Embed Size (px)
Citation preview

UNIVERSITY OF NAIROBIFACULTY OF ARTS
SOCIOLOGY DEPARTMENT
SOCIO-ECONOMIC FACTORS LN TECHNOLOGY DEVELOPMENT AND ADOPTION: AN ASSESSMENT OF THE “PUSH-PULL” TECHNOLOGY OF
CONTROLLING MAIZE STEM BORERS IN TRANS NZOIA DISTRICT.
BYDOROTHY MUKUDI WANYAMA MASINDE
REG. C82/7802/97
A THESIS SUBMITTED IN FULFILMENT FOR THE DEGREE OF DOCTOR OF PHILOSOPHY' AT THE UNIVERSITY OF N AIROBI
NOVEMBER, 2009
University of N A IR O B I LOrary
UNIVERSITY OR NAIROBI

DECLARATIONThis thesis is my original work and has never been presented for a degree in any other institution.
Signature l44li\aoa=|DOROTHY MUKUDI WANYAMA MASENDE
REG. NO C82/7802/97
This thesis has been submitted for examination with our approval as the university supervisors.
1. SIGNATUREPRESTON O. CHIT ERE
* DATE PROF.
’. SIGNATUREDR. ROBINSON M. OCHARO
DATE
11

DEDICATIONThis work is dedicated to all my teachers, especially “Bai” my nursery school teachers, who began the long education journey with the letter “A” in 1969. I also dedicate it to my big baby Nash Zoe Nasimiyu to inspire her imaginative mind to explore. To my other children Wendy, Sharon, Melvin, and Baby Johanna, you are the reason I did this. To the memory of my father the late Charles Peter Mukudi, who did not live long enough to see what his “girls” achieved. My dearest mother Febe Munaji Mukudi, without your many sacrifices I would never have reached this far.
iii

TABLE OF CONTENTSLIST OF TABLES.............................................................................................................. viiLIST OF FIGURES..............................................................................................................xiLIST OF ACRONYMS...................................................................................................... xiiACKNOWLEDGMENTS.................................................................................................xiiiABSTRACT........................................................................................................................ xvCHAPTER ONE: INTRODUCTION......................L........................................................1
Problem Statement.......................................................................................................... 3Overview of the Gatsby Foundation Funded Project.....................................................7Collaborators Defined................................................................................................... 10Goal and Objectives of the Study..................................................................................13Justification of the Study...............................................................................................13Scope of the Study.........................................................................................................16Definition of key variables and terms used in the study............................................... 16Organization of the Dissertation................................................................ 24
CHAPTER TWO: REVIEW OF THE LITERATURE...................................................... 25Technology Generation and Dissemination................................................................. 25Research and Development (R&D) and Adoption....................................................... 27Conventional Research and Development Approaches................................................ 27Participatory Approaches to Research and Development............................................29Socio-Economic Factors and Technology Adoption.................................................... 34
Land......................................................................................................................... 35Labour...................................................................................................................... 36Age............................................................................................................................36Education................................................................................................................. 37Gender..................................................................................................................... 37Social Participation..................................................................................................39Knowledge of Innovation....................................................................................... 39
Theoretical Framework..................................................................................................41Action theory and actor oriented approach.............................................................41Farm Adoption and Diffusion Approach/Model....................................................44Farming Systems research and extension Model...................................................46Participatory approaches....................................................................................... 47
Conceptual model/framework...................................................................................... 49Research Hypotheses.....................................................................................................50Operational definition of key concepts......................................................................... 52Conclusion..................................................................................................................... 58
IV

CHAPTER THREE: RESEARCH METHODOLOGY..................................................... 59Study sites and unit of analysis......................................................................................59
Sampling methods and Procedure...........................................................................63Data Collection methods...............................................................................................64
Time frame.......................................................................................................................... 65Data analysis and organisation procedure.......................................................................... 66
Descriptive Statistics.............................................................................................. 67Inferential Statistics................................................................................................ 67
Test of Independence and measure of association............................................68Economic Benefits of the Technology.................................................................. 72
Limitations of the study...................................................................................................... 72CHAPTER FOUR: RESEARCH FINDINGS.................................................................... 74
Socio-economic characteristics of respondents........................................................... 75Personal characteristics........................................................................................... 76Household characteristics....................................................................................... 77Communication variables....................................................................................... 81
Relationships between predictor and response Variables...................................................84Hosting project trials (project and non-project farmers................................... 84
Technology adoption and predictor variables.................................................................... 86Personal Characteristics.................................................................................... 86Household Characteristics.................................................................................88Communication Variables.................................................................................90
Participation in the project and predictor variables................................................94Personal Characteristics.................................................................................... 95Household Characteristics and Diffusion.........................................................97Communication Variables................................................................................ 99Reason for adoption......................................................................................... 97
Technology diffusion and predictor Variables..................................................................104Personal Characteristics...................................................................................104Household Characteristics...............................................................................104Communication Variables...............................................................................105
Regression Analysis of Predictor Variables on Response Variables.........................105Analysis of Predictor Variables and Adoption..................................................... 106
Regression of Personal Characteristics and Adoption....................................106Regression of Household Characteristics on Adoption..................................107Regression of Communication Variables and Adoption............................... 109Analysis of Predictor Variables and Participation..........................................112Regression of Personal Characteristics on Participation............................... 112Regression of Household Characteristics on Participation............................ 113Communication Variables and Participation..................................................115
Benefits of the technology................................................................................................117Perceived Benefits............................................................................................................. 118
Perceived benefits and adoption.................................................................... 118Participation in Technology development perceived benefits of the technology...........119Benefit-Cost Analysis of the Technology........................................................................119

CHAPTER FIVE: DISCUSSION, CONCLUSIONS, ANDRECOMMENDATIONS................................................................... 123
Summary of major findings............................................................................................. 123Discussions ......................................................................................................................123Personal characteristics ...................................................................................................123Household characteristics................................................................................................126Communication Variable..................................................................................................129Benefits of the Technology...............................................................................................132Conclusion........................................................................................................................ 133Policy Implication.............................................................................................................134Recommendations for Future Research........................................................................... 136REFERENCES.................................................................................................................138APPENDIX A: List of tables...........................................................................................153APPENDIX B: INTERVIEW SCHEDULE FOR FARMERS IN
TRANS NZOIA DISTRICT.................................................................186APPENDIX C: MAP OF THE STUDY AREAS............................................................194
VI

LIST OF T ABLESTable 1 Project Phases and the Role of this Study in the Project.................................... 153Table 2 Scoring of “push-pull” technology Adoption Characteristics............................154Table 3 Adoption Rates..................................................................................................... 156Table 4 Participation Categories........................................................................................156Table 5 Participation Scores.............................................................................................. 157Table 6 Measuring Dependent (Response) Variables.......................................................156Table 7 Weighting of Resource Endowment Indicators....................................................158Table 8 Scoring for Knowledge of Technology................................................................159Table 9 Relationship of Independent (Predictor) Variables..............................................160Table 10 Distribution of Tribe by Village........................................................................ 161Table 11 Household Heads Distribution in the Study Areas by Gender ....................... 161Table 12 1998 Project Farmers’ Proportionate Distribution by Study Areas..................161Table 13 Distribution of Respondents by Village............................................................. 162Table 14 Education Level of the Household Head by Adoption Category...................... 162Table 15 Land Size by Adoption Category....................................................................... 162Table 16 Gender of Household Head by Adoption Category...........................................163Table 17 Respondents’ Age by Adoption Category..........................................................163Table 18 Household Head’s Occupation by Adoption Category..................................... 163Table 19 Marital Status by Adoption Category.................................................................164Table 20 Number of People in the Household by Adoption Category.............................164Table 21 Number of Children under the Age of 5 Years by Adoption Category............ 164Table 22 Reported Annual Income by Adoption Category............................................. 165Table 23 Livestock Numbers by Adoption Category...................................................... 165
vii

Table 25 Degree of Membership in Social Organisations by Adoption Category......... 166Table 26 Total Visits by Collaborators by Adoption......................................................166Table 27 Contact with MOALD Extension agents by Adoption Category.....................166Table 28 Project Awareness by Adoption Category....................................................... 167Table 29 Knowledge of Technology by Adoption Category.......................................... 167Table 30 Number of Trainings Attended by Adoption Category....................................167Table 31 Technology Option by Adoption Category...................................................... 168Table 32 Participation in Technology Development by Adoption Category..................168Table 33 Gender of Household Head by Participation Category.................................... 168Table 34 Age of Household Head by Participation Category...........................................169Table 35 Education Level of the Household Head by Participation Category.................169Table 36 Household Head’s Occupation by Participation Category................................ 169Table 37 Marital Status by Participation Category...........................................................170Table 38 Land Size by Participation Category..................................................................170Table 39 Household Size by Participation Category.........................................................170Table 40 Number of Children Under the Age of 5 Years by
Participation Category...................................................................................171Tabic 41 Reported Annual Income by Participation Category......................................... 171Table 42 Livestock Numbers by Participation Category...................................................171Table 43 Wealth Status by Participation Category............................................................172Table 44 Contact with MOALD Extension agents by Participation Category.................172Table 45 Membership in Social Organisations by Participation Category......................172
Total 24 Wealth Status by Adoption Category.....................................................................165
viii

Table 47 Project Awareness by Participation Category.................................................. 173Table 48 Knowledge of Technology by Participation Category....................................173Table 49 Attendance at Training Sessions by Participation Category............................ 174Table 50 Technology Option Adopted by Participation Category..................................174Table 51 Hosting Project Trials by Participation Category............................................. 174Table 52 Correlations of Personal Characteristics and Response Variables
of Adoption................................................................................................... 175Table 53 Regression of Personal Characteristic on Technology Adoption.....................175Table 54 Correlations of Household Characteristics and Response Variable
of Adoption................................................................................................... 176Table 55 Regression Analysis of Household Characteristics on Adoption...................... 176Table 56 Correlations of Communication Variables and Response Variables
of Adoption.................................................................................................... 177Table 57 Regression of Communication Variables on Technology Adoption.................177Table 58 Correladon Between Personal Characteristics and Participation...................... 178Table 59 Regression of Personal Characteristics and Participation.................................178Table 60 Correlation Between Household Characteristics and Participation...................179Table 61 Regression Between Household Characteristics and Participation...................180Table 62 Correlation between Communication Variables and Participation...................181Table 63 Regression Between Communication Characteristics and Participation.......... 181Table 64 Distribution of Perceived Benefits by Adoption Category................................182Table 65 Distribution of Participation by Perceived Benefits of the Technology............182Table 66 Baseline Benefit-Cost Analysis.........................................................................183
Total 46 Total Visits by Collaborators by Participation Category.................................... 173
ix

Table 6~ Benefit-Cost Analysis if Cost o f Production Increases by 20%.... Table 68 Benefit-Cost .Analysis if Cost of Production Decreases by 2094... Table 69 Benefit-Cost .Analysis if Price o f Napier Grass Increases by 20% Table 70 Benefit-Cost .Analysis if Maize Price Drops by 20%Table 71 Benefit-Cost .Analysis if Maize Increases by 20%.........
x

LIST OF FIGURES.28Figure 2.1 Simplified TOT modeL'approach.................
Figure 2.2 Diffusion as a linear phenomenon........................... ^Figure 2.3 Adoption/diHusion process as defined by the classical diffusion theory........ 46Figure 2.4 Linkages be™ 'en technology development and adoption incorporating collaborative
participation based on the action theory..................
XI

LIST OF ACRONYMSANOVA Analysis of variance
ARC-Rothamsted Institute of Arable Crops Research at Rothamsted
FSR/E Farming system research and Extension
ICIPE International Centre of Insect Physiology and Ecology
IPM Integrated Pest Management
ISEPRIM Interactive Socio-economic Research for Bio-intensive Pest Management
ITK Indigenous Technology Knowledge
ivm Integrated Vector Management
KARI Kenya Agricultural Research Institute
MOALD Ministry of Agriculture and Livestock Development
MPFS Mbita Point Field Station
MRA Multiple Regression AnalysisPA Participatory Assistance
TOT Transfer of Technology
UNECA United Nations Economic Commission for Africa
USEPA United States Environmental Protection Agency
Xll

ACKNOWLEDGMENTSThis work was would not have been possible without the support and encouragement from the following, who I wish to acknowledge immensely:
• My supervisors, Prof. Preston 0. Chitere, Dr. Robinson M. Ocharo, Dr. Joseph Ssenyonga, who contributed immensely to the ultimate realization of this research;
• Dr. Khan, Z.R., for allowing me to work on this project and guiding me;• All the farmers in Kitale who were involved in this study, whose support I needed to
obtain the useful data;• Ail my colleagues in the Ministry of Agriculture, Kitale, notably Mrs. A. Kirembu,
Mrs. J. Shivachi, and, Mr. W. Kharinda, who provided the invaluable support during the data collection phase;
• All the collaborators from KARI and ICIPE, especially Mr. Oscar Nyapela and Mr. Naftali Dibogo, for all the logistic and technical support;
• My family, first and foremost my mother, Febe Munaji Mukudi (thanks for making sure that I got the best foundation and keeping me in school); especially my husband, Dr. Eliud Masinde (you have been an inspiration and my main supporter); my lovely children, Wendy, Sharon, Melvin, Nash, and Johanna for always bearing with the professional student mother; my sister Dr. Edith Omwami (This one is yours for keeps), my brother-in-law Dr. Raymond Omwami thank you for reminding me that I will never enter Bel Air with my luggage, half of it was this work; and the rest of my siblings (thanks for your encouragement).
xiii

• Special thanks to Prof. Fassil G. Kiros, formerly of ICIPE, and Prof. Charles E. Loggins of California State Polytechnic University, Pomona, USA for your valuable contributions to my work;
• All my friends who in one way or another have played a role in my long road of education and especially Veronica Opili Orege during this stage of my schooling;
• To the Dean, Prof. Wendy Wintersteen, Associate Dean, Prof. David Acker, and Faculty of Iowa State University’s College of Agriculture and Life sciences; Dr. Loma Butler, Gerry and Karen, your support was invaluable. Thanks for the “push” on the final stretch—I touched the tape.
• To the then Director Dr. Robert Mazur and staff of the Centre for Sustainable Rural Livelihoods at Iowa State University; Catherine Adams, room 306B1 worked well, it was cold enough, thanks a lot;
• Denise Rothschild, the editing was great, I can show off my work to others.
THIS WAS A GREAT ‘TEAM’ TO WORK WITH!!!
xiv

ABSTRACTThis study sought to examine the collaborative participation approach and technology adoption. The objective of this study was to determine the linkage between socio-economic factors in collaborative participation and technology adoption and diffusion among Trans Nzoia district resource-limited farmers. Collaborative participation involves farmers, researchers, and extension agents in developing and disseminating technology. The study reviewed the ■ push/pull’ technology of controlling maize stem borers. The goal was to provide information that would contribute to improvement of the collaborative participation approach, eventually enhancing adoption of developed technologies.
The study was conducted in the villages of Yuya, Wamuini, Kaminini, and Kissawai in Trans Nzoia District. The sample consisted of 110 project and 110 non-project farmers who were selected using random and purposive sampling methods. Reviewed literature indicated that, as actions taking place in situations, adoption and diffusion are affected by various characteristics of the situation. Innovations are introduced to bring change in terms of increased agricultural productivity. Adoption and diffusion of these innovations are, therefore, imperative if change is to be achieved. Conventional transfer of technology approaches have produced limited success in terms of technology adoptions. Focus has shifted to use of participatory approaches. Participatory approaches vary according to the level of farmer involvement. Technology development efforts that combine various approaches and use participatory methodologies are more inclusive and involve farmers in research and development processes, increasing chances of success. Results from the study indicated that education and labour had positive significant relationships with adoption and participation. Literacy was crucial to farmers attending training sessions
XV

related to technology development. Functional literacy as opposed to high education attainment was found to be necessary to manage the technology. The technology being developed was viewed to be labour intensive. The number of people in the households who potentially could work farms was considered as proxy for labour. Participation and adoption increased with an increase in numbers of such members.
Communication variables were significant in influencing adoption, participation, and hosting of trials. Technology awareness, contact farmers, and knowledge of technology provided information about the technology, which influenced farmers’ decisions to participate and adopt the technology. Perceived benefits from the technology motivated farmers to participate and adopt the technology. Economic analysis of the technology indicated that it was a viable undertaking. Using the action theory the study explained participation and adoption decisions of respondents and how the significant variables influenced them.
The study recommended integration of literacy in development efforts to enhance beneficiaries’ ability to understand and take advantage of introduced innovations. Use of participatory methodologies should be encouraged to develop technologies that take into consideration farmers’ situations. Research efforts should be inclusive and focus on all farmers as opposed to setting conditions that potentially leave out those with potential to contribute to the technology development process. Two-way communications during the technology development process is imperative.
xvi

CHAPTER ONE INTRODUCTION
New technology, no matter its origin, aims to offer opportunity for improvement in existing situations. New agricultural technologies have been introduced; however they do not reflect a significant increase in agricultural production among resource-limited fanners. In addition, there is evidence that technologies are neither adopted by resource limited farmers nor diffuse as expected (Roling, 1988). Non-adoption has been attributed to various factors, among them: communication-related factors, such as contact with change agents and social participation (Roling, 1988); attributes of the innovations (Fliegel, 1993; Rogers, 1983); and personality variables and stereotyping, such as blaming farmers and terming them ignorant and having a psychological predisposition (Chambers and Jiggins, 1987).
Adoption and diffusion studies have established that socio-economic factors do influence technology adoption. Factors such as education, social status, farm size, and age, among others, have been shown to influence innovation adoption (Charoenwatana, 1987; Roling, 1988). McAllister (1981) posited that in adopting innovations, people are motivated not only by economic considerations but also by their positions in the social hierarchy. Galeski (1971), quoted in McAllister, 1981) noted that economic considerations were not the only reason for farmers’ reluctance to adopt innovations, as there were other considerations like prestige. Bonnard and Scherr (1994) and others have listed personal and social status and technology- related factors as some of the characteristics that influence technology adoption and diffusion. Gender considerations are also critical in agriculture-related technology adoption, given that in Africa women make significant contributions to agriculture (Staudt, 1985). Therefore technology
1

development and dissemination approaches have to take into consideration all these socioeconomic factors if they are to achieve any increase in agricultural production among resource- limited fanners.
Resource-limited farmers are not only constrained by their environments, which are ecologically diverse and risky due to unstable weather and complex production systems (Chambers, Pacey, andThrupp, 1989); but also face problems due to limited access to production resources such as land, capital, and information. Resource-limited farmers are not homogenous, yet studies (Roling, 1994: Antholt, 1994) have shown that conventional technology development and dissemination approaches do not consider conditions under which farmers operate.
The dominant transfer of technology (TOT) paradigm, which emphasises the transfer of technologies developed by scientists to farmers, has failed to address the problems of resource- limited farmers (Chambers and Jiggins 1987; Roling, 1994). This approach tends to put a lot of emphasis on the technology being developed as opposed to the conditions under which the farmer is operating. Participatory approaches, on the other hand, tend to utilise a collaborative process regarding all partners including those considered as resource poor. While focusing on the technology, TOT stresses the advantage of the new technology over preceding ones. Participatory approaches, on the other hand, seek to improve the situation under which the tanners operate. The latter, therefore, have potential for addressing resource-limited farmers’ complex agricultural problems (Mattocks and Steele, 1994).
2
The International Centre of Insect Physiology and Ecology (ICIPE) is a research centre that is geared towards development of integrated pest management (IPM) and integrated vector management (IVM) technologies. The goal of ICIPE’s work is to contribute towards ensuring food security and alleviating poverty ((ICIPE, 1996). The centre has offered new approaches to research and development, by undertaking its research activities collaboratively. Towards this goal the centre has embraced the use of participatory research approaches involving various partners in technology development and dissemination. ICIPE has envisaged participation in the context of appropriateness of the technologies in terms of benefiting rural communities. In addition the centre views collaboration as being beneficial in terms of facilitating interaction with rural communities as well as a source of valuable information and resources (Kiros, Chitere, and Ssenyonga, 1993). ICIPE utilises collaborative participation in developing and disseminating technology. This study aimed at examining ICIPE’s collaborative participation approach. It sought to establish if socio-economic factors associated with collaborative participation approach influence adoption and diffusion of the “push-pull” technology under review.
Problem StatementAgricultural performance in developing countries, Kenya included remains disappointedly low. New technologies continue to be developed yet adoption and diffusion is lower than expected (Roling, 1988). The poor performance has been blamed on, among others, technical factors, poor agricultural policies, and farmer’s psychological predisposition. New innovations are meant to introduce change in a social system by way of increased agricultural productivity. Change in society is influenced by multiple factors (Etzioni-Harvey and Etzioni, 1973). It is imperative that
3

before any change is introduced, there is need to understand the socio-cultural and socioeconomic aspects of the system.
Adoption and diffusion studies have reiterated the importance of socio-economic, personality and communication factors in influencing innovativeness (Chitere, 1998; Rogers, 1983; Rogers and Shoemaker, 1971). Similarly, Molho (1981) argued that social factors are important in understanding innovative process, especially factors that define role and status in a social system. Any intervention aimed at introducing change in a social system should therefore involve the beneficiaries in development and dissemination of the intended intervention. It should address the needs of the beneficiaries while taking into consideration their opportunities.
Conventional extension and research approaches have treated farmers as passive participants in the ‘technology development and dissemination’ process with little or no consideration of their views. The result is that resource-limited farmers have generally failed to adopt technologies developed by scientists. Further, the technologies often require inputs that are way beyond the farmers’ means (Chambers and Jiggins, 1987; Muriithi, 1980).
Participatory approaches were introduced to narrow the gap that exists between research and fanners’ practices by empowering farmers to be able to judge performance while contributing to defining research agendas and extension programs (Antholt, 1994). The ultimate goal was to develop technologies that would be adopted and diffuse to the wider community leading to increase in agricultural productivity. The approaches involve farmers in the technology development process.
4

Conventional adoption and diffusion studies have tended to address the technology under study (Beslev and Case, 1993; Gartrell and Gartrell, 1979) with little reference to the methodology used to develop the technology. Yet technology development approaches have been cited as one of the reasons that technologies are not being adopted. Adoption studies have tended to overlook this aspect of the technology development process. This study set out to examine the methodology applied to develop the “push-pull” technology.
The Gatsby Charitable Foundation is funding a collaborative research project among ICIPE, ARC-Rothamsted, KAR1, MOALD and farmers that is developing an integrated pest management technology to control maize stem borer. It is a “push-pull” technology. The ICIPE/ARC-Rothamsted/KARI/MOALD collaborative project is utilizing participatory approaches to develop technologies that are appropriate and beneficial to rural communities. The approach facilitates interaction among collaborators and rural communities and provides information useful in research process. It has three phases and this study is focusing on the third stage of the approach. The approach was first used in the ICIPE/United Nations Economic Commission for Africa (UNECA) project in Oyugis and Kendu Bay where there was collaboration among farmers, the Ministry of Agriculture and ICIPE. Farmers were involved in developing and disseminating technologies. Results from this project showed the impact of contact with extension agents and project staff on farmers’ technology adoption (Chitere, 1998).
The same approach was applied in the Interactive Socio-economic Research for Bio-intensive Pest Management (ISEPRIM) project at the Kenyan coast. The project explored methods of
iinvolving farmers in various phases of its implementation. It highlighted the role played by
5

participation in increasing technology adoption by indicating that, through participation, the period of waiting before adoption begins might be shorter and increased the interest of the community in the project (Chitere and Kiros, 1996; Kiros, Chitere, and Ssenyonga, 1993). However, the impact of socio-economic factors associated with the approach was not demonstrated clearly. This study sought to examine these factors and their linkage to participation in technology development, adoption and diffusion of the technology being developed. The study focused on the third stage of the project.
The study sought to assess the factors that were influencing farmers’ participation in technology development and subsequent adoption and diffusion of the “push-pull” technology. Specifically, it sought to establish the socio-economic factors associated with the collaborative participation approach. Further, it sought to determine if socio-economic factors associated with the collaborative participation approach would make the technology more receptive to farmers. The study was part of the on-going project process and formed part of the evaluation component of the project. As one of the stages in the Gatsby-funded ICIPE/ARC-Rothamsted/KARI/MOALD collaborative project, the study set out to evaluate the extent of adoption and diffusion of the technology being developed. Information obtained through this study will improve the collaborative participation approach, eventually enhancing adoption and diffusion of technologies developed through participatory methodologies. Adoption of the “push-pull” technology will enhance maize productivity, which will contribute to improving food security and alleviating poverty in Kenya.
6

Overview of the Gatsbv Foundation Funded ProjectThe Gatsby Charitable Foundation is funding a project on ‘utilization of wild host and non-host plants for management of cereal stem borers of Africa’ in Trans Nzoia district. The project is addressing the problem of maize stem borers in Trans Nzoia district. It is utilising Integrated Pest Management approach to manage maize stem borers (ICIPE, 1996). An Integrated Pest Management (IPM) approach aims at controlling pests using a combination of environmentally sound approaches. The essence of the IPM is to limit pest damage using the most economical methods with the least harm to the environment (USEPA). An IPM approach involves conservation of natural enemies while using methods that preserve the natural resource base (ICIPE, 1996). The ICIPE/ARC-Rothamsted/KARI/MOALD collaborative project was in the process of developing the ‘push-pull’ technology, an integrated pest management approach(IPM).
Stem borers are one of the main pre-harvest maize insect pest causing substantial losses in developing countries (Ampofo, 1986:1124, Macharia, Njihia, Mulaa, Songa, undated). In Kenya the total losses due to stem borer has been estimated to be between 13.5% and 18% of maize produced (De Groote, Bett, Okuro, Odendo, Mose, and Wekesa, 2001:450; Ampofo, 1986). In a household level survey carried out in Trans Nzoia district, 96% of the respondents indicated stem borers as the most serious pest of maize (ICIPE, 1997). Among the respondents in the survey, 93.4% had reported maize as the main cereal grain grown. Farmers in Trans Nzoia acknowledged losses by stem borers to be between 25% and 50% of the total yield (ICIPE, 1997). Hence the need to address the maize stem borer problem in Trans Nzoia district.
7

Stem borers are controlled through cultural practices like early planting and clearing all crop residues, Chemical methods like using granules or dust that kills the pests, and organic methods like using ash and pepper (Macharia, Njihia, Mulaa, and Songa, undated). Use of pesticides is the main method being recommended for stem borer control; however this approach is out of reach for most resource limited farmers (ICIPE, 2003). The ICIPE/ARC-Rothamsted/KAilLMOALD collaborative project was developing the “push-puli’ technology to address the stem borer problem. This project adopted a collaborative participatory approach in technology development and dissemination. It aimed at achieving economic viability and social acceptability in the context of rural communities (Kiros, Chitere, and Ssenyonga, 1993) through the use of this approach.
The ‘push-pull’ technologyThe ‘push-pull’ strategy entails inter-cropping maize with a stem borer repellent plant and planting an attractant crop around the intercrop. The approach uses a combination of repellant plants to “push” (repel) pests from the maize crop and attractant (pull) crops to draw the repelled pest. Silver leaf Desmodium (Desmodium uncinatum) and Molasses grass (Melinis minutiflora) are used as repellents and Napier grass (Pennisetum purpureum) as attractant or trap plant. Desmodium or Molasses grass are integrated into the Napier grass maize system resulting in the ■ push-pull’ technology (Amudavi 2008, Gatsby, 2005).
Napier grass is used as a ‘trap' plant because of its ability to produce chemical substances that attract stem borers to lay eggs on it. The stem borer lays its eggs on the Napier grass instead of maize thereby reducing the numbers of pests attacking the maize crop. At the same time Napier
8

grass produces a gummy substance that traps the larvae of the stem borer resulting in few larvae surviving to adulthood. The ability of Melinis and Desmodium intercrop to repel the adult stem borer 'pushes’ the stem borers from the maize field. Melinis has a strong smell that repels adult borers when intercropped with maize, resulting in limited ovipositing on maize. Desmodium changes the microclimate due to its foliage density, thereby significantly influencing or diverting the number of stem borer infestation and acting as a repellent. Hence the term ‘push/pull’ technology (Khan, Overholt, and Ng’eny-Mengich, 2003:448; Khan, Pickett, Berg Van den, Wadhams, and Woodcock., 2000: 958-959, Amudavi, Khan and Pickett 2007: 8). All the plants used in the strategy are fodder crops for livestock. It is beyond the scope of this thesis to discuss in details the science behind the “push-pull” technology: for more details please read Gatsby (2005), Khan, Pickett, Wadhams and Muyekho (2001), and Khan, Pickett, Berg Van Den, Wadham and Woodcock (2000).
The Collaborative Research project in Trans Nzoia district was launched in 1994. Alongside biological research, socio-economic research that focuses on evaluation of the technology under farmer’s management and the potential for adoption, sustainability, and impact on food and livestock production were included in the project (ICIPE, 1996). The aim of the project was to develop an IPM based maize stem borer control technology (Gatsby, 2005). The project adopted a collaborative approach to technology development, where there was participation and collaboration among farmers, research scientists and extension agents. The approach adopted by the project involved farmers at all stages of technology development and dissemination, although farmer involvement was higher in later stages compared with initial stages. The project set criteria as a basis for farmer participation.
9

.Ail collaborators had key roles to play at the different stages of the research. Participation by all the collaborators was meant to encourage ownership of the technology and to provide for an exit strategy when the scientists leave the areas. All the collaborators owned a stake in the technology through their contribution to its development (Hassanali, Herren, Khan, Pickett and Woodcock,2008: 616).
The technology development process began with an evaluative stage in 1994 (Table 1), in which on-station trials were conducted at Mbita Point Field Station (MPFS) and Kenya Agricultural Research Institute (KARI) Kitale (Gatsby, 2005). Potential push and pull crops were tested on station and the results introduced to farming community through visits to the stations. Farmers participated by evaluating the technology. Results of the first stage were used in the second stage, which was the on-farm researcher managed trials, which were initiated in 1997 (Chemweno, Dibogo, Ng’ang’a, and Ndiege 1999; Hassanali, Herren, Khan, Pickett and Woodcock, 2008). In 1998 the third stage, which incorporated on-farm researcher managed and on-farm farmer managed trials, was initiated (Khan, Pickett, Van den Berg, Wadhams, and Woodcock , 2000). The present study focused on the third stage of the project implementation (Table 1).
Collaborators DefinedThe project worked with fanners, research scientists and extension agents in developing and disseminating the “push-pull” technology. These groups of people were referred to as collaborators.
10
Collaborators were defined as the different groups with interest in the outcome of the project. For the purpose of this study, collaborators included farmers: ICIPE, ARC-Rothamstead, Gatsby Charitable Foundation and KARI research scientists: and Ministry of Agriculture and Livestock Development (MOALD) extension agents. The roles of the collaborators were defined asfollows.
Farmers: Were defined as persons practising agriculture for their livelihood in the Trans Nzoia district. The study focused on resource limited farmers. The study defined resource limited farmers in the context of Tran Nzoia district as farmers who own less than 12 acres of land, are engaged in small scale agricultural production (both crops and livestock) as one of their main economic activities and have limited access to factors of production (land, labour, capital, and information) (FAO, 1997: Chambers, Pacey, and Thrupp, 1989).
Farmers were consulted in the process of identifying useful crops to be used in developing the technology (Gatsby, 2005). Farmers undertook activities/materials related to the technology, participated in evaluating and disseminated the technology. Their contributions to technology development and dissemination were critical in determining practical technology designs that would be acceptable within established farming systems. They contributed to the final technical design of the technology.
There were two categories of farmers: project and non-project farmers. Project farmers were defined as those farmers who volunteered to participate in technology development and dissemination between 1998 and 2000 after meeting the following criteria set by the project:
11

■ Gender representation;■ Should own livestock;■ Should own at least one acre of land;■ Should be resident on the farm;■ Should be able to spend at least 50% of her/his time on the farm;■ The trial site should be accessible;■ The farmer must be willing to take part in the trials;■ Farmer must be able to get along with other members of the areas and be willing to
share knowledge with other farmers as determined by community members (Kiros, Nyapela, Wanyama, and Wanyama, 1997).
ICIPE/ARC-Rothamstead/Gatsby researchers: Were defined as a group of scientists drawn from ICIPE, ARC-Rothamstead, and Gatsby Charitable Foundation who undertook the research that came up with the basic design of the "‘push-pull” technology. They identified the potential attractant and repellent plants and initial technology design (Gatsby, 2005). They reviewed data collected from the field and recommended actions to be taken. Researchers provided leadership and management of scientific work, provided collection and monitoring of biological and socioeconomic data, and participated in farmer training.
Ministry o f Agriculture and Livestock Development (MOALD) extension agents: Were defined as Ministry of agriculture staff who were providing regular extension services to farmers. They used extension approaches like farm visits, demonstrations, field days, and group trainings. Extension agents provided information on the farming systems and identified challenges facing
12

farmers in maize production. In addition they introduced farmers to the project by selecting farmers to take part in initial trials and technology evaluation.Extension agents mobilised farmers to participate in technology development, monitored and supervised project activities, and provided technical information on the farming systems in the district.
Goal and Objectives of the StudyThe goal of this study was to determine the linkage between socio-economic factors and participation in technology development, adoption and diffusion among Trans Nzoia district resource-limited farmers. The study specifically sought:
1. To establish socio-economic factors that influenced resource limited farmers’ participation in development of the “push-pull” technology
2. To establish socio-economic factors that influenced resource limited farmers’ adoption and diffusion of ‘push-pull’ technology
3. To determine if participating in the collaborative participation approach influenced adoption and diffusion of ‘push-pull’ technology
Justification of the StudyResource-limited farmers are constrained by environmental, political, social, economic, and methodological factors. The social and economic conditions of these farmers are limited, and they tend to have less access to extension services (Chambers and Jiggins, 1987; Chambers, Pacey, and Thrupp, 1989). It is recognised that these farmers are less likely to adopt technologies
13

developed through conventional approaches, as these approaches give little consideration to conditions under which the farmers operate (Sikana, 1993).
The issue of non-adoption of technologies needs to be addressed if development programmes are to provide sustainable solutions to the degrading socio-economic conditions in most African countries (Wanyama, Sayeweh, Rugege, Mugo, and Acebedo, 1996). A gap exists between the needs of the majority of resource limited tanners and what agncultural research and extension have to offer. It is apparent that if this gap is ever to be bridged, resource limited farmers have to participate actively in agricultural research and development (Gubbels, 1988).
The findings of this study have an implication for enhancing participation in research and development and eventually technology adoption. In determining the socio-economic factors associated with participation in technology development that enhances adoption, the study will contribute towards improving farmer participation in development programmes. The role of participation in successful implementation of government plans has been acknowledged by the Kenyan government (Government of Kenya, 1999:60). The government is committed to developing participatory methods that will be used to gather local views and design solutions to identified needs. However, the government’s poverty eradication plans draws attention to the lack of information on participation (Government of Kenya, 1999:57). Results of this study will contribute to a better understanding of the role of participation in development related programmes and how it can be institutionalised.
14

The project under review was developing an EPM technology to control maize stem borers. As noted earlier, stem borer is one of the main pests of maize responsible for an estimated 20-40% of crop losses (Khan. Muyekho, Njuguna, Pickett, Wadhams, Pittchar, Ndiege, Genga, Nyagol, and Lusweti, 2007: IV)- In Kenya losses due to maize stem borer account for 12% of the annual maize crop losses estimated at USS 50 million (CIMMYT, 2005). Use of chemical control methods is not practical for resource limited farmers (ICIPE, 2003), therefore development of alternative control measures are justified. The government of Kenya in its sessional paper number one of 1994 on recovery and sustainable development laid emphasis on need for research in integrated pest management (IPM) systems (Government of Kenya, 1994:54). The ‘push-pull’ technology being developed will enable resource limited farmers control maize stem borers while contributing towards achieving the governments plans on developing IPM systems.
The Kenyan government plans to achieve national food security at the household level through increased productivity and income generation (Government of Kenya, 1994:48). Given this, the need to explore technologies geared towards improving agricultural productivity is justified. The push-pull’ technology will increase maize productivity, provide livestock fodder and alternative
sources of income. The proposed development of “push-pull” technology of controlling maize stem borer is conceived as a means towards contributing to the government’s objective. Reducing losses due to maize stem borers will ultimately increase household level incomes ultimately reducing poverty and enhancing national food security.
15

Scope of the StudyThe study was limited to Kiminini, Yuya, Wamuini, and Kisawai villages of Trans Nzoia district. The main focus of the study was the approach being utilized to develop and disseminate the stem borer control technology among Trans Nzoia farmers. The study examined those socio-economic factors emphasised by the collaborative approach in selecting project farmers. It focused on age, education, resource endowment, social status, and gender, access to information, knowledge of the technology, social participation, collaborative participation, and adoption. The study sought to establish the nature of the link between these socio-economic factors and participation in technology development, adoption and diffusion. It focused on these factors as they relate to the approach; the study did not address factors directly associated with the technology.
Definition of kev variables and terms used in the studyThe study used several variables to measure factors of study. The study consisted of two types of variables, response or dependent variables and predictor or independent variables. Adoption, measured in terms o f adoption rates, and participation in the project, measured in terms of participation rates, were the main response variables (see elsewhere for operationalisation of these concepts). Predictor variables, which represented factors that influenced adoption, diffusion and participation in the project, were categorized into household head characteristics, household resources, personal characteristics, and communication variables.
Demographic data and socio-economic parameters were obtained and used as predictor variables. The predictor variables included in the study were selected based on earlier adoption studies
16

(Abd-Ella et al., 1981; Ezeh and Unamma, 1989), which showed that these variables have a bearing on the outcome of adoption. Below are the definitions of the variables used in the study
Personal characteristicsGender: Gender was defined as the sex of the household head (both de facto and de jure for female household heads) as being male of female. Respondents were categorised by gender of the household head, disaggregating the data and information as gathered from male or female headed households. Gender (GENDER) had a dummy variable with values of 1 for female and 0 for male, studies have indicated lower adoption rates in female-headed households than in maleheaded households. This was attributed to constraints related to land rights and capital. However, given that the technology under study was cultural practice-based, which limits the use of chemicals (the need for capital), then it was hypothesised that gender is positively related to adoption and participation.
Age: Age (AGE) was defined in terms of actual age in years of the household head, estimated to the nearest year. Age was stated in actual years and categorised in age brackets as follows;
<39 = young 40-59 = middle age 60 and above = old
Older farmers have been shown to be resistant to change, although they also tend to have more resources and experience necessary for change (Ezeh and Unamma, 1989). Thus age was hypothesised to be negatively related to adoption of the technology under study and participation in the technology development.
17

Marital status. Mantal status was defined as any type of union that constituted marriage ranging from traditional, Civil, or religious. Definition of the marital status included both single and multiple spouses where applicable. Marital status of the household head was stated and categorised into single (never married), married monogamous, married polygamous, and divorced. Marital status was included as a descriptive statistic describing household characteristics.
Education: Education (EDUC) defined as the highest level of formal schooling attained by the household head and stated in years schooling. It was measured in terms of the highest level of formal schooling under the Kenyan education system attained by the household head. It was then categorised into the Kenyan system of education: viz. no education = 0, 1 to 4 years for lower primary = 1, 5 to 8 years for upper primary = 2, 9 to 12 years for secondary = 3, and above 12 years tor post secondary education = 4. Although education has been shown to influence adoption (Dasgupta, 1989), it is functional literacy that has a positive influence. However, for this study formal education was hypothesised to have a positive influence given that the introduction of the technology was preceded by a series of educational activities.
Occupation: Occupation was defined as main economic activity undertaken by the household head. It was defined in relation to farming and any other income generating activity. Occupation of the informant was stated and scored in terms of: full-time farmer = 1, part-time fanner = 2, any occupation other than farming = 3.
18

Household Resources and Characteristicsl o establish resources available to the household, data was obtained on land (size and source of land), household size (both total size and by age composition as a proxy for labour availability), and resource endowment, which was measured in annual income and ownership of resource endowment indicators.
Cost. Cost of the technology was defined as all cost incurred in using the components of “push- pull technology to produce maize. Costs were defined in monetary terms. Where this was stated then the cost was converted into cash equivalent. The cost determined from the benefit costanalysis.
Village: Village was defined using the same definition used by the main Gatsby Charitable foundation funded ICIPE/ARC-Rothamsted/KARXMOALD collaborative project that considered a village to be smaller than a sub-location.
Household size'. Household size was defined as the total number of people of all ages residing in the household. To consider household size as a proxy for labour, adult members and post primary school children were defined as the household size as they were considered to be potential labour source.
A household size (HHSIZE) was measured in terms of total number of adult members and posts primary school children the household. Considering that the technology under study is labour
19

intensive and that household size is a proxy for labour, it was hypothesised that household size would positively influence adoption of the technology and participation.
Number o f preschoolers: Preschoolers (HHSLPRJE) were defined as children aged less than five years of age measured to nearest year. Number of preschoolers was defined as the total number of children aged less than five years of age and living in the household. Number of preschoolers was measured in terms of children less than 5 years of age and was hypothesized to have a negative influence on participation and adoption as they pose competition for care givers’ time.
Land size: Land size was defined as the total land in acres owned by the household. Ownership was defined disregarding ownership of a title deed. Source of land was defined as the method of land acquisition. Land size was stated in acres. Source of land was measured by respondents indicating whether they inherited, settled by government, or purchased, the land they owned. They were also supposed to indicate whether they were or were squatters.
Land as the main factor of production and determinant of social status was considered in this study. The technology under study was promoted for resource-limited farmers; therefore land (LANDSIZE) and source of land (SOURLAND) as a proxy for land ownership were both hypothesized to positively influence technology adoption and participation. It was then categorized according to the MOALD guidelines into:
1-5 acres = Small scale, 6—25 acres = Medium scale, 26 acres and above = Large scale (MOALD,).
20
Livestock ownership: Livestock ownership was defined as the number of domestic animals mainly ruminants the household owned. It was determined by numbers and types, i.e., oxen, cows, calves, bulls, donkeys, shoats, and others. This was hypothesized to have a positive influence on adoption and participation because of the fodder crops promoted by the technology. Livestock ownership was also used to determine wealth status.
Resource endowment: Resource endowment was defined as the types and number of assets or resources owned by the households. It was used as a proxy for wealth status. It was measured by a point scoring method, weighted depending on the value of the resource/ item (s) owned by the farmer (table 7). Weighting was based on the works of Chitere, Kiros, and Mutinga (1995) and the results of the 1997 house hold level survey undertaken in Trans Nzoia district (ICIPE, 1997). Resources identified and used as the basis for rating resource endowment include physical capital, which was stated in terms of type(s) and numbers that the fanner owned (i.e., tractor, ox plough, and cart, and land). Other properties were stated as follows: house type; vehicle; bicycle; radio; sofa set; wheelbarrow, etc.; and livestock. A relationship has been demonstrated between wealth status and technology adoption (Dasgupta, 1989; Gartrell, 1977; Gartrell and Gartrell, 1979; Rogers, 1983). In this study wealth status (WEALTHI) was hypothesized to have a positive influence on technology adoption and participation.
Communication VariablesInformation was obtained on communication related variables of project awareness, social interaction, and visits by collaborators, and contact with extension.
21

Project awareness: Project awareness was defined as respondents’ knowledge of the existence of project and its activities in the district. Further the year of awareness was defined in terms of the year respondents first heard about the project. It was measured by asking the respondents whether they were aware of the project or not and the year they became aware of the project. The act of being aware of the project satisfies the first step in adoption process. Therefore project awareness (PROJAW), like contact with extension, was hypothesised to influence adoption and participation positively.
Social participation: Social participation was defined as household head’s membership to social organisations. Social organisations were defined as groups that were formed to discuss societal issues. It was measured by listing the number of social organisations one belonged to. Interacting with other farmers and community members affords a farmer an opportunity to leam new ideas. Social organisations act as a forum through which farmers exchange ideas. Therefore membership in social organisations (SOCORG) was hypothesised to positively influence adoption and participation in the technology development.
Contact with extension agents: Contact farmers were defined as fanners selected by MOALD as the person on whose farmer meetings and trainings are held. This farmer receives fortnightly visit by the MOALD extension staff (Howell, 1982). Respondents indicated whether they were contact farmers or not. Being a contact farmer (CONTFAR) was viewed as the other source of information because it is also an indication of contact with extension agents. A score of 1 point was given for contact farmers and 0 for non-contact farmers. Being a contact farmer was also hypothesised to influence adoption and participation positively.
2 2

Contact with extension providers: Contact with extension providers was defined as visits made by MOALD extension staff, researchers from ICIPE/Rothamsted/Gatsby Charitable foundation, and other fanners to discuss issues related to the project under review. Only visits related to the project were considered in this study. Given that awareness is the first step in adoption, contact with extension providers was viewed as a source of information necessary to create awareness on the technology. Contact with extension providers was hypothesised to positively influence adoption and participation in the technology development. Contact with extension was measured by indicating and counting the number of visits that had been made by MOALD extension staff, researchers from ICIPE/Rothamsted/Gatsby Charitable foundation, and other farmers, who were the project collaborators. Respondents were asked to indicate the number of visits they had received from the project collaborators, and this was indicated in actual numbers of visits. Scoring was done at two levels: first the total number of visits was recorded, which was then categorized for analysis as a contact with extension. A score of 1 was provided for at least one visit made by the collaborators, which was used as an indicator of participation. Visits were hypothesized to have a positive influence on adoption and participation.
Total knowledge: Total knowledge was defined as knowledge about key aspects of the “push- pull” technology like crop agronomy and life cycle of the insect pest. Respondents were asked questions that related to the technology being developed, including maize, Melinis, Desmodium, and Napier grass agronomy and life cycle and control of stem borers. The results were then scored and the respondent awarded marks based on the number of correct responses (table 8). iTOTKNOWLE) was hypothesised to positively influence adoption and participation given that acquiring knowledge about a technology significantly increases the likelihood of knowing the
23

advantages of utilising the technology and, hence, participating in the project, adoption, and diffusion. Table 9 shows the scoring of independent (predictor) variables.
Organisation of the DissertationThis study is organised into five chapters. The first chapter provides the background to the study, problem statement, goals and objectives, and justification of the study. The second chapter reviews literature related to the research problem. It seeks to demonstrate the link between technology development, participation, adoption and diffusion. The review covers literature on technology development and resource limited farmers; participation, adoption and diffusion; and characteristics affecting adoption and diffusion. The theoretical framework guiding the study is presented in this chapter.
Chapter three focuses on the methodology adopted in the study. It is noted that the study relied on quantitative and qualitative techniques both in data collection and analysis. Combinations of tools were used in obtaining data. The study population is identified as resource limited farmers from the villages of Yuya, Kiminini, Kisawai and Wamuini in Trans Nzoia district. Chapter four presents results of the research. The chapter presents results of the statistical analyses. Both descriptive and inferential statistics are employed. The statistics are used to provide empirical results. A discussion of the results comprises the fifth chapter. Possible explanations for the nature of the observed results are advanced and areas for possible new research are proposed.The chapter also gives a summary of the study, policy implications, conclusions, and presents recommendations for further research.
24

CHAPTER TWOREVIEW OF THE LITERATURE
Research and development process involves interactions between different actors who play different roles (Fliegel, 1993). These actors interact in certain situations that have characteristics that affect the outcome of these interactions. Linkages between characteristics of new technologies and adoption have been demonstrated. The linkage is positive where all the characteristics are taken into consideration in the technology development and dissemination process. The literature reviewed herein explores socio-economic factors that influence technology adoption and diffusion and how they relate to a participatory approach to technology development and dissemination.
Technology Generation and DisseminationAgriculture has been identified as a complex social process in which different actors are continuously involved in the process of knowledge generation, transmission, and application. Development and dissemination of innovations, or new technologies, is aimed at introducing change in a social system through increasing agricultural productivity. Researchers, extension agents, and farmers are social actors who interact with each other and play different roles in the social system (Scoones & Thompson, 1994).
New technologies are viewed as one way in which agricultural productivity could be increased. Despite efforts put into developing agricultural technologies, limited success has been achieved in terms of agricultural development, especially in developing countries. Development achieved
25
in agricultural production does not reflect the value of resources invested in research and development. Farmers in developing countries continue to experience low production, which is attributed to non-adoption of technology (Feder, Just, and Zilberman, 1985).
Approaches used in research and development in developing countries have raised both pragmatic and ethical concerns. Research has been technology driven with little concern for the social dimension of the technology (Fliegel, 1993). Social effects of economic and technical change have not been a consideration. Technologies are developed elsewhere and transferred to developing nations with prescribed requirements in terms of skills and labour. Socio-cultural factors inherent in systems in which the technologies are being introduced are not considered (Ovwigho and Ifie, 2007). Conventional research and development approaches have developed technologies that put a lot of emphasis on inputs and environments as opposed to the socioeconomic and cultural conditions of farmers. Results have been technologies that do not fit the resource-limited farmers conditions. Cemea (1985) suggested people-centred interventions, in which the beneficiaries have a say in what is being developed, as being a way to avoid this kind of scenario. Long and van der Ploeg (1994) argued that farmers as social actors should not be viewed as passive recipients but, rather, as active participants in the process of developing and disseminating interventions.
26

Research and Development (RAD) and AdoptionAs aforementioned, socio-economic factors impact on technology adoption and diffusion. However, traditional methods of technology development and dissemination have tended to ignore the socio-economic constraints under which most farmers in developing countries operate. Little is bound to be achieved in terms of improving the status of the resource-limited farmers unless farmers are made active participants in the technology development and dissemination process, Charoenwatana (1987) and Besley and Case, (1993) argued that socio-economic factors and cultural parameters control the use of technology. Jazarry (1989) addressed basic changes that should be taken if needs of resource-limited farmers are to be met. Among others, the issue of considering the limited resources and the farming systems in which these farmers operate is raised.
Conventional Research and Development ApproachesOver the years, a ‘technology gap’ was perceived to exist between the developed and developing countries. Technology was viewed as Wanyama, Sayeweh, Rugege, Mugo, & Acebedo, 1996). It was envisioned that this gap would be bridged through the transfer of technology (TOT) by foreign assistance (Cohen and Uphoff, 1980).
The TOT paradigm of the 1950s emphasised the development of technologies by scientists who would pass on the technologies to farmers through extension. Technologies were developed in research stations, transferred to a few ‘progressive’ farmers through extension agents, and expected to ‘trickle down’ to the majority of the farmers (Schonherr and Mbugua, 1974). Extension agents or research officers were the controller and the supplier of ‘new’ knowledge to
27

tanners. The approach depended on external research (see Figure 2.1), which was then passed to extension to deliver to farmers (Chambers and Jiggins, 1987; Scoones and Thompson, 1994; Pretty and Chambers, 1994).
Research and development using the conventional TOT approach assumed homogeneity of the social system. Farmers were believed to be uniform in terms o f technological needs (Schonherr and Mbugua, 1974). Technologies being developed and disseminated were seen to be relevant to all members of the social system. The homogeneity was a necessary condition for diffusion. Yet .armers are heterogeneous; they vary in their socio-cultural and socio-economic characteristics (Roiing, 1988).
Figure 2.1 Simplified TOT model/approach (Source: Schonherr and Mbugua, 1974)
The TO T approach was based on the classical diffusion theory that states that innovations diffuse Trough a social system over time (Rogers, 1983). The classical diffusion model assumes a linear model with improved agricultural innovations being assumed to originate from a centralised
28

source and transferred to an ultimate user, the farmer (Figure 2.2). The approach treats fanners as passive recipients of the improved technology (Fliegel, 1993).
Technology Technology Utilisation of technology by farmers
generation transfer
Figure 2.2 Diffusion as a linear phenomenon (Source: Fliegel, 1993)
.Although the classical diffusion theory states that innovations diffuse in a social system, it did not state clearly the criteria for defining the social system (Roling, 1988). Examples of the classical diffusion model are the introduction of hybrid com in the 1920s in Iowa and the use of fertilisers in the 1950s (Rogers, 1983:32-33).
However, among resource-limited farmers, adoption did not take place as anticipated, as it became evident that TOT could only work under specific conditions which do not favour resource-limited regions (Chambers, 1994; Chambers and Jiggins, 1987; Roling, 1994). The TOT worked well in high input systems with controlled environments, whereas the environments in the resource-limited regions are characterised by ecological diversity, complex production systems, and high risks due to unstable weather (Chambers, Pacey, and Thrupp, 1989).
Participatory Approaches to Research and DevelopmentDue to the failure of the TOT approach to narrow the productivity gap between developed and less developed countries, more inclusive approaches were envisaged. Development practitioners advocated for an increase in the farmers’ role in technology generation and dissemination Bunch, 1985; Gubbels, 1988). The approaches were to involve farmers in research and
29

development. Development practitioners realised the need to treat farmers as active participants in research and development as opposed to mere passive recipients of technology. This ushered in participation in development in research and development. Participation is defined as the active involvement of a significant number of persons in situation analysis and in all decisions that enhance their well being (Cohen and Uphoff. 1980).
Participatory approaches evolved from experiences whereby farmers showed little interest in projects that were designed elsewhere and brought to them to implement. With time, a systems approach that took into consideration the farmers’ views and an interdisciplinary team was adopted. Farmers developed interest in the projects, thus participating in the design, implementation, and evaluation of their programs, which were based on their needs (Lowdermilk and Laitos, 1981).
Participation is imperative for enhancing sustainable development. Chitere and Karos (1996) noted that lack of participation by tarmers in technology development partly contributed to the lack ot adoption of useful technologies. Non-adoption of technologies was blamed on farmers’ ignorance and farm-level constraints, which were to be remedied by better extension and removing the constraints.
Approaches to participation vary considerably. Several typologies of participation have been developed (Cornwall, 2008). Biggs, quoted in Okali, Sumberg, and Farrington, (1994) has classified participation into various categories.
■ 'Contract’, whereby farmers’ land and services are used for research;
30

■ ‘Consultative’ participation, whereby researchers consult farmers to diagnose farmers’ problems and find solution;
■ ‘Collaborative’ participation, whereby researchers and farmers are partners and collaborate in most if not all activities;
■ ‘Collegial’ participation, whereby informal research and development is encouraged in rural areas.
Farming system research and extension (FSR/E), which is an adaptation of TOT, emerged in the mid-1970s after it was perceived that the green revolution had overlooked the majority of resource-limited farmers. It was the first attempt towards a participatory approach to technology development. Proponents of the FSR/E argued that the farmers’ needs, as opposed to preferences ot researchers, should determine research. FSR/E applied a systems perspective to identify technologies appropriate to local farm conditions (Collinson, 1985). The approach was developed after the realisation that the technologies in use were not fitting the farming systems to which they were being applied (Axinn, 1988). The technologies did not favour the conditions and needs of resource-limited farmers.
FSR/E assumed a multidisciplinary approach and involved all the stakeholders in planning and development of technology. It took into consideration the farmer’s physical, economic, and socio-cultural factors. Research personnel, in collaboration with extension personnel, would go to farms to listen to farmers and get an understanding of the farm as a system (Axinn, 1988). The activities of FSR E constituted basic research that was done mainly in laboratories, which were then tried at research stations. The results of the on-station trials were then tried under farmers’
31

conditions in on-farm trials so as to leam about the conditions of the farmers’ fields. The results were eventually communicated to experimental stations (Cornwall, Guijit, and Welboum, 1994).
The FSR/E still maintained the power in the hands of the research scientists. The scientists obtained information from farmers, processed it, and prescribed what they considered good for the resource-limited farmers without giving the farmers a chance to decide for themselves (Chambers and Jiggins, 1987). The main difference between the FSR/E approach and the conventional TOT approach was the fact that FSR/E incorporated technologies diagnosed as being appropriate into local farm situations.
Development of FSR ushered in participatory methodologies (Amanor, 1990; Farrington and Martin, 1993; Haverkot, Hiemstra, Reijntjes, and Essers, 1988), which have been in use in the 1980s and 1990s. Despite the fact that all participatory approaches differ in many ways, they all advocate for active participation of farmers in technology development. Participatory approaches are based on the fact that effective research starts and ends with farmers (Chambers, 1994). The following are discussions of participatory approaches.
Farmer participatory research was developed in the 1980s to involve farmers in research beyond the FSR/E (Chambers, Pacey, and Thrupp, 1989). The approach emphasises the use of Indigenous Technology Knowledge (ITK) as a valuable resource and the importance of farmer empowerment. It focuses on farmers as innovators and experimenters who try out new technologies alongside their local technologies (Chambers, Pacey, and Thrupp, 1989). Participatory assistance (PA), which is an alternative participatory approach, emphasizes a more
32

holistic participation. The approach encourages total farmer/farm-centred processes as opposed to participation in specialists’ owned research (Lanyon, 1994).
ICIPE's collaborative participation approach is one of the participatory approaches. The goal of the ICIPE approach was to have people-centred approaches that are socially acceptable. The approach collaboratively involves farmers, researchers and extension agents in all project activities (Kiros, Chitere, and Ssenyonga, 1993). Collaboration is viewed as a facilitating interaction with rural communities and a way to access important information and resources.
The ideal of participatory approaches is to involve farmers in generating and disseminating new technologies. Participation is about power and control. It is based on how the beneficiaries are involved and are able make contribution to their own development. Despite efforts and call for participation by all stakeholders, this remains a challenge in praxis (Cornwall, 2003). Certain groups remain marginalized when it comes to inclusive participation. Social and economic variables continue to determine those who participate or whose voices continue to be heard (Cornwall, 2003). Classifications adopted by some programs disfranchise the same groups they meant to speak for as realisations emerge that such groups may not be homogeneous (Cornwall, 2008). Participation like adoption is influenced by economic, social and cultural factors. Agrawal and Gupta (2005) in their study found that income, land, education and household size influenced household participation in government programs. Gender and age must be part and parcel of participatory programs if inclusiveness is to be achieved (Cornwall, 2003). Cornwall (2008:276) has argued for optimum participation that he terms as “... getting the balance
33

between depth and inclusion...” He notes that not everyone can be involved in the participation process. He sites cases of non participation, which he attributes to “self exclusion”.
Socio-Economic Factors and Technology AdoptionAdoption can be defined as a full-scale integration of an innovation into an on-going operation, and diffusion is the spread of an innovation over time among members of a social system (Fliegel, 1993; Rogers, 1983). Adoption and diffusion are actions that take place in certain situations, and these actions are affected by different characteristics of the situation. These characteristics range from farm size and income, tenure status, age and stage of family cycle to level of education. The characteristics are viewed as constraining farmers to adopt or not to adopt (Fliegel, 1993). In this study, socio-economic factors like land, labour, age, education, gender, social participation, and knowledge of innovation were examined in detail.
Research evidences that adoption and diffusion are influenced by various characteristics. Wijeratne and Chandrasiri (1993) have argued that the adoption process is governed by economic in addition to physical and agronomic factors. Bonnard and Scherr (1994) and Lionberger (1968), among others, have listed social status, education level, membership in groups, cost, and complexity of a technology as some of the characteristics that influence technology adoption and diffusion.
Socio-economic status is a function of resource endowment. The amount of resources one possesses determines one’s status. Poverty is a deterrent to adoption due to the lack of resources to take advantage of innovations. Several authors (Cancian 1967, 1972, 1976; Dasgupta, 1989;
34

Gartrell, 19 7; Gartrell and Gartrell, 1979; Rogers, 1983; Rogers and Shoemaker, 1971) have argued that there is a positive relationship between status and technology adoption. They stated that adoption is faster among rich as compared to poor farmers. The authors associated this to the tact that, in trying out new innovations, the individual is investing the resources that determine his or her status thus risking both that very investment and the opportunity cost associated with the resource. Gartrell and Gartrell (1985), Boyd (1980), and Cancian (1976), supported the relationship between economic status and technology adoption. They, however, argued that it is the lower middle status that is more likely to innovate faster as compared to the upper middle rank farmers.
LandLand is the basic production unit in agriculture. It is one of the most important determinants of status and land holding patterns in rural communities. Land is a major factor of production and an indicator of wealth status (Paudel, Shrestha, and Matsuoka, 2009). Larger farms indicate more resources and, hence, a better ability to take risk in adopting innovations. Several studies ' Praudel, Shrestha, and Matsuoka, 2009; Wetengere, 2009) have shown a relationship between tarm characteristics and adoption. Land size and ownership patterns indicate available economic resources (Fliegel, 1993).
Ashby (1982) reported findings that indicate both the presence and absence of a relationship between farm size and adoption. She attributed this to the issue of compatibility between developed technology and available resources. Abd-EUa, Hoiberg, and Warren (1981) found land tenure to be positively related to adoption because owners are freer to adopt than renters or
UNIVERSITY op NAIROBI LIBRARY
35

squatters. Saxena, Okeyo, Reddy, Omolo and Ngode (1990) observed that non-ownership of land could be an obstacle to those who want to access means to improve their agriculture.
LabourFamily size influences availability of labour (Agrawal and Gupta, 2005:1104). Labour impacts on technology implementation as it has an implication on the cost of the technology, gender roles, and responsibility. Labour affects technical design of a technology, which is a cost factor. Thus labour determines the characteristics of the technology, eventually impacting adoption (Rogers, 1983). Technologies that are labour intensive tend to be attractive to larger households. Abd-Ella, Hoiberg, and Warren (1981) contended that family size is positively related to adoption, as large families tend to use more family labour. In their study, Paudel, Shrestha, and Matsuoka, (2009) found labour to be significantly linked to adoption of maize production technologies.
Age
Farmer’s age has been reported to have an influence in some of the adoption studies and no influence in others. Lionberger (1968), Anosike and Coughenour (1990), and Ezeh and Unamma (1989) observed that age was positively related to adoption. Anosike and Coughenour (1990) argued that age influences farming decisions. They based their argument on the fact that younger farmers tend to be better educated, hence have higher farm income, and thus have surplus resources with which they can acquire new technology. Wetengere (2009) found that younger .irmers were more likely to adopt compared to older farmers who are more risk averse. Chitere 11998) established a lack of relationship between age and adoption.
36

Education
Education has an indirect influence on adoption. Bose (1964), quoted in Fliegel (1993) inferred that literacy was not necessarily a deterrent to adoption. He contended that information about innovation flowed through face-to-face communication channels. Dasgupta (1989) linked higher literacy and education to early adoption of technology in his review of 83 findings. Chitere (1998) reported a link between functional, as opposed to formal, education and adoption. In cases where a technology requires some skills gained through education and training, education level would be expected to be positively related to adoption. Some studies Abd-Ella, Hoiberg, and Warren (1981), Ani, Ogunnika and Ifah (2004), Ngoc Chi (2008) and Wetengere (2009), found education to be positively related to adoption. In such cases, the technology required training and reading of technology related materials. Some of the cases the technology was technical and required some degree of formal education to understand. Education enhances the ability to evaluate innovations and make informed decisions on its usefulness prior to adoption.
In their study, Ezeh and Unamma (1989) found formal education to be inversely related to adoption. They argued that illiterate farmers could still acquire favourable attitudes towards adoption that are assumed to be created by learning. Ezeh and Unamma concluded that formal education could not influence farmers to adopt innovations.
GenderThe discourse on participation cannot be complete without mentioning gender, which impacts participation and technology adoption. Gender, as a social construct, is important in positioning both men and women in relation to institutions that determine control and access to production
37

resources (Thomas-Slayter and Rocheleau, 1994). Women’s contributions to agriculture are acknowledged (Staudt. 1985). However, special obstacles that hinder their participation in technology development face women, who form a majority o f the rural population (Havekort, Hiemstra, Reijntjes, and Essers, 1988).
Research and extension has inadequately addressed the needs of women, which are often ignored. Development of technologies those are appropriate for women continue to receive inadequate attention (Ani, Ogunnika and Ifah, 2004). Compared to their male counterparts, women farmers are 'invisible* to extension agents who discriminate against women when designing and delivering improved technologies (Lewis, 1981; Matata, Ajayil, Oduol, and Agumya, 2008). Under the Training and Visit (T&V) system of extension the number of female 'contact’ farmers was low and female-headed households had fewer visits than the contact, non- contact, or non-T&V joint households’ (Due, Mollel, and Malone, 1987). Female-headed households are, moreover, among the poorest, and their numbers are growing (Whitehead and Bloom, 1992).
Gender considerations are therefore critical in technology development. Men and women need to be considered as stakeholders in technology development. According to Poats (1991), gender makes a difference in diagnosing farm-level problems and in the designing and adoption of new technologies. Jiggins (1986) suggested that, as long as a woman’s role in agricultural production is ignored or underestimated, agricultural production will not improve. Gender has been found to influence technology adoption by some studies while others have failed to link gender to adoption. In his study, Chitere (1998) found that gender did not influence adoption of IPM
38

technologies, while Wetengere (2009) found gender to be linked to adoption of fish farming. Wetengere argued that the low earnings acted as a deterrent to men, which could be an advantage tor household food security. As noted earlier, non-ownership of land can impede agricultural improvement, and that few women tend to own land registered in their name. Gender can be a hindrance to technology adoption (Saxena, Okeyo, Reddy, Omolo and Ngode, 1990, Ani, Ogunnika and Ifah, 2004).
Social ParticipationSocial organisation refers to the way society is organised, the interrelationships between different groups and institutions. Patterns of hierarchy and aspects of leadership impact on the way new ideas, messages, and innovations are introduced. Farmers’ position in the social hierarchy relates to their actions and attitudes towards information (McAllister, 1981). Social participation has a strong effect on adoption behaviour because interaction enhances access to ‘new’ information i Abd-Ella, Hoiberg, and W arren, 1981). Membership in social organisations is positively related to adoption in that as farmers communicate in the organisations, they are able to communicate to each other about new ideas (Ezeh & Unamma, 1989).
Knowledge of InnovationKnowledge is necessary for adoption as it is the step at which an individual encounters an innovation (Rogers, 1983). Contact with extension agents provides knowledge about recommended practices and creates awareness. Although awareness is necessary, it is not sufficient for adoption to take place (Gartrell & Gartrell, 1979). Knowledge of recommended
39

farm practices positively relates to adoption. Ngoc Chi (2008) in his study found that as the tanners’ technical knowledge increased the likelihood of adopting the technology increased.
Social participation and contact with extension agents as proxies for knowledge of recommended practices are positively related to adoption (Abd-Ella, Hoiberg, and Warren, 1981). Chitere (1998) noted that there is a positive relationship between contact with extension workers and adoption. He found that adoption was higher among farmers who reported having contact with extension agents than among those who had no contact. Characteristics of a technology should be considered in introducing the technology as it has been shown that attributes of a technology play an important role in its adoption and eventual diffusion (Rogers, 1983).
It is evident from the literature reviewed that innovations are introduced into social systems to bring about change in terms of increased agricultural productivity. Adoption and diffusion of these innovations are therefore imperative if change is to be achieved. The literature evidenced that conventional technology development and dissemination approaches treat farmers as passive recipients of innovations, thus ignoring socio-economic constraints facing them. On the other hand, participatory approaches are more inclusive and involve farmers in research and development processes.
^ actions taking place in situations, adoption and diffusion are affected by various -haracteristics of the situation. These characteristics need to be considered by those who adopt aPproaches for research and development processes for developing and disseminating Novations. Collaborative participation approaches are no exception.
40

Theoretical FrameworkThe study was based on a combination of theories and approaches. It considered the action theory, actor-oriented approach, farm adoption and diffusion model, farming systems research and extension model (FSR/E), and participatory approaches. The action theory based on Parsons and Shils’ (1967) work in Toward a General Theory o f Action and actor-oriented approach as proposed by Long (2001) were used to explain the relationship between socio-economic factors that relate to collaborative participation approach and their impact on adoption of ‘push-pull’ technology. Farming systems extensions and research and farm adoption and diffusion models were adopted to describe technology adoption and diffusion processes.
Action theory and actor oriented approachAccording to Parsons and Shils (1967), social objects (actors) interact, and the results of their interactions vary. According to this theory, a social system consists of actors interacting in a situation, and the actors are motivated by the need to optimise gratification (Ritzer, 1992). The orientation of the corresponding action processes could lead either to attainment of gratification or avoidance of deprivation.
Parsons and Shils (1967:54) were concerned with ‘“orientation” of one or more actors . . to situations, which includes other actors. Parsons and Shils (1967) further described situations as being composed of an individual actor’s objects and classes, which are peculiar to that actor. According to their action theory, action is viewed as being a process whereby there is a motivational significance to the individual actor. The organisation of action is a function of the
41

relation of the actor to his situation and the history of that relation. Action will be affected by the characteristics of the situation, and these characteristics vary from one situation to another.
In the present study, farmers, researchers, and extension agents are actors who interact in the social system (the community) with technology adoption being the intended action. Technology adoption is considered as an action taking place in a certain situation (Fliegel, 1993) with control of stem borers being the motivational significance and an increase in productivity being the gratification to the farmer. Unlike the action theory, this study took social object interactions as the basic unit in the study of the social system (Ritzer, 1992). In adopting Long’s (2001) actor- oriented approach, this study did not consider farmers merely as actors but as what Giddens (1984) refer to as Agency. Agency is the capability of an individual to make a difference based on situations and experiences and the need to cope with life situations (Bosman, 2004:22; Giddens, 1984). Long (2001) and Bosman (2004) contends that actions are not limited by motivations, which they note are not bound by continuity of actions but are reflexive. However they argue that an actor should be in a position to deliberate upon actions and make decisions. Giddens (1984) argues that action is based on rationalisation, and continuous monitoring of ones actions.
Although the action theory viewed actors as passive recipients in the socialisation process, this study adopted actor oriented approach and considered actors (farmers) as active participants in the technology development and dissemination process due to the collaborative participation approach adopted by the project. Long and van der Ploeg (1994:67) observed that, in participatory action, social actors are viewed as active participants who ‘process information and
42

strategies in their dealings with various local actors as well as with outside institutions and personnel’. Long and van der Ploeg (1994) further argued that farmers should not be viewed as passive recipients of planned change.
The study viewed all the collaborators in the study as social actors with capabilities to choose to participate or not participate in the project. Like in actor oriented approach, the collaborative project took into consideration the different actors in the project, who included farmers, researchers, and extension agents. By participating in the program farmers accessed information on the technology, which they continuously monitored and decide either to adopt or not to adopt. They possessed the capability to make decisions based on interaction with other collaborators and their own experiences as fanners and the need to cope with situations they encounter in this case are the maize stem borers.
Farmers’ actions were not determined only by motivation but rationalisation (Giddens, 1984). Actor oriented approach states that social actors are “knowledgeable and capable” of solving problems they encounter. They continuously monitor their actions and other actors’ reactions towards their behaviour and this guides how they act on their decisions (Bosman 2004:23). Adopting Long’s actor oriented approach, the study views farmers as actors that posses powers to choose to participate and adopt the technology. Long contends that “...actors are capable...of formulating decisions, acting upon them, and innovating or experimenting...” (Long, 2001:24- 25) their actions could be positive where they participate and adopt or negative if they choose not to participate or adopt the technology. The actor oriented approach also takes into consideration all the different actors in a situation (Long 2001:140).
43

Participation is identified as the situation, whereas from the literature reviewed, education, age, gender, farm size and income are some of the characteristics associated with the situations that were identified as affecting adoption. The organisation of the action was either to adopt or not to adopt, whereas the relation of the actor to his or her situation depended on the characteristics of the situation. Bearing in mind that the organisation of action is a function of the relation of the actor to his situation, the actor was expected to adopt technology if he/she participated in the development and dissemination of the “push-pull” technology. However, the socio-economic characteristics associated with the situation determined whether the farmers participated or not.
Farmers were expected to adopt the technology if they met the conditions of the collaborative participation approach, thus participating in the project. Adoption took place based on the fact that, if the relation of the actor (farmer) to his situation (met the socio-economic conditions) was conducive, then the farmer participated. If the farmer participated, then she/he was expected to adopt—a positive action—which in this case led to gratification. In following the process of adoption and diffusion, the study adopted the following models in explaining the processes.
Farm Adoption and Diffusion Approach/Model. echnology adoption and diffusion has been described in terms of an individual’s characteristics,: an innovation’s attributes; and the social status of the potential adopter. The classical diffusion theory, as presented by Rogers (1983) and others (Cancian 1967, 1976; Rogers and Shoemaker, 1971) has formed the basis for the study of adoption and diffusion. The theory states that, in a social system, individuals do not adopt innovations at the same time. A tew members adopt innovations at first then the innovations diffuse to the others through
44

communications and interaction among people. The speed of the diffusion process increases until it reaches a peak and, based on the number of people in the social system (see Figure 2.3), it then declines until the last members of the system are reached (Schonherr and Mbugua, 1974). Individuals are classified into five adopter categories depending on when they first used the innovation. Those who are quick to adopt are referred to as innovators. They tend to be keen to try new things, have resources they could tap into to experiment and risk losses, and have highly developed communication networks. They form 2.5% of people who adopt (Rogers, 1983).
Early adopters are local people who tend to be opinion leaders, and form part of reference groups. They are always ready to make innovation decisions. They are attractive to extensionists as a catalyst tor diffusion process. They comprise of 13.5% of individuals who adopt. Early majority form 34% of the adopters and take up innovations before majority of the community members (Rogers, 1983; Rogers and Shoemaker, 1971). They think through an innovation before they take up, and rarely lead others. The late majority make up 34% of the adopters (Rogers, 1983). They are careful with new innovations and will only adopt if they must. They wait to be convinced by the performance of the innovation before they attempt to adopt. They tend to have limited resources. Laggards form 2.5% of adopters and always the last to adopt (Rogers, 1983). They tend to adopt innovations that have been overtaken by events. They site their limited resources as reason for late adoption. They are never leaders (Rogers, 1983:250).Most agricultural extension sendees have been based on Rogers’ (1983) classical diffusion theory. Efforts are directed to the ‘most’ progressive farmers with the hope that the farmers’ characteristics and innovations’ attributes determine the rates of adoption.
45

According to the model, for an innovation to be adopted there are several stages that an individual goes through prior to adopting or rejecting the innovation. The individual has to be aware of the innovation, get persuaded, then decide to implement the innovation, and finally confirms his/her decision or reverses the decisions (Rogers, 1983), thus reiterating the importance of knowledge of the technology in the adoption-diffusion process.
Figure 2.3 Adoption/diffusion process as defined by the classical diffusion theory (adoptedfrom Rogers, 1983).
Farming systems research and extension (FSR/E) ModelThe farming system model, which advocates for the study of the farm as a system, has also contributed to the diffusion field (Ashby, 1985; Roling, 1994). The model takes a multidisciplinary approach ar.d involves all stakeholders in technology development. The model was developed as a result of the realisation that lack of adoption was linked to farm-level constraints (Chambers, 1994). Hence this demonstrated the fact that conditions on the farm impact on adoption hence the need to look at the farm as a system when introducing innovations.
46

FSRE arose out of the realisation that, in order to guarantee technology adaptability and adoption, there is a need to work with farmers in technology development (Collinson, 1985). The FSRE mode! advocates for the use of an interdisciplinary systems perspective. The model integrates on-farm and on-station experimentation in the design and testing of new or alternate technologies. There is collaboration between research, extension, and development entities in on- farm research and a focus on the farm family or household (Feldstein and Poats, 1989). In conducting research the model identifies relatively homogeneous groups of farmers who share agro-ecological zones as clients of research.
Participatory approachesFarming system research was the first attempt at introducing participatory approaches in agricultural research and development. The important fundamentals of participatory approaches are involvement of farmers in drawing up research agendas, designing, implementing, and evaluating development programmes. Participatory approaches actively involve stakeholders in all stages of technology development. Levels of local farmers and community involvement vary with type of participatory approach adopted. Approaches range from contractual participation where there is limited farmer participation to collegial whereby local communities drive their research without external facilitation (Okali, Sumberg, and Farrington, 1989). Based on this approach the author examined the collaborative participation approach used in the project and its effect on adoption and diffusion.
This study adopted an adaptation of the combined models in explaining the determinants of technology adoption. Parson and Shils’ (1967) action theory and Long’s (2001) actor oriented
47

approach were used to defme interaction among collaborators. A model modifying the features of the adoption and diffusion model, including aspects of both the farming system research and extension (FSRE) and participatory approaches formed the basis for this study. Based on the classical diffusion model, characteristics of the technology under review and how they impacted on adoption were looked at. Knowledge of the technology was considered as the first stage in the adoption process to determine its impact on adoption.
Deviating from the adoption and diffusion model, adoption was conceptualized according to the FSR E model by taking into consideration all the conditions on the farms that could impact adoption. Participatory approaches considered contributions made by farmers, among other collaborators, in technology development. In this respect, if taken into context, farmer characteristics influenced participation levels. The extent of goal realisation in technology adoption was, however, largely dependent on farm-level constraints. There had to be a match between the input demands of the technology and the resources available to the farmer.
Based on the FSRE model and the participatory models, farmer characteristics were more important with respect to technology design and acceptability of the technology especially among the resource limited populations. In involving the farmers at the technology development phase, the technology designs took into account the farmers’ characteristics while enhancing ownership. This should have ultimately reflected in higher levels of adoption. Care was taken that the technology also took into account the resource level of the farmers. One developed with farmer involvement but with no consideration for their resource level would fail in the adoption phase as it might turn out to be beyond their means. In contrast, this dichotomy was also present
48

in the situation where resource rich farmers were more likely to adopt a technology in whose creation they did not necessarily participate in simply because they had the means. The participatory models sought to magnify the level of participation in technology adoption in the community of farmers.
Conceptual model/FrameworkThe schematic representation of the conceptual framework (Figure 2.4) illustrates the linkages between technology development and adoption that incorporates this model. In the framework, farmers, extension agents and researchers as actors are interacting actively through the collaborative participatory approach. Farmers’ socio-economic characteristics will influence their decision to participate or not to participate in the technology development and dissemination process. Both the FSR/E model and participatory approach takes into consideration these variables. Those who participate are motivated by the need to control stem borer, but also make a rational decision to participate and aim at achieving gratification in the form of increased productivity.
Based on Long’s (2001) actor oriented approach farmers who participate are driven by their own decision due to their rationalisation and are motivated by the need to control stem borer and aim at achieving gratification the form of increased productivity (figure 2.4). Some of the farmers will monitor the technology continuously and because they posses agency and may choose not to adopt it even when they have participated in developing the technology (figure 2.4). This could still be attributed to their resource limited status if they realise the technology requirements are beyond their means. The adoption process will vary among the farmers giving rise to the adopter
49

categories as stated by Rogers (1983). Some farmers will still adopt the technology even in cases -hat they do not participate in developing the technology, but their actor orientation will enable them evaluate the technology if they find it meeting their needs and is within their means could still adopt. Adoption will lead to increased productivity and eventually achieving national foodsecurity.
Research HypothesesThe study hypothesized the following relationships with adoption for the variables in the study:
1. The extent of farmer participation in development of the ‘push-pull’ technology is dependent on socio-economic factors
2. The extent of farmer adoption of the ‘push-pull’ technology is dependent on socioeconomic factors
3. The extent of diffusion of the 'push-pull’ technology is dependent on socio-economic factors
4. Participating in the collaborative participation approach will influence adoption of ‘push- pull’ technology
50

c0w
aoPB<L
Figure 2.4 Linkages between technology development and adoption incorporating collaborative participation based on the action theory and actor oriented approach (Source:
developed by author)
51
No
P
ar
tic
ipa
tio
n

Operational definition of kev conceptsThe study had three main response variables: technology adoption, diffusion and participation in the project. The study sought to determine the influence of predictor variables on these response variables. To measure the predictor variables, the study started by determining what adoption involved and what participation entailed. Indicators of the two variables were derived from activities related to the project process, from which the variables were studied. These key concepts were used to state the hypotheses above and operationalized and defined as follows. Concepts defined include technology development, adoption, participation in the project, diffusion, socio economic factors categorized into household resources, personal characteristics, and communication variables. Below are definitions of the concepts, description of the measures and how they were arrived upon.
Technology developmentTechnology development was defined as all the processes and activities undertaken in relation to the ‘push-pull ’ technology. These included on-farm trials, trainings, and evaluations. These processes and activities were carried out in order to improve on the technology that had been developed in phase one of the project through on station trials (table 1). The third phase of the technology development entailed On-farm scientist managed and on-farm farmer managed trials and included technology evaluation. Ail project activities were targeting “push-pull” technology hence were considered as part and parcel of developing the “push-pull” technology.
52
Participation in the project is used interchangeably with participation in technology development. The goal of the project under review was to develop the “push-pull” technology; hence farmers who participated in the project were in effect participating in developing the technology.
Adoption VariablesAdoption was defined as implementing recommended practices related to the main components of the “push-pull” technology. The main component of the “push-pull” technology entailed planting a border of Napier grass around a maize field, and intercropping the maize with either silver leaf Desmodium or Melinis (Gatsby, 2005). Adoption of the “push-pull” was defined as planting Napier grass around a maize field and incorporating other important husbandry practices that enhance productivity of the selected crops.
Adoption was measured in terms of uptake of the “push-pull” technology components. Respondents were considered to have adopted if they (a) they were using the main component of the “push-pull” technology and (b) using recommended improved maize, Napier grass, Desmodium, and Melinis husbandry practices that complimented the technology. Intercropping was to increase efficacy of the technology. Beans intercrop did not impact the efficacy of the technology (Khan, Van den Berg, Wadhams, and Woodcock, 2000).
In order to reap the maximum benefit from the technology the farmer had to adopt recommended practices for the particular variety of maize and Napier grass. In the case of Trans Nzoia, the hybrid maize varieties were recommended. Activities related to maize crop production were listed and their impact on crop yield used to score practices as follows.
53

.As mentioned above, the main component of the technology that determined adoption was border planting of Napier grass and Desmodium or Mel inis intercrop. These were given the highest score possible of 3 for adoption (0 for non-adoption). The highest score for each of all the other practices was 2. Land preparation and planting dates, land preparation method, maize variety planted, soil fertility enhancement both at planting and top dressing, Napier grass variety selected, planting design for all the crops grown, spacing, weed control, and harvesting stage were all scored based on whether one undertook the activity and timeliness of the activity. The scores varied between 0 for non-adoption to 2 for adoption per recommendation. A respondent who undertook all the above activities as per recommendation of the collaborators scored a maximum of 40 points (table 2). One had to choose between Desmodium and Melinis intercrop. Adoption rates were expressed in terms of the total activities undertaken per technology combination and stated in terms of non-adoption, low adoption, medium adoption, and high adoption as described below (table 3)
For non-adoption, none of the activities related to the main component of the technology were undertaken. This implied that maize was planted using recommended practices and varieties, but there was no Napier grass border or intercrop with either Desmodium or Melinis. The maximum score for these activities was 15 out of the possible 40. Non-adoption was assumed to have taken place when a respondent scored between 0 and 15 points.
Low adoption, on the other hand, was considered to be adoption of the minimum requirement of the technology under study, which in this case was planting Napier grass border including the correct variety and planting date. Adopting recommended maize husbandry practices and
54
planting border Napier grass without the other practices related to Napier grass production scored a possible highest 21 points out of the 40. Therefore, if 15 was the maximum for nonadoption, then 16 was the minimum for low adoption, giving a range of 16 to 21 for lowadoption.
Medium adoption included all the above activities plus crop husbandry practices related to Napier grass production. The fanner planted a Napier grass border, selected the conect variety, planted on time, applied fertilizer on the Napier grass, weeded more than once, and harvested on time. This gave a total score of 27 out of the total 40. The range for medium adoption was between 22 and 27. All the crop husbandry practices are important for the technology; however in deriving the adoption rate it was assumed that high adopters had to adopt Napier grass border planting and one of the intercrops (Desmodium or Melinis). Assuming Desmodium (or Melinis) intercrop was adopted, in addition to adopting Napier grass crop husbandry the farmer intercropped Desmodium, weeded it more than once, applied fertilizer on Desmodium, and harvested it at the recommended time, thus scoring 40 points. The range was 28 to 40 points (table 3).
Diffusion
Roger (1983) and Fliegel (1993) have defined diffusion as the spread of an innovation over time among members of a social system. In this study diffusion was define as the use of the .echnology being developed by farmers other than the project fanners. It was assumed that project farmers were expected to use the technology the minute they chose to host project trials,
55

diffusion was assumed to have taken place among non project farmers. In this study, diffusion was measured in the same as adoption.
Participation VariablesBergdall (1993:2) described participation as it relates to rural development as, ‘Participation includes people’s involvement in decision making process, in implementing programmes . . . , their sharing in benefits of development programmes, and their involvement in efforts to evaluate such programmes’. In defining participation, this study took into consideration the key points outlined by Bergdall (1993) above. Participation was defined as being involved in processes and activities that targeted the “push-pull” technology. Participation also included sharing any benefits perceived to have been derived from the “push-pull” technology including, trainings, free inputs, educational tours, and field days.Participation level was derived by taking into consideration sets of project activities that collaborators engaged in the process of technology development. For the purpose of this study, participation as it relates to farmers was the focus.
During the data collection period the following activities took place (Chemweno, Dibogo, Ng’ang’a, and Ndiege, 1999): project introduction meetings; on-farm researcher-managed trial, project farmer selection meetings; village-level surveys; household-level surveys; farmer training workshops (three workshops were conducted during the duration of the study); agricultural extension agents’ training workshop (one workshop was held for the extension staff); fanner field days (two field days were held in each of the four locations, and some of the farmers from Trans Nzoia attended a similar field day in Suba District), which were combined with farmers’ evaluation of the technology; educational tours (two were held); and visits by the collaborators.
56

In 1998 fanners had the choice to volunteer to host the trials. During the trials they received planting materials and further training on the technology (Kiros and Nyapela, 1997). In measuring participation, activities, as described below, were scored to determine participation i tables 4 and 5). There were a total of 18 activities related to the “push-pull” technology development in which farmers could participate.
The lowest level of participation was defined by a farmer attending all possible meetings and activities that were open to everyone. These included meetings to introduce the project to communities, meetings to select farmers to host trial sites, volunteering to be a project farmer, and fanner field days (two were held per project site), which gave a total of 5 points. Low participation ranged between 1 and 5 points (table 4).
That is, one had to attend at least one of the activities to be deemed to have participated; otherwise there was no participation, a 0 score. The next participation level (medium participation) was derived from those activities that all farmers had an equal chance to participate but had limited control over whether or not to participate in addition to the five above. Participation was through random selection, and included activities such as household-level surveys (ICIPE, 1997), village-level surveys, and technology evaluation (two were held during the farmer field days; (Chemweno, Dibogo, Ng’ang’a, and Ndiege, 1999). These activities totalled 9 points tor farmers at the medium level. Medium participation therefore ranged between 6 and 9 points.
The highest level of participation was derived from those activities that a farmer could participate in only if she/he were Project Farmers. These included farmer training workshops
57
i three were held in the course of this study), educational tours (two were held, one to Mbita Point and the other to Trans Nzoia), visits by project collaborators (ICIPE/ Rothamsted Research/Gatsby, KARI, MOALD, and farmers). These activities totalled 9 points (table 5). Therefore, high participation ranged between 10 and 18 points. Table 6 summarizes how the different dependent variables were measured.
Socio-economic factors were defined as social and economic characteristics that impacted the decisions to participate in technology development, technology diffusion and eventually diffusion. They were defined as personal, household and communication characteristics that relate to the household head that will influence their decisions that affect participation, adoption and diffusion. The characteristics were social or economic in nature (see elsewhere for detailed discussions on definitions of individual socio-economic factors).
Conclusion
It is evident from the literature reviewed that innovations are introduced into social systems to bring about change in terms of increased agricultural productivity. Adoption and diffusion of these innovations are therefore imperative if change is to be achieved. Conventional technology development and dissemination approaches treat farmers as passive recipients of innovations, thus ignoring socio-economic constraints facing them. On the other hand, participatory approaches are more inclusive and involve farmers in research and development processes. However, adoption and diffusion as actions taking place in situations are affected by various characteristics of the situation. Approaches adopted for research and development process need to consider those factors that relate to that approach when developing and disseminating innovations. Collaborative participation approaches are no exception.
58
CHAPTER THREE
RESEARCH METHODOLOGY
The chapter presents the methodology used to achieve the study objectives. Quantitative and qualitative techniques were applied both in data collection and analysis. Study sites and unit of analysis, sampling design and procedures used, and data analysis techniques employed are discussed in this chapter.
Study sites and unit of analysisThe project under review is located in Trans Nzoia district of Kenya. The choice of the district was based on a study that had identified it as high stem borer prevalence site (Kiros and Nyapela, 199.'). Trans Nzoia District is the highest maize producer in the country with 60% of the country's production (Nyangito and Ndirangu, 1997:2). Maize stem borer is a major insect pest ot maize. This combination made this district suitable for the project given that it had set out to develop a maize stem borer control technology. The study cited by Kiros and Nyapela (1997) also identified maize stem borer ‘hot spots’ in the district. This research formed part of the Gatsby-funded ICIPE/ARC-Rothamsted/KARl/MOALD collaborative project that was initiated to develop an IPM approach to control maize stem borer in Trans Nzoia district.
Trans Nzoia district covers an area of 2,468 km2 (246,800 ha) with an estimated population of 5 c,662 an annual growth rate of 4%, (Central Bureau of Statistics, 2002). Trans Nzoia district is divided into seven administrative divisions namely Saboti, Cherangani, Kiminini, Central,
59

Kwanza, Kaplamai, and Endebess divisions. The project is sited in Kiminini, Central, Kaplamai and Sabod divisions. These divisions were identified as stem borer hot spots.
The maize stem borer study had been conducted in 15 locations, based on agro-ecological zones and selected through systematic random sampling. The project team then established four research sites within these 15 locations to be based in four divisions as adequate for the project. The sites based in Kiminini, Central, Kaplamai and Saboti divisions were selected due to the level of stem borer infestation, number of livestock kept and accessibility. The villages of Yuya, Wamuini, Kiminini, and Kissawai were selected within these locations (Kiros and Nyapela, 1997). The villages represented three different agro-ecological zones, which influence the area’s agricultural systems (Ministry of Agriculture, 1997). The villages represented the three major agro-ecological zones in Trans Nzoia district. Kissawai represented the lower highlands (LH2), a predominantly livestock production zone; Kiminini represented the Lower highland 3 (LH3), a wheat/maize zone; and Wamuini represented the Upper midland 4 (UM4), a maize zone. It is beyond the scope of this study to discuss the influence of the ecological zones on the technology.
Farming (maize cultivation and dairy) is the main economic activity in the district (MOALD, 1999). The district is considered the maize granary of Kenya due to the amount of maize produced. Maize (both commercial and seed) cultivated on over 65,000 ha is the main crop grown in the district. Other crops, like beans, wheat, potatoes and horticultural crops, are grown to a lesser extent (MOALD, 1999). Farmers in Trans Nzoia practice intercropping, with maize- beans intercrop being the most common combination.
60

Trans Nzoia district is a settlement area, formerly part of the so-called 'white highlands’, which consisted of mainly large-scale European-owned lands, the land has been subdivided and is owned by individual Kenyan citizens, groups, and the government. Land ownership varies between large farms and small landholders (Tellegen and Foeken, 1992). Majority of the residents have been settled there either by the government, political leaders, or through land purchasing the rest are squatters on other people’s land (Jones, 1965). The type of settlement has an implication on the population density of the area and the land size. Yuya and Wamuini had higher population density (see elsewhere for the discussion on land size and sources of land) compared to Kissawai and Kiminini.
The settlement in Trans Nzoia is based on ethnicity; the village one comes from is related to their tribe and type of agriculture practiced. Yuya is predominantly a Luhya settlement; 76% of the respondents in this village were Luhyas practicing mainly maize/beans production and less livestock farming. Kissawai is mainly a Kalenjin settlement (84%) with emphasis on dairy production, both exotic and cross breeds. Wamuini on the other hand is a mostly Kikuyu settlement (84%) whose residents practice both maize farming and livestock production more so intensive dairy farming. Kiminini has a mixture of Kikuyus (57%), Kalenjins (2%), Tesos (2%), Luhyas (37%), confined in different parts of the village, practising mixed farming systems (table 10).
Maize stalk borer is considered the main pest of maize crop and contributes to yield losses approximated to be within the range of 20 to 80% (Ampofo, 1986). Among other pest control measures, ICIPE’s “push-pull” approach is being employed to address the stem borer problem
61

through the Gatsby-fiinded collaborative project in the study areas. Farmers also utilise other control measure such as cultural practices that use sand and ashes and the use of chemicals.
The household was the unit of analysis, considering that it is a dynamic unit where production decisions are made. The unit of observation was the household head.
Sampling methods and proceduresSingleton, Straits, and Miller Straits (1993:131) and Punch (1998:105) have noted that it is not possible to observe all events or study the whole population, hence sampling is necessary. This study employed sampling techniques to select a sample to work with. The study had two categories of farmers, project and non-project farmers, thus a combination of sampling techniques was necessary. A combination of probability and non-probability sampling, as described by Singleton et al. (1993:155), was used to select the sample.
Lists of farmers’ household mapping were obtained from village headmen. The total number of households in the project areas was 719 (table 11). By the year 2000 the study area had increased spontaneously to include the neighbouring villages. Some of the respondents in this study resided in areas beyond the original project areas. The households were distributed as shown in table 12. Study respondents were drawn from this list. The study had two categories of farmers. Project tanners were farmers who had been exposed to project activities and received material assistance from the project. They received assistance with planting materials, trainings, and regular follow up by the research team. Non-project farmers had not been exposed directly to project activities. The number of respondents varied with the population of the village under study. Yuya and
62

Kiminini had the highest number of respondents, represented by 35% and 31% of the total respondents, respectively. Wamuini and Kissawai were represented by 17% of the total respondents each (table 13).
Project fanners were selected in 1997, 1998, 1999, and 2000 during the on-farm researcher- and tanner-managed trials. In the first year (1997), 11 project farmers were selected to undertake on- farm researcher-managed trials. These farmers were selected by their community members after they met the set criteria. In the second year (1998), 44 more farmers joined the project, bringing the total of project farmers to 55. By the year 2000, the number of the trial farmers had reached 150.
Project farmers selected in 1997 were excluded from the study sample; all 1998, 1999, and 2000 project farmers were included in the study. This was done to avoid introducing bias in the study given the 1997 project farmers had been selected by their communities whereas the other project farmers made the decision to join the project. Out of the 139 project farmers included in the study, 120 were randomly selected using simple random sampling. One of the respondents eventually was dropped because she was absent from home most of the time the enumerators visited to interview her, leaving a sample 119 respondents. Respondents were drawn from Yuya, 'A amuini, Kiminini and Kissawai villages of Trans Nzoia district. In order to capture the variations w-uhin the population and contribute to sampling efficiency (Singleton et al., 1993:145; Barbie, 1995.211), the population was stratified into project and non-project farmers. Non-project fanners were then purposively sampled (Singleton et al., 1993:154: Schutt, 2001:164). For each project farmer, one non-project farmer within a radius of 1 km was purposefully selected to form
63

part of the study sample of 238 respondents. A total of 119 project and 119 non-project farmers were interviewed, of which 220 (92%) were considered to be useful for analysis. Nine questionnaires (three from Yuya, two from Kiminini and three from Wamuini) from the project formers and nine corresponding questionnaires from non-project farmers were discarded due to inconsistency in the responses and refusal to provide answers to some of the questions. This resulted in a total sample of 220 respondents (table 13).
Data Collection methodsCombinations of data collection methods were used in the study. A structured questionnaire consisting of both open-ended and close-ended questions was used in data collection (Singleton et al., 1993:243). This method was used to allow for neutrality and provide rational responses (Punch 1998:176). Open ended questions were used to collect data on farmers’ perception of the technology and provide respondents with opportunity to answer questions without introducing bias. The also author recorded observations made during visits to the field (Punch, 1998). In the course of the year 2000 and 2001 cropping season a questionnaire was administered at scheduled sessions to collect data on personal characteristics, household resources and characteristics, and communication variables. The questionnaire provided information related to farmers’ participation in the collaborative participatory approach of technology development and their attitude and knowledge on the technology.
The questionnaire was pre-tested on the ten 1997 project farmers (Kiros and Nyapela, 1997) and ten other non-project farmers to determine if it was providing the information that it was meant to (Singleton et al., 1993:253). The results of the pre-tested questionnaire were discussed with
64

the university supervisors, and revisions were made to the questionnaire. Revisions entailed inclusion of missing information, restructuring of the sequence of the questions, rephrasing of leading questions and those that were causing misunderstanding, and omission of unnecessaryquestions.
To administer the surveys, the Researcher relied on the help o f three Research Assistants. These were trained on administration of the interview both before and after the pretesting process. The pretesting was done together with the author as a practical session with the research assistants. The author made visits to the field to verify the data collection process. During such visits, she made personal observations that related to the respondents’ attitudes towards the technology and noted other responses that had not been captured by the questionnaire (Punch, 1998).
In addition to participation, adoption and diffusion data, an economic data collection form was developed and used to collect production data during 1999 cropping season. The economic data was collected among the ten 1997 project fanners to establish the cost-benefit ratio of the technology. Additional information on demographic profiles, the collaborative participation approach, and land acquisition and use was obtained from secondary sources mainly other reports related to the project and household level survey conducted in 1997.
Time FrameThis study was based on the third phase of the project, running between January 1998 and December 2001. The field research covered the period between August 1999 and December 2000. This period coincided with two cropping seasons. The period between August 1999 and
65

December 1999 was spent on collection of production economic data on the project farmers, whereas the period between January 2000 and December 2001 was spent on collecting socioeconomic and demographic data on both project and non-project farmers and collaboration data from the collaborators.
Data Analysis and Organisation ProceduresAt the end of data collection, the completed questionnaires were then edited for errors and omissions. Where corrections were not plausible the questionnaires were discarded. Responses to the questionnaires were coded numerically, entered in an Excel® spreadsheet for analysis and
cleaned. Quantitative data was then imported into SPSS® version 16 software for further data analysis. Qualitative data collected using the questionnaire and personal observations were coded using open coding (Flick, 1998:180-182). The data was then analyzed using summarizing content analysis procedure (Flick, 1998:193).
In this study data were analysed using both descriptive and inferential statistics. Descriptive statistics were used to organise, summarise, and present the data (Sokal and Rohlf, 1981:38; Punch, 1998:132) in order to obtain a clear picture of the data. Inferential statistics assisted in making decisions about the data by establishing the relationship that existed among the variables of interest and making generalisations about the population (Sprinthall, 1994:13). In addition a benefit-cost analysis was done to determine the benefits accrued from the technology. The details and results of these analyses are presented in subsequent chapters.
66

Descriptive StatisticsSokal and Rohlf (1981:38) have contended that an accurate description of facts is important before attempting to analyse their causes. Further, data have to be organised and summarised so as to be able to determine information contained within (Daniels 1995:15). In this study, data were organised and summarised using a combination of descriptive statistics. Statistical tools like frequency distributions; measures of central tendencies, like means, medians, and modes; and measures of dispersion, like range and standard deviation were used to summarize quantitative variables. Incomes, wealth status indicators, level of education, and age, although measured on a ratio scale (Sprinthall, 1994:17), were also categorised for descriptive analysis.
Data measured on nominal and ordinal scales were summarised using frequency distribution with the mode used to measure central tendency (Norusis, 1991). Central tendency on interval and ratio data were measured using mean and median, with the range and standard deviation measuring the dispersion. This group of data was then categorically analysed to yield ordinal data that was then summarised using frequency distributions. Cross tabulations (contingency tables) were then applied to the categorical data to describe the relations among the variables. Tables and other charts are used to present the data.
Inferential statisticsCategorical analysis was done on all key data to yield ordinal data. All data measured on a nominal scale were quantified using dummy variables for the purpose of doing higher levels of analysis. Daniels (1995:460) described a dummy variable as ‘a variable that assumes only a finite number of values (such as 0 or 1) for the purpose of identifying the different categories of a
67

qualitative variable’. This implies that the variable does not have a quantitative value. The rest of the variables measured on an interval scale were included in the regression model.
Cross tabulations were computed to establish the association among the various variables. Chi- square statistic was used to test for independence among the variables of interest in order to measure association (Norusis, 1991:265-268; Sprinthall, 1994:329-331). This test was done between the response variables of adoption and participation in the collaborative approach and the predictor variables, and between the various predictor variables. Correlation was used to measure the strength of the association. Further, a regression analysis was performed to determine the relationship between the predictor (independent) variables and the response (dependent) variables (Daniels, 1995:483; Sokal and Rohlf, 1981:762). The regression analysis adopted was multiple regression analysis (MRA), which was used to predict or explain the response variables from the predictor variables.
Test of Independence and measure o f associationTo determine if the criteria used to classify the responses were independent of each other, a test of independence was employed (Daniels, 1995:520). The chi-square statistics was the test selected for this study. The statistic tests the null hypothesis that the criteria of classification are independent. Under this test, the variables are independent if the distribution of one variable is the same irrespective of the distribution of the other variable. This is determined using observed and expected frequencies. The observed frequencies are the frequencies that appear in the sample, whereas the expected frequencies are those frequencies that would appear if the null hypothesis were true. The chi-square statistic is expressed by:
68

X: = S 110,-E,)2]Ej
\\'here: Oi = Observed frequencies and Ei = expected frequencies
The null hypothesis is true if X2 is distributed approximately as the x2 with k-r degrees of treedom. The Pearson’s chi-square statistic was used to test for independence among the variables. In reporting the chi-square xT the value is indicated with its associated degrees of freedom and the significance value. For example x2 (2) = 35.23, p< .001 (Value of chi-square x2 was 35.23 with 2 degrees of freedom, and it was significant at /K.001).
Once an association was established, correlation analysis was undertaken to measure the strength ot the association. Pearson's correlation coefficient r was used to measure the strength of the relationship. Correlations range between -1.00 and 1.00. A 1 means a perfect correlation, which could be negative or positive, while a 0 indicates lack of correlation. Correlation coefficient isdetermined by:
_ cov*> _
“ V , ” (A M )V ,
U nere st is the standard deviation of the tirst variance, sy is the standard deviation of the second
variance * represents the mean of the sample, x, is the data point. Both the r value and the p (significant value) are stated when reporting correlations (Field, 2005). Example: there was a positive relationship between class attendance and score in the subject r = .38. p < .05.
69

Relationship between Predictor and Response VariablesTo determine the relationship among variables, a higher level of analysis was employed. Multiple regression analysis (MRA) was employed to describe a relationship between independent (predictor) variables and dependent (response) variables. In regression analysis the predictor variable is used to predict or explain the response variable. There are two vanables of interest, the x variable which is controlled by the researcher and, hence, is not free to vary and is referred to as the independent (predictor) variable; and the y variable, which varies and is the dependent (response) variable. Regression analysis has several underlying assumptions (see Daniels, 1995:355) for discussion on the assumptions). The type of regression analyses adopted depends on the situation under study.
MRA was used to provide information on the impact of the predictor variables over the response variable while limiting effects of other independent variables. It sought to determine the dependent variable from several independent variables. MRA tells the predictive power of the relationship between the two variables. Variables used in MRA must be measured at a higher level, either interval or ratio. Nominal data can be used in MRA by converting it into categorical data using dummy variables (Singleton et al., 1993:424). This analysis assumes linear relations. MRA strengthens the explanation of the predictor variables. The MRA model is expressed by:
y - p o + (3iXi + P 2 X 2 + . . .+ pkX|( + e i ,
Where: y = dependent variable to be predicted; p0, P i„ p2---pk = constants; Xi, x2...xk = independent variables measured without errors; and e= random error (Mendenhall, 1987).
70

MRA applied requires evaluation. The evaluation is made using the goodness of fit and the estimated coefficients. The goodness of fit measures how well a model does the job of describing the relationship between the two variables. To measure the goodness of fit, the coefficient of multiple determination R2 is used (for properties of R2, see Agresti and Finlay, 1997). R2 evaluates the strength of the regression equation and is determined by:
_ I ( y- y)2- \2S (y i-y )
A large R2 indicates that a large percentage of the dependent variable can be explained in the equation, which means the regression explains the relationship between the variables. In such a case the regression equation is favoured. However, in case of a smaller R2, instead of rejecting the regression outright, it is subjected to a test of significance. The test determines the usefulness of the regression equation in predicting and estimating the response variable. The F ratio is the test statistic applied in the case of MRA and is expressed by:
F ~ k(l-R2)Where: N = the number of cases and k = number of predictors in the model
In statistical packages this information is provided in the analysis of variance (ANOVA; see Agresti and Finlay, 1997). In the study, the SPSS5 software package was used to non the MRA and ran all the necessary tests concurrently. The study employed MRA in determining the impacts of socio-economic factors discussed in the literature review on adoption and participation in the project. The regression model was specified using household head characteristics, household characteristics and resources, and communication variables, which
71

were the predictor variables, and participation, adoption and diffusion, the response variables. Project fanners and participation are used in the text interchangeably to denote participation inthe project.
Economic Benefits of the TechnologyBenefit-cost analysis was used to determine the economic benefit of the technology. Secondary data were used in the analysis where applicable. Marom and Volk (1994) have argued that in determining the cost of production, the expenditures or losses incurred due to production should be reflected. Gross margins are able to capture both the expenditures and losses. Gross margin analysis is used to determine the real change in a farm due to undertaking a certain production activity on the farm. Gross margins are an indication of the difference between income and variable costs. Gross margin analysis was chosen for this study because it has been argued that it is the right criterion for deciding on a venture to undertake on a farm. It is beyond the scope of this study to do an in-depth analysis of what it entails.
Limitations of the StudyThe study involved only four villages in Trans Nzoia district. These villages may not absolutely reflect the unique characteristics of any other village nor any unique situations of the villages represented. The sampling strategies adopted, however, permitted generalisation to be plausible.
The study focused on socio-economic factors in technology adoption, diffusion, and participation; however the study was limited to socio-economic factors that related to
72
development of “push-pull” technology as defined by the main Gatsby funded project. Only small-scale farmers as defined by the MOALD for Trans Nzoia district were involved in the study. This classification was based on Trans Nzoia district classification of farmers; that is, small scale = 0 to 5acres. medium scale = 6 to 25 acres and large scale = >25 acres (MOALD, 1997). The study involved farmers owning less than 12 acres of land and practising mixed farming. This group of farmers represents the category of farmers who are bound to benefit from this technology. However, the study group may not represent the entire group of small scale farmers in all aspects.
73

CHAPTER FOURRESEARCH FINDINGS
This chapter presents results of the qualitative and quantitative analyses from the field research. It details data organised and summarised through descriptive statistics. To be able to show the relationship between variables of interest, a higher level of analysis was necessary. Inferential statistics are employed to depict this relationship. The chapter presents empirical results based on data analyzed using these statistics. Findings presented include economic evaluation of the introduced technology.
Results are based on responses to questionnaires administered; economic data collection sheets filled, and field observations. The chapter details the socio-economic characteristics of the respondents, household characteristics that impact on technology adoption and diffusion, and communication variables that relate to the technology such as knowledge of the technology and visits by project collaborators.
Information on technology adoption rates, participation in the project and farmers’ perception of the benefits of the technology is provided. Results of the measure of association and the relationship between the predictor and response variables are detailed. Benefits of the technology as perceived by the respondents along with benefits as determined by the benefit-cost ratio areaiso presented.
74

Socio-economic characteristics o f respondentsThere were rwo main categories of respondents in the study. Respondents were disaggregated based on whether they hosted project trials or not. Respondents who hosted project trial were referred to as project farmers and those who did not host trial, non-project farmers. A total of 220 questionnaires of which 110 were project and 110 were non-project fanners were useful foranalysis.
Personal characteristicsPersonal characteristics of gender, age, education, occupation, marital status, were used to describe respondents. Below is a detailed discussion of these characteristics
Gender: Male headed households accounted for 75% compared to 25% female headed households (both de facto and de jure). Gender distribution was equal among project and non project farmers, with male and female household heads accounting for 50% of the respondents in each category. Out of the 56 female household heads, 28 were project and 28 were non-project farmers. .Among the 164 male headed households, 81 were non-project farmers and 83 project farmers. Age of the household head did not vary significantly with gender. Age distribution among male and female headed households was similar. Contrary to the norm, the female household heads were more educated than the male headed households. Fourteen percent of the female household heads had achieved post secondary education compared to 10% of the male headed households. More of the single household heads were female at 23% compared to male headed households at 2%. There was more full time farmers among female headed households (91%) compared to male headed households (82%).
75

Age: Mean age of respondents was 48.2 years (SD= 11.4, median= 48 years) the minimum age was 25 years and the maximum was 88 years, with a range of 63 years. Over 50% of the respondents were middle aged (between the ages of 40 and 59 years of age), which happens to be the most productive years. Less than 20% were classified as being old, aged 60 years and above. More of the non-project farmers (11%) were over 60 years of age compared to the project fanners (7%). The percentage of young household head was low among both project (3%) and non-project farmers (5%).
Education: Educational activities were a key component of the development of the technology under review. Farmers hosting trials attended a series of formal training sessions (Chemweno, Dibogo. Ng’ang’a, and Ndiege 1999). The activities required basic literacy to enable participants to read and write information obtained during training. This study focused on formal schooling as a measure of education, and the respondents indicated the highest level of education attained. The mean number of years of formal education was 7.2 (SD = 3.6). Less than 10% of the respondents had no formal education, which indicates a high literacy level among the respondents. Although the majority of the respondents (92%) had at least lower primary education, only a small percentage (6%) attained post secondary education (table 14).
More of the non-project farmers had no formal education (10%) compared to the project farmers (6%). Although the percentage of both project and non-project farmers possessing at least lower primary education was high, slightly more of the project farmers (94%) had at least a lower primary education compared to non-project farmers (90%).
76

Occupation: Respondents were desegregated by whether they were full or part time farmers. Pan time fanners were asked to indicate their other occupation. The study confirmed fanning as the main economic activity in Tran Nzoia district. Majority of the respondents 84% were full time farmers. Distribution of full-time and part-time fanners across the two categories of respondents was similar, with 81% and 82% full-time project and non-project farmers, respectively.
Pan time farmers were mainly teachers or businessmen and women, which represented 52% of all the pan time farmers. The other part time farmers were Assistant chiefs (6%), drivers (9%); village elders, carpenters and pastors, each represented by 11%, and the rest represented less than 3% of the pan time farmers. Although the Traditional birth attendants (TBA), village elders and pastors were listed as pan time farmers, they did not consider themselves gainfully employed. They viewed their other profession as voluntary, given that they did not draw a salary or wage but a token of appreciation.
Marital status: Majority of the respondents (93%) were married. Polygamy was less prevalent in the study area as indicated by only 20% of the respondents. Less than 10% of the respondents were single; among the single respondents were divorcees, widowed, and unmarried. There were similar percentages of single and married household heads among project and non-project farmers at 92% in each category.
Household CharacteristicsHousehold characteristics considered in this study included land size, source of land, households size, number of preschoolers, income, number of livestock, and wealth status.
77

Land size: The average land size was 5.09 (SD = 5.19). The median was 3.5 acres, and the mode is 1.80. As expected by the project, the majority of the respondents (73%) were small-scale farmers owning up to 5 acres of land, and less than 30% of the respondents owned more than 5 acres. Small scale farmers accounted for more than 70% of both project and non-project farmers. There were 28 % project and 25% non-project farmers among respondents owning more than 5 acres (table 15).
Source o f land: All the respondents owned the land they were farming. Majority of the respondents had purchased their land (80%), with 19% being settled by the government, and only a small number (1%) of respondents had been settled by the government in the study areas. Source of land trends were similar among project and non project farmers.
Household size: The average family size was 8 (SD = 4.0), with the majority of the households having 7 members. Most of the households (63%) had between 6 and 10 members. Household size did not vary significantly between the two farmer categories with 65% of non-project farmers compares 68% of project farmers having more than 5 people in each household.
When household size was based on the number of household members who could potentially provide labour, the average number of people of at least secondary school age per household was 5 people (SD = 3.3), with the maximum number being 27. These are the group of people who potentially could provide labour for the technology being reviewed. Results of the showed that majority of the household (65%) had between 1 and 5 members who could provide labour.
78

each category.
Presence o f pre-schoolers in the households: Children below the age of 5 years, place demand on time and labour for minders, thereby competing with the technology for factors of production like labour. The number of pre-schoolers was an indication of the number of dependants in the home who need nurturing, which eventually would impact on the ability of the adults to provide labour. The average number of pre-schoolers in each household was 1 child (SD = 1.3). The maximum number of pre-schoolers reported was 6 children, and some households reported no children under age of 5 years. Forty-one percent of non-project farmers and 43% of project farmers had no preschoolers in their households. More than half of the households (58%) had at least 1 child less than 5 years of age.
Income: Majority of the respondents were reported to be poor to very poor based on the stated income for the year 2000 (United Nations Development Programme, 1999). Average annual income was Ksh. 14,311 (SD = 11,786). The median income was Ksh. 38,500 with one of the respondents having an annual income of Ksh. 1,750,500. About 90% of the respondents had an annual income of less than Ksh. 100,000, and less than 10% of the respondents earned more than Ksh. 150,000 during the year 2000. Over 50% of the respondents earned an annual income of Ksh. 50,000 or less.
Income was earned from at least two sources, with maize being the main source of income as reported by 91% of the respondents. Respondents who indicated other sources of income as the
Among these, non-project farmers recorded 67% and project farmers 64% of the respondents in
79

mam income still depended on maize, although to a lesser extent. Less than 10% of the respondents were in the low income category, and the majority 51% reported being in the medium income category. Distribution of respondents by farmer category was similar across the income categories. Sixty-three percent and 55% of project and non-project farmers, respectively, earned less than Ksh. 50,000 in the year 2000.
Livestock numbers: The technology being developed had fodder as a major component; therefore livestock numbers were one of the predictor variables under study. Households owned an average of 2.27 (SD - 1.5) animals. The minimum number recorded was 0, and 8 was the maximum. The mode and median were 2 animals. Majority of the respondents (86%) owned between 1 and 5 animals, and less than 5% owned more than 5 animals.
Wealth status: Wealth and social statuses were measured in terms of local status, which were relative to the social system in which the farmer operated (Cancian, 1981), rather than societal stratification. Wealth status was measured and scored based on the number of wealth endowment indicators possessed. Majority of the respondents (59%) belonged to low wealth status category, with less than 10% being in the high class.
Apart from wealth status, the social status was determined in relation to the position of status held at the local level. At least six of the respondents were considered to be holding position of status, based on what was viewed as a status position. In this case, two of them were assistant chiefs, and 3 others were village elders or ‘mukasa.’ One of the respondents who owned a wholesale shop was considered ‘very rich’, which earned him respect among his peers. In one of
80

the villages, though, the 'mukasa' was not viewed as a status symbol, as reported by one of the respondents: ‘a “mukasa” is a petty person who can only solve petty issues, like drinking problems, and petty theft in the village. We are too busy to become ‘'mukasas' ... This was in response to a question raised by the author as to why the area still lacked a village elder after the passing of the former village elder.
Communication VariablesThe study looked at communication variables of membership to social organisation, visits by collaborators, contact with extension agents, project awareness, attendance to project related training activities, and knowledge on the technology.
Membership to social organisations'. Membership in social organisations was evident among the respondents with almost 80% of the respondents belonging to at least one social organisation. The social organisations cited by majority of the respondents were church-related organisations, with a few of them belonging to farmer co-operatives and women groups. Eighty-four percent of project and 75% of non-project farmers belonged to at least one social organisation.
Visits by project Collaborators: When asked if they had received any visits from the project collaborators, 51% of the respondents indicated that they had received at least one visit from IClPE Rothamsted/Gatsbv. MOALD. KARI, or fellow farmers. All the project farmers received visits from more than one collaborator. Non-project farmers received limited visits from collaborators; with only 4% of non-project farmers receiving visits from more than one collaborator. The mean number of ICIPE/Rothamsted/Gatsby researchers’ visits per farmer was
81

4.6 (SD = 7.6), with the highest reported number of visits by ICIPERothamsted/Gatsby researchers being 46. These Researchers had visited more than half of the respondents. KARI researchers made the least number of visits, at 7% of the respondents.
When asked to indicate whether farmers had visited them in relation to project activities, results indicated that 47% of the respondents had been visited on issues related to the technology. On average each farmer had received 7 visits (SD = 17.66). The maximum number of visits by fellow farmers was 190; however, this was attributed to farmers who had visited to attendfanners’ field day.
The MOALD extensionists had made the most number of project related visits. Visits considered for this study excluded those related to data collection for this research. Eighty-two percent of the respondents received at least one visit from MOALD. All project farmers received visits from MOALD extensionists.
Contact with extension agents: Being a contact farmer was considered a measure of one’s regular contact with the extension agents. The majority of the respondents 64% were not contact farmers. There was more contact farmers among project farmers (55%) compared to non-projectfarmers (17%).
Project Awareness: Project awareness was the first step to participation and technology adoption. It was the point at which a farmer realised the existence of both the project and technology being developed. Majority of the respondents (90%) were aware of the project. As
82

expected, all the project farmers were aware of the project, however project awareness among the non-project farmers was also high (79%).
Majority of the project farmers (86%) and non-project farmers (55%) became aware of the project by 1998. The project was introduced to farmers in 1997. By the time of this study several training and field days, through which farmers became aware o f the project, had been conducted by the project. Twenty eight percent became aware of the project in 1997, 42% in 1998, 17% in 1999. and only 3% became aware in 2000.
Knowledge on the technology: When the total score on knowledge was analysed, results showed a median score of 9 and a mean score of 9.53 with a standard deviation of 3.4 for the total score of 15. The minimum score was 3 and the maximum score was 15, giving a range of 12. All the respondents were knowledgeable about maize agronomy, 93% about Napier grass, 20% about Melinis, 18% about Desmodium, and 66 % were knowledgeable on stem borer life cycle and damage. Project farmers scored highly on knowledge of technology with 66% scoring average to highly knowledgeable compared to 17% of non-project farmers. None of the project farmers had limited knowledge of technology, whereas 14% of the non-project farmers reported limited knowledge.
Attendance to project related training: Training sessions included in this analysis were training workshops, farmers’ field days, evaluation field days, and educational tours. When asked if they had attended any educational activities, 70% of the respondents had attended at least one training session. Attendance at educational tours, at 7%, was the lowest among all the training activities.
83

Attendance at a minimum of one farmer field day stood at 85%, evaluation field day at 70%, and training workshops at 45% for all the 220 respondents. All the project farmers had attended at least one training session compared to 39% of non-project farmers. In terms of attending more than two training sessions, non-project farmers fared worse off with only 7% compared to 74%of project farmers.
Relationship between predictor and response variablesThe study had three main factors of study, technology adoption and diffusion and participation in technology development, which were the response variables. The predictor variables were divided into three main categories: personal characteristics of the household head, household characteristics, and communication variables. Below are discussions of the relationship between the variables. Chi square analysis of the response and predictor variables was run detailing the relationships among them. Correlations of response and predictor variables were conducted. The final section of the chapter details the regression analysis of the response on predictor variables.
Hosting project trials (project and non-project farmers)Respondents were distributed based on whether they hosted or did not host project trials. To determine factors influencing choice to host project trials, a chi square analysis was run for hosting project trials against personal characteristics, household characteristics, and communication variables. Presented below are the results of the analysis.
Personal characteristics: Most of the personal characteristics did not significantly influence the choice to host project trials except education level of the household head. Gender (x2 = 006, df
84

= 1, p = .937), age (x2 = 4 .3 4 0 , df= 4 , p = .3 6 2 ) , occupation (x 2 = 0 .0 3 4 , df= \ ,p = .854) and marital status (X2 = .0 2 9 , d f = 2, p = .9 8 5 ) of the household head did not significantly influence the choice to host project trials. While education was significant in influencing the choice to host project trials, x2 = 1111 -00, df= 3 ,p< .0 0 0 5 .
Household characteristics: Chi square analyses showed that household characteristics did influence the decision to host project trials. Size of land owned by (x2 = .7 4 1 , df= 2, p = .6 90 );
Source of land (x2 = 1 .3 8 9 , d f = l , p = 2 3 8 ) ; Household size (x2 = 2 .1 2 1 , df= 2 ,p = .3 4 6 ); number of household members who could potentially provide labour ( x2 = 1-711, d f = 2 , p = .4 2 5 );
number of preschoolers (x2 = 1 .0 0 5 , df= 2 , p = .3 1 6 ); income ( x2 = 1-478, d f = 2 , p = .4 78 );
wealth status (x2 = 2 .6 7 9 , d f = 2 , p = .2 6 2 ) were not significant influencing the decision to become a project fanner.
Communication variables: All communication related variables were significant in influencing hosting project trials except membership in social organizations, which did not significantly influence the choice to become a project or non-project farmers (x2 = 2 .8 5 2 , d f - 2 , p = .240). The other communication variables of being a contact farmer (x2 = 3 4 .6 5 0 , df= 1, p < .0 0 0 5 ); project awareness (x2 = 4 7 .9 8 0 ' df = 4 , p < .0 0 0 5 ); visits by collaborators (jf = 2 0 7 0 .0 0 , df = 3, p < .0005); knowledge of the technology (jf = 6 1 .5 5 7 , d f = 3, p < .0 0 0 5 ); and attending project trainings (x2 = 1 5 8 3 .0 0 , df = 3, p< .0 0 0 5 ) were highly significant in influencing the decision to host project trials thus becoming project farmers.
85

Technology adoption and predictor variablesAdoption was measured in three categories, low, medium and high adoption, based on the components of the technology adopted. Sixty percent of the respondents reported adoption of some components of the technology. Majority of the adopters 76% recorded medium adoption, and only 12% achieved high adoption. As expected, all project fanners adopted compared to 21% of non-project fanners. Most of the project farmers who adopted reported medium adoption (78%). Eight percent of the remaining project farmers recorded low adoption, and 14% high adoption. Results of the analyzed data indicated that the technology diffused to 11% of the adopters. Among them 30% achieved low diffusion, 65% medium and 5% high diffusion.
Personal characteristics and adoptionGender: Findings of the study indicated slight variations in adoption trends by gender. Among female headed households, 37% did not adopt the technology compared to 41% non adoption among male headed households; 10% achieved low adoption among female headed households against 6% for male headed households; and 44% reported medium adoption among female compared to 47% among male headed households. The percentage of high adopters was marginally higher among the female (10%) than the male headed households (7%) (table 16). A chi square test of independence indicated that gender was not significant in influencing technology adoption, x2 =1.570, df= 3,p = .666.
Age: Middle-aged respondents recorded high adoptions, especially medium level adoptions, compared to the young and the old who recorded high score among non-adopters. There were 32% non-adopters among middle-aged respondents, 6% low adopters, 54% medium and 8% high
86

adopters. Young household heads reported 46% non-adoption, 11% low adoption, 37% and 6% and high adoption (table 17). Age was not significant in influencing technology adoption, £= 1 9 .1 27 , df= 12,/? = .086.
Education: Technology adoption was low among respondents without any formal education (39% ). High adoption was recorded among those who had at least upper primary school education (54%) and those with high school education (53%). A chi-square analysis indicated that education was significant in determining technology adoption, x2 =1202.00, df= 9,p< .0005.
Occupation: Adoption within the occupation categories was similar. Majority of full-time (54%) and part-time (51%) farmers achieved at least medium adoption. Among the full-time farmers, 38 % did not adopt the technology, 8% recorded low adoption, 47% medium adoption, and 7% achieved high adoption. Adoption among part-time farmers was as follows: 46% did not adopt the technology, 3% achieved low adoption, and 43% recorded medium adoption and 8% high adoption (table 18). Occupation did not significantly influence technology adoption, x~ = 1.697, df=7>,p = .638.
Marital Status: Half of the single respondents 50% did not adopt the technology, whereas most of the married respondents (over 60%) adopted. Adoption trends were similar among the married groups, both monogamous and polygamous. The results showed that no adoption was reported by 37% and 39%, low adoption by 8 and 7%, medium adoption by 46%, and high adoption by 9 and 8% of those in monogamous and polygamous relationships respectively (table 19). Chi
87

adoption. =1.774, d f - 3 ,p = .621.
Household characteristics and adoptionSize of land: As earlier indicated majority of the respondents were small scale farmers. Among this group of farmers. 37% did not adopt the technology, 9% reported low adoption, and the highest percentage (45%) recorded medium adoption, with the rest recording high adoption. .Among farmers who owned more than five acres, 46% did not adopt the technology, 3% reported low adoption, 48% achieved medium and only 3% high adoption. Land size did not significantly influence the decision to adopt the technology, f l =5.532, d f - 6,p = .478.
Source o f land: Among those who had purchased their land, 41% did not adopt the technology, 6% reported low adoption, 46% medium, and 7% high adoption. Of those who had inherited or had been settled by the government, 33% did not adopt the technology, 10% achieved low adoption, 47% achieved medium adoption, and 10 % high adoption. Test for independence results showed that the source of land did not influence adoption, = 0.993, df= 1 ,p < .01).
Household size: The technology was attractive to large households, and higher adoption rates were reported within these households. Among households with 6 to 10 people, 38% did not adopt the technology, 10% reported low adoption, 45% reported medium adoption, and only 7% managed high adoption. Half of the households (50%) with fewer members (1 to 5 people) did not adopt the technology, only 2% of this group achieved high adoption, and 10% and 45% achieved low and medium adoption, respectively (table 20). The test of independence indicated
square analysis showed that marital status was not significant in influencing technology
38

0.388.
Among households with 1 and 5 people who were of at least high school age, technology adoption was recorded as follows: 41% did not adopt the technology, 8% low adoption, 45% medium adoption and only 6% managed high adoption. Households with more than 5 people who could provide labour reported 37% non-adoption, 5% low adoption, 47% medium adoption and 11% high adoption. Sixty-five percent of the households where technology had diffused had between 1 and 5 people who could provide labour. Labour was significant in influencing technology adoption, %' =2.603, d f - 3,p = .047.
Number o f pre-schooler: Among households with at least 1 pre-schooler, 39% did not adopt technology, similar to those without any pre-schoolers (40%), 9% reported low adoption, 46% medium adoption, and only 6% achieved high adoption (table 21). Chi square analysis indicated that presence of pre-schoolers was not significant in influencing adoption, x2 =2.864, df= 3, p =.838.
Income: There were similar adoption trends across the income categories. Low income status reported 43% non-adoption, 10% low adoption, 38% medium, and 20% high adoption respectively. Medium and high income classes had similar scores across the four adoption categories: 39 and 40% non-adoption, 7 and 8% low adoption, 47 and 52% medium adoption, and 7% high adoption respectively (table 22). A chi-square analysis indicated that household income did not significantly influence technology adoption, x2 = 1.360, d f= 6 ,p = 0.968).
that household size did not significantly influence technology adoption, x2 =7.366, d f = 6 , p =
89

Livestock ownership: Adoption did not vary significantly with Livestock ownership. Among farmers owning 1 to 5 animals, 38% reported low adoption, 47% reported medium adoption, and 7% achieved high adoption. Among farmers who did not own any animal, 48% did not adopt the technology, whereas the majority 52% achieved mainly medium adoption (table 23). Livestock numbers were not significant in influencing technology adoption, X = 3.630, df= 6, p = .727.
Wealth status: Medium wealth status respondents exhibited similar trends to the high wealth status category. Among the low wealth category, adoption was reported as follows: non adoption 41%. low adoption 8%, medium adoption 43%, and high adoption 8%. High wealth status respondents reported 47% non adoption, 6% low adoption, 41% medium and 6% high adoption (table 24). Wealth status did not significantly influence technology adoption, X =2.203, df= 6, p = .900.
Communication variables and adoptionMembership to social organisations: Results of the study showed over 50% of those who belong to a social organization adopted the technology. Among respondents belonging to 1 to 5 groups, 65% adopted the technology, 74% of those belonging to more than 5 organisations adopted and those who did not belong to any organizations reported 49% adoption. Respondents who belonged to over 5 organizations performed better at 69% of them achieving medium to high adoption compared to 49% for the 1 to 5 category (table 25). Membership in social organisations had a positive significant influence on technology adoption, X =17.691, df= 6 ,p < .05.
90

Visits by Collaborators: Adoption varied with visits by project collaborators. Results of the study suggest that visits by the various collaborators significantly influenced adoption of the technology. .All respondents who had received at least one visit adopted the technology. Among them 10% reported low adoption, 76% achieved medium adoption and 14% high adoption (table 26). V is its by collaborators significantly influenced technology adoption, =265.400, df= 3, p < .0005 .
.Among those visited by ICIPE/Rothamsted/Gatsby researchers, 92% achieved medium to high adoptions, 8% achieved low adoptions, and there were no non-adopters in this group. Visits by ICIPE, Rothamsted/Gatsby researchers had a positive significant influence on technologyadoption, = 1582.00, df= 3, p < .005.
All the respondents who received at least one visit from KARI adopted the technology, with 93% achieving medium to high adoptions and 7% reporting low adoption. All respondents who had received at least one visit from KARI researchers adopted the technology. Among them 10% reported low adoption, 76% achieved medium adoption and 14% high adoption. Visits by KARI was found to be significant in influencing technology adoption, %2 =22.103, df=2>p< .0005.
Some of the visits by farmers contributed to others adopting the technology. All the respondents who received visits from other farmers adopted the technology with 95% achieving medium to high adoption, and 5% achieving low adoption. Visits by other farmers had a positive significant influence on technology adoption, x~ =1412.00, df= 3 ,p < .005.
91

Among respondents visited by MOALD, 28% did not adopt the technology, 8% achieved low adoption, 55% medium adoption and 9% high adoption. Adoption was higher among those who received at least one visit from the MOALD compared to those who had received no visit. Visits by MOALD had a positive significant influence on technology adoption, x' =1269.00, df= 3 ,p <.005.
Contact with extension: The study showed that more of the contact farmers (80%) compared to non-contact farmers (49%) adopted the technology. Contact farmers reported 5% low adoptions, 6 4 % medium and 11% high adoptions. Non-contact farmers achieved 9% low adoption, 36% medium and 4% high adoptions (table 27). Contact with extension agents had a positive significant influence on technology adoption, x2 =24.488 df= 3, < .0005.
Project awareness Ninety percent of the respondents were aware of the project. As expected, all the project farmers were aware of the project. More of the respondents who became aware of the project adopted it compared to those who were not aware. All of the respondents who were not aware of the technology had not adopted it. Among those who were aware, 33% did not adopt and 67% adopted the technology (table 28). Most of the adopters (51%) were in the medium adoption category. Project awareness was highly significant in influencing technology adoption, X2 =37.369, rf/= 3 ,p < .0005.
fear of awareness: Adoption was high (84%) among those who became aware of the project in 1997; among them 16% did not adopt, 6% reported low adoption, 68% medium adoption, and
92

10° o high adoption. The 1998 awareness group had 41% non-adopters, 10% recording low adoption. 39% medium, and 10% high adoption. There were only 6 respondents who became aware in the year 2000, they achieved 50% adoption. This group combined with the year 1999 to test for independence. Year of awareness significantly influenced adoption, %2 =56.891, df= 9,p< .0005.
Knowledge on the technology: Data showed that the higher the level of knowledge displayed, the higher the level of adoption. High adoption levels were evident among those who were highly knowledgeable (96%) compared to those with limited knowledge (13%). Over 50% of respondents with limited to average knowledge on the technology did not adopt the technology. Only 13% of respondents with limited knowledge adopted compared to 88% of the highly knowledgeable respondents. Respondents with average knowledge reported 57% non-adoption, 10% low adoption, 31% medium, and 2% high adoption (table 29). Results showed knowledge on the technology highly significantly influenced technology adoption, X ~ 95.414, d f = 6, p < .0005.
Attending training sessions: Among those respondents who attended at least one farmers’ training session, 81% adopted the technology. Adoption was higher among those who had attended more than 2 training sessions. Results showed that respondents who attended 1 to 2 trainings reported 44% non adoption, 4% low, 46% medium, and 6% high adoptions. The higher the number of trainings farmers attended, the more likely they were to adopt, with those attending 6 to 9 trainings reporting 95% medium and 5% high adoptions (table 30). The chi
93

square test of independence indicated that the number of training sessions attended influencedtechnology adoption, x2 = 1494.00, df= 3, p < .005.
Technology option: The basic design of the technology was Napier grass border planting, with Desmodium or Melinis intercrop. Sixty percent of the respondents adopted the technology. Twenty percent adopted Napier grass border planting only, 8% Napier grass border and Desmodium intercrop, 9% Napier grass border and Melinis intercrop, and 17% adopted Napier grass border and intercrop beans. All those who adopted Desmodium and Melinis intercrop achieved medium to high adoption compared to Napier grass border and bean intercrop adopters who achieved low to medium adoption. Respondents who adopted Melinis intercrop achieved 71% medium and 29% high adoptions. Those choosing Desmodium option achieved 41% medium and 59% high adoptions (table 31). Technology option selected significantly influenced adoption, x2 =3093.00, df= 12,p < .0005.
Participation in the project and predictor variablesParticipation in the project was one of the main factors of study. As mentioned earlier, participation was measured based on technology-related activities in which respondents participated. Participation was measured at four levels: no participation, low participation, medium, and high participation. Participation was generally high (81%) among all respondents. Data analysed indicated that 19% of the respondents did not participate in the project, 27% of the respondents reported low participation, and 17% and 37% reported medium and high participation, respectively. The majority of those who reported low participation (73%) did not adopt the technology.
94
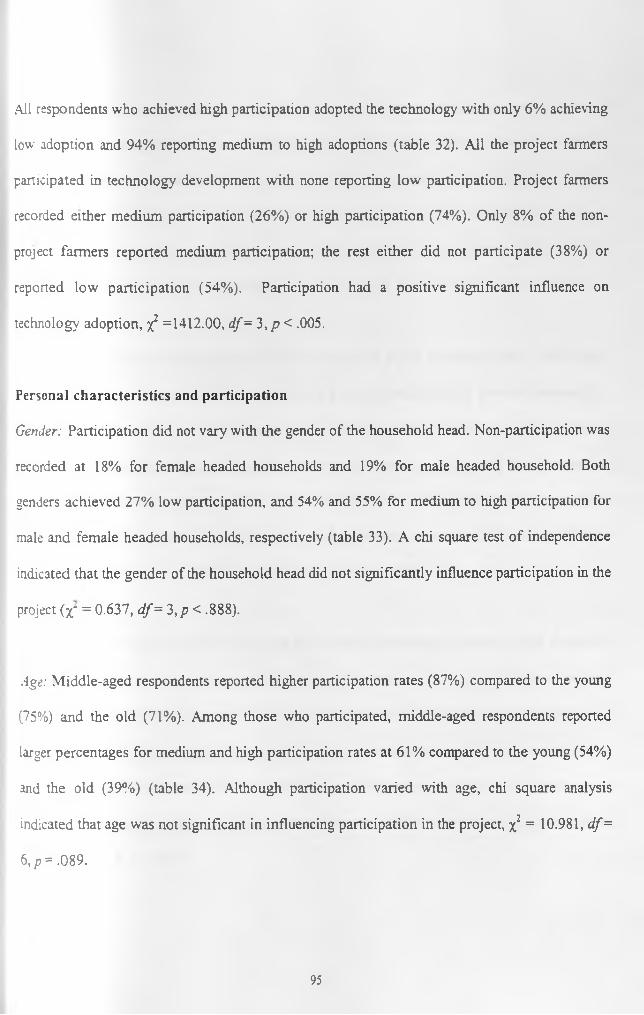
All respondents who achieved high participation adopted the technology with only 6% achieving low adoption and 94% reporting medium to high adoptions (table 32). Ail the project farmers participated in technology development with none reporting low participation. Project farmers recorded either medium participation (26%) or high participation (74%). Only 8% of the nonproject farmers reported medium participation; the rest either did not participate (38%) or reported low participation (54%). Participation had a positive significant influence on technology adoption, x2 =1412.00, df= 3, p < .005.
P e r s o n a l characteristics and participationGender: Participation did not vary with the gender of the household head. Non-participation was recorded at 18% for female headed households and 19% for male headed household. Both genders achieved 27% low participation, and 54% and 55% for medium to high participation for male and female headed households, respectively (table 33). A chi square test of independence indicated that the gender of the household head did not significantly influence participation in the project (x~ = 0.637, df= 3,p< .888).
Age: Middle-aged respondents reported higher participation rates (87%) compared to the young (75%) and the old (71%). Among those who participated, middle-aged respondents reported larger percentages for medium and high participation rates at 61% compared to the young (54%) and the old (39%) (table 34). Although participation varied with age, chi square analysis indicated that age was not significant in influencing participation in the project, x2 = 10.981, df= 6,/?= .089.
95

Eduction: Participation was higher among better educated respondents. Eighty-seven percent of those with secondary education and all respondents with post-secondary education achieved medium to high participation levels compared to 39% for those with no formal education and 9% for those with lower primary school education. There were more respondents (39%) without formal education who did not participate compared to the educated respondents (17%) (table 35). Education significantly influenced participation in the project, %2 = 1.744, df= 9, p < .0005.
Occupation: Participation did not vary with the occupation of the household head. Participation percentages across the levels were similar among part-time and full-time farmers. Among fulltime farmers 19% did not participate, 27% reported low participation, 16% medium participation, and 38% high participation. Part-time farmers’ participation was reported as follows: 20% did not participate, 26% had low participation, 20% recorded medium and 34% had high participation (table 36). Chi square analysis showed occupation did not significantly influence participation in the project, yC =10.981, d f - 6,p = 0.089.
Marital status: Participation was fairly high across the different marital status groups. Over 80% of respondents in each marital status category participated in the project. Medium and high participation were reported in over 50% in all the categories. Single respondents reported 19% no participation, 25% low participation, 31% medium participation, and 25% high participation. Married respondents reported 20% non-participation, 26% low participation, 17% medium and 37% high participation (table 37). Marital status was not significant in influencing participation, 1C =3.836, df=6, p = .699.
96

Household characteristics and participationLand size: Participation was high across the land size categories. All the categories had over 70% of the respondents participating. Over 50% of respondents reported medium to high participation (table 38). All the respondents owning more five acres participated in the project. Small-scale farmers reported 19% non-participation, 27% low participation, 17% medium participation, and 37% high participation. Results from consolidated categories and separated categories showed that land size was not significant in influencing participation, jf = 5.430, d f= 3,p = .490.
Source o f land: More than 70% of respondents who purchased their land participated in the project, among them 37% reported high participation, similar to those who were given land (inherited land or were settled by government), (37%) who achieved high participation. Among those who purchased their land, 19% did not participate, 29% reported low participation, 15% medium participation, and 37% high participation. Of those who inherited land or were settled by government, 13% did not participate, 22% had low participation, 28% medium participation, and 3-0i high participation. The source of land was not significant in influencing participation in the project, ■ £ =2.767, d f — 3,p = 0.429.
Household size: High participation was reported in all the three household sizes. In the l to 5 people category, 33% recorded high participation, in the 6 to 10 people high participation was reported at 36% and in the over 10 people category 46% achieved high participation. All the categories had less that 25% of the respondents reporting no participation (table 39). The chi square test of independence indicated that household size had no significant influence on participation in the project, jf = 4.634, df= 6,p = .592.
97

Eighty percent of households with more than 5 people who could provide labour participated in the project. Among them, 41% reported high participation, 15% medium participation, and 24% low participation. Households with less than 6 people had 19 % not participating, 29% having low participation, 17% medium participation, and 35% high participation. Labour did not have a significant relationship with participation in the project, x =1.923, df= 3, p = 0.027.
Presence o f pre-schoolers: Households that had children under the age of 5 years participated as much as those without. Among households without young children, participation was at 84%, whereas those with at least one young child had 79% participation. Low participation was reported at 27% for households with preschoolers and 16% for those without (table 40). Medium participation was reported at 17% for both categories and high participation at 39% for those without and 36% for households with young children. The presence of pre-schooler in the household did not significantly influence participation in the project, x =4.891, df= 3,p = .558.
Income: Participation varied marginally across the income classes. High participation was the most frequently reported level reported by respondents in all the income classes. Low income status had 19% non-participation, 29% had low participation, 24% medium participation, and 29% high participation. Medium income respondents reported 17% non-participation, 30% low participation, 14% medium and 40% high participation. High income respondents reported 36% high participation, 21% medium participation, and 22% each for low and no participation (table 41). A chi- square analysis indicated that household income did not significantly influence participation in the project. X = 5.331, df= 6,p = .502).
98

Livestock ownership: Among respondents who did not own any animals, 16% did not participate in the project, 40% reported low participation, 12% medium participation, and 32% high participation. Among those who owned at least one animal 20% did not participate, 38% reported high participation, 17% medium participation, and 25% low participation (table 42). Livestock ownership did not significantly influence participation in the project, x2 =2.793, df= 5, p = .834.
Wealth status: Results of the analysis showed similar participation trends across the wealth classes. Among the low class, participation was reported as follows: 18% non participation, 31% low participation, 12% medium participation and 39% high participation. Medium class reported 19% non participation, 21% low participation, 26% medium participation, and 34% high participation. High wealth status category, which was the minority, achieved 29% non participation, 25% low participation, 10% medium participation, and 36% high participation (table 43). Wealth status did not significantly influence participation in the project, x" = 8.820, d f = 6, p = .184.
Communication variables and participationContact with extension agents: A low percentage of contact farmers (6%) reported not participating in the project, and a moderately high percentage (63%) reported high participation. On the other hand, non-contact farmers reported 26% non-participation, 33% low, 18% medium, and 23% high participation (table 44). Results from the study indicated that contact with extension agents had a positive significant influence on participation in the project, x2 = 37.806, <//=3,p<.0005.
99
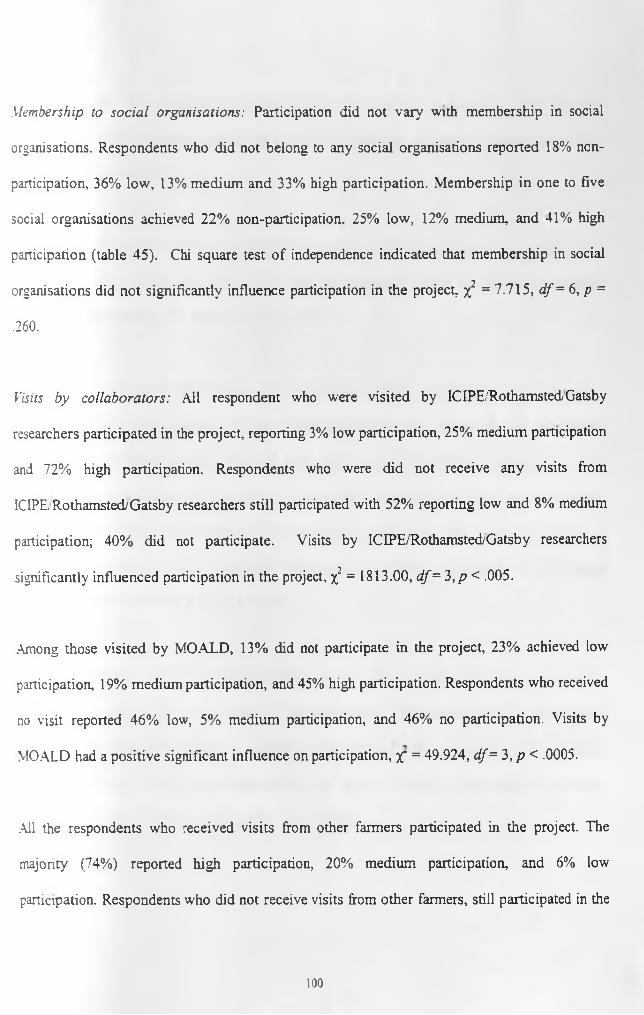
Membership to social organisations: Participation did not vary with membership in social organisations. Respondents who did not belong to any social organisations reported 18% nonparticipation, 36% low, 13% medium and 33% high participation. Membership in one to five social organisations achieved 22% non-participation. 25% low, 12% medium, and 41% high participation (table 45). Chi square test of independence indicated that membership in social organisations did not significantly influence participation in the project, x2 = 7.715, df= 6, p = .260.
Visits by collaborators: All respondent who were visited by ICIPE/RothamstedGatsby researchers participated in the project, reporting 3% low participation, 25% medium participation and 72% high participation. Respondents who were did not receive any visits from ICIPE Rothamsted/Gatsby researchers still participated with 52% reporting low and 8% medium participation; 40% did not participate. Visits by ICIPE/RothamstedyGatsby researchers significantly influenced participation in the project, x2 = 1813.00, df= 3 ,p < .005.
Among those visited by MOALD, 13% did not participate in the project, 23% achieved low participation, 19% medium participation, and 45% high participation. Respondents who received no visit reported 46% low, 5% medium participation, and 46% no participation. Visits by MOALD had a positive significant influence on participation, X = 49.924, df= 3 ,p < .0005.
All the respondents who received visits from other farmers participated in the project. The majonty (74%) reported high participation, 20% medium participation, and 6% low participation. Respondents who did not receive visits from other farmers, still participated in the
100

project w i th o n ly 4 % re p o rtin g h ig h p a r tic ip a t io n , 14% m e d iu m p a r tic ip a tio n , a n d 4 6 % low
p a rtic ip a tio n . V is its b y o th e r fa rm e rs h a d a p o s itiv e s ig n if ic a n t in flu e n c e o n p a r tic ip a t io n , % =
1431.00, d f = 3 , p < .0 0 5 .
.411 the re sp o n d e n ts w h o re c e iv e d a t le a s t o n e v is it f ro m K A R I p a r tic ip a te d in th e p ro je c t, 27 %
a c h ie v in g m e d iu m p a r tic ip a t io n a n d 7 3 % h ig h p a r tic ip a t io n . V is its b y K A R I s ig n if ic a n tly
in flu e n c e d p a r tic ip a t io n , x2 = 1 3 .9 4 , d f= 3 ,p < .005.
W hen b y a l l th e v is i ts b y c o lla b o ra to rs w e r e c o n s id e re d to g e th e r , p a r tic ip a t io n w a s h ig h am o n g
those w h o re c e iv e d h ig h n u m b e r o f v is its . R e sp o n d e n ts w h o w e re v is ite d b y o n e c o lla b o ra to r
re p o rte d 3 7 % n o n -p a r tic ip a t io n , 5 5 % lo w p a r tic ip a tio n , a n d 8 % m e d iu m p a r t ic ip a t io n ; n o n e
rep o rted h ig h p a r tic ip a t io n . A ll r e sp o n d e n ts w ho w e re v is i te d b y m o re th a n o n e c o lla b o ra to r
p a rtic ip a te d . A m o n g th o s e w ith v is its b y m o re th an o n e c o l la b o ra to r 9 4 % r e c o r d e d m e d iu m o r
high p a r t ic ip a t io n ( ta b le 46). V is its b y c o lla b o ra to rs w a s h ig h ly s ig n if ic a n t in in flu e n c in g
p a r tic ip a tio n , X = 2 0 3 0 .0 0 , df= 6,p< .0 0 0 5 .
P ro jec t awareness: N o n e o f th e fa rm e rs w h o w e re n o t a w a re o f th e te c h n o lo g y p a rtic ip a te d .
.Among r e s p o n d e n ts w h o w e re a w a re o f th e te c h n o lo g y , 9 0 % p a r tic ip a te d in th e p ro jec t.
P a rtic ip a tio n a m o n g w a s re p o r te d as fo llo w s : 30 % re p o r te d lo w p a r tic ip a tio n , 1 9 % m e d iu m
p a r tic ip a tio n a n d 4 1 % h ig h p a r tic ip a t io n ( ta b le 47). P ro je c t a w a re n e ss s ig n if ic a n tly in flu e n c e d
p a rtic ip a tio n in th e p ro je c t, f2 = 1 .036 , d f= 3 ,p < .0 005 .
101

H igh p a r tic ip a tio n w a s o b se rv e d am o n g re sp o n d e n ts w h o h a d b e e n a w a re o f th e p ro je c t for th e
longest tim e . T h e lo n g e r one h a d b e e n a w a re o f th e te c h n o lo g y the m o re l ik e ly o n e w as to
p a rtic ipa te in th e p ro je c t . A ll th e re sp o n d e n ts g a in in g a w a re n e s s in 19 9 7 p a r tic ip a te d in th e
project. S e v e n ty -s e v e n p e rc e n t o f th e se re sp o n d e n ts re p o r te d h ig h p a r tic ip a t io n w ith 13% a n d
10% re c o rd in g lo w a n d m e d iu m p a r tic ip a t io n , re sp e c tiv e ly . N o n e o f th e g ro u p th a t b eca m e
aw are in 1999 re p o r te d h ig h p a r tic ip a t io n , 2 4 % o f th is g ro u p d id n o t p a r tic ip a te , w h e re a s the re s t
had 3 5 % lo w p a r t ic ip a t io n a n d 41 % m e d iu m p a r tic ip a tio n . T h e y e a r o n e b e c a m e aw are w a s
s ig n if ican t in in f lu e n c in g p a r tic ip a tio n , x2 = 1-828, df=\2,p< .0 0 0 5 .
Knowledge on the technology: K n o w le d g e w a s im p o rta n t in p a r t ic ip a t io n in th e p ro je c t. A m o n g
re sp o n d e n ts w h o w e r e h ig h ly k n o w le d g e a b le , 5 % d id n o t p a r tic ip a te , 9 % a c h ie v e d lo w
p a rtic ip a tio n , 2 1 % m e d iu m a n d 65% h ig h p a r tic ip a tio n . N o n e o f the re s p o n d e n ts w ith lim ite d
k n o w led g e h ad a c h ie v e d h ig h p a r tic ip a t io n . A m o n g r e sp o n d e n ts re p o r tin g l im ite d k n o w le d g e
67% d id n o t p a r t ic ip a te , 2 7 % a tta in e d lim ite d p a r tic ip a t io n , an d o n ly 6 % h a d m ed iu m
p a rtic ip a tio n . R e s p o n d e n ts in th e a v e ra g e k n o w le d g e g ro u p a c h ie v e d 7 8 % p a r tic ip a tio n , w ith
22% n o t p a r t ic ip a t in g ( ta b le 48 ). K n o w le d g e o f te c h n o lo g y w a s s ig n if ic a n t in in flu e n c in g
p a r t ic ip a t io n ,x~ = 7 6 .7 9 9 , df= 6 ,p< .0 0 0 5 .
Attendance to project related training sessions: P a rt ic ip a tio n in th e p ro je c t v a r ie d w id e ly w ith
a tten d an ce at t r a in in g se ss io n s . .All re sp o n d e n ts w h o a t te n d e d a t le a s t o n e tr a in in g se ss io n
p a r tic ip a te d in th e p ro je c t. O f th o se w h o d id n o t a tte n d a n y tra in in g s e s s io n s , 6 3 % d id n o t
pa rtic ipa te , 3 6 % re p o r te d lo w p a r tic ip a tio n , and o n ly 1 % m a n a g e d m e d iu m p a rtic ip a tio n .
P artic ip a tion in c re a s e d s ig n if ic a n tly w i th a n in c rease in a tte n d a n c e a t tra in in g sessio ns. A il
102

respondents with the highest training attendance reported high participation. Respondents who attended one or two training sessions reported 53% low participation, 45% medium participation, and 2% high participation. Those who attended more than two training sessions recorded 1% low participation, 8% medium participation, and 91% high participation (table 49). Attendance at training significantly influenced participation in the project, x ~ 3012.00, d f= 9 ,p < .0005.
Technology options: Among the 40%, who did not adopt any technology option, 48% did not participate in the project, another 48% reported low participation, and only 4% achieved medium participation. All the respondents who had adopted one of the four options (60%) participated in the project. Desmodium intercrop adopters achieved medium (29%) and high participation (71%). Melinis intercrop adopters reported 9% low participation, 24% medium participation, and 67% high participation. Napier grass border and bean intercrop adopters achieved 12% and 20% low participation, 34% and 13% medium participation and 54% and 67% high participation, respectively (table 50). Technology option selected was significant in influencing participation in the project, x2 = 1611.00, df= 12,p< .0005.
Reason for adoptionWhen asked to list and rank the reason for adopting the technology, all the adopters cited the need to control stem borers first, 86% rated feed for their livestock second, 74% rated the free inputs provided by the project third, and 16% ranked soil erosion control third. Only 2% of the respondents rated free inputs second (table 51).
103

Technology diffusion and predictor variablesResults of the analyzed data indicated that the technology diffused to 11% adopters. Participation and diffusion varied within this group. Chi square and regression analysis of this group was undertaken under discussions on adoption because they formed part of adopters. Among them 30% achieved low diffusion, 65% medium and 4% high diffusion. The group reported low (74%) to medium (26%) participation.
Personal Characteristics and diffusion.Among the group that the technology had diffused to, there were 70% male and 30% female headed households. Male headed households achieved 19% low and 81% medium diffusion. Female households reported 57% low, 29% medium, and 14% high diffusion. All the respondents had at least a primary school level of education (39%). Majority (70%) of the diffusion group members were middle aged, with 19% young and 11% old respondents. Among the middle aged respondents, 75% reported medium diffusion; all the old respondents achieving medium diffusion. All the respondents were in monogamous marriages. There were 9% part-time fanners who achieved medium diffusion and 62% full-time farmers achieving medium diffusion.
Household Characteristics and diffusionDiffusion varied with villages. Kiminini recorded the highest number of diffusions 39% , Yuya recorded 35%, Wamuini 22%, and Kissawai 4%. Majority of these respondents (96%) were small scale farmers, who had purchased their own land. They all owned their land. Sixty-five percent of the households where technology had diffused had between 1 and 5 people who could provide labour. None of the households had children of less than 5 years of age. Over 80% of the
104

h o u se h o ld s had at least one animal. The majority of the households 69%, were classified as hav ing lo w wealth status and being in the low income category.
Communication Variables and diffusionA ll the respondents to whom the technology had diffused were aware of the technology. A w a re n e ss is the first stage of adoption and diffusion. The majority of them ( 7 4 % ) had become aware in 1998 and 1999. Technology options selected included Napier grass border plant (44%), Desmodium intercrop (13%), Melinis intercrop (4%), and Napier grass border with beans in te rc ro p (4 0 % ). There were 13% contact farmers among the diffusion group. They scored average ( 5 7 % ) to high (39%) on knowledge of the technology.
O ver 7 0 % of the diffusion group had received at least one visit from the project collaborators. N o ne h a d been visited by KARI, ICIPE had visited only 1, MOALD and other farmers had v is ited 13 and 8, respectively. Ail the respondents perceived the technology to be beneficial.
Regression Analysis of Predictor Variables on Response VariablesMulticollinearity (high correlation between predictor variables) and heteroscedasticity (unequal variances) assessment was done among the independent variables, and those that were found to be highly correlated were eliminated from the regression model. Multiple regression analyses were then run for predictor variables and adoption and participation in the project of the technology. Below are the findings of the regression.
105

Adoption was regressed on predictor variables of personal characteristics, household characteristics, and communication variables. Findings are presented herein.
Regression o f Personal Characteristics and AdoptionThe study hypothesized that personal characteristics will influence technology adoption; to test this hypothesis multiple regression analysis was conducted to test for the relationship between the predictor and response variables of adoption. Results of the analysis indicated that only education was significantly and positively correlated with adoption, r = .115, p < .05. None of the other predictor variables under personal characteristics had significant relationships with technology adoption (table 52).
Relationships were established among the predictor variables, although they were not significant between some of the variables. A positive significant relationship was indicated between gender and education; female household heads were more educated than male, r =. 197, p > .005. Gender had a negative significant relationship with marital status; there were more single household heads who were female, r = -.259, p < .005. Age had a negative significant relationship with education and a positive significant relationship with occupation. Younger household heads were more educated, r = -.401, p < .005; whereas older household heads were full-time farmers, r = - •268. p < .005 (table 52). These relationships were true when all the other variables are held constant.
Analysis of Predictor Variables and Adoption
106

Multiple regression analysis was run using the personal characteristics of respondents of gender, age. education level and occupation as regressors. Results indicated lack of a significant relationship between personal characteristics and adoption. The regression model explained 13% of the relationship and the overall relationship between personal characteristics and adoption was not significant, R‘ =.187, F{5, 214) = 1.556, p = .174) (table 53). MRA showed education to be the one predictor variable to positively significantly influence technology adoption, P =. 177, / = 2.273, p < .05. For every increase in years of education by one standard deviation there was an increase in adoption by a 0.177 standard deviation when all the other variables are held constant. The variables of gender, age, and occupation had a no significant influence on technology adoption (table 53).
Regression o f Household Characteristics on AdoptionHousehold characteristics are critical in technology adoption. Households possess resources that enable them to make use of new innovations. In determining factors influencing adoption, the study looked at household resources, such as the number of livestock kept (the technology promoted production of livestock feed and livestock numbers is a proxy for wealth status); both availability and demand for labour as indicated by the number of adults in the household and the number of children under 5 years old, reported annual income as an indication of household income, land at the household’s disposal (both land size and ownership), and other wealth status symbols owned by the household as indicators of their wealth status. This study had hypothesized that these variables would positively and significantly influence adoption of the technology under study except for number of under 5-year-old children whose demand for time
107

and attention would have a negative effect on labour availability and, hence, negatively impactadoption.
The results of the analysis showed a positive significant correlation exists between adoption and number of adults in the household, r = .117, p < .05. Households with more adults adopted the technology. There was a non-significant correlation indicated between adoption and livestock number, r - .050, p > .1; number of children under 5 years old, r = -0.041, p > .1; wealth status, r = .0 7 6 ,/? > .1; income, r = .082, p > .1; land size, r = .019, p > .1; and land ownership r = -0.079, p > 1) (table 54). The findings did not support the study’s hypothesis that socio-economic factors would significantly influence adoption.
Village had positive significant correlation with all the household characteristics. Among the predictor variables, positive significant correlations were found between number of livestock and wealth status, r = .390, p < .005, as households with high livestock numbers had higher wealth status; and livestock numbers and land size, r = .316, p < .005, as households with large livestock numbers tended to own bigger lands. Larger numbers of adults were present in households that bought their land, r = .195, p < .005 but had smaller land sizes, r = -.176, p < .005.
Households with under 5-vear-olds did not have a significant relationship with any of the household characteristic predictor variables. Wealthier households recorded significantly high annual incomes, r =.206, p < .005, and those households that earned high annual incomes ownedmore land, r = .107, p < .05.
108

The regression model explained only 46% of the relationship, and the overall relationship between household characteristics and adoption was not significant, R2 =.214, F (8, 214) =2.19, p - 260. The model predicted labour would have a positive significant influence on technology adoption, P =.165, t = 2.316, p = .033). For every one standard deviation increase in number of adults in the household there was an increase in adoption by 0.17 standard deviations, when all the other variables were held constant. The other variables of livestock number, number of under 5-vear-olds, wealth status, income, land size, and land ownership did not have a significant influence on technology adoption (table 55).
Regression o f Communication Variables and AdoptionCommunication variables were hypothesized to positively influence technology adoption. Through communication households become aware and acquire knowledge about the technology. Communication variables that were included in this study included project awareness, hosting a technology trial (whether one was a project or non-project farmer), knowledge of the technology being developed, contact with Ministry of Agriculture extension agents (whether a contact farmer or not), membership in social organizations, participation in technology development related activities, and perceived benefits from the technology. The study hypothesized that these variables would positively and significantly influence adoption of the technology under study.
The correlation analysis showed high positive and significant correlations between adoption and all the communication variables. There was increased adoption as farmers became aware of the project, r = .379, p < .005; hosted project trials, r = .825, p < .005; increased their knowledge of
109

the project, r = .6526, p < .005; increased their contact with extension agents, r - .334, p < .005; increased their membership in social organisations, r = .268, p < .005, increased their participation in technology development, r = .790, p < .005; and perceived an increase in benefits from the technology, r = .696, p < .005.
There was positive correlation among all the predictor variables. Being aware of the project influenced one’s decision to host project trial, r - .342, p < .005. Project awareness increased one's knowledge of the technology, r = .306, p < .005. Contact with extension agents increased one's chance of being aware of the project, r = .166, p < .005. Being aware of the project increased the chances of participating in technology development, r = .406, p < .005; and being aware of the project influenced fanners’ perception of benefits from the technology, r = .284,/? < .005. Membership in social organisations did not influence one’s ability to become aware of the project, r = .026, p > .05.
Hosting project trials increased the farmers’ knowledge about the technology, r =. 581, p> .050). Being a contact farmer increased the farmers’ chances of hosting the trials, r =.397, p > .005. Hosting trials increased farmers’ participation in technology development, r =.879, p > .005. Hosting trials influenced farmers’ perception of the benefit o f the technology, r =.640, p > .005.
Contact farmers scored highly on knowledge if the technology, r =.322, p > .005. Membership in social organisations increased knowledge of the technology, r =.259, p > .005. Participating in technology development increased knowledge of the technology, r =.558, p > .005. Increased
110

> .005.
Membership in social organisations increased the chances of being made a contact farmer, r =.107, p > .05. Being a contact farmer increased the chances of participating in technology development, r = .4 3 5 ,/? > .005 . Being a contact farmer increased farmers’ perception of benefits from the technology, r =.321, p > .0 0 5 . Membership in social organisations influenced the farmers’ perception of benefits from the technology, r = .3 3 4 , p > 0 .0 0 5 . Participation in technology development increased the farmers’ perception of benefits of the technology, r = .6 0 4 ,
p > .005. Membership in social organisations had no influence on participation in technology development and project awareness (table 56 ).
Findings from the study correctly predicted that communication variables influenced technology adoption. The regression model explained 76.2% of the relationship, and the overall relationship between household characteristics and adoption was highly significant, R2 =.770, F (7, 212) = 11.265, p < .005. When all the other variables are held constant, the model predicted hosting project trials, p = 410, / = 5.612,/? < .005; knowledge of technology, P =155, t = 3.460, p < .005; membership in social organizations, P =.098, t = 2.726, p < .05, participation in technology development activities, P = .237, t = 3.203, p < .005, and perceived benefits from the technology being developed, p =.163, t =3.356, p < .005, project awareness, p =.156, t = -2.457, p < .05, positively and significantly influenced technology adoption. Contact with MOALD extension agents had a negative significant influence on decisions to adopt the technology, P = -.154, t =
knowledge o f the technology increased the perception of benefits from the technology, r =.618, p

2.457, p < .05. There was a significant increase in adoption for every unit increase in the above variables (table 57).
Analysis of Predictor Variables and ParticipationMultiple Regression analysis was run for participation and the response variable and predictor variables of personal characteristics, household characteristics, and communication variables. Below are the findings of the analysis. Correlations between response variable and predictor variables and among predictor variables are presented to demonstrate their relationships. A higher level regression analysis is then presented to show determinants of participation in technology development.
Regression o f Personal Characteristics on ParticipationPersonal characteristics were hypothesized to positively and significantly influence technology adoption. To test this hypothesis multiple regression analysis was performed to determine the relationship between the predictor variables and the response variable of participation. Results indicate that the influence by the predictor variables on participation was not significant. The variables under study did not have a strong influence on determining whether or not a farmer should participate in technology development (table 58).
The only predictor variable that had a positive significant relation with participation was education, r = 122, p > .05. There was a positive significant relationship between gender and education, r =.214, p > .005, and a negative significant relationship between gender and farmer’s occupation, r = -.112, p > .05, and gender and marital status, r = -.260, p > .005. A negative
112

s ig n if ic a n t relationship was demonstrated between age and education, r = -.401, p > .005, and b e tw e e n a g e and respondents' occupation, r = .268, p > .005. A negative significant relationship w as a lso established between education and respondents’ occupation, r =.214, p > .005. None of the o th e r variables had significant relationships. These relationships were true when all the other v a r ia b le s were held constant.
M u ltip le regressions of participation and personal characteristics produced a weak model that e x p la in e d 17% of the relationship with a non-significant overall relationship being observed b e tw e e n personal characteristics and participation, R2 = -.081, F (5, 214) = .281,/? > .1).
T he m o d e l predicted education to positively significantly influence participation in technology d e v e lo p m e n t, |3 =.540, t = .691, p = .045). For every increase in the number of schooling years there was a 0.54 increase in participation scores when all the other variables were held constant. N one o f the other variables had significant relationships with participation in technology d e v e lo p m e n t (table 59).
Regression o f Household Characteristics on ParticipationH o u se h o ld characteristics like number of livestock kept (the technology promoted production of liv e s to c k feed and livestock numbers is a proxy for wealth status); both availability and demand for la b o u r as indicated by number of adults in the household and number of under 5-year-olds; rep o rted annual income as an indication of household income; land at the household’s disposal both la n d size and ownership; other wealth status symbols owned by the household as indicators by th e ir wealth status were regression on participation to determine their influence of farmers’ p a rtic ip a tio n technology development.
113

This study had hypothesized that these variables would positively and significantly influence participation in technology development. However findings of the study indicate that only labour, as indicated by the number of adult household members that has a positive significant influence on participation. Households with high numbers of adults participated in technology development, r = .143, p > .05. The rest of the household characteristic variables don’t have significant correlation with participation (table 60).
Correlation predictor variables were as per the discussion on adoption above. Positive significant correlations were found between the number of livestock and wealth status, r = .390, p < .005; livestock numbers and land size, r = .316, p < .005; and the numbers of adults and land size, r = .195, p < .005, and ownership, r = -.176, p < .005.
The regression model for participation and household characteristics explained 18% of the relationship, and the overall relationship between household characteristics and adoption was not significant, R2 =.251, F (10, 209) = 1.404, p = .18. The model predicted labour, |3 =.305, t = 2.258, p < .05, and village, (3 =.909, t = -2.223, p < .05, to positively and significantly influence participation in technology development. For every unit increase in number of adults in the household there was a 0.305 increase in participation scores when all the other variables were held constant. The other variables of livestock number, number of under 5-year-olds, wealth status, income, land size, and source of land had a non-significant influence on technology adoption (table 61).
114

Communication Variables and ParticipationC o m m u n ic a tio n was the main activity that took place with participating in technology d ev e lo p m en t. Therefore, the study hypothesized that communication variables would positively and s ig n if ic a n tly influence participation in technology development. Communication variables in c lu d ed in the study were project awareness, hosting a technology trial (whether one was a p ro jec t or non-project farmer), knowledge of the technology being developed, contact with M in is try of Agriculture extension agents (whether one was a contact farmer or not), membership in so c ia l organizations, participation in technology development-related activities, and perceived b en efits f ro m the technology.
T here w e r e high positive significant correlations between participation technology development and all the communication variables. There was a positive correlation between participation and a w a re n e ss , r = .406, p < .005; hosting project trials (project farmers), r = .879, p < .005; k n o w le d g e of the project, r = .558, p < .005; contact with extension agents (contact farmers), r = .435, p < .005; and perceived benefits from the technology, r = .604, p < .005. Membership in social organisations was the only communication variable that did not have a significant c o rre la tio n with participation (table 62).
P ositive a n d significant correlations were observed among all the predictor variables except m em b ersh ip to social organisations. Membership in social organisations had a non-significant c o rre la tio n w ith project awareness and positive significant correlations with the rest of the p red ic to r variables. Project awareness was positively and significantly correlated with hosting pro ject tr ia ls (project farmer), r = .342, p < .005; project awareness, r = .306, p < .005; contact
115

w ith M O A L D extension agents (contact farmer), r = .166,/? < .005; and perceived benefits from the tech n o lo g y , r = .284, p < .005. Hosting project trials (project farmer) had positive significant c o rre la tio n s w ith knowledge of the technology, r = .581, p > .050); contact farmers, r =.397, p > .005; and perceived benefits from the technology, r = .640, p > .005.
T here was positive significant correlation between contact with extension agents (contact farmer) and knowledge of the technology, r =.322, p > .005. Membership in social organisations had a p o sitive significant correlation with knowledge of the technology, r = .259, p > .005. Perceived ben efits of the technology had a positive significant correlation with knowledge of thete ch n o lo g y , r = .618, p > .005.
M e m b ersh ip in social organisations increased the chances of being made a contact farmer, r =.107, p > .0 5 . Being a contact farmer increased the chances of participating in technology d e v e lo p m e n t, r = .435, p > .005. Being a contact farmer increased a farmer’s perception of ben efits from the technology, r = .321, p > .005. Membership in social organisations influenced a fa rm er’s perception of benefits from the technology, r = .334, p > .005. Participation in te c h n o lo g y development increased a farmer’s perception of benefits of the technology, r = .604, p > .0 05 . Membership in social organisations had no influence on participation in technology d e v e lo p m e n t and project awareness (table 62).
F ind ings from the study correctly indicated that communication variables influenced p a rtic ip a tio n in technology development. MRA produced a strong regression model that exp la in ed 7 9 .5 % of the relationship. The overall relationship between communication variables
116
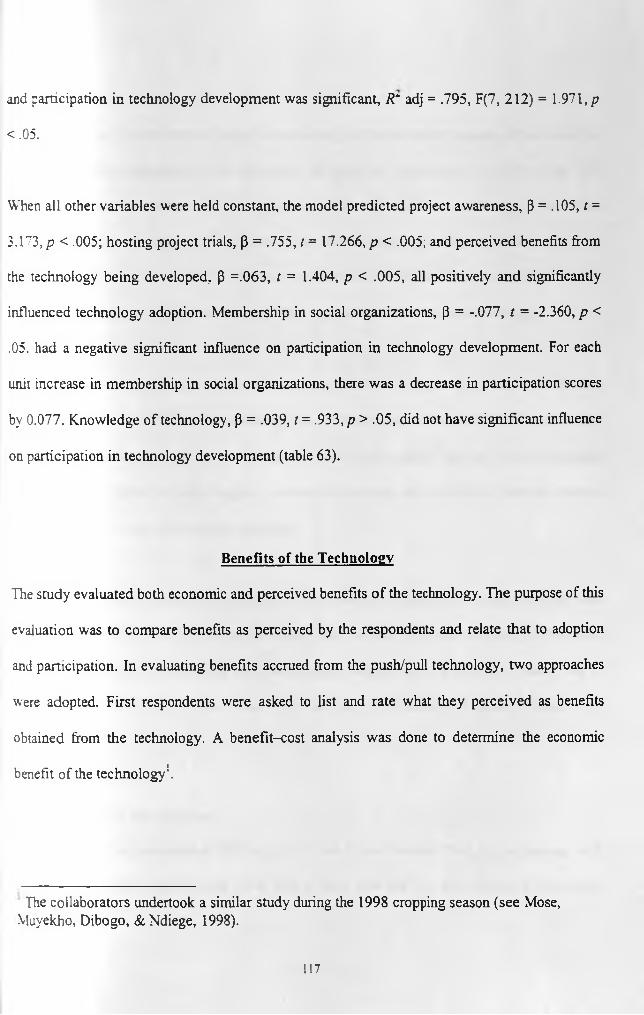
and participation in technology development was significant, R“ adj = .795, F(7, 212) = 1.971, p<.05.
When all other variables were held constant, the model predicted project awareness, |3 = .105, t = 3.173, p < .005; hosting project trials, (3 = .755, t = 17.266, p < .005; and perceived benefits from the technology being developed, (3 =.063, t = 1.404, p < .005, all positively and significandy influenced technology adoption. Membership in social organizations, P = -.077, t = -2.360, p < .05. had a negative significant influence on participation in technology development. For each unit increase in membership in social organizations, there was a decrease in participation scores by 0.077. Knowledge of technology, P = .039, t = .933, p > .05, did not have significant influence on participation in technology development (table 63).
Benefits of the TechnologyThe study evaluated both economic and perceived benefits of the technology. The purpose of this evaluation was to compare benefits as perceived by the respondents and relate that to adoption and participation. In evaluating benefits accrued from the push/pull technology, two approaches were adopted. First respondents were asked to list and rate what they perceived as benefits obtained from the technology. A benefit-cost analysis was done to determine the economic benefit of the technology '1.
The collaborators undertook a similar study during the 1998 cropping season (see Mose, Muyekho, Dibogo, &Ndiege, 1998).
117

Perceived BenefitsThe s tu d y looked at extra costs of using the technology as perceived by farmers. When asked to indicate what they considered as the extra costs of using the technology, only 10% of the 220 re sp o n d e n ts noted that there were increased costs associated with the technology. Costs cited in c lu ded weeding and applying fertilizers to the fodder crops, and one respondent talked of security fo r Napier grass as she felt the good variety would be attractive to thieves. It is beyond the sc o p e o f this study to look the details of extra costs associated with the technology.
Som e respondents who had not adopted the technology but were aware of it commented on what they perceived as the benefit of the technology as per what they had seen from their neighbours. A m ong the benefits perceived by the farmer were stem borer control, feed for livestock, control o f soil erosion, control of maize logging, a source of income, and a profitable farming method w h ereb y the lack of chemical use saves money.
A m ong the 220 respondents, 90% responded to the question on the rated benefits. Among these 73% rated stem borer control first as the benefit they accrued from the technology, 18% rated liv e s to ck fe e d as first, and less than 10% rated erosion control, fanning profitably, and selling of N ap ier a s their first priority. Most of the 73% who rated stem borers first ranked livestock feedsecond.
Perceived Benefits and AdoptionThe m a jo r ity o f the respondents 55 % reported at least three benefits from the technology, with 29% in d ic a tin g one or two benefits. Over 90% of those who felt they were getting three benefits
118

from the technology achieved high to medium adoption. Even respondents who had not adopted the technology still listed benefits of the technology. Among those who listed 1-2 benefits, 83% did not adopt the technology. The more benefits one perceived from the technology the more likely one was to adopt (table 64). Perceived benefits significantly influenced technologyadoption, X ~ 95.525, df= 6 ,p < .0005.
Parucipaiion in Technology Development and Perceived Benefits o f the Technology P e rc e iv e d benefits had a significant influence on participation in technology development, f = 95 .525. d f = 2 , p < .0005. All respondents who had indicated at least one benefit participated in te c h n o lo g y development. All those did not list any benefit did not participate. All respondents w ho r e p o r te d one benefit achieved only low participation. O f respondents who identified 2 or 3 ben efits 6 2 % and 57% respectively, reported high participation, 31% and 25% , respectively, rep o rted medium, and 7% and 18%, respectively, reported low participation (table 65).
Benefit-Cost Analysis of the TechnologyA benefit-cost analysis was done for the technology to determine the economic benefits accrued from using the technology. Findings indicate that the technology was economically viable. Analysis undertaken for this study was a simulation of a similar analysis undertaken in 1998 from the 10 trial farmers (Mose, Muyekho, Dibogo, & Ndiege, 1998). Information used in this analysis was collected from the same 10 trial farmers during the 1999 cropping season to compare with the 1998 results.
119

A m ong th e 10 farmers, 6 undertook technology option A , which was maize with Napier grass border p la n tin g ; 2 others undertook technology option B, which was maize with Napier grass border p la n t in g and Desmodium intercrop, and technology option C, which was maize with N apier g ra s s border planting and Melinis intercrop, respectively. For the purpose of analysis, te c h n o lo g y option E and F represent no stalk borer control and chemical control, respectively. Som e of th e farmers had intercropped beans in the maize crop, which is a normal practice among the fa rm e rs in the study area (ICIPE, 1 9 9 7 ). For each trial plot there was a control plot, which en ta iled th e fanner’s practice and was similar to technology option E.
G iven th a t data were collected in the second year of establishing the Napier grass, cost of e s ta b lish in g the Napier grass was not considered among the costs. Marom and Volk (1994) have no ted th a t only relevant costs are considered in doing gross margins. For the purpose of an a ly s in g th e costs and returns of utilising the push/pull technology, the prevailing market prices at the t im e of data collection were used. These included prices of the inputs and outputs at the tim e o f planting and harvesting.
T he in p u ts were divided into market and non-market (Mose at al., 1998). Non-market inputs, such as family labour, were considered at the going wage rate, which was Ksh. 60.00 per man- day at approximately 6 to 8 hours of work per day; the price of Napier grass was placed at Ksh. 10 p e r wheelbarrow, which was determined from what the farmers quoted. Those who sold their N ap ier g ra s s were exchanging it for milk at the rate of 2 cups of milk per wheelbarrow of Napier grass; the price of milk was Ksh. 5.00/cup.
120 U N W W S '" ^ft'ROB l

A lth o u g h fanners did not sell their Desmodium, molasses grass seed, and forage, their prices were determined using the going market rates for the products or their equivalents. The prices were determined using comparable products of dairy meal and Boma Rhodes grass. The cost of p ro d u c tio n did not include the cost of establishing Napier, which has a life span of 5 years, or Desmodium and Melims, each with a life span of 2 years (Mose et al., 1998). The price of maize at harvesting was Ksh. 1080.00 per 90-kg bag. All the fodder crops were established during the 1998 cropping season. During the planting season transport for fertiliser and seed maize was Ksh. 50.00 per 50-kg bag and Ksh. 10.00 per 10-kg bag.
All the analyses were based on the treatments done by the trial farmers. Analysis for the maize and Napier grass border planting technology varied as some of the farmers did not apply DAP fertilisers when planting; others ploughed only once whereas yet others applied DAP and ploughed twice .which brought about variations in the costs and benefits.
Results of the benefit-cost ratio indicate that all the technology options were worthwhile. They all produced a benefit-cost ratio of more than 1.5, which is considered the required minimum (Mose et al., 1998). The maize Napier grass border planting had variations, all three treatments had a benefit-cost ratio which was higher than the 1998 benefit-cost ratio for the control of 1.82 (Mose et al.). This is attributed to the fact that the cost of establishing Napier grass was not included in the analysis although the benefit accrued from the sale of Napier was included.
Although the treatment in which the farmers ploughed twice produced the highest gross benefit of 24.680, the no DAP treatment had the highest benefit-cost ratio at 2.59. Compared to the 1998
121

benefit-cost ratio for the maize, Napier border planting technology was higher at 2.38, 2.57, and 2.61 (table 66). All three introduced technology options produced benefit-cost ratios that were superior to the no stalk borer control and the chemical control.
When an assumption is made whereby the cost of production increases by 20%, technology options A, B, and C remain worthwhile, whereas technology options E and F would give very low returns at the rates of 1.46 and 1.57 (table 67). If the assumption changes such that price of Napier were to drop by 20%, this would affect the returns, especially for technology options A, B and C (table 68). However, these technology options would remain superior to options E and F.
An increase in the price of Napier by 20% would lead to an increase in returns from technology options A, B and C; they would still be superior to options E and F (table 69). In the case of a drop in price of maize by 20% the returns for all the technology options would be affected. Technology options E and F would not be worthwhile; however options A, B, and C would be worthwhile with a reduced return (table 70).
If the price of maize increases by 20%, then all the technology options would become worthwhile, however technology options A, B and C would still remain superior to options E andF (table 71).
122
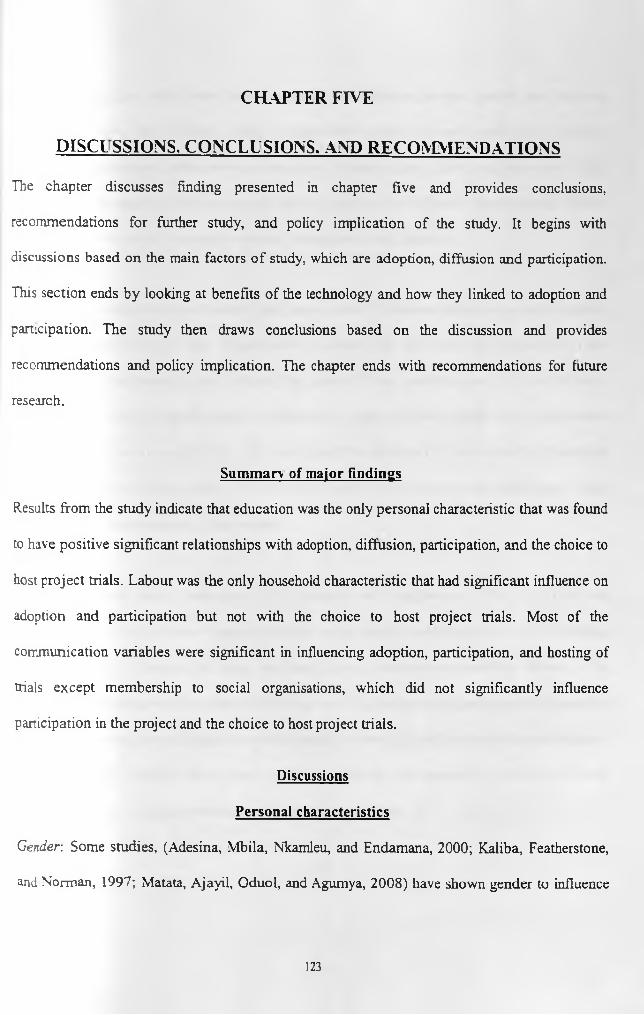
CHAPTER FIVE
DISCI SSIONS. CONCLUSIONS. AND RECOMMENDATIONSThe chapter discusses finding presented in chapter five and provides conclusions, recommendations for further study, and policy implication of the study. It begins with discussions based on the main factors of study, which are adoption, diffusion and participation. This section ends by looking at benefits of the technology and how they linked to adoption and participation. The study then draws conclusions based on the discussion and provides recommendations and policy implication. The chapter ends with recommendations for future research.
Summary of major findingsResults from the study indicate that education was the only personal characteristic that was found to have positive significant relationships with adoption, diffusion, participation, and the choice to host project trials. Labour was the only household characteristic that had significant influence on adoption and participation but not with the choice to host project trials. Most of the communication variables were significant in influencing adoption, participation, and hosting of trials except membership to social organisations, which did not significantly influence participation in the project and the choice to host project trials.
DiscussionsPersonal characteristics
Gender. Some studies, (Adesina, Mbila, Nkamleu, and Endamana, 2000; Kaliba, Featherstone, and Norman, 1997; Matata, Ajayil, Oduol, and Agumya, 2008) have shown gender to influence
123

technology adoption while others have not shown any linkage between gender and adoption (Doss and Morris, 2001; Chitere, 1998). In this study gender did not significantly influence technology adoption and participation in the project. Matata, Ajayil, Oduol, and Agumya, (2008) found gender to negatively influence participation in projects with female farmers being left out because o f the design of extension programs that targeted male fanners.
Although this study had hypothesized that gender would influence participation and adoption, findings showed contrary to that. These results concurred with what Doss and Morris (2001) and Chitere (1998) had found in their studies, that gender of the household head did not influence adoption. The project required gender representation among project farmers, and collaborators ensured that this was complied with. This result could be attributed to the fact that all household heads, irrespective of their gender, were exposed to the same aspects of the technology. There was no gender discrimination in the project.
Age of household head: Lionberger (1968), Anosike and Coughenour (1990), and Ezeh and Unamma (1989) linked farmer’s age to adoption, with Anosike and Coughenour (1990) arguing that age influences farming decisions, and most farming decisions are made by farmers in the middle age. The study had hypothesized that age would influence participation and adoption, but findings evidenced lack of a significant relationship between age and participation and adoption. Participation and adoption did not vary considerably across age categories. In his study Chitere (1998) found no linkage between age and technology adoption.
124

Education: Education had positive significant influence on participation in the project and technology- adoption. Findings indicated that participation and adoption increased with respondents’ education attainment. The study found that respondents who participated and adopted the technology tended to have at least a lower primary education. Findings of this study concurred with Dasgupta (1989), Ngoc Chi (2008), and Abd-Ella et al. (1981) who found education to be positively related to adoption. Although literacy was not one of the criteria set by the project for participating in the project (Kiros et al., 1997), the study evidenced that it is a determinant in participation and adoption.
In this study more of those who had at least lower primary school education participated in the project and adopted compared to those who had no education and those with higher education. These results concur with the requirement for functional literacy; at lower primary level of education one acquires only basic reading and writing skills. These findings were in agreement with what Chitere (1998) and Ezeh and Unamma (1989) found. Their studies showed that functional literacy is more important than formal education; fanners were able to adopt technologies if they acquired positive dispositions necessary for adoption. This could have been the case with this study given that educational activities were conducted in local languages and some of the respondents with limited formal education participated and adopted. However, in cases where the technologies are technical and require higher levels of analysis then years of formal education would be relevant. The technology being developed was based on cultural practice and was simple hence was easy for the farmers to understand. According to literature, in cases where a technology requires some skills gained through education and training, education level would be expected to be positively related to adoption (Abd-Ella et al., 1981). The project
125

had a series of training activities through which farmers learned how to manage the technology. The positive relationship between participation and years of formal education could have been an indication of the respondents’ ability to understand the technology.
Marital status: In this study, participation and technology adoption did not vary significantly with marital status. There are limited studies (Ani, Ogunnika and Ifah, 2004; Matata, Ajayil, Oduol, and Agumya, 2008) that have found a link between marital status and technology adoption. Findings of this study indicated irrespective of their marital status household heads had powers to make decisions to participate and adopt the technology.
Occupation: Although fanning was practiced by all the respondents on full time and part time basis, the study did not show any significant link between occupation and technology adoption. The technology being developed targeted farmers hence all respondents had equal chance to participate and adopt the technology.
Household characteristicsLand size: The technology was promoted for small- and medium-scale farmers (ICIPE, 1996). The majority of respondents were small-scale farmers, which could explain the findings. Land size could be an indicator of wealth status (Paudel, Shrestha, and Matsuoka, 2009), in such cases if a technology is to increase fanners’ wealth a link has been demonstrated between land size and adoption (Doss, Mwangi, Verkuijl, and Groote, 2003). This study did not show any evidence of land size influencing participation and technology adoption.
126

Labour: Labour was the other variable that had a positive significant influence on participation and adoption. Findings of this study agree with what Abd-Ella et al. (1981) found: that labour has a positive relationship with adoption. The technology under review was viewed as labour intensive. Hence, labour availability was critical for this technology. Farmers in Trans Nzoia district use machinery for most farm operations. Farmers perceived the design of this technology to be limiting in terms of machinery use, as reported by one of the participants in the field day who stated 'kazi yetu ya kulima tumezoea kufanya na tractor sasa hatujui tutaweka watu ngapi kwa hi shamba kwa vile kuna napier ndani ya mahindi' [‘most of our farming is done by tractors,I wonder how many people we will need to engage to dig this land because of the Napier grass being planted in the maize’] (Kissawai farmer, 1998). In evaluating the technology, farmers raised the same issue of the challenges of using tractor in the field with Napier grass (Chemweno et al., 1999). Households with available labour, therefore, would be able to take advantage of the technology. According to study results, the technology was attractive to households with a higher number of people who could provide labour for this technology.
Income: Results of the study did not show a significant correlation between income and participation and technology adoption. Technology that require funds to purchase part or the whole technology would be influenced by household incomes (Doss et al, 2003: Paudel, Shrestha, and Matsuoka, 2009). The technology under review was an IPM based one with the focus being in the design, this could have contributed to the lack of linkage between income and participation and technology adoption.
127

livestock numbers: It was hypothesized that livestock number would positively influence adoption. The assumption was that the technology would be attractive to people keeping livestock. Contrary to expectations there was no significant relationship between the number of livestock kept and participation and technology adoption. Respondents who did not keep livestock and those with small livestock numbers still adopted as much as those with larger livestock numbers. Farmers who did not own any livestock reported selling their fodder to their neighbours, thus making cash. A farmer reported that T sell my Napier grass to my neighbour in exchange for milk or cash’. This could explain the attractiveness of the technology to farmers who did not keep livestock. Farmers who owned a lot of livestock had high wealth statuses and owned larger farm sizes. This is true because they would need funds to purchase and manage the livestock and more land to provide feed for their livestock. Some studies have linked livestock numbers to technology adoption, however in such cases, the variable could have been used as an indicator of wealth or the technology specifically targeted livestock production (Doss, et al, 2003; Kaliba, et al, 1997).
Total number o f children under the age o f 5 years (pre-schoolers) and adoption: The study had hypothesized that there would be a negative relationship between the number of preschoolers and participation and adoption. The higher the number of preschoolers, the more time and energy would be spent taking care of them. This would take away much needed time and energy that could have been spent on the technology. The study, however, found that there was no significant relationship between the number of preschoolers and participation and adoption.
Perceived benefits from the technology were stem borer control, livestock feed, and soil erosion control. Some felt there were increased costs associated with the technology, which they reported
128

as costs associated with managing the fodder crops. Economic analysis of the technology indicated that it was a viable undertaking.
Communication VariablesThere were significant relationships between all communication variables and participation in technology development and adoption except membership to social organisation, which did not influence participation in the project and decisions to host project trials.
Comae: with extension agents: Contact with extension workers played a significant role in participation, with respondents who had indicated being contact farmers participating in the project and adopting compared to non-contact farmers. MOALD extension workers visit contact farmers at least once a month, which increases the chances of the farmers becoming aware of any new technology being introduced. Contact farmers happen to be the ‘most progressive’ in their communities. Howell (1982) contended that extension workers are known to select traditional village elders or better off farmers as contact farmers. It was not the intent of this project to target the most progressive farmers, thus all the farmers were given ‘equal’ chances to participate in the project. However, contact farmers could have had an advantage of being informed about the project by the extension workers.
Project awareness: According to the farm adoption and diffusion model, awareness is the first stage of the adoption process (Rogers and Shoemaker, 1971:100). Participation and adoption were higher among respondents who had been aware of the technology for longer periods, as shown by the year respondents became aware of the technology in the findings. Project
129

awareness was increased the chances of respondents’ understanding the benefits derived from the technology hence participated and adopt. Findings of this study concurred with Matata, et al (2008) who found awareness to increase chances of technology adoption.
Visit by collaborators: As expected, visits by collaborators had an influence on participation in the project and adoption of the technology. Visits by the collaborators created awareness and provided the respondents with information about the technology, which facilitated their participation and adoption of the technology. Working with collaborators from various fields was according to the farming system research and extension model, which advocates the use of an interdisciplinary systems perspective. The model promotes collaboration and a focus on the household (Fieldstein & Poats, 1989). Farmers, as one kind of collaborator, facilitated adoption through visits to other farmers to help them leam about the technology. KARI's main contribution was through on-station trials, whereas ICIPE participated in both the on-station and on-farm trials. The MOALD and ICIPE led on-farm trials. At the different stages the collaborators provided information, which contributed in influencing the farmers to participate and adopt the technology.
Attendance to project related trainings and knowledge: According to Feder and Slade (1984) and Rogers (1971), awareness is not sufficient for adoption; farmers need information and knowledge about the technology. The technology development team was aware of this factor and conducted a series of trainings on the technology. The influence of knowledge on participation and adoption was as expected. Knowledge about the technology was a factor of awareness and an indication of a respondent’s ability to discern the benefits accrued and the extra costs incurred
130

in using the technology. It enabled adopters to manage the technology. Knowledge about the benefits of the technology acted as a motivation for the respondent to participate in the project and adopt. As earlier discussed, motivation is necessary for action. According to the action theory the respondent, as an actor, was able to choose to participate in the project based on the knowledge of what it would entail to undertake the technology. The knowledge of the ability of the technology to control the stem borer was the motivational significance (Fliegel, 1993) that drove the respondents to adopt. Through these educational activities respondents were able to acquire knowledge about the technology.
With the exception of the educational tours and training workshops, all the other educational activities were open to all farmers irrespective of whether they were project or non-project fanners. This gave all the farmers an equal chance of participating in the educational activities. The significant relationship between educational activities and participation and adoption established by the study was as expected. This confirms the relationship between knowledge and participation. Rogers (1983:164), in his model of innovation-decision process, emphasized the importance of awareness and knowledge of technology: ‘an individual . . . is exposed to the innovation’s existence and gains understanding of how it functions’, and thereby adopts. Through educational activities respondents acquired knowledge about the technology. Although in his study Ngoc Chi (2008) found knowledge to influence adoption, it was the knowledge by the extension agents that was important in adopting the new rice varieties.
Membership to social organisation: Membership in social organisations had an influence on adoption of the technology; it did not influence participation in the project and the decision to
131

host project trials. Social organisations could have acted as units of learning. Membership in social organisations serves as channels through which members exchange ideas and knowledge. This concurs with Ezeh and Unamma (1989) who found membership in social organisation to impact technology adoption. Farmers became aware of the project from their colleagues in the organisations. Like contact with extension, social participation is a proxy for knowledge on the technology, which accounts for awareness.
Benefits o f the Technology: Benefits accrued from the technology significantly influenced participation and adoption. Knowledge of the technology played a key role in farmers’ decision to get involved in the technology. Rogers (1983:166) has argued for ‘selective exposure’, noting that individuals choose to be exposed only to those messages they feel meet their needs. In this study, respondents who perceived benefits from the technology could have chosen to become aware of the existence of the technology. Thus, perception of benefits played a role in both participation and adoption. A dichotomy could exist where perceived benefit could be a hindrance to both participation and adoption especially the period of waiting to before benefits are realised is seen to be long (Matata, et al, 2008).
Rogers (1983:165) stated that ‘the need for certain innovations, such as pesticides to treat a new bug that is destroying . . . probably comes first;. . . new ideas may create the need’. In this study, the need to control stem borer existed, the knowledge about the technology’s ability to control the pests inspired the respondents to participate and adopt. This is supported by the action theory, which argues that actors are motivated by the need to optimise satisfaction (Parsons and Shils, 1967). However, using the actor oriented approach (Bosman, 2004: Long, 2001), farmers could
132

have been able to rationalise by comparing the extra costs associated with the technology and benefits accrued to decide whether to adopt or not to adopt the technology.
ConclusionResults of the study demonstrated that socio-economic variables that influenced participation in technology development also influenced technology adoption. Data evidenced technology diffusion among respondents who were not participating in technology development. Given that the technology is still being developed; this was a sign of relevance of the technology to thestudy sample.
In explaining the influence of education, labour, and communication variables on participation in technology development and adoption of the push/pull technology, Parson’s (Parson & Shils, 1967) action theory was used. Participation was identified as the situation in which the farmers were operating. From the study, labour availability and education were the characteristics associated with the situations that were identified as affecting adoption. Technology adoption is considered as an action taking place through participation, with control of stem borers being the motivational significance and an increase in productivity being the gratification to the farmer, Diverting from Parson’s theory that considered actors to be passive, the farming system and research model and the actor oriented approach were adopted in this study they considered actors (farmers) as active participants in the technology development and dissemination process.
According to the action theory, social objects (actors) interact, and the results of their interactions vary. Like in Parsons’ social system (Parson & Shils, 1967) collaborators interacted
133
as evidenced by communication variables however the decision to participate lay with the actor’s agency hence the capability to cause change (Giddens, 1984). The actors (resource-limited farmers) were motivated by the need to optimise gratification (Ritzer, 1992). In this study, resource-limited farmers, who comprised the majority of the respondents, were motivated by the need to optimise gratification by increasing production through controlling stem borers and produce livestock feed, to participate in the project, and to adopt the technology. Benefits accrued from the introduced technology were the motivation sought by the participating and adopting farmer. The aim of the participatory approach was to consider the environments in which the actors (farmers) operated by involving them in technology development. The approach took a multidisciplinary approach, as advocated by the farming system and research approach, by involving various collaborators. Results of the study evidence an interaction among the collaborators.
Fanners would be willing to interact only if they are aware of the gratification from the technology, which was obtained through educational activities. This confirms the significance of technology awareness and knowledge of the technology in participation and adoption. Further, contact with extension and visits by collaborators served as the stage at which the farmers came into contact with the technology (awareness), hence its influence on participation in the project and adoption of the technology.
Policy ImplicationFindings of this study pointed to importance of education, communication and active participation of beneficiaries in technology development, factors that if taken into consideration
134

would substantially improve technology adoption leading to increase in agricultural productivity and hence food security .Literacy was significant in the levels of participation and adoption. To enhance beneficiaries’ ability to understand and take advantage of introduced technologies, it is imperative that literacy projects form an integral part of Development programmes. Literacy programmes would provide an opportunity for beneficiaries to acquire functional literacy skills.
The research and extension systems in the country emphasise technologies being developed and technology dissemination in terms of farm visits. This research evidences that the methodologies used to develop the technology impact adoption. The use of educational sessions among farmers should be emphasized to ensure farmers acquire knowledge of the technology to facilitate their decision to adopt.
Setting conditions that potentially exclude some farmers, without proper research to determine the impact the conditions have on technology adoption, should be discouraged. They could lead to researchers missing out on contributions that could make a difference to technologies being developed. From the study, it was apparent that the set criteria had no influence on participation in technology development and adoption. The interactions among collaborators were important in the process of developing the technology, which eventually impacted on adoption of the technology. Researchers and development practitioners advocating for participatory approaches should provide equal chances to all farmers to get involved in projects.
135

Educational sessions should not be confined to farm visits but should include sessions in whichfarmers exchange ideas with their colleagues. This calls for an increase in farmers’ access to training sessions to enhance their knowledge of technology and should be done during the technology development and dissemination process.
Interactions would not only encourage exchange of ideas and feedback from the end users but would also ensure development of technologies that meet the needs of the users and are relevant to their situations, thus enhancing the adoption of the technology. Communication is important in working with rural communities; keeping communication channels open ensures a two-way exchange of ideas from farmers to researchers and extension agents and back.
Technologies have to be appropriate for farmers’ conditions and needs to increase their adoptability. Farmers need to fully understand what the technology entails and the costs and eventual benefits of using the technology; the use of a collaborative approach offers an opportunity to achieve this. The collaborative approach, like that adopted by this project, has the potential for developing appropriate technologies that are user-specific, hence enhancing their potential for increased adoption. This approach has the potential for cutting costs and time spent on developing technology, hence improving efficiency and returns to research.
Recommendations for Future Research1. Most adoption studies have focused on technology with models developed to study this
aspect of adoption (Besley & Case, 1993), there is a need to develop models that target technology development approaches and their relation to the adoption of technologies.
136

2. This study was cross-sectional in nature, and information provided applied to the time of the study. Further studies need to undertaken when complete diffusion of the technology will have been assumed to have taken place to be able to determine time-dependent elements of the approach. The study would determine the effects of the free inputs provided on influencing participation in the project and adoption. A diffusion study of the technology is important to achieve this.
3. The study evidenced interactions among the collaborators. Using the capitals framework approach, a study should be undertaken to determine the contribution of the different capitals in the technology development process and how this would enhance adoption anddiffusion.
4. Using a social capitals approach researches should look at how the project has assisted participants build their social networks that they can refer to when collaborators exit the area. This is critical for sustainability of the technology developed.
137

REFERENCESE lla , M. M ., Hoiberg, E. 0. & Warren, R. D. (1981). Adoption behaviour in family system: An
Io w a stu d y . Journal o f Rural Sociology, 46( 1), 42-61.■ d, J. D . (1 9 - 1). East African crops: An introduction to the production of field and plantation crops
in Kenya, Tanzania and Uganda. London: Longman for the Food and Agriculture Organization ina . A. A., Mbila, D., Nkamleu, G. B., Endamana, D.. 2000. Econometric analysis of the
determinants adoption of alley farming by farmers in the forest zone of Southwest Cameroon. Agriculture Ecosystems and Environment. 80, 255-265.
* al, Arun and Krishna, Gupta. 2005. Decentralization and Participation: The Governance of Common Pool Resources in Nepal’s Terai. World Development Vol. 33, No. 7, pp. 1101-1114, 2005.
5ti. A., & Finlay, B. (1997). Statistical methods for the social sciences. Upper Saddle River, New Jersey : Prentice Hall.
L. A. (1975). The Kitale maize agronomy programme, 1963-75. Retrieved October 15, 2005, from vvvva taa.org.ulcTAAScotland/KitaleMaize.html
nor. K. (1 9 9 0 ). Analytical abstracts on farmer participatory research. London: Overseas D ev e lo p m e n t Institute.
o fo , J. K. O. (1986). Maize stalk borer (Lepidoptera: Pyralidae) damage and plant resistance.Environmental Entomology, 15(6), 1124-1129.
d a v i, D avid , Zeyaur Khan and John Pickett.(2007). Enhancing the Push-Pull strategy. LEISA M agazine 23 .4 December 2007.
138

davi, David. 2008. Push-pull technology and determinants influencing expansion amongsmallholder producers I Western Kenya. 2008 A1AEE proceeding of the 24th Annual Meeting E.A.R.T.H. University, Costa Rica.
A.O., O. Ogunnika O. and S.S. Ifa. (2004). Relationship between Socio-Economic Characteristics or Rural women farmers and their adoption of farm technologies in Southern Ebonyi State, Nigeria. International Journal of Agriculture and Biology. 1560-8530/2004/06-5-802-805. http:, www,ijab.org. 6/10/09.
tike, N.. & Coughenour, C. M. (1990). The socio-economic basis of farm enterprise diversification decisions. Rural Sociology, 55(1), 1-24.
©It, C. (1994). Getting ready for the twenty first century: Technical change and institutional modernization in agriculture (Technical Paper 217). Washington DC: World Bank.
► y. J. A. (1982). Technology and ecology: Implication for innovation research in peasant agriculture. Rural Sociology, 47(2), 234-250.
>y. J. A. (1985). The social ecology of soil erosion in a Colombian farming system. Rural Sociology,50(3): 377-396.
in. G. H. (1988). Guide on alternative extension approaches. FAO: Rome.»ie. E. (1995). The practice o f social research. Belmont, California: Wadsworth. gda.ll. T. D. (1993). Methods for active participation: Experiences in rural development from East
and Central Africa. Nairobi: Oxford University Press, ley, T., & Case, A. (1993). Modelling technology adoption in developing countries. American
Economic Review, Papers and Proceedings, 83(2), 396-402 mard. p & Scherr, S. (1994). Within gender differences in tree management: Is gender distinction a
reliable concept? Agroforestry Systems, 25(2), 71-93.
139

A Willem. (2004). An analysis of actor oriented approach as a tool in international developmentcooperation. A dissertation for the degree of Doctor of Administration in Development studies. University of South Africa. Retrieved on 6 October 2009 from http://etd.unisa.ac.za/ETD- db/theses;available/etd-07052005-102932/unrestricted/thesis.pdf http://etd.unisa.ac.za/ETD- db.theses/available/etd-07052005-102932/unrestricted/ thesis, pdf
J. P.. (1980). Three orthogonal models of the adoption of agricultural innovation. Rural Sociology’, 45(2), 309-324.
- R. (1985). Encouraging farmers' experiments. In R. Chambers, A. Pacey, & L.-A. Thrupp (Eds.). Farmers first: Farmer innovation and agricultural research (pp. 57-61). London: Intermediate Technology.
an. F. (1967). Stratification and risk-taking: A theory tested on agricultural innovations. American Sociological Review, 32, 912-927.
an, F. (1972). Change and uncertainty in a peasant economy: The Maya corn farmers o f Zinacantan. Stanford, California: Stanford University Press,
an. F. (1976). Reply to Morrison, Kumar, Rogers, and Fliegel. American Sociological Review, 41,1089-1093.
an, F. (1979). The innovators’ situation: Upper middle class conservatism in agricultural communities. Stanford, California: Stanford University Press.
Lan, F. (1981). Community reference in rural stratification research. Rural Sociology, 46(4), 626-655.
ral Bureau of Statistics (CBS). (2002). 1999 Population and housing census o f Kenya. Nairobi, Kenya: Government Printers, Kenya.
140

:nea, M. M. (1985). Sociological knowledge for development projects. In M. M. Cemea (Ed). (1985). Putting people first: Sociological variables in rural development. New York: Oxford University Press.
’.ambers, R. (1994). Challenging the professions: Frontiers for rural development. London: Intermediate Technology.
:amoers. R., & Jiggins, J. (1987). Agricultural research for resource-poor farmers. Part I: Transfer-of- technology and farming systems research. Agricultural Administration and Extension, 27, 35-52.
ambers, R., Pacey, A., & Thrupp, L.-A. (1989). Farmers first: Farmer innovation and agricultural research. London: Intermediate Technology.
iaroenwatana, T. (1987). Farmers and agricultural science. In K. Amanor (Ed.), Analytical abstracts on farmer participatory research. London: Overseas Development,
bmweno. A., Dibogo, N. O., Ng’ang’a, F. N., & Ndiege, A. O. (1999). Farmers’ evaluation of on- farm trials for the management strategies of stem borers in Trans Nzoia district, 1998. A paper presented at the International Workshop on Habitat Management Strategies for Control of Stem Borers and Striga Weed in Maize-based Farming Systems in Africa. ICIPE, Mbita Point Field Station, June 27-30.
mtere, P. 0. (1998). Diffusion and adoption of farm technologies among resource-limited farmers: Experiences from the ICIPE/UNECA Integrated Pest Management Project in Western Kenya. International Journal o f Pest Management, 44(2), 49-52.
ft-toe. P. 0., & Kiros, F. G. (1996). Farmers’ participation in the adaptation of IPM technologies in Sub-Saharan Africa: Experiences from Kenya. African Crop Science Journal, 4(1), 115-125.
141

atere, P 0., Kiros, F. G. & Mutinga, M. (1995). Report on the study o f adoption and households' capacity to manage and sustain permrthrin impregnated mbu cloth technology in Marigat area, Kenya (Research paper no. 19). Nairobi: International Centre of Insect Physiology and Ecology.
IMMYT.2005. Bug havens keep maize Pest-Proof. Refugia concept for Bt maize under development in Kenya. Retrieved on 6/10/09 fromhttr:./www.cimmvt.org/english/wps/news/2005/dec/bugHavens.html
ohen, J. M., & Lphoff, N. (1980). Participation's place in rural development: Seeking clarity through specificity. World Development, 8, 213-235.
o.linson, M. (1985). Farming system research: Diagnosing the problems. In M. M. Cemea, J. K. Coulter, & J. F. A. Russell (Eds.), Research-extension-farmer: A two-way continuum for agricultural development (pp. 71-86). Washington DC: World Bank,
omwall, A.. Guijit, I., & Welboum, A. (1994). Acknowledging process: Methodological challenges for agricultural research and extension. In I. Scoones & J. Thompson (Eds.), Beyond farmer first: Rural people's knowledge, agricultural research and extension practice. London: Intermediate Technology.
.omwall, .Andrea. 2003. Whose Voices? Whose Choices? Reflections on Gender and Participatory Development. In World Development Vol. 31, No. 8, pp. 1325-1342, 2003
.omwall. Andrea. 2008. Unpacking ‘participation’: models, meanings and practices. Oxford University Press and Community Development Journal. 2008.
^me;s, Vr . W. (1995). Biostatistics: A foundation for analysis in the health sciences (6th ed.). New \ ork: Wiley.
-^supta, S. (1989). Diffusion o f agricultural innovations in village India. New Delhi, Wiley Eastern.
142

■ eGroote. H., Bett, C., Okuro, J. 0., Odendo, M., Mose, L., and Wekesa, E.. 2001. Direct estimation of maize crop losses due to stem borers in Kenya, Preliminary results from 2000 and 2001. Seventh Eastern and Southern African Regional Maize Conference, February 11-15.
css, C. R , & Morris, M. L. (2001). How does gender affect the adoption of agricultural innovations?The case ot improved maize technology in Ghana, Agricultural Economics, 25, 27-39.
oss, C. R., W. Mwangi, H. Verkuijl, and H. de Groote. 2003. Adoption o f Maize and Wheat Technologies in Eastern Africa: A Synthesis o f the Findings o f 22 Case Studies. CIMMYT Economics Working. Paper 03-06. Mexico, D.F.: CIMMYT. Dublin. 30th March to 1st April 2009.
we, J. M., Mollel, N., & Malone, V. (1987). Does the T & V reach female- headed families? Some evidence from Tanzania. Agricultural Administration and Extension, 26, 209-217.
tzioni-Halevy, E., & and Etzioni, A. (Eds.). (1973). Social change: Sources, patterns and consequences. New York: Basic Books.
^h,N. O. A., & Unamma, M. N. (1989). Socio-economic factors influencing the adoption of NAFPP cassava maize production technology by smallholders in southeastern Nigeria. Beitrage zur tropischen Landwirtschaft und Veterinarmedizin, 27(2), 149-154.
'tnngton, J. & Martin, A. (1993). Farmer participation in agricultural research: A review o f concepts and practices. London: Overseas Development.
‘ er- Just, R. E. & Zilberman, D. (1985). Adoption of agricultural innovations in developing countries: A survey. Economic Development and Cultural Change, 32(2), 255-297.
•:-er- G.. & Slade, R. (1984). The acquisition of information and adoption of new technology.American Journal o f Agricultural Economics, 66, 312-320.
143

idstein. S. H., & Poats, S. V. (Eds.). (1989). Working together: Gender analysis in agriculture. West Hartford. Connecticut: Kumarian Press.
: i i .Andy. (2005). Discovering statistics using SPSS. London. Sage Publications, ck. lwe(1998). An introduction to qualitative research. Sage publications. London, egel, F. 11993). Diffusion research in rural sociology: The record and prospects for the future.
Westport Connecticut: Greenwood Press.ad and Agriculture Organisation (FAO). 1997. Gender and participation in agricultural development
planning: Key issues from ten case studies. Rome, 1997. Retrieved on 6 October 2009 from http://www.fao.Org/DQCREP/x0254e/x0254e02.htm#P142 5732 6/10/09.
Jtrell. J. W. (1977). Status inequality and innovation: The green revolution in Andra Pradesh, India. American Sociological Review. 42, 318-37.
i-trell, J. W., & Gartrell, C. D. (1979). Status, knowledge and innovation. Rural Sociology, 44( 1), 73-94.
nreil, J. W., & Gartrell, C. D. (1985). Social status and agricultural innovation: A meta-analysis. Rural Sociology, 50(1), 38-50.charitable foundation. 2005. The Quiet Revolution: Push-Pull Technology and the African Farmer. Gatsby Occasional Paper.
ccens, A. (1984). The constitution o f society: Outline of the theory o f structuration. Oxford: PolityPress.
■ ■ -'•eniment of Kenya, 1994. Ministry of Planning and Development Sessional paper No. 1 of 1994 on Recovery and sustainable development to the year 2010. The government printer. Nairobi,
c'-cnment of Kenya, 1999. Department of Development Coordination. National Poverty eradication plan 1999-2015 The government printer. Nairobi.
144

_?bels, P. (1988). Peasant farmer agricultural self-development: The world neighbours experience in est Africa. ILEIA Newsletter, (4)2, 11-14.
assanali Ahmed, Hans Herren, Zeyaur R. Khan, John A. Pickett, and Christine M. Woodcock. (2008). Integrated pest management: the push-pull approach for controlling insect pests and weeds of cereals, and its potential for other agricultural systems including animal husbandry.Philosophical Transactions of Royal Society B (2008) 363, 611-621.
ivekort, 3., Hiemstra, W., Reijntjes, C. & Essers, S. (1988). Strengthening farmers' capacity for technology development. ILEIA Newsletter, (4)2, 3-7.
:*ell, J. (1982). Managing agricultural extension; The T and V System in practice. Agricultural Administration, 77,273-284.
‘emational Centre of Insect Physiology and Ecology (ICLPE). (1996). Utilisation of wild host plants for the management of cereals stem borers in Africa. A project proposal submitted to the Gatsby Charitable Foundation for funding to conduct on-farm trials during 1997-98.
.'.emational Centre of Insect Physiology and Ecology (ICIPE). (1997). Household level survey: Socioeconomic aspects of utilising wild host plants for management of cereal stem borers in Africa. A summary of a diagnostic survey of agricultural production systems in Trans Nzoia district. Unpublished data.
'•' national Centre of Insect Physiology and Ecology (ICIPE). 2003. Habitat Management strategies for Control of stem borer and Striga weed in cereal based farming systems in Eastern Africa. In .Annual scientific Report 2002-2003. ICIPE Duduville. Nairobi.
2zarr>’, I. (Ed.). (1989). Technology systems o f small farmers: Issues and options. Boulder, Colorado: Westview Press.
145

ggins. J. 11986). Gender related impacts and the work o f the International Agricultural Research Centres. Washington DC: The World Bank.
r.es: C. N. S. (1965). The decolonization of the white highlands of Kenya. Geographical Journal,131{2), 186-201.
iliba. A. R. M., Featherstone, A., Norman, D.W. (1997). A stall-feeding management for improved cattle in semiarid central Tanzania: factors influencing adoption. Agricultural Economics, 17, 133-146.
'.an Z. R.. Ampong Nyarko, K., Chiliswa, P., Hassanali, A., Kimani S., Lwande W.(1997).Intercropping increases parasitism of pests. Nature, 388, 631-632.
tan Z. R.. Pickett, J. A., Van den Berg, J., Wadhams, L. J., and Woodcock, C. M. (2000). Exploiting chemical ecology and species diversity: Stem borer and striga control for maize and sorghum in Africa. Pest Management Science, 56, 957-962.
hn, Z. R, Overholt, W. A. & Ng’eny-Mengich, A. (2003). Integrated pest management case studies from ICIPE. In K. M. Maredia, D. Dakouo, & D. Mota-Sanchez (Eds.), Integrated pest management in the global arena. Wallingford, UK: CABI.
iau Z.R., F. N. Muyekho, E. Njuguna, J. A. Pickett, L. J. Wadhams, J. Pittchar, A. Ndiege, G. Genga, D. Nvagol, and C. Lusweti, (2007). A Primer on planting and managing ‘Push-Pull’ fields for stemborer and striga weed control in maize: A Step-by-Step Guide for Farmers and Extension Staff. 2nd Edition. International Centre of Insect Physiology and Ecology.
--t-'1., Zevaur R , John A Pickett, Johnnie van den Berg,Lester J Wadhams2 and Christine M Woodcock. • 2000) Exploiting chemical ecology and species diversity: stem borer and striga control for ntaize and sorghum in Africa. In Pest Management Science 56:957-962 (2000).
146

m F. G. and Nyapela, O. J. F. (1997). Use of wild host plants for the management of cereal stem borers in Africa: Approaches to IPM technology development, research sites and trials farmers’ selection in an adaptive research project. (Project research methodology report No. 3). Nairobi: International Centre of Insect Physiology and Ecology,
ros. F. G., Chitere, P. O., and Ssenyonga, J. W. (1993). Recent advances in alternative socioeconomic and biological interface researcher approaches fo r the development o f integrated pest and vector management technologies: The experience ofICIPE (Research paper no. 13).Nairobi: International Centre of Insect Physiology and Ecology,
cos. F. G., Nyapela, O. J. F., Wanyama, J. M., & Wanyama D. (1997). Use of wild host plants for the management of cereal stem borers in Africa: Procedures for the selection of sites, farmers and technology evaluation in the Gatsby Project. (Research methodology report No. 4). Nairobi: International Centre of Insect Physiology and Ecology,
anyon, L. E. (1994). Participatory assistance: An alternative to transfer of technology for promoting change on farms. American Journal o f Alternative Agriculture, 9(3), 136-142.
?*is. B. C. (1981). Invisible farmers: Women and the crisis in agriculture. Washington, DC: USAID, -onberger. H. F. (1968). Adoption o f new ideas and practices. Ames, Iowa State University Press. ■ °&g,N., & van der Ploeg, J. D. (1994). Heterogeneity, actor and structure: Towards a reconstitution of
the concept of structure. In D. Booth (Ed.). Rethinking social development: Theory, research and practice. London: Longman.Norman. 2001. Development Sociology: Actor perspectives. Routledge. London.
-wdennilk, M.. & Laitos, W. R. (1981). Towards a participatory strategy for integrated rural development. Rural Sociology, 46(4), 688-802.
147

iviiana, M , S Njihia, M. Mulaa, J.M Songa, Undated. Control Of Stalk Borers In Maize Crops.Kenya Agricultural Research Institute (KARI). NJORO. Leaflet supported and funded by government of Kenya, DFID, and government of the Netherlands. Produced by KARI’s publication unit and DEVCOM.
rora, D., & V oik, A. (1994). Farm management training and reference manual. Fertiliser Extension Project, Trained Frontline Extension Agents, Mabanga Farmers Training Centre, Bungoma, Kenya. March 1-3, 1995.
ata, P .Z., O.C. Ajayil, P.A.Oduol and Aggrey Agumva. (2008). Socio-economic factors influencing adoption of improved fallow practices among smallholder farmers in western Tanzania. International NGO Journal Vol. 3 (4), pp. 068-073, April, 2008.
attocks, D. M., & Steele, R. E. (1994). NGO-govemment paradigms in agricultural development: A relationship of competition or collaborators? Journal o f International Agricultural and Extension Education. 7(1), 54-62.
cAilister, J. (1981). Rural innovators: A struggle for power. In R. B. Crouch & S. Chamala (Eds).Extension education and rural development (Vol. 1). New York: Wiley,
lendeahall, W. (1987). Introduction to probability and statistics (7th ed). Pacific Grove, California: Brooke/Cole.
Lnistry of Agriculture Livestock Development (1999). Trans Nzoia district annual report. Nairobi: Author.
■ unistry of Agriculture Livestock Development. (1997). Trans Nzoia district farm management guidelines. Nairobi: Government Printer.S. (1981). Innovativeness and status-congruence: The case of the Kibbutz. In R. B. Crouch & S. Chamala (Eds.). Extension education and rural development (Vol. 1). New York: Wiley.
148

less. L. 0., Muvekho, F. N., Dibogo, N., & Ndiege, A. (1998). Economic evaluation of the Gatsby funded ICIPE;KARI/MOALD Habitat Management Technologies for Stem Borer Control, Trans Nzoia. Unpublished paper.
lunithi, C. N. (1980). On-farm experiments: Some experiences. In Proceedings o f the 2nd Symposium on Intercropping in Semi-Arid Areas. Morogoro, Tanzania, August 4-7.
goc Chi, Truong T h i. (2008). Factors affecting technology adoption among rice farmers in theMekong Delta through the lens of the local authorial managers: An analysis of qualitative data.In Omonrice 16: 107-112 (2008).
orusis, M. J. (1991). The SPSS guide to data analysis for SPSS/PC+ (2nd ed.). Cary, NC: SPSS, vangito, H., & Ndirangu, L. (1997). Farmers' response to reforms in the marketing o f maize in Kenya:
A case study o f Trans Nzoia district (Discussion Paper No. DP 003/97). Nairobi: Institute of Policy .Analysis and Research.
kii, C., Sumberg, J., & Farrington, J. (1994). Farmer participatory research: Rhetoric and reality. London: Overseas Development Institute.
Mgho, B.O. and ZP.A. Ifie. 2007. Socio-Cultural Factors Affecting the Adoption of Snailery in Delta Central Agricultural Zone, Delta State Nigeria. Journal of Applied Sciences 2(1): 26-30,2007.
hrsons, T., & Shils, E. (Eds.). (1967). Toward a general theory o f action. Cambridge, Massachusetts: Harvard University Press.Pashupati, Aijun Kumar, Shrestha and Atsushi Matsuoka. (2009). Socio-economic Factors Influencing Adoption of Fertilizer for Maize Production in Nepal: A Cast Study of Chitwan District. The 83rd Annual Conference of the Agricultural Economics Society
^als7 S. (1991). The role o f gender in agricultural development. Washington DC: Consultative Group on International Research.
149

^ay. J. N., & Chambers, R. (1994). Towards a learning paradigm: New professionalism and institutions for agriculture. In I. Scoones & J. Thompson (Eds.), Beyond farmer first: Rural people's knowledge, agricultural research and extension practice. London: Intermediate Technology.
T-ch. K. F. (1998). Introduction to social research: Quantitative and qualitative approaches. Thousand Oaks, California: Sage.
itier, G. (1992). Sociological theory (3rd ed.). New York: McGraw-Hill.:gers, E. M. (1971). Diffusion o f innovations (2nd ed.). New York: Free Press, ogers, E. M. (1983). Diffusion o f innovations (3rd ed.). New York: Free Press..ogers, E. M., & Shoemaker, F. F. (1971). Communication o f innovations: A cross cultural approach.
New York: Free Press.ling, N. (1988). Extension science: Information systems in agricultural development. New York:
Cambridge University Press.lolng, N. (1994). Facilitating sustainable agriculture: Turning policy models upside down. In I.
Scoones & J. Thompson (Eds.), Beyond farmer first: Rural people's knowledge, agricultural research and extension practice. London: Intermediate Technology.
5aeaa> K. N., Pala Okeyo, A., Seshu Reddy, K. V., Omolo, E. 0., & Ngode, L. (1990). Insect pest management and socio-economic circumstances of small-scale farmers in food crop production in W estern Kenya: A case study. Insect Science and Its Application, 10(4), 443-462.
-onherr. S., & Mbugua, E. S. (1974). Rapid development for Kenya's small farms (Working paper No. 129). Nairobi: Institute for Development Studies, University of Nairobi.
- K.. R. (2001). Investigating the social world; the process and practice of research. ThousandOaks, California: Pine Forge Press.
150

ScDor.es. I., & Thompson, J. (Eds.). (1994). Beyond farmer first: Rural people's knowledge, agricultural research and extension practice. London: Intermediate Technology,
iima. P. (1993). Indigenous soil characterisation and farmer participation in Northern Zambia:Implications for research and extension delivery. In I. Scoones & J. Thompson (Eds.), Beyond farmer first: Rural people's knowledge, agricultural research and extension practice (pp. 80-82). London: Intermediate Technology.
ngleton, A. R„ Jr., Straits, C. B., & Miller Straits, M. (1993). Approaches to social research (2nd ed.). New York: Oxford University Press.
c’<al. R. R,. & Rohlf, F. J. (1981). Biometry: the principles and practice o f statistics in biological research (2nd ed.). New York: W. H. Freeman,
ixnthall. R. C. (1994). Basic statistical analysis (4Ih ed.). Boston: Allyn and Bacon:, tiudt, K. (1985). Agricultural policy implementation: A case study from Western Kenya. West
Hartford, Connecticut: Kumarian Press.i .egen, N., & Foeken, D. (Eds.). (1992). Farm labourers in Trans Nzoia district, Kenya (Report No.
46 1992). Proceedings o f a dissemination seminar at Kitale, Food and Nutrition Studies Programme. November, 23-24.
• ®as-Slayter, B., & Rocheleau, D. E. (1994). Research frontiers at the nexus of gender, environment, and development, linking households, community and ecosystems. In R. S. Gallin & A. Ferguson 'Eds.). Women and International Development Annual. Boulder, Colorado: Westview Press.
-ited Nations Development Programme. (1999). Human Development Report. New York: Oxford University Press.
- Environmental Protection Agency (USEPA). Integrated Pest Management (IPM) Principles. ilIIgliAvww.eDa.gov/opp00001/factsheets/ipm.htm. 02/10/09
D., Sayeweh, P., Rugege, E., Mugo, F., & Acebedo, L. F. (1996). The Kenya gender training project. Unpublished paper.
151

■ e:engere. KLitojo. 2009. Socio-economic factors critical for adoption of fish farming technology: The case of selected villages in Eastern Tanzania. In International Journal of Fisheries and Aquaculture Vol. 1 (3), pp. 028-037, August, 2009. Retrieved on 6 October 09 from http://www.academiciournals.ore/iifa 6/10/09
' "itehead A., & Bloom, H. (1992). Agriculture. In L. Ostergaard (Ed.), Gender planning and de\e!opment: A practical guide. New York: Rutledge.
' -/eratne, M., & Chandrasiri, P. A. N. (1993). Dissemination of new technology in a farming systems research and extension programme: Diffusion of rice varieties in an area with poor production potential. Experimental Agriculture, 20, 503-507.
152

APPENDIX A LIST OF TABLES
Table 1 Project Phases and the Role o f this Study in the “Push-pull" technology developmentprocessProtect phase Farmer participation Collaborators Role of this studyPhase 1: On-station trials • Evaluation of • Farmers • Noneat Mbita Point Field potential push and • Researchers fromStation (MPFS) and pull crops being ICEPE and KARI.KARI Kitale tested at the station • Extension agents
• Awareness creation from MOALD.about the project and its components
Phase 2: On-farm • Farm operations by • Farmers • Noneresearcher-managed providing land and • Researchers fromtnals labour for some of ICEPE and KARI.
the operations. • Extension agents• Learning about the from MOALD.
technology components and trial process.
• Attending researchand educationalsessions
• Disseminating thetechnology to wider communities
Phase 3: On-farm • Farm operations by • Farmers • Examine thescientist managed and providing land and • Researchers from collaborativeon-farm farmer labour for some of ICIPE and KARI. process.managed trials. The the operations. • Extension agents • Determine factorsscientist-managed trials • Learning about the from MOALD. that areare for data collection. technology influencing
components and technologytrial process. adoption.
• Attending research • Establish theand educational and impact of theevaluation sessions collaborative
• Disseminating the participationtechnology to wider model oncommunities technology
adoption.Source: D evelop ed b y th e a u th o r
153

Table 2 S c o r in g o f P u s h - p u l l” te c h n o lo g y A d o p tio n C h a ra c te r is tic s
Activity. h usbandry practice Scoring Justification for inclusion_____ _______________ __ _________________ scorelane separation date December to January = 2
February to March = l After March = 0
2 Recommended land preparation dates are 1-2 months before planting for the case of Tran Nzoia. Rainfall begins in mid-March, which is the planting time (MOALD, 1997)
Number of times land ploughed More than once = 2Once= 1Not ploughed = 0
2 Desmodium requires a fine tilth because of the size of seed.
Pianog date tor maize February to March = 2 April to May= 1 After May=0
2 Planting early ensures maize takes advantage of soil air/moisture relationships (Acland, 1971, p. 129). Delay in planting by a day after the start of the rain could lead to a decrease in yields of up to 70 Kgfoa (Allan, 1975).
P'antr.g date for Napier grass At least two weeks before planting maize = 1 After two weeks = 0
I According to recommendations, Napier grass must be planted at least 2 weeks before the maize so that it has a head start on the maize. The stem borers will prefer the older grass (Khan, Pickett, Berg Van den, Wadham and Woodcock, 2000).
Maize variety planted Hybrid = 2 Open pollinated and composites = 1 Local variety = 0
2 To maximize production per unit area and take advantage of the climatic conditions, hybrids were recommended for Trans Nzoia District (MOALD, 1997).
Napier grass variety planted Bana = 2Other varieties of Napier
grass= INo Napier grass = 0
2 Bana was recommended for efficiency in attracting stem borer opposition and for production of the gummy substance.
Planting fertilizer used on maize Fertilizer used = 1 No fertilizer = 0
l Performance of hybrid maize variety is increased by soil fertility enhancement.
Top dressing fertilizer used on maize Fertilizer used = 1 No fertilizer=0
l Performance of hybrid maize variety is increased by soil fertility enhancement.
Napter grass planting design
Sctoodium planting design
Border planting = 3 Non-border planting or no Napier grass = 0 Desmodium intercrop = 3 No Desmodium intercrop = 0
3
3
Border planting of Napier grass was the main component of the technology
intercropping with Desmodium increased the efficacy of the technology.
Melon planting design Desmodium intercrop = 3 No Desmodium intercrop = 0
3 Intercropping with Melinis increased the efficacy of the technology. (Khan etal.. 1997, p. 631).
Maac spacing 75cm by 25-30 cm = 1 Other spacing = 0
1 Spacing has an impact on plant population, eventually impacting on yield. Recommendedspacing for Trans Nzoia District is 75 cm by 25- 30 cm.
154

Numwr of nmes maize weeded Twice or use of herbicide = 2 2Once= 1 No weeding = 0
Weeding reduces competition for nutrients rhus enhancng crop development Early and clean weeding is necessary to improve productivity.
Number of limes Napier grass weeded Twice or use of herbicide =2 2Once= I No weeding = 0
Weeding reduces competition for nutrients 'bus enhancing crop development. Early and clean weeding is necessary to improve productivity.
Numoe of times Desmodium weeded if At least twice or use of 2 nErcopped herbicide = 2
Once= 1 No weeding = 0
Number of times Melinis weeded if At least twice or use o f 2 ncrcopped herbicide = 2
Once = i No weeding - 0
ncblizc- application on Napier grass Fertilizer used = l 1No fertilizer = 0
Weeding reduces competition for nutrients thus enhancing crop development. Early and clean weeding is necessary to Improve productivity.
Weeding reduces competition for nutrients thus enhancing crop development Early and clean weeding is necessary to improve productivity.
Performance crop is increased by soil fertility enhancement.
rertiltaer application on Desmodium Fertilizer used = 1No fertilizer = 0
Performance crop is increased by soil fertility enhancement.
Fertilizer application on Melina Fertilizer used = 1No fertilizer = 0
Performance crop is increased by soil fertility enhancement.
Age at harvesting maize
Age a: harvesting Desmodium
Age at first harvesting Napier
November to December = 2 2January to February = 1 After February = 0
After 5 months = 2 2Before 5 months = 1 Desmodium not planted =0
At 3 months = 2 2After 3 months = 1 NoNapier = 0
Maize should be harvested early to reduce losses to pests (Allan, 1975).
Desmodium should be harvested after it has repelled the stem borers and not earlier.
The recommended practice is to harvest Napier grass from 3 months, which is when the stem borer is laying eggs on it and the grass is soft.
Age zt second harvesting Napier 6-8 weeks alter the first 2 cutting = 2
Over 8 weeks after the first cutting = 1
No Napier = 0
The recommended practice is to harvest Napier grass from three months, that is when the stem borer is laying eggs on it and the grass is soft.
Age at harv esting Melinis After 5 months = 2 2 Before 5 months = 1 Melinis not planted = 0
Melinis should be harvested after it has repelled the stem borers and not earlier.
Total score1 40 po in ts M a x im u m sco red a s su m e d all the a b o v e p rac tices are ad o p ted
ine total p o in ts p o s s ib le is 4 0 and n o t 44 b e c a u s e o n e has a c h o ic e o f e i th e r D esmodium o r M elin is in te rc ro p to score the m a x im u m p o in tSource: Developed by author
155
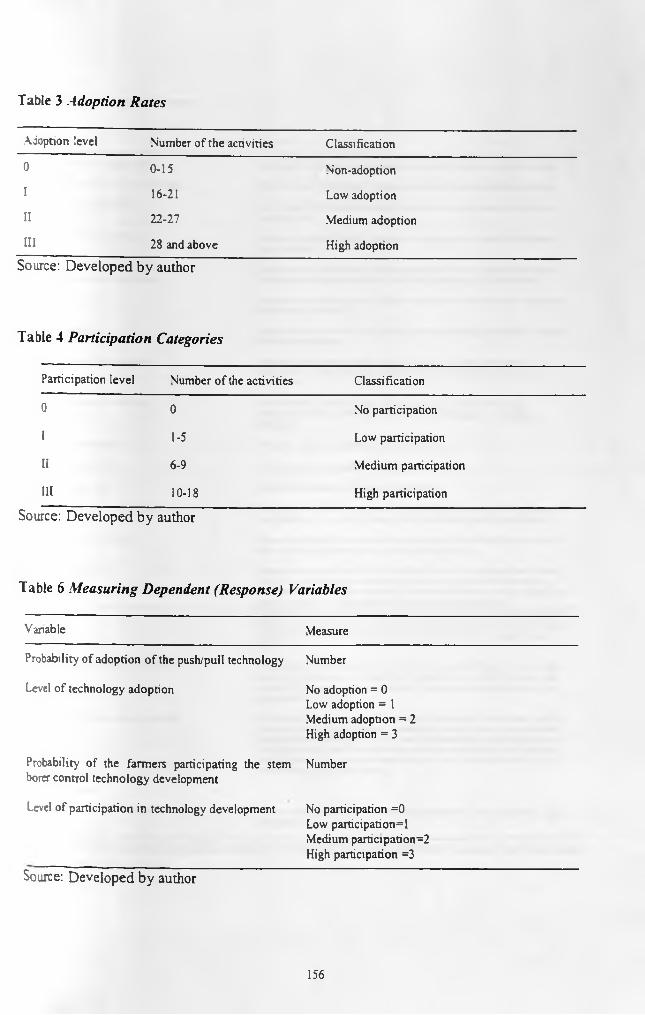
Table 3 A d o p t io n R a te s
A d option lev e l N u m b e r o f th e ac tiv itie s C la s s if ic a tio n0 0 -1 5 N o n -a d o p tio nI 16-21 L ow a d o p tio nII 2 2 -2 7 M ed iu m a d o p tio nIII 23 an d a b o v e H ig h a d o p tio n
Source: Developed by author
Table 4 Participation Categories
P a rtic ip a tio n le v e l N u m b e r o f the a c tiv itie s C la s s if ic a tio n
0 0 N o p a rtic ip a tio n
1 1-5 L ow p a rtic ip a tio n
n 6-9 M e d iu m p a rtic ip a tio n
m 10-18 H ig h p a rtic ip a tio nSource: Developed by author
Table 6 Measuring Dependent (Response) Variables
V ariab le M easu re
P robab ility o f a d o p tio n o f th e p u sh /p u ll te c h n o lo g y N u m b er
Level o f te c h n o lo g y a d o p tio n N o a d o p tio n = 0 L ow a d o p tio n = 1 M ed iu m a d o p tio n = 2 H igh a d o p tio n = 3
P robability o f th e fa rm e rs p a rtic ip a tin g th e s tem borer co n tro l te c h n o lo g y d e v e lo p m e n t
N u m b e r
Level o f p a rtic ip a tio n in te c h n o lo g y d e v e lo p m e n t N o p a rtic ip a tio n = 0 L ow p a r t i c ip a t io n ^ M ed iu m p a rtic ip a tio n = 2 H igh p a rtic ip a tio n = 3
Source: Developed by author
156

Table 5 P a r t ic ip a tio n S c o re s
Score RemarksProject ntroducooo meeting {baraza’) l Everyone was invited and had a choice to participate. Participate in decision making.On-tarn nal project farmer selection meeting.baraza)Farmer field days m Trans Nzoia t
l1
Everyone was invited and had a choice to participate. Participate in decision making.Everyone was invited and had a choice to participate and be selected. Participate in being informed.
Fanner field days in Trans Nzoia 2 1 Everyone was invited and had a choice to participate and be selected. Participate ni being informed.
Farmer selection for on farm Farmer managed trials Hosting a mal as a project farmer) 1 Everyone was invited and had a chance to choose to become a project farmer if they
met the set criteria thus participating. Participate in providing land and labourHouseaold level surveys l Rcspoudcnu did not have a choice, but all had equal chances to participate. Participate in providing information.Village level surveys l Respondents did not have a choice, but all had equal chances to participate. Participate
in providing information.Farmers’ evaluation of the technology 1 Respondents did not have a choice, but all had equal chances to participate.
Respondents randomly selected at the field day site. Participate in providing information.
Farmer evaluation of the technology l Respondents did not have a choice, but all had equal chances to participate. Respondents randomly selected at the field day site. Participate in providing information.
Farmer training workshops 1 i Only selected fanners were allowed to participate.Farmer Timing workshops 2 1 Only selected farmers were allowed to participate.Farmer saining workshop 3 I Only selected farmers were allowed to participate.Fiiucanonal lour by Mbita Point Fanners 1 Respondents did not have a choice, farmers perceived by researchers to be doing well
were selected to be visited by farmers from Mbita Division South Nyanza DistrictEducational tour to Mbita Point l Respondents did not have a choice, farmers perceived by researchers to be doing well
were selected to visit Mbita Division. South Nyanza District.Visa bt MOALD staff l At least one visit from the MOALD this did not include visits to collect data for this
study. Visits were defined as those made in relation to the stem borer technology development Farmers selected as project were visited to follow up on the project Any other visits related to general extension were not included in this study.• isit by 1CAXI stall l At least one ’/isit form KARI. Visits were defined as those made in relation to the stem borer technology development Farmers selected as project were visited to follow up on the project Any other visits related to general extension were not included in this study.
' isit by ICIPE Rcthamsted Research/Gatsbysexatas 1 At least one visit from this group of researchers. Visits were defined as those made in relation to the stem borer technology development. Farmers selected as project were visited to follow up on the project Any other visits related to general extension were not included in this study
• isit by other farmer on issues related to theproject i At least one visit from this group of researchers. Visits were defined as those made ui
relation to the stem borer technology development. Farmers selected as project were visited to follow up on the project Any other visits related to general extension were not included in this study. Excluded were farmers who attended field days hosted by Project farmers and farmers on educational tours. These were excluded because the numbers were going to skew the data
Total possible score 18Agncahaiai externum agents' training workshop
T~. :-----------------------------------
l Farmers were not allowed to participate. This did not form a basis to determine fanner participation
A Baraza is a community public meeting convened by local leaders to discuss development.Source: D ev elo p ed b y a u th o r
157

Table 7 W e ig h tin g o f R e s o u r c e E n d o w m e n t In d ic a to r s
Item Maximum score
Source of land whether purchased ■ 3. inherited * 2, settled by government = 1, or squatters = 0 3
Land size: S 1 acre * 1. > 1-4 acres =2, >5acres = 3 3
OfT-arm employment for respondent 1
OtT-arm employment for spouse, son, daughter (one score for each, up to a maximum score of 3) 3
Livestock ownership—Local cattle: none = 0, 1—»* 1,5-8 « 2, >8 = 3 3
Grade cattle( 1 score for each grade cow owned up to a maximum of 3 points for >3) 3
Sheeo and goats (Shoats): none = 0, <5 “ 1,6-10 * 2, >10 = 3 3
Improved poultry 1
Donkeys 1
Beehives 1
Houses: local “ 0, semi-permanent = 1, permanent = 2) 2
Other source of income (e.g., pension, remittance) 1
Bicycles l
Motorbike 1
Vehicle 1
Radio 1
So a set 1
Dining set 1
Tractor 1
Wheelbarrow I
Ox-piough 1
Car: 1
Source: Adapted from Chitere, Kiros, and Mutinga (1995)
158

Table 8 S c o r in g f o r K n o w le d g e o f T e c h n o lo g y
C a te g o rie s S c o re s
Has c e r ta in k n o w le d g e o n m a ize a g ro n o m y (q u e s tio n s asked in c lu d e d e a r ly a n d N o n e 0proper l a n d p re p a ra t io n , use o f c e r t if ie d seed s , u s e o f fe rtilizers , p la n tin g d e p th , 1-3 1weed c o n t r o l , th in n in g , p ro p e r h a rv e s tin g te c h n iq u e , and p ro p e r s to ra g e ) 4 -5 2
> 6 3
Has c e r ta in k n o w le d g e o n N a p ie r g ra s s e s ta b lish m e n t and u tiliz a tio n (q u e s tio n s N o n e 0asked in c lu d e d p ro p e r land p re p a ra tio n . P la n tin g m ateria ls , u se o f fe r ti l iz e rs , 1-3 1p lan tin g d e s ig n s , m a in te n a n c e , h a rv e s tin g , u tiliz a tio n , sto rage a n d p re s e rv a tio n ) 4 -5 2
> 6 3
H as c e r ta in k n o w le d g e on M elinis e s ta b lis h m e n t and u tiliz a tio n (q u e s tio n s N o n e 0asked in c lu d e d p ro p e r lan d p re p a ra tio n , P la n tin g m ateria ls , u se o f fe r ti l iz e rs , 1-3 1p la n tin g d e s ig n s , m a in te n a n c e , h a rv e s tin g , u tiliz a tio n , s to rag e an d p re s e rv a tio n ) 4 -6 2
> 6 3
Has c e r ta in k n o w le d g e o n D esm odium e s ta b lish m e n t and u tiliz a tio n (q u e s tio n s N o n e 0asked in c lu d e d p ro p e r lan d p re p a ra tio n , P la n tin g m ateria ls , u se o f fe r ti l iz e rs , 1-3 1p lan tin g d e s ig n s , m a in te n a n c e , h a rv e s tin g , u ti l iz a tio n , s to rage an d p re s e rv a tio n ) 4 -6 2
> 6 3
Has c e r ta in k n o w le d g e on the s te m b o re r s ’ b io lo gy , d a m a g e a n d c o n tro l N o n e 0(q u e s tio n s a s k e d in c lu d e d life cy c le , ty p e o f d a m a g e , loses d u e to s te m b o re rs , 1 1m ethods o f c o n tro l) 2 2
>3 3Source: D e v e lo p e d b y a u th o r
159
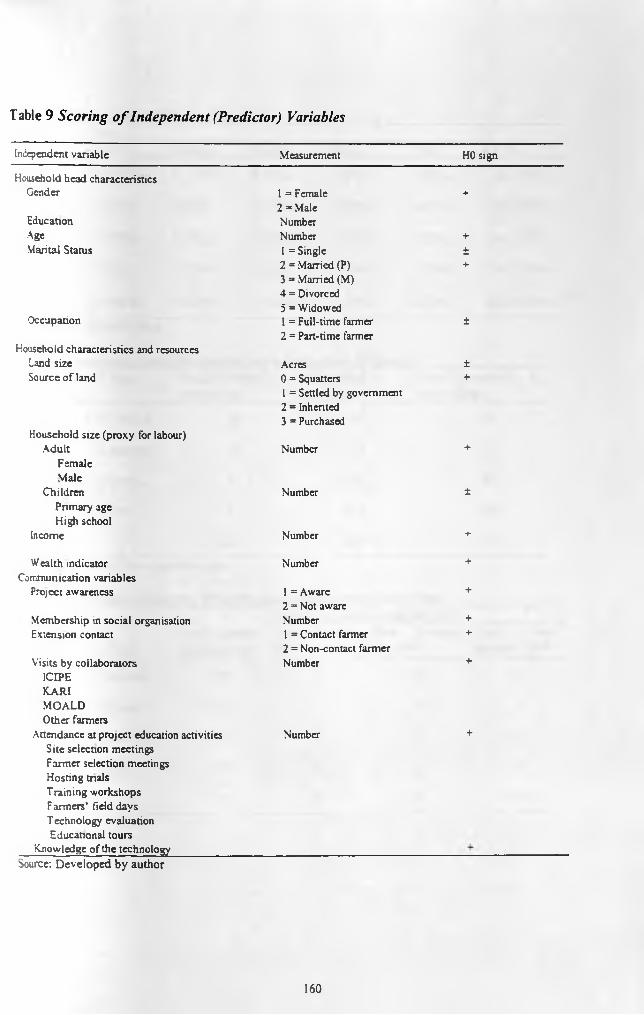
Table 9 S c o r in g o f I n d e p e n d e n t (P r e d ic to r ) V a ria b le s
Independent variable Measurement HO sign
Household head characteristics Gender 1 = Female +
Education2 = Male Number
Age Number +Marital Status 1 = Single ±
2 = Married (P) +
Occupation
3 = Married (M)4 = Divorced5 = Widowed1 = Full-time farmer ±
Household characteristics and resources Land size
2 = Part-time farmer
Acres ±Source of land 0 = Squatters +
Household size (proxy for labour) Adult
1 = Settled by government2 = Inherited3 = Purchased
Number +FemaleMale
Children Number ±Primary age High school
Income Number +
Wealth indicator Number +Communication variables
Project awareness 1 = Aware +
Membership in social organisation2 = Not aware Number +
Extension contact 1 = Contact farmer +
Visits by collaborators2 = Non-contact farmer Number +
ICIPE KARI MOALD Other farmers
Attendance at project education activities Number +Site selection meetings Farmer selection meetings Hosting trials Training workshops Farmers’ field days Technoiogy evaluation Educational tours
Knowledge of the technologySource: Developed by author
160

uiuuuun Uf 11Tribe
rioe oy villageVillage Luhya Kalenjir. Kikuyu Kisii Teso TotalYuya 58 (76%) 11 (15%) 4 (5%) 3 (4%) 0 (0%) 76 (100%)Wamuini 4(11%) 0 (0%) 32 (84%) 2 (5%) 0 (0%) 38 (100%)Kumnini 25 (37%) 1 (2%) 39 (57%) 2 (3%) 1 (2%) 68 (100%)Kissawai 5 (13%) 32 (84%) 0 (0%) 0 (0%) 1 (3%) 38 (100%)Totals 92 (42%) 44 (20%) 75 (34%) 7 (3%) 2 (1%) 220 (100%)Source: field research dataTable 11 Household Heads Distribution ,in the Study Areas by GenderDivision Village Female-headed Male-headed
households householdsTotal households in each village
Kiminini Kiminini 18 42 60Saboti Kissawai 9 62 71Central Wamuini 44 150 194Kaplamai Yuya 42 352 394Total 113 606 719
Source: Developed from research dataTable 12 1998 Project Farmers’ Proportionate Distribution by Study Areas
Number of participating farmersDivision Village
Total number Trial of households 1997
farmers New farmers for 1998
Total trial farmers 1998
Kiminini Kiminini 60 3 13 16Saboti Kisawai 71 2 6 8Central Wamuini 194 4 10 14Kaplamai Yuya 394 2 15 17Total 719 11 44 55
Source: Research data
161

Table 13 D istr ib u tio n o f R espondents by V illage
Village Non-projectProject farmers farmers Respondents Percentage
Yuva 38 38 76 35%Koranini 34 34 68 31%Wamuini 19 19 38 17%Kissawai 19 19 38 17%Total 110 110 220 100%Source: Field research data
Table 14 Education Level of the Household Head by Adoption CateeorvEducation level
Adoptioncategories 0 yean 1-4 years 5-8 years 9-12 years
Post high school Totals
None 11 (61%) 21 (54%) 27 (33%) 23 (33%) 5 (38%) 87 (40%)Low 1 (5%) 4(10%) 3 (4%) 7 (10%) 1 (8%) 16(7%)Medium 3 (17%) 12(31%) 43 (54%) 37 (53%) 6 (46%) 101 (46%)High 3 (17%) 2 (5%) 7 (9%) 3 (4%) l (8%) 16(7%)Totals 18(8%) 39(18%) 80 (36%) 70 (32%) 13 (6%) 220(100%)X =1.202, df=9,p< .0005Source: Field research dataTable 15 Land Size by Adoption Category
Land size categoriesAdoption categories
Small scaleMedium scale to large scale Totals
None 60 (37%) 27 (46%) 87 (40%)Low 14 (9%) 2 (3%) 16(7%)Medium 73 (45%) 28 (48%) 101 (46%)High 14 (9%) 2 (3%) 16(7%)Totals 161 (73%) 59 (27%) 220(100%)i2 =5.532, df~ 6, p = .478 Source: Field research data
162

Table 16 G ender o f H o u se h o ld H e a d by A d o p tio n CategoryAdoptioncategories1 Male
GenderFemale Totals
None 66 (40%) 21 (37%) 87 (40%)Low 10 (6%) 6 (10%) 16 (7%)Medium 76 (47%) 25 (44%) 101 (46%)High 11 (7%) 5 (9%) 16(7%)Totals 164 (75%) 56 (25%) 220 (100%)X =1.570, df= 3,p = .666Source: Field research dataTable 17 Respondents’ Age by Adoption CategoryAdoption ______________ AgeCategories 0-39 years 40-59 years 60 years and above TotalsNone 24 (46%) 40 (32%) 23 (56%) 87 (40%)Low 6(12%) 8 (6%) 2 (5%) 16 (7%)Medium 19(37%) 69 (54%) 13 (32%) 101 (46%)High 3 (6%) 10 (8%) 3 (7%) 16(7%)Totals 52 (24%) 127 (58%) 41 (18%) 220(100%)X =19.127, df= \2,p = .086 Source: Field research dataTable 18 Household Head’s Occupation by Adoption CategoryAdoptioncategories
OccupationFull-time fanner Part-time farmer Totals
None 71 (38%) 16(46%) 87 (40%)Low 15 (8%) 1(3%) 16 (7%)Medium 86(47%) 15 (43%) 101 (46%)High 13 (7%) 3 (8%) 16 (7%)Totals 185 (84%) 35 (16%) 220(100%)12=1.697. df= 3.0 =.638Source: Field research data
163

Table 19 M arita l S ta tu s by A do p tion C ategoryMarital statusAdoption
categories Single Mamed, Married, monogamous polygamous Totals
None 8 (50%) 63 (39%) 16(37%) 87 (40%)Low 0 (0%) 13 (8%) 3 (7%) 16 (7%)Medium 7 (44%) 74 (46%) 20 (46%) 101 (46%)High 1 (6%) 11 (7%) 4 (9%) 16(7%)Totals 16(7%) 161 (73%) 43 (20%) 220(100%)X2 =1.774, df= 3,p = .621 Source: Field research dataTotal 20 Number o f People in the H ousehold bv Adoption CategoryAdoption Number of people in the householdcategories 1-5 6-10 >10 TotalsNone 21 (50%) 53 (38%) 13 (33%) 87 (40%)Low 2 (5%) 13 (10%) 1 (3%) 16(7%)Medium 18 (43%) 63 (45%) 20 (51%) 101 (46%)High 1 (2%) 10(7%) 5(13%) 16(7%)Totals 42 (19%) 139(63%) 39 (18%) 220(100%)X =7.366, df=6,p = 0.388 Source: Field research dataTable 21 lXumber o f Children under the A g e o f 5 Years by Adoption CategoryAdoption Number of children under the age of 5 yearscategories 0 1-5 TotalsNone 37 (40%) 50(39%) 87 (40%)Low 5 (5%) 11 (9%) 16(7%)Medium 42 (46%) 59 (47%) 101 (46%)High 8 (9%) 8 (6%) 16 (7%)Totals 92 (42%) 128 (58%) 220 (100%)X =2.864, d f= 2 ,p = .838Source: Field research data
164

Table 22 R eported A n n u a l In c o m e s by A d o p tio n CategoryAdoption C atego ries o f annual incomeCategories L o w status M ed iu m status H ig h status T o ta lsNone 9 (43%) 45 (40%) 33 (38%) 87 (40%)L o w 2 (10%) 9 (8%) 5 (6%) 16 (7%)M edium 8 (38%) 50 (45%) 43 (49%) 101 (46%)H igh 2 (10%) 8 (7%) 6 (7%) 16 (7%)Totals 21 (9%) 112(51%) 87 (40%) 220(100%)r = 1-360, d f= 6, p = 0.968 Source: F ie ld research data
Table 23 L ivestock N u m b e rs by A d o p tio n C ategoryC atego ries o f livestock numbers
Adoption categories 0 1-5 6-10 T otalsN one 12 (48%) 72 (38%) 3 (43%) 87 (40%)L o w l (4%) 15 (8%) 0 (0%) 16 (7%)M edium 9 (36%) 89 (47%) 3 (43%) 101 (46%)High 3 (12%) 12 (7%) 1 14%) 16(7%)Totals 25(11%) 188(86%) 7 (3%) 220(100%)C ~ 3.630, df= 6 ,p = .727Source: Field research data
Table 24 W ealth S ta tu s by A do p tio n C a tegoryAdoption C atego ries o f w ealth statuscategories L o w status M ed iu m status High status TotalsNone 54 (41%) 25 (34%) 8 (47%) 87 (40%)L ow 10(8%) 5 (7%) 1 (6%) 16 (7%)Medium 56 (43%) 38 (52%) 7(41%) 101 (46%)High 10 (8%) 5 (7%) 1 (6%) 16(7%)Totals 130 (59%) 73 (33%) 17 (8%) 220(100%)X" =2.203, df= 6,p = .900 Source: Field research data
165

Adoption ______ Number of social organisations belonged to______categories____________0 __________ 1-5 6-10 TotalsTable 25 D egree o f M em b ersh ip in S o cia l O rganisations by A d o p tio n C ategory________
None 23 (51%) 44 (45%) 20 (26%) 87 (40%)Low 6(13%) 6 (6%) 4 (5%) 16 (7%)Medium 15(33%) 43 (44%) 43 (56%) 101 (46%)High 1 (2%) 5 (5%) 10 (13%) 16 (7%)Totals 45 (20%) 98 (45%) 77 (35%) 220 (100%)X* =17.691, d f- 6, p< .05 Source: Field research dataTable 26 Total Visits by Collaborators by AdoptionAdoption Visits by collaboratorscategories 0 visits At least 1 visit TotalsNone 87(81%) 0 (0%) 87 (40%)Low 5 (5%) 11(10%) 16 (7%)Medium 15 (14%) 86 (76%) 101 (46%)High 0 (0%) 15 (14%) 16 (7%)Totals 107 (49%) 113(51%) 220(100%)t =265.400, df= 3,p < .0005 Source: Field research dataTable 27 Contact with M OALD Extension agents by Adoption CategoryAdoption Contact with MOALD extension agentscategories Contact fanner Non-contact farmer TotalsNone 16(20%) 71 (51%) 87 (40%)Low 4 (5%) 12 (9%) 16(7%)Medium 51 (64%) 50 (36%) 101 (46%)High 9(11%) 7 (4%) 16 (7%)Totals 80 (36%) 149 (64%) 220 (100%)7 =24.488#= 3, < .0005Source: Field research data
166

Adoption Project awarenesscategories Not aware Aware TotalsNone 22 (100%) 65 (33%) 87 (40%)Low 0 (0%) 16 (8%) 16(7%)Medium 0(0%) 101(51%) 101(46%)High 0 (0%) 16 (8) 16(7%)Totals 22 (10%) 198 (90%) 220(100%)r =37.369,#= 3, p < . 0005 Source: Field research data
Table 29 Knowledge o f Technology by Adoption CategoryCategories of knowledge on technologyAdoption
categories Limited Average High knowledge knowledge knowledge Totals
None 13 (87%) 72 (57%) 2 (2%) 87 (40%)Low 2(13%) 12(10%) 2 (2%) 16(7%)Medium 0(0%) 39(31%) 62 (79 %) 101 (46%)High 0 (0%) 3 (2%) 13 (17%) 16(7%)Totals 15(7%) 126(57%) 79 (36%) 220(100%)Jf = 95.414, df= 6,p< .0005 Source: Field research dataTable 30 .\um ber o f Trainings A ttended by Adoption CategoryAdoption Trainings attendedcategories None 1-2 3-5 6-9 TotalsNone 58 (89%) 21(44%) 8(15%) 0 (0%) 87 (40%)Low 3 (5%) 2 (4%) 8 (15%) 3 (6%) 16(7%)Medium 4 (6%) 22 (46%) 32 (60%) 43 (80%) 101 (46%)High 0 (0%) 3 (6%) 5 (9%) 8 (15%) 16(7%)Totals—------ rrr--------
65 (30%) 48 (22%) 53 (24%) 54 (24%) 220(100%)
Source: Field research data
167

Table 31 T echno logy O ption by A do p tio n C ategoryTechnology optionAdoption
categoriesNone
adoptedNapieronly Napier + Napier +
Desmodium MelinisNapier +
beans TotalsNone 87(100%) 0 (0%) 0 (0%) 0 (0%) 0 (0%) 87 (40%)Low 0 (0%) 10(17%) 0 (0%) 0 (0%) 6(16%) 16 (7%)Medium 0 (0%) 47 (84%) 7(41%) 15(71%) 32 (84%) 101 (46%)High 0 (0%) 0 (0%) 10(59%) 6(29%) 0 (0%) 16 (7%)Totals 87 (40%) 57 (26%) 17(8%) 21(9%) 38 (17%) 220 (100%)r =3093.00, # = 12, p < .0005 Source: Field research data
Table 32 Participation in Technology D evelopment by Adoption CategoryAdoption Participation in technology developmentcategories None Low Medium High TotalsNone 41 (98%) 43 (73%) 3 (8%) 0 (0%) 87 (40%)Low 1(2%) 4(7%) 6(16%) 5 (6%) 16 (7%)Medium 0 (0%)1 12 (20%) 24 (65%) 65 (79%) 101 (46%)High 0(0%) 0(0%) 4(11%) 12(15%) 16 (7%)Totals 42(19%) 59(27%) 37(17%) 82 (37%) 220(100%)X =1.412E2, # = 3, p < .005 Source: Field research dataTable 33 Gender o f H ousehold H ead by Participation CategoryParticipation GenderCategories Male Female TotalsNone 32 (20%) 10(18%) 42(19%)Low 44 (27%) 15(27%) 59 (27%)Medium 29(18%) 8 (14%) 37(17%)High 59 (36%) 23 (41%) 82(37%)Totals 164(75%) 56 (25%) 220(100%)t = 0.637,#= 3,p < .888Source: Field research data
168

Table 34 A ge o f H o u se h o ld H ea d by P artic ipa tion CategoryPancipationcategories Age of household head
TotalsYoung Middle-aged OldNone 13 (25%) 17(13%) 12(29%) 42 (19%)Low 13 (25%) 33 (26%) 13 (32%) 59 (27%)Medium 11 (21%) 23 (18%) 3 (7%) 37(17%)High 15 (29%) 54 (43%) 13 (32%) 82(37%)Totals 52 (24%) 127 (58%) 41 (18%) 220(100%)X - 10.981, d f= 6 ,p = .0 8 9 S o u rce : F ie ld re s e a rc h d a ta
Table 3 5 E d u ca tio n L e v e l o f th e H o u se h o ld H ea d by P articipation CategoryEducation level of household head
Participationcategories
No formal Lower education primary
Upperprimary
Post-Secondary secondary Totals
None 7 (39%) 34 (54%) 0 (0%) 1 (1%) 0 (0%) 42 (19%)Low 4 (22%) 23 (37%) 17 (57%) 15(17%) 0 (0%) 59 (27%)Medium 2(11%) 4(7%) 8 (26%) 22 (25%) 1 (5%) 37(17%)High 5 (28%) 1 (2%) 5 (17%) 50 (57%) 21 (95%) 82 (37%)Totals 18 (8%) 62 (28%) 30 (14%) 88 (40%) 22(10%) 220 (100%)X = 1744.00, df -9 ,p < .0005Source: Field research dataTable 36 H ouseho ld H e a d ’s O ccupa tion bv P articipation C ategoryParticipation Occupation of the household headcategories Part-time farmer Full-time fanner TotalsNone 7 (20%) 35(19%) 42 (19%)Low 9 (26%) 50 (27%) 59 (27%)Medium 7 (20%) 30(16%) 37 (17%)High 12 (34%) 70 (38%) 82 (37%)Totals 35 (16%) 185 (84%) 220 (100%)X -10.981. df= 6,p = 0.089 Source: Field research data
169

Table 37 M a r ita l S ta tu s by Participation C a tegory
Participationcategories ---- *-------------
Marital statusSingle
Married, Married, monogamous polygamous Totals
None 3 (19%) 32 (20%) 7 (16%) 42 (19%)Low 4 (25%) 41(26%) 14(33%) 59 (27%)Medium 5 (31%) 26(16%) 6(14%) 37 (17%)High 4 (25%) 62(39%) 16(37%) 82 (37%)Totals 16 (7%) 161 (73%) 43 (20%) 220(100%)I' =3.836, d f— 6 , p =; .699 Source: Field research data
Table 38 L a n d S ize by Participation CategoryLand size
Participationcategories Small scale
Medium scale to large scale Totals
None 29 (18%) 13 (22%) 42 (19%)Low 44 (27%) 15 (25%) 59 (27%)Medium 28 (17%) 9 (15%) 37(17%)High 60 (37%) 22 (38%) 82 (37%)Totals 161 (73%) 59 (27%) 220 (100%)3f = 5.430,#= 3, p = .490 Source: Field research dataTotal 39 H ousehold size by Participation CategoryParticipation Total household size (number of people)categones 1-5 6-10 >10 TotalsNone 11 (26%) 23(17%) 8(21%) 42(19%)Low 10 (24%) 41(30%) 7(18%) 59 (27%)Medium 7(17%) 24(17%) 6(15%) 37 (17%)High 14(33%) 50 (36%) 18(46%) 82 (37%)Totals 42 (19%) 139 (63%) 39(18%) 220 (100%)\ = 4.634, d f - 6,p = .592 Source: Field research data
170

40 d u m b e r o f Children under the A ge o f 5 Years by Participation CategoryParticipation Number of children under 5 years of agecategories 0 1-5 TotalsNone 15 (16%) 28 (21%) 42 (19%)Low 25 (16%) 34 (27%) 59 (27%)Medium 16(17%) 21 (17%) 37(17%)High 36 (39%) 46 (36%) 82 (37%)Totals 92 (42%) 128 (58%) 220(100%)X'=4.89 !,<*/= 3,/? = .558 Source: Field research data
Table 41 R eported a n n u a l Incom e by Participation CategoryParticipation Reported annual incomecategories Low income Medium income High income TotalsNone 4 (19%) 19 (17%) 19 (22%) 42 (19%)Low 6 (29%) 34(30%) 19(22%) 59 (27%)Medium 5 (24% 14 (13%) 18 (21%) 37(17%)High 6 (29%) 45(40%) 31(36%) 82 (37%)Totals 21 (10) 112(51%) 87(39%) 220(100%)r = 5.331 ,d f= 6,p = .502 Source: Field research data
Table 42 L ivestock N um bers by Participation CategoryParticipation Livestock numberscategories No livestock At least one animal TotalsNone 4(16%) 38 (20%) 42(19%)Low 10(40%) 49 (25%) 59 (27%)Medium 3 (12%) 34 (17%) 37(17%)High 8 (32%) 74 (38%) 82 (37%)Totals 25(11%) 195 (89%) 220(100%)X =2.793, d f = 5, p = .834Source: Field research data
171

Table 43 Wealth S ta tus by Participatio n CategoryParticipation Wealth statuscategories Low class Medium class High class TotalsNone 23 (18%) 14(19%) 5 (29%) 42 (19%)Low 40 (31%) 15 (21%) 4 (24%) 59 (27%)Medium 16(12%) 19(26%) 2 (10%) 37(17%)High 51 (39% 25 (34%) 6 (35%) 82 (37%)Totals 130 (59%) 73 (33%) 17 (8%) 220(100%)X ~ 8.820, df= 6, p = . 184 Source: Field research data
Table 44 Contact with M O ALD Extension agents bv Participation CategoryParticipation Contact with MOALD extension agentscategories Non-contact farmer Contact farmer TotalsNone 37 (26%) 5 (6%) 42 (19%)Low 46 (33%) 13 (16%) 59 (27%)Medium 25 (18%) 12 (15%) 37(17%)High 32 (23%) 50 (63%) 82 (37%)Totals 140 (64%) 80 (36%) 220 (100%)X = 37.806,#= 3, p < .0005 Source: Field research data
Table 45 M em bership in Social Organisations by Participation CategoryParticipation Number of social organisationscategories 0 1-5 6-10 TotalsNone 8 (18%) 22 (22%) 12(16%) 42 (19%)Low 16(36%) 24 (25%) 19 (25 %) 59 (27%)Medium 6 (13%) 12(12%) 19 (25%) 37(17%)High 15(33%) 40 (41%) 27 (35%) 82(37%)Totals 45 (21%) 98 (44%) 77 (35%) 220(100%)r s 7.715, df= 6,p = .260 Source: Field research data
172

Participation N um ber o f v is its by collaboratorscategories 0 1 2 T o ta lsNone 19(49%) 23 (37%) 0 (0%) 42(19%)Low 18(47%) 34 (55%) 7 (6%) 59 (27%)Medium 2 (4%) 5 (8%) 30 (25%) 37(17%)High 0 (0%) 0 (0%) 82 (69%) 82 (37%)Totals 39 (18%) 62 (28%) 119(54%) 220 (100%)t = 2030.00,#= 6, p < . 0005Source: F ie ld research data
T ab le 4 7 Project Awareness by Participation CategoryParticipation Project aw aren esscategories N o t aw are Aware TotalsNone 22 (100%) 20 (10%) 42 (19%)Low 0 (0%) 59 (30%) 59 (27%)Medium 0 (0%) 37 (19%) 37 (17%)High 0 (0%) 82 (41%) 82 (37%)Totals 22 (10%) 198 (90%) 220 (100%)*2= 1036.00, df= 3, p < .0005 Source: F ie ld research data
Table 48 Knowledge o f Technology by Participation Category
ParticipationcategoriesK n o w le d g e o f technology
L im itedknow led ge
A ve ra g e H igh k n o w led ge know ledge T otals
None 10 (67%) 28 (22%) 4 (5%) 42 (19%)Low 4 (27%) 48 (38%) 7 (9%) 59 (27%)Medium 1 (6%) 19(15%) 17(21%) 37(17%)High 0 (0%) 31 (25%) 51 (65%) 82 (37%)Totalsv — “tz inn jr
15 (7%) 126 (57%) 79 (36%) 220(100%)
Source: Field research data
173

Jable 49 Attendance a t Training Sessions by Participation CategoryParticipation ___ _________ Total trainings attended_______categories No training 1-2 trainings 3-5 trainings TotalsNone 42 (63%) 0 (0%) 0 (0%) 42(19%)Low 24 (36%) 34 (53%) 1 (1%) 59 (27%)Medium 1 (1%) 29 (45%) 7 (8%) 37(17%)High 0 (0%) l (2%) 81 (91%) 82(37%)Totals 67(30%) 64(29%) 89(41%) 220(100%)X* = 3012.00, df= 9,p< .0005 Source: Field research data
Table 50 Technology Option Adopted by Participation CategoryTechnology option adoptedParticipation
categories None Napier adopted only Napier +
DesmodiumNapier + Melinis
Napier +beans Totals
None 42 (48%) 0 (0%) 0 (0%) 0 (0%) 0 (0%) 42 (19%)Low 42(48%) 7(12%) 0 (0%) 2 (9%) 8 (20%) 59 (27%)Medium 3 (4%) 19 (34%) 5 (29%) 5 (24%) 5(13%) 37(17%)High 0 (0%) 30 (54%) 12 (71%) 14 (67%) 26 (67%) 82 (37%)Totals 87 (39%) 56 (25%) 17(8%) 21 (10%) 39(18%) 220(100%)r = 1611.00,#= 12,p <.0005 Source: Field research data
Table 51 Hosts o f Project Trials by Adoption CategoryAdoption Hosts of project trialscategories Project fanners Non-project fanners TotalsNone 0 (0%) 87 (79%) 87 (40%)Low 9 (8%) 7(6) 16(7%)Medium 86 (78%) 15 (14%) 101 (46%)High 15 (14%) 1 (1%) 16(7%)Totals 110(50%) 110(50%) 220(100%)r =1494.00, df~ 3,p < .005 Source: Field research data
174

Table 52 C o r r e la t io n s o f P e r s o n a l C h a ra c te r is tic s a n d R e s p o n s e V a r ia b le s o f A d o p t io n
Measure Adoption Gender Maritalstatus
Age Education Occupation
1. Adoption 1.0 -.067 -.060 -.012 .115* -.0362. Gender 1.0 -.259** .062 .197** .0873.Marital status
- 1.0 .012 -.068 .016
4. Age - - 1.0 -.401** .268**5. Education - - - 1.0 .3446.Occupation
- - - - 1.0
*p < .05, **p < .005
Source: Field research dataTable 53 R egression o f P erso n a l C haracteristic on T e ch n o lo g y A d o p tio n
B SEB B T Sig.Constant 22.682 3.556 6.379 .000Gender -1.590 .958 -.119 -1.660 .098Mantal status -.662 .594 -.078 -1.114 .266Age .026 .039 .048 .640 .523Education .285 .126 A l l 2.273 .024*Occupation 1.151 1.59 -.072 -.993 .322■ \ote. R2 = .1 8 7 ; F (5 , 2 1 4 ) = 1 .5 5 6 ; number of observations = 2 2 0 , p = .1 7 4 . p < .05, **p < .0 0 5 , Source: Field research data
175
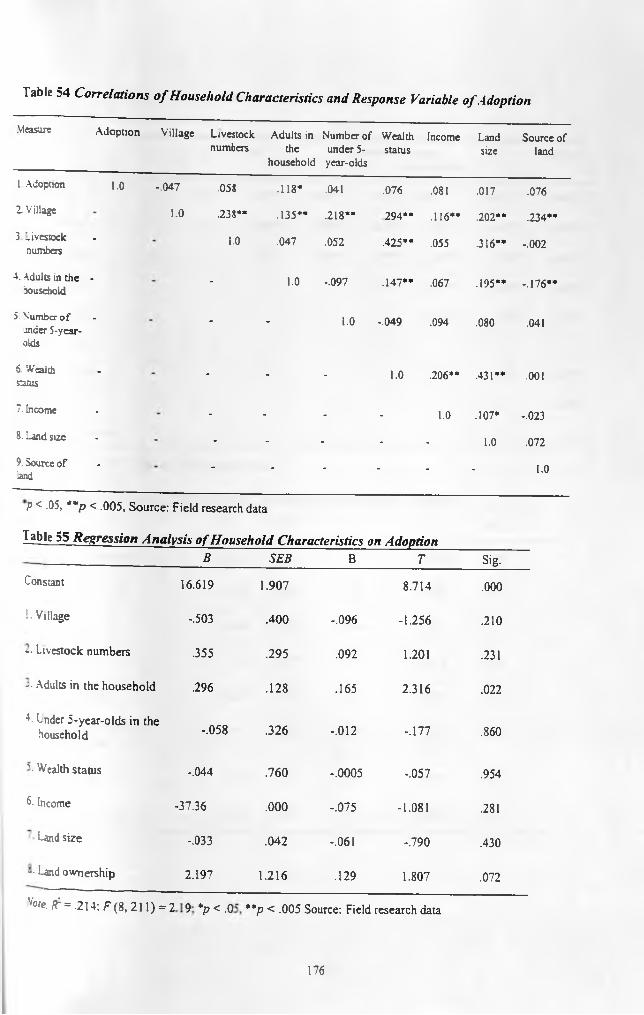
Table 54 C o rre la tio n s o f H o u se h o ld C haracteristics a n d R espo nse Variable o f A d o p tio n
Measure Adoption Village Livestocknumbers
Adults in the
household
Number of under 5- year-olds
Wealthstatus
Income Landsize
Source of land
1 Adoption 1.0 -.047 .058 .118* .041 .076 .081 .017 .0762 Village 1.0 .238** .135** .218** 294** .116** .202** .234**
3 Livestock numbers
* 1.0 .047 .052 .425** .055 JI6** -.002
4. Adults in the household
- - 1.0 -.097 .147** .067 .195** -.176**
5. Number of under 5-y ear- olds
- - - i.O -.049 .094 .080 .041
6. W eaithszmis - - - - 1.0 .206** .431** .001
7. Income - - - - - 1.0 .107* -.023
8. Land size - - - - - - 1.0 .072
9. Source of land
- - - - - - - 1.0
p < .0 5 , **p < .0 0 5 , S o u rc e : F ie ld re sea rch d a ta
Table 55 Regression A nalysis o f H ousehold Characteristics on AdoptionB SE B B T Sig-
Constant 16.619 1 .9 0 7 8 .7 1 4 .000
T V illage -.503 .4 0 0 - .0 9 6 -1 .2 5 6 .210
-■ L ivestock n u m b e rs .355 .2 9 5 .092 1.201 .231
-• Adults in th e h o u s e h o ld .296 .1 2 8 .165 2 .3 1 6 .022
4- L nder 5 -y e a r-o ld s in th e h o u seho ld - .0 5 8 .3 2 6 - .0 1 2 - A l l .860
'• W ealth s ta tu s -.044 .7 6 0 -.0 0 0 5 -.0 5 7 .954
5- Income -3 7 .3 6 .0 0 0 -.0 7 5 -1 .081 .281
Land size -.033 .0 4 2 -.061 -.7 9 0 .430
-• Land o w n ersh ip 2 .1 9 7 1 .2 1 6 .1 2 9 1.807 .072
v°fe. ^ = . 2 1 4 ^ ( 8 , 2 1 1 ) = K> VO
•a*
A b **p < .0 0 5 S o u rce : F ie ld re s e a rc h d a ta
176

Table ?6 C o rre la tio n s o f C o m m un ica tion Variables a n d R esp o n se Variables o f A d o p tio n
Adoption Awareness Fannertype
Knowledge Contact fanner
Membership in social organisations
Participation Perceivedbenefits
1 Adoption 1.0 .379** .825** .652** .334** .268** .790** .696**
2. Awareness - 1.0 .342** .306** .166* .026 O O * « .284**
3. Farmer type - - 1.0 .581** .397** .148* .879** .640**
4 Knowledge - - - 1.0 322** .259** .558** .618**
5. Contact farmer - - - - 1.0 .107* .435** .321**
6. Membership in m .socialorgan isanons 1.0 .078 .334**
7. Participation - - - - - - 1.0 .604**
8- Perceived benefits - - - - - - - 1.0
mp < .05 , *“p < .0 0 5 , S o u rc e : F ie ld re s e a rc h d a ta
Table 57 Regression o f Communication Variables on Technology AdoptionB SEB P T sig
1.A d o p tio n (R e s p o n s e ) 10 .414 .7 6 0 13.696 .000
2. A w a re n e ss 1 .067 .6 9 6 .156 2 .5 3 3 m i
3. F a n n e r ty p e 4 .8 0 4 .856 .4 1 0 5 .6 1 2 .000
4- K n o w le d g e 0 .2 6 5 .0 7 7 .155 3 .4 6 0 .001
5. C o n tac t fa rm e r -0 .6 5 4 .4 4 9 -.1 5 4 -2 .4 5 7 .047
6 M em b ersh ip in so c ia l o rg an isa tio n s
0 .4 4 5 .163 .098 2 .7 2 6 .007
2- P artic ip a tio n 0 .2 3 3 .073 .237 3 .203 .002
P erce iv ed B en efits 0 .7 0 0 .2 0 9 .163 3 .3 5 6 .001
111

Source: Field research data
Table 58 Correlation between Personal Characteristics and Participation
P a r t ic ip a tio n G e n d e r M arita ls ta tus
A g e E d u ca tio n O c c u p a tio n
1. P artic ip ation 1.0 -.037 -.019 .0 3 6 .1 2 2 * -.0 0 72. G en d er - 1.0 -.2 60** .0 5 3 .2 1 4 * * -.1 1 2 *3. M an ta l s ta tus - - 1.0 .0 1 2 - .0 6 8 -.0 1 64. A ge - - - 1.0 - .4 0 1 * * .268**5. E ducation - - - - 1.0 -.3 4 4 * *
6. O ccu p a tio n - - - - - 1.0Source: Field research data
Table 59 Regression o f Personal Characteristics and Participation
Measure B SEB P t Sig1. Constant 7.273 3.651 2.184 .0302. Gender -0.843 0.966 -.062 -0.842 .4533. Marital Status -0.281 0.614 -.032 -0.458 .6484. Age 0.034 0.040 .065 0.857 .3935. Education 0.089 0.130 .054 0.691 .0456. Occupation -0.220 1.200 -.014 -0.183 .855Vote. R .081; F (5, 214) = .281; number of observations = 220.*P < 05, **p < .005 Source: Field research data
178

Table 60 C o r r e la t io n b e tw e e n H o u s e h o ld C h a r a c te r is t ic s a n d P a r t ic ip a t io n
Measure Participation Village Yield/acre Livestocknumbers
Householdsize
Labour
1. Participation 1.0 -.095 -.042 .030 .125* .143
2. Village - 1.0 .154 .238 .176 .135
3. Yield/acre - - 1.0 .225 .080 .065
4. Livestock numbers - - - 1.0 .078 .047
5. Household size - - - - 1.0 .834
6. l abour • - - - - 1.0
7. Under 5-year-olds in the household - - - - - -
8. Weallh status - - - - - -
9. Income - - - - - -
10. Land size - - - - - -
11. Land ownership - - - - - -
*p < .05. **p < .005.Source: Field research data
179

Under 5- year-olds
in Ihe household
Wealthstatus
Income Laud size Landownership
-.014 .031 -.080 .057 .055
.218 .271 .116 .202 .234
.015 .152 .057 .043 012
.052 .460** .055 .316** -.002
.370 .088 .102 .155 -.166
-.097 127 .067 .195** -.176**
1.0 -.037 .094 -.080 .041
- 1.0 .247** .467** -.004
- - 1.0 .107* -.023
- - - 1.0 .072
- - - - 1.0

Table 61 R e g r e s s io n b e tw e e n H o u s e h o ld C h a ra c te r is tic s a n d P a r t ic ip a tio n
Measure B SEB B T Sig.
Constant 4.872 2.610 1.866 .063
1. Village -.909 .409 -.171 -2.223 .027
2. Yield/acre -.067 .105 -.045 -.642 .522
3. Livestock numbers .163 .309 .041 .528 .598
4. Household size .036 .322 .024 . 1 1 2 .911
5. Labour .305 .370 .167 2.258 .025
6. Under 5-year-olds in the household .170 .582 .036 .292 .771
7. Wealth status .192 .156 .097 1.225 .222
8. Income -4587.00 .000 o -1.573 .117
9. Land size .0 12 .043 .021 .271 .787
10. Source of land 2.158 1.237 .124 1.744 .083
-Note. R2 = .251; ^ (10, 209) = 1.404; number of observations - 220. *p < .05, **p < .005 Source: Field research data
180

Table 62 C o r r e la t io n b e tw e e n C o m m u n ic a t io n V a r ia b le s a n d P a r tic ip a tio n
M easure P a r tic ip a tio n A w a re n e ss F a n n e rtype
K n o w le d g e C o n tac t fa rm er
M e m b e rsh ip in s o d a l
o rg a n isa tio n s
P erce iv edb en efits
1. P a rn d p a tio n 1.0 .4 0 6 * * .879** .55 8 * * .435** .078 .604**
2. A w aren e ss - 1.0 .342** .30 6 * * .166** .026 .284**
3. F irm e r ty p e - - 1.0 .5 8 1 * * .397** .1 4 8 * * .640**
4. K n o w le d g e - - - 1.0 .322** .25 9 * * .618**
5. C o n tac t fa rm e r - - - 1.0 .1 0 7 * * .321**
6. M em b ersh ip insocialo rg an isa tio n s - - -
1.0 .334**
7. P erce iv ed b e n e fits - - - - 1.0
* p<0.05, **p<0.005Source: F ie ld resea rch d a ta
Table 63 Regression between C om m unication Characteristics and Participation
B SE B B t S ig .
l. P a ra d p a tio n - .2 8 9 .7 1 6 -.403 .687
2. A w areness 2 .0 3 5 .641 .105 3 .1 7 3 .0 0 2
3. Farmer ty p e 8 .9 9 4 .521 .755 17.266 .0 0 0
4. K now ledge .067 .0 7 2 .039 .933 .352
5- C ontact fa rm er 1 .159 .4 1 6 .094 2 .7 8 8 .0 0 6
C M em bership in soc ia l organisations -.3 5 8 .1 5 2 -.0 7 7 -2 .3 6 0 .019
" Perceived b en efits .275 .1 9 6 .063 1 .404 .1 6 2
-'*ofe. R~ = .801; adjusted R2 = .795; F = 1.971 * ; number of observations = 220 .*? < .05, * * p < .005 S o u rc e : F ield re sea rch d a ta
181
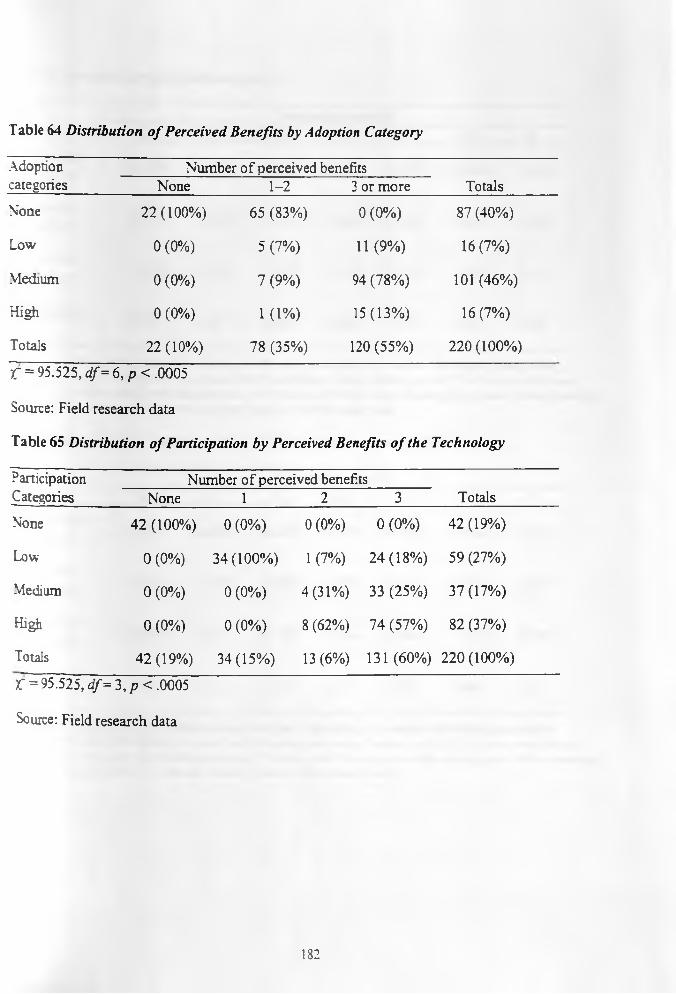
Table 64 D is tr ib u t io n o f P e r c e iv e d B e n e f i t s b y A d o p tio n C a te g o r y
Adoptioncategories
Number of perceived benefitsTotalsNone 1 - 2 3 or more
None 2 2 ( 100%) 65 (83%) 0 (0%) 87 (40%)Low 0 (0%) 5 (7%) 11 (9%) 16 (7%)Medium 0 (0%) 7 (9%) 94 (78%) 101 (46%)High 0 (0%) 1 ( 1 %) 15 (13%) 16(7%)Totals 22 ( 10%) 78 (35%) 120 (55%) 220 (10 0%)r = 95.525,df= 6 , p < .0005Source: Field research dataTable 65 Distribution o f Participation by Perceived Benefits o f the Technology
Participation Number of perceived benefitsCategories None 1 2 3 TotalsNone 42 (100%) 0 (0%) 0 (0%) 0 (0%) 42 (19%)Low 0 (0%) 34(100%) 1(7%) 24(18%) 59 (27%)Medium 0 (0%) 0(0%) 4(31%) 33 (25%) 37(17%)High 0 (0%) 0 (0%) 8 (62%) 74 (57%) 82 (37%)Totals 42(19%) 34(15%) 13(6%) 131(60%) 2 2 0 (100%)X = 95.525, df= 3, p < . 0005 Source: Field research data
132

Table 66 B a s e l in e B e n e f i t —C o s t A n a ly s is
Technology option1Ai a 2 a 3 B C E F
Total benefits/ acre (Ksh) 19,408 24,680 18,200 22,596 23,280 14,040 17,280
Total costs/ acre (Ksh) 8,170 9,590 7,030 8,660 10,262 8,025 9,145
Net benefits/' acre (Ksh) 11,238 15,090 11,170 13,936 13,018 6,015 8,135
Benefit-costratio 2.38 2.57 2.59 2.61 2.27 1.74 1.89
lA = m aize w ith N a p ie r g ra s s b o rd e r p lan tin g , D A P , a n d 1 p lo u g h in g ; A 2 = m a iz e w ith N a p ie r g ra s s b o rd e r p lanting, D A P , a n d 2 p lo u g h in g s ; A 3 . m a iz e w ith N a p ie r g rass b o rd e r p la n tin g , no D A P ; B = m a iz e w ith N a p ie r grass bo rd er p la n tin g a n d D esm odium in te rc ro p ; C = m a ize , w ith N a p ie r g ra s s b o rd e r p la n tin g a n d M elim s in te rc ro p ; E = n o s u lk b o re r c o n tro l; F = c h e m ic a l co n tro l. S o u rc e : Field resea rch d a ta
Table 67 B e n e fit-C o st Analysis i f Cost o f Production Increases by 20%
Technology option*A; a 2 a 3 B C E F
Total benefits/ acre (Ksh) 19,408 24,680 18,200 22,596 23,280 14,040 17,280
Total costs/ acre (Ksh) 9,804 11,508 8,436 10,392 12,314 9,630 10,974
Net benefits/ acre (Ksh) 9,604 13,172 9,764 12,204 10,966 4,410 6,306
Benefit-costratio 1.98 2.14 2.16 2.17 1.89 1.46 1.57
A' = maize w ith N a p ie r g ra s s b o rd e r p lan tin g , D A P , a n d 1 p lo u g h in g ; A 2 = m a iz e w ith N a p ie r g ra s s b o rd e r planting, D A P , an d 2 p lo u g h in g s ; A 3 , m a iz e w ith N a p ie r g rass b o rd e r p la n tin g , n o D A P ; B = m a iz e w ith N a p ie r grass border p lan tin g a n d D esm odium in te rc ro p ; C = m a ize , w ith N a p ie r g ra s s b o rd e r p la n tin g a n d M elin is in te rc ro p ; E = no s u lk b o rer c o n tro l; F = c h e m ic a l con tro l. S o u rc e : F ield resea rch d a ta
183

Table 68 B e n e f i t - C o s t A n a ly s i s i f C o s t o f P r o d u c tio n D e c r e a s e s b y 2 0 %
Technology option1A, a 2 A3 B C E F
Total benefits/ acre (Ksh) 19,008 24,280 17,800 22,326 22,930 14,040 17,280
Total costs/' acre (Ksh) 8,170 9,590 7,030 8,660 10,262 8,025 9,145
Net benefits/ acre (Ksh) 10,838 14,690 10,770 13,666 12,668 6,015 8,135
Benefit-costratio 2.33 2.53 2.53 2.58 2.23 1.74 1.89
*Ai = m a ize w ith N a p ie r g ra s s b o rd e r p la n tin g , D A P , an d 1 p lo u g h in g ; A 2 = m a iz e w ith N a p ie r g ra s s b o rd e r p lanting, D A P , a n d 2 p lo u g h in g s ; A 3 , m a iz e w ith N a p ie r g rass b o rd e r p la n tin g , n o D A P ; B = m a iz e w ith N a p ie r grass b o rd e r p la n tin g a n d D esm odium in te rc ro p ; C = m a ize , w ith N a p ie r g ra s s b o rd e r p la n tin g a n d M elinis in te rc ro p ; E = n o s ta lk b o re r c o n tro l; F = c h e m ic a l c o n tro l. S o u rc e : F ield re se a rc h d a ta
Table 69 B enefit-C o st Analysis i f Price o f Napier Grass Increases by 20%
Technology option*A, a 2 a 3 B C E F
Total benefits/ acre (Ksh) 19,808 25,080 18,600 22,866 23,630 14,040 17,280
Total costs/ acre (Ksh) 8,170 9,590 7,030 8,660 10,262 8,025 9,145
Net benefits/ acre (Ksh) 11,638 15,490 11,570 14,206 13,368 6,015 8,135
Benefit-costratio 2.42 2.62 2.65 2.64 2.30 1.74 1.89
Ai = m aize w ith N a p ie r g ra s s b o rd e r p la n tin g , D A P , an d 1 p lo u g h in g ; A 2 = m a iz e w ith N a p ie r g ra s s b o rd e r r-anting, D A P , an d 2 p lo u g h in g s ; A 3 . m a iz e w ith N a p ie r g rass b o rd e r p la n tin g , no D A P ; B = m a iz e w ith N a p ie r p s s border p lan tin g a n d D esm odium in te rc ro p ; C = m aize , w ith N a p ie r g ra s s b o rd e r p la n tin g a n d M elin is in te rc ro p ; - = no sta lk b o re r c o n tro l; F = c h e m ic a l co n tro l. S o u rc e : Field re sea rch d a ta
184

Table "0 B e n e f i t—C o s t A n a ly s is i f M a iz e P r ic e D r o p s b y 2 0 %
Technology option3Ai a 2 a 3 B C E F
Total benefits/ acre (Ksh) 15,926 20,144 14,960 19,248 19,068 11,232 13,824
Total costs/ acre (Ksh) 8,170 9,590 7,030 8,660 10,262 8,025 9,145
Net benefits/ acre (Ksh) 7,756 10,554 7,930 10,588 8,806 3,207 4,679
Benefit-costratio 1.95 2.10 2.13 2.22 1.86 1.40 1.51
1A| = m aize w ith N a p ie r g ra s s b o rd e r p la n tin g , D A P , a n d 1 p lo u g h in g ; A 2 = m a iz e w ith N a p ie r g ra s s b o rd e r planting, D A P , an d 2 p lo u g h in g s ; A 3 . m a iz e w ith N a p ie r g rass b o rd e r p la n tin g , n o D A P ; B = m a iz e w ith N ap ier grass b o rd e r p la n tin g a n d D esm odium in te rc ro p ; C = m a ize , w ith N a p ie r g ra s s b o rd e r p la n tin g a n d M elinis in te rc ro p ; E = no s ta lk b o re r c o n tro l; F = ch em ica l co n tro l. S o u rc e : F ield re sea rch d a ta
Table 71 B en e fit-C o st Analysis i f M aize Increases by 20%
Technology option8A, a 2 a 3 B C E F
Total benefits/ acre (Ksh) 22,890 29,216 21,400 25,944 27,492 16,848 20,736
Total costs/ acre (Ksh) 8,170 9,590 7,030 8,660 10,262 8,025 9,145
Net benefits/ acre (Ksh) 14,720 19,626 14,370 17,284 17,230 8,823 11,591
Benefit-costratio 2.80 3.05 3.04 2.99 2.67 2.10 2.27
A = m aize w ith N a p ie r g ra s s b o rd e r p la n tin g , D A P , an d 1 p lo u g h in g ; A 2 = m a iz e w ith N a p ie r g r a s s b o rd e r planting, D A P , an d 2 p lo u g h in g s ; A 3, m a iz e w ith N a p ie r g rass b o rd e r p la n tin g , n o D A P ; B = m a iz e w ith N a p ie r ? a ss border p la n tin g a n d D esm odium in te rc ro p ; C = m a ize , w ith N a p ie r g ra s s b o rd e r p la n tin g a n d M elinis in te rc ro p ; E = no stalk b o re r c o n tro l; F = ch e m ic a l c o n tro l.S o u rc e : F ield re sea rch d a ta
185

APPENDIX B
INTERVIEW SCHEDULE FOR FARMERS IN TRANS NZOIA DISTRICT
Date--------------- -------- --------
Quesr.onnaire In tro du c tion
Tunataka k u j u a m a m b o k u h u s u m rad i w a k u z u ia m a b u u aina ya s ta lk b o r e r y a n ay o h a r ib u m a h in d i. T u ta k u sh u k u ru
S a n a k w a m s a a d a u ta k a o tu p a tia k u p itia k u jib u m asw ali tu ta k a y o k u u liza .
Name o f h o u s e h o ld h e a d --------------------------------------------------------------------------G e n d e r : (1 ) F e m a le (0 ) M a le
Respondent’s position on the farm if no t household h e a d ------------------------------------------------------------------
Location------------------------------------------- S u b -lo c a tio n --------------------------------------------- V illa g e -------------------------------
Are you a w a r e o f th e s te m b o re r co n tro l p ro je c t? Y e s / N o
1 f yes. w h e n d id y o u b e c o m e aw a re o f th e p ro je c t? (1 ) 1997 (2 ) 1998 (3 ) 199 9 (4 ) 2 0 0 0
•) P roject f a r m e r (2 ) N o n -p ro je c t fa rm e r
• project fa rm e r , w h e n d id you jo in th e p ro je c t? (1 ) 1998 (2) 1999 (3 ) 2 0 0 0
Why did y o u d e c id e to j o i n the p ro je c t---------------------------------------------------------------------------------------------------------------------------
Technology O p tio n (1 ) A (2 ) B (3) C (4 ) D (5 ) N o n e
Crop a n d l iv e s to c k f a r m in g :
Land p r e p a r a t i o n / c r o p e s ta b l i s h m e n t
*0- A creage-------------------------
‘-ana p rep a ra tio n : D a te -------------------------------------------------- M ean s (trac to r, o x p lo u g h , hand)-
186

V a rie ty o f m a i z e ---------------------------------------------------------------------------------------------------------------------------------------
P lan tin g fe r ti l iz e rs u sed for m a iz e -----------------------------------------------------------------------------------------------------------
N a p p ie r g ra s s v a r ie ty p la n ted ---------------------------------------------------------------------------------------------------------------------
N u m b e r o f t im e s P lo u g h e d -----------------------------------------------------------------------------------------------------------------------
W h e th e r in te rc ro p p e d b ean s o r n o t ----------------------------------------------------------------------------------------------------------
P lan tin g d e s ig n u s e d (ro w p la n tin g o r b ro a d c a s t in g ) ------------------------------------------------------------------------------
S p a c in g ------------------------------------------------------------------------------------------------------------------------------------------------------
C r o p p r o te c t io n
N a p p ie r g ra ss p la n t in g d e sig n u se d (B o rd e r p la n tin g o r m o n o c ro p )---------------------------------------------------------
W h e th e r D e s m o d iu m in te rc ro p p e d o r n o t -------------------------------------------------------------------------------------------------
W h e th e r M elin is in te rc ro p p e d o r n o t ------------------------------------------------------------------------------------------------------
C ro p m a n a g e m e n t
N u m b er o f t im e s m a iz e w e e d e d ---------------------------------------------------------------------------------------------------------------
T ype o f fe r t i l iz e r a p p lie d on N a p p ie r g ra s s ------------------------------------------------------------------------------------------------
N u m b er o f t im e s N a p p ie r g rass w e ed e d ----------------------------------------------------------------------------------------------------
N u m b er o f t im e s D e sm o d e u m w e e d e d -------------------------------------------------------------------------------------------------------
N u m b er o f t im e s M elin is w e e d e d --------------------------------------------------------------------------------------------------------------
T op d re ss in g f e r t i l iz e r u sed on m a iz e --------------------------------------------------------------------------------------------------------
H a rv e s t in g
A ge o f N a p p ie r g ra s s a t firs t c u ttin g (n u m b e r o f m on ths/ d ay s a f te r p la n t in g ) -----------------------------------------
A ge o f N a p p ie r g ra s s a t se c o n d c u t t i n g ----------------------------------------------------------------------------------------------------
W hen w as th e m a iz e h a rv e s te d a n d s to r e d -----------------------------------------------------------------------------------------------
W hen w as D e s m o d e u m c u t------------------------------------------------------------------------------------------------------------------------
H o w m a n y t im e s w a s D e sm o d iu m c u t ------------------------------------------------------------------------------------------------------
W hen w as D e s m o d e u m seed s h a rv e s te d ---------------------------------------------------------------------------------------------------
W hen w as M elin is c u t--------------------------------------------------------------------------------------------------------------------------------
Y ie ld
187

34. Maize (in 90 Kg bags):— — bags Nappier grass (in number of wheelbarows or bags)------------------------- D e sm o d e u m ---------------------- M e lin is -----------------
C r o p s g r o w n o n th e fa rm :
3 5 . C r o p / F o d d e r A c re a g e
36. L iv e s to c k k e p t :
L iv e s to c k t y p e N u m b e r
L o ca l c a t t le --------
G ra d e c a ttle --------
G ra d e / L o ca l c ro s s e s --------
S heep a n d g o a ts --------
Im p ro v e d p o u ltry -------
L ocal b ird s -------
D o n k ey s -------
Pigs -------
A ttendance to p r o j e c t e d u c a t io n a l / e v a lu a t io n a c tiv itie s
A c tiv ity N u m b e r a t te n d e d p e r year W h a t th e fa rm e r leam t
f ro m th e
a c t iv i ty
R o le o f f a n n e r in
th e
a c tiv ity
1998 1999 2 0 0 0
| 37. T ra in in g w o rk sh o p
38. F a rm e rs ’ f ie ld d ay s
; 39 E v a lu a tio n f ie ld
d ay s
] 40. E d u c a tio n a l to u rs
188

W e re an y o f th e ed u ca tio n ac tiv in es e v e r h e ld on y o u r fa rm ? Y e s / N o
I f y e s , w h ich o n e s ? -------------------------------------------------------------------------------
A c cess to te c h n o lo g y re la te d in f o r m a t io n a n d e x te n s io n s e rv ic e s
A re y o u a c o n ta c t fa rm er? (a) Y e s (b ) N o
V is its by p ro je c t c o llab o ra to rs
| C o lla b o ra to r N u m b e r o f v isits P u rp o se
1C IPE
VIOA
K A R I
O th e r fa n n e rs
C o n tr ib u tio n s b y p ro je c t co llab o ra to rs
C o lla b o ra to r T y p e a n d am o u n t o f c o n tn b u tio n
IC IPEi _ _ _ _ _ _ _ _ _ _ _ _ _ _ _ _ _ _ _ _ _ _ _ _ _ _ _ _ _ _ _ _ _ _ _ _ _ _ _ _ _ _ _ _ _ _ _ _ _ _ _ _ _ _ _ _ _ _ _ _
M OA
1 KA RI
O th e r fa rm ers
F a n n e r ’s s o u rc e s o f ex ten s io n in fo rm a tio n
farm v is its -------------a tte n d a n c e o f fa rm er c o u rs e s ---------------- farm d e m o n s tra tio n ------------- f ie ld d a y s ------------------
N e ig h b o u rs -------------------------------- o th e rs ( s ta te ) ----------------------------
T e c h n o lo g y a d o p tio n a n d ad ap ta tio n to f a n n e r s ’ s itu a tio n
45. W h ich a s p e c ts o f th e te c h n o lo g y h a v e y o u a d o p te d a n d so u rce o f in fo rm a tio n th a t a c c o u n te d fo r ad op tion?
Activities/' te c h n o lo g ie s ad o p ted S o u rce o f in fo rm a tio n
189

4 6 . H a v e y o u m a d e an y m o d ific a tio n s to th e tech n o lo g y ? Y es / N o
I f y e s , in d ic a te :
T y p e o f te c h n o lo g y A d ap ta tio n s R easo n s f o r the ad ap ta tio n
47. H a v e y o u r n e ig h b o u rs ev er v is ite d y o u to le a m ab o u t the te c h n o lo g y ? Y es / N o
48. I f y es, a p p ro x im a te ly how m a n y in 1 9 9 7 ------------------------- 1 9 9 8 -------------------------- 1 9 9 9 -------------------2 0 0 0 ------
49. W h a t a s p e c ts o f th e te c h n o lo g y d id th e y le a m from you and a p p ro x im a te ly h o w m a n y h a v e ad op ted ?
A s p e c ts o f th e te c h n o lo g y lea rn t N u m b e r o f n e ig h b o u rs w h o h a v e ad op ted
190

Knowledge on technologyA ctiv ities M a iz e N a p p ie r M elin is D e sm o d iu m
50. W hen is th e b e s t tim e to p re p a re
la n d f o r
51. N am e c e r t i f ie d v a rie ty o f
52. N am e p la n t in g fe rtiliz e r fo r
53. N am e to p d r e s s in g fe r ti l iz e r fo r
54. H o w m a n y t im e s sh o u ld a fa rm er
w e ed
55. W h a t ty p e o f p la n tin g m a te r ia l is
u se d f o r g ro w in g
56. H o w o ften s h o u ld a fa rm e r h a rv e st
57. H o w is M e lin is , d e sm o d iu m fed to
l iv e s to c k
58. W h a t a re th e b e n e f i ts o f g ro w in g
m e lin is , d e sm o d iu m
59. H o w is n a p p ie r , m e lin is ,
d e sm o d iu m p la n te d
K n o w le d g e o n t h e S t e m b o r e r s ’ b io lo g y , d a m a g e a n d c o n tro l
How m an y s ta g e s d o e s a s tem b o re r pass th ro u g h b e fo re it b e co m e s an adult?-
A t w h a t stage is th e s te m b o re r d e s tru c tiv e ? —
W h at type o f lo s e s d o e s th e s te m b o re r c a u s e ?
N a m e one m e th o d o f c o n tro llin g s tem b o re rs? -
191

Farmers’ personal characteristics2 5 . M arita l s ta tu s (1 ) S in g le— (2 ) M a r r ie d (P )------(3 ) M arried (M )------- (4) D iv o rc e d ------- (5 ) W id o w ed -------
5 6 . A g e in y e a r s -----------------------------------------------------------------------------------------------------------------------------------------------
57 . T rib e ................................................................................................................................................................................................................
58 . E d u c a tio n le v e l in h ig h est n u m b e r o f s c h o o lin g y ears a t t a in e d -----------------------------------------------------------------
59. O c c u p a tio n ty p e ------------------------------------------------------------------------------------------------------------------------------------------
60. O c c u p a tio n : (1 ) fu ll tim e fa rm er, (2 ) p a n tim e fa rm er, (3 ) O th e r o ccu p a tio n o th e r th a n fa rm in g
61. N u m b e r o f so c ia l o rg a n iz a tio n (s ) a f f i l ia te d t o -----------------------------------------------------------------------------------------
62 . T o ta l L a n d s iz e in acres----------------------------- A ro u n d h o m e s te a d -------------------------- E lse w h e re ---------------------
63 . S o u rc e o f la n d : (0 ) S q u a tte rs (1) S e t t le d b y g o v e rn m e n t (2) In h e r ite d (3) P u rch ased
6 4 . W h o o w n s th e la n d you a re u s in g ...............................................................................................................................
H o u s e h o ld s iz e a n d c o m p o s i t io n :
65 . A d u lt m a l e : ---------------------------------------------- A d u lt f e m a le : ------------------------------------------------------
C h ild re n :
0 -5 y e a r o l d s : --------------------------7 -1 3 y e a r o l d s : ------------------- 14-18 y e a r o ld s :-------------------------
6 6 . S o u rc e s o f f a m ily in co m e:
In c o m e s o u rc e A p p ro x im e n t am o u n t in 200 0
S e ll o f m a iz e ---------------------------------------------------
W a g e s an d s a la r ie s ---------------------------------------------------
R em itta n ces ---------------------------------------------------
S e ll o f o th e r c ro p s ---------------------------------------------------
o th e rs ( in d ic a te ) ---------------------------------------------------
6 7 . O t h e r f a r m r e s o u r c e s (w e a l th e n d o w m e n t in d ic a to r s ) p o s s e s s e d b y h o u s e h o ld
O f f f a rm e m p lo y m e n t fo r sp o u se , son, d a u g h t e r --------------------------------------------------------------
B e e h iv e s ------------------------------------
H o u se s (1 ) lo c a l, (2 ) s e m i-p e rm a n e n t, (3 ) p e rm a n e n t
B ic y c le s - -------------------------------------------------------------
192

M o to r b ik e ---------------------------------------------------
V e h ic le ty p e -------------------------------------------
R a d io ------------------------------------------------
S o fa se t----------------------------------------------
D in in g set---------------------------------------------
T ra c to r----------------------------------------------------
W h ee lb a rro w --------------------------------------------
O x -p lo u g h -------------------------------------------------
68. P ro je c t r e l a t e d in f o r m a t io n
In y o u r v iew w h a t a re the b e n e fits o f u s in g th is tec h n o lo g y ? L is t a n d R a te ac co rd in g to o r d e r o f im p o rtan ce
W hat ex tra c o s ts d o y o u a s s o c ia te w ith th is te c h n o lo g y ? -----------------------------------------------------------------------------------------------
K EY
T e c h n o lo g y O p t io n s
NappieT g rass b o r d e r p la n tin g a lo n e
N 'appier g rass b o rd e r p la n tin g w ith D e sm o d e u m in te rc ro p
N 'appier g rass b o r d e r p la n tin g w ith M e lin is in e rc ro p
N a p p ie r g rass b o r d e r p la n tin g w ith b e an s in te rc ro p
O th er specify
M a r i ta l s ta tu s
M a m e d ip) - M a rr ie d p o ly g a m o u s
M a m e d (in) - M a rr ie d m o n o g a m o u s
UNIVt. ... ' T OK N A IH O B '
193

APPENDIX CMAP OF THE STLDY AREAS
Map of the Trans Nzoia District showing the study areas (Source: ICIPE, 1997)
194