Embed Size (px)
Citation preview
Socio-economic and climate change impacts on agriculture: an integrated assessment, 1990–2080
Günther Fischer, Mahendra Shah, Francesco N. Tubiello, and Harrij van Velthuizen
RP-05-008 November 2005

International Institute for Applied Systems Analysis • Schlossplatz 1 • A-2361 Laxenburg • Austria Tel: (+43 2236) 807 • Fax: (+43 2236) 71313 • E-mail: [email protected] • Web: www.iiasa.ac.at
Socio-economic and climate change impacts on agriculture: an integrated assessment, 1990–2080
Günther Fischer1 Mahendra Shah1 Francesco N. Tubiello1,2 Harrij van Velthuizen1 1International Institute for Applied Systems Analysis (IIASA) 2Goddard Institute for Space Studies, Columbia University, NY, USA
RP-05-008 November 2005
Reprinted from Philosophical Transactions of the Royal Society B (Phil. Trans. R. Soc. B), 360(1463): 2067–2083, DOI: 10.1098/rstb.2005.1744, 29 November 2005. Published online.
IIASA Reprints make research conducted at the International Institute for Applied Systems Analysis more accessible to a wider audience. They reprint independently reviewed articles that have been previously published in journals. Views or opinions expressed herein do not necessarily represent those of the Institute, its National Member Organizations, or other organizations supporting the work.
Reprinted with permission from Philosophical Transactions of the Royal Society B (Phil. Trans. R. Soc. B), 360(1463): 2067–2083, DOI: 10.1098/rstb.2005.1744, 29 November 2005. Publishedonline. Copyright © 2005 The Royal Society.
All rights reserved. No part of this publication may be reproduced or transmitted in any form or byany means, electronic or mechanical, including photocopy, recording, or any information storage orretrieval system, without permission in writing from the copyright holder.
Phil. Trans. R. Soc. B
doi:10.1098/rstb.2005.1744
Socio-economic and climate change impacts onagriculture: an integrated assessment, 1990–2080
Published online
Gunther Fischer1,*, Mahendra Shah1, Francesco N. Tubiello1,2
and Harrij van Velhuizen1
One cona chang
*Autho
1International Institute for Applied Systems Analysis (IIASA), Laxenburg, Austria2Goddard Institute for Space Studies, Columbia University, NY, USA
A comprehensive assessment of the impacts of climate change on agro-ecosystems over this century isdeveloped, up to 2080 and at a global level, albeit with significant regional detail. To this end anintegrated ecological–economic modelling framework is employed, encompassing climate scenarios,agro-ecological zoning information, socio-economic drivers, as well as world food trade dynamics.Specifically, global simulations are performed using the FAO/IIASA agro-ecological zone model, inconjunction with IIASAs global food system model, using climate variables from five different generalcirculation models, under four different socio-economic scenarios from the intergovernmental panelon climate change. First, impacts of different scenarios of climate change on bio-physical soil andcrop growth determinants of yield are evaluated on a 5 0!5 0 latitude/longitude global grid; second,the extent of potential agricultural land and related potential crop production is computed. Thedetailed bio-physical results are then fed into an economic analysis, to assess how climate impactsmay interact with alternative development pathways, and key trends expected over this century forfood demand and production, and trade, as well as key composite indices such as risk of hunger andmalnutrition, are computed. This modelling approach connects the relevant bio-physical and socio-economic variables within a unified and coherent framework to produce a global assessment of foodproduction and security under climate change. The results from the study suggest that critical impactasymmetries due to both climate and socio-economic structures may deepen current production andconsumption gaps between developed and developing world; it is suggested that adaptation ofagricultural techniques will be central to limit potential damages under climate change.
Keywords: agriculture; crop production; climate change; food security; sub-Saharan Africa;risk of hunger
1. INTRODUCTIONThere is significant concern about the impacts of
climate change and its variability on agricultural
production worldwide. First, issues of food security
figure prominently in the list of human activities and
ecosystem services under threat of dangerous anthro-
pogenic interference on Earth’s climate (Watson et al.
2000; IPCC 2001a,b; Ecosystem Millennium Assess-
ment 2005; see also article II, UNFCCC). Second,
each country is naturally concerned with potential
damages and benefits that may arise over the coming
decades from climate change impacts on its territory as
well as globally, since these will affect domestic and
international policies, trading patterns, resource use,
regional planning and ultimately the welfare of its
people.
Current research confirms that while crops would
respond positively to elevated CO2 in the absence of
climate change (e.g. Kimball et al. 2002; Jablonski et al.
2002; Ainsworth & Long 2005), the associated impacts
of high temperatures, altered patterns of precipitation
tribution of 17 to a Discussion Meeting Issue ‘Food crops ining climate’.
r for correspondence ([email protected]).
1
and possibly increased frequency of extreme events
such as drought and floods, will probably combine to
depress yields and increase production risks in many
world regions, widening the gap between rich and poor
countries (e.g. IPCC 2001a,b). A consensus has
emerged that developing countries are more vulnerable
to climate change than developed countries, because of
the predominance of agriculture in their economies,
the scarcity of capital for adaptation measures, their
warmer baseline climates and their heightened
exposure to extreme events (Parry et al. 2001). Thus,
climate change may have particularly serious con-
sequences in the developing world, where some 800
million people are undernourished. Of great concern is
a group of more than 40 ‘least-developed’ countries,
mostly in sub-Saharan Africa, where domestic per
capita food production declined by 10% in the last 20
years (e.g. UN Millennium Project 2005).
Many interactive processes determine the dynamics
of world food demand and supply: agro-climatic
conditions, land resources and their management are
clearly a key component, but they are critically affected
by distinct socio-economic pressures, including current
and projected trends in population growth, availability
and access to technology and development. In the last
three decades, for instance, average daily per capita
q 2005 The Royal Society
climatemodel
SRESscenario
climate impactresponse relations
world market
production demand
tradeglobal food system
(basic linked system)
ecological–economic analysis
AEZ
BLS
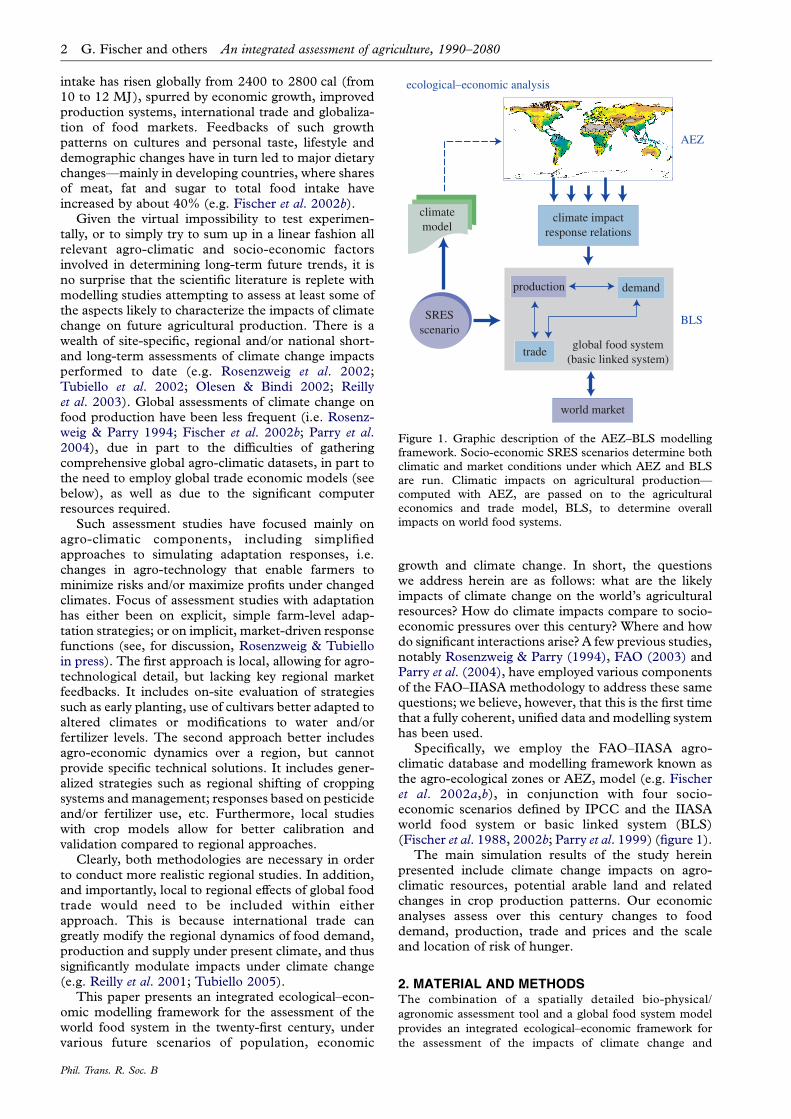
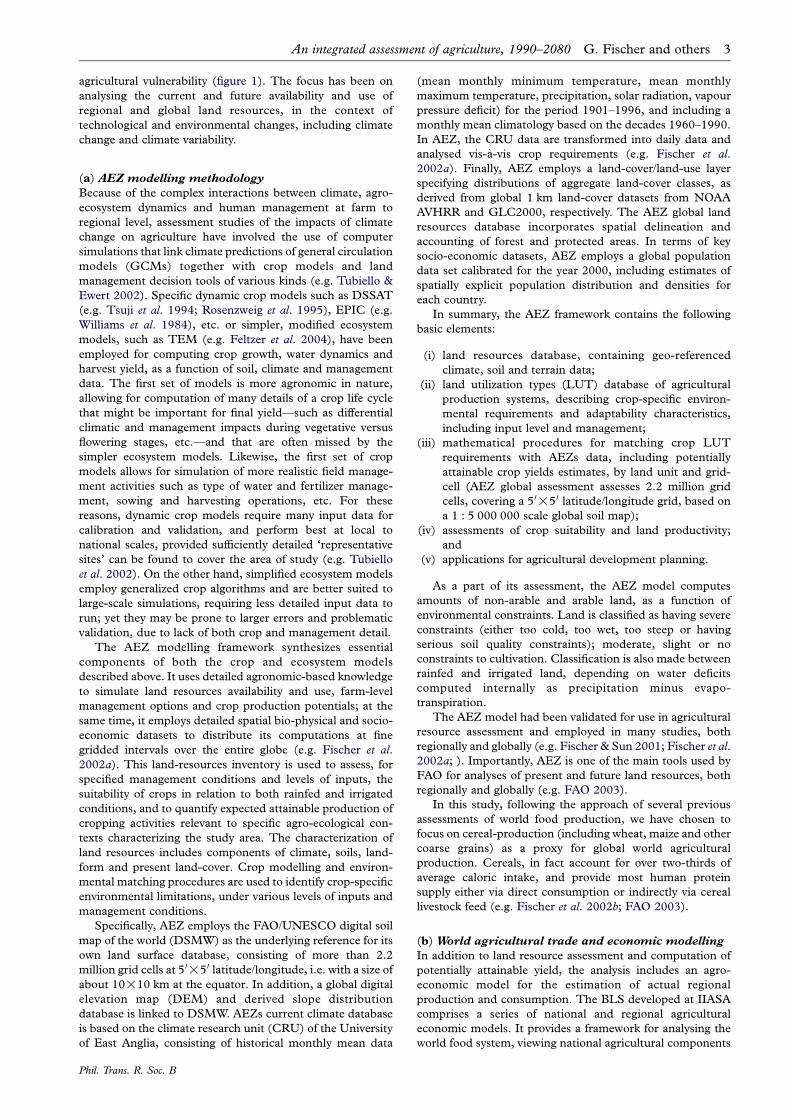
Figure 1. Graphic description of the AEZ–BLS modellingframework. Socio-economic SRES scenarios determine bothclimatic and market conditions under which AEZ and BLSare run. Climatic impacts on agricultural production—computed with AEZ, are passed on to the agriculturaleconomics and trade model, BLS, to determine overallimpacts on world food systems.
2 G. Fischer and others An integrated assessment of agriculture, 1990–2080
intake has risen globally from 2400 to 2800 cal (from10 to 12 MJ), spurred by economic growth, improvedproduction systems, international trade and globaliza-tion of food markets. Feedbacks of such growthpatterns on cultures and personal taste, lifestyle anddemographic changes have in turn led to major dietarychanges—mainly in developing countries, where sharesof meat, fat and sugar to total food intake haveincreased by about 40% (e.g. Fischer et al. 2002b).
Given the virtual impossibility to test experimen-tally, or to simply try to sum up in a linear fashion allrelevant agro-climatic and socio-economic factorsinvolved in determining long-term future trends, it isno surprise that the scientific literature is replete withmodelling studies attempting to assess at least some ofthe aspects likely to characterize the impacts of climatechange on future agricultural production. There is awealth of site-specific, regional and/or national short-and long-term assessments of climate change impactsperformed to date (e.g. Rosenzweig et al. 2002;Tubiello et al. 2002; Olesen & Bindi 2002; Reillyet al. 2003). Global assessments of climate change onfood production have been less frequent (i.e. Rosenz-weig & Parry 1994; Fischer et al. 2002b; Parry et al.2004), due in part to the difficulties of gatheringcomprehensive global agro-climatic datasets, in part tothe need to employ global trade economic models (seebelow), as well as due to the significant computerresources required.
Such assessment studies have focused mainly onagro-climatic components, including simplifiedapproaches to simulating adaptation responses, i.e.changes in agro-technology that enable farmers tominimize risks and/or maximize profits under changedclimates. Focus of assessment studies with adaptationhas either been on explicit, simple farm-level adap-tation strategies; or on implicit, market-driven responsefunctions (see, for discussion, Rosenzweig & Tubielloin press). The first approach is local, allowing for agro-technological detail, but lacking key regional marketfeedbacks. It includes on-site evaluation of strategiessuch as early planting, use of cultivars better adapted toaltered climates or modifications to water and/orfertilizer levels. The second approach better includesagro-economic dynamics over a region, but cannotprovide specific technical solutions. It includes gener-alized strategies such as regional shifting of croppingsystems and management; responses based on pesticideand/or fertilizer use, etc. Furthermore, local studieswith crop models allow for better calibration andvalidation compared to regional approaches.
Clearly, both methodologies are necessary in orderto conduct more realistic regional studies. In addition,and importantly, local to regional effects of global foodtrade would need to be included within eitherapproach. This is because international trade cangreatly modify the regional dynamics of food demand,production and supply under present climate, and thussignificantly modulate impacts under climate change(e.g. Reilly et al. 2001; Tubiello 2005).
This paper presents an integrated ecological–econ-omic modelling framework for the assessment of theworld food system in the twenty-first century, undervarious future scenarios of population, economic
Phil. Trans. R. Soc. B
growth and climate change. In short, the questionswe address herein are as follows: what are the likelyimpacts of climate change on the world’s agriculturalresources? How do climate impacts compare to socio-economic pressures over this century? Where and howdo significant interactions arise? A few previous studies,notably Rosenzweig & Parry (1994), FAO (2003) andParry et al. (2004), have employed various componentsof the FAO–IIASA methodology to address these samequestions; we believe, however, that this is the first timethat a fully coherent, unified data and modelling systemhas been used.
Specifically, we employ the FAO–IIASA agro-climatic database and modelling framework known asthe agro-ecological zones or AEZ, model (e.g. Fischeret al. 2002a,b), in conjunction with four socio-economic scenarios defined by IPCC and the IIASAworld food system or basic linked system (BLS)(Fischer et al. 1988, 2002b; Parry et al. 1999) (figure 1).
The main simulation results of the study hereinpresented include climate change impacts on agro-climatic resources, potential arable land and relatedchanges in crop production patterns. Our economicanalyses assess over this century changes to fooddemand, production, trade and prices and the scaleand location of risk of hunger.
2. MATERIAL AND METHODSThe combination of a spatially detailed bio-physical/
agronomic assessment tool and a global food system model
provides an integrated ecological–economic framework for
the assessment of the impacts of climate change and
An integrated assessment of agriculture, 1990–2080 G. Fischer and others 3
agricultural vulnerability (figure 1). The focus has been on
analysing the current and future availability and use of
regional and global land resources, in the context of
technological and environmental changes, including climate
change and climate variability.
(a) AEZ modelling methodology
Because of the complex interactions between climate, agro-
ecosystem dynamics and human management at farm to
regional level, assessment studies of the impacts of climate
change on agriculture have involved the use of computer
simulations that link climate predictions of general circulation
models (GCMs) together with crop models and land
management decision tools of various kinds (e.g. Tubiello &
Ewert 2002). Specific dynamic crop models such as DSSAT
(e.g. Tsuji et al. 1994; Rosenzweig et al. 1995), EPIC (e.g.
Williams et al. 1984), etc. or simpler, modified ecosystem
models, such as TEM (e.g. Feltzer et al. 2004), have been
employed for computing crop growth, water dynamics and
harvest yield, as a function of soil, climate and management
data. The first set of models is more agronomic in nature,
allowing for computation of many details of a crop life cycle
that might be important for final yield—such as differential
climatic and management impacts during vegetative versus
flowering stages, etc.—and that are often missed by the
simpler ecosystem models. Likewise, the first set of crop
models allows for simulation of more realistic field manage-
ment activities such as type of water and fertilizer manage-
ment, sowing and harvesting operations, etc. For these
reasons, dynamic crop models require many input data for
calibration and validation, and perform best at local to
national scales, provided sufficiently detailed ‘representative
sites’ can be found to cover the area of study (e.g. Tubiello
et al. 2002). On the other hand, simplified ecosystem models
employ generalized crop algorithms and are better suited to
large-scale simulations, requiring less detailed input data to
run; yet they may be prone to larger errors and problematic
validation, due to lack of both crop and management detail.
The AEZ modelling framework synthesizes essential
components of both the crop and ecosystem models
described above. It uses detailed agronomic-based knowledge
to simulate land resources availability and use, farm-level
management options and crop production potentials; at the
same time, it employs detailed spatial bio-physical and socio-
economic datasets to distribute its computations at fine
gridded intervals over the entire globe (e.g. Fischer et al.
2002a). This land-resources inventory is used to assess, for
specified management conditions and levels of inputs, the
suitability of crops in relation to both rainfed and irrigated
conditions, and to quantify expected attainable production of
cropping activities relevant to specific agro-ecological con-
texts characterizing the study area. The characterization of
land resources includes components of climate, soils, land-
form and present land-cover. Crop modelling and environ-
mental matching procedures are used to identify crop-specific
environmental limitations, under various levels of inputs and
management conditions.
Specifically, AEZ employs the FAO/UNESCO digital soil
map of the world (DSMW) as the underlying reference for its
own land surface database, consisting of more than 2.2
million grid cells at 5 0!5 0 latitude/longitude, i.e. with a size of
about 10!10 km at the equator. In addition, a global digital
elevation map (DEM) and derived slope distribution
database is linked to DSMW. AEZs current climate database
is based on the climate research unit (CRU) of the University
of East Anglia, consisting of historical monthly mean data
Phil. Trans. R. Soc. B
(mean monthly minimum temperature, mean monthly
maximum temperature, precipitation, solar radiation, vapour
pressure deficit) for the period 1901–1996, and including a
monthly mean climatology based on the decades 1960–1990.
In AEZ, the CRU data are transformed into daily data and
analysed vis-a-vis crop requirements (e.g. Fischer et al.
2002a). Finally, AEZ employs a land-cover/land-use layer
specifying distributions of aggregate land-cover classes, as
derived from global 1 km land-cover datasets from NOAA
AVHRR and GLC2000, respectively. The AEZ global land
resources database incorporates spatial delineation and
accounting of forest and protected areas. In terms of key
socio-economic datasets, AEZ employs a global population
data set calibrated for the year 2000, including estimates of
spatially explicit population distribution and densities for
each country.
In summary, the AEZ framework contains the following
basic elements:
(i) land resources database, containing geo-referenced
climate, soil and terrain data;
(ii) land utilization types (LUT) database of agricultural
production systems, describing crop-specific environ-
mental requirements and adaptability characteristics,
including input level and management;
(iii) mathematical procedures for matching crop LUT
requirements with AEZs data, including potentially
attainable crop yields estimates, by land unit and grid-
cell (AEZ global assessment assesses 2.2 million grid
cells, covering a 5 0!5 0 latitude/longitude grid, based on
a 1 : 5 000 000 scale global soil map);
(iv) assessments of crop suitability and land productivity;
and
(v) applications for agricultural development planning.
As a part of its assessment, the AEZ model computes
amounts of non-arable and arable land, as a function of
environmental constraints. Land is classified as having severe
constraints (either too cold, too wet, too steep or having
serious soil quality constraints); moderate, slight or no
constraints to cultivation. Classification is also made between
rainfed and irrigated land, depending on water deficits
computed internally as precipitation minus evapo-
transpiration.
The AEZ model had been validated for use in agricultural
resource assessment and employed in many studies, both
regionally and globally (e.g. Fischer & Sun 2001; Fischer et al.
2002a; ). Importantly, AEZ is one of the main tools used by
FAO for analyses of present and future land resources, both
regionally and globally (e.g. FAO 2003).
In this study, following the approach of several previous
assessments of world food production, we have chosen to
focus on cereal-production (including wheat, maize and other
coarse grains) as a proxy for global world agricultural
production. Cereals, in fact account for over two-thirds of
average caloric intake, and provide most human protein
supply either via direct consumption or indirectly via cereal
livestock feed (e.g. Fischer et al. 2002b; FAO 2003).
(b) World agricultural trade and economic modelling
In addition to land resource assessment and computation of
potentially attainable yield, the analysis includes an agro-
economic model for the estimation of actual regional
production and consumption. The BLS developed at IIASA
comprises a series of national and regional agricultural
economic models. It provides a framework for analysing the
world food system, viewing national agricultural components
4 G. Fischer and others An integrated assessment of agriculture, 1990–2080
as embedded in national economies, which in turn interact
with each other at the international trade level (e.g. Fischer
et al. 2002a,b). The BLS model consists of 34 national and
regional geographical components covering the globe,
calibrated and validated over past time windows (e.g. Fischer
et al. 1988, 1994) and successfully reproduces regional
consumption, production and trade of major agricultural
commodities in 2000. Several applications of the BLS to
climate-change impact analysis have been published, e.g. in
Rosenzweig & Parry (1994), Fischer et al. (1996) and Parry
et al. (1999, 2004).
The individual national/regional models are linked
together by means of a world market, where international
clearing prices are computed to equalize global demand with
supply. The BLS is formulated as a recursively dynamic
system, working in successive annual steps. Each individual
model component focuses primarily on the agricultural
sector, but attempts to represent the whole economy as
necessary to capture essential dynamics among capital,
labour and land. For the purpose of subsequent international
linkage, production, consumption and trade of goods and
services are aggregated into nine main agricultural sectors,
though individual regional models have more detail. The nine
agricultural sectors include: wheat, rice, coarse grains, bovine
and ovine meat, dairy products, other meat and fish, protein
feeds, other food, non-food agriculture. The rest of the
economy is coarsely aggregated into one simplified non-
agricultural sector. Agricultural commodities may be used
within BLS for human consumption, feed, intermediate
consumption and stock accumulation. The non-agricultural
commodity may contribute as investment, and for processing
and transporting agricultural goods. All physical and financial
accounts are balanced and mutually consistent: the pro-
duction, consumption and financial ones at the national level
and the trade and financial flows at the global level.
Within each regional unit, the supply modules allocate
land, labour and capital as a function of the relative
profitability of its different economic sectors. In particular,
actual cultivated acreage is computed from agro-climatic land
parameters (derived from AEZ) and profitability estimates.
Once acreage, labour and capital are assigned to cropping and
livestock activities, actual yields and livestock production is
computed as a function of fertilizer applications, feed rates
and available technology.
Population growth and technology are key external inputs
to BLS. Population numbers and projected incomes are used
to determine demand for food for the period of study.
Technology affects BLS yield estimates, by modifying the
efficiency of production per given units of input (e.g. Fischer
et al. 2002a,b). For simulations of historical periods up to the
present, population data are taken from official UN data at
country-level, while the rate of technical progress can be
estimated from past agricultural performance. For simu-
lations into the future, scenarios of socio-economic develop-
ment and population growth must be chosen in order to
inform BLS computations. Another key external input to
AEZ/BLS is climate and environment, which determine crop
suitability and potential yields used by the economic model as
an input in resource allocation. Thus, projected climate
change affects BLS results indirectly yet significantly, via its
impacts on agro-climatic land resources computed by AEZ.
(c) Socio-economic scenario generation
In order to assess agricultural development over this century,
with or without climate change, it is necessary to first make
some coherent assumptions about how key socio-economic
Phil. Trans. R. Soc. B
drivers of food systems might evolve over the same period. To
this end, we used plausible socio-economic development
paths, as specified in the IPCC special report on emissions
scenarios (SRES) (IPCC 2000, 2001a,b). The SRES
scenarios have been constructed to explore socio-economic
development and related pressures on the global environment
in this century, with special reference to emissions of
greenhouse gases into the atmosphere (see notes in table 1).
Within this context, climate change is clearly seen as the
consequence of complex social, economic and environmental
interactions, possibly modulated by the capacity to mitigate
and adapt regionally and globally. Emissions of greenhouse
gases connected to specific SRES scenarios are translated into
projections of climate change over this century by using
GCMs. We used projections available from IPCC data
distribution centre (DDC) and the CRU, corresponding
to five emission scenarios: A1FI, A1B, A2, B1 and B2 (see
table 1).
The following methodology was developed for application
of GCM and SRES scenarios to the AEZ–BLS framework.
For use in AEZ, projected GCM changes were interpolated to
a grid of 0.58!0.58 latitude/longitude and applied to the
baseline climate period of 1961–1990 (see also following
section). Application of SRES scenarios to BLS were realized
via the following steps. First, UN-based SRES population
growth rates were either incorporated for individual countries
or aggregated to BLS regions. In order to maintain
consistency with SRES structure, the BLS 34 regions were
further aggregated to 11, following SRES. We then let BLS
dynamically compute allocation of labour and capital
between agriculture and non-agriculture as a function of
specified economic conditions. Second, BLS runs were
harmonized with SRES specifications. The approach chosen
was to harmonize rates of economic growth generated in the
BLS with those projected in the IPCC-SRES scenarios,
through adjustment of capital investment (saving rates) and
of rates of technical progress in non-agricultural sectors. The
harmonization of production factors and GDP, individually
for each decade during the period 1990–2080, was carried
out on a region-by-region basis.
In order to address the research questions formulated in
the introduction of this paper, namely the impacts of climate
change on agriculture and the interactions with concomitant
socio-economic pressures over this century, we devised a two-
step simulation strategy involving AEZ–BLS simulations
under different SRES scenarios, with and without climate
change. The latter set includes the combined impacts of socio-
economic variables and climate, in particular higher tem-
perature, modified rainfall patterns and elevated carbon
dioxide (CO2) concentrations, with respect to current
conditions. In either case, modifications to potentially
attainable yields computed in AEZ were input into the BLS,
and resulting changes were analysed globally and regionally,
with special attention to food balances in sub-Saharan Africa.
(d) Climate change scenario generation
GCMs represent one powerful tool to generate character-
istics of future climates under anthropogenic forcing, i.e.
under present and projected future emissions of greenhouse
gases (e.g. IPCC 2001a). Their use in climate-change impact
assessment studies is widespread (e.g. Reilly et al. 2001;
IPCC 2001b). Importantly, GCMs provide internally
coherent climate dynamics, by solving globally all climate-
relevant physical equations. Yet, it is well known that GCM
projections present significant uncertainties, due in part to
issues of scale resolution, leading to incomplete model
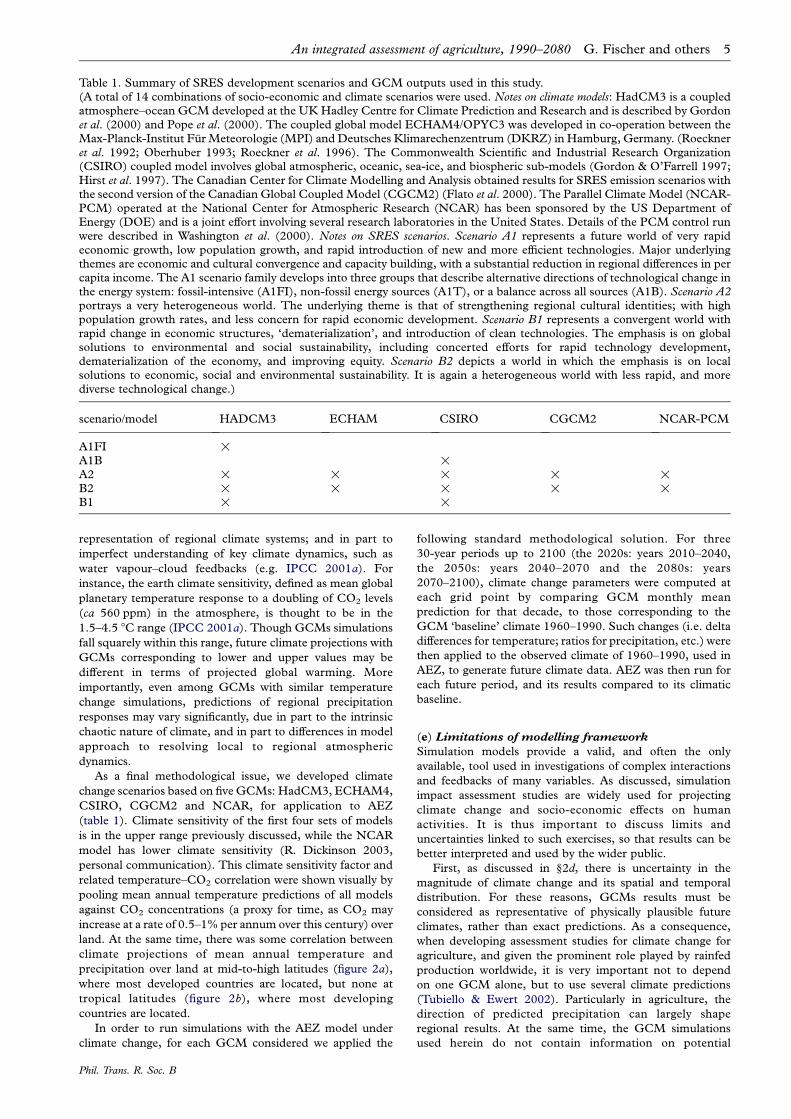
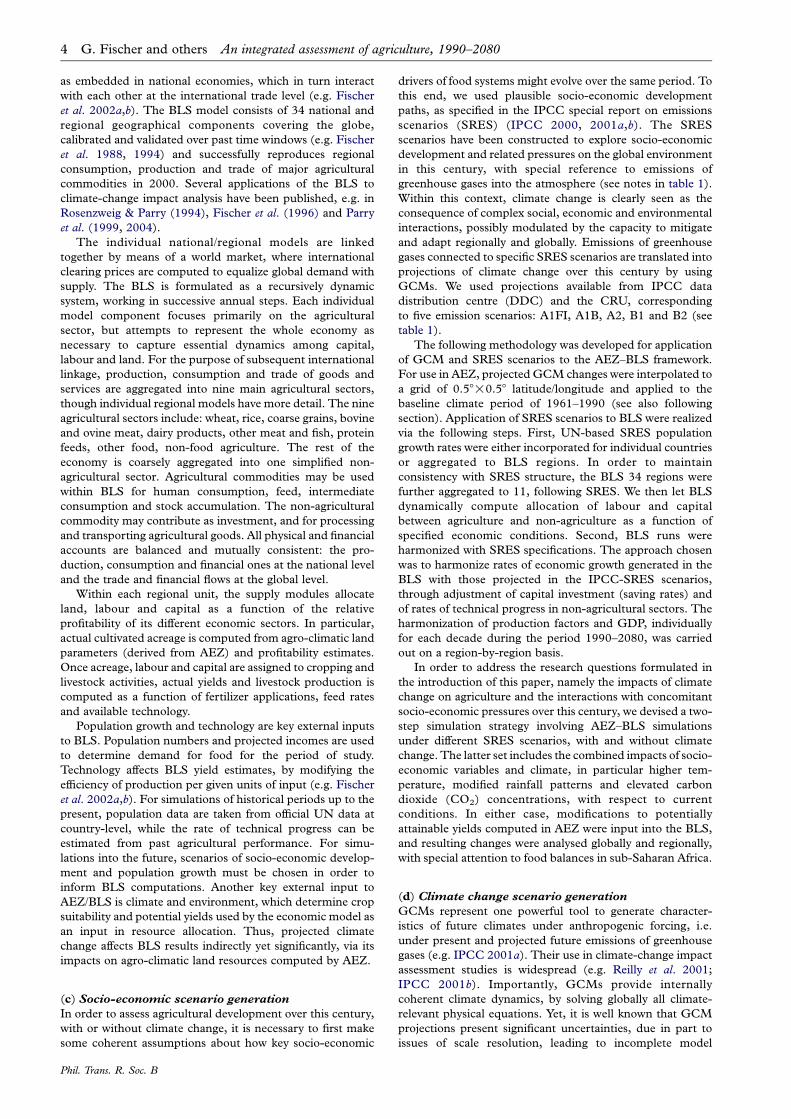
Table 1. Summary of SRES development scenarios and GCM outputs used in this study.(A total of 14 combinations of socio-economic and climate scenarios were used. Notes on climate models: HadCM3 is a coupledatmosphere–ocean GCM developed at the UK Hadley Centre for Climate Prediction and Research and is described by Gordonet al. (2000) and Pope et al. (2000). The coupled global model ECHAM4/OPYC3 was developed in co-operation between theMax-Planck-Institut Fur Meteorologie (MPI) and Deutsches Klimarechenzentrum (DKRZ) in Hamburg, Germany. (Roeckneret al. 1992; Oberhuber 1993; Roeckner et al. 1996). The Commonwealth Scientific and Industrial Research Organization(CSIRO) coupled model involves global atmospheric, oceanic, sea-ice, and biospheric sub-models (Gordon & O’Farrell 1997;Hirst et al. 1997). The Canadian Center for Climate Modelling and Analysis obtained results for SRES emission scenarios withthe second version of the Canadian Global Coupled Model (CGCM2) (Flato et al. 2000). The Parallel Climate Model (NCAR-PCM) operated at the National Center for Atmospheric Research (NCAR) has been sponsored by the US Department ofEnergy (DOE) and is a joint effort involving several research laboratories in the United States. Details of the PCM control runwere described in Washington et al. (2000). Notes on SRES scenarios. Scenario A1 represents a future world of very rapideconomic growth, low population growth, and rapid introduction of new and more efficient technologies. Major underlyingthemes are economic and cultural convergence and capacity building, with a substantial reduction in regional differences in percapita income. The A1 scenario family develops into three groups that describe alternative directions of technological change inthe energy system: fossil-intensive (A1FI), non-fossil energy sources (A1T), or a balance across all sources (A1B). Scenario A2portrays a very heterogeneous world. The underlying theme is that of strengthening regional cultural identities; with highpopulation growth rates, and less concern for rapid economic development. Scenario B1 represents a convergent world withrapid change in economic structures, ‘dematerialization’, and introduction of clean technologies. The emphasis is on globalsolutions to environmental and social sustainability, including concerted efforts for rapid technology development,dematerialization of the economy, and improving equity. Scenario B2 depicts a world in which the emphasis is on localsolutions to economic, social and environmental sustainability. It is again a heterogeneous world with less rapid, and morediverse technological change.)
scenario/model HADCM3 ECHAM CSIRO CGCM2 NCAR-PCM
A1FI !A1B !A2 ! ! ! ! !B2 ! ! ! ! !B1 ! !
An integrated assessment of agriculture, 1990–2080 G. Fischer and others 5
representation of regional climate systems; and in part to
imperfect understanding of key climate dynamics, such as
water vapour–cloud feedbacks (e.g. IPCC 2001a). For
instance, the earth climate sensitivity, defined as mean global
planetary temperature response to a doubling of CO2 levels
(ca 560 ppm) in the atmosphere, is thought to be in the
1.5–4.5 8C range (IPCC 2001a). Though GCMs simulations
fall squarely within this range, future climate projections with
GCMs corresponding to lower and upper values may be
different in terms of projected global warming. More
importantly, even among GCMs with similar temperature
change simulations, predictions of regional precipitation
responses may vary significantly, due in part to the intrinsic
chaotic nature of climate, and in part to differences in model
approach to resolving local to regional atmospheric
dynamics.
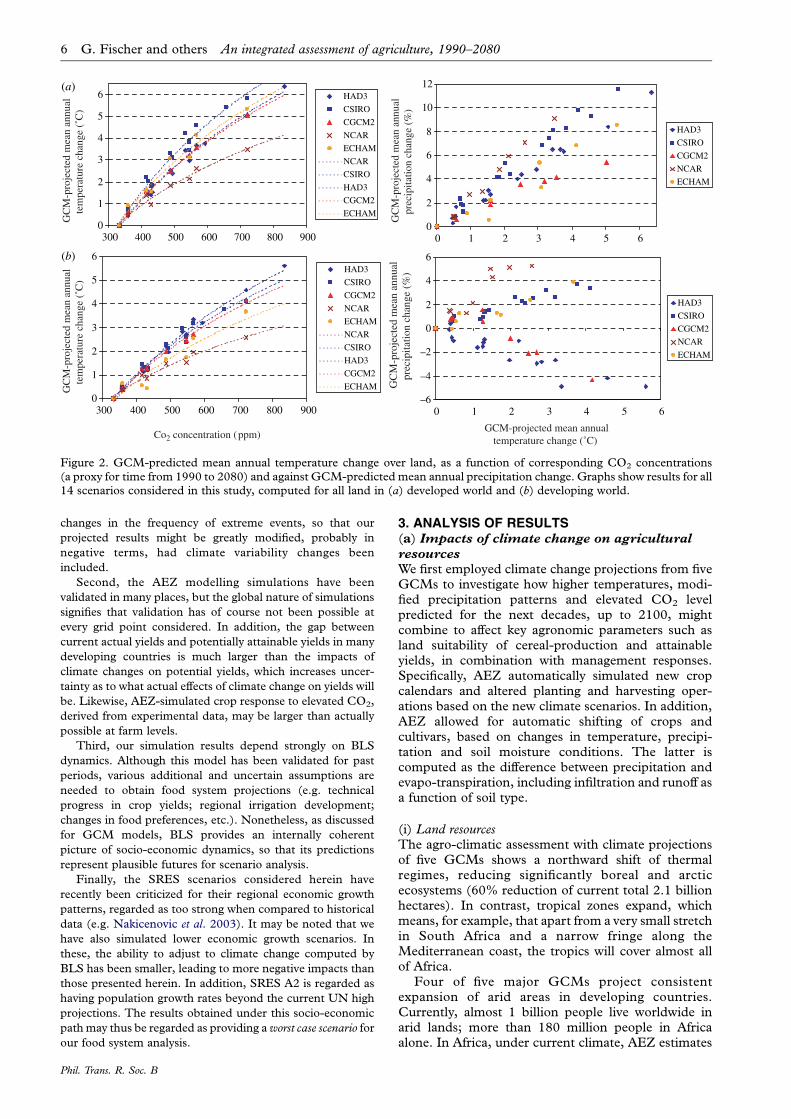
As a final methodological issue, we developed climate
change scenarios based on five GCMs: HadCM3, ECHAM4,
CSIRO, CGCM2 and NCAR, for application to AEZ
(table 1). Climate sensitivity of the first four sets of models
is in the upper range previously discussed, while the NCAR
model has lower climate sensitivity (R. Dickinson 2003,
personal communication). This climate sensitivity factor and
related temperature–CO2 correlation were shown visually by
pooling mean annual temperature predictions of all models
against CO2 concentrations (a proxy for time, as CO2 may
increase at a rate of 0.5–1% per annum over this century) over
land. At the same time, there was some correlation between
climate projections of mean annual temperature and
precipitation over land at mid-to-high latitudes (figure 2a),
where most developed countries are located, but none at
tropical latitudes (figure 2b), where most developing
countries are located.
In order to run simulations with the AEZ model under
climate change, for each GCM considered we applied the
Phil. Trans. R. Soc. B
following standard methodological solution. For three
30-year periods up to 2100 (the 2020s: years 2010–2040,
the 2050s: years 2040–2070 and the 2080s: years
2070–2100), climate change parameters were computed at
each grid point by comparing GCM monthly mean
prediction for that decade, to those corresponding to the
GCM ‘baseline’ climate 1960–1990. Such changes (i.e. delta
differences for temperature; ratios for precipitation, etc.) were
then applied to the observed climate of 1960–1990, used in
AEZ, to generate future climate data. AEZ was then run for
each future period, and its results compared to its climatic
baseline.
(e) Limitations of modelling framework
Simulation models provide a valid, and often the only
available, tool used in investigations of complex interactions
and feedbacks of many variables. As discussed, simulation
impact assessment studies are widely used for projecting
climate change and socio-economic effects on human
activities. It is thus important to discuss limits and
uncertainties linked to such exercises, so that results can be
better interpreted and used by the wider public.
First, as discussed in §2d, there is uncertainty in the
magnitude of climate change and its spatial and temporal
distribution. For these reasons, GCMs results must be
considered as representative of physically plausible future
climates, rather than exact predictions. As a consequence,
when developing assessment studies for climate change for
agriculture, and given the prominent role played by rainfed
production worldwide, it is very important not to depend
on one GCM alone, but to use several climate predictions
(Tubiello & Ewert 2002). Particularly in agriculture, the
direction of predicted precipitation can largely shape
regional results. At the same time, the GCM simulations
used herein do not contain information on potential
0
1
2
3
4
5
6(a)
(b)
300 400 500 600 700 800 900
HAD3
CSIRO
CGCM2
NCAR
ECHAM
NCAR
CSIRO
HAD3
CGCM2
ECHAM
0
2
4
6
8
10
12
0 1 2 3 4 5 6
HAD3
CSIRO
CGCM2
NCAR
ECHAM
0
1
2
3
4
5
6
300 400 500 600 700 800 900
HAD3
CSIRO
CGCM2
NCAR
ECHAM
NCAR
CSIRO
HAD3
CGCM2
ECHAM
–6
–4
–2
0
2
4
6
0 1 2 3 4 5 6
HAD3
CSIRO
CGCM2
NCAR
ECHAM
GC
M-p
roje
cted
mea
n an
nual
tem
pera
ture
cha
nge
(˚C
) G
CM
-pro
ject
ed m
ean
annu
alte
mpe
ratu
re c
hang
e (˚
C)
GC
M-p
roje
cted
mea
n an
nual
prec
ipita
tion
chan
ge (
%)
GC
M-p
roje
cted
mea
n an
nual
prec
ipita
tion
chan
ge (
%)
GCM-projected mean annualtemperature change (˚C)
Co2 concentration (ppm)
Figure 2. GCM-predicted mean annual temperature change over land, as a function of corresponding CO2 concentrations(a proxy for time from 1990 to 2080) and against GCM-predicted mean annual precipitation change. Graphs show results for all14 scenarios considered in this study, computed for all land in (a) developed world and (b) developing world.
6 G. Fischer and others An integrated assessment of agriculture, 1990–2080
changes in the frequency of extreme events, so that our
projected results might be greatly modified, probably in
negative terms, had climate variability changes been
included.
Second, the AEZ modelling simulations have been
validated in many places, but the global nature of simulations
signifies that validation has of course not been possible at
every grid point considered. In addition, the gap between
current actual yields and potentially attainable yields in many
developing countries is much larger than the impacts of
climate changes on potential yields, which increases uncer-
tainty as to what actual effects of climate change on yields will
be. Likewise, AEZ-simulated crop response to elevated CO2,
derived from experimental data, may be larger than actually
possible at farm levels.
Third, our simulation results depend strongly on BLS
dynamics. Although this model has been validated for past
periods, various additional and uncertain assumptions are
needed to obtain food system projections (e.g. technical
progress in crop yields; regional irrigation development;
changes in food preferences, etc.). Nonetheless, as discussed
for GCM models, BLS provides an internally coherent
picture of socio-economic dynamics, so that its predictions
represent plausible futures for scenario analysis.
Finally, the SRES scenarios considered herein have
recently been criticized for their regional economic growth
patterns, regarded as too strong when compared to historical
data (e.g. Nakicenovic et al. 2003). It may be noted that we
have also simulated lower economic growth scenarios. In
these, the ability to adjust to climate change computed by
BLS has been smaller, leading to more negative impacts than
those presented herein. In addition, SRES A2 is regarded as
having population growth rates beyond the current UN high
projections. The results obtained under this socio-economic
path may thus be regarded as providing a worst case scenario for
our food system analysis.
Phil. Trans. R. Soc. B
3. ANALYSIS OF RESULTS(a) Impacts of climate change on agricultural
resources
We first employed climate change projections from fiveGCMs to investigate how higher temperatures, modi-fied precipitation patterns and elevated CO2 levelpredicted for the next decades, up to 2100, mightcombine to affect key agronomic parameters such asland suitability of cereal-production and attainableyields, in combination with management responses.Specifically, AEZ automatically simulated new cropcalendars and altered planting and harvesting oper-ations based on the new climate scenarios. In addition,AEZ allowed for automatic shifting of crops andcultivars, based on changes in temperature, precipi-tation and soil moisture conditions. The latter iscomputed as the difference between precipitation andevapo-transpiration, including infiltration and runoff asa function of soil type.
(i) Land resourcesThe agro-climatic assessment with climate projectionsof five GCMs shows a northward shift of thermalregimes, reducing significantly boreal and arcticecosystems (60% reduction of current total 2.1 billionhectares). In contrast, tropical zones expand, whichmeans, for example, that apart from a very small stretchin South Africa and a narrow fringe along theMediterranean coast, the tropics will cover almost allof Africa.
Four of five major GCMs project consistentexpansion of arid areas in developing countries.Currently, almost 1 billion people live worldwide inarid lands; more than 180 million people in Africaalone. In Africa, under current climate, AEZ estimates
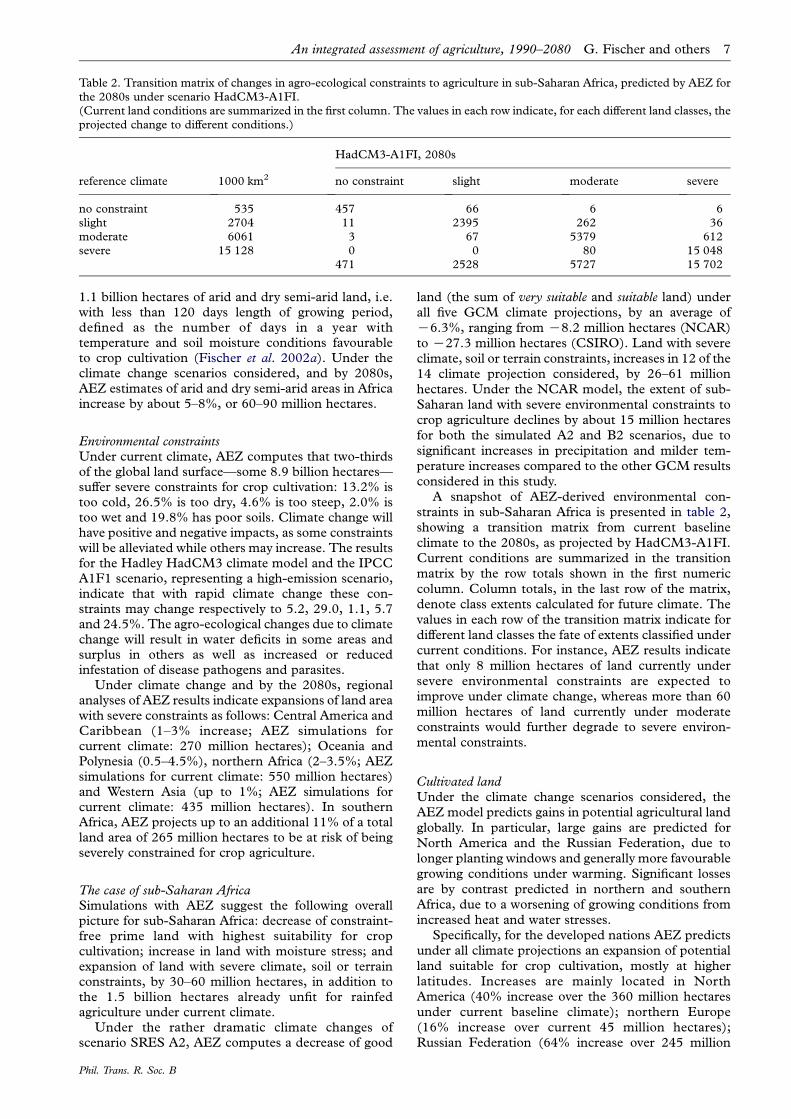
Table 2. Transition matrix of changes in agro-ecological constraints to agriculture in sub-Saharan Africa, predicted by AEZ forthe 2080s under scenario HadCM3-A1FI.(Current land conditions are summarized in the first column. The values in each row indicate, for each different land classes, theprojected change to different conditions.)
reference climate 1000 km2
HadCM3-A1FI, 2080s
no constraint slight moderate severe
no constraint 535 457 66 6 6slight 2704 11 2395 262 36moderate 6061 3 67 5379 612severe 15 128 0 0 80 15 048
471 2528 5727 15 702
An integrated assessment of agriculture, 1990–2080 G. Fischer and others 7
1.1 billion hectares of arid and dry semi-arid land, i.e.with less than 120 days length of growing period,defined as the number of days in a year withtemperature and soil moisture conditions favourableto crop cultivation (Fischer et al. 2002a). Under theclimate change scenarios considered, and by 2080s,AEZ estimates of arid and dry semi-arid areas in Africaincrease by about 5–8%, or 60–90 million hectares.
Environmental constraintsUnder current climate, AEZ computes that two-thirdsof the global land surface—some 8.9 billion hectares—suffer severe constraints for crop cultivation: 13.2% istoo cold, 26.5% is too dry, 4.6% is too steep, 2.0% istoo wet and 19.8% has poor soils. Climate change willhave positive and negative impacts, as some constraintswill be alleviated while others may increase. The resultsfor the Hadley HadCM3 climate model and the IPCCA1F1 scenario, representing a high-emission scenario,indicate that with rapid climate change these con-straints may change respectively to 5.2, 29.0, 1.1, 5.7and 24.5%. The agro-ecological changes due to climatechange will result in water deficits in some areas andsurplus in others as well as increased or reducedinfestation of disease pathogens and parasites.
Under climate change and by the 2080s, regionalanalyses of AEZ results indicate expansions of land areawith severe constraints as follows: Central America andCaribbean (1–3% increase; AEZ simulations forcurrent climate: 270 million hectares); Oceania andPolynesia (0.5–4.5%), northern Africa (2–3.5%; AEZsimulations for current climate: 550 million hectares)and Western Asia (up to 1%; AEZ simulations forcurrent climate: 435 million hectares). In southernAfrica, AEZ projects up to an additional 11% of a totalland area of 265 million hectares to be at risk of beingseverely constrained for crop agriculture.
The case of sub-Saharan AfricaSimulations with AEZ suggest the following overallpicture for sub-Saharan Africa: decrease of constraint-free prime land with highest suitability for cropcultivation; increase in land with moisture stress; andexpansion of land with severe climate, soil or terrainconstraints, by 30–60 million hectares, in addition tothe 1.5 billion hectares already unfit for rainfedagriculture under current climate.
Under the rather dramatic climate changes ofscenario SRES A2, AEZ computes a decrease of good
Phil. Trans. R. Soc. B
land (the sum of very suitable and suitable land) underall five GCM climate projections, by an average ofK6.3%, ranging from K8.2 million hectares (NCAR)to K27.3 million hectares (CSIRO). Land with severeclimate, soil or terrain constraints, increases in 12 of the14 climate projection considered, by 26–61 millionhectares. Under the NCAR model, the extent of sub-Saharan land with severe environmental constraints tocrop agriculture declines by about 15 million hectaresfor both the simulated A2 and B2 scenarios, due tosignificant increases in precipitation and milder tem-perature increases compared to the other GCM resultsconsidered in this study.
A snapshot of AEZ-derived environmental con-straints in sub-Saharan Africa is presented in table 2,showing a transition matrix from current baselineclimate to the 2080s, as projected by HadCM3-A1FI.Current conditions are summarized in the transitionmatrix by the row totals shown in the first numericcolumn. Column totals, in the last row of the matrix,denote class extents calculated for future climate. Thevalues in each row of the transition matrix indicate fordifferent land classes the fate of extents classified undercurrent conditions. For instance, AEZ results indicatethat only 8 million hectares of land currently undersevere environmental constraints are expected toimprove under climate change, whereas more than 60million hectares of land currently under moderateconstraints would further degrade to severe environ-mental constraints.
Cultivated landUnder the climate change scenarios considered, theAEZ model predicts gains in potential agricultural landglobally. In particular, large gains are predicted forNorth America and the Russian Federation, due tolonger planting windows and generally more favourablegrowing conditions under warming. Significant lossesare by contrast predicted in northern and southernAfrica, due to a worsening of growing conditions fromincreased heat and water stresses.
Specifically, for the developed nations AEZ predictsunder all climate projections an expansion of potentialland suitable for crop cultivation, mostly at higherlatitudes. Increases are mainly located in NorthAmerica (40% increase over the 360 million hectaresunder current baseline climate); northern Europe(16% increase over current 45 million hectares);Russian Federation (64% increase over 245 million
100
110
120
130
140
150
inde
x (1
961–
90 =
100
) HAD3
CSIRO
CGCM2
NCAR
HAD3
CGCM2
NCAR
CSIRO
90
100
110
120
130
HAD3
CSIRO
CGCM2
NCAR
HAD3
NCAR
CGCM2
CSIRO
95
100
105
110
115
300 400 500 600
developed, all land developed, current cultivated land
developing, all land developing, current cultivated land
700 800 900
Co2 ppm Co2 ppm
inde
x (1
961–
90 =
100
) HAD3
CSIRO
CGCM2
NCAR
HAD3
CGCM2
NCAR
CSIRO
95
100
105
110
115
300 400 500 600 700 800 900
HAD3
CSIRO
CGCM2
NCAR
HAD3
NCAR
CGCM2
CSIRO
Figure 3. Changes in potentially attainable cereal-production predicted by AEZ under different GCM climate change scenarios,versus CO2 concentration. Projections are for either current cultivated land (right), or all available under future climates (left),and pooled into developed (top) and developing (bottom) countries. Results are expressed against an index of climate change(Z100 in 1990), a proxy for time from 1990 to 2080.
8 G. Fischer and others An integrated assessment of agriculture, 1990–2080
hectares) and in East Asia (10% increase over 150million hectares).
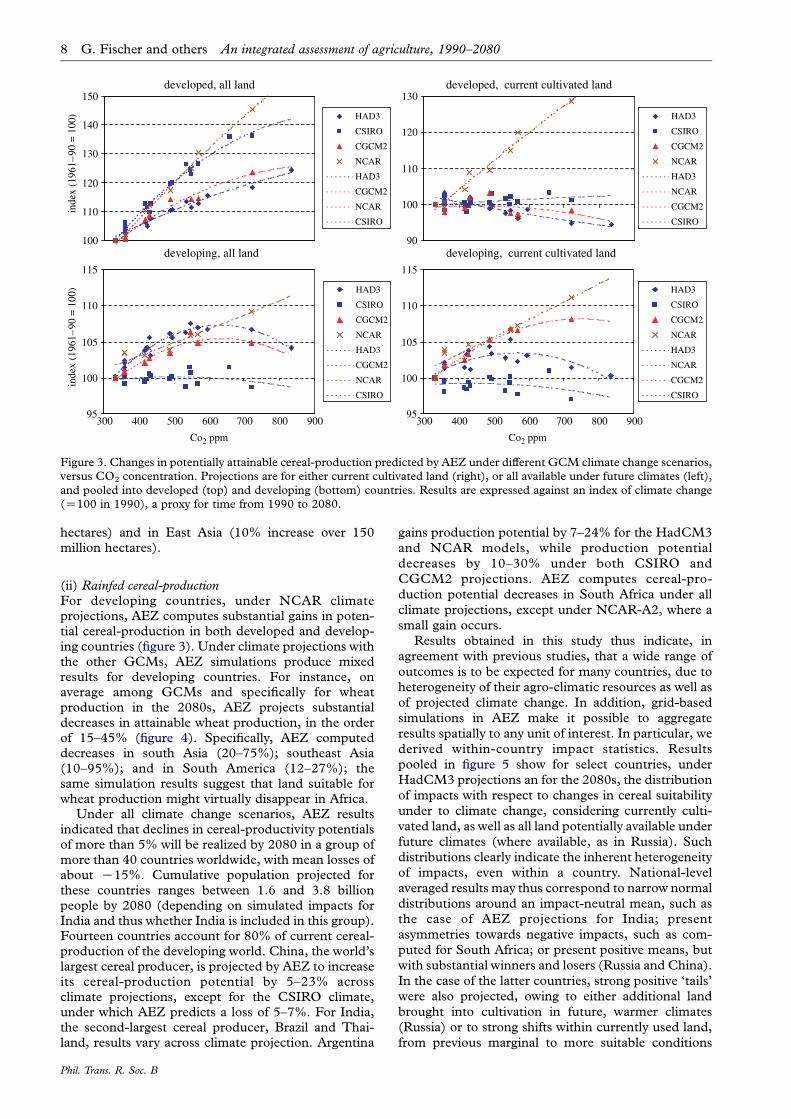
(ii) Rainfed cereal-productionFor developing countries, under NCAR climateprojections, AEZ computes substantial gains in poten-tial cereal-production in both developed and develop-ing countries (figure 3). Under climate projections withthe other GCMs, AEZ simulations produce mixedresults for developing countries. For instance, onaverage among GCMs and specifically for wheatproduction in the 2080s, AEZ projects substantialdecreases in attainable wheat production, in the orderof 15–45% (figure 4). Specifically, AEZ computeddecreases in south Asia (20–75%); southeast Asia(10–95%); and in South America (12–27%); thesame simulation results suggest that land suitable forwheat production might virtually disappear in Africa.
Under all climate change scenarios, AEZ resultsindicated that declines in cereal-productivity potentialsof more than 5% will be realized by 2080 in a group ofmore than 40 countries worldwide, with mean losses ofabout K15%. Cumulative population projected forthese countries ranges between 1.6 and 3.8 billionpeople by 2080 (depending on simulated impacts forIndia and thus whether India is included in this group).Fourteen countries account for 80% of current cereal-production of the developing world. China, the world’slargest cereal producer, is projected by AEZ to increaseits cereal-production potential by 5–23% acrossclimate projections, except for the CSIRO climate,under which AEZ predicts a loss of 5–7%. For India,the second-largest cereal producer, Brazil and Thai-land, results vary across climate projection. Argentina
Phil. Trans. R. Soc. B
gains production potential by 7–24% for the HadCM3and NCAR models, while production potentialdecreases by 10–30% under both CSIRO andCGCM2 projections. AEZ computes cereal-pro-duction potential decreases in South Africa under allclimate projections, except under NCAR-A2, where asmall gain occurs.
Results obtained in this study thus indicate, inagreement with previous studies, that a wide range ofoutcomes is to be expected for many countries, due toheterogeneity of their agro-climatic resources as well asof projected climate change. In addition, grid-basedsimulations in AEZ make it possible to aggregateresults spatially to any unit of interest. In particular, wederived within-country impact statistics. Resultspooled in figure 5 show for select countries, underHadCM3 projections an for the 2080s, the distributionof impacts with respect to changes in cereal suitabilityunder to climate change, considering currently culti-vated land, as well as all land potentially available underfuture climates (where available, as in Russia). Suchdistributions clearly indicate the inherent heterogeneityof impacts, even within a country. National-levelaveraged results may thus correspond to narrow normaldistributions around an impact-neutral mean, such asthe case of AEZ projections for India; presentasymmetries towards negative impacts, such as com-puted for South Africa; or present positive means, butwith substantial winners and losers (Russia and China).In the case of the latter countries, strong positive ‘tails’were also projected, owing to either additional landbrought into cultivation in future, warmer climates(Russia) or to strong shifts within currently used land,from previous marginal to more suitable conditions
50
60
70
80
90
100
110
300 400 500 600 700 800 900
HAD3
CSIRO
CGCM2
NCAR
HAD3
NCAR
CGCM2
CSIRO
50
60
70
80
90
100
110
300 400 500 600 700 800 900
inde
x (1
961–
90 =
100
) HAD3
CSIRO
CGCM2
NCAR
HAD3
CGCM2
NCAR
CSIRO
90
100
110
120
130
HAD3
CSIRO
CGCM2
NCAR
HAD3
NCAR
CGCM2
CSIRO
100
110
120
130
140
150in
dex
(196
1–90
= 1
00) HAD3
CSIRO
CGCM2
NCAR
HAD3
CGCM2
NCAR
CSIRO
Co2 ppm Co2 ppm
developed, all land developed, current cultivated land
developing, all land developing, current cultivated land
Figure 4. Changes in potentially attainable wheat production predicted by AEZ under different GCM climate change scenarios,versus CO2 concentration. Projections are for either current cultivated land (right), or all available under future climates (left),and pooled into developed (top) and developing (bottom) countries. Results are expressed against an index of climate change(Z100 in 1990), a proxy for time from 1990 to 2080.
Russia, all suitable landsouthern Africa,
current cultivated land
02468
1012141618
% o
f la
nd in
impa
ct c
lass
02468
10121416
% o
f la
nd in
impa
ct c
lass
China, current cultivated land India, current cultivated land
02468
101214
–100 –70 –40 –10 20 50 80 –100 –70 –40 –10 20 50 80SI changes by impact class
% o
f la
nd in
impa
ct c
lass
05
101520253035
SI changes by impact class
% o
f la
nd in
impa
ct c
lass
Figure 5. AEZ-simulated distribution of climate impacts on cereal productivity in the 2080s, under HadCM3-A1FI climateprojections. The diagrams show the distribution of land with respect to cereal suitability changes under climate change. Barsshown to the right of the red line indicate land pixels where suitability increased; bars to the left denote negative changes.SIZsuitability index for potential cereal-production computed by AEZ.
An integrated assessment of agriculture, 1990–2080 G. Fischer and others 9
(China), often brought about by more favourableprecipitation regimes under the projected climates.
Current food-insecure countriesThe total population of the over 80 poor food-insecurecountries currently amounts to some 4.2 billion, more
Phil. Trans. R. Soc. B
than 70% of current world population (FAO 2001);about 20% of this population is considered under-nourished. By the 2080s, the total population of thesecountries is projected to increase to 6.8 billion, or about80% of the world population at that time. Individualcountry outcomes in this group are reason for concern.
27
56
29
59
40
50
52
42
–6
–4
–2
0
2
4
6
8
gainers losers
Hadley, 2080 CSIR0, 2080
B1
B2
A2
A1F
36
37
43
30
48
35
30
49
–8
–6
–4
–2
0
2
4
6
gainers losers
% c
hang
e of
reg
iona
l tot
al
B1
B2
A2
A1B
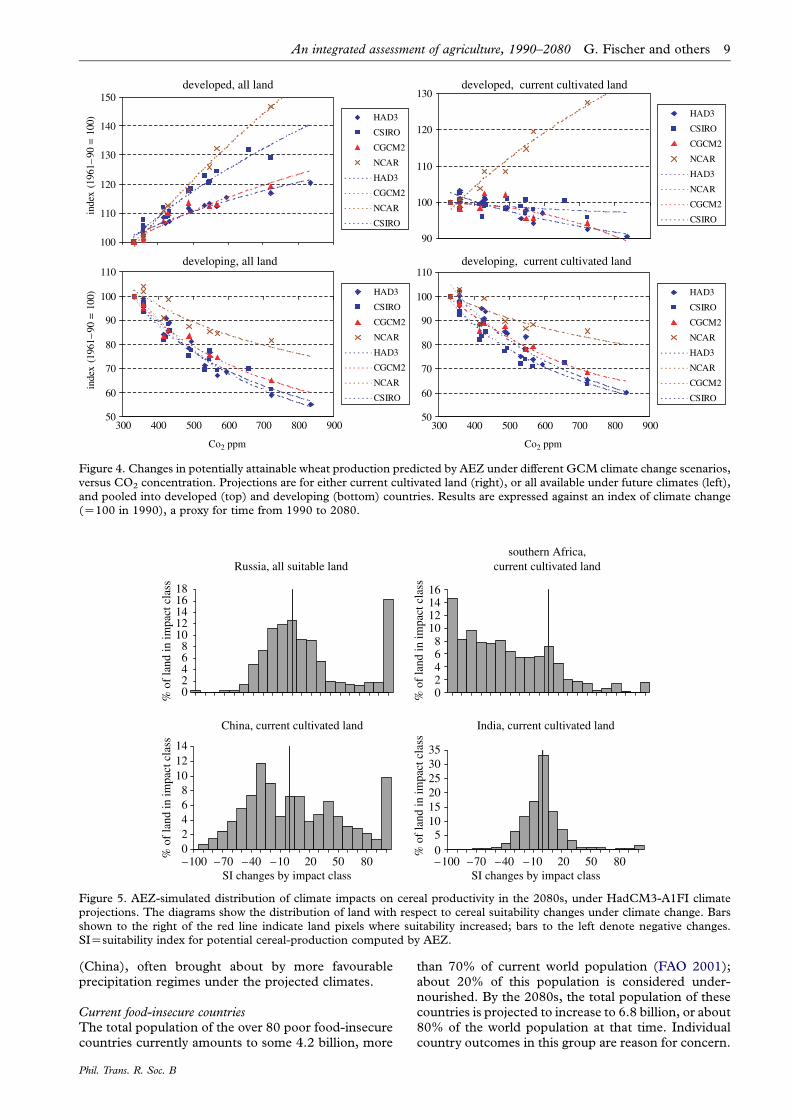
Figure 6. Impacts of climate change on rainfed cereal-production potential of developing countries, for currently cultivated landin the 2080s, according to HadCM3 and CSIRO climate projections.
10 G. Fischer and others An integrated assessment of agriculture, 1990–2080
For example, the AEZ results based on a suite of
HadCM3 projections (scenario A1FI to B1) indicatethat 20–40 poor and food-insecure countries, totalling
1–3 billion people, may lose on average 10–20% of theircereal-production potential under climate change.
Results for developing countries in terms of cereal-production potential for gaining and losing countries
are highlighted in figure 6, showing broad groups ofcountries where production capacity increases or
decreases by at least 5%, compared to current climate.With the exception of the results for the NCAR
model, simulations under all remaining climate scen-arios indicated that Sudan, Nigeria, Senegal, Mali,
Burkina Faso, Somalia, Ethiopia, Zimbabwe, Chad,Sierra Leone, Angola, Mozambique and Niger, would
lose cereal-production potential by the 2080s, across allthe emission scenarios. These countries currently have
87 million undernourished, equivalent to 45% of thetotal undernourished in sub-Saharan Africa. In con-
trast, Zaire, Tanzania, Kenya, Uganda, Madagascar,Cote d’Ivoire, Benin, Togo, Ghana and Guinea were all
projected to gain cereal-production potential by the2080s. These eight gaining countries currently have 73
million undernourished, equivalent to 38% of theundernourished population in sub-Saharan Africa.
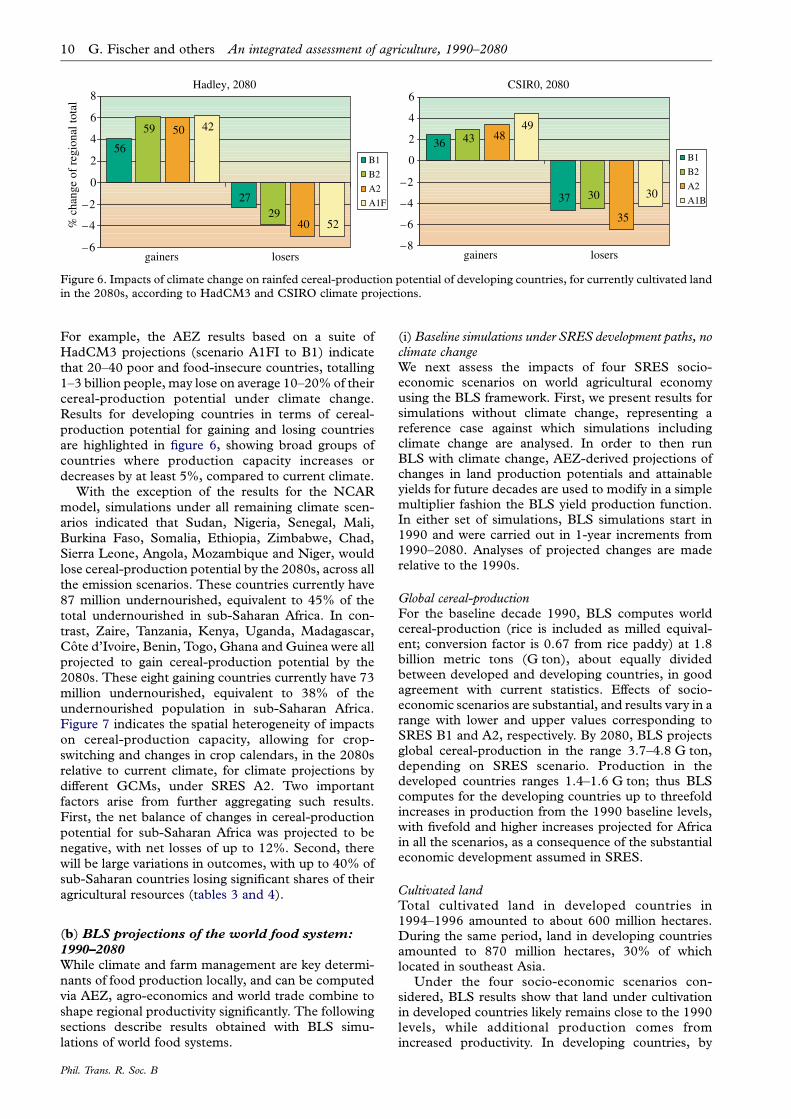
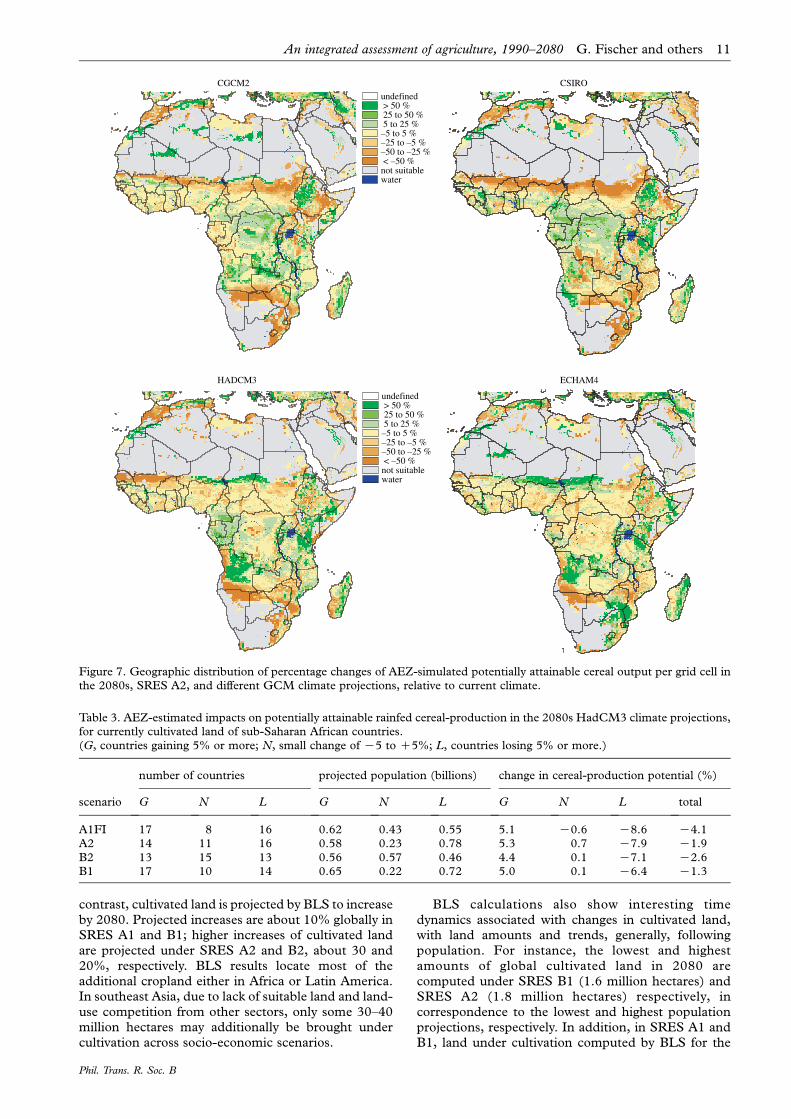
Figure 7 indicates the spatial heterogeneity of impactson cereal-production capacity, allowing for crop-
switching and changes in crop calendars, in the 2080srelative to current climate, for climate projections by
different GCMs, under SRES A2. Two importantfactors arise from further aggregating such results.
First, the net balance of changes in cereal-production
potential for sub-Saharan Africa was projected to benegative, with net losses of up to 12%. Second, there
will be large variations in outcomes, with up to 40% ofsub-Saharan countries losing significant shares of their
agricultural resources (tables 3 and 4).
(b) BLS projections of the world food system:
1990–2080
While climate and farm management are key determi-
nants of food production locally, and can be computedvia AEZ, agro-economics and world trade combine to
shape regional productivity significantly. The followingsections describe results obtained with BLS simu-
lations of world food systems.
Phil. Trans. R. Soc. B
(i) Baseline simulations under SRES development paths, noclimate changeWe next assess the impacts of four SRES socio-economic scenarios on world agricultural economyusing the BLS framework. First, we present results forsimulations without climate change, representing areference case against which simulations includingclimate change are analysed. In order to then runBLS with climate change, AEZ-derived projections ofchanges in land production potentials and attainableyields for future decades are used to modify in a simplemultiplier fashion the BLS yield production function.In either set of simulations, BLS simulations start in1990 and were carried out in 1-year increments from1990–2080. Analyses of projected changes are maderelative to the 1990s.
Global cereal-productionFor the baseline decade 1990, BLS computes worldcereal-production (rice is included as milled equival-ent; conversion factor is 0.67 from rice paddy) at 1.8billion metric tons (G ton), about equally dividedbetween developed and developing countries, in goodagreement with current statistics. Effects of socio-economic scenarios are substantial, and results vary in arange with lower and upper values corresponding toSRES B1 and A2, respectively. By 2080, BLS projectsglobal cereal-production in the range 3.7–4.8 G ton,depending on SRES scenario. Production in thedeveloped countries ranges 1.4–1.6 G ton; thus BLScomputes for the developing countries up to threefoldincreases in production from the 1990 baseline levels,with fivefold and higher increases projected for Africain all the scenarios, as a consequence of the substantialeconomic development assumed in SRES.
Cultivated landTotal cultivated land in developed countries in1994–1996 amounted to about 600 million hectares.During the same period, land in developing countriesamounted to 870 million hectares, 30% of whichlocated in southeast Asia.
Under the four socio-economic scenarios con-sidered, BLS results show that land under cultivationin developed countries likely remains close to the 1990levels, while additional production comes fromincreased productivity. In developing countries, by
undefined
CGCM2 CSIRO
HADCM3 ECHAM4
> 50 % 25 to 50 % 5 to 25 %–5 to 5 %–25 to –5 %–50 to –25 % < –50 %not suitablewater
undefined > 50 % 25 to 50 % 5 to 25 %–5 to 5 %–25 to –5 %–50 to –25 % < –50 %not suitablewater
Figure 7. Geographic distribution of percentage changes of AEZ-simulated potentially attainable cereal output per grid cell inthe 2080s, SRES A2, and different GCM climate projections, relative to current climate.
Table 3. AEZ-estimated impacts on potentially attainable rainfed cereal-production in the 2080s HadCM3 climate projections,for currently cultivated land of sub-Saharan African countries.(G, countries gaining 5% or more; N, small change of K5 to C5%; L, countries losing 5% or more.)
scenario
number of countries projected population (billions) change in cereal-production potential (%)
G N L G N L G N L total
A1FI 17 8 16 0.62 0.43 0.55 5.1 K0.6 K8.6 K4.1A2 14 11 16 0.58 0.23 0.78 5.3 0.7 K7.9 K1.9B2 13 15 13 0.56 0.57 0.46 4.4 0.1 K7.1 K2.6B1 17 10 14 0.65 0.22 0.72 5.0 0.1 K6.4 K1.3
An integrated assessment of agriculture, 1990–2080 G. Fischer and others 11
contrast, cultivated land is projected by BLS to increaseby 2080. Projected increases are about 10% globally inSRES A1 and B1; higher increases of cultivated landare projected under SRES A2 and B2, about 30 and20%, respectively. BLS results locate most of theadditional cropland either in Africa or Latin America.In southeast Asia, due to lack of suitable land and land-use competition from other sectors, only some 30–40million hectares may additionally be brought undercultivation across socio-economic scenarios.
Phil. Trans. R. Soc. B
BLS calculations also show interesting timedynamics associated with changes in cultivated land,with land amounts and trends, generally, followingpopulation. For instance, the lowest and highestamounts of global cultivated land in 2080 arecomputed under SRES B1 (1.6 million hectares) andSRES A2 (1.8 million hectares) respectively, incorrespondence to the lowest and highest populationprojections, respectively. In addition, in SRES A1 andB1, land under cultivation computed by BLS for the
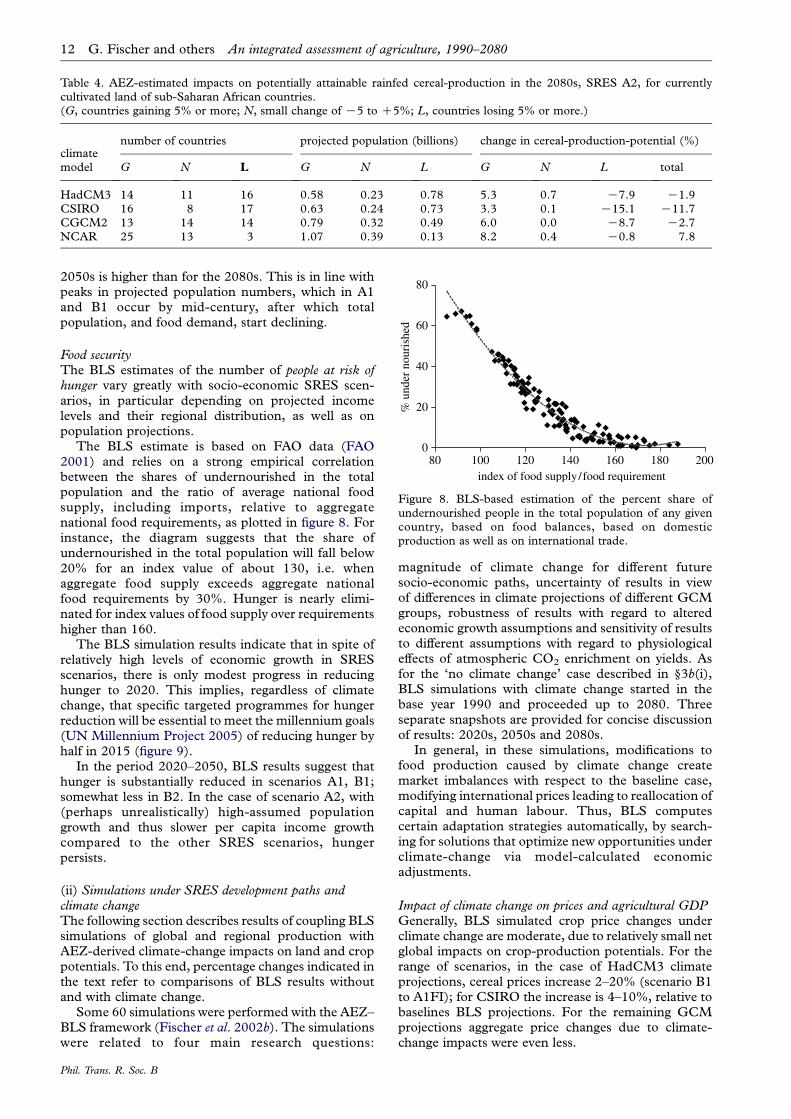
Table 4. AEZ-estimated impacts on potentially attainable rainfed cereal-production in the 2080s, SRES A2, for currentlycultivated land of sub-Saharan African countries.(G, countries gaining 5% or more; N, small change of K5 to C5%; L, countries losing 5% or more.)
climatemodel
number of countries projected population (billions) change in cereal-production-potential (%)
G N L G N L G N L total
HadCM3 14 11 16 0.58 0.23 0.78 5.3 0.7 K7.9 K1.9CSIRO 16 8 17 0.63 0.24 0.73 3.3 0.1 K15.1 K11.7CGCM2 13 14 14 0.79 0.32 0.49 6.0 0.0 K8.7 K2.7NCAR 25 13 3 1.07 0.39 0.13 8.2 0.4 K0.8 7.8
0
20
40
60
80
80 100 120 140 160 180 200index of food supply/food requirement
% u
nder
nou
rish
ed
Figure 8. BLS-based estimation of the percent share ofundernourished people in the total population of any givencountry, based on food balances, based on domesticproduction as well as on international trade.
12 G. Fischer and others An integrated assessment of agriculture, 1990–2080
2050s is higher than for the 2080s. This is in line withpeaks in projected population numbers, which in A1and B1 occur by mid-century, after which totalpopulation, and food demand, start declining.
Food securityThe BLS estimates of the number of people at risk ofhunger vary greatly with socio-economic SRES scen-arios, in particular depending on projected incomelevels and their regional distribution, as well as onpopulation projections.
The BLS estimate is based on FAO data (FAO2001) and relies on a strong empirical correlationbetween the shares of undernourished in the totalpopulation and the ratio of average national foodsupply, including imports, relative to aggregatenational food requirements, as plotted in figure 8. Forinstance, the diagram suggests that the share ofundernourished in the total population will fall below20% for an index value of about 130, i.e. whenaggregate food supply exceeds aggregate nationalfood requirements by 30%. Hunger is nearly elimi-nated for index values of food supply over requirementshigher than 160.
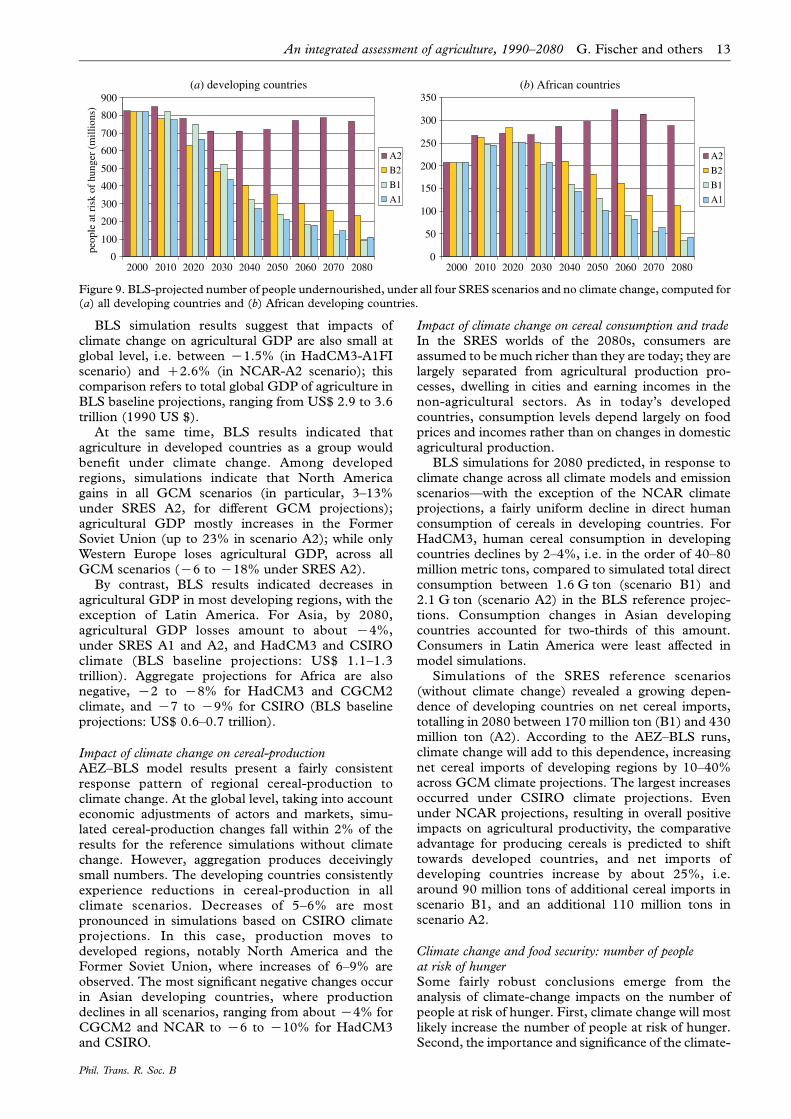
The BLS simulation results indicate that in spite ofrelatively high levels of economic growth in SRESscenarios, there is only modest progress in reducinghunger to 2020. This implies, regardless of climatechange, that specific targeted programmes for hungerreduction will be essential to meet the millennium goals(UN Millennium Project 2005) of reducing hunger byhalf in 2015 (figure 9).
In the period 2020–2050, BLS results suggest thathunger is substantially reduced in scenarios A1, B1;somewhat less in B2. In the case of scenario A2, with(perhaps unrealistically) high-assumed populationgrowth and thus slower per capita income growthcompared to the other SRES scenarios, hungerpersists.
(ii) Simulations under SRES development paths andclimate changeThe following section describes results of coupling BLSsimulations of global and regional production withAEZ-derived climate-change impacts on land and croppotentials. To this end, percentage changes indicated inthe text refer to comparisons of BLS results withoutand with climate change.
Some 60 simulations were performed with the AEZ–BLS framework (Fischer et al. 2002b). The simulationswere related to four main research questions:
Phil. Trans. R. Soc. B
magnitude of climate change for different futuresocio-economic paths, uncertainty of results in viewof differences in climate projections of different GCMgroups, robustness of results with regard to alteredeconomic growth assumptions and sensitivity of resultsto different assumptions with regard to physiologicaleffects of atmospheric CO2 enrichment on yields. Asfor the ‘no climate change’ case described in §3b(i),BLS simulations with climate change started in thebase year 1990 and proceeded up to 2080. Threeseparate snapshots are provided for concise discussionof results: 2020s, 2050s and 2080s.
In general, in these simulations, modifications tofood production caused by climate change createmarket imbalances with respect to the baseline case,modifying international prices leading to reallocation ofcapital and human labour. Thus, BLS computescertain adaptation strategies automatically, by search-ing for solutions that optimize new opportunities underclimate-change via model-calculated economicadjustments.
Impact of climate change on prices and agricultural GDPGenerally, BLS simulated crop price changes underclimate change are moderate, due to relatively small netglobal impacts on crop-production potentials. For therange of scenarios, in the case of HadCM3 climateprojections, cereal prices increase 2–20% (scenario B1to A1FI); for CSIRO the increase is 4–10%, relative tobaselines BLS projections. For the remaining GCMprojections aggregate price changes due to climate-change impacts were even less.
0
100
200
300
400
500
600
700
800
900
2000 2010 2020 2030 2040 2050 2060 2070 2080
peop
le a
t ris
k of
hun
ger
(mill
ions
)
A2
(a) developing countries (b) African countries
B2
B1
A1
0
50
100
150
200
250
300
350
2000 2010 2020 2030 2040 2050 2060 2070 2080
A2
B2
B1
A1
Figure 9. BLS-projected number of people undernourished, under all four SRES scenarios and no climate change, computed for(a) all developing countries and (b) African developing countries.
An integrated assessment of agriculture, 1990–2080 G. Fischer and others 13
BLS simulation results suggest that impacts ofclimate change on agricultural GDP are also small atglobal level, i.e. between K1.5% (in HadCM3-A1FIscenario) and C2.6% (in NCAR-A2 scenario); thiscomparison refers to total global GDP of agriculture inBLS baseline projections, ranging from US$ 2.9 to 3.6trillion (1990 US $).
At the same time, BLS results indicated thatagriculture in developed countries as a group wouldbenefit under climate change. Among developedregions, simulations indicate that North Americagains in all GCM scenarios (in particular, 3–13%under SRES A2, for different GCM projections);agricultural GDP mostly increases in the FormerSoviet Union (up to 23% in scenario A2); while onlyWestern Europe loses agricultural GDP, across allGCM scenarios (K6 to K18% under SRES A2).
By contrast, BLS results indicated decreases inagricultural GDP in most developing regions, with theexception of Latin America. For Asia, by 2080,agricultural GDP losses amount to about K4%,under SRES A1 and A2, and HadCM3 and CSIROclimate (BLS baseline projections: US$ 1.1–1.3trillion). Aggregate projections for Africa are alsonegative, K2 to K8% for HadCM3 and CGCM2climate, and K7 to K9% for CSIRO (BLS baselineprojections: US$ 0.6–0.7 trillion).
Impact of climate change on cereal-productionAEZ–BLS model results present a fairly consistentresponse pattern of regional cereal-production toclimate change. At the global level, taking into accounteconomic adjustments of actors and markets, simu-lated cereal-production changes fall within 2% of theresults for the reference simulations without climatechange. However, aggregation produces deceivinglysmall numbers. The developing countries consistentlyexperience reductions in cereal-production in allclimate scenarios. Decreases of 5–6% are mostpronounced in simulations based on CSIRO climateprojections. In this case, production moves todeveloped regions, notably North America and theFormer Soviet Union, where increases of 6–9% areobserved. The most significant negative changes occurin Asian developing countries, where productiondeclines in all scenarios, ranging from about K4% forCGCM2 and NCAR to K6 to K10% for HadCM3and CSIRO.
Phil. Trans. R. Soc. B
Impact of climate change on cereal consumption and tradeIn the SRES worlds of the 2080s, consumers areassumed to be much richer than they are today; they arelargely separated from agricultural production pro-cesses, dwelling in cities and earning incomes in thenon-agricultural sectors. As in today’s developedcountries, consumption levels depend largely on foodprices and incomes rather than on changes in domesticagricultural production.
BLS simulations for 2080 predicted, in response toclimate change across all climate models and emissionscenarios—with the exception of the NCAR climateprojections, a fairly uniform decline in direct humanconsumption of cereals in developing countries. ForHadCM3, human cereal consumption in developingcountries declines by 2–4%, i.e. in the order of 40–80million metric tons, compared to simulated total directconsumption between 1.6 G ton (scenario B1) and2.1 G ton (scenario A2) in the BLS reference projec-tions. Consumption changes in Asian developingcountries accounted for two-thirds of this amount.Consumers in Latin America were least affected inmodel simulations.
Simulations of the SRES reference scenarios(without climate change) revealed a growing depen-dence of developing countries on net cereal imports,totalling in 2080 between 170 million ton (B1) and 430million ton (A2). According to the AEZ–BLS runs,climate change will add to this dependence, increasingnet cereal imports of developing regions by 10–40%across GCM climate projections. The largest increasesoccurred under CSIRO climate projections. Evenunder NCAR projections, resulting in overall positiveimpacts on agricultural productivity, the comparativeadvantage for producing cereals is predicted to shifttowards developed countries, and net imports ofdeveloping countries increase by about 25%, i.e.around 90 million tons of additional cereal imports inscenario B1, and an additional 110 million tons inscenario A2.
Climate change and food security: number of peopleat risk of hungerSome fairly robust conclusions emerge from theanalysis of climate-change impacts on the number ofpeople at risk of hunger. First, climate change will mostlikely increase the number of people at risk of hunger.Second, the importance and significance of the climate-
0
25
50
75
100
125
150
175
300 400 500 600 700 800 900atmospheric CO2 concentration (ppm)
addi
tiona
l und
er-n
ouri
shed
due
to c
limat
e ch
ange
(m
illio
ns)
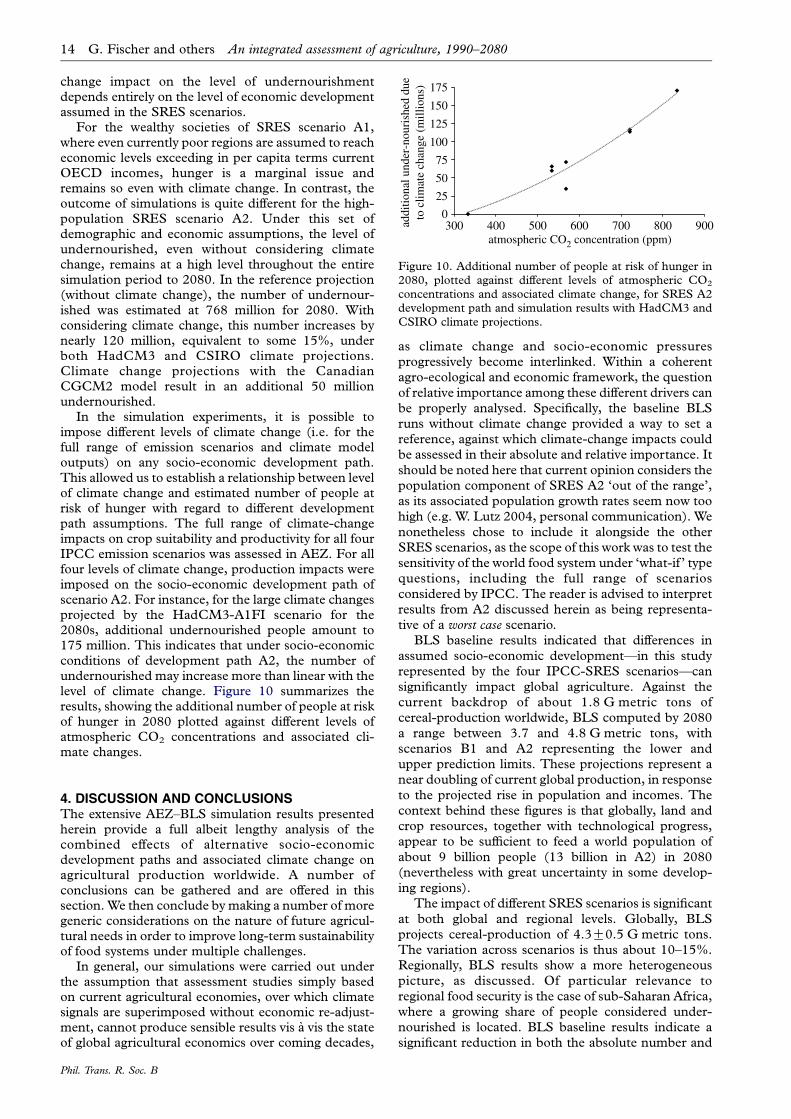
Figure 10. Additional number of people at risk of hunger in2080, plotted against different levels of atmospheric CO2
concentrations and associated climate change, for SRES A2development path and simulation results with HadCM3 andCSIRO climate projections.
14 G. Fischer and others An integrated assessment of agriculture, 1990–2080
change impact on the level of undernourishmentdepends entirely on the level of economic developmentassumed in the SRES scenarios.
For the wealthy societies of SRES scenario A1,where even currently poor regions are assumed to reacheconomic levels exceeding in per capita terms currentOECD incomes, hunger is a marginal issue andremains so even with climate change. In contrast, theoutcome of simulations is quite different for the high-population SRES scenario A2. Under this set ofdemographic and economic assumptions, the level ofundernourished, even without considering climatechange, remains at a high level throughout the entiresimulation period to 2080. In the reference projection(without climate change), the number of undernour-ished was estimated at 768 million for 2080. Withconsidering climate change, this number increases bynearly 120 million, equivalent to some 15%, underboth HadCM3 and CSIRO climate projections.Climate change projections with the CanadianCGCM2 model result in an additional 50 millionundernourished.
In the simulation experiments, it is possible toimpose different levels of climate change (i.e. for thefull range of emission scenarios and climate modeloutputs) on any socio-economic development path.This allowed us to establish a relationship between levelof climate change and estimated number of people atrisk of hunger with regard to different developmentpath assumptions. The full range of climate-changeimpacts on crop suitability and productivity for all fourIPCC emission scenarios was assessed in AEZ. For allfour levels of climate change, production impacts wereimposed on the socio-economic development path ofscenario A2. For instance, for the large climate changesprojected by the HadCM3-A1FI scenario for the2080s, additional undernourished people amount to175 million. This indicates that under socio-economicconditions of development path A2, the number ofundernourished may increase more than linear with thelevel of climate change. Figure 10 summarizes theresults, showing the additional number of people at riskof hunger in 2080 plotted against different levels ofatmospheric CO2 concentrations and associated cli-mate changes.
4. DISCUSSION AND CONCLUSIONSThe extensive AEZ–BLS simulation results presentedherein provide a full albeit lengthy analysis of thecombined effects of alternative socio-economicdevelopment paths and associated climate change onagricultural production worldwide. A number ofconclusions can be gathered and are offered in thissection. We then conclude by making a number of moregeneric considerations on the nature of future agricul-tural needs in order to improve long-term sustainabilityof food systems under multiple challenges.
In general, our simulations were carried out underthe assumption that assessment studies simply basedon current agricultural economies, over which climatesignals are superimposed without economic re-adjust-ment, cannot produce sensible results vis a vis the stateof global agricultural economics over coming decades,
Phil. Trans. R. Soc. B
as climate change and socio-economic pressuresprogressively become interlinked. Within a coherentagro-ecological and economic framework, the question
of relative importance among these different drivers canbe properly analysed. Specifically, the baseline BLSruns without climate change provided a way to set areference, against which climate-change impacts couldbe assessed in their absolute and relative importance. It
should be noted here that current opinion considers thepopulation component of SRES A2 ‘out of the range’,as its associated population growth rates seem now toohigh (e.g. W. Lutz 2004, personal communication). We
nonetheless chose to include it alongside the otherSRES scenarios, as the scope of this work was to test thesensitivity of the world food system under ‘what-if ’ typequestions, including the full range of scenarios
considered by IPCC. The reader is advised to interpretresults from A2 discussed herein as being representa-tive of a worst case scenario.
BLS baseline results indicated that differences in
assumed socio-economic development—in this studyrepresented by the four IPCC-SRES scenarios—cansignificantly impact global agriculture. Against thecurrent backdrop of about 1.8 G metric tons ofcereal-production worldwide, BLS computed by 2080
a range between 3.7 and 4.8 G metric tons, withscenarios B1 and A2 representing the lower andupper prediction limits. These projections represent anear doubling of current global production, in response
to the projected rise in population and incomes. Thecontext behind these figures is that globally, land andcrop resources, together with technological progress,appear to be sufficient to feed a world population of
about 9 billion people (13 billion in A2) in 2080(nevertheless with great uncertainty in some develop-ing regions).
The impact of different SRES scenarios is significant
at both global and regional levels. Globally, BLSprojects cereal-production of 4.3G0.5 G metric tons.The variation across scenarios is thus about 10–15%.Regionally, BLS results show a more heterogeneouspicture, as discussed. Of particular relevance to
regional food security is the case of sub-Saharan Africa,where a growing share of people considered under-nourished is located. BLS baseline results indicate asignificant reduction in both the absolute number and
An integrated assessment of agriculture, 1990–2080 G. Fischer and others 15
percentage (compared to world population) of under-nourished people, i.e. at risk of hunger, for all SRESscenarios by 2080, except for A2, due to significantlylarger populations and slower per capita income growthin that scenario. Under A2, BLS predicts the number ofundernourished in 2080 to be 768 million, virtuallyequivalent to today’s figures. Even taking A2 out of thepicture, BLS average results, across scenarios, indicate150G50 million undernourished people by 2080.Variability across scenarios, of about 30%, is thusmuch larger than computed for global food production.
Importantly, all scenarios indicated that reduction ofworld hunger will be small, until 2030 globally, andperhaps not until 2040 for sub-Saharan Africa. Theseresults are important in terms of UN millenniumdevelopment goals, i.e. the current commitment ofdeveloped nations to reduce hunger by half by 2015.BLS results suggest that global economic developmentcan ‘trickle down’ to poor regions to nearly eradicateworld hunger by the 2050s and 2080s, provided highlevels of economic growth are accompanied bymoderate population increase. Yet, under all scenariosconsidered, BLS results indicate that millenniumdevelopment goals cannot be met simply throughmarket mechanisms, and that additional targetedactions would be necessary.
The impacts of climate change were found to becritically dependent upon SRES development scenarioand on GCM regionally, but not so much globally. Atthe global level simulation results indicate only smallpercentage changes from the baseline reference casewith respect to cereal-production. Analyses of theAEZ–BLS framework thus indicate that the two levelsof adaptation considered in our simulations, i.e.autonomous adaptation at the field level, such aschanging of crop calendars and cropping systems as afunction of climate; and market adjustments at bothregional (re-distribution of capital, labour and land)and global (trade) levels, can successfully combine toreduce otherwise larger negative impacts, as computedby AEZ alone. Regionally, climate change effects wereto further widen the gap between developed anddeveloping countries, in addition to results analysedunder the BLS reference cases. The conclusion is thatclimate change impacts will be more severe in tropicalsemi-arid developing countries. The AEZ–BLS resultssuggest reductions in production in developingcountries, in the 5–10% range, accompanied by similarincreases of production in northern developed regions,especially North America and Russia. Finally, in termsof food security, AEZ–BLS results indicate significantclimate change effects would occur only if levels ofundernourishment were already high under ‘no climatechange’ conditions, e.g. as in SRES A2. In particularfor SRES A2, projected climate change resulted in anadditional 15% increase in the number of under-nourished people. Under the other three SRESscenarios, simulated climate-change impacts on foodsecurity were rather small (in absolute terms) due toprojected demographic and socio-economic changesthat substantially reduced the risk of under-nutrition.
In conclusion, the AEZ–BLS results provided for in-depth analysis of the potential interactions betweensocio-economic pressures and climate-change impacts
Phil. Trans. R. Soc. B
over the coming decades. Results suggest that socio-
economic development over this century will greatly
alter production, trade, distribution and consumptionof food products worldwide, as a consequence of
population growth, economic growth, and diet changes
in developing countries. Climate change will addition-ally modify agricultural activities, probably increasing
any gaps between developing and developed countries.
Adaptation strategies, both on-farm and via market
mechanisms, will be important contributors to limitingthe severity of impacts. Additional climate change
pressures, not investigated in this study, may arise by
changes in the frequency of extreme precipitationevents such as floods and droughts, which may
diminish the capacity of countries to adapt, especially
in poor tropical regions.
The climate change issue is global, long-term andinvolves complex interaction between demographic,
climatic, environmental, economic, health, political,
institutional, social and technological processes. It hassignificant international and intergenerational impli-
cations in the context of equity and sustainable
development. Climate change will impact on social,
economic and environmental systems and shapeprospects for food, water and health security (Steffen
et al. 2004; WHO 2003). The capacity to mitigate and
to adapt to climate-change impacts is strongly relatedto the future development paths. The socio-economic
and, even more so, the technological characteristics of
different futures strongly affect emissions, hence the
extent and pace of the impacts of climate change, aswell as the capability of societies to adapt to and
mitigate climate change. Recent developments in
geographical information systems, data acquisition byremote sensing, and the increasing quality and spatial
coverage of global resource databases, has enabled
modelling to identify potentials and environmental
constraints to crop production at regional and nationallevels. The integration of these assessments in the
global food economy together with projections of future
climate change and variability enables evaluation ofimpacts of climate change on agriculture and provides a
basis of prioritizing regional and commodity specific
agricultural research for adaptation and mitigation.
Climate change and variability may result inirreparable damage to arable land and water resources
in some regions, and with serious local consequences
for food production. These losses will be felt mostprofoundly in developing countries with low capacity to
cope and adapt. While the international community
has focused on climate change mitigation, the issue of
adaptation to climate change is an equally pressingissue and must be put on the international negotiation
agenda. This is of critical importance to many
developing countries that have contributed little togreenhouse gas emissions thus far and yet, it is these
countries that will bear the brunt of the negative
impacts of climate change and variability.
We thank two anonymous reviewers for their valuablecomments, which greatly improved clarity and substance ofthis paper. F. N. T. was supported in part by NOAA Researchgrant GC02-333, and by a US–Italy Climate Change Grantfrom INGV-Bologna.
16 G. Fischer and others An integrated assessment of agriculture, 1990–2080
REFERENCESAinsworth, E. A. & Long, S. P. 2005 What have we learned
from 15 years of free-air CO2 enrichment (FACE)?
A meta-analysis of the responses of photosynthesis,
canopy properties and plant production to rising CO2.
New Phytol. 165, 351–372. (doi:10.1111/j.1469-8137.
2004.01224.x.)
FAO 2001 The State of Food Insecurity in the World, 2001. Food
and Agriculture Organization of the United Nations,
Rome, Italy, ISBN 92-5-104628-X.
FAO 2003 World Agriculture: Towards 2015/1030. In A FAO
perspective (ed. Jelle Bruinsma), p. 432. Rome: Food and
Agricultural Organization of the United Nations.
Felzer, B., Kicklighter, D. W., Melillo, J. M., Wang, C.,
Zhuang, Q. & Prinn, R. 2004 Effects of ozone on net
primary production and carbon sequestration in the
conterminous United States using a biogeochemistry
model. Tellus 56B, 230–248.
Fischer, G. & Sun, L. 2001 Model-based analysis of future
land-use development in China. Agr. Ecosyst. Environ. 85,
163–176. (doi:10.1016/S0167-8809(01)00182-7.)
Fischer, G., Frohberg, K., Parry, M. L. & Rosenzweig, C.
1994 Climate change and world food supply, demand and
trade: who benefits, who loses? Global Environ. Change 4,
7–23. (doi:10.1016/0959-3780(94)90018-3.)
Fischer, G., Frohberg, K., Parry, M. L. & Rosenzweig, C.
1996 Impacts of potential climate change on global and
regional food production and vulnerability. In Climate
change and world food security, vol. 137 (ed. E. T. Downing),
pp. 115–159. Berlin: Springer-Verlag.
Fischer, G., Frohberg, K., Keyzer, M. A. & Parikh, K. S.
1988 Linked national models: a tool for international policyanalysis. Dordrecht, The Netherlands: Kluwer Academic.
Fischer, G., van Velthuizen, H., Shah, M. & Nachtergaele,
F. O. 2002a Global agro-ecological assessment for agriculture in
the 21st century: methodology and results. IIASA RR-02-02.
Laxenburg, Austria: IIASA.
Fischer, G., Shah, M., & van Velthuizen, H. 2002b Climate
Change and Agricultural Vulnerability, Special Report to
the UN World Summit on Sustainable Development,
Johannesburg 2002. IIASA, Laxenburg, Austria.
Flato, G. M., Boer, G. J., Lee, W. G., McFarlane, N. A.,
Ramsden, D., Reader, M. C. & Weaver, A. J. 2000 The
Canadian centre for climate modelling and analysis global
coupled model and its climate. Climate Dyn. 16, 451–467.
(doi:10.1007/s003820050339.)
Gordon, H. B. & O’Farrell, S. P. 1997 Transient climate
change in the CSIRO coupled model with dynamic sea ice.
Mon. Weather Rev. 125, 875–907. (doi:10.1175/1520-
0493(1997)125!0875:TCCITCO2.0.CO;2.)
Gordon, C., Cooper Sr., C. A., Banks, H., Gregory, J. M.,
Johns, T. C., Mitchell, J. F. B. & Wood, R. A. 2000 The
simulation of SST, sea ice extents and ocean heat
transports in a version of the Hadley centre coupled
model without flux adjustments. Climate Dyn. 16,
147–168. (doi:10.1007/s003820050010.)
Hirst, A. C., Gordon, H. B. & O’Farrell, S. P. 1997 Response
of a coupled ocean-atmosphere model including oceanic
eddy-induced advection to anthropogenic CO2 increase.
Geophys. Res. Lett. 23, 3361–3364. (doi:10.1029/
96GL03234.)
IPCC 2000 Summary for policymakers, emissions scenarios.
A Special Report of IPCC Working Group III, Inter-
governmental Panel on Climate Change. Cambridge, UK:
Cambridge University Press.
IPCC, 2001a Climate change 2001: the scientific basis.
Contribution of working group I to the third assessment
report of the Intergovernmental panel on climate change,
ISBN 0521-014-95-6.
Phil. Trans. R. Soc. B
IPCC 2001b IPCC climate change 2001: impacts, adaptation,
and vulnerability. Contribution of working group II to the
third assessment report of the intergovernmental panel on
climate change. Cambridge, UK: Cambridge University
Press.
Jablonski, L. M., Wang, X. & Curtis, P. S. 2002 Plant
reproduction under elevated CO2 conditions: a meta-
analysis of reports on 79 crop and wild species. New Phytol.
156, 9–26. (doi:10.1046/j.1469-8137.2002.00494.x.)
Kimball, B. A., Kobayashi, K. & Bindi, M. 2002 Responses of
agricultural crops to free-air CO2 enrichment. Adv. Agron.
77, 293–368.
Millennium Ecosystem Assessment 2005 Ecosystems and
human well-being: synthesis. Washington, DC: Island Press.
Nakicenovic, N. et al. 2003 IPCC SRES revisited: a response.
Clim. Change 14, 187–214.
Oberhuber, J. M. 1993 Simulation of the Atlantic circulation
with a coupled sea-ice mixed layer-isopycnal general
circulation model. Part I: model description. J. Phys.
Oceanogr. 13, 808–829. (doi:10.1175/1520-0485(1993)
023!0808:SOTACWO2.0.CO;2.)
Olesen, J. E. & Bindi, M. 2002 Consequences of climate
change for European agricultural productivity, land use
and policy. Eur. J. Agron. 16, 239–262. (doi:10.1016/
S1161-0301(02)00004-7.)
Parry, M. L., Rosenzweig, C., Iglesias, A., Fischer, G. &
Livermore, M. T. J. 1999 Climate change and world food
security: a new assessment. Global Environ. Change 9,
51–67. (doi:10.1016/S0959-3780(99)00018-7.)
Parry, M. L. et al. 2001 Millions at risk: defining critical
climate change threats and targets. Global Environ. Change
11, 181–183. (doi:10.1016/S0959-3780(01)00011-5.)
Parry, M. L., Rosenzweig, C., Iglesias, A., Livermore, M. &
Fischer, G. 2004 Effects of climate change on global food
production under SRES emissions and socio-economic
scenarios. Global Environ. Change 14, 53–67. (doi:10.
1016/j.gloenvcha.2003.10.008.)
Pope, V. D., Gallani, M. L., Rowntree, P. R. & Stratton, R. A.
2000 The impact of new physical parametrizations in the
Hadley Centre climate model—HadAM3. Climate Dyn.
16, 123–146. (doi:10.1007/s003820050009.)
Reilly, J., Tubiello, F. N., McCarl, B. & Melillo, J. 2001
Climate change and agriculture in the United States. In
Climate change impacts on the United States: foundation,
USGCRP (ed. J. Melillo, G. Janetos & T. Karl),
pp. 379–403. Cambridge, UK: Cambridge University
Press.
Reilly, J. et al. 2003 U.S. Agriculture and climate change: new
results. Climatic Change 57, 43–69.
Roeckner et al. 1992 Simulation of the present-day climate with
the ECHAM 4 model: impact of model physics and resolution.
Max-Planck Institute for Meteorology, Report No. 93,
p. 171, Hamburg, Germany.
Roeckner, E. et al. 1996 The atmospheric general circulation
model ECHAM-4: model description and simulation of
present-day climate, Max-Planck Institute for Meteorology,
Report No. 218, p. 90, Hamburg, Germany.
Rosenzweig, C. & Parry, M. L. 1994 Impacts of climate
change on world food supply. Nature 367, 133–138.
(doi:10.1038/367133a0.)
Rosenzweig, C. & Tubiello, F. N. In press. Interactions of
adaptation and mitigation strategies in agriculture.
Mitigation and adaptation strategies for climate change.
Rosenzweig, C., Tubiello, F. N., Goldberg, R. A., Mills, E. &
Bloomfield, J. 2002 Increased crop damage in the U.S.
from excess precipitation under climate change. Global
Environ. Change 12, 197–202. (doi:10.1016/S0959-
3780(02)00008-0.)
An integrated assessment of agriculture, 1990–2080 G. Fischer and others 17
Rosenzweig, C., Allen , L. H., Harper, L. A., Hollinger, S. e.& Jones, J. W. (eds) 1995 Climate change and agriculture:analysis of potential international impacts. ASA SpecialPublication No. 59. Madison, WI: ASA, CSSA and SSSA.
Steffen, W., Sanderson, A., Tyson, P. D., Jager, J., Matson,P. A., Moore III, B., Oldfield, F., Richardson, K.,Schellnhuber, H. J., Turner, B. L. & Wasson, R. J. (eds)2004 Global change and the Earth system: a planet underpressure. Berlin, Heidelberg, New York: Springer-Verlag.
Tsuji, G. Y., Uehara, G. & Balas, S. (eds) 1994 DSSAT v3,volumes 1, 2 and 3. Honolulu, Hawaii: InternationalBenchmark Sites Network for Agrotechnology Transfer,University of Hawaii.
Tubiello, F. N. 2005 Climate variability and agriculture:perspectives on current and future challenges. In Impact ofclimate change, variability and weather fluctuations on cropsand their produce markets (ed. B. Knight), Impact Reports,Cambridge, UK.
Tubiello, F. N., Jagtap, S., Rosenzweig, C., Goldberg, R. &Jones, J. W. 2002 Effects of climate change on U.S. cropproduction from the National assessment. Simulation
Phil. Trans. R. Soc. B
results using two different GCM scenarios. Part I: wheat,potato, corn, and citrus. Climate Res. 20, 259–270.
Tubiello, F. N. & Ewert, F. 2002 Modeling the effects ofelevated CO2 on crop growth and yield: a review. Eur. J. Agr.18, 57–74. (doi:10.1016/S1161-0301(02)00097-7.)
Investing in development. A practical plan to achieve theMillenium development goals. Report to the UN SecretaryGeneral. 2005. ISBN 1-884707-217-1, New York.
Washington, W. M. et al. 2000 Parallel climate model (PCM)control and transient simulations. Climate Dyn. 16,755–774. (doi:10.1007/s003820000079.)
Watson, R. T., Noble, I. R., Bolin, B., Ravindranath, N. H. &Verardo, D. J. (eds) 2000 Land use, land-use change, andforestry. Special report of the intergovernmental panel onclimate change. Cambridge, UK: Cambridge UniversityPress.
WHO 2003 Climate change and human health—risks andresponses. Geneva: WHO.
Williams, J. R., Renard, K. G. & Dyke, P. T. 1984 EPIC—anew model for assessing erosion’s effect on soil pro-ductivity. J. Soil Water Conserv. 8, 381–383.


Additional copies
Further copies of this IIASA Reprint are available online at www.iiasa.ac.at/Publications
Hard copies are also available for a small handling charge. Orders must include the publication number and should be sent to the Publications Department, International Institute for Applied Systems Analysis, A-2361 Laxenburg, Austria.
Telephone: +43 2236 807 Telefax: +43 2236 71313 E-mail: [email protected]