Embed Size (px)
Citation preview
SOCIO-DEMOGRAPHIC STRUCTURE OF SYDNEY'S PERIMETROPOLITAN REGIONAuthor(s): P.A. Murphy and I.H. BurnleySource: Journal of the Australian Population Association, Vol. 10, No. 2 (November 1993), pp.127-144Published by: SpringerStable URL: http://www.jstor.org/stable/41110636 .
Accessed: 15/06/2014 19:12
Your use of the JSTOR archive indicates your acceptance of the Terms & Conditions of Use, available at .http://www.jstor.org/page/info/about/policies/terms.jsp
.JSTOR is a not-for-profit service that helps scholars, researchers, and students discover, use, and build upon a wide range ofcontent in a trusted digital archive. We use information technology and tools to increase productivity and facilitate new formsof scholarship. For more information about JSTOR, please contact [email protected].
.
Springer is collaborating with JSTOR to digitize, preserve and extend access to Journal of the AustralianPopulation Association.
http://www.jstor.org
This content downloaded from 62.122.73.86 on Sun, 15 Jun 2014 19:12:08 PMAll use subject to JSTOR Terms and Conditions
Vol.10, No.2, 1993 Journalof the Australian Population Association
SOCIO-DEMOGRAPHIC STRUCTURE OF SYDNEY'S PERIMETROPOLITAN REGION
PA. Murphy School of Town Planning
I.H. Burnley School of Geography
University of New South Wales PO Boxi
Kensington N.S.W. 2033
The reach of cities extends well beyond the newest outer suburbs to at least the limits of commuting. Beyond the suburbs lie rural lands and urban centres which increasingly take on the function of suburbs. This perimetropolitan region has been researched from various perspectives and there has been a resurgence of interest in recent years. The paper conceptualizes processes driving change in perimetropolitan regions then, using Sydney as a case study, analyses population growth rates and internal migration patterns between 1981 and 1991. Next, a set of social and demographic variables derived from the 1986 Census is analysed to derive four key dimensions of socio-spatial structure, namely: disadvantage, rurality, socio-economic status and retirement.
This paper focuses on what we term the perimetropolitan region. This region includes both the recently urbanized edges of a metropolis plus the space into which it is expanding physically, through suburbanization, and functionally, through commuter and recreational travel The region thus incorporates the outer part of what Parr (1986) called the 'metropolitan-area- based region*. It consists of the suburban edge of the metropolitan region plus a set of urban centres within a matrix of rural land. Urban centres may have been established as central places for rural hinterlands or else as tourist destinations, mining or industrial towns, or a combination of these. Rural land was traditionally used for farming and to varying degrees still is. As the metropolis grows both urban centres and rural areas are absorbed by suburbia or transformed into commuter towns and rural residential zones.
Perimetropolitan regions have been analysed for many years in the urban studies and planning literatures of Europe and America. Apart from studies of new suburbs, among the foci of research have been the functional reach of metropolitan regions, extending well beyond their contiguous built-up edges, landuse changes at the rural-urban fringe, the growth of rural residential and retirement living, and loss of agricultural land to urban development. Studies of the outer rural and urban parts of these regions have undergone a resurgence in recent years. Writers on the population turnaround, for example, recognize that much so called non-metropolitan population growth occurs in or not far beyond, the 'commuter sheds' of large cities, at least in
127
This content downloaded from 62.122.73.86 on Sun, 15 Jun 2014 19:12:08 PMAll use subject to JSTOR Terms and Conditions
North America, the United Kingdom and Europe (Champion 1989). In Australia it is arguable that coastal growth in New South Wales and Queensland is more voluminous than perimetropolitan growth, depending, of course, on how metropolitan boundaries are delimited.
Embedded within and near to the built-up edges of metropolitan regions are what American writers call 'edge cities' (Garreau 1991). These are employment and service centres of such large scale that it is no longer meaningful to talk about them as suburban. Relatedly, large urbanized regions are breaking up into territories with ever more functional closure from each other and the original metropolitan cores. North American work on *exurbia' which seems to be synonymous with the zone of what Australians would call rural residential living, postulates a major strengthening of the trend to highly decentralized living patterns in the outer rural parts of perimetropolitan regions (Nelson and Dueker 1990).
This paper aims to describe and interpret the socio-demographic structure of Sydney's perimetropolitan region against a backdrop of contemporary economic and social processes. Sydney was chosen for analysis because, being the Australian city with the largest population, it is likely to exhibit sharply the range of perimetropolitan demographic and social trends. The precise objectives and methodology of the paper are described below. It is first necessary to establish a theoretical context within which the research can be situated.
Processes of Perimetropolitan Change Population growth and social change in perimetropolitan regions are driven
primarily by intra-urban migration, mostly from the metropolitan core. Two bodies of theory inform contemporary research on this region. First, there is theory of the population turnaround, much of which takes place within the outer parts of perimetropolitan regions. Second, there is theory relating to the new suburban fringe which, for our purposes, is the inner edge of the perimetropolitan region.
Population Turnaround Since the mid-1960s, a demographic process commonly called the
"population turnaround' has become a distinct trend in many industrialized countries in the Western world. Migration is a key factor in this process, wherein 'non-metropolitan' populations have increased significantly more rapidly than the longer established metropolitan populations. Migration is important in the turnaround because of less migration to major cities from smaller centres and greater outmigration from metropolitan centres. The overall turnaround is believed to have resulted from structural change in the economy, lifestyle shifts, and better transport, communications and personal mobility (Hugo and Smailes 1985, Hugo 1992). The present study focuses on a major locus of the 'turnaround', those parts of perimetropolitan Sydney which are beyond the suburban edge.
Implicit in the idea of the turnaround is the notion that not only has there been a lifestyle shift, resulting in perimetropolitan localities being perceived as
128
This content downloaded from 62.122.73.86 on Sun, 15 Jun 2014 19:12:08 PMAll use subject to JSTOR Terms and Conditions
environmentally and aesthetically desirable and in which leisure plays an important part, but there has been growth in incomes which allows people to migrate there and to sustain long distance connections with the city proper. Migration to the perimetropolitan region, whether residentially rural or residentially urban, may be an extension of intra-metropolitan mobility, rather than true migration, since earlier interactional links with metropolitan communities may be at least partially maintained. Alternatively, there may be a discontinuity in interaction patterns between the urban residential parts of the metropolitan periphery and the rural areas. It may be that those settling in rural areas near the edge of the metropolis are making a stronger alternative lifestyle choice than those who move to the urban edge residential areas. There may be differences in the migration profiles between the residentially urban sections of the periphery and the residentially rural parts. Those settling in the rural parts may trade off accessibility to the metropolitan core for amenity whereas those in the urban parts are more constrained in their location choice to seek accessibility.
Following the notion of there being an urbanization continuum, and an urban-rural continuum, a debate which has been part of sociology for almost a century, there may be substantive similarities in population characteristics and migration selectivity between outer suburban evolution and perimetropolitan urban evolution. This would assume that perimetropolitan migration and community formation is primarily an extension of suburbanization processes. Alternatively, the urbanization continuum may have discontinuities and such breaks, despite certain similarities, may occur between perimetropolitan rural in-migration and perimetropolitan urban in- migration; and between suburbanization in-migration and exurban migration.
Within the perimetropolitan zone, additional differences may exist between older towns formerly outside the metropolitan region but now incorporated within it through metropolitan expansion and longer distance commuting, and rural areas. There may be differences between socio-economic characteristics of movers to older towns caught up in perimetropolitan change, and the characteristics of movers to adjacent rural areas or to newly emerging urban areas. It is possible, for example, that movement to the older towns may, to an extent, resemble gentrification of the inner city if younger, more affluent persons buy and renovate older established housing. Conversely, lower income persons may migrate to such older towns and villages where cheap rental or owner-occupied housing is available. If the latter type of movement is involved, there could be a different socio-economic and family profile of in fnovers to the older towns as compared with movement on to rural land nearby.
Ideally the morphology and density of perimetropolitan settlement must be seen against the migration processes and characteristics underway, demographic and motivational factors in the migration, and choice and constraint factors in the movement. More particularly, the role of structural economic and social change in the movement of lower income individuals and families to the varying settlement types within the perimetropolitan region requires detailed examination. Such structural change in the metropolitan
129
This content downloaded from 62.122.73.86 on Sun, 15 Jun 2014 19:12:08 PMAll use subject to JSTOR Terms and Conditions
region may drive people on lower incomes to the metropolitan periphery and, in particular, to smaller, older towns.
Most population and social atlases of Australia's metropolitan centres have not charted the perimetropolitan zone in any detail, and sample surveys have not been sufficiently detailed to allow identification of exurbanites as a group. The processes and settlement outcomes, modified by planning operations or restrictions in part, could result in spatial stratification within perimetropolitan development in terms of advantaged and disadvantaged populations. But, to identify such inequalities, reference must be made to wider metropolitan residential processes and socio-economic change. The fact that almost all social atlases compiled for Sydney have not presented information for areas beyond Faulconbridge in the lower Blue Mountains, Camden and Campbelltown in the southwest, and the Hawkesbury River in the north, indicates uncertainty about the extent of the functional metropolis and about the sociological and settlement characteristics of the perimetropolitan region.
Residential Choice at the Metropolitan Edge The standard urban land rent model, which limits its focus to outer
metropolitan suburbs - although it can logically be extended to incorporate ultra-low density rural residential development - implies that the relatively affluent should Uve at the edge of the metropolis at low densities and use their wealth to support long distance commuting to centralized employment. Whilst the logic which leads to this conclusion is strong, the model says nothing explicit about change. Nor is the logic based on immutable premises since on the edges of Australian cities it is predominantly younger, lower income earners who are colonists.
The land rent model assumes that accessibility to amenities and employment, both of which were traditionally located in the inner city, results in the most expensive land being located there. While well-off persons have been increasingly taking up residence in the inner city, some via gentrification, poorer people have been traditionally able to reside there by living at higher densities. However, there have been displacement effects in the inner city due to steeply rising housing costs and erosion of cheaper rental stock. At the same time there has been recent decentralization of office development which makes perimetropolitan settlement more viable.
In the evolving perimetropolitan region, a diversity of settlement exists. There is considerable social diversity due to different niches which include cheaper and more expensive privately supplied housing, public housing, up- market rural residential subdivisions and cheaper rural land and housing in small towns. In this large region there may be displacement effects as fanners close down or relocate to be supplanted by exurbanites. Neither land rent nor population turnaround theories can fully explain this diversity but they constitute a starting point for empirical exploration.
Recent survey research for the National Housing Strategy (1992) showed, contrary to popular understanding, that a substantial proportion of home buyers in outer suburbia are in fact purchasing second and subsequent homes and can thus be considered to be relatively well-off rather than first home
130
This content downloaded from 62.122.73.86 on Sun, 15 Jun 2014 19:12:08 PMAll use subject to JSTOR Terms and Conditions
buyers being forced to the periphery. Whilst this may be trae, the lion's share of first home buyers undoubtedly locate in the outer suburbs. It is arguable, moreover, that the impacts of economic restructuring in the 1980s, which included job loss and steeply increasing housing costs, were greater in Sydney than in other regions of Australia, and that consequently relatively more were pushed to the perimetropolitan zone.
Methodology The Sydney Region
Sydney's lateral expansion, controlled by transportation routes and reinforced by metropolitan plans, is sectoral. Each sector is served by commuter rail and freeways. In the southwest sector, which extends for present purposes to the Bowral-Mittagong area, peripheral development is relatively unimpeded by topography and existing major urban settlement. All Statistical Local Areas (SLAs) in the southwest sector include substantial rural parts potentially available for further urban and rural residential development. The western sector traverses the Blue Mountains into the eastern parts of Lithgow SLA. Whilst the straight line distance to Lithgow is about the same as to the southwestern limit of commuting, communications across the Blue Mountains are relatively slow, so the area is more isolated. Blue Mountains SLA provides few opportunities for population growth since the land is rugged and much of it is in national parks. The northern sector includes the Central Coast SLAs of Gosford and Wyong which have been the sites for major urban development in recent years.
The Spatial Framework Two groups of SLAs were selected in order to cover both the urbanized
parts of the perimetropolitan region which are physically contiguous with Sydney's metropolitan mass (the new suburbs) and, beyond this, what is judged to be the outer limits of commuting to Sydney (DEET 1993). The latter represents the limits to perimetropolitan development (Table 1, Figure 1). No reliable data exist with which to define the extent of commuting to Sydney but our informal understanding is that this limit is in the vicinity of Bowral/Mittagong to the southwest, Lithgow to the west, and Wyong to the north. The straight-line distance from Sydney's Central Business District (CBD) to these areas is about 100 kilometres. Anecdotal evidence suggests periodic commuting from further afield.
The first group of SLAs, which are labelled edge, includes areas which have parts defined as Sydney Urban Centre (UC) by the Australian Bureau of Statistics, or which incorporate parts of Sydney's growing urban fringe, as defined by their inclusion in the New South Wales Department of Planning' s Urban Development Programme (UDP). In addition to their urban parts, each of these edge SLAs has a rural part within which exurban development and commercial agriculture take place. These rural parts are also being colonized at suburban densities by the expanding urban fringe. The urban parts of these SLAs are labelled edge urban, the rural parts edge rural. Edge
131
This content downloaded from 62.122.73.86 on Sun, 15 Jun 2014 19:12:08 PMAll use subject to JSTOR Terms and Conditions
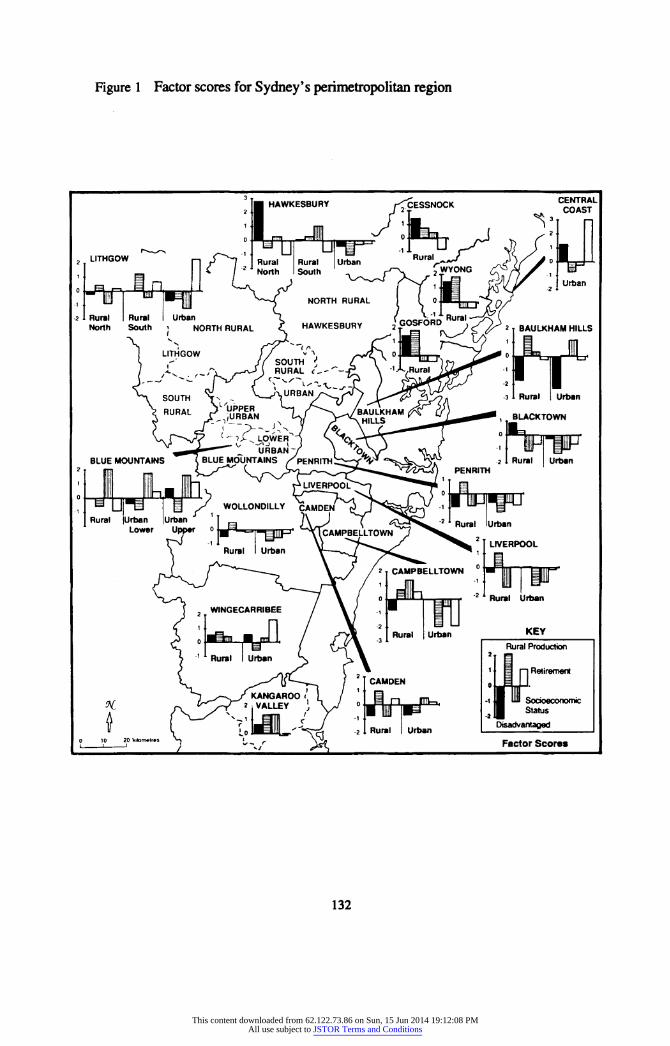
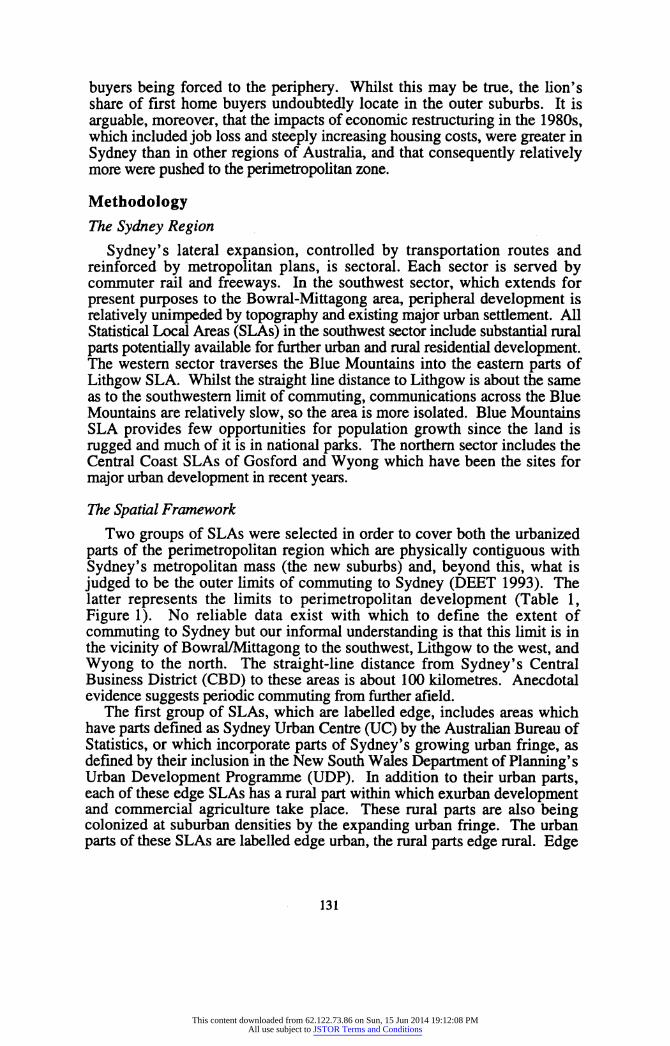
Figure 1 Factor scores for Sydney's perimetropolitan region
3 'm HAWKESBURY /<CESSNOCK CSJTEtL 2 H r T c>*v. COAST
2 LITHGOW "^
p. r^ì -1 Rura| Rura, Urban
1 Rural^^y^ yJlfJ ° PLJ '
' m '' /North South -'^. /^^X 2^Y0NG ¿a r> S i| ^^
■i Tul ^^^Hl -
7 NORTH RURAL I ( 0 H^t,,, y> Q/ ■2 Rural Rural Urban c. irnccniin Rural ~~~fi' '
North South ¡ NORTH RURAL < HAWKESBURY 2]^ '^J ' <T 2
] BAULKHAM HILLS
^ SOUTH i .
^^'URBA/^V^ 3 1 Rural Urban
' RURAL y^Stn
.
|| VyULKHAM^^rV^ ^ BLACKTOWN
BLUE MOUNTAINS ^"
7 BLUEJMOUNTAINS XpENRITh!^^^^*=^^sJ3^ 2 1 Rural Urban
Rural ¡Urban | Urban I j' ^) T ^îvZ3^^^ 2 ̂ Rural I Urban Lower Upper o
^^^-«l^pip4 <^fTcAMPBELLTOWN J ^^^^ r^ '
1 I *2 XL V ^î ̂i^-^ y ^^ ^ 2 Ì LIVERPOOL
' Rural Urban V ^î ^^*y^^ ^ , _
pjL f^~^~~~~~~~~~~-~7 V-v/ / 2 í campbelltown ° ̂ irrHiP" V^l 7 ' ( ° Ir^rmwx 2 Rural Uftoan
j 2 WINGECARRIBEE / ' / ,■ Wl
X 1 l^Smi WjJ I. / /^Vt 3 1 ""^ Urtoan KEY
h^ l^y / 'J~} ' 3
^ural Production
S ^/'fr^ S 2 Min Retirement S V, s^^^^^^^-X I
2 CAMDEN g I I
!V; ^^W^ ^A^LEY00 f| 'y 0 In >^- -i IB li Saáoeconomic
í ( XliljL-4/ -2 «««I Urban P "^ I 0 10 20V,tomeues
^ ^ ^ FflCt0r SCOIAI
132
This content downloaded from 62.122.73.86 on Sun, 15 Jun 2014 19:12:08 PMAll use subject to JSTOR Terms and Conditions
Table 1 Statistical Local Areas in Sydney's perimetropolitan region
Inner Edge SLAs Outer Edge SLAs
Baulkham Hills Camden Blacktown Wollondilly Campbelltown Gosford Liverpool Wyong Penrith
Peripheral SLAs
Blue Mountains Cessnock (rural area south of Cessnock) Greater Lithgow (eastern section) Hawkesbury Shoaihaven (Kangaroo Valley only) Wingecarribee
SLAs may be further classified as inner edge or outer edge. This distinction reflects the fact that some areas now included in the UDP are relatively recent additions and are thus in the early stages of their intensive urbanization, whereas other SLAs have been in the UDP for a long time and may be classified as mature fringe. Although this labelling is rather complex it facilitates interpretation of socio-demographic patterns. The second group of SLAs, labelled peripheral, are contiguous with the outer limits of the 'edge' group. But because some of these SLAs include parts which are very likely beyond Sydney's commuter shed, only sections of some of these peripheral areas were included in the study.
Each SLA included in the study was split into either two or three parts and ABS data for Census Collector Districts (CDs) were amalgamated for these parts. Edge SLAs were split into urban and rural parts, with the urban part being Sydney UC as defined by ABS in 1986. Peripheral SLAs were also split into rural and urban parts, but the urban parts were the amalgamation of urban centres and bounded rural localities. An exception to this was Blue Mountains which contains a component of Sydney UC as well as separately defined urban centres. In the outer SLAs of Cessnock, Shoaihaven and Lithgow, only those rural CDs 'reasonably close' to Sydney were included in the analysis. In order to focus in more detail on the rural parts of peripheral SLAs, their rural parts were split into two or more parts. These were called special rural study areas.
Perimetropolitan Population Change and Migration Structure
Sydney's perimetropolitan region of course accounts for the major part of metropolitan population growth. The SLAs defined as perimetropolitan for this study accounted for nearly 80 per cent of Sydney's growth in the 1980s. But there was considerable variation in scale of growth across the rural and urban parts of the perimetropolitan region (Table 2). As expected, by far the bulk of growth was in inner edge SLAs which correspond to the New South
133
This content downloaded from 62.122.73.86 on Sun, 15 Jun 2014 19:12:08 PMAll use subject to JSTOR Terms and Conditions
%
2 ON
ï I 2 i- i
1
¡ ! .S
S
•g
1
î£ Hon^oô Ò es es # es oô « O«n(n^# 'o _« ^ _ ^h ^ro^^H ^_ ^, i (s ^
?! I a »-e g £ 2^ tî es es 'o ^ »n <*tmor- ti- es os «n es g
Z »o r^ o^ «o *o r^ oo»n#<s»n ♦Tt^^l*9'^l* ^1 g 'S
« $
! 1 Hooooatn q °ì ^ # -? "l »^^^^^^ ^ì S U
?| 1 1 g -6 -SS SD. oo^ooocso eNTt tJ-o <n«r-fH m fi ^
>t § "S 00 S g g1 S
o' es 00 r- (S «o oooNCS *-• coeso>»no<Sfn ^ -g ç£ Ttoô»o^^<s yo^^'î «ri vocoxtenr^sooo g Q
vi'g 5 S 00 5 g w 2°^ . hiHfrioom <n r»» ̂ o ^ o' cm m m m *n m « S
g | cd o 2 ^ » e¿
^ xt ; os 00 es 00 es o 00 r*- r* ̂ 00 00 ^h in en ^5* ̂ .S
^ ^_ csj t- ^ m <N rs-*m ^ eSTt^ ^ ^ ^ ■ > 'C ¿
2 8. ¡fi 00 S g g g 2°^ . moor^^cs es »n^^ o 'o^o'^om 00 S^S'ö
o .
enen^ON^H co r^ver-* ^ osenosr-csoo o ^«S^ Zerj^^^r^ o ©eso» Tt -h'-'oo r»^ es i^P
Mhhhcî o' ^^^ en ^1 es »n o^^o ^
Si5
lì i^afrl 5 Hill S ff 8¿£if ¿ §
134
This content downloaded from 62.122.73.86 on Sun, 15 Jun 2014 19:12:08 PMAll use subject to JSTOR Terms and Conditions
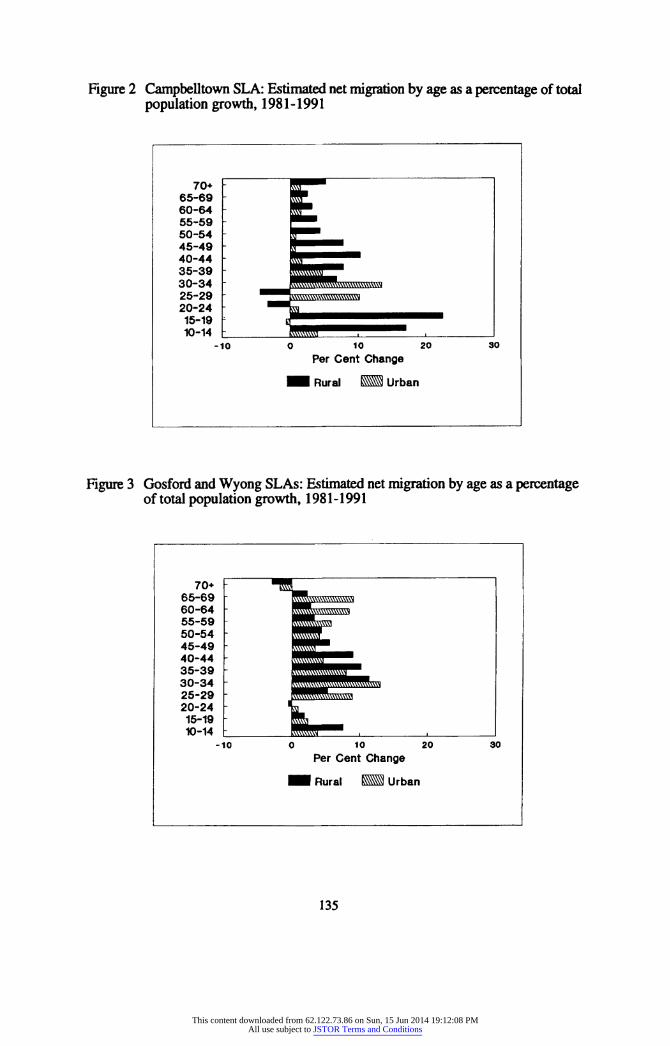
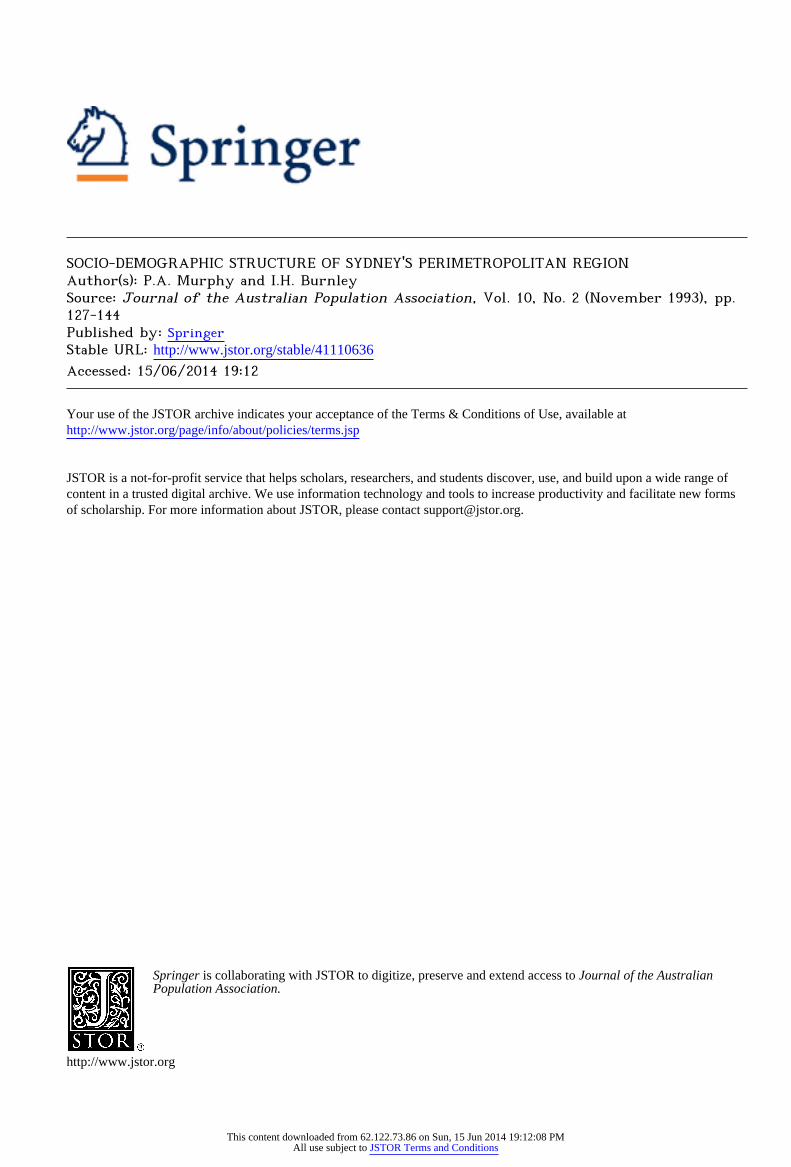
Figure 2 Campbelltown SLA: Estimated net migration by age as a percentage of total population growth, 1981-1991
65-69 - ÍF 60-64 IP 55-59 "^
15-19 '- K™""^ 10-14 L l^^^^^^^^^^^^^^^^^^ > I
-10 O 10 20 30 Per Cent Change
■1 Rural [A3 Urban
Figure 3 Gosford and Wyong SLAs: Estimated net migration by age as a percentage of total population growth, 1981-1991
65-69 ~ ^^w^^''''''''''
60-64 ■ ^^gssSESSS
35-39 - {ÉÍJÍÍ^^P' 30-34 * BBiiM^^^^^Ktt 25-29 - JJJJKTOroni
10-14 L l^^^^^^^^ i i I -10 0 10 20 30
Per Cent Change
■1 Rural EMS Urban
135
This content downloaded from 62.122.73.86 on Sun, 15 Jun 2014 19:12:08 PMAll use subject to JSTOR Terms and Conditions
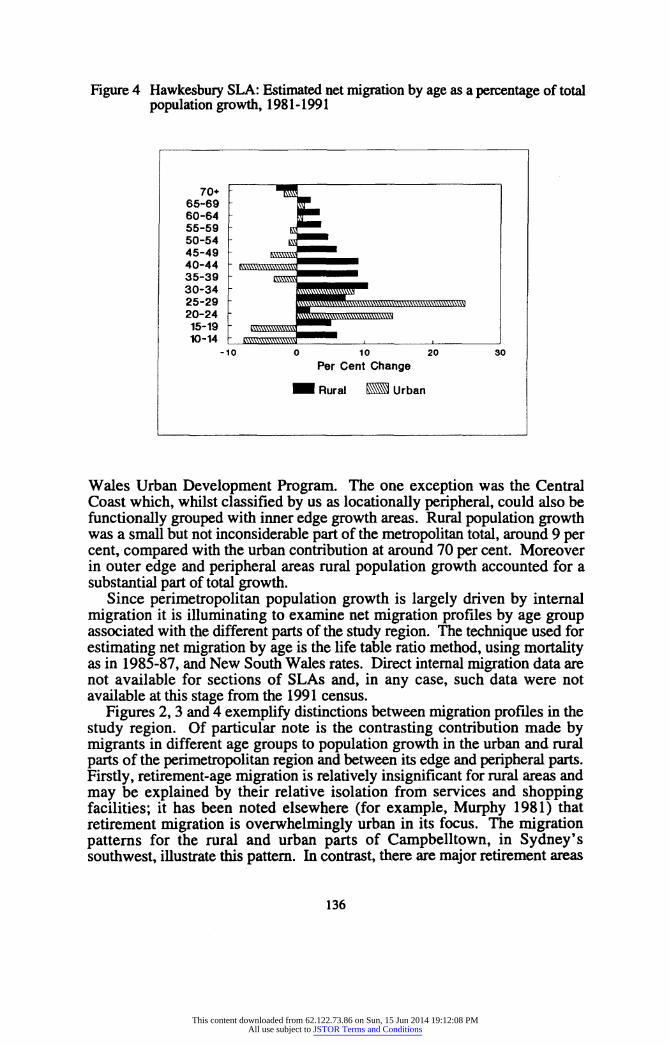
Figure 4 Hawkesbury SLA: Estimated net migration by age as a percentage of total population growth, 1981-1991
65-69 P 60-64 f™ 55-59 rc11- 50-54 -
E!^^L
-10 0 10 20 30 Per Cent Change
^M Rural KM Urban
Wales Urban Development Program. The one exception was the Central Coast which, whilst classified by us as locationally peripheral, could also be functionally grouped with inner edge growth areas. Rural population growth was a small but not inconsiderable part of the metropolitan total, around 9 per cent, compared with the urban contribution at around 70 per cent. Moreover in outer edge and peripheral areas rural population growth accounted for a substantial part of total growth.
Since perimetropolitan population growth is largely driven by internal migration it is illuminating to examine net migration profiles by age group associated with the different parts of the study region. The technique used for estimating net migration by age is the life table ratio method, using mortality as in 1985-87, and New South Wales rates. Direct internal migration data are not available for sections of SLAs and, in any case, such data were not available at this stage from the 1991 census.
Figures 2, 3 and 4 exemplify distinctions between migration profiles in the study region. Of particular note is the contrasting contribution made by migrants in different age groups to population growth in the urban and rural parts of the perimetropolitan region and between its edge and peripheral parts. Firstly, retirement-age migration is relatively insignificant for rural areas and may be explained by their relative isolation from services and shopping facilities; it has been noted elsewhere (for example, Murphy 1981) that retirement migration is overwhelmingly urban in its focus. The migration patterns for the rural and urban parts of Campbelltown, in Sydney's southwest, illustrate this pattern. In contrast, there are major retirement areas
136
This content downloaded from 62.122.73.86 on Sun, 15 Jun 2014 19:12:08 PMAll use subject to JSTOR Terms and Conditions
in the urban periphery as well as considerable relocation of older people to the suburbs. A second notable feature of the migration patterns is that gains in the 30-49 year cohort are relatively strong in rural areas but weak in urban parts. This may be explained by the fact that exurban residential land prices are usually higher than smaller allotments on new residential estates. Rural settlers are therefore likely to be more affluent, a quality which for many increases with age. In contrast, the urban parts of the perimetropolitan region are much more likely to attract first home buyers.
Perimetropolitan Socio-Demographic Structure
Although the perimetropolitan region depends to a major degree for its population growth on net migration, Australian census data do not readily permit separate analysis of recent settlers and longer term residents. Analysis is thus limited to data for the total population. The year chosen for analysis was 1986, the latest year for which full census data were available during the research period. A parallel analysis for 1981, not reported here, was also undertaken and when data are available for 1991, changes over time in socio- demographic patterns will be reported.
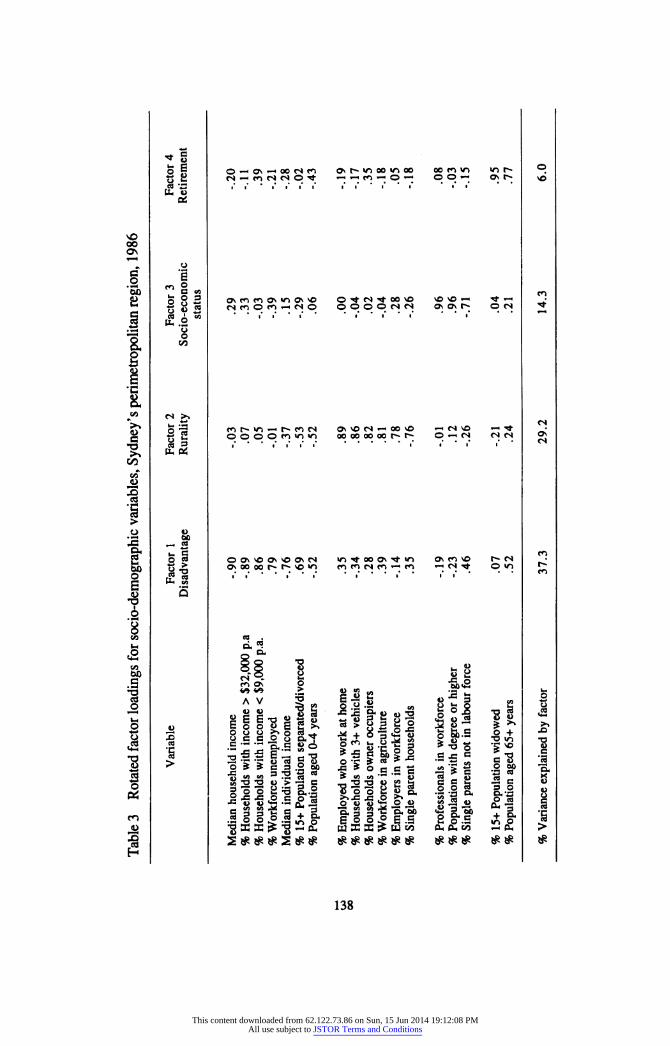
A set of socio-demographic indicators was selected to reflect what are postulated to be the major types of people migrating into and currently living in Sydney's perimetropolitan region (Table 3). There is an obvious dichotomy between people making their living in rural and urban occupations. There is a distinction between generally more affluent, older people who choose the region either because they can afford long distance commuting or because they have good jobs/businesses locally, and less affluent people who are pushed to the region because of lower housing costs, including the greater availability of public housing. In the case of public housing, the waiting lists may be much smaller with less queuing in outer suburbia and smaller towns, although the volume of such housing is not great. A distinction can also be made between older people, especially retirees, who can choose the periphery and younger people who have less choice. Each of these distinctions, and perhaps others, may characterize the socio-demographic structure of the perimetropolitan region.
In order to elucidate the socio-demographic mosaic of the perimetropolitan region, data items listed in Table 3 were assembled for the 30 rural and urban parts of the study region and were analysed using principal components analysis. Four components with eigenvalues greater than 1.0 were extracted and orthogonally rotated using the varimax method. Association of variables with this factor are indexed by factor loadings (Table 3).
Factor 1: Disadvantage Two clusters of variables define this factor. The first includes
unemployment, single parenthood, separated/divorced status, lower income and older age structure. These characteristics are likely to be causally related and define what can be termed a 'disadvantage' factor. A subsidiary cluster of variables suggests a secondary rural association for this factor.
137
This content downloaded from 62.122.73.86 on Sun, 15 Jun 2014 19:12:08 PMAll use subject to JSTOR Terms and Conditions
Os
.1
1 i. Ì w i
I
I
I i CO
I
o | o-ho'^«N(<i ahmoo^» oe en »n »nr- °. ^ 2 es ~* en c* es p ^ ^-hw^O'-; © © *■« °i ^ >© £ "S •" ■' * •' •' •" •' •" •"■■''•' •' •'
oc
o e
2RS o'romos«no'>o o ^ rí ̂ oo 'o sono^ ^^ • 2RS oÌjS n en p en *-n es o opopeses * " ^os^ p^i * ^ *""* ed JL to i" <*"•"" i*
* i' "
i" i * *""*
üu .2
co
^ ^ es o 'S ^r^m-H^mts onvo<s*-ioovo ^esvo -h^- • g o 2 ooootn»n»n oooooomm^ o^h<s * ^^ 2 ^ es ^ r * • i* i" i" r •* •' * i* r ^ (In tó
-I h* g m o* ooN^oosvooNes »n^-oooN^t«n o' v^ 'o r*es
S3" «*" I i Se II S
«¡¡-„lÍfl'Í-282 £«•§ ï I *
¡ ̂ II III il ¡(fi H ! i ^ lïiïli «il ill •JiillS! tilltf lit Si- i
138
This content downloaded from 62.122.73.86 on Sun, 15 Jun 2014 19:12:08 PMAll use subject to JSTOR Terms and Conditions
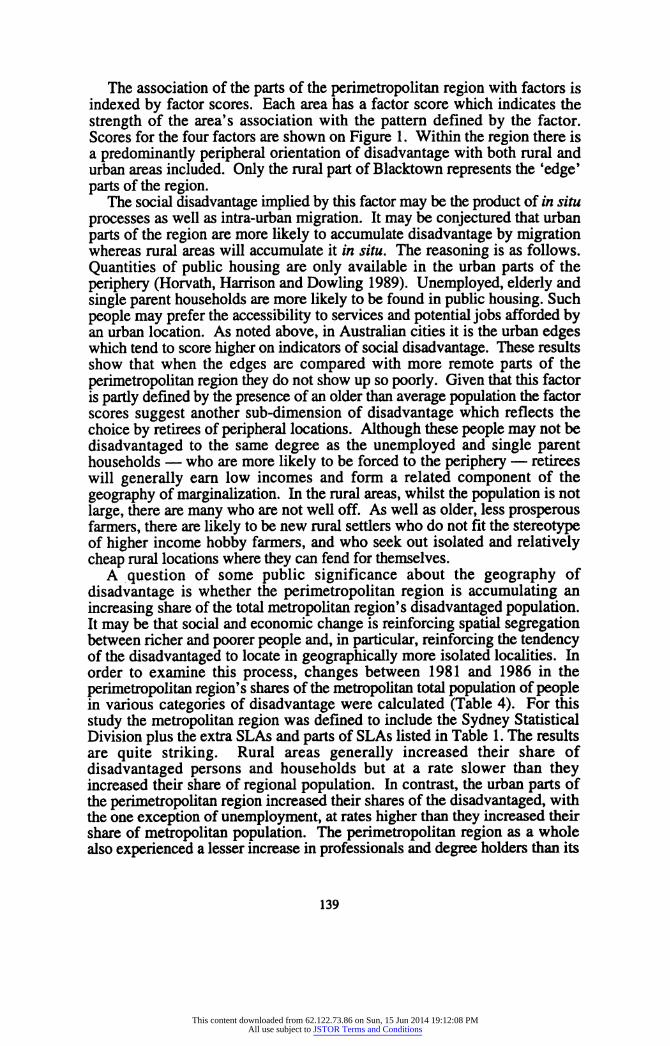
The association of the parts of the perimetropolitan region with factors is indexed by factor scores. Each area has a factor score which indicates the strength of the area's association with the pattern defined by the factor. Scores for the four factors are shown on Figure 1. Within the region there is a predominantly peripheral orientation of disadvantage with both rural and urban areas included. Only the rural part of Blacktown represents the 'edge' parts of the region.
The social disadvantage implied by this factor may be the product of in situ processes as well as intra-urban migration. It may be conjectured that urban parts of the region are more likely to accumulate disadvantage by migration whereas rural areas will accumulate it in situ. The reasoning is as follows. Quantities of public housing are only available in the urban parts of the periphery (Horvath, Harrison and Dowling 1989). Unemployed, elderly and single parent households are more likely to be found in public housing. Such people may prefer the accessibility to services and potential jobs afforded by an urban location. As noted above, in Australian cities it is the urban edges which tend to score higher on indicators of social disadvantage. These results show that when the edges are compared with more remote parts of the perimetropolitan region they do not show up so poorly. Given that this factor is partly defined by the presence of an older than average population the factor scores suggest another sub-dimension of disadvantage which reflects the choice by retirees of peripheral locations. Although these people may not be disadvantaged to the same degree as the unemployed and single parent households - who are more likely to be forced to the periphery - retirees will generally earn low incomes and form a related component of the geography of marginalization. In the rural areas, whilst the population is not large, there are many who are not well off. As well as older, less prosperous farmers, there are likely to be new rural settlers who do not fit the stereotype of higher income hobby farmers, and who seek out isolated and relatively cheap rural locations where they can fend for themselves.
A question of some public significance about the geography of disadvantage is whether the perimetropolitan region is accumulating an increasing share of the total metropolitan region's disadvantaged population. It may be that social and economic change is reinforcing spatial segregation between richer and poorer people and, in particular, reinforcing the tendency of the disadvantaged to locate in geographically more isolated localities. In order to examine this process, changes between 1981 and 1986 in the perimetropolitan region's shares of the metropolitan total population of people in various categories of disadvantage were calculated (Table 4). For this study the metropolitan region was defined to include the Sydney Statistical Division plus the extra SLAs and parts of SLAs listed in Table 1. The results are quite striking. Rural areas generally increased their share of disadvantaged persons and households but at a rate slower than they increased their share of regional population. In contrast, the urban parts of the perimetropolitan region increased their shares of the disadvantaged, with the one exception of unemployment, at rates higher than they increased their share of metropolitan population. The perimetropolitan region as a whole also experienced a lesser increase in professionals and degree holders than its
139
This content downloaded from 62.122.73.86 on Sun, 15 Jun 2014 19:12:08 PMAll use subject to JSTOR Terms and Conditions
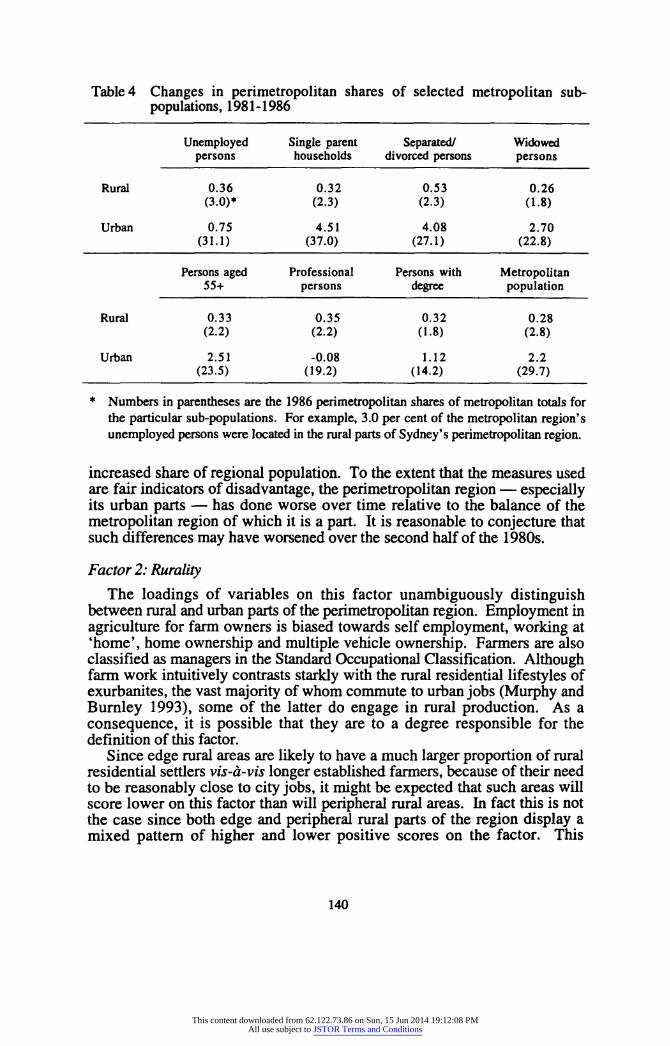
Table 4 Changes in perimetropolitan shares of selected metropolitan sub- populations, 1981-1986
Unemployed Single parent Separated/ Widowed persons households divorced persons persons
Rural 0.36 0.32 0.53 0.26 (3.0)* (2.3) (2.3) (1.8)
Urban 0.75 4.51 4.08 2.70 (31.1) (37.0) (27.1) (22.8)
Persons aged Professional Persons with Metropolitan 55+ persons degree population
Rural 0.33 0.35 0.32 0.28 (2.2) (2.2) (1.8) (2.8)
Urban 2.51 -0.08 1.12 2.2 (23.5) (19.2) (14.2) (29.7)
* Numbers in parentheses are the 1986 perimetropolitan shares of metropolitan totals for the particular sub-populations. For example, 3.0 per cent of the metropolitan region's unemployed persons were located in the rural parts of Sydney's perimetropolitan region.
increased share of regional population. To the extent that the measures used are fair indicators of disadvantage, the perimetropolitan region - especially its urban parts - has done worse over time relative to the balance of the metropolitan region of which it is a part. It is reasonable to conjecture that such differences may have worsened over the second half of the 1980s.
Factor 2: Rurality The loadings of variables on this factor unambiguously distinguish
between rural and urban parts of the perimetropolitan region. Employment in agriculture for farm owners is biased towards self employment, working at 'home', home ownership and multiple vehicle ownership. Farmers are also classified as managers in the Standard Occupational Classification. Although farm work intuitively contrasts starkly with the rural residential lifestyles of exurbanites, the vast majority of whom commute to urban jobs (Murphy and Burnley 1993), some of the latter do engage in rural production. As a consequence, it is possible that they are to a degree responsible for the definition of this factor.
Since edge rural areas are likely to have a much larger proportion of rural residential settlers vis-à-vis longer established farmers, because of their need to be reasonably close to city jobs, it might be expected that such areas will score lower on this factor than will peripheral rural areas. In fact this is not the case since both edge and peripheral rural parts of the region display a mixed pattern of higher and lower positive scores on the factor. This
140
This content downloaded from 62.122.73.86 on Sun, 15 Jun 2014 19:12:08 PMAll use subject to JSTOR Terms and Conditions
suggests that the colonization by exurbanites of rural areas is widespread across the region.
Factor 3: Socio-economic Status Variables defining this factor are, in descending size of loading: higher
education, professional, managerial and administrative occupations, employers, higher incomes, and older ages. But it is the first two which dominate. The latter three have moderate rather than high loadings, suggesting a more middle income, middle aged pattern with a relatively high proportion of better educated professional, administrative and managerial people.
The strongest positive associations with this factor are: inner edge rural areas of Campbelltown, Baulkham Hills and south Hawkesbury, no doubt reflecting rural residential settlement; all areas in the Blue Mountains; the urban part of Baulkham Hills; and Kangaroo Valley. The high urban and rural scores for Baulkham Hills reflects its well-known role as an upper income sector which stands in contrast to the generally less affluent character of Sydney's peripheral urban population. The Blue Mountains is a commuter area, the upper parts of which are being gentrified. This process, which is being investigated by the authors, is postulated to consist of two elements. First, there are younger professionals who choose the Mountains because they can obtain affordable housing and much higher environmental amenity than can now be got by younger, middle income, first home buyers in the inner city sites of gentrification. The second group consists of people - such as writers, artists and actors - who can afford to maximize environmental amenity because their jobs do not require daily commuting to Sydney. The association of Kangaroo Valley with this factor is particularly interesting since this relatively remote site is known, anecdotally, to be a place where middle and upper income, working age people are settling on a part- time or permanent basis. They are in a similar category to the second group of gentrifiers in the Blue Mountains.
Although less clear cut than is the case with other factors, there is some distinction between edge rural and peripheral rural localities. The edge rural areas of south Hawkesbury, Baulkham Hills and Campbelltown have positive scores, whereas only Kangaroo Valley and Blue Mountains on the periphery have positive scores with most other peripheral rural areas scoring negatively or close to zero.
Factor 4: Retirement This factor is defined by variables measuring a higher incidence of the
elderly and widows, lower incomes and high home ownership. This pattern of intercorrelation is plausibly labelled 'retirement'. High levels of home ownership and lower incomes go together because retirees who migrate to peripheral 'retirement areas' tend to be asset 'rich' but income 'poor'.
This is predominantly an urban, specifically peripheral urban, factor. Whilst some retirees choose to move to rural areas, it seems more plausible to interpret the weak association of some rural areas with this factor as reflecting
141
This content downloaded from 62.122.73.86 on Sun, 15 Jun 2014 19:12:08 PMAll use subject to JSTOR Terms and Conditions
the ageing in situ of a longer established rural population, relatively unaffected by younger, wealthier rural residential settlers.
Only four areas score higher than 1.0 on this factor, all peripheral urban. They are: upper Blue Mountains; Wingecanibee; Central Coast; and Lithgow. This peripheral urban orientation accords strongly with the fact that retirement migration is predominantly to areas close to the metropolis but towards the edge of the commuter field and just beyond it (Murphy 1981). Whilst these areas are being incorporated into Sydney's commuter field they still retain their retirement function but to a decreasing degree. The high score for Lithgow is anomalous since this mining town has not been noted as a destination for retirees. Its score seems more likely to be the result of the ageing in situ of a static population, reinforced by steady population decline, presumably selective of younger people, during the 1980s. It is, however, conceivable that retirement migration will increase as retirees are pushed beyond the suburbanizing upper Blue Mountains.
Interrelationships Whilst the four factors separate out statistically independent patterns of
intercorrelation between variables, it is quite possible that the different rural and urban parts of the perimetropolitan region may be associated with more than one factor. A number of interesting associations of this type were observed.
Rural areas are differently associated with the status factor. Areas which are associated with both higher levels of rurality and higher socio-economic status are: rural Wingecarribee; south Hawkesbury rural; rural Campbelltown; rural Baulkham Hills; and the outlier of Kangaroo Valley.
Rural areas with lower levels of status are: rural Liverpool; rural Blacktown; rural Camden; and rural Penrith; that is the rural parts of inner edge SLAs. Also inner edge but with contrasting higher status scores, are the rural parts of Campbelltown and Baulkham Hills. This sectoral pattern parallels the more affluent character of urban areas in the same SLAs.
Areas which are both rural and disadvantaged are: Kangaroo Valley; the rural parts of Gosford, Wyong and Cessnock; rural Wingecarribee; and rural Blacktown. These are, with the exception of Blacktown, peripheral rural areas. Since Kangaroo Valley and Cessnock are also associated with the affluence factor it may be inferred that these are areas which contain significant proportions of both more and less affluent groups, the latter being more likely rural residential settlers who have migrated there. Rurality not associated with the disadvantage factor includes the rural parts of: Baulkham Hills; Camden; Liverpool; Penrith; Wollondilly; and Campbelltown. That is, mainly edge rural areas.
Conclusions This paper has presented a cross-sectional analysis of socio-demographic
structure of Sydney's perimetropolitan region as it was in 1986, along with data on demographic trends for the 1980s. The socio-spatial dimensions of
142
This content downloaded from 62.122.73.86 on Sun, 15 Jun 2014 19:12:08 PMAll use subject to JSTOR Terms and Conditions
the perimetropolitan region proved to be much as expected and quite sharply drawn.
Some interesting issues, some with policy significance, arise from a consideration of the possible evolution of the socio-demographic structure of the periphery. There is the transference of gentrification processes from their sites in the inner city, both to exurbia and to the urban periphery, in areas such as the upper Blue Mountains. How large a scale will this phenomenon become? Is it having the same displacement effects on the poor as it has done in the inner city? To what extent is the process related to the adoption of flexible and home-based occupations? Are there differences between rural residential settlers of the inner and outer parts of the periphery? There is anecdotal evidence that peripheral exurbanites may depend less on regular commuting to metropolitan jobs. How much of this is related to flexible jobs and working at home? To what extent have rural settlers taken advantage of the decentralization of office jobs? A further issue is the extent to which working age settlers in the periphery are taking advantage of jobs and business opportunities being created there through the revitalization of tourism. There is also the question of what choices retirees will make as existing destinations lose their attraction due to the price inflationary and amenity reducing effects of suburbanization. There is long term evidence of this for the Blue Mountains and the Central Coast (Murphy 1976 and 1992). Which areas will absorb the displaced demand? Finally, to what extent will the disadvantaged of the Sydney region locate disproportionately in the periphery if the adverse effects of structural economic change do not supply the jobs that are needed. Will parts of the perimetropolitan region approach the conditions of American inner cities?
At the population-landuse interface there is a raft of local and regional planning issues. At the local scale major concerns have been the control of rural subdivision - in order to avoid loss of agricultural land - demands for uneconomical provision of services, loss of landscape amenity and environmental impacts. At the regional scale, control of new urban development around the perimeters of cities, so as to reduce government commitments to the financing of new infrastructure, has been an important issue. In Australia where, in contrast to many northern hemisphere cities, the metropolitan regions of deprivation tend to be on the edge rather than in the inner city, social needs have been of perennial concern. They include housing affordability, access to jobs and human services.
References Champion, A.G. 1989. Counterurbanization: the Changing Pace and Nature of Population
Déconcentration. London: Edward Arnold. Davis, J.S. 1990. Exurban commuting patterns: a case study of the Portland, Oregon region.
Doctoral Dissertation, Portland State University. Department of Employment Education and Training (DEET). 1993. Natural Labour Markets in
Australia. Canberra: Australian Government Publishing Service. Garreau, J. 1991. Edge City: Ufe on the New Frontier. New York: Doubleday. Horvath, R.J., G.E. Harrison and K.M. Dowlmg. 1989. Sydney: a Social Atlas, bydney: Sydney
University Press.
143
This content downloaded from 62.122.73.86 on Sun, 15 Jun 2014 19:12:08 PMAll use subject to JSTOR Terms and Conditions
Hugo, G. 1992. The turnaround in Australia: some preliminary observations from the 1991 census. Paper presented to the Australian Population Association Conference, Sydney.
Hugo, G.J. and P.J. Smailes. 1985. Urban-rural migration in Australia: a process view of the turnaround. Journal of Rural Studies 1(1): 1 -10.
Fishman, R. 1987. Bourgeois Utopias: the Rise and Fall of Suburbia. New York: Basic Books. Fishman, R. 1990. Megalopolis unbound. The Wilson Quarterly 14(l):25-48. Mellor, E.F. 1986. Shift work and flexitime: how prevalent are they? Monthly Labor Review
109:14-21. Murphy, P.A. 1976. Residential resort land in New South Wales. Australian Geographical
Studies 14:103-115. Murphy, P.A. 1981. Patterns of coastal retirement migration. Ch.19 in A.L. Howe (ed.),
Towards an Older Australia. Brisbane: University of Queensland Press. Murphy, P.A. 1992. Leisure and coastal development. Australian Planner 30:145-151. Murphy, P.A. and I.H. Burnley. 1993. Residential location choice in Sydney's peri metropolitan
region, (mi meo). National Housing Strategy. 1992. The Findings of the Housing and Locational Choice Survey.
Canberra: Australian Government Publishing Service. Nelson, A.C. and K.J. Dueker. 1990. The exurbanisation of America and its planning policy
implications. Journal of Planning Education and Research 9(2):91-100. Parr, J.B. 1986. The regional density function: an application of the concept in planning.
Town Planning Review 57(3):3 19-330.
144
This content downloaded from 62.122.73.86 on Sun, 15 Jun 2014 19:12:08 PMAll use subject to JSTOR Terms and Conditions