Embed Size (px)
Citation preview
FULLERTON LUX FUNDSSociété d'Investissement à Capital Variable
R.C.S. Luxembourg N° B 148 899Audited Annual Report as at March 31, 2018
FULLERTON LUX FUNDS
Fullerton Lux Funds - Asia Growth & Income Equities
Fullerton Lux Funds - Asian Small Cap Equities
Fullerton Lux Funds - Asia Focus Equities
Fullerton Lux Funds - Asia Absolute Alpha
Fullerton Lux Funds - ASEAN Growth
Fullerton Lux Funds - China A Equities
Fullerton Lux Funds - All China Equities
Fullerton Lux Funds - Global Emerging Market Equities
Fullerton Lux Funds - Asian Currency Bonds
Fullerton Lux Funds - Asian High Yield Bonds
Fullerton Lux Funds - Asian Bonds
Fullerton Lux Funds - RMB Bonds
Fullerton Lux Funds - Asian Short Duration Bonds
No subscription can be received on the basis of financial reports. Subscriptions are only valid if made on the basis of the current prospectus and relevant Key InvestorInformation Document ("KIID") which will be accompanied by a copy of the latest annual report and a copy of the latest available semi-annual report, if published aftersuch annual report.
FULLERTON LUX FUNDS
1
Table of Contents
Organisation of the SICAV 4
Directors' Report 5
Audit report 16
Statistics 19
Combined Statement of Net Assets as at March 31, 2018 23
Combined Statement of Operations and Changes in Net Assets for the year ended March 31, 2018 23
Fullerton Lux Funds - Asia Growth & Income Equities
Statement of Net Assets as at March 31, 2018 24
Statement of Operations and Changes in Net Assets for the year ended March 31, 2018 24
Statement of Changes in Number of Shares 24
Securities Portfolio as at March 31, 2018 25
Portfolio Breakdowns 26
Top Ten Holdings 26
Fullerton Lux Funds - Asian Small Cap Equities
Statement of Net Assets as at March 31, 2018 27
Statement of Operations and Changes in Net Assets for the year ended March 31, 2018 27
Statement of Changes in Number of Shares 27
Securities Portfolio as at March 31, 2018 28
Financial derivative instruments as at March 31, 2018 28
Portfolio Breakdowns 29
Top Ten Holdings 29
Fullerton Lux Funds - Asia Focus Equities
Statement of Net Assets as at March 31, 2018 30
Statement of Operations and Changes in Net Assets for the year ended March 31, 2018 30
Statement of Changes in Number of Shares 30
Securities Portfolio as at March 31, 2018 31
Financial derivative instruments as at March 31, 2018 31
Portfolio Breakdowns 32
Top Ten Holdings 32
Fullerton Lux Funds - Asia Absolute Alpha
Statement of Net Assets as at March 31, 2018 33
Statement of Operations and Changes in Net Assets for the year ended March 31, 2018 33
Statement of Changes in Number of Shares 33
Securities Portfolio as at March 31, 2018 34
Portfolio Breakdowns 35
Top Ten Holdings 35
Fullerton Lux Funds - ASEAN Growth
Statement of Net Assets as at March 31, 2018 36
Statement of Operations and Changes in Net Assets for the year ended March 31, 2018 36
Statement of Changes in Number of Shares 36
Securities Portfolio as at March 31, 2018 37
Portfolio Breakdowns 38
Top Ten Holdings 38
FULLERTON LUX FUNDS
2
Table of Contents
Fullerton Lux Funds - China A Equities
Statement of Net Assets as at March 31, 2018 39
Statement of Operations and Changes in Net Assets for the year ended March 31, 2018 39
Statement of Changes in Number of Shares 39
Securities Portfolio as at March 31, 2018 40
Portfolio Breakdowns 41
Top Ten Holdings 41
Fullerton Lux Funds - All China Equities
Statement of Net Assets as at March 31, 2018 42
Statement of Operations and Changes in Net Assets for the year ended March 31, 2018 42
Statement of Changes in Number of Shares 42
Securities Portfolio as at March 31, 2018 43
Portfolio Breakdowns 44
Top Ten Holdings 44
Fullerton Lux Funds - Global Emerging Market Equities
Statement of Net Assets as at March 31, 2018 45
Statement of Operations and Changes in Net Assets for the year ended March 31, 2018 45
Statement of Changes in Number of Shares 45
Securities Portfolio as at March 31, 2018 46
Portfolio Breakdowns 47
Top Ten Holdings 47
Fullerton Lux Funds - Asian Currency Bonds
Statement of Net Assets as at March 31, 2018 48
Statement of Operations and Changes in Net Assets for the year ended March 31, 2018 48
Statement of Changes in Number of Shares 48
Securities Portfolio as at March 31, 2018 49
Financial derivative instruments as at March 31, 2018 50
Portfolio Breakdowns 51
Top Ten Holdings 51
Fullerton Lux Funds - Asian High Yield Bonds
Statement of Net Assets as at March 31, 2018 52
Statement of Operations and Changes in Net Assets for the year ended March 31, 2018 52
Statement of Changes in Number of Shares 52
Securities Portfolio as at March 31, 2018 53
Financial derivative instruments as at March 31, 2018 53
Portfolio Breakdowns 55
Top Ten Holdings 55
Fullerton Lux Funds - Asian Bonds
Statement of Net Assets as at March 31, 2018 56
Statement of Operations and Changes in Net Assets for the year ended March 31, 2018 56
Statement of Changes in Number of Shares 56
Securities Portfolio as at March 31, 2018 57
Financial derivative instruments as at March 31, 2018 59
Portfolio Breakdowns 60
Top Ten Holdings 60
FULLERTON LUX FUNDS
3
Table of Contents
Fullerton Lux Funds - RMB Bonds
Statement of Net Assets as at March 31, 2018 61
Statement of Operations and Changes in Net Assets for the year ended March 31, 2018 61
Statement of Changes in Number of Shares 61
Securities Portfolio as at March 31, 2018 63
Financial derivative instruments as at March 31, 2018 64
Portfolio Breakdowns 65
Top Ten Holdings 65
Fullerton Lux Funds - Asian Short Duration Bonds
Statement of Net Assets as at March 31, 2018 66
Statement of Operations and Changes in Net Assets for the year ended March 31, 2018 66
Statement of Changes in Number of Shares 66
Securities Portfolio as at March 31, 2018 67
Financial derivative instruments as at March 31, 2018 68
Portfolio Breakdowns 70
Top Ten Holdings 70
Notes to the Financial Statements 71
Supplementary Information (unaudited) 79
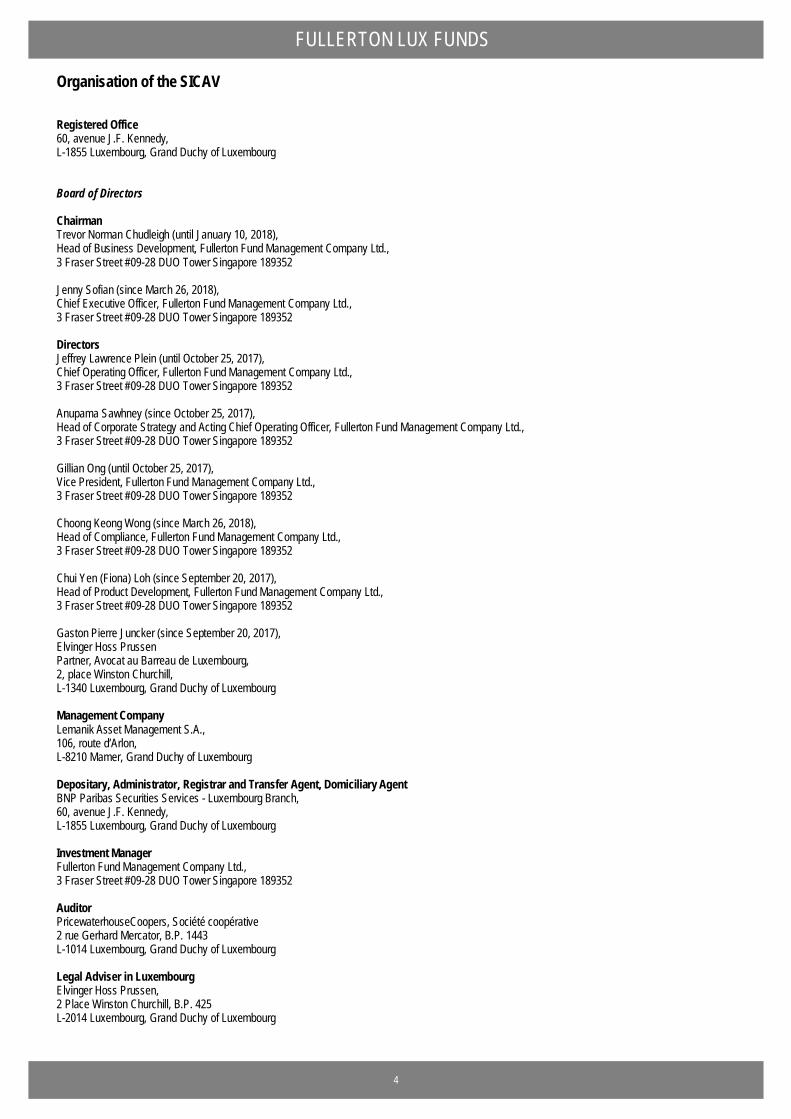
FULLERTON LUX FUNDS Organisation of the SICAV Registered Office 60, avenue J.F. Kennedy, L-1855 Luxembourg, Grand Duchy of Luxembourg Board of Directors Chairman Trevor Norman Chudleigh (until January 10, 2018), Head of Business Development, Fullerton Fund Management Company Ltd., 3 Fraser Street #09-28 DUO Tower Singapore 189352 Jenny Sofian (since March 26, 2018), Chief Executive Officer, Fullerton Fund Management Company Ltd., 3 Fraser Street #09-28 DUO Tower Singapore 189352 Directors Jeffrey Lawrence Plein (until October 25, 2017), Chief Operating Officer, Fullerton Fund Management Company Ltd., 3 Fraser Street #09-28 DUO Tower Singapore 189352 Anupama Sawhney (since October 25, 2017), Head of Corporate Strategy and Acting Chief Operating Officer, Fullerton Fund Management Company Ltd., 3 Fraser Street #09-28 DUO Tower Singapore 189352 Gillian Ong (until October 25, 2017), Vice President, Fullerton Fund Management Company Ltd., 3 Fraser Street #09-28 DUO Tower Singapore 189352 Choong Keong Wong (since March 26, 2018), Head of Compliance, Fullerton Fund Management Company Ltd., 3 Fraser Street #09-28 DUO Tower Singapore 189352 Chui Yen (Fiona) Loh (since September 20, 2017), Head of Product Development, Fullerton Fund Management Company Ltd., 3 Fraser Street #09-28 DUO Tower Singapore 189352 Gaston Pierre Juncker (since September 20, 2017), Elvinger Hoss Prussen Partner, Avocat au Barreau de Luxembourg, 2, place Winston Churchill, L-1340 Luxembourg, Grand Duchy of Luxembourg Management Company Lemanik Asset Management S.A., 106, route d’Arlon, L-8210 Mamer, Grand Duchy of Luxembourg Depositary, Administrator, Registrar and Transfer Agent, Domiciliary Agent BNP Paribas Securities Services - Luxembourg Branch, 60, avenue J.F. Kennedy, L-1855 Luxembourg, Grand Duchy of Luxembourg Investment Manager Fullerton Fund Management Company Ltd., 3 Fraser Street #09-28 DUO Tower Singapore 189352 Auditor PricewaterhouseCoopers, Société coopérative 2 rue Gerhard Mercator, B.P. 1443 L-1014 Luxembourg, Grand Duchy of Luxembourg Legal Adviser in Luxembourg Elvinger Hoss Prussen, 2 Place Winston Churchill, B.P. 425 L-2014 Luxembourg, Grand Duchy of Luxembourg
4
FULLERTON LUX FUNDS Directors’ Report Fullerton Lux Funds - Asia Growth & Income Equities Asian equity markets were broadly positive over the 12 months under review, on the back of firm investor sentiment boosted by strong economic growth and corporate earnings. Developed markets’ central bank rhetoric and policy actions, uncertainty over the Trump administration as well as geopolitical tensions were focal points for investors over most of 2017. While risk assets started the period under review on a strong footing, concerns over the possibility of coordinated monetary policy tightening by developed market central banks caused some market jitters after the US Federal Reserve (“Fed”) hiked interest rates by 25bps in June. Geopolitical tensions between the US and North Korea also weighed on risk appetite. Nonetheless, equity markets marched higher in 4Q17, buoyed by ongoing improvements in corporate earnings. Investors also took comfort in policy continuity under China’s new Politburo Standing Committee’s leadership. The Fed followed through with another rate hike in December, which markets took in stride. Markets turned challenging in 1Q18 after risk aversion erupted on the back of inflationary pressures in the US, higher US bond yields and US-China trade tensions. In March, the Fed raised interest rates again as widely expected but new Fed Chairman Jerome Powell assuaged the investment community that the pace of rate hikes would be gradual. Asian economies have benefitted from the synchronised global recovery that played out in 2017. Singapore’s economy expanded by 3.6% in 2017, supported by an improvement in global trade last year. Meanwhile, Malaysia’s 2017 GDP registered a 5.9% growth, on the back of strong momentum in domestic demand and robust exports. China beat expectations with a full year GDP growth of 6.9%, buoyed by robust domestic consumption and external demand. Similarly, Taiwan’s 4Q17 GDP growth came in stronger than expected, bringing full-year 2017 GDP growth to 2.8%. Elsewhere, Indonesia’s real GDP growth edged up in the last quarter of 2017, driven by a gradual rise in investment growth, although private consumption stalled; full year growth in 2017 reached 5.1%. In contrast, slower exports saw real GDP growth in the Philippines moderating in 4Q17, contributing to a 6.7%GDP growth for the whole of 2017. In Thailand, real GDP growth also slowed in 4Q17, and this in turn brought 2017 GDP growth to 3.9%. While exports remained the key driver to growth, rising external investments provided upside momentum. Lastly, Korea saw its first quarter-on-quarter contraction since 2009 in 4Q17, due to drag from construction investments which offset improvements in private consumption. For the full year, the Korean economy expanded by 3.1%. On the monetary front, policymakers across the region were varied in views over the 12 months under review. Singapore, Thailand and the Philippines held rates steady while the Reserve Bank of India unexpectedly cut its repo rate by 25bp to 6% from 6.25% in August 2017; the Indian central bank kept policy rates unchanged thereafter. Elsewhere, Bank Indonesia (BI) surprised the market with two consecutive cuts to its key policy rate in August and September 2017. BI cited lower-than-expected inflation and subdued credit growth as bases for its decision. The Indonesian central bank later kept policy rates unchanged albeit tweaking the bank reserve requirement and loan-to-funding ratios in February 2018, with a view of improving policy transmission and financial intermediation. Against the above, the Bank of Korea (BOK) raised its policy rate by 25bps to 1.5% in November 2017, its first rate increase since June 2011. The BOK’s decision was supported by an improving macroeconomic outlook and the central bank indicated an upward bias for future policy direction. Meanwhile, Bank Negara Malaysia hiked the benchmark rate by 25bps in January 2018, on the back of optimism that the global economic expansion would continue. Lastly, the People’s Bank of China (PBOC) announced reserve requirement ratio cuts for banks involved in lending to agriculture and small firms in October 2017. Later in December 2017, the PBOC raised the 7-day and 28-day repo rates, as well as the one-year medium-term lending facility by 5bps. Most recently in March 2018, the PBOC again raised the interest rate on the 7-day reverse-repo by 5bps, as it aimed to keep up the pressure on deleveraging and prevent too much divergence from US policy. As a conservative strategy, the Fund underperformed its benchmark during the period. Drag arising from positions in China and Korea outweighed gains generated in Hong Kong and India. By sector, consumer discretionary and IT names were the key laggards, negating gains from positions in financials and telecommunication services. Earnings revisions have become more mixed as we progress into the second quarter of 2018 but our expectations for double-digit EPS growth this year in Asia remain intact, buoyed by sound macro fundamentals and an upbeat corporate outlook. This notwithstanding, we recognise that inflation fears have surfaced and could potentially adversely affect risk appetite for Asia equities in the near term. Additionally, geopolitical uncertainties, national elections, trade tensions and rising rates, are among some of the other key sources of risk likely to add to the return of market volatility here in Asia and beyond. With more companies finding it difficult to beat investors’ elevated expectations, earnings – not multiple expansion – will need to be the source of equity returns going forward. To this end, we adhere to our high conviction, bottom-up driven investment discipline in our continued search for growth companies in Asia with high or growing dividends, in addition to possessing proven track records or potential that has been underestimated by the market. Fullerton Lux Funds - Asian Small Cap Equities Asian equity markets were broadly positive over the 12 months under review, on the back of firm investor sentiment boosted by strong economic growth and corporate earnings. Developed markets’ central bank rhetoric and policy actions, uncertainty over the Trump administration as well as geopolitical tensions were focal points for investors over most of 2017. Across the period, small cap equities were broadly positive across Asia, with Korea, China and Taiwan leading gains. While risk assets started the period under review on a strong footing, concerns over the possibility of coordinated monetary policy tightening by developed market central banks caused some market jitters after the US Federal Reserve (“Fed”) hiked interest rates by 25bps in June. Geopolitical tensions between the US and North Korea also weighed on risk appetite. Nonetheless, equity markets marched higher in 4Q17, buoyed by ongoing improvements in corporate earnings. Investors also took comfort in policy continuity under China’s new Politburo Standing Committee’s leadership. The Fed followed through with another rate hike in December, which markets took in stride. Markets turned challenging in 1Q18 after risk aversion erupted on the back of inflationary pressures and higher bond yields in the US, as well as trade tensions. In March, the Fed raised interest rates again as widely expected but new Fed Chairman Jerome Powell assuaged the investment community that the pace of rate hikes would be gradual.
5
FULLERTON LUX FUNDS Directors’ Report (continued) Fullerton Lux Funds - Asian Small Cap Equities (continued) Asian economies have benefitted from the synchronised global recovery that played out in 2017. Singapore’s economy expanded by 3.6% in 2017, supported by an improvement in global trade last year. Meanwhile, Malaysia’s 2017 GDP registered a 5.9% growth, on the back of strong momentum in domestic demand and robust exports. China beat expectations with a full year GDP growth of 6.9%, buoyed by robust domestic consumption and external demand. Similarly, Taiwan’s 4Q17 GDP growth came in stronger than expected, bringing full-year 2017 GDP growth to 2.8%. Elsewhere, Indonesia’s real GDP growth edged up in the last quarter of 2017, driven by a gradual rise in investment growth, although private consumption stalled; full year growth in 2017 reached 5.1%. In contrast, slower exports saw real GDP growth in the Philippines moderating in 4Q17, contributing to a 6.7%GDP growth for the whole of 2017. In Thailand, real GDP growth also slowed in 4Q17, and this in turn brought 2017 GDP growth to 3.9%. While exports remained the key driver to growth, rising external investments provided upside momentum. Lastly, Korea saw its first quarter-on-quarter contraction since 2009 in 4Q17, due to drag from construction investments which offset improvements in private consumption. For the full year, the Korean economy expanded by 3.1%. On the monetary front, policymakers across the region were varied in views over the 12 months under review. Singapore, Thailand and the Philippines held rates steady while the Reserve Bank of India unexpectedly cut its repo rate by 25bp to 6% from 6.25% in August 2017; the Indian central bank kept policy rates unchanged thereafter. Elsewhere, Bank Indonesia (BI) surprised the market with two consecutive cuts to its key policy rate in August and September 2017. BI cited lower-than-expected inflation and subdued credit growth as bases for its decision. The Indonesian central bank later kept policy rates unchanged albeit tweaking the bank reserve requirement and loan-to-funding ratios in February 2018, with a view of improving policy transmission and financial intermediation. Against the above, the Bank of Korea (BOK) raised its policy rate by 25bps to 1.5% in November 2017, its first rate increase since June 2011. The BOK’s decision was supported by an improving macroeconomic outlook and the central bank indicated an upward bias for future policy direction. Meanwhile, Bank Negara Malaysia hiked the benchmark rate by 25bps in January 2018, on the back of optimism that the global economic expansion would continue. Lastly, the People’s Bank of China (PBOC) announced reserve requirement ratio cuts for banks involved in lending to agriculture and small firms in October 2017. Later in December 2017, the PBOC raised the 7-day and 28-day repo rates, as well as the one-year medium-term lending facility by 5bps. Most recently in March 2018, the PBOC again raised the interest rate on the 7-day reverse-repo by 5bps, as it aimed to keep up the pressure on deleveraging and prevent too much divergence from US policy. The Fund outperformed its benchmark during the period, on the back of strong stock selection in China and Hong Kong. By sector, consumer discretionary, healthcare and financials names added the most value. Earnings revisions have become more mixed as we progress into the second quarter of 2018 but our expectations for double-digit EPS growth this year in Asia remain intact, buoyed by sound macro fundamentals and an upbeat corporate outlook. This notwithstanding, we recognise that inflation fears have surfaced and could potentially adversely affect risk appetite for Asia equities in the near term. Additionally, geopolitical uncertainties, national elections, trade tensions and rising rates, are among some of the other key sources of risk likely to add to the return of market volatility here in Asia and beyond. With more companies finding it difficult to beat investors’ elevated expectations, earnings – not multiple expansion – will need to be the source of equity returns going forward. Fullerton Lux Funds - Asia Focus Equities Asian equity markets were broadly positive over the 12 months under review, on the back of firm investor sentiment boosted by strong economic growth and corporate earnings. Developed markets’ central bank rhetoric and policy actions, uncertainty over the Trump administration as well as geopolitical tensions were focal points for investors over most of 2017. While risk assets started the period under review on a strong footing, concerns over the possibility of coordinated monetary policy tightening by developed market central banks caused some market jitters after the US Federal Reserve (“Fed”) hiked interest rates by 25bps in June. Geopolitical tensions between the US and North Korea also weighed on risk appetite. Nonetheless, equity markets marched higher in 4Q17, buoyed by ongoing improvements in corporate earnings. Investors also took comfort in policy continuity under China’s new Politburo Standing Committee’s leadership. The Fed followed through with another rate hike in December, which markets took in stride. Markets turned challenging in 1Q18 after risk aversion erupted on the back of inflationary pressures in the US, higher US bond yields and US-China trade tensions. In March, the Fed raised interest rates again as widely expected but new Fed Chairman Jerome Powell assuaged the investment community that the pace of rate hikes would be gradual. Asian economies have benefitted from the synchronised global recovery that played out in 2017. Singapore’s economy expanded by 3.6% in 2017, supported by an improvement in global trade last year. Meanwhile, Malaysia’s 2017 GDP registered a 5.9% growth, on the back of strong momentum in domestic demand and robust exports. China beat expectations with a full year GDP growth of 6.9%, buoyed by robust domestic consumption and external demand. Similarly, Taiwan’s 4Q17 GDP growth came in stronger than expected, bringing full-year 2017 GDP growth to 2.8%. Elsewhere, Indonesia’s real GDP growth edged up in the last quarter of 2017, driven by a gradual rise in investment growth, although private consumption stalled; full year growth in 2017 reached 5.1%. In contrast, slower exports saw real GDP growth in the Philippines moderating in 4Q17, contributing to a 6.7%GDP growth for the whole of 2017. In Thailand, real GDP growth also slowed in 4Q17, and this in turn brought 2017 GDP growth to 3.9%. While exports remained the key driver to growth, rising external investments provided upside momentum. Lastly, Korea saw its first quarter-on-quarter contraction since 2009 in 4Q17, due to drag from construction investments which offset improvements in private consumption. For the full year, the Korean economy expanded by 3.1%.
6
FULLERTON LUX FUNDS Directors’ Report (continued) Fullerton Lux Funds - Asia Focus Equities (continued) On the monetary front, policymakers across the region were varied in views over the 12 months under review. Singapore, Thailand and the Philippines held rates steady while the Reserve Bank of India unexpectedly cut its repo rate by 25bp to 6% from 6.25% in August 2017; the Indian central bank kept policy rates unchanged thereafter. Elsewhere, Bank Indonesia (BI) surprised the market with two consecutive cuts to its key policy rate in August and September 2017. BI cited lower-than-expected inflation and subdued credit growth as bases for its decision. The Indonesian central bank later kept policy rates unchanged albeit tweaking the bank reserve requirement and loan-to-funding ratios in February 2018, with a view of improving policy transmission and financial intermediation. Against the above, the Bank of Korea (BOK) raised its policy rate by 25bps to 1.5% in November 2017, its first rate increase since June 2011. The BOK’s decision was supported by an improving macroeconomic outlook and the central bank indicated an upward bias for future policy direction. Meanwhile, Bank Negara Malaysia hiked the benchmark rate by 25bps in January 2018, on the back of optimism that the global economic expansion would continue. Lastly, the People’s Bank of China (PBOC) announced reserve requirement ratio cuts for banks involved in lending to agriculture and small firms in October 2017. Later in December 2017, the PBOC raised the 7-day and 28-day repo rates, as well as the one-year medium-term lending facility by 5bps. Most recently in March 2018, the PBOC again raised the interest rate on the 7-day reverse-repo by 5bps, as it aimed to keep up the pressure on deleveraging and prevent too much divergence from US policy. The Fund outperformed its benchmark during the period on the back of strong stock selection in Taiwan, China, Hong Kong and Singapore. By sector, the portfolio’s IT and consumer discretionary names added the most value. Earnings revisions have become more mixed as we progress into the second quarter of 2018 but our expectations for double-digit EPS growth this year in Asia remain intact, buoyed by sound macro fundamentals and an upbeat corporate outlook. This notwithstanding, we recognise that inflation fears have surfaced and could potentially adversely affect risk appetite for Asia equities in the near term. Additionally, geopolitical uncertainties, national elections, trade tensions and rising rates, are among some of the other key sources of risk likely to add to the return of market volatility here in Asia and beyond. With more companies finding it difficult to beat investors’ elevated expectations, earnings – not multiple expansion – will need to be the source of equity returns going forward. To this end, we adhere to our high conviction, bottom-up driven investment discipline in our continued search for growth companies in Asia with proven track records or growth potential that has been underestimated by the market. Fullerton Lux Funds - Asia Absolute Alpha Asian equity markets were broadly positive over the 12 months under review, on the back of firm investor sentiment boosted by strong economic growth and corporate earnings. Developed markets’ central bank rhetoric and policy actions, uncertainty over the Trump administration as well as geopolitical tensions were focal points for investors over most of 2017. While risk assets started the period under review on a strong footing, concerns over the possibility of coordinated monetary policy tightening by developed market central banks caused some market jitters after the US Federal Reserve (“Fed”) hiked interest rates by 25bps in June. Geopolitical tensions between the US and North Korea also weighed on risk appetite. Nonetheless, equity markets marched higher in 4Q17, buoyed by ongoing improvements in corporate earnings. Investors also took comfort in policy continuity under China’s new Politburo Standing Committee’s leadership. The Fed followed through with another rate hike in December, which markets took in stride. Markets turned challenging in 1Q18 after risk aversion erupted on the back of inflationary pressures in the US, higher US bond yields and US-China trade tensions. In March, the Fed raised interest rates again as widely expected but new Fed Chairman Jerome Powell assuaged the investment community that the pace of rate hikes would be gradual. Asian economies have benefitted from the synchronised global recovery that played out in 2017. Singapore’s economy expanded by 3.6% in 2017, supported by an improvement in global trade last year. Meanwhile, Malaysia’s 2017 GDP registered a 5.9% growth, on the back of strong momentum in domestic demand and robust exports. China beat expectations with a full year GDP growth of 6.9%, buoyed by robust domestic consumption and external demand. Similarly, Taiwan’s 4Q17 GDP growth came in stronger than expected, bringing full-year 2017 GDP growth to 2.8%. Elsewhere, Indonesia’s real GDP growth edged up in the last quarter of 2017, driven by a gradual rise in investment growth, although private consumption stalled; full year growth in 2017 reached 5.1%. In contrast, slower exports saw real GDP growth in the Philippines moderating in 4Q17, contributing to a 6.7%GDP growth for the whole of 2017. In Thailand, real GDP growth also slowed in 4Q17, and this in turn brought 2017 GDP growth to 3.9%. While exports remained the key driver to growth, rising external investments provided upside momentum. Lastly, Korea saw its first quarter-on-quarter contraction since 2009 in 4Q17, due to drag from construction investments which offset improvements in private consumption. For the full year, the Korean economy expanded by 3.1%. On the monetary front, policymakers across the region were varied in views over the 12 months under review. Singapore, Thailand and the Philippines held rates steady while the Reserve Bank of India unexpectedly cut its repo rate by 25bp to 6% from 6.25% in August 2017; the Indian central bank kept policy rates unchanged thereafter. Elsewhere, Bank Indonesia (BI) surprised the market with two consecutive cuts to its key policy rate in August and September 2017. BI cited lower-than-expected inflation and subdued credit growth as bases for its decision. The Indonesian central bank later kept policy rates unchanged albeit tweaking the bank reserve requirement and loan-to-funding ratios in February 2018, with a view of improving policy transmission and financial intermediation.
7
FULLERTON LUX FUNDS Directors’ Report (continued) Fullerton Lux Funds - Asia Absolute Alpha (continued) Against the above, the Bank of Korea (BOK) raised its policy rate by 25bps to 1.5% in November 2017, its first rate increase since June 2011. The BOK’s decision was supported by an improving macroeconomic outlook and the central bank indicated an upward bias for future policy direction. Meanwhile, Bank Negara Malaysia hiked the benchmark rate by 25bps in January 2018, on the back of optimism that the global economic expansion would continue. Lastly, the People’s Bank of China (PBOC) announced reserve requirement ratio cuts for banks involved in lending to agriculture and small firms in October 2017. Later in December 2017, the PBOC raised the 7-day and 28-day repo rates, as well as the one-year medium-term lending facility by 5bps. Most recently in March 2018, the PBOC again raised the interest rate on the 7-day reverse-repo by 5bps, as it aimed to keep up the pressure on deleveraging and prevent too much divergence from US policy. The Fund generated strong returns over the period. Positions in select IT companies in China, Taiwan, Korea and Singapore, were primary sources of value-add. Elsewhere, the portfolio’s consumer discretionary, healthcare and financials positions also contributed positively to performance. Earnings revisions have become more mixed as we progress into the second quarter of 2018 but our expectations for double-digit EPS growth this year in Asia remain intact, buoyed by sound macro fundamentals and an upbeat corporate outlook. This notwithstanding, we recognise that inflation fears have surfaced and could potentially adversely affect risk appetite for Asia equities in the near term. Additionally, geopolitical uncertainties, national elections, trade tensions and rising rates, are among some of the other key sources of risk likely to add to the return of market volatility here in Asia and beyond. With more companies finding it difficult to beat investors’ elevated expectations, earnings – not multiple expansion – will need to be the source of equity returns going forward. To this end, we adhere to our high conviction, bottom-up driven investment discipline in our continued search for growth companies in Asia with proven track records or growth potential that has been underestimated by the market. Fullerton Lux Funds - ASEAN Growth ASEAN equity markets in aggregate generated strong returns over the 12 months under review, on the back of firm investor sentiment boosted by positive economic growth and corporate earnings. Monetary policy in the developed markets, uncertainty over the Trump administration, and geopolitical tensions were focal points for investors over most of 2017. While risk assets started the period under review on a strong footing, concerns over the possibility of coordinated monetary policy tightening by developed market central banks caused some market jitters after the US Federal Reserve (“Fed”) hiked interest rates by 25bps in June. Geopolitical tensions between the US and North Korea also weighed on risk appetite. Nonetheless, equity markets marched higher from October, buoyed by healthy corporate results, rising commodity prices and growing optimism regarding the strength of the global economy. The Fed subsequently followed through with another rate hike in December, which investors took in stride. Markets turned challenging in 1Q18 after risk aversion erupted in the region, on the back of inflationary pressures and higher bond yields in the US, as well as trade war tensions. In March, the Fed raised interest rates again as widely expected but new Fed Chairman Jerome Powell assuaged the investment community that the pace of rate hikes would be gradual. Regional economies have benefitted from the synchronised global recovery that played out in 2017. Singapore’s economy expanded by 3.6% in 2017, supported by an improvement in global trade. In particular, growth was driven by strong externally-oriented services, offsetting a pullback in manufacturing. Meanwhile, Malaysia’s 2017 GDP registered a 5.9% growth, on the back of strong momentum in domestic demand and robust exports. Elsewhere, Indonesia’s real GDP growth edged up in the last quarter of 2017, driven by a gradual rise in investments, notwithstanding stalling private consumption; full year growth in 2017 came in at 5.1%. In contrast, slower exports saw real GDP growth in the Philippines moderating in 4Q17, contributing to a still robust 6.7%GDP growth for the whole of 2017. In Thailand, real GDP growth also slowed in 4Q17, and this in turn brought 2017 GDP growth to 3.9%. While Thai exports remained the key driver to growth, rising external investments provided further tailwinds. On the monetary front, policymakers across the region were varied in views over the period under review. Singapore, Thailand and the Philippines held rates steady while Bank Indonesia (BI) surprised the market with two consecutive cuts to its key policy rate in August and September. BI cited lower-than-expected inflation and subdued credit growth as bases for its decision. The Indonesian central bank later kept policy rates unchanged, albeit tweaking the bank reserve requirement and loan-to-funding ratios in February 2018, with a view of improving policy transmission and financial intermediation. Against the above, Bank Negara Malaysia took the lead in normalising monetary policy and hiked the benchmark rate by 25bps in January 2018, on the back of optimism that the global economic expansion would continue. Over the period, the Fund outperformed its benchmark on the back of strong stock selection in Singapore and Malaysia. By sector, the portfolio’s IT, consumer staples and energy names were key contributors to performance. Earnings revisions have become more mixed as we progress into the second quarter of 2018 but our expectations for double-digit EPS growth this year in Asia remain intact, buoyed by sound macro fundamentals and an upbeat corporate outlook. This notwithstanding, we recognise that inflation fears have surfaced and could potentially adversely affect risk appetite for regional equities in the near term. Additionally, geopolitical uncertainties, national elections, trade tensions and rising rates, are among some of the other key sources of risk likely to add to the return of market volatility here in ASEAN and beyond. With more companies finding it difficult to beat investors’ elevated expectations, earnings – not multiple expansion – will need to be the source of equity returns going forward. To this end, we adhere to our high conviction, bottom-up driven investment discipline in our continued search for growth companies with proven track records or growth potential that has been underestimated by the market.
8
FULLERTON LUX FUNDS Directors’ Report (continued) Fullerton Lux Funds - China A Equities China A shares delivered positive returns over the period despite bouts of volatility, as the Chinese economy turned in growth and companies delivered solid earnings growth. Overall, monetary policy in the developed markets, uncertainty over the Trump administration, and geopolitical tensions were focal points for investors over most of 2017. Market sentiment surrounding China A shares was given a boost in June after MSCI announced that it would include China A shares in various MSCI indices. Thereafter, at China’s 19th National Party Congress, the Politburo Standing Committee’s new leadership signalled no major shift in economic policy direction and investors took comfort in policy continuity. Markets turned challenging in 1Q18 after risk aversion erupted in the Asia, on the back of inflationary pressures and higher bond yields in the US, as well as trade war concerns. US-China trade tensions flared after the Trump administration announced steel and aluminium trade tariffs in early March, although it was later announced that a handful of nations would be exempt from these tariffs. The subsequent imposition of additional tariffs on up to US$60 billion in annual imports from China further raised the spectre of a US-China trade dispute. On the domestic front, China’s economic data broadly reflected stable growth. For the full year 2017, GDP grew 6.9%, buoyed by robust domestic consumption and external demand. Elsewhere, manufacturing activity picked up with both new orders and new export orders exhibiting resilience , while trade data also registered strong performance. Turning to monetary policy, the People’s Bank of China (PBOC) announced reserve requirement ratio cuts for banks involved in lending to agriculture and small firms in October 2017. Later in December, the PBOC raised the 7-day and 28-day repo rates, as well as the one-year medium-term lending facility by 5bps. Most recently in March 2018, the PBOC again raised the interest rate on the 7-day reverse-repo by 5bps, as it aimed to keep up the pressure on deleveraging and prevent too much divergence from US policy. Separately, the National People’s Congress approved the appointment of Yi Gang as the PBOC’s new governor – his appointment reflects the importance of policy continuity, with top priority still placed on deleveraging and financial risk containment. The Fund outperformed its benchmark significantly during the period, on the back of strong stock selection in the healthcare, real estate, consumer and financials sectors. China equities remain supported by fundamental drivers that are propelling economic growth, as China undergoes profound economic and social changes; these drivers are largely unaffected by slight changes in China’s macroeconomic statistics. That said, downside risks include a cooling housing sector, ongoing financial deleveraging and to a lesser degree, a potential trade war with the US. Investors are likely to gradually view the China-US trade conflict in a more rational way, particularly since the market has already corrected quite significantly. With new sectors emerging from economic rebalancing that have great potential for growth over the long-term, we retain our constructive outlook over Chinese equities. Additionally, the valuation for the whole market has now dropped to 17x PER (TTM), similar to back in January 2016. On monetary policy, we also expect the risk-free rate to remain relatively stable. Overall, growth names still outpace value names in terms of valuation to growth. We remain focused on bottom-up stock selection to find the best opportunities and continue to invest in companies with quality earning profiles. Fullerton Lux Funds - All China Equities Asian equity markets were broadly positive over the 12 months under review, on the back of firm investor sentiment boosted by positive economic growth and corporate earnings. Monetary policy in the developed markets, uncertainty over the Trump administration, and geopolitical tensions were focal points for investors over most of 2017. At China’s 19th National Party Congress, the Politburo Standing Committee’s new leadership signalled no major shift in economic policy direction and investors took comfort in policy continuity. Markets turned challenging in 1Q18 after risk aversion erupted in the Asia, on the back of higher bond yields in the US, as well as trade war concerns. In March, the Fed raised interest rates again as widely expected but new Fed Chairman Jerome Powell assuaged the investment community that the pace of rate hikes would be gradual. Asian economies have benefitted from the synchronised global recovery that played out in 2017. China’s economic data broadly reflected stable growth, with full year GDP growth registering at 6.9%, on the back of robust domestic consumption and external demand. Taiwan’s 4Q17 GDP growth was stronger than expected, bringing full-year GDP growth to 2.9%yoy in 2017. The government has raised its forecast for 2018 GDP growth to 2.4%. Hong Kong’s economy expanded by 3.8% in 2017, supported by robust trade activity from a global recovery and buoyant domestic demand. The government has forecasted Hong Kong’s economy to grow by 3-4% in 2018. On the monetary policy front, Taiwan’s central bank left its policy rate steady over the period under review. The central bank cited stable inflation expectations, continued uncertainties in the global economic outlook, and a modest slowdown in economic growth momentum, as key factors behind its decision. Meanwhile, the People’s Bank of China (PBOC) announced reserve requirement ratio cuts for banks involved in lending to agriculture and small firms in October 2017. Later in December, the PBOC raised the 7-day and 28-day repo rates, as well as the one-year medium-term lending facility by 5bps. Most recently in March 2018, the PBOC again raised the 7-day reverse-repo rate by 5bps, as it aimed to keep up the pressure on deleveraging and prevent too much divergence from US policy. Similarly, the Hong Kong Monetary Authority raised the base rate by 25bps in March 2018, in line with the move by the Federal Reserve. The Fund generated strong returns over the period, with gains led primarily by select IT, consumer, healthcare and financial companies.
9
FULLERTON LUX FUNDS Directors’ Report (continued) Fullerton Lux Funds - All China Equities (continued) Earnings revisions have become more mixed as we progress into the second quarter of 2018 but our expectations for Chinese equities to generate double-digit EPS growth this year remain intact, buoyed by sound macro fundamentals and an upbeat corporate outlook. This notwithstanding, we recognise that geopolitical uncertainties, national elections, trade tensions and rising rates are among some of the key sources of risk likely to add to the return of market volatility here in Asia and beyond. With more companies finding it difficult to beat investors’ elevated expectations, earnings – not multiple expansion – will need to be the source of equity returns going forward. To this end, we adhere to our high conviction, bottom-up driven investment discipline in our continued search for Chinese growth companies with proven track records or growth potential that has been underestimated by the market. Fullerton Lux Funds - Global Emerging Market Equities Emerging Markets (EM) enjoyed strong returns over the 12 months under review, benefitting from an environment of synchronised global growth, strong corporate earnings and accommodative monetary policy. Overall, developed markets’ central bank rhetoric and policy actions, uncertainty over the Trump administration as well as geopolitical tensions were focal points for investors over most of 2017. Markets also turned challenging in 1Q18 after risk aversion erupted on the back of inflationary pressures and higher bond yields in the US, as well as US-China trade tensions. EM rose without any major drawdown from April to late January, driven by a sustained earnings growth recovery with modest multiple expansion. The combination of accelerating growth, subdued inflation and low volatility was supportive of risk assets, and EM equities have consequently delivered positive performance and attracted significant funds flows. Additionally, US dollar weakness and commodity price strength also benefited EM during the period under review, with crude oil and copper delivering material gains in response to firm underlying demand and supply-side tightness. All sectors delivered positive performance during the period, with information technology accounting for 41% of EM gains and financials accounting for 23%. At the country level, China delivered 42% of gains, followed by Korea (16%) and Taiwan (10%). North Asian tech delivered sequential earnings upgrades in both the internet and semiconductor subsectors, and was the key determinant of market performance during the period. The Fund delivered strong gains in the period under review, with material contribution from positions in Chinese and Korean tech, Chinese healthcare and the consumer discretionary sector. Outside Asia, positions in a Polish insurance company, Turkish telecom operator and two Latin American energy distributors were notable contributors to performance. Korea was the principal detractor, specifically in the industrials sector. Stock selection contributed positively during the period, offset by negative effect from allocation and currency. The global growth environment remains robust, though late-cycle. Global monetary policy is no longer a tailwind for equities and with more companies finding it difficult to beat investors’ elevated expectations, earnings – not multiple expansion – will need to be the source of equity returns going forward. EM should continue to perform relatively well given attractive growth differential versus developed markets, and benign inflationary pressures resulting in largely accommodative EM policy. Valuations are undemanding, though not cheap – therefore, the portfolio is focused on companies with good earnings visibility and sustainable growth, having reduced exposure to stocks and sectors where valuations have become stretched following a period of unbroken strong performance, and where there is no longer an appropriate margin of safety. We retain a relevant exposure to Latin America, given the positive growth outlook and decline in the cost of capital. The profit cycle in the region should be sustained and corporates are well positioned to capture this growth now that financial deleveraging has occurred. We have significant positions in the Asian consumer and tech sectors, specifically in companies where we have identified a multi-year runway for growth and where valuations do not yet capture this potential. Our positive view on Chinese mass consumption is expressed by our position in a beverage and noodles producer. We also retain a significant exposure to the Indian banking and Asian insurance sectors, where rising financial penetration should continue to enable well-run companies to compound growth at attractive returns. Lastly, we hold exposure to late-cycle growth beneficiaries in the commodities and energy sectors, in companies where we see quality asset bases and low levels of financial leverage. Fullerton Lux Funds - Asian Currency Bonds Global bond markets experienced bouts of heightened volatility over the 12-month period under review. Developed market central bank policy actions were a major focal point while investors also had to grapple with political uncertainty surrounding the Trump administration and geopolitical risks from North Korea, over much of 2017. In China, financial deleveraging was a key policy focus. While global markets saw significant volatility, Asian local currency bonds did well, boosted by continued inflows into emerging market (EM) local currency funds, yield seeking appetite and supportive policy actions by various central banks. Bond markets experienced bouts of volatility from potential discussion of a reduction in the Federal Reserve’s balance sheets by Fed officials, election risks in Europe, and geopolitical tensions on the Korean peninsula. Fading optimism over the ability of the Trump administration to push through its pro-growth agenda contributed to a risk-off tone in the market. US Treasuries rallied as investors sought refuge in safe haven assets. This, coupled with USD weakness against most Asian currencies and stronger EM bond inflows helped the positive performance in Asian local currency bonds for most of the first half of 2017. US bond yields subsequently moved higher on the back of stronger US economic data, hawkish central bank rhetoric, and concerns of possible coordinated monetary policy tightening by the Federal Reserve and the European Central Bank. Despite bouts of softness, Asian local currency bond markets generated positive gains for most of the second half of 2017, and ended the year on a strong note.
10
FULLERTON LUX FUNDS Directors’ Report (continued) Fullerton Lux Funds - Asian Currency Bonds (continued) Inflationary pressures in the US, higher US bond yields and US-China trade tensions, dominated bond markets in the first quarter of 2018. Hawkish central bank rhetoric, higher inflation and better economic data led to a sell-off in US Treasuries and yields rose sharply across the curve. The benchmark 10-year yield briefly rose above the key level of 2.9%. However, trade tensions flared after the Trump administration announced steel and aluminium trade tariffs in early March. The subsequent imposition of additional tariffs on up to US$60 billion in annual imports from China further raised the spectre of an US-China trade dispute. Treasury yields moved lower as investors took refuge in safe haven government debt in the equities sell-off that followed. A bumper issuance of US government debt and weak auction demand also capped yields. After a strong performance in 2017, Asian local currency bonds delivered a more uneven, albeit positive performance, in the first quarter of 2018 as the pullback in global risk sentiment led to sharper outflows in February. Asian local currency returns were mainly driven by the strength in Asian currencies, while performance of local currency bonds was mixed. Bond yields of low yielders such as KRW and HKD were more affected by the direction of US rates. In terms of monetary policy over the review period, Bank Indonesia and the Reserve Bank of India lowered their benchmark interest rates. In Indonesia, Bank Indonesia cut the 7-day reverse repo rate from 4.75% to 4.25% over two consecutive months beginning July 2017. In China, the People’s Bank of China (PBOC) raised the 7-day and 28-day Open Market Operations (OMO) as well as the one-year money lending facility policy rates by 5bps each in December 2017 and March 2018. The PBOC announced the lending rate changes following the rate hikes by the US Federal Reserve. Elsewhere, the Indian government announced an adjustment of its bond issuance policy in March, triggering expectations of a short-term supply squeeze; news over the potential increase in Foreign Portfolio Investment (FPI) limits for bonds also boosted sentiment. Away from central bank actions, India’s sovereign rating was upgraded by Moody’s to Baa2 from Baa3 on expectations of continued progress for economic and institutional reforms. Elsewhere, Chinese bonds received a boost after it was announced in March that China bonds will be added to the Bloomberg Barclays Global Aggregate Index over a 20-month period beginning April 2019. Asian local currency markets delivered a strong performance over the review period, with the iBoxx ALBI Index delivering a positive return of 7.3% in USD terms and 2.5% in local currency terms. Malaysia was the outperformer on a total return basis, with gains led mainly by MYR strength. Indonesia was the outperformer in local currency returns on the back of strong inflows and supportive monetary policy conditions. PHP bonds lagged the region, with losses exacerbated by currency weakness whilst the central bank has been slow to hike rates despite higher inflation. For the 12 months ended 31 March 2018, the Fund outperformed the benchmark in both USD and local currency terms. The Fund benefitted from positive carry and spread outperformance. Market allocation effects were also positive, as the Fund gained from its overweight to higher yielding bonds including Malaysia and India. Duration and currency effects detracted from overall performance. Asia’s growth outlook remains supportive for Asian bonds and currencies but the tail risks have risen. We do not expect US-China trade tensions to escalate into a full-blown trade war, as it is not in the mutual interests of both economies. However, against rising asset volatilities and expensive US equities valuation, the potential for further spillover into EM risk assets remains. We will stay nimble in managing overall FX and duration exposure. Fullerton Lux Funds - Asian High Yield Bonds Global bond markets experienced bouts of heightened volatility over the review period. Developed market central bank policy actions were a major focal point while investors also had to grapple with political uncertainty surrounding the Trump administration and geopolitical risks from North Korea in 2017. Fading optimism over the ability of the Trump administration to push through its pro-growth agenda contributed to a risk-off tone in the market. US Treasuries rallied as investors sought refuge in safe haven assets. US bond yields subsequently moved higher in the second half of 2017 on the back of stronger US economic data, hawkish central bank rhetoric, and concerns of possible coordinated monetary policy tightening by the Federal Reserve and the European Central Bank. Core European bond yields also rose in December as the European Central Bank approached its final asset purchases for 2017. Inflation concerns in the US, higher US bond yields and US-China trade tensions dominated bond markets in the first quarter of 2018. The Treasury yield curve steepened slightly in January and the trend of rising US yields was further intensified by improving inflation data. US bond yields moved higher, with the benchmark 10-year yield briefly breaching the technical level of 2.9% in February, leading to risk-off sentiment among investors. Markets also interpreted newly-appointed US Federal Reserve Chairman Jerome Powell’s positive assessment of the US growth and inflation outlook with a hawkish bias, raising the possibility of more than three rate hikes in 2018. US-China trade tensions flared after the Trump administration announced steel and aluminium trade tariffs in early March, although it was later announced that a handful of nations would be exempt from these tariffs. The subsequent imposition of additional tariffs on up to US$60 billion in annual imports from China further raised the spectre of an US-China trade dispute. The benchmark 10-year yield broke out of a technical trading range and fell below 2.8% during the month. On the bond supply front, a bumper issuance of US government bonds and weak auction demand for two-year and five-year US Treasuries drove the 10-year yield down to 2.74% in March. In Asia, leading indicators for manufacturing were generally resilient over the review period. Elsewhere in China, financial deleveraging was a key policy focus amid greater regulatory scrutiny risky financial instruments and tougher efforts to contain the country’s financial risks, but growth remained stable overall. On the monetary policy front, the People’s Bank of China (PBOC) made a directional move with the raising of the 7-day and 28-day Open Market Operations (OMO) as well as the one-year money lending facility policy rates by 5bps each, following the rate hike by the US Federal Reserve in December. The PBOC had made this directional move to raise interest rates following the rate hike by the US Federal Reserve.
11
FULLERTON LUX FUNDS Directors’ Report (continued) Fullerton Lux Funds - Asian High Yield Bonds (continued) Asian credits, as represented by the JACI Composite Index, performed strongly in the last three quarters of 2017, largely driven by US Treasury returns. Asian credit markets subsequently reversed gains and delivered negative returns in 1Q18 as credit spreads widened and US Treasury yields rose during the quarter. Overall, the JACI Composite Index delivered positive returns of 1.72% over the review period, despite the negative returns in 1Q18. The JACI High Yield Index posted a return of 2.25% over the review period even as spreads widened by 19.4bps. By sub-segment, high yield quasi sovereigns and sovereigns outperformed with returns of 4.41% and 4.23%, respectively. High yield corporates posted more muted gains of 1.83% as spreads widened the most. For the 12 months ended 31 March 2018, the Fund delivered positive returns, primarily due to its holdings in commodities and Chinese property credits. Positive coupon carry was the main driver of performance. Asia’s growth outlook remains supportive for Asian credits and currencies but the risks have risen. We do not expect US-China trade tensions to escalate into a full-blown trade war, as it is not in the mutual interests of both economies. However, against rising asset volatilities, the potential for further spillover into emerging market risk assets remains. Given the pickup in market volatility, the Fund will adopt a more nimble approach in its holdings. Preference is to keep duration short and maintain credit selectivity. Fullerton Lux Funds - Asian Bonds Global bond markets experienced bouts of heightened volatility over the review period. Developed market central bank policy actions were a major focal point while investors also had to grapple with political uncertainty surrounding the Trump administration and geopolitical risks from North Korea in 2017. Fading optimism over the ability of the Trump administration to push through its pro-growth agenda contributed to a risk-off tone in the market. US Treasuries rallied as investors sought refuge in safe haven assets. US bond yields subsequently moved higher in the second half of 2017 on the back of stronger US economic data, hawkish central bank rhetoric, and concerns of possible coordinated monetary policy tightening by the Federal Reserve and the European Central Bank. Core European bond yields also rose in December as the European Central Bank approached its final asset purchases for 2017. Inflation concerns in the US, higher US bond yields and US-China trade tensions dominated bond markets in the first quarter of 2018. The Treasury yield curve steepened slightly in January and the trend of rising US yields was further intensified by improving inflation data. US bond yields moved higher, with the benchmark 10-year yield briefly breaching the technical level of 2.9%, leading to risk-off sentiment among investors. Markets also interpreted newly-appointed US Federal Reserve Chairman Jerome Powell’s positive assessment of the US growth and inflation outlook with a hawkish bias, raising the possibility of more than three rate hikes in 2018. US-China trade tensions flared after the Trump administration announced steel and aluminium trade tariffs in early March, although it was later announced that a handful of nations would be exempt from these tariffs. The subsequent imposition of additional tariffs on up to US$60 billion in annual imports from China further raised the spectre of an US-China trade dispute. The benchmark 10-year yield broke out of a technical trading range and fell below 2.8% during the month. On the bond supply front, a bumper issuance of US government bonds and weak auction demand for two-year and five-year US Treasuries drove the 10-year yield down to 2.74% in March. In Asia, leading indicators for manufacturing were generally resilient over the review period. Elsewhere in China, financial deleveraging was a key policy focus amid greater regulatory scrutiny risky financial instruments and tougher efforts to contain the country’s financial risks, but growth remained stable overall. On the monetary policy front, the People’s Bank of China (PBOC) made a directional move with the raising of the 7-day and 28-day Open Market Operations (OMO) as well as the one-year money lending facility policy rates by 5bps each, following the rate hike by the US Federal Reserve in December. The PBOC had made this directional move to raise interest rates following the rate hike by the US Federal Reserve. Asian credits, as represented by the JACI Composite Index, performed strongly in the last three quarters of 2017, largely driven by US Treasury returns. Asian credit markets subsequently reversed gains and delivered negative returns in 1Q18 as credit spreads widened and US Treasury yields rose during the quarter. Overall, Asian credit markets delivered positive returns of 1.72% over the review period, despite the negative returns in 1Q18. By segment, investment grade (IG) credits (+1.56%) underperformed high yield credits (+2.25%). Within the IG sovereign space, Indonesia bonds performed strongly over the course of 2017, supported by strong inflows, but these gains were reversed in 1Q18. Notably, Indonesia received its third sovereign upgrade after Fitch upgraded the country’s credit rating to BBB from BBB-, citing improved resilience to external shocks, sustained GDP growth and low government debt levels. For the 12 months ended 31 March 2018, the Fund delivered positive returns over its benchmark. The Fund benefitted from positive allocation and credit selection; in particular, the off-benchmark positions in Australia, and positive credit selection in China and India, were the main return contributors. The Fund’s duration exposure added value, while currency effects detracted marginally.
12
FULLERTON LUX FUNDS Directors’ Report (continued) Fullerton Lux Funds - Asian Bonds (continued) Asia’s growth outlook remains supportive for Asian credits and currencies but the risks have risen. We do not expect US-China trade tensions to escalate into a full-blown trade war, as it is not in the mutual interests of both economies. However, against rising asset volatilities and expensive US equities valuation, the potential for further spillover into emerging market risk assets remains. We continue to maintain an underweight stance on duration, with a preference for shorter-dated, lower beta names. In terms of credit strategy, we maintain our preference for credits, as IG credit fundamentals remain broadly sound, with credit profiles that are able to withstand earnings weakness in a challenging operating environment. We would maintain select exposure to high yield credits which provide some buffer in a rising interest rate environment. Fullerton Lux Funds - RMB Bonds Global bond markets experienced bouts of heightened volatility over the 12-month period under review. Developed market central bank policy actions were a major focal point while investors also had to grapple with political uncertainty surrounding the Trump administration and geopolitical risks from North Korea, over much of 2017. Bond markets had a bumpier start to 2018 on the back of inflationary pressures in the US, higher US bond yields and US-China trade tensions. In China, financial deleveraging was a key policy focus throughout the review period. CNH bonds performed well over 2017 and the first quarter of 2018 on the back of currency strength. Despite the stronger currency, offshore RMB liquidity remained tight, constrained by the small offshore RMB pool. CNH funding also stayed higher than historical levels. China’s onshore bond market was bearish over 2017, and the yield gap between onshore and offshore RMB credit bonds turned positive in 2H17. Financial deleveraging continued apace and the unwinding of leveraged positions created headwinds for CNY bonds in 2017. Liquidity conditions onshore tightened as a whole over the review period but the People’s Bank of China (PBOC) carried out targeted liquidity operations which kept onshore conditions reasonably conducive for most of 2H17. Other supportive measures included targeted cuts to Chinese banks’ Reserve Requirement Ratio (RRR) by the PBOC in September, a move aimed at encouraging lending to Small and Medium Enterprises. Onshore liquidity conditions remained supported in the first three months of 2018. The “Contingent Reserve Allowance” tool, which allows up to 2% RRR relief for national commercial banks for up to 30 days, came into effect in January. Targeted RRR cuts announced by the PBOC also came into effect on 25 January. Liquidity conditions onshore remained benign in the run up to the National People’s Congress in March. On the policy front, it was announced during the National Party Congress that a new entity, the China Banking and Insurance Regulatory Committee, would be formed with the merger of the China Insurance Regulatory Committee and China Banking Regulatory Committee. In terms of monetary policy actions, the People’s Bank of China (PBOC) raised the 7-day and 28-day Open Market Operations (OMO) as well as the one-year money lending facility policy rates by 5bps each in December 2017 and March 2018. The PBOC announced the lending rate changes following the rate hikes by the US Federal Reserve. China’s bond market also received a boost after it was announced in March that China bonds will be added to the Bloomberg Barclays Global Aggregate Index over a 20-month period beginning April 2019. Away from the Chinese bond markets, the Asian USD credit market performed strongly in the last three quarters of 2017, largely driven by US Treasury returns. However, the positive performance in the Asian credit market was derailed in the first three months of 2018 on the back of inflationary pressures in the US, higher US bond yields and US-China trade tensions. Trade tensions flared after the Trump administration announced steel and aluminium trade tariffs in early March. The subsequent imposition of additional tariffs on up to US$60 billion in annual imports from China further raised the spectre of an US-China trade dispute. Overall, Asian USD credit markets delivered positive returns over the review period, despite the negative performance in the first quarter of 2018. For the 12 months ended 31 March 2018, the Fund delivered positive returns over the CNH Overnight Deposit Rate, with positive coupon carry the key contributor to returns, whilst positive currency and spread effects added value. The Fund benefitted from tighter credit spreads in its CNH and CNY credit allocations. Duration however detracted from overall performance as US Treasury yields rose over the review period. In light of higher expected CGB net issuance in 2Q, we maintain our preference to underweight duration. However, we will be watchful of policy guidance and implementation to trade nimbly. We continue to have a favorable view of onshore credit spreads given levels remain elevated even after some tightening year to date. The healthy revival of issuance in CNH space observed since the start of the year also provides greater investment opportunities. Moreover, we recognize that supportive technicals in the CNH market will remain. In USD space, near term supply from Chinese developers have been particularly strong post earnings and on account of funding needs. We look to be selective and invest in quality issuers with reasonable valuations.
13
FULLERTON LUX FUNDS Directors’ Report (continued) Fullerton Lux Funds - Asian Short Duration Bonds Global bond markets experienced bouts of heightened volatility over the review period. Developed market central bank policy actions were a major focal point while investors also had to grapple with political uncertainty surrounding the Trump administration and geopolitical risks from North Korea in 2017. Fading optimism over the ability of the Trump administration to push through its pro-growth agenda contributed to a risk-off tone in the market. US Treasuries rallied as investors sought refuge in safe haven assets. US bond yields subsequently moved higher in the second half of 2017 on the back of stronger US economic data, hawkish central bank rhetoric, and concerns of possible coordinated monetary policy tightening by the Federal Reserve and the European Central Bank. Core European bond yields also rose in December as the European Central Bank approached its final asset purchases for 2017. Inflation concerns in the US, higher US bond yields and US-China trade tensions dominated bond markets in the first quarter of 2018. The Treasury yield curve steepened slightly in January and the trend of rising US yields was further intensified by improving inflation data. US bond yields moved higher, with the benchmark 10-year yield briefly breaching the technical level of 2.9%, leading to risk-off sentiment among investors. Markets also interpreted newly-appointed US Federal Reserve Chairman Jerome Powell’s positive assessment of the US growth and inflation outlook with a hawkish bias, raising the possibility of more than three rate hikes in 2018. US-China trade tensions flared after the Trump administration announced steel and aluminium trade tariffs in early March, although it was later announced that a handful of nations would be exempt from these tariffs. The subsequent imposition of additional tariffs on up to US$60 billion in annual imports from China further raised the spectre of an US-China trade dispute. The benchmark 10-year yield broke out of a technical trading range and fell below 2.8% during the month. On the bond supply front, a bumper issuance of US government bonds and weak auction demand for two-year and five-year US Treasuries drove the 10-year yield down to 2.74% in March. In Asia, leading indicators for manufacturing were generally resilient over the review period. Elsewhere in China, financial deleveraging was a key policy focus amid greater regulatory scrutiny risky financial instruments and tougher efforts to contain the country’s financial risks, but growth remained stable overall. On the monetary policy front, the People’s Bank of China (PBOC) made a directional move with the raising of the 7-day and 28-day Open Market Operations (OMO) as well as the one-year money lending facility policy rates by 5bps each, following the rate hike by the US Federal Reserve in December. The PBOC had made this directional move to raise interest rates following the rate hike by the US Federal Reserve. Asian credits, as represented by the JACI Composite Index, performed strongly in the last three quarters of 2017, largely driven by US Treasury returns. Asian credit markets subsequently reversed gains and delivered negative returns in 1Q18 as credit spreads widened and US Treasury yields rose during the quarter. Overall, Asian credit markets delivered positive returns of 1.72% over the review period, despite the negative returns in 1Q18. By segment, investment grade (IG) credits (+1.56%) underperformed high yield credits (+2.25%). Within the IG sovereign space, Indonesia bonds performed strongly over the course of 2017, supported by strong inflows, but these gains were reversed in 1Q18. Notably, Indonesia received its third sovereign upgrade after Fitch upgraded the country’s credit rating to BBB from BBB-, citing improved resilience to external shocks, sustained GDP growth and low government debt levels. For the 12 months ended 31 March 2018, the Fund delivered positive returns. The Fund benefitted the most from positive coupon carry, while spread and currency effects added value. The Fund’s duration exposure was the key detractor. Market volatility could continue in the coming months amid trade tensions between the US and China, and the prospect of a potentially more hawkish policy path by the Federal Reserve. We continue to maintain a nimble stance on duration, with a preference for shorter-dated, lower beta names. In terms of credit strategy, we maintain our preference for credits, as IG credit fundamentals remain broadly sound, with credit profiles that are able to withstand earnings weakness in a challenging operating environment. We would maintain select exposure to HY credits which provide some buffer in rising interest rate environment.
14
FULLERTON LUX FUNDS
Directors’ Report (continued)
Global risk measurement methods
The Management Company uses a risk management process that allows a monitoring of the risk of the portfolio positions and their share of the overall risk profile of the Funds at any time. In accordance with the amended Law of December 17, 2010 and the applicable regulatory requirements of the Commission de Surveillance du Secteur Financier (“CSSF”) the Management Company reports to the CSSF on a regular basis on the risk management process. The Management Company ensures, based on appropriate and reasonable methods, that the overall risk, associated with derivatives, does not exceed the net asset value of the portfolio. The Management Company uses the Commitment Approach to monitor the aforementioned risk.
Commitment approach
The thirteen Funds use the commitment approach in order to monitor and measure the global exposure. The global exposure of the Funds is calculated based on the commitment approach in accordance with the methodology described in the ESMA's guidelines 10-788.
Yours sincerely,
The Board of Directors (Fullerton Lux Funds)
Luxembourg, July 17, 2018
The performances were calculated in using the official published Net Asset Value as at March 29, 2018.
Note: The figures stated in this report are historical and not necessarily indicative of future performance.
15
Audit report To the Shareholders of Fullerton Lux Funds Our opinion In our opinion, the accompanying financial statements give a true and fair view of the financial position of Fullerton Lux Funds and of each of its sub-funds (the “Fund”) as at March 31, 2018, and of the results of their operations and changes in their net assets for the year then ended in accordance with Luxembourg legal and regulatory requirements relating to the preparation and presentation of the financial statements. What we have audited The Fund’s financial statements comprise: • the statement of net assets as at March 31, 2018; • the statement of operations and changes in net assets for the year then ended; • the securities portfolio as at March 31, 2018; and • the notes to the financial statements, which include a summary of significant accounting policies. Basis for opinion We conducted our audit in accordance with the Law of July 23, 2016 on the audit profession (Law of July 23, 2016) and with International Standards on Auditing (ISAs) as adopted for Luxembourg by the “Commission de Surveillance du Secteur Financier” (CSSF). Our responsibilities under those Law and standards are further described in the “Responsibilities of the “Réviseur d’entreprises agréé” for the audit of the financial statements” section of our report. We believe that the audit evidence we have obtained is sufficient and appropriate to provide a basis for our opinion. We are independent of the Fund in accordance with the International Ethics Standards Board for Accountants’ Code of Ethics for Professional Accountants (IESBA Code) as adopted for Luxembourg by the CSSF together with the ethical requirements that are relevant to our audit of the financial statements. We have fulfilled our other ethical responsibilities under those ethical requirements.
PricewaterhouseCoopers, Société coopérative, 2 rue Gerhard Mercator, B.P. 1443, L-1014 Luxembourg T : +352 494848 1, F : +352 494848 2900, www.pwc.lu Cabinet de révision agréé. Expert-comptable (autorisation gouvernementale n°10028256) R.C.S. Luxembourg B 65 477 - TVA LU25482518
16
Other information The Board of Directors of the Fund is responsible for the other information. The other information comprises the information stated in the annual report but does not include the financial statements and our audit report thereon. Our opinion on the financial statements does not cover the other information and we do not express any form of assurance conclusion thereon. In connection with our audit of the financial statements, our responsibility is to read the other information identified above and, in doing so, consider whether the other information is materially inconsistent with the financial statements or our knowledge obtained in the audit, or otherwise appears to be materially misstated. If, based on the work we have performed, we conclude that there is a material misstatement of this other information, we are required to report that fact. We have nothing to report in this regard. Responsibilities of the Board of Directors of the Fund for the financial statements The Board of Directors of the Fund is responsible for the preparation and fair presentation of the financial statements in accordance with Luxembourg legal and regulatory requirements relating to the preparation and presentation of the financial statements, and for such internal control as the Board of Directors of the Fund determines is necessary to enable the preparation of financial statements that are free from material misstatement, whether due to fraud or error. In preparing the financial statements, the Board of Directors of the Fund is responsible for assessing the Fund’s ability to continue as a going concern, disclosing, as applicable, matters related to going concern and using the going concern basis of accounting unless the Board of Directors of the Fund either intends to liquidate the Fund or to cease operations, or has no realistic alternative but to do so.
17
Responsibilities of the “Réviseur d’entreprises agréé” for the audit of the financial statements
The objectives of our audit are to obtain reasonable assurance about whether the financial statements as a whole are free from material misstatement, whether due to fraud or error, and to issue an audit report that includes our opinion. Reasonable assurance is a high level of assurance, but is not a guarantee that an audit conducted in accordance with the Law of July 23, 2016 and with ISAs as adopted for Luxembourg by the CSSF will always detect a material misstatement when it exists. Misstatements can arise from fraud or error and are considered material if, individually or in the aggregate, they could reasonably be expected to influence the economic decisions of users taken on the basis of these financial statements.
As part of an audit in accordance with the Law of July 23, 2016 and with ISAs as adopted for Luxembourg by the CSSF, we exercise professional judgment and maintain professional scepticism throughout the audit.
We also:
• identify and assess the risks of material misstatement of the financial statements, whether due to fraud or error, design and performaudit procedures responsive to those risks, and obtain audit evidence that is sufficient and appropriate to provide a basis for ouropinion. The risk of not detecting a material misstatement resulting from fraud is higher than for one resulting from error, as fraud mayinvolve collusion, forgery, intentional omissions, misrepresentations, or the override of internal control;
• obtain an understanding of internal control relevant to the audit in order to design audit procedures that are appropriate in thecircumstances, but not for the purpose of expressing an opinion on the effectiveness of the Fund’s internal control;
• evaluate the appropriateness of accounting policies used and the reasonableness of accounting estimates and related disclosures made by the Board of Directors of the Fund;
• conclude on the appropriateness of the Board of Directors of the Fund’s use of the going concern basis of accounting and, based on theaudit evidence obtained, whether a material uncertainty exists related to events or conditions that may cast significant doubt on theFund’s ability to continue as a going concern. If we conclude that a material uncertainty exists, we are required to draw attention in ouraudit report to the related disclosures in the financial statements or, if such disclosures are inadequate, to modify our opinion. Ourconclusions are based on the audit evidence obtained up to the date of our audit report. However, future events or conditions maycause the Fund to cease to continue as a going concern;
• evaluate the overall presentation, structure and content of the financial statements, including the disclosures, and whether the financialstatements represent the underlying transactions and events in a manner that achieves fair presentation.
We communicate with those charged with governance regarding, among other matters, the planned scope and timing of the audit and significant audit findings, including any significant deficiencies in internal control that we identify during our audit.
PricewaterhouseCoopers, Société coopérative Luxembourg, July 17, 2018 Represented by
Valérie Arnold
18
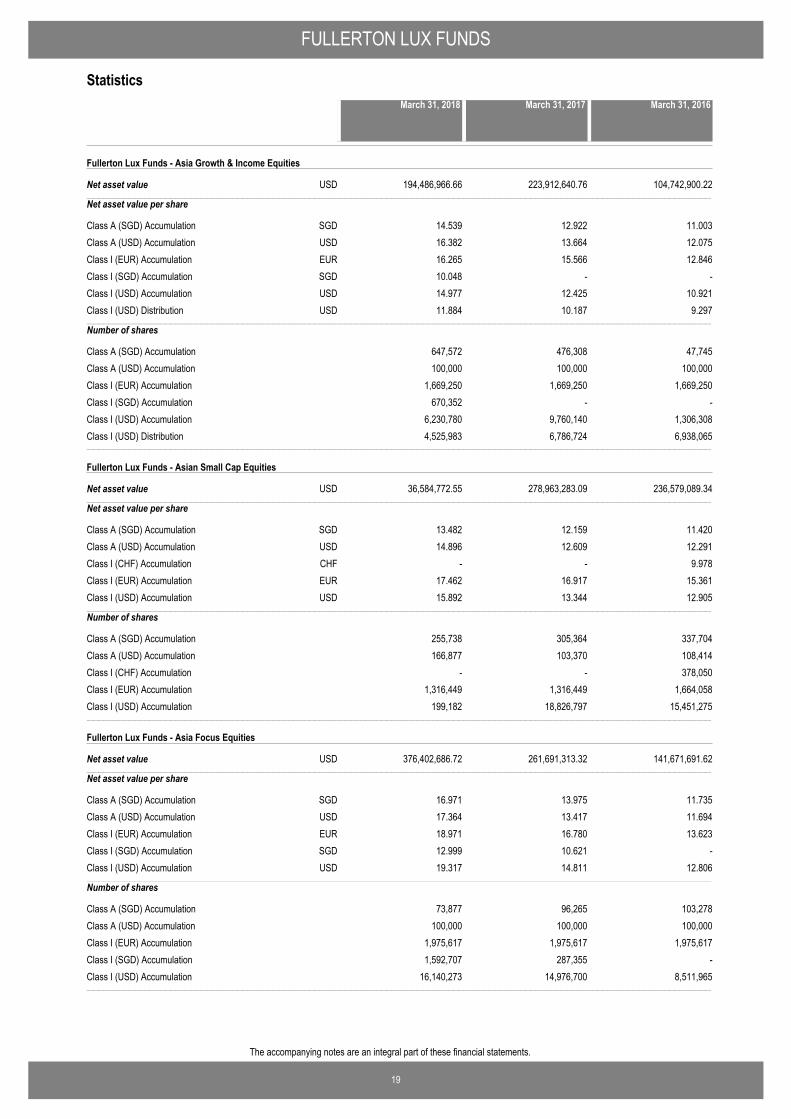
FULLERTON LUX FUNDS
19
The accompanying notes are an integral part of these financial statements.
Statistics
Fullerton Lux Funds - Asia Growth & Income Equities
Net asset value−−−−−−−−−−−−−−−−−−−−−−−−−−−−−−−−−−−−−−−−−−−−−−−−−−−−−−−−−−−−−−−−−−−−−−−−−−−−−−−−−−−−−−−−−−−−−−−−−−−−−−−−−−−−−−−−−−−−−−−−−−−−−−−−−−−−−−−−−−−−−−−−−−−−−−−−−−−−−−−−−−−−−−−−−−−−−−−−−−−−−−−−−−−−−−−−−−−−−−−−−−−−−−−−−−−−−−−−−−−−−−−−−−−−−−−−−−−−−−−−−−−−−−−−−−−−−−−−−−−−−−−−−−−−−−−−−−−−−−−−−−−−−−−−−−−−−−−−−−−−−−−−−−−−−−−−−−−−−−−−−−−−−−−−−−−−−−−−−−−−−−−−−−−−−−−−−−−−−−−−−−−−−−−−−−−−−−−−−−−−−−−−−−−−−−−−−−−−−−−−−−−−−−−−−−−−−−−−−−−−−−−−−−−−−−−−−−−−−−−−−−−−−−−−−−−−−−−−−−−−−−−−−−−−−−−−−−−−−−−−−−−−−−−−−−−−−−−−−−−−−−−
194,486,966.66 223,912,640.76 104,742,900.22USD
Net asset value per share
Class A (SGD) Accumulation 14.539 12.922 11.003SGDClass A (USD) Accumulation 16.382 13.664 12.075USDClass I (EUR) Accumulation 16.265 15.566 12.846EURClass I (SGD) Accumulation 10.048 - -SGDClass I (USD) Accumulation 14.977 12.425 10.921USDClass I (USD) Distribution 11.884 10.187 9.297USD−−−−−−−−−−−−−−−−−−−−−−−−−−−−−−−−−−−−−−−−−−−−−−−−−−−−−−−−−−−−−−−−−−−−−−−−−−−−−−−−−−−−−−−−−−−−−−−−−−−−−−−−−−−−−−−−−−−−−−−−−−−−−−−−−−−−−−−−−−−−−−−−−−−−−−−−−−−−−−−−−−−−−−−−−−−−−−−−−−−−−−−−−−−−−−−−−−−−−−−−−−−−−−−−−−−−−−−−−−−−−−−−−−−−−−−−−−−−−−−−−−−−−−−−−−−−−−−−−−−−−−−−−−−−−−−−−−−−−−−−−−−−−−−−−−−−−−−−−−−−−−−−−−−−−−−−−−−−−−−−−−−−−−−−−−−−−−−−−−−−−−−−−−−−−−−−−−−−−−−−−−−−−−−−−−−−−−−−−−−−−−−−−−−−−−−−−−−−−−−−−−−−−−−−−−−−−−−−−−−−−−−−−−−−−−−−−−−−−−−−−−−−−−−−−−−−−−−−−−−−−−−−−−−−−−−−−−−−−−−−−−−−−−−−−−−−−−−−−−−−−−−
Number of shares
Class A (SGD) Accumulation 647,572 476,308 47,745Class A (USD) Accumulation 100,000 100,000 100,000Class I (EUR) Accumulation 1,669,250 1,669,250 1,669,250Class I (SGD) Accumulation 670,352 - -Class I (USD) Accumulation 6,230,780 9,760,140 1,306,308Class I (USD) Distribution 4,525,983 6,786,724 6,938,065−−−−−−−−−−−−−−−−−−−−−−−−−−−−−−−−−−−−−−−−−−−−−−−−−−−−−−−−−−−−−−−−−−−−−−−−−−−−−−−−−−−−−−−−−−−−−−−−−−−−−−−−−−−−−−−−−−−−−−−−−−−−−−−−−−−−−−−−−−−−−−−−−−−−−−−−−−−−−−−−−−−−−−−−−−−−−−−−−−−−−−−−−−−−−−−−−−−−−−−−−−−−−−−−−−−−−−−−−−−−−−−−−−−−−−−−−−−−−−−−−−−−−−−−−−−−−−−−−−−−−−−−−−−−−−−−−−−−−−−−−−−−−−−−−−−−−−−−−−−−−−−−−−−−−−−−−−−−−−−−−−−−−−−−−−−−−−−−−−−−−−−−−−−−−−−−−−−−−−−−−−−−−−−−−−−−−−−−−−−−−−−−−−−−−−−−−−−−−−−−−−−−−−−−−−−−−−−−−−−−−−−−−−−−−−−−−−−−−−−−−−−−−−−−−−−−−−−−−−−−−−−−−−−−−−−−−−−−−−−−−−−−−−−−−−−−−−−−−−−−−−−
Fullerton Lux Funds - Asian Small Cap Equities
Net asset value−−−−−−−−−−−−−−−−−−−−−−−−−−−−−−−−−−−−−−−−−−−−−−−−−−−−−−−−−−−−−−−−−−−−−−−−−−−−−−−−−−−−−−−−−−−−−−−−−−−−−−−−−−−−−−−−−−−−−−−−−−−−−−−−−−−−−−−−−−−−−−−−−−−−−−−−−−−−−−−−−−−−−−−−−−−−−−−−−−−−−−−−−−−−−−−−−−−−−−−−−−−−−−−−−−−−−−−−−−−−−−−−−−−−−−−−−−−−−−−−−−−−−−−−−−−−−−−−−−−−−−−−−−−−−−−−−−−−−−−−−−−−−−−−−−−−−−−−−−−−−−−−−−−−−−−−−−−−−−−−−−−−−−−−−−−−−−−−−−−−−−−−−−−−−−−−−−−−−−−−−−−−−−−−−−−−−−−−−−−−−−−−−−−−−−−−−−−−−−−−−−−−−−−−−−−−−−−−−−−−−−−−−−−−−−−−−−−−−−−−−−−−−−−−−−−−−−−−−−−−−−−−−−−−−−−−−−−−−−−−−−−−−−−−−−−−−−−−−−−−−−−
36,584,772.55 278,963,283.09 236,579,089.34USD
Net asset value per share
Class A (SGD) Accumulation 13.482 12.159 11.420SGDClass A (USD) Accumulation 14.896 12.609 12.291USDClass I (CHF) Accumulation - - 9.978CHFClass I (EUR) Accumulation 17.462 16.917 15.361EURClass I (USD) Accumulation 15.892 13.344 12.905USD−−−−−−−−−−−−−−−−−−−−−−−−−−−−−−−−−−−−−−−−−−−−−−−−−−−−−−−−−−−−−−−−−−−−−−−−−−−−−−−−−−−−−−−−−−−−−−−−−−−−−−−−−−−−−−−−−−−−−−−−−−−−−−−−−−−−−−−−−−−−−−−−−−−−−−−−−−−−−−−−−−−−−−−−−−−−−−−−−−−−−−−−−−−−−−−−−−−−−−−−−−−−−−−−−−−−−−−−−−−−−−−−−−−−−−−−−−−−−−−−−−−−−−−−−−−−−−−−−−−−−−−−−−−−−−−−−−−−−−−−−−−−−−−−−−−−−−−−−−−−−−−−−−−−−−−−−−−−−−−−−−−−−−−−−−−−−−−−−−−−−−−−−−−−−−−−−−−−−−−−−−−−−−−−−−−−−−−−−−−−−−−−−−−−−−−−−−−−−−−−−−−−−−−−−−−−−−−−−−−−−−−−−−−−−−−−−−−−−−−−−−−−−−−−−−−−−−−−−−−−−−−−−−−−−−−−−−−−−−−−−−−−−−−−−−−−−−−−−−−−−−−
Number of shares
Class A (SGD) Accumulation 255,738 305,364 337,704Class A (USD) Accumulation 166,877 103,370 108,414Class I (CHF) Accumulation - - 378,050Class I (EUR) Accumulation 1,316,449 1,316,449 1,664,058Class I (USD) Accumulation 199,182 18,826,797 15,451,275−−−−−−−−−−−−−−−−−−−−−−−−−−−−−−−−−−−−−−−−−−−−−−−−−−−−−−−−−−−−−−−−−−−−−−−−−−−−−−−−−−−−−−−−−−−−−−−−−−−−−−−−−−−−−−−−−−−−−−−−−−−−−−−−−−−−−−−−−−−−−−−−−−−−−−−−−−−−−−−−−−−−−−−−−−−−−−−−−−−−−−−−−−−−−−−−−−−−−−−−−−−−−−−−−−−−−−−−−−−−−−−−−−−−−−−−−−−−−−−−−−−−−−−−−−−−−−−−−−−−−−−−−−−−−−−−−−−−−−−−−−−−−−−−−−−−−−−−−−−−−−−−−−−−−−−−−−−−−−−−−−−−−−−−−−−−−−−−−−−−−−−−−−−−−−−−−−−−−−−−−−−−−−−−−−−−−−−−−−−−−−−−−−−−−−−−−−−−−−−−−−−−−−−−−−−−−−−−−−−−−−−−−−−−−−−−−−−−−−−−−−−−−−−−−−−−−−−−−−−−−−−−−−−−−−−−−−−−−−−−−−−−−−−−−−−−−−−−−−−−−−−
Fullerton Lux Funds - Asia Focus Equities
Net asset value−−−−−−−−−−−−−−−−−−−−−−−−−−−−−−−−−−−−−−−−−−−−−−−−−−−−−−−−−−−−−−−−−−−−−−−−−−−−−−−−−−−−−−−−−−−−−−−−−−−−−−−−−−−−−−−−−−−−−−−−−−−−−−−−−−−−−−−−−−−−−−−−−−−−−−−−−−−−−−−−−−−−−−−−−−−−−−−−−−−−−−−−−−−−−−−−−−−−−−−−−−−−−−−−−−−−−−−−−−−−−−−−−−−−−−−−−−−−−−−−−−−−−−−−−−−−−−−−−−−−−−−−−−−−−−−−−−−−−−−−−−−−−−−−−−−−−−−−−−−−−−−−−−−−−−−−−−−−−−−−−−−−−−−−−−−−−−−−−−−−−−−−−−−−−−−−−−−−−−−−−−−−−−−−−−−−−−−−−−−−−−−−−−−−−−−−−−−−−−−−−−−−−−−−−−−−−−−−−−−−−−−−−−−−−−−−−−−−−−−−−−−−−−−−−−−−−−−−−−−−−−−−−−−−−−−−−−−−−−−−−−−−−−−−−−−−−−−−−−−−−−−
376,402,686.72 261,691,313.32 141,671,691.62USD
Net asset value per share
Class A (SGD) Accumulation 16.971 13.975 11.735SGDClass A (USD) Accumulation 17.364 13.417 11.694USDClass I (EUR) Accumulation 18.971 16.780 13.623EURClass I (SGD) Accumulation 12.999 10.621 -SGDClass I (USD) Accumulation 19.317 14.811 12.806USD−−−−−−−−−−−−−−−−−−−−−−−−−−−−−−−−−−−−−−−−−−−−−−−−−−−−−−−−−−−−−−−−−−−−−−−−−−−−−−−−−−−−−−−−−−−−−−−−−−−−−−−−−−−−−−−−−−−−−−−−−−−−−−−−−−−−−−−−−−−−−−−−−−−−−−−−−−−−−−−−−−−−−−−−−−−−−−−−−−−−−−−−−−−−−−−−−−−−−−−−−−−−−−−−−−−−−−−−−−−−−−−−−−−−−−−−−−−−−−−−−−−−−−−−−−−−−−−−−−−−−−−−−−−−−−−−−−−−−−−−−−−−−−−−−−−−−−−−−−−−−−−−−−−−−−−−−−−−−−−−−−−−−−−−−−−−−−−−−−−−−−−−−−−−−−−−−−−−−−−−−−−−−−−−−−−−−−−−−−−−−−−−−−−−−−−−−−−−−−−−−−−−−−−−−−−−−−−−−−−−−−−−−−−−−−−−−−−−−−−−−−−−−−−−−−−−−−−−−−−−−−−−−−−−−−−−−−−−−−−−−−−−−−−−−−−−−−−−−−−−−−−
Number of shares
Class A (SGD) Accumulation 73,877 96,265 103,278Class A (USD) Accumulation 100,000 100,000 100,000Class I (EUR) Accumulation 1,975,617 1,975,617 1,975,617Class I (SGD) Accumulation 1,592,707 287,355 -Class I (USD) Accumulation 16,140,273 14,976,700 8,511,965−−−−−−−−−−−−−−−−−−−−−−−−−−−−−−−−−−−−−−−−−−−−−−−−−−−−−−−−−−−−−−−−−−−−−−−−−−−−−−−−−−−−−−−−−−−−−−−−−−−−−−−−−−−−−−−−−−−−−−−−−−−−−−−−−−−−−−−−−−−−−−−−−−−−−−−−−−−−−−−−−−−−−−−−−−−−−−−−−−−−−−−−−−−−−−−−−−−−−−−−−−−−−−−−−−−−−−−−−−−−−−−−−−−−−−−−−−−−−−−−−−−−−−−−−−−−−−−−−−−−−−−−−−−−−−−−−−−−−−−−−−−−−−−−−−−−−−−−−−−−−−−−−−−−−−−−−−−−−−−−−−−−−−−−−−−−−−−−−−−−−−−−−−−−−−−−−−−−−−−−−−−−−−−−−−−−−−−−−−−−−−−−−−−−−−−−−−−−−−−−−−−−−−−−−−−−−−−−−−−−−−−−−−−−−−−−−−−−−−−−−−−−−−−−−−−−−−−−−−−−−−−−−−−−−−−−−−−−−−−−−−−−−−−−−−−−−−−−−−−−−−−
March 31, 2016March 31, 2018 March 31, 2017
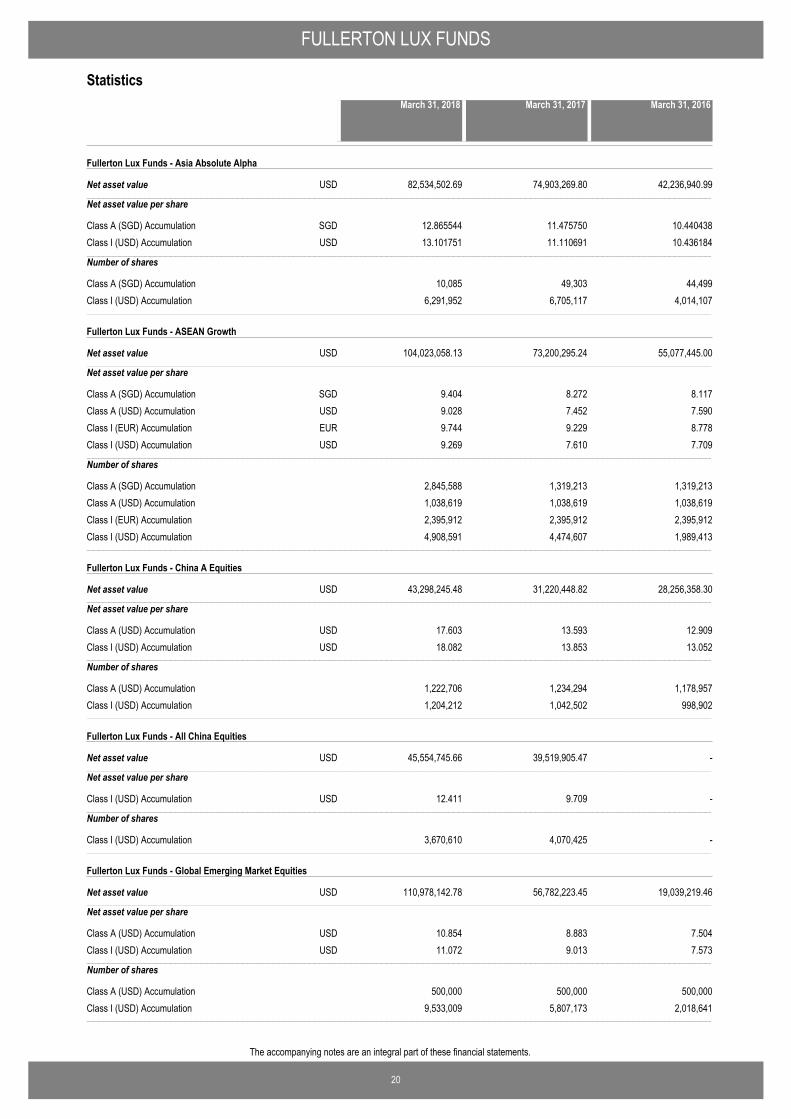
FULLERTON LUX FUNDS
20
The accompanying notes are an integral part of these financial statements.
Statistics
Fullerton Lux Funds - Asia Absolute Alpha
Net asset value−−−−−−−−−−−−−−−−−−−−−−−−−−−−−−−−−−−−−−−−−−−−−−−−−−−−−−−−−−−−−−−−−−−−−−−−−−−−−−−−−−−−−−−−−−−−−−−−−−−−−−−−−−−−−−−−−−−−−−−−−−−−−−−−−−−−−−−−−−−−−−−−−−−−−−−−−−−−−−−−−−−−−−−−−−−−−−−−−−−−−−−−−−−−−−−−−−−−−−−−−−−−−−−−−−−−−−−−−−−−−−−−−−−−−−−−−−−−−−−−−−−−−−−−−−−−−−−−−−−−−−−−−−−−−−−−−−−−−−−−−−−−−−−−−−−−−−−−−−−−−−−−−−−−−−−−−−−−−−−−−−−−−−−−−−−−−−−−−−−−−−−−−−−−−−−−−−−−−−−−−−−−−−−−−−−−−−−−−−−−−−−−−−−−−−−−−−−−−−−−−−−−−−−−−−−−−−−−−−−−−−−−−−−−−−−−−−−−−−−−−−−−−−−−−−−−−−−−−−−−−−−−−−−−−−−−−−−−−−−−−−−−−−−−−−−−−−−−−−−−−−−
82,534,502.69 74,903,269.80 42,236,940.99USD
Net asset value per share
Class A (SGD) Accumulation 12.865544 11.475750 10.440438SGDClass I (USD) Accumulation 13.101751 11.110691 10.436184USD−−−−−−−−−−−−−−−−−−−−−−−−−−−−−−−−−−−−−−−−−−−−−−−−−−−−−−−−−−−−−−−−−−−−−−−−−−−−−−−−−−−−−−−−−−−−−−−−−−−−−−−−−−−−−−−−−−−−−−−−−−−−−−−−−−−−−−−−−−−−−−−−−−−−−−−−−−−−−−−−−−−−−−−−−−−−−−−−−−−−−−−−−−−−−−−−−−−−−−−−−−−−−−−−−−−−−−−−−−−−−−−−−−−−−−−−−−−−−−−−−−−−−−−−−−−−−−−−−−−−−−−−−−−−−−−−−−−−−−−−−−−−−−−−−−−−−−−−−−−−−−−−−−−−−−−−−−−−−−−−−−−−−−−−−−−−−−−−−−−−−−−−−−−−−−−−−−−−−−−−−−−−−−−−−−−−−−−−−−−−−−−−−−−−−−−−−−−−−−−−−−−−−−−−−−−−−−−−−−−−−−−−−−−−−−−−−−−−−−−−−−−−−−−−−−−−−−−−−−−−−−−−−−−−−−−−−−−−−−−−−−−−−−−−−−−−−−−−−−−−−−−
Number of shares
Class A (SGD) Accumulation 10,085 49,303 44,499Class I (USD) Accumulation 6,291,952 6,705,117 4,014,107−−−−−−−−−−−−−−−−−−−−−−−−−−−−−−−−−−−−−−−−−−−−−−−−−−−−−−−−−−−−−−−−−−−−−−−−−−−−−−−−−−−−−−−−−−−−−−−−−−−−−−−−−−−−−−−−−−−−−−−−−−−−−−−−−−−−−−−−−−−−−−−−−−−−−−−−−−−−−−−−−−−−−−−−−−−−−−−−−−−−−−−−−−−−−−−−−−−−−−−−−−−−−−−−−−−−−−−−−−−−−−−−−−−−−−−−−−−−−−−−−−−−−−−−−−−−−−−−−−−−−−−−−−−−−−−−−−−−−−−−−−−−−−−−−−−−−−−−−−−−−−−−−−−−−−−−−−−−−−−−−−−−−−−−−−−−−−−−−−−−−−−−−−−−−−−−−−−−−−−−−−−−−−−−−−−−−−−−−−−−−−−−−−−−−−−−−−−−−−−−−−−−−−−−−−−−−−−−−−−−−−−−−−−−−−−−−−−−−−−−−−−−−−−−−−−−−−−−−−−−−−−−−−−−−−−−−−−−−−−−−−−−−−−−−−−−−−−−−−−−−−−
Fullerton Lux Funds - ASEAN Growth
Net asset value−−−−−−−−−−−−−−−−−−−−−−−−−−−−−−−−−−−−−−−−−−−−−−−−−−−−−−−−−−−−−−−−−−−−−−−−−−−−−−−−−−−−−−−−−−−−−−−−−−−−−−−−−−−−−−−−−−−−−−−−−−−−−−−−−−−−−−−−−−−−−−−−−−−−−−−−−−−−−−−−−−−−−−−−−−−−−−−−−−−−−−−−−−−−−−−−−−−−−−−−−−−−−−−−−−−−−−−−−−−−−−−−−−−−−−−−−−−−−−−−−−−−−−−−−−−−−−−−−−−−−−−−−−−−−−−−−−−−−−−−−−−−−−−−−−−−−−−−−−−−−−−−−−−−−−−−−−−−−−−−−−−−−−−−−−−−−−−−−−−−−−−−−−−−−−−−−−−−−−−−−−−−−−−−−−−−−−−−−−−−−−−−−−−−−−−−−−−−−−−−−−−−−−−−−−−−−−−−−−−−−−−−−−−−−−−−−−−−−−−−−−−−−−−−−−−−−−−−−−−−−−−−−−−−−−−−−−−−−−−−−−−−−−−−−−−−−−−−−−−−−−−
104,023,058.13 73,200,295.24 55,077,445.00USD
Net asset value per share
Class A (SGD) Accumulation 9.404 8.272 8.117SGDClass A (USD) Accumulation 9.028 7.452 7.590USDClass I (EUR) Accumulation 9.744 9.229 8.778EURClass I (USD) Accumulation 9.269 7.610 7.709USD−−−−−−−−−−−−−−−−−−−−−−−−−−−−−−−−−−−−−−−−−−−−−−−−−−−−−−−−−−−−−−−−−−−−−−−−−−−−−−−−−−−−−−−−−−−−−−−−−−−−−−−−−−−−−−−−−−−−−−−−−−−−−−−−−−−−−−−−−−−−−−−−−−−−−−−−−−−−−−−−−−−−−−−−−−−−−−−−−−−−−−−−−−−−−−−−−−−−−−−−−−−−−−−−−−−−−−−−−−−−−−−−−−−−−−−−−−−−−−−−−−−−−−−−−−−−−−−−−−−−−−−−−−−−−−−−−−−−−−−−−−−−−−−−−−−−−−−−−−−−−−−−−−−−−−−−−−−−−−−−−−−−−−−−−−−−−−−−−−−−−−−−−−−−−−−−−−−−−−−−−−−−−−−−−−−−−−−−−−−−−−−−−−−−−−−−−−−−−−−−−−−−−−−−−−−−−−−−−−−−−−−−−−−−−−−−−−−−−−−−−−−−−−−−−−−−−−−−−−−−−−−−−−−−−−−−−−−−−−−−−−−−−−−−−−−−−−−−−−−−−−−
Number of shares
Class A (SGD) Accumulation 2,845,588 1,319,213 1,319,213Class A (USD) Accumulation 1,038,619 1,038,619 1,038,619Class I (EUR) Accumulation 2,395,912 2,395,912 2,395,912Class I (USD) Accumulation 4,908,591 4,474,607 1,989,413−−−−−−−−−−−−−−−−−−−−−−−−−−−−−−−−−−−−−−−−−−−−−−−−−−−−−−−−−−−−−−−−−−−−−−−−−−−−−−−−−−−−−−−−−−−−−−−−−−−−−−−−−−−−−−−−−−−−−−−−−−−−−−−−−−−−−−−−−−−−−−−−−−−−−−−−−−−−−−−−−−−−−−−−−−−−−−−−−−−−−−−−−−−−−−−−−−−−−−−−−−−−−−−−−−−−−−−−−−−−−−−−−−−−−−−−−−−−−−−−−−−−−−−−−−−−−−−−−−−−−−−−−−−−−−−−−−−−−−−−−−−−−−−−−−−−−−−−−−−−−−−−−−−−−−−−−−−−−−−−−−−−−−−−−−−−−−−−−−−−−−−−−−−−−−−−−−−−−−−−−−−−−−−−−−−−−−−−−−−−−−−−−−−−−−−−−−−−−−−−−−−−−−−−−−−−−−−−−−−−−−−−−−−−−−−−−−−−−−−−−−−−−−−−−−−−−−−−−−−−−−−−−−−−−−−−−−−−−−−−−−−−−−−−−−−−−−−−−−−−−−−
Fullerton Lux Funds - China A Equities
Net asset value−−−−−−−−−−−−−−−−−−−−−−−−−−−−−−−−−−−−−−−−−−−−−−−−−−−−−−−−−−−−−−−−−−−−−−−−−−−−−−−−−−−−−−−−−−−−−−−−−−−−−−−−−−−−−−−−−−−−−−−−−−−−−−−−−−−−−−−−−−−−−−−−−−−−−−−−−−−−−−−−−−−−−−−−−−−−−−−−−−−−−−−−−−−−−−−−−−−−−−−−−−−−−−−−−−−−−−−−−−−−−−−−−−−−−−−−−−−−−−−−−−−−−−−−−−−−−−−−−−−−−−−−−−−−−−−−−−−−−−−−−−−−−−−−−−−−−−−−−−−−−−−−−−−−−−−−−−−−−−−−−−−−−−−−−−−−−−−−−−−−−−−−−−−−−−−−−−−−−−−−−−−−−−−−−−−−−−−−−−−−−−−−−−−−−−−−−−−−−−−−−−−−−−−−−−−−−−−−−−−−−−−−−−−−−−−−−−−−−−−−−−−−−−−−−−−−−−−−−−−−−−−−−−−−−−−−−−−−−−−−−−−−−−−−−−−−−−−−−−−−−−−
43,298,245.48 31,220,448.82 28,256,358.30USD
Net asset value per share
Class A (USD) Accumulation 17.603 13.593 12.909USDClass I (USD) Accumulation 18.082 13.853 13.052USD−−−−−−−−−−−−−−−−−−−−−−−−−−−−−−−−−−−−−−−−−−−−−−−−−−−−−−−−−−−−−−−−−−−−−−−−−−−−−−−−−−−−−−−−−−−−−−−−−−−−−−−−−−−−−−−−−−−−−−−−−−−−−−−−−−−−−−−−−−−−−−−−−−−−−−−−−−−−−−−−−−−−−−−−−−−−−−−−−−−−−−−−−−−−−−−−−−−−−−−−−−−−−−−−−−−−−−−−−−−−−−−−−−−−−−−−−−−−−−−−−−−−−−−−−−−−−−−−−−−−−−−−−−−−−−−−−−−−−−−−−−−−−−−−−−−−−−−−−−−−−−−−−−−−−−−−−−−−−−−−−−−−−−−−−−−−−−−−−−−−−−−−−−−−−−−−−−−−−−−−−−−−−−−−−−−−−−−−−−−−−−−−−−−−−−−−−−−−−−−−−−−−−−−−−−−−−−−−−−−−−−−−−−−−−−−−−−−−−−−−−−−−−−−−−−−−−−−−−−−−−−−−−−−−−−−−−−−−−−−−−−−−−−−−−−−−−−−−−−−−−−−
Number of shares
Class A (USD) Accumulation 1,222,706 1,234,294 1,178,957Class I (USD) Accumulation 1,204,212 1,042,502 998,902−−−−−−−−−−−−−−−−−−−−−−−−−−−−−−−−−−−−−−−−−−−−−−−−−−−−−−−−−−−−−−−−−−−−−−−−−−−−−−−−−−−−−−−−−−−−−−−−−−−−−−−−−−−−−−−−−−−−−−−−−−−−−−−−−−−−−−−−−−−−−−−−−−−−−−−−−−−−−−−−−−−−−−−−−−−−−−−−−−−−−−−−−−−−−−−−−−−−−−−−−−−−−−−−−−−−−−−−−−−−−−−−−−−−−−−−−−−−−−−−−−−−−−−−−−−−−−−−−−−−−−−−−−−−−−−−−−−−−−−−−−−−−−−−−−−−−−−−−−−−−−−−−−−−−−−−−−−−−−−−−−−−−−−−−−−−−−−−−−−−−−−−−−−−−−−−−−−−−−−−−−−−−−−−−−−−−−−−−−−−−−−−−−−−−−−−−−−−−−−−−−−−−−−−−−−−−−−−−−−−−−−−−−−−−−−−−−−−−−−−−−−−−−−−−−−−−−−−−−−−−−−−−−−−−−−−−−−−−−−−−−−−−−−−−−−−−−−−−−−−−−−
Fullerton Lux Funds - All China Equities
Net asset value−−−−−−−−−−−−−−−−−−−−−−−−−−−−−−−−−−−−−−−−−−−−−−−−−−−−−−−−−−−−−−−−−−−−−−−−−−−−−−−−−−−−−−−−−−−−−−−−−−−−−−−−−−−−−−−−−−−−−−−−−−−−−−−−−−−−−−−−−−−−−−−−−−−−−−−−−−−−−−−−−−−−−−−−−−−−−−−−−−−−−−−−−−−−−−−−−−−−−−−−−−−−−−−−−−−−−−−−−−−−−−−−−−−−−−−−−−−−−−−−−−−−−−−−−−−−−−−−−−−−−−−−−−−−−−−−−−−−−−−−−−−−−−−−−−−−−−−−−−−−−−−−−−−−−−−−−−−−−−−−−−−−−−−−−−−−−−−−−−−−−−−−−−−−−−−−−−−−−−−−−−−−−−−−−−−−−−−−−−−−−−−−−−−−−−−−−−−−−−−−−−−−−−−−−−−−−−−−−−−−−−−−−−−−−−−−−−−−−−−−−−−−−−−−−−−−−−−−−−−−−−−−−−−−−−−−−−−−−−−−−−−−−−−−−−−−−−−−−−−−−−−
45,554,745.66 39,519,905.47 -USD
Net asset value per share
Class I (USD) Accumulation 12.411 9.709 -USD−−−−−−−−−−−−−−−−−−−−−−−−−−−−−−−−−−−−−−−−−−−−−−−−−−−−−−−−−−−−−−−−−−−−−−−−−−−−−−−−−−−−−−−−−−−−−−−−−−−−−−−−−−−−−−−−−−−−−−−−−−−−−−−−−−−−−−−−−−−−−−−−−−−−−−−−−−−−−−−−−−−−−−−−−−−−−−−−−−−−−−−−−−−−−−−−−−−−−−−−−−−−−−−−−−−−−−−−−−−−−−−−−−−−−−−−−−−−−−−−−−−−−−−−−−−−−−−−−−−−−−−−−−−−−−−−−−−−−−−−−−−−−−−−−−−−−−−−−−−−−−−−−−−−−−−−−−−−−−−−−−−−−−−−−−−−−−−−−−−−−−−−−−−−−−−−−−−−−−−−−−−−−−−−−−−−−−−−−−−−−−−−−−−−−−−−−−−−−−−−−−−−−−−−−−−−−−−−−−−−−−−−−−−−−−−−−−−−−−−−−−−−−−−−−−−−−−−−−−−−−−−−−−−−−−−−−−−−−−−−−−−−−−−−−−−−−−−−−−−−−−−
Number of shares
Class I (USD) Accumulation 3,670,610 4,070,425 -−−−−−−−−−−−−−−−−−−−−−−−−−−−−−−−−−−−−−−−−−−−−−−−−−−−−−−−−−−−−−−−−−−−−−−−−−−−−−−−−−−−−−−−−−−−−−−−−−−−−−−−−−−−−−−−−−−−−−−−−−−−−−−−−−−−−−−−−−−−−−−−−−−−−−−−−−−−−−−−−−−−−−−−−−−−−−−−−−−−−−−−−−−−−−−−−−−−−−−−−−−−−−−−−−−−−−−−−−−−−−−−−−−−−−−−−−−−−−−−−−−−−−−−−−−−−−−−−−−−−−−−−−−−−−−−−−−−−−−−−−−−−−−−−−−−−−−−−−−−−−−−−−−−−−−−−−−−−−−−−−−−−−−−−−−−−−−−−−−−−−−−−−−−−−−−−−−−−−−−−−−−−−−−−−−−−−−−−−−−−−−−−−−−−−−−−−−−−−−−−−−−−−−−−−−−−−−−−−−−−−−−−−−−−−−−−−−−−−−−−−−−−−−−−−−−−−−−−−−−−−−−−−−−−−−−−−−−−−−−−−−−−−−−−−−−−−−−−−−−−−−−
Fullerton Lux Funds - Global Emerging Market Equities
Net asset value−−−−−−−−−−−−−−−−−−−−−−−−−−−−−−−−−−−−−−−−−−−−−−−−−−−−−−−−−−−−−−−−−−−−−−−−−−−−−−−−−−−−−−−−−−−−−−−−−−−−−−−−−−−−−−−−−−−−−−−−−−−−−−−−−−−−−−−−−−−−−−−−−−−−−−−−−−−−−−−−−−−−−−−−−−−−−−−−−−−−−−−−−−−−−−−−−−−−−−−−−−−−−−−−−−−−−−−−−−−−−−−−−−−−−−−−−−−−−−−−−−−−−−−−−−−−−−−−−−−−−−−−−−−−−−−−−−−−−−−−−−−−−−−−−−−−−−−−−−−−−−−−−−−−−−−−−−−−−−−−−−−−−−−−−−−−−−−−−−−−−−−−−−−−−−−−−−−−−−−−−−−−−−−−−−−−−−−−−−−−−−−−−−−−−−−−−−−−−−−−−−−−−−−−−−−−−−−−−−−−−−−−−−−−−−−−−−−−−−−−−−−−−−−−−−−−−−−−−−−−−−−−−−−−−−−−−−−−−−−−−−−−−−−−−−−−−−−−−−−−−−−
110,978,142.78 56,782,223.45 19,039,219.46USD
Net asset value per share
Class A (USD) Accumulation 10.854 8.883 7.504USDClass I (USD) Accumulation 11.072 9.013 7.573USD−−−−−−−−−−−−−−−−−−−−−−−−−−−−−−−−−−−−−−−−−−−−−−−−−−−−−−−−−−−−−−−−−−−−−−−−−−−−−−−−−−−−−−−−−−−−−−−−−−−−−−−−−−−−−−−−−−−−−−−−−−−−−−−−−−−−−−−−−−−−−−−−−−−−−−−−−−−−−−−−−−−−−−−−−−−−−−−−−−−−−−−−−−−−−−−−−−−−−−−−−−−−−−−−−−−−−−−−−−−−−−−−−−−−−−−−−−−−−−−−−−−−−−−−−−−−−−−−−−−−−−−−−−−−−−−−−−−−−−−−−−−−−−−−−−−−−−−−−−−−−−−−−−−−−−−−−−−−−−−−−−−−−−−−−−−−−−−−−−−−−−−−−−−−−−−−−−−−−−−−−−−−−−−−−−−−−−−−−−−−−−−−−−−−−−−−−−−−−−−−−−−−−−−−−−−−−−−−−−−−−−−−−−−−−−−−−−−−−−−−−−−−−−−−−−−−−−−−−−−−−−−−−−−−−−−−−−−−−−−−−−−−−−−−−−−−−−−−−−−−−−−
Number of shares
Class A (USD) Accumulation 500,000 500,000 500,000Class I (USD) Accumulation 9,533,009 5,807,173 2,018,641−−−−−−−−−−−−−−−−−−−−−−−−−−−−−−−−−−−−−−−−−−−−−−−−−−−−−−−−−−−−−−−−−−−−−−−−−−−−−−−−−−−−−−−−−−−−−−−−−−−−−−−−−−−−−−−−−−−−−−−−−−−−−−−−−−−−−−−−−−−−−−−−−−−−−−−−−−−−−−−−−−−−−−−−−−−−−−−−−−−−−−−−−−−−−−−−−−−−−−−−−−−−−−−−−−−−−−−−−−−−−−−−−−−−−−−−−−−−−−−−−−−−−−−−−−−−−−−−−−−−−−−−−−−−−−−−−−−−−−−−−−−−−−−−−−−−−−−−−−−−−−−−−−−−−−−−−−−−−−−−−−−−−−−−−−−−−−−−−−−−−−−−−−−−−−−−−−−−−−−−−−−−−−−−−−−−−−−−−−−−−−−−−−−−−−−−−−−−−−−−−−−−−−−−−−−−−−−−−−−−−−−−−−−−−−−−−−−−−−−−−−−−−−−−−−−−−−−−−−−−−−−−−−−−−−−−−−−−−−−−−−−−−−−−−−−−−−−−−−−−−−−
March 31, 2016March 31, 2018 March 31, 2017

FULLERTON LUX FUNDS
21
The accompanying notes are an integral part of these financial statements.
Statistics
Fullerton Lux Funds - Asian Currency Bonds
Net asset value−−−−−−−−−−−−−−−−−−−−−−−−−−−−−−−−−−−−−−−−−−−−−−−−−−−−−−−−−−−−−−−−−−−−−−−−−−−−−−−−−−−−−−−−−−−−−−−−−−−−−−−−−−−−−−−−−−−−−−−−−−−−−−−−−−−−−−−−−−−−−−−−−−−−−−−−−−−−−−−−−−−−−−−−−−−−−−−−−−−−−−−−−−−−−−−−−−−−−−−−−−−−−−−−−−−−−−−−−−−−−−−−−−−−−−−−−−−−−−−−−−−−−−−−−−−−−−−−−−−−−−−−−−−−−−−−−−−−−−−−−−−−−−−−−−−−−−−−−−−−−−−−−−−−−−−−−−−−−−−−−−−−−−−−−−−−−−−−−−−−−−−−−−−−−−−−−−−−−−−−−−−−−−−−−−−−−−−−−−−−−−−−−−−−−−−−−−−−−−−−−−−−−−−−−−−−−−−−−−−−−−−−−−−−−−−−−−−−−−−−−−−−−−−−−−−−−−−−−−−−−−−−−−−−−−−−−−−−−−−−−−−−−−−−−−−−−−−−−−−−−−−
119,458,157.01 111,849,246.26 103,569,497.98USD
Net asset value per share
Class A (SGD) Distribution 9.705 10.104 10.051SGDClass A (USD) Distribution 10.524 10.269 10.336USDClass I (EUR) Accumulation 13.638 14.699 13.636EURClass I (USD) Accumulation 12.134 11.337 11.201USD−−−−−−−−−−−−−−−−−−−−−−−−−−−−−−−−−−−−−−−−−−−−−−−−−−−−−−−−−−−−−−−−−−−−−−−−−−−−−−−−−−−−−−−−−−−−−−−−−−−−−−−−−−−−−−−−−−−−−−−−−−−−−−−−−−−−−−−−−−−−−−−−−−−−−−−−−−−−−−−−−−−−−−−−−−−−−−−−−−−−−−−−−−−−−−−−−−−−−−−−−−−−−−−−−−−−−−−−−−−−−−−−−−−−−−−−−−−−−−−−−−−−−−−−−−−−−−−−−−−−−−−−−−−−−−−−−−−−−−−−−−−−−−−−−−−−−−−−−−−−−−−−−−−−−−−−−−−−−−−−−−−−−−−−−−−−−−−−−−−−−−−−−−−−−−−−−−−−−−−−−−−−−−−−−−−−−−−−−−−−−−−−−−−−−−−−−−−−−−−−−−−−−−−−−−−−−−−−−−−−−−−−−−−−−−−−−−−−−−−−−−−−−−−−−−−−−−−−−−−−−−−−−−−−−−−−−−−−−−−−−−−−−−−−−−−−−−−−−−−−−−−
Number of shares
Class A (SGD) Distribution 9,262 11,219 6,153Class A (USD) Distribution 176,450 186,332 100,000Class I (EUR) Accumulation 2,642,482 2,642,482 2,642,482Class I (USD) Accumulation 6,029,418 6,033,080 5,493,291−−−−−−−−−−−−−−−−−−−−−−−−−−−−−−−−−−−−−−−−−−−−−−−−−−−−−−−−−−−−−−−−−−−−−−−−−−−−−−−−−−−−−−−−−−−−−−−−−−−−−−−−−−−−−−−−−−−−−−−−−−−−−−−−−−−−−−−−−−−−−−−−−−−−−−−−−−−−−−−−−−−−−−−−−−−−−−−−−−−−−−−−−−−−−−−−−−−−−−−−−−−−−−−−−−−−−−−−−−−−−−−−−−−−−−−−−−−−−−−−−−−−−−−−−−−−−−−−−−−−−−−−−−−−−−−−−−−−−−−−−−−−−−−−−−−−−−−−−−−−−−−−−−−−−−−−−−−−−−−−−−−−−−−−−−−−−−−−−−−−−−−−−−−−−−−−−−−−−−−−−−−−−−−−−−−−−−−−−−−−−−−−−−−−−−−−−−−−−−−−−−−−−−−−−−−−−−−−−−−−−−−−−−−−−−−−−−−−−−−−−−−−−−−−−−−−−−−−−−−−−−−−−−−−−−−−−−−−−−−−−−−−−−−−−−−−−−−−−−−−−−−
Fullerton Lux Funds - Asian High Yield Bonds
Net asset value−−−−−−−−−−−−−−−−−−−−−−−−−−−−−−−−−−−−−−−−−−−−−−−−−−−−−−−−−−−−−−−−−−−−−−−−−−−−−−−−−−−−−−−−−−−−−−−−−−−−−−−−−−−−−−−−−−−−−−−−−−−−−−−−−−−−−−−−−−−−−−−−−−−−−−−−−−−−−−−−−−−−−−−−−−−−−−−−−−−−−−−−−−−−−−−−−−−−−−−−−−−−−−−−−−−−−−−−−−−−−−−−−−−−−−−−−−−−−−−−−−−−−−−−−−−−−−−−−−−−−−−−−−−−−−−−−−−−−−−−−−−−−−−−−−−−−−−−−−−−−−−−−−−−−−−−−−−−−−−−−−−−−−−−−−−−−−−−−−−−−−−−−−−−−−−−−−−−−−−−−−−−−−−−−−−−−−−−−−−−−−−−−−−−−−−−−−−−−−−−−−−−−−−−−−−−−−−−−−−−−−−−−−−−−−−−−−−−−−−−−−−−−−−−−−−−−−−−−−−−−−−−−−−−−−−−−−−−−−−−−−−−−−−−−−−−−−−−−−−−−−−
59,882,850.17 60,695,573.07 31,271,807.69USD
Net asset value per share
Class A (SGD) Hedged Distribution 10.258 10.622 10.099SGDClass A (USD) Distribution 10.167 10.493 9.990USD−−−−−−−−−−−−−−−−−−−−−−−−−−−−−−−−−−−−−−−−−−−−−−−−−−−−−−−−−−−−−−−−−−−−−−−−−−−−−−−−−−−−−−−−−−−−−−−−−−−−−−−−−−−−−−−−−−−−−−−−−−−−−−−−−−−−−−−−−−−−−−−−−−−−−−−−−−−−−−−−−−−−−−−−−−−−−−−−−−−−−−−−−−−−−−−−−−−−−−−−−−−−−−−−−−−−−−−−−−−−−−−−−−−−−−−−−−−−−−−−−−−−−−−−−−−−−−−−−−−−−−−−−−−−−−−−−−−−−−−−−−−−−−−−−−−−−−−−−−−−−−−−−−−−−−−−−−−−−−−−−−−−−−−−−−−−−−−−−−−−−−−−−−−−−−−−−−−−−−−−−−−−−−−−−−−−−−−−−−−−−−−−−−−−−−−−−−−−−−−−−−−−−−−−−−−−−−−−−−−−−−−−−−−−−−−−−−−−−−−−−−−−−−−−−−−−−−−−−−−−−−−−−−−−−−−−−−−−−−−−−−−−−−−−−−−−−−−−−−−−−−−
Number of shares
Class A (SGD) Hedged Distribution 1,230,586 1,524,661 844,434Class A (USD) Distribution 4,943,380 4,680,014 2,496,424−−−−−−−−−−−−−−−−−−−−−−−−−−−−−−−−−−−−−−−−−−−−−−−−−−−−−−−−−−−−−−−−−−−−−−−−−−−−−−−−−−−−−−−−−−−−−−−−−−−−−−−−−−−−−−−−−−−−−−−−−−−−−−−−−−−−−−−−−−−−−−−−−−−−−−−−−−−−−−−−−−−−−−−−−−−−−−−−−−−−−−−−−−−−−−−−−−−−−−−−−−−−−−−−−−−−−−−−−−−−−−−−−−−−−−−−−−−−−−−−−−−−−−−−−−−−−−−−−−−−−−−−−−−−−−−−−−−−−−−−−−−−−−−−−−−−−−−−−−−−−−−−−−−−−−−−−−−−−−−−−−−−−−−−−−−−−−−−−−−−−−−−−−−−−−−−−−−−−−−−−−−−−−−−−−−−−−−−−−−−−−−−−−−−−−−−−−−−−−−−−−−−−−−−−−−−−−−−−−−−−−−−−−−−−−−−−−−−−−−−−−−−−−−−−−−−−−−−−−−−−−−−−−−−−−−−−−−−−−−−−−−−−−−−−−−−−−−−−−−−−−−
Fullerton Lux Funds - Asian Bonds
Net asset value−−−−−−−−−−−−−−−−−−−−−−−−−−−−−−−−−−−−−−−−−−−−−−−−−−−−−−−−−−−−−−−−−−−−−−−−−−−−−−−−−−−−−−−−−−−−−−−−−−−−−−−−−−−−−−−−−−−−−−−−−−−−−−−−−−−−−−−−−−−−−−−−−−−−−−−−−−−−−−−−−−−−−−−−−−−−−−−−−−−−−−−−−−−−−−−−−−−−−−−−−−−−−−−−−−−−−−−−−−−−−−−−−−−−−−−−−−−−−−−−−−−−−−−−−−−−−−−−−−−−−−−−−−−−−−−−−−−−−−−−−−−−−−−−−−−−−−−−−−−−−−−−−−−−−−−−−−−−−−−−−−−−−−−−−−−−−−−−−−−−−−−−−−−−−−−−−−−−−−−−−−−−−−−−−−−−−−−−−−−−−−−−−−−−−−−−−−−−−−−−−−−−−−−−−−−−−−−−−−−−−−−−−−−−−−−−−−−−−−−−−−−−−−−−−−−−−−−−−−−−−−−−−−−−−−−−−−−−−−−−−−−−−−−−−−−−−−−−−−−−−−−
231,013,881.00 204,095,192.27 214,855,607.33USD
Net asset value per share
Class A (EUR) Hedged Accumulation 10.524 10.555 10.214EURClass A (SGD) Hedged Distribution 9.931 10.197 10.138SGDClass I (SGD) Hedged Accumulation 9.845 - -SGDClass A (USD) Accumulation 12.055 11.849 11.307USDClass A (USD) Distribution 10.014 10.235 10.177USDClass I (USD) Accumulation 12.324 12.060 11.458USDClass I (USD) Distribution 11.035 11.230 11.102USDClass R (SGD) Accumulation - 10.086 -SGD−−−−−−−−−−−−−−−−−−−−−−−−−−−−−−−−−−−−−−−−−−−−−−−−−−−−−−−−−−−−−−−−−−−−−−−−−−−−−−−−−−−−−−−−−−−−−−−−−−−−−−−−−−−−−−−−−−−−−−−−−−−−−−−−−−−−−−−−−−−−−−−−−−−−−−−−−−−−−−−−−−−−−−−−−−−−−−−−−−−−−−−−−−−−−−−−−−−−−−−−−−−−−−−−−−−−−−−−−−−−−−−−−−−−−−−−−−−−−−−−−−−−−−−−−−−−−−−−−−−−−−−−−−−−−−−−−−−−−−−−−−−−−−−−−−−−−−−−−−−−−−−−−−−−−−−−−−−−−−−−−−−−−−−−−−−−−−−−−−−−−−−−−−−−−−−−−−−−−−−−−−−−−−−−−−−−−−−−−−−−−−−−−−−−−−−−−−−−−−−−−−−−−−−−−−−−−−−−−−−−−−−−−−−−−−−−−−−−−−−−−−−−−−−−−−−−−−−−−−−−−−−−−−−−−−−−−−−−−−−−−−−−−−−−−−−−−−−−−−−−−−−
Number of shares
Class A (EUR) Hedged Accumulation 175,066 143,616 43,600Class A (SGD) Hedged Distribution 1,549,080 1,362,210 775,483Class I (SGD) Hedged Accumulation 3,702,552 - -Class A (USD) Accumulation 2,494,513 2,793,157 3,369,464Class A (USD) Distribution 2,925,424 3,718,437 6,573,366Class I (USD) Accumulation 4,406,354 2,322,368 2,436,608Class I (USD) Distribution 6,847,443 8,290,563 6,809,558Class R (SGD) Accumulation - 38,145 -−−−−−−−−−−−−−−−−−−−−−−−−−−−−−−−−−−−−−−−−−−−−−−−−−−−−−−−−−−−−−−−−−−−−−−−−−−−−−−−−−−−−−−−−−−−−−−−−−−−−−−−−−−−−−−−−−−−−−−−−−−−−−−−−−−−−−−−−−−−−−−−−−−−−−−−−−−−−−−−−−−−−−−−−−−−−−−−−−−−−−−−−−−−−−−−−−−−−−−−−−−−−−−−−−−−−−−−−−−−−−−−−−−−−−−−−−−−−−−−−−−−−−−−−−−−−−−−−−−−−−−−−−−−−−−−−−−−−−−−−−−−−−−−−−−−−−−−−−−−−−−−−−−−−−−−−−−−−−−−−−−−−−−−−−−−−−−−−−−−−−−−−−−−−−−−−−−−−−−−−−−−−−−−−−−−−−−−−−−−−−−−−−−−−−−−−−−−−−−−−−−−−−−−−−−−−−−−−−−−−−−−−−−−−−−−−−−−−−−−−−−−−−−−−−−−−−−−−−−−−−−−−−−−−−−−−−−−−−−−−−−−−−−−−−−−−−−−−−−−−−−−
Fullerton Lux Funds - RMB Bonds
Net asset value−−−−−−−−−−−−−−−−−−−−−−−−−−−−−−−−−−−−−−−−−−−−−−−−−−−−−−−−−−−−−−−−−−−−−−−−−−−−−−−−−−−−−−−−−−−−−−−−−−−−−−−−−−−−−−−−−−−−−−−−−−−−−−−−−−−−−−−−−−−−−−−−−−−−−−−−−−−−−−−−−−−−−−−−−−−−−−−−−−−−−−−−−−−−−−−−−−−−−−−−−−−−−−−−−−−−−−−−−−−−−−−−−−−−−−−−−−−−−−−−−−−−−−−−−−−−−−−−−−−−−−−−−−−−−−−−−−−−−−−−−−−−−−−−−−−−−−−−−−−−−−−−−−−−−−−−−−−−−−−−−−−−−−−−−−−−−−−−−−−−−−−−−−−−−−−−−−−−−−−−−−−−−−−−−−−−−−−−−−−−−−−−−−−−−−−−−−−−−−−−−−−−−−−−−−−−−−−−−−−−−−−−−−−−−−−−−−−−−−−−−−−−−−−−−−−−−−−−−−−−−−−−−−−−−−−−−−−−−−−−−−−−−−−−−−−−−−−−−−−−−−−
68,762,572.93 70,291,740.90 144,961,904.42USD
March 31, 2016March 31, 2018 March 31, 2017
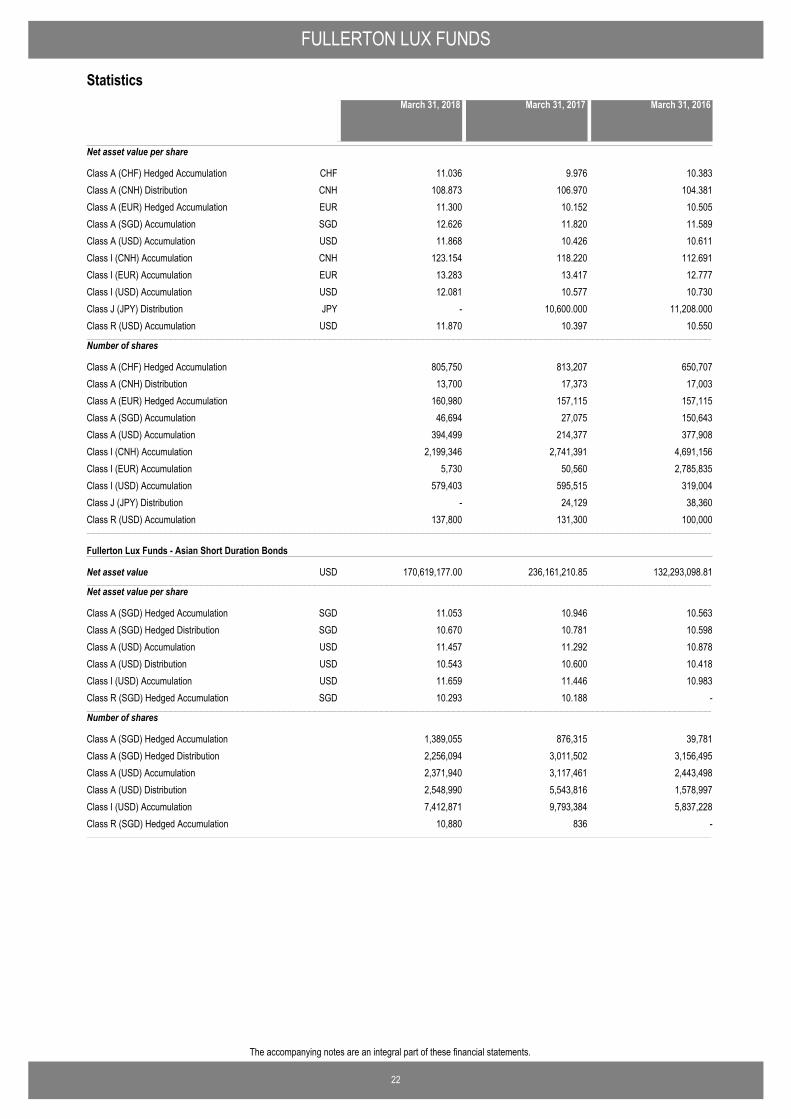
FULLERTON LUX FUNDS
22
The accompanying notes are an integral part of these financial statements.
Statistics
Net asset value per share
Class A (CHF) Hedged Accumulation 11.036 9.976 10.383CHFClass A (CNH) Distribution 108.873 106.970 104.381CNHClass A (EUR) Hedged Accumulation 11.300 10.152 10.505EURClass A (SGD) Accumulation 12.626 11.820 11.589SGDClass A (USD) Accumulation 11.868 10.426 10.611USDClass I (CNH) Accumulation 123.154 118.220 112.691CNHClass I (EUR) Accumulation 13.283 13.417 12.777EURClass I (USD) Accumulation 12.081 10.577 10.730USDClass J (JPY) Distribution - 10,600.000 11,208.000JPYClass R (USD) Accumulation 11.870 10.397 10.550USD−−−−−−−−−−−−−−−−−−−−−−−−−−−−−−−−−−−−−−−−−−−−−−−−−−−−−−−−−−−−−−−−−−−−−−−−−−−−−−−−−−−−−−−−−−−−−−−−−−−−−−−−−−−−−−−−−−−−−−−−−−−−−−−−−−−−−−−−−−−−−−−−−−−−−−−−−−−−−−−−−−−−−−−−−−−−−−−−−−−−−−−−−−−−−−−−−−−−−−−−−−−−−−−−−−−−−−−−−−−−−−−−−−−−−−−−−−−−−−−−−−−−−−−−−−−−−−−−−−−−−−−−−−−−−−−−−−−−−−−−−−−−−−−−−−−−−−−−−−−−−−−−−−−−−−−−−−−−−−−−−−−−−−−−−−−−−−−−−−−−−−−−−−−−−−−−−−−−−−−−−−−−−−−−−−−−−−−−−−−−−−−−−−−−−−−−−−−−−−−−−−−−−−−−−−−−−−−−−−−−−−−−−−−−−−−−−−−−−−−−−−−−−−−−−−−−−−−−−−−−−−−−−−−−−−−−−−−−−−−−−−−−−−−−−−−−−−−−−−−−−−−
Number of shares
Class A (CHF) Hedged Accumulation 805,750 813,207 650,707Class A (CNH) Distribution 13,700 17,373 17,003Class A (EUR) Hedged Accumulation 160,980 157,115 157,115Class A (SGD) Accumulation 46,694 27,075 150,643Class A (USD) Accumulation 394,499 214,377 377,908Class I (CNH) Accumulation 2,199,346 2,741,391 4,691,156Class I (EUR) Accumulation 5,730 50,560 2,785,835Class I (USD) Accumulation 579,403 595,515 319,004Class J (JPY) Distribution - 24,129 38,360Class R (USD) Accumulation 137,800 131,300 100,000−−−−−−−−−−−−−−−−−−−−−−−−−−−−−−−−−−−−−−−−−−−−−−−−−−−−−−−−−−−−−−−−−−−−−−−−−−−−−−−−−−−−−−−−−−−−−−−−−−−−−−−−−−−−−−−−−−−−−−−−−−−−−−−−−−−−−−−−−−−−−−−−−−−−−−−−−−−−−−−−−−−−−−−−−−−−−−−−−−−−−−−−−−−−−−−−−−−−−−−−−−−−−−−−−−−−−−−−−−−−−−−−−−−−−−−−−−−−−−−−−−−−−−−−−−−−−−−−−−−−−−−−−−−−−−−−−−−−−−−−−−−−−−−−−−−−−−−−−−−−−−−−−−−−−−−−−−−−−−−−−−−−−−−−−−−−−−−−−−−−−−−−−−−−−−−−−−−−−−−−−−−−−−−−−−−−−−−−−−−−−−−−−−−−−−−−−−−−−−−−−−−−−−−−−−−−−−−−−−−−−−−−−−−−−−−−−−−−−−−−−−−−−−−−−−−−−−−−−−−−−−−−−−−−−−−−−−−−−−−−−−−−−−−−−−−−−−−−−−−−−−−
Fullerton Lux Funds - Asian Short Duration Bonds
Net asset value−−−−−−−−−−−−−−−−−−−−−−−−−−−−−−−−−−−−−−−−−−−−−−−−−−−−−−−−−−−−−−−−−−−−−−−−−−−−−−−−−−−−−−−−−−−−−−−−−−−−−−−−−−−−−−−−−−−−−−−−−−−−−−−−−−−−−−−−−−−−−−−−−−−−−−−−−−−−−−−−−−−−−−−−−−−−−−−−−−−−−−−−−−−−−−−−−−−−−−−−−−−−−−−−−−−−−−−−−−−−−−−−−−−−−−−−−−−−−−−−−−−−−−−−−−−−−−−−−−−−−−−−−−−−−−−−−−−−−−−−−−−−−−−−−−−−−−−−−−−−−−−−−−−−−−−−−−−−−−−−−−−−−−−−−−−−−−−−−−−−−−−−−−−−−−−−−−−−−−−−−−−−−−−−−−−−−−−−−−−−−−−−−−−−−−−−−−−−−−−−−−−−−−−−−−−−−−−−−−−−−−−−−−−−−−−−−−−−−−−−−−−−−−−−−−−−−−−−−−−−−−−−−−−−−−−−−−−−−−−−−−−−−−−−−−−−−−−−−−−−−−−
170,619,177.00 236,161,210.85 132,293,098.81USD
Net asset value per share
Class A (SGD) Hedged Accumulation 11.053 10.946 10.563SGDClass A (SGD) Hedged Distribution 10.670 10.781 10.598SGDClass A (USD) Accumulation 11.457 11.292 10.878USDClass A (USD) Distribution 10.543 10.600 10.418USDClass I (USD) Accumulation 11.659 11.446 10.983USDClass R (SGD) Hedged Accumulation 10.293 10.188 -SGD−−−−−−−−−−−−−−−−−−−−−−−−−−−−−−−−−−−−−−−−−−−−−−−−−−−−−−−−−−−−−−−−−−−−−−−−−−−−−−−−−−−−−−−−−−−−−−−−−−−−−−−−−−−−−−−−−−−−−−−−−−−−−−−−−−−−−−−−−−−−−−−−−−−−−−−−−−−−−−−−−−−−−−−−−−−−−−−−−−−−−−−−−−−−−−−−−−−−−−−−−−−−−−−−−−−−−−−−−−−−−−−−−−−−−−−−−−−−−−−−−−−−−−−−−−−−−−−−−−−−−−−−−−−−−−−−−−−−−−−−−−−−−−−−−−−−−−−−−−−−−−−−−−−−−−−−−−−−−−−−−−−−−−−−−−−−−−−−−−−−−−−−−−−−−−−−−−−−−−−−−−−−−−−−−−−−−−−−−−−−−−−−−−−−−−−−−−−−−−−−−−−−−−−−−−−−−−−−−−−−−−−−−−−−−−−−−−−−−−−−−−−−−−−−−−−−−−−−−−−−−−−−−−−−−−−−−−−−−−−−−−−−−−−−−−−−−−−−−−−−−−−
Number of shares
Class A (SGD) Hedged Accumulation 1,389,055 876,315 39,781Class A (SGD) Hedged Distribution 2,256,094 3,011,502 3,156,495Class A (USD) Accumulation 2,371,940 3,117,461 2,443,498Class A (USD) Distribution 2,548,990 5,543,816 1,578,997Class I (USD) Accumulation 7,412,871 9,793,384 5,837,228Class R (SGD) Hedged Accumulation 10,880 836 -−−−−−−−−−−−−−−−−−−−−−−−−−−−−−−−−−−−−−−−−−−−−−−−−−−−−−−−−−−−−−−−−−−−−−−−−−−−−−−−−−−−−−−−−−−−−−−−−−−−−−−−−−−−−−−−−−−−−−−−−−−−−−−−−−−−−−−−−−−−−−−−−−−−−−−−−−−−−−−−−−−−−−−−−−−−−−−−−−−−−−−−−−−−−−−−−−−−−−−−−−−−−−−−−−−−−−−−−−−−−−−−−−−−−−−−−−−−−−−−−−−−−−−−−−−−−−−−−−−−−−−−−−−−−−−−−−−−−−−−−−−−−−−−−−−−−−−−−−−−−−−−−−−−−−−−−−−−−−−−−−−−−−−−−−−−−−−−−−−−−−−−−−−−−−−−−−−−−−−−−−−−−−−−−−−−−−−−−−−−−−−−−−−−−−−−−−−−−−−−−−−−−−−−−−−−−−−−−−−−−−−−−−−−−−−−−−−−−−−−−−−−−−−−−−−−−−−−−−−−−−−−−−−−−−−−−−−−−−−−−−−−−−−−−−−−−−−−−−−−−−−−
March 31, 2016March 31, 2018 March 31, 2017
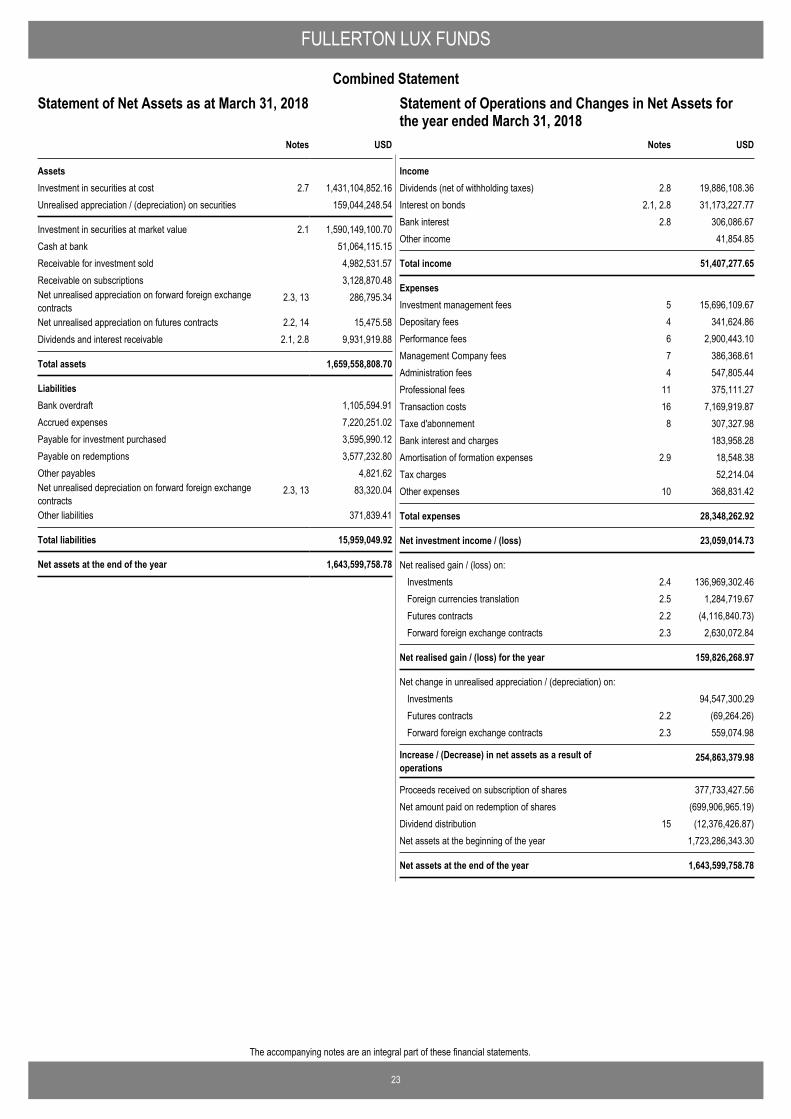
23
The accompanying notes are an integral part of these financial statements.
FULLERTON LUX FUNDS
Combined Statement
USD
AssetsInvestment in securities at cost 2.7 1,431,104,852.16Unrealised appreciation / (depreciation) on securities 159,044,248.54
Investment in securities at market value 2.1 1,590,149,100.70Cash at bank 51,064,115.15Receivable for investment sold 4,982,531.57Receivable on subscriptions 3,128,870.48Net unrealised appreciation on forward foreign exchangecontracts
2.3, 13 286,795.34
Net unrealised appreciation on futures contracts 2.2, 14 15,475.58Dividends and interest receivable 2.1, 2.8 9,931,919.88
Total assets 1,659,558,808.70
LiabilitiesBank overdraft 1,105,594.91Accrued expenses 7,220,251.02Payable for investment purchased 3,595,990.12Payable on redemptions 3,577,232.80Other payables 4,821.62Net unrealised depreciation on forward foreign exchangecontracts
2.3, 13 83,320.04
Other liabilities 371,839.41
Total liabilities 15,959,049.92
Net assets at the end of the year 1,643,599,758.78
Notes
Statement of Net Assets as at March 31, 2018
IncomeDividends (net of withholding taxes) 2.8 19,886,108.36Interest on bonds 2.1, 2.8 31,173,227.77Bank interest 2.8 306,086.67Other income 41,854.85
Total income 51,407,277.65
ExpensesInvestment management fees 5 15,696,109.67Depositary fees 4 341,624.86Performance fees 6 2,900,443.10Management Company fees 7 386,368.61Administration fees 4 547,805.44Professional fees 11 375,111.27Transaction costs 16 7,169,919.87Taxe d'abonnement 8 307,327.98Bank interest and charges 183,958.28Amortisation of formation expenses 2.9 18,548.38Tax charges 52,214.04Other expenses 10 368,831.42
Total expenses 28,348,262.92
Net investment income / (loss) 23,059,014.73
Net realised gain / (loss) on: Investments 2.4 136,969,302.46Foreign currencies translation 2.5 1,284,719.67Futures contracts 2.2 (4,116,840.73)Forward foreign exchange contracts 2.3 2,630,072.84
Net realised gain / (loss) for the year 159,826,268.97
Net change in unrealised appreciation / (depreciation) on: Investments 94,547,300.29Futures contracts 2.2 (69,264.26)Forward foreign exchange contracts 2.3 559,074.98
Increase / (Decrease) in net assets as a result ofoperations
254,863,379.98
Proceeds received on subscription of shares 377,733,427.56Net amount paid on redemption of shares (699,906,965.19)Dividend distribution 15 (12,376,426.87)Net assets at the beginning of the year 1,723,286,343.30
Net assets at the end of the year 1,643,599,758.78
USDNotes
Statement of Operations and Changes in Net Assets forthe year ended March 31, 2018
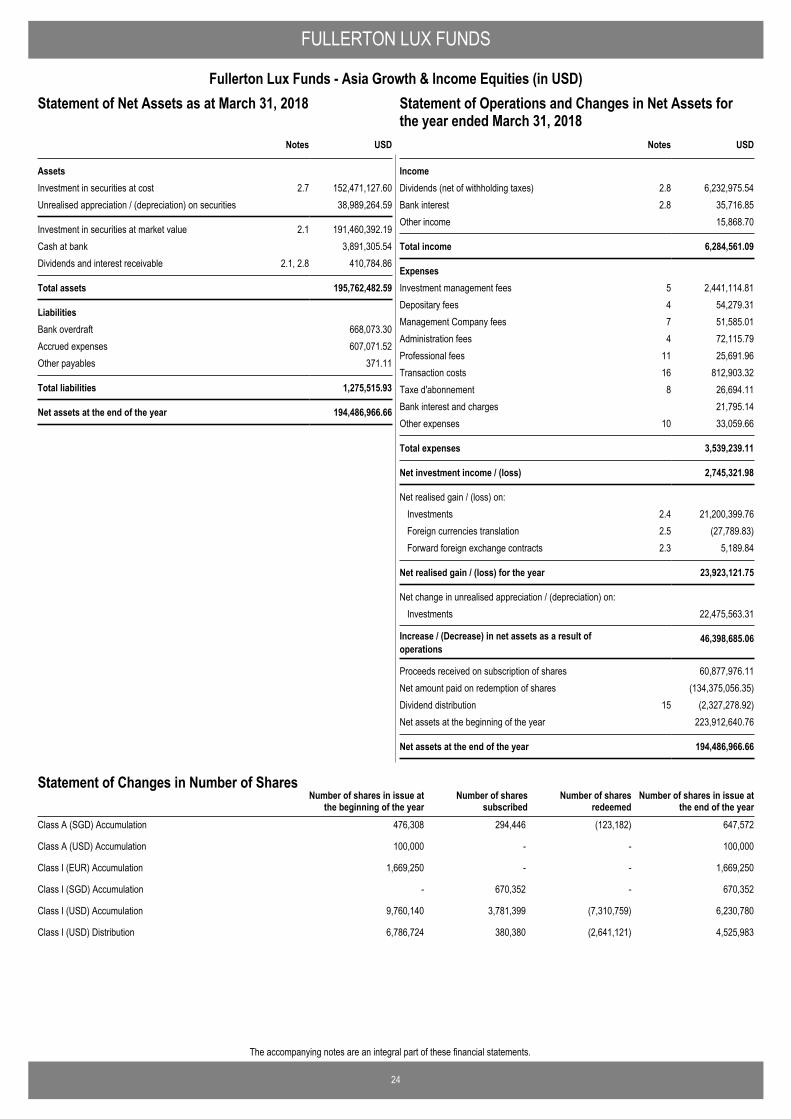
24
The accompanying notes are an integral part of these financial statements.
FULLERTON LUX FUNDS
Fullerton Lux Funds - Asia Growth & Income Equities (in USD)Statement of Operations and Changes in Net Assets for theyear ended March 31, 2018
USD
AssetsInvestment in securities at cost 2.7 152,471,127.60Unrealised appreciation / (depreciation) on securities 38,989,264.59
Investment in securities at market value 2.1 191,460,392.19Cash at bank 3,891,305.54Dividends and interest receivable 2.1, 2.8 410,784.86
Total assets 195,762,482.59
LiabilitiesBank overdraft 668,073.30Accrued expenses 607,071.52Other payables 371.11
Total liabilities 1,275,515.93
Net assets at the end of the year 194,486,966.66
Notes
Statement of Net Assets as at March 31, 2018
IncomeDividends (net of withholding taxes) 2.8 6,232,975.54Bank interest 2.8 35,716.85Other income 15,868.70
Total income 6,284,561.09
ExpensesInvestment management fees 5 2,441,114.81Depositary fees 4 54,279.31Management Company fees 7 51,585.01Administration fees 4 72,115.79Professional fees 11 25,691.96Transaction costs 16 812,903.32Taxe d'abonnement 8 26,694.11Bank interest and charges 21,795.14Other expenses 10 33,059.66
Total expenses 3,539,239.11
Net investment income / (loss) 2,745,321.98
Net realised gain / (loss) on: Investments 2.4 21,200,399.76Foreign currencies translation 2.5 (27,789.83)Forward foreign exchange contracts 2.3 5,189.84
Net realised gain / (loss) for the year 23,923,121.75
Net change in unrealised appreciation / (depreciation) on: Investments 22,475,563.31
Increase / (Decrease) in net assets as a result ofoperations
46,398,685.06
Proceeds received on subscription of shares 60,877,976.11Net amount paid on redemption of shares (134,375,056.35)Dividend distribution 15 (2,327,278.92)Net assets at the beginning of the year 223,912,640.76
Net assets at the end of the year 194,486,966.66
USDNotes
Statement of Operations and Changes in Net Assets forthe year ended March 31, 2018
Number of shares in issue atthe end of the year
Number of shares in issue atthe beginning of the year
Number of sharessubscribed
Number of sharesredeemed
Statement of Changes in Number of Shares
Class A (SGD) Accumulation 476,308 294,446 (123,182) 647,572
Class A (USD) Accumulation 100,000 - - 100,000
Class I (EUR) Accumulation 1,669,250 - - 1,669,250
Class I (SGD) Accumulation - 670,352 - 670,352
Class I (USD) Accumulation 9,760,140 3,781,399 (7,310,759) 6,230,780
Class I (USD) Distribution 6,786,724 380,380 (2,641,121) 4,525,983
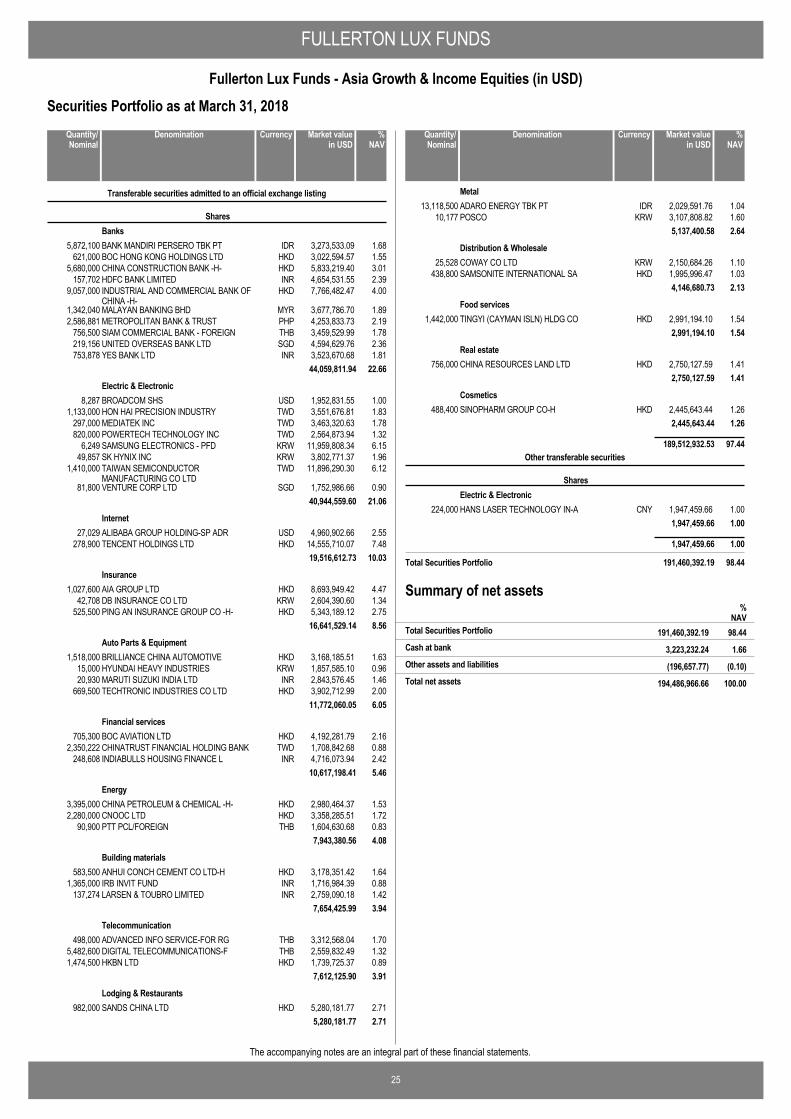
FULLERTON LUX FUNDS
25
Fullerton Lux Funds - Asia Growth & Income Equities (in USD)
The accompanying notes are an integral part of these financial statements.
Securities Portfolio as at March 31, 2018
BANK MANDIRI PERSERO TBK PT IDR 3,273,533.09 1.685,872,100
Transferable securities admitted to an official exchange listing
SharesBanks
BOC HONG KONG HOLDINGS LTD HKD 3,022,594.57 1.55621,000CHINA CONSTRUCTION BANK -H- HKD 5,833,219.40 3.015,680,000HDFC BANK LIMITED INR 4,654,531.55 2.39157,702INDUSTRIAL AND COMMERCIAL BANK OFCHINA -H-
HKD 7,766,482.47 4.009,057,000
MALAYAN BANKING BHD MYR 3,677,786.70 1.891,342,040METROPOLITAN BANK & TRUST PHP 4,253,833.73 2.192,586,881SIAM COMMERCIAL BANK - FOREIGN THB 3,459,529.99 1.78756,500UNITED OVERSEAS BANK LTD SGD 4,594,629.76 2.36219,156YES BANK LTD INR 3,523,670.68 1.81753,878
44,059,811.94 22.66
BROADCOM SHS USD 1,952,831.55 1.008,287Electric & Electronic
HON HAI PRECISION INDUSTRY TWD 3,551,676.81 1.831,133,000MEDIATEK INC TWD 3,463,320.63 1.78297,000POWERTECH TECHNOLOGY INC TWD 2,564,873.94 1.32820,000SAMSUNG ELECTRONICS - PFD KRW 11,959,808.34 6.156,249SK HYNIX INC KRW 3,802,771.37 1.9649,857TAIWAN SEMICONDUCTORMANUFACTURING CO LTD
TWD 11,896,290.30 6.121,410,000
VENTURE CORP LTD SGD 1,752,986.66 0.9081,80040,944,559.60 21.06
ALIBABA GROUP HOLDING-SP ADR USD 4,960,902.66 2.5527,029Internet
TENCENT HOLDINGS LTD HKD 14,555,710.07 7.48278,90019,516,612.73 10.03
AIA GROUP LTD HKD 8,693,949.42 4.471,027,600Insurance
DB INSURANCE CO LTD KRW 2,604,390.60 1.3442,708PING AN INSURANCE GROUP CO -H- HKD 5,343,189.12 2.75525,500
16,641,529.14 8.56
BRILLIANCE CHINA AUTOMOTIVE HKD 3,168,185.51 1.631,518,000Auto Parts & Equipment
HYUNDAI HEAVY INDUSTRIES KRW 1,857,585.10 0.9615,000MARUTI SUZUKI INDIA LTD INR 2,843,576.45 1.4620,930TECHTRONIC INDUSTRIES CO LTD HKD 3,902,712.99 2.00669,500
11,772,060.05 6.05
BOC AVIATION LTD HKD 4,192,281.79 2.16705,300Financial services
CHINATRUST FINANCIAL HOLDING BANK TWD 1,708,842.68 0.882,350,222INDIABULLS HOUSING FINANCE L INR 4,716,073.94 2.42248,608
10,617,198.41 5.46
CHINA PETROLEUM & CHEMICAL -H- HKD 2,980,464.37 1.533,395,000Energy
CNOOC LTD HKD 3,358,285.51 1.722,280,000PTT PCL/FOREIGN THB 1,604,630.68 0.8390,900
7,943,380.56 4.08
ANHUI CONCH CEMENT CO LTD-H HKD 3,178,351.42 1.64583,500Building materials
IRB INVIT FUND INR 1,716,984.39 0.881,365,000LARSEN & TOUBRO LIMITED INR 2,759,090.18 1.42137,274
7,654,425.99 3.94
ADVANCED INFO SERVICE-FOR RG THB 3,312,568.04 1.70498,000Telecommunication
DIGITAL TELECOMMUNICATIONS-F THB 2,559,832.49 1.325,482,600HKBN LTD HKD 1,739,725.37 0.891,474,500
7,612,125.90 3.91
SANDS CHINA LTD HKD 5,280,181.77 2.71982,000Lodging & Restaurants
5,280,181.77 2.71
DenominationQuantity/Nominal
Market valuein USD
Currency %NAV
ADARO ENERGY TBK PT IDR 2,029,591.76 1.0413,118,500Metal
POSCO KRW 3,107,808.82 1.6010,1775,137,400.58 2.64
COWAY CO LTD KRW 2,150,684.26 1.1025,528Distribution & Wholesale
SAMSONITE INTERNATIONAL SA HKD 1,995,996.47 1.03438,8004,146,680.73 2.13
TINGYI (CAYMAN ISLN) HLDG CO HKD 2,991,194.10 1.541,442,000Food services
2,991,194.10 1.54
CHINA RESOURCES LAND LTD HKD 2,750,127.59 1.41756,000Real estate
2,750,127.59 1.41
SINOPHARM GROUP CO-H HKD 2,445,643.44 1.26488,400Cosmetics
2,445,643.44 1.26
189,512,932.53 97.44
HANS LASER TECHNOLOGY IN-A CNY 1,947,459.66 1.00224,000
Other transferable securities
SharesElectric & Electronic
1,947,459.66 1.00
1,947,459.66 1.00
Total Securities Portfolio 191,460,392.19 98.44
DenominationQuantity/Nominal
Market valuein USD
Currency %NAV
Summary of net assets%
NAV191,460,392.19 98.44Total Securities Portfolio
3,223,232.24 1.66Cash at bank
(196,657.77) (0.10)Other assets and liabilities
194,486,966.66 100.00Total net assets
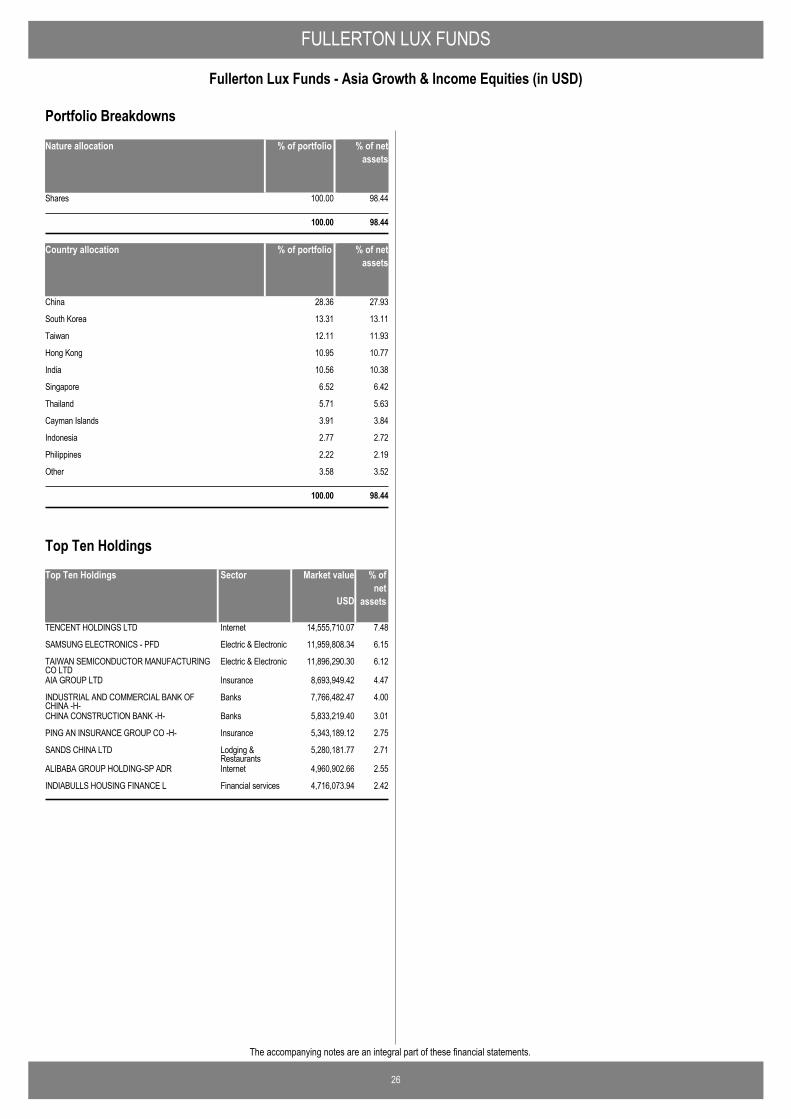
FULLERTON LUX FUNDS
26
Fullerton Lux Funds - Asia Growth & Income Equities (in USD)
The accompanying notes are an integral part of these financial statements.
Nature allocation % of portfolio % of netassets
Shares 100.00 98.44
100.00 98.44
Country allocation % of portfolio % of netassets
China 28.36 27.93
South Korea 13.31 13.11
Taiwan 12.11 11.93
Hong Kong 10.95 10.77
India 10.56 10.38
Singapore 6.52 6.42
Thailand 5.71 5.63
Cayman Islands 3.91 3.84
Indonesia 2.77 2.72
Philippines 2.22 2.19
Other 3.58 3.52
100.00 98.44
Portfolio Breakdowns
Top Ten Holdings Market value % ofnet
assets
TENCENT HOLDINGS LTD 14,555,710.07 7.48Internet
SAMSUNG ELECTRONICS - PFD 11,959,808.34 6.15Electric & Electronic
TAIWAN SEMICONDUCTOR MANUFACTURINGCO LTD
11,896,290.30 6.12Electric & Electronic
AIA GROUP LTD 8,693,949.42 4.47Insurance
INDUSTRIAL AND COMMERCIAL BANK OFCHINA -H-
7,766,482.47 4.00Banks
CHINA CONSTRUCTION BANK -H- 5,833,219.40 3.01Banks
PING AN INSURANCE GROUP CO -H- 5,343,189.12 2.75Insurance
SANDS CHINA LTD 5,280,181.77 2.71Lodging &Restaurants
ALIBABA GROUP HOLDING-SP ADR 4,960,902.66 2.55Internet
INDIABULLS HOUSING FINANCE L 4,716,073.94 2.42Financial services
USD
Sector
Top Ten Holdings
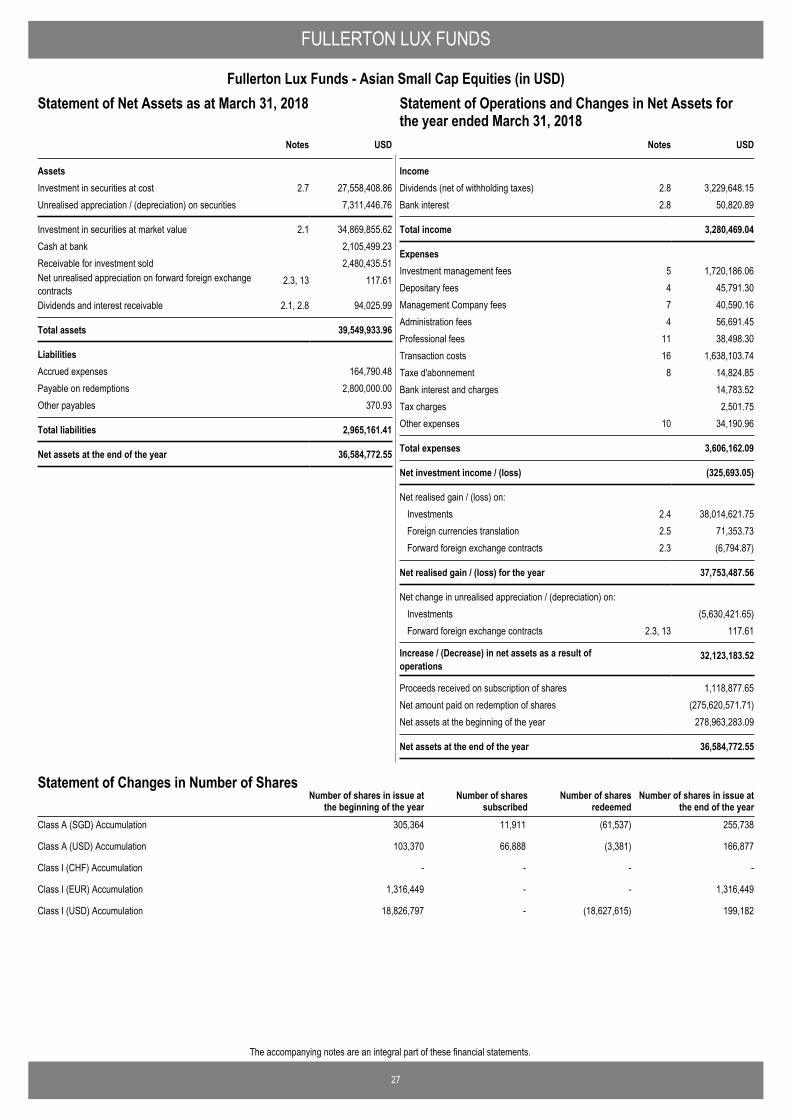
27
The accompanying notes are an integral part of these financial statements.
FULLERTON LUX FUNDS
Fullerton Lux Funds - Asian Small Cap Equities (in USD)Statement of Operations and Changes in Net Assets for theyear ended March 31, 2018
USD
AssetsInvestment in securities at cost 2.7 27,558,408.86Unrealised appreciation / (depreciation) on securities 7,311,446.76
Investment in securities at market value 2.1 34,869,855.62Cash at bank 2,105,499.23Receivable for investment sold 2,480,435.51Net unrealised appreciation on forward foreign exchangecontracts
2.3, 13 117.61
Dividends and interest receivable 2.1, 2.8 94,025.99
Total assets 39,549,933.96
LiabilitiesAccrued expenses 164,790.48Payable on redemptions 2,800,000.00Other payables 370.93
Total liabilities 2,965,161.41
Net assets at the end of the year 36,584,772.55
Notes
Statement of Net Assets as at March 31, 2018
IncomeDividends (net of withholding taxes) 2.8 3,229,648.15Bank interest 2.8 50,820.89
Total income 3,280,469.04
ExpensesInvestment management fees 5 1,720,186.06Depositary fees 4 45,791.30Management Company fees 7 40,590.16Administration fees 4 56,691.45Professional fees 11 38,498.30Transaction costs 16 1,638,103.74Taxe d'abonnement 8 14,824.85Bank interest and charges 14,783.52Tax charges 2,501.75Other expenses 10 34,190.96
Total expenses 3,606,162.09
Net investment income / (loss) (325,693.05)
Net realised gain / (loss) on: Investments 2.4 38,014,621.75Foreign currencies translation 2.5 71,353.73Forward foreign exchange contracts 2.3 (6,794.87)
Net realised gain / (loss) for the year 37,753,487.56
Net change in unrealised appreciation / (depreciation) on: Investments (5,630,421.65)Forward foreign exchange contracts 2.3, 13 117.61
Increase / (Decrease) in net assets as a result ofoperations
32,123,183.52
Proceeds received on subscription of shares 1,118,877.65Net amount paid on redemption of shares (275,620,571.71)Net assets at the beginning of the year 278,963,283.09
Net assets at the end of the year 36,584,772.55
USDNotes
Statement of Operations and Changes in Net Assets forthe year ended March 31, 2018
Number of shares in issue atthe end of the year
Number of shares in issue atthe beginning of the year
Number of sharessubscribed
Number of sharesredeemed
Statement of Changes in Number of Shares
Class A (SGD) Accumulation 305,364 11,911 (61,537) 255,738
Class A (USD) Accumulation 103,370 66,888 (3,381) 166,877
Class I (CHF) Accumulation - - - -
Class I (EUR) Accumulation 1,316,449 - - 1,316,449
Class I (USD) Accumulation 18,826,797 - (18,627,615) 199,182
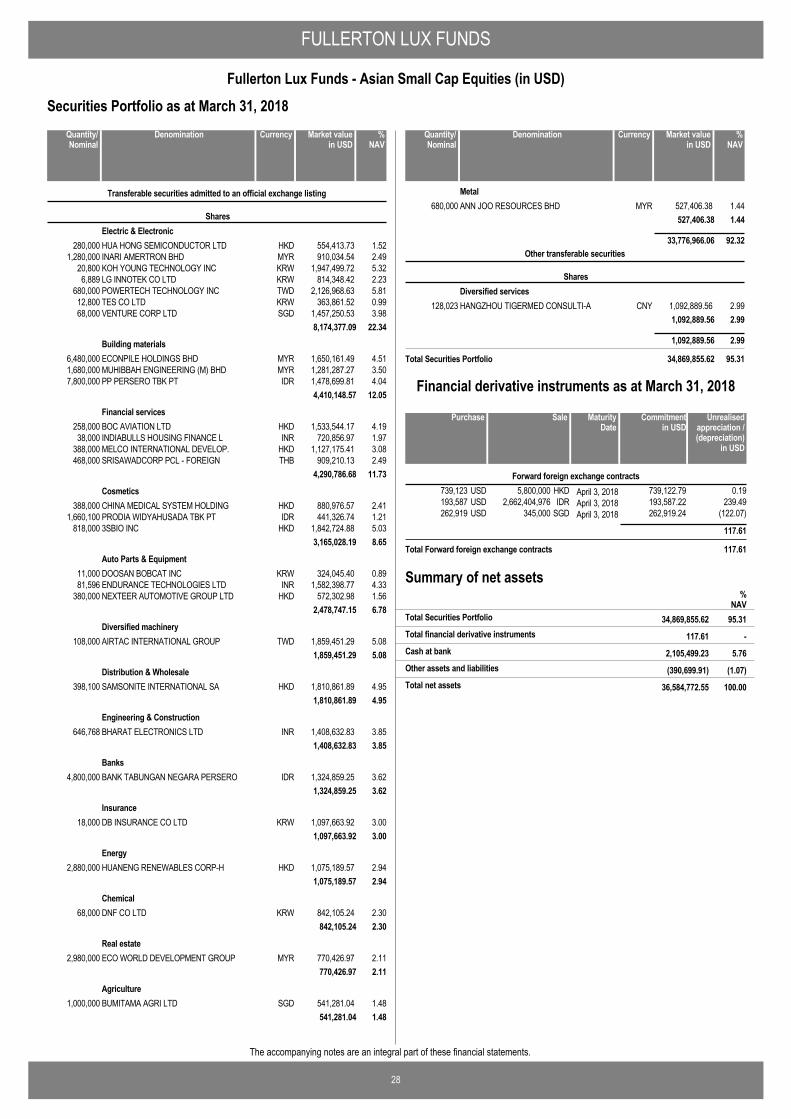
FULLERTON LUX FUNDS
28
Fullerton Lux Funds - Asian Small Cap Equities (in USD)
The accompanying notes are an integral part of these financial statements.
Securities Portfolio as at March 31, 2018
HUA HONG SEMICONDUCTOR LTD HKD 554,413.73 1.52280,000
Transferable securities admitted to an official exchange listing
SharesElectric & Electronic
INARI AMERTRON BHD MYR 910,034.54 2.491,280,000KOH YOUNG TECHNOLOGY INC KRW 1,947,499.72 5.3220,800LG INNOTEK CO LTD KRW 814,348.42 2.236,889POWERTECH TECHNOLOGY INC TWD 2,126,968.63 5.81680,000TES CO LTD KRW 363,861.52 0.9912,800VENTURE CORP LTD SGD 1,457,250.53 3.9868,000
8,174,377.09 22.34
ECONPILE HOLDINGS BHD MYR 1,650,161.49 4.516,480,000Building materials
MUHIBBAH ENGINEERING (M) BHD MYR 1,281,287.27 3.501,680,000PP PERSERO TBK PT IDR 1,478,699.81 4.047,800,000
4,410,148.57 12.05
BOC AVIATION LTD HKD 1,533,544.17 4.19258,000Financial services
INDIABULLS HOUSING FINANCE L INR 720,856.97 1.9738,000MELCO INTERNATIONAL DEVELOP. HKD 1,127,175.41 3.08388,000SRISAWADCORP PCL - FOREIGN THB 909,210.13 2.49468,000
4,290,786.68 11.73
CHINA MEDICAL SYSTEM HOLDING HKD 880,976.57 2.41388,000Cosmetics
PRODIA WIDYAHUSADA TBK PT IDR 441,326.74 1.211,660,1003SBIO INC HKD 1,842,724.88 5.03818,000
3,165,028.19 8.65
DOOSAN BOBCAT INC KRW 324,045.40 0.8911,000Auto Parts & Equipment
ENDURANCE TECHNOLOGIES LTD INR 1,582,398.77 4.3381,596NEXTEER AUTOMOTIVE GROUP LTD HKD 572,302.98 1.56380,000
2,478,747.15 6.78
AIRTAC INTERNATIONAL GROUP TWD 1,859,451.29 5.08108,000Diversified machinery
1,859,451.29 5.08
SAMSONITE INTERNATIONAL SA HKD 1,810,861.89 4.95398,100Distribution & Wholesale
1,810,861.89 4.95
BHARAT ELECTRONICS LTD INR 1,408,632.83 3.85646,768Engineering & Construction
1,408,632.83 3.85
BANK TABUNGAN NEGARA PERSERO IDR 1,324,859.25 3.624,800,000Banks
1,324,859.25 3.62
DB INSURANCE CO LTD KRW 1,097,663.92 3.0018,000Insurance
1,097,663.92 3.00
HUANENG RENEWABLES CORP-H HKD 1,075,189.57 2.942,880,000Energy
1,075,189.57 2.94
DNF CO LTD KRW 842,105.24 2.3068,000Chemical
842,105.24 2.30
ECO WORLD DEVELOPMENT GROUP MYR 770,426.97 2.112,980,000Real estate
770,426.97 2.11
BUMITAMA AGRI LTD SGD 541,281.04 1.481,000,000Agriculture
541,281.04 1.48
DenominationQuantity/Nominal
Market valuein USD
Currency %NAV
ANN JOO RESOURCES BHD MYR 527,406.38 1.44680,000Metal
527,406.38 1.44
33,776,966.06 92.32
HANGZHOU TIGERMED CONSULTI-A CNY 1,092,889.56 2.99128,023
Other transferable securities
SharesDiversified services
1,092,889.56 2.99
1,092,889.56 2.99
Total Securities Portfolio 34,869,855.62 95.31
DenominationQuantity/Nominal
Market valuein USD
Currency %NAV
5,800,000 April 3, 2018739,123 0.19HKDUSD 739,122.79Forward foreign exchange contracts
2,662,404,976 April 3, 2018193,587 239.49IDRUSD 193,587.22345,000 April 3, 2018262,919 (122.07)SGDUSD 262,919.24
117.61
Total Forward foreign exchange contracts 117.61
SalePurchase Unrealisedappreciation /(depreciation)
in USD
MaturityDate
Commitmentin USD
Financial derivative instruments as at March 31, 2018
Summary of net assets
117.61 -Total financial derivative instruments
%NAV
34,869,855.62 95.31Total Securities Portfolio
2,105,499.23 5.76Cash at bank
(390,699.91) (1.07)Other assets and liabilities
36,584,772.55 100.00Total net assets
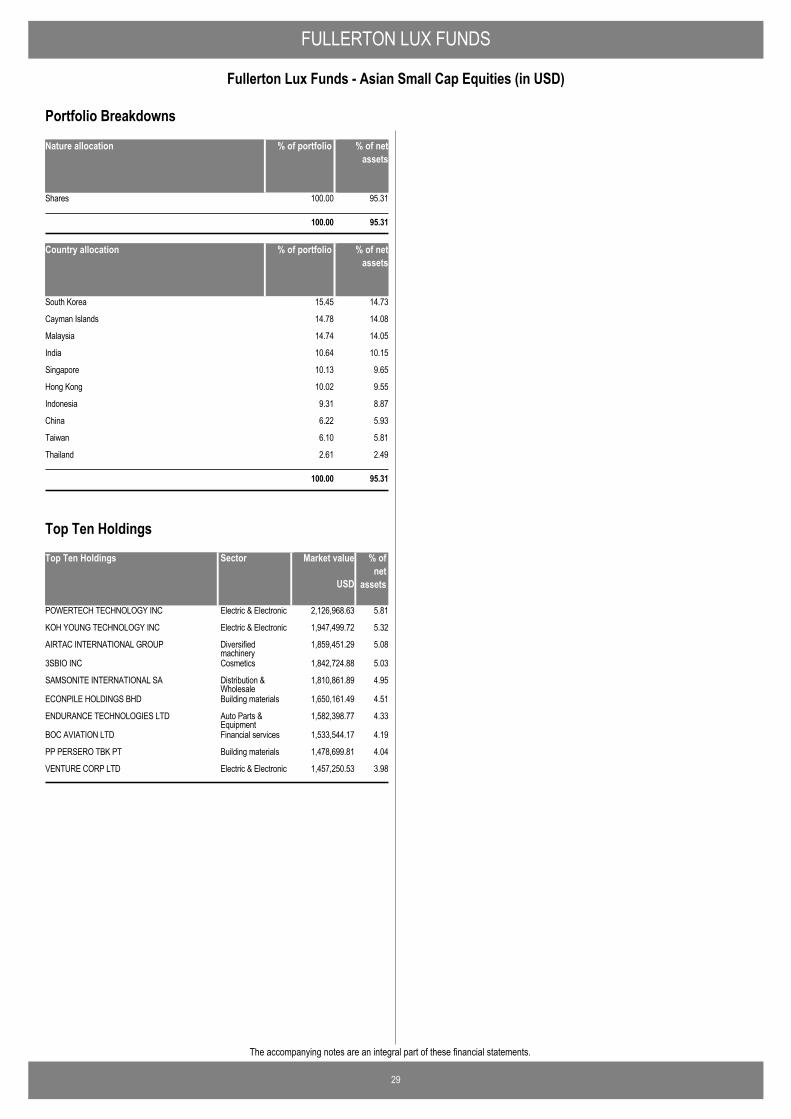
FULLERTON LUX FUNDS
29
Fullerton Lux Funds - Asian Small Cap Equities (in USD)
The accompanying notes are an integral part of these financial statements.
Nature allocation % of portfolio % of netassets
Shares 100.00 95.31
100.00 95.31
Country allocation % of portfolio % of netassets
South Korea 15.45 14.73
Cayman Islands 14.78 14.08
Malaysia 14.74 14.05
India 10.64 10.15
Singapore 10.13 9.65
Hong Kong 10.02 9.55
Indonesia 9.31 8.87
China 6.22 5.93
Taiwan 6.10 5.81
Thailand 2.61 2.49
100.00 95.31
Portfolio Breakdowns
Top Ten Holdings Market value % ofnet
assets
POWERTECH TECHNOLOGY INC 2,126,968.63 5.81Electric & Electronic
KOH YOUNG TECHNOLOGY INC 1,947,499.72 5.32Electric & Electronic
AIRTAC INTERNATIONAL GROUP 1,859,451.29 5.08Diversifiedmachinery
3SBIO INC 1,842,724.88 5.03Cosmetics
SAMSONITE INTERNATIONAL SA 1,810,861.89 4.95Distribution &Wholesale
ECONPILE HOLDINGS BHD 1,650,161.49 4.51Building materials
ENDURANCE TECHNOLOGIES LTD 1,582,398.77 4.33Auto Parts &Equipment
BOC AVIATION LTD 1,533,544.17 4.19Financial services
PP PERSERO TBK PT 1,478,699.81 4.04Building materials
VENTURE CORP LTD 1,457,250.53 3.98Electric & Electronic
USD
Sector
Top Ten Holdings
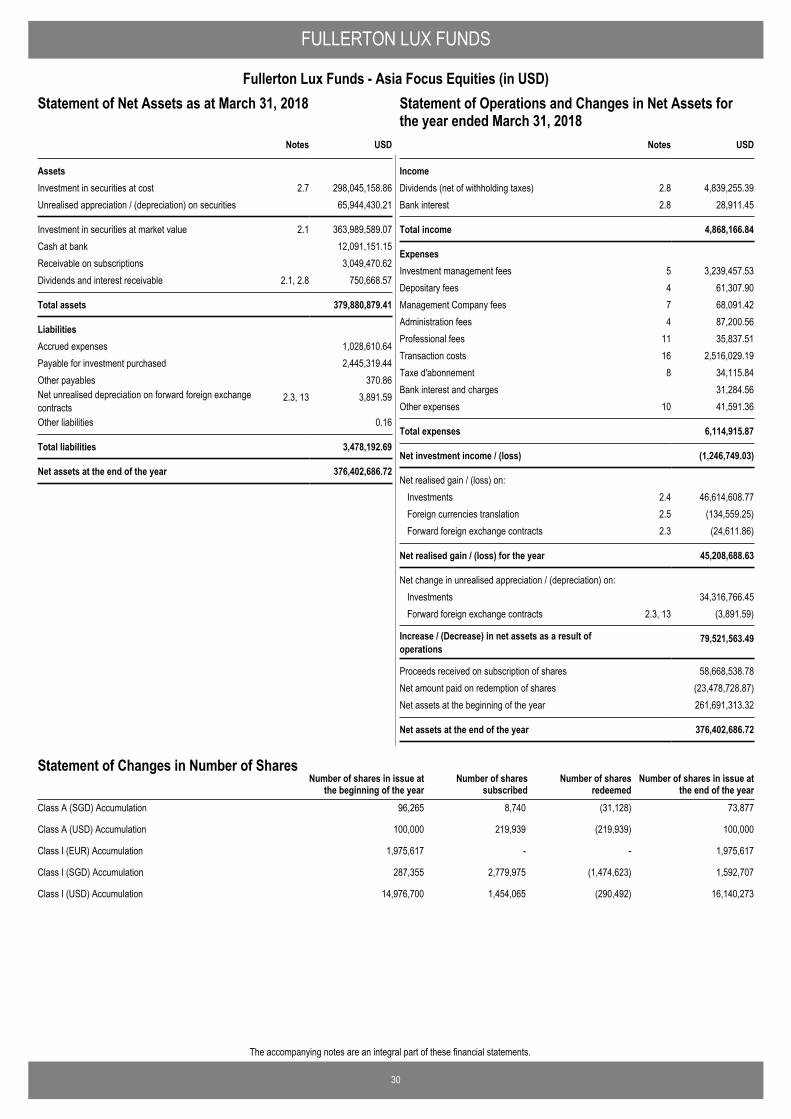
30
The accompanying notes are an integral part of these financial statements.
FULLERTON LUX FUNDS
Fullerton Lux Funds - Asia Focus Equities (in USD)Statement of Operations and Changes in Net Assets for theyear ended March 31, 2018
USD
AssetsInvestment in securities at cost 2.7 298,045,158.86Unrealised appreciation / (depreciation) on securities 65,944,430.21
Investment in securities at market value 2.1 363,989,589.07Cash at bank 12,091,151.15Receivable on subscriptions 3,049,470.62Dividends and interest receivable 2.1, 2.8 750,668.57
Total assets 379,880,879.41
LiabilitiesAccrued expenses 1,028,610.64Payable for investment purchased 2,445,319.44Other payables 370.86Net unrealised depreciation on forward foreign exchangecontracts
2.3, 13 3,891.59
Other liabilities 0.16
Total liabilities 3,478,192.69
Net assets at the end of the year 376,402,686.72
Notes
Statement of Net Assets as at March 31, 2018
IncomeDividends (net of withholding taxes) 2.8 4,839,255.39Bank interest 2.8 28,911.45
Total income 4,868,166.84
ExpensesInvestment management fees 5 3,239,457.53Depositary fees 4 61,307.90Management Company fees 7 68,091.42Administration fees 4 87,200.56Professional fees 11 35,837.51Transaction costs 16 2,516,029.19Taxe d'abonnement 8 34,115.84Bank interest and charges 31,284.56Other expenses 10 41,591.36
Total expenses 6,114,915.87
Net investment income / (loss) (1,246,749.03)
Net realised gain / (loss) on: Investments 2.4 46,614,608.77Foreign currencies translation 2.5 (134,559.25)Forward foreign exchange contracts 2.3 (24,611.86)
Net realised gain / (loss) for the year 45,208,688.63
Net change in unrealised appreciation / (depreciation) on: Investments 34,316,766.45Forward foreign exchange contracts 2.3, 13 (3,891.59)
Increase / (Decrease) in net assets as a result ofoperations
79,521,563.49
Proceeds received on subscription of shares 58,668,538.78Net amount paid on redemption of shares (23,478,728.87)Net assets at the beginning of the year 261,691,313.32
Net assets at the end of the year 376,402,686.72
USDNotes
Statement of Operations and Changes in Net Assets forthe year ended March 31, 2018
Number of shares in issue atthe end of the year
Number of shares in issue atthe beginning of the year
Number of sharessubscribed
Number of sharesredeemed
Statement of Changes in Number of Shares
Class A (SGD) Accumulation 96,265 8,740 (31,128) 73,877
Class A (USD) Accumulation 100,000 219,939 (219,939) 100,000
Class I (EUR) Accumulation 1,975,617 - - 1,975,617
Class I (SGD) Accumulation 287,355 2,779,975 (1,474,623) 1,592,707
Class I (USD) Accumulation 14,976,700 1,454,065 (290,492) 16,140,273
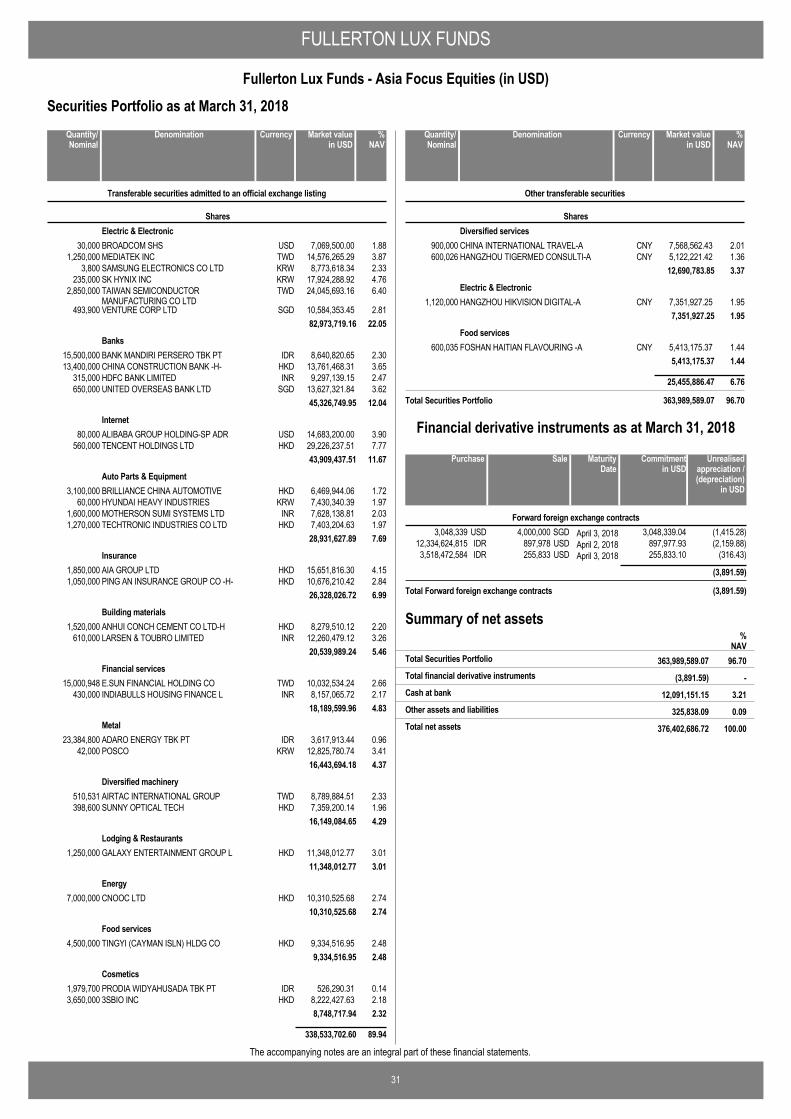
FULLERTON LUX FUNDS
31
Fullerton Lux Funds - Asia Focus Equities (in USD)
The accompanying notes are an integral part of these financial statements.
Securities Portfolio as at March 31, 2018
BROADCOM SHS USD 7,069,500.00 1.8830,000
Transferable securities admitted to an official exchange listing
SharesElectric & Electronic
MEDIATEK INC TWD 14,576,265.29 3.871,250,000SAMSUNG ELECTRONICS CO LTD KRW 8,773,618.34 2.333,800SK HYNIX INC KRW 17,924,288.92 4.76235,000TAIWAN SEMICONDUCTORMANUFACTURING CO LTD
TWD 24,045,693.16 6.402,850,000
VENTURE CORP LTD SGD 10,584,353.45 2.81493,90082,973,719.16 22.05
BANK MANDIRI PERSERO TBK PT IDR 8,640,820.65 2.3015,500,000Banks
CHINA CONSTRUCTION BANK -H- HKD 13,761,468.31 3.6513,400,000HDFC BANK LIMITED INR 9,297,139.15 2.47315,000UNITED OVERSEAS BANK LTD SGD 13,627,321.84 3.62650,000
45,326,749.95 12.04
ALIBABA GROUP HOLDING-SP ADR USD 14,683,200.00 3.9080,000Internet
TENCENT HOLDINGS LTD HKD 29,226,237.51 7.77560,00043,909,437.51 11.67
BRILLIANCE CHINA AUTOMOTIVE HKD 6,469,944.06 1.723,100,000Auto Parts & Equipment
HYUNDAI HEAVY INDUSTRIES KRW 7,430,340.39 1.9760,000MOTHERSON SUMI SYSTEMS LTD INR 7,628,138.81 2.031,600,000TECHTRONIC INDUSTRIES CO LTD HKD 7,403,204.63 1.971,270,000
28,931,627.89 7.69
AIA GROUP LTD HKD 15,651,816.30 4.151,850,000Insurance
PING AN INSURANCE GROUP CO -H- HKD 10,676,210.42 2.841,050,00026,328,026.72 6.99
ANHUI CONCH CEMENT CO LTD-H HKD 8,279,510.12 2.201,520,000Building materials
LARSEN & TOUBRO LIMITED INR 12,260,479.12 3.26610,00020,539,989.24 5.46
E.SUN FINANCIAL HOLDING CO TWD 10,032,534.24 2.6615,000,948Financial services
INDIABULLS HOUSING FINANCE L INR 8,157,065.72 2.17430,00018,189,599.96 4.83
ADARO ENERGY TBK PT IDR 3,617,913.44 0.9623,384,800Metal
POSCO KRW 12,825,780.74 3.4142,00016,443,694.18 4.37
AIRTAC INTERNATIONAL GROUP TWD 8,789,884.51 2.33510,531Diversified machinery
SUNNY OPTICAL TECH HKD 7,359,200.14 1.96398,60016,149,084.65 4.29
GALAXY ENTERTAINMENT GROUP L HKD 11,348,012.77 3.011,250,000Lodging & Restaurants
11,348,012.77 3.01
CNOOC LTD HKD 10,310,525.68 2.747,000,000Energy
10,310,525.68 2.74
TINGYI (CAYMAN ISLN) HLDG CO HKD 9,334,516.95 2.484,500,000Food services
9,334,516.95 2.48
PRODIA WIDYAHUSADA TBK PT IDR 526,290.31 0.141,979,700Cosmetics
3SBIO INC HKD 8,222,427.63 2.183,650,0008,748,717.94 2.32
338,533,702.60 89.94
DenominationQuantity/Nominal
Market valuein USD
Currency %NAV
CHINA INTERNATIONAL TRAVEL-A CNY 7,568,562.43 2.01900,000
Other transferable securities
SharesDiversified services
HANGZHOU TIGERMED CONSULTI-A CNY 5,122,221.42 1.36600,02612,690,783.85 3.37
HANGZHOU HIKVISION DIGITAL-A CNY 7,351,927.25 1.951,120,000Electric & Electronic
7,351,927.25 1.95
FOSHAN HAITIAN FLAVOURING -A CNY 5,413,175.37 1.44600,035Food services
5,413,175.37 1.44
25,455,886.47 6.76
Total Securities Portfolio 363,989,589.07 96.70
DenominationQuantity/Nominal
Market valuein USD
Currency %NAV
4,000,000 April 3, 20183,048,339 (1,415.28)SGDUSD 3,048,339.04Forward foreign exchange contracts
897,978 April 2, 201812,334,624,815 (2,159.88)USDIDR 897,977.93255,833 April 3, 20183,518,472,584 (316.43)USDIDR 255,833.10
(3,891.59)
Total Forward foreign exchange contracts (3,891.59)
SalePurchase Unrealisedappreciation /(depreciation)
in USD
MaturityDate
Commitmentin USD
Financial derivative instruments as at March 31, 2018
Summary of net assets
(3,891.59) -Total financial derivative instruments
%NAV
363,989,589.07 96.70Total Securities Portfolio
12,091,151.15 3.21Cash at bank
325,838.09 0.09Other assets and liabilities
376,402,686.72 100.00Total net assets

FULLERTON LUX FUNDS
32
Fullerton Lux Funds - Asia Focus Equities (in USD)
The accompanying notes are an integral part of these financial statements.
Nature allocation % of portfolio % of netassets
Shares 100.00 96.70
100.00 96.70
Country allocation % of portfolio % of netassets
China 28.05 27.12
Taiwan 13.37 12.93
South Korea 12.90 12.47
Hong Kong 12.28 11.87
India 10.26 9.93
Cayman Islands 9.26 8.95
Singapore 8.59 8.31
Indonesia 3.51 3.40
Bermuda 1.78 1.72
100.00 96.70
Portfolio Breakdowns
Top Ten Holdings Market value % ofnet
assets
TENCENT HOLDINGS LTD 29,226,237.51 7.77Internet
TAIWAN SEMICONDUCTOR MANUFACTURINGCO LTD
24,045,693.16 6.40Electric & Electronic
SK HYNIX INC 17,924,288.92 4.76Electric & Electronic
AIA GROUP LTD 15,651,816.30 4.15Insurance
ALIBABA GROUP HOLDING-SP ADR 14,683,200.00 3.90Internet
MEDIATEK INC 14,576,265.29 3.87Electric & Electronic
CHINA CONSTRUCTION BANK -H- 13,761,468.31 3.65Banks
UNITED OVERSEAS BANK LTD 13,627,321.84 3.62Banks
POSCO 12,825,780.74 3.41Metal
LARSEN & TOUBRO LIMITED 12,260,479.12 3.26Building materials
USD
Sector
Top Ten Holdings

33
The accompanying notes are an integral part of these financial statements.
FULLERTON LUX FUNDS
Fullerton Lux Funds - Asia Absolute Alpha (in USD)Statement of Operations and Changes in Net Assets for theyear ended March 31, 2018
USD
AssetsInvestment in securities at cost 2.7 67,854,421.41Unrealised appreciation / (depreciation) on securities 8,445,938.35
Investment in securities at market value 2.1 76,300,359.76Cash at bank 7,962,677.77Receivable for investment sold 426,496.41Dividends and interest receivable 2.1, 2.8 62,396.88
Total assets 84,751,930.82
LiabilitiesAccrued expenses 1,755,598.25Payable for investment purchased 461,458.64Other payables 370.86Other liabilities 0.38
Total liabilities 2,217,428.13
Net assets at the end of the year 82,534,502.69
Notes
Statement of Net Assets as at March 31, 2018
IncomeDividends (net of withholding taxes) 2.8 1,230,275.34Bank interest 2.8 7,481.98
Total income 1,237,757.32
ExpensesInvestment management fees 5 787,642.51Depositary fees 4 17,997.30Performance fees 6 1,518,859.55Management Company fees 7 17,076.10Administration fees 4 24,121.78Professional fees 11 22,283.97Transaction costs 16 889,484.30Taxe d'abonnement 8 7,970.18Bank interest and charges 8,217.78Other expenses 10 29,055.47
Total expenses 3,322,708.94
Net investment income / (loss) (2,084,951.62)
Net realised gain / (loss) on: Investments 2.4 14,608,415.55Foreign currencies translation 2.5 (91,303.77)Futures contracts 2.2 (3,237,374.09)Forward foreign exchange contracts 2.3 (3,310.00)
Net realised gain / (loss) for the year 9,191,476.07
Net change in unrealised appreciation / (depreciation) on: Investments 3,771,212.66Forward foreign exchange contracts 2.3, 13 (47.59)
Increase / (Decrease) in net assets as a result ofoperations
12,962,641.14
Proceeds received on subscription of shares 9,914.94Net amount paid on redemption of shares (5,341,323.19)Net assets at the beginning of the year 74,903,269.80
Net assets at the end of the year 82,534,502.69
USDNotes
Statement of Operations and Changes in Net Assets forthe year ended March 31, 2018
Number of shares in issue atthe end of the year
Number of shares in issue atthe beginning of the year
Number of sharessubscribed
Number of sharesredeemed
Statement of Changes in Number of Shares
Class A (SGD) Accumulation 49,303 85 (39,303) 10,085
Class I (USD) Accumulation 6,705,117 826 (413,991) 6,291,952
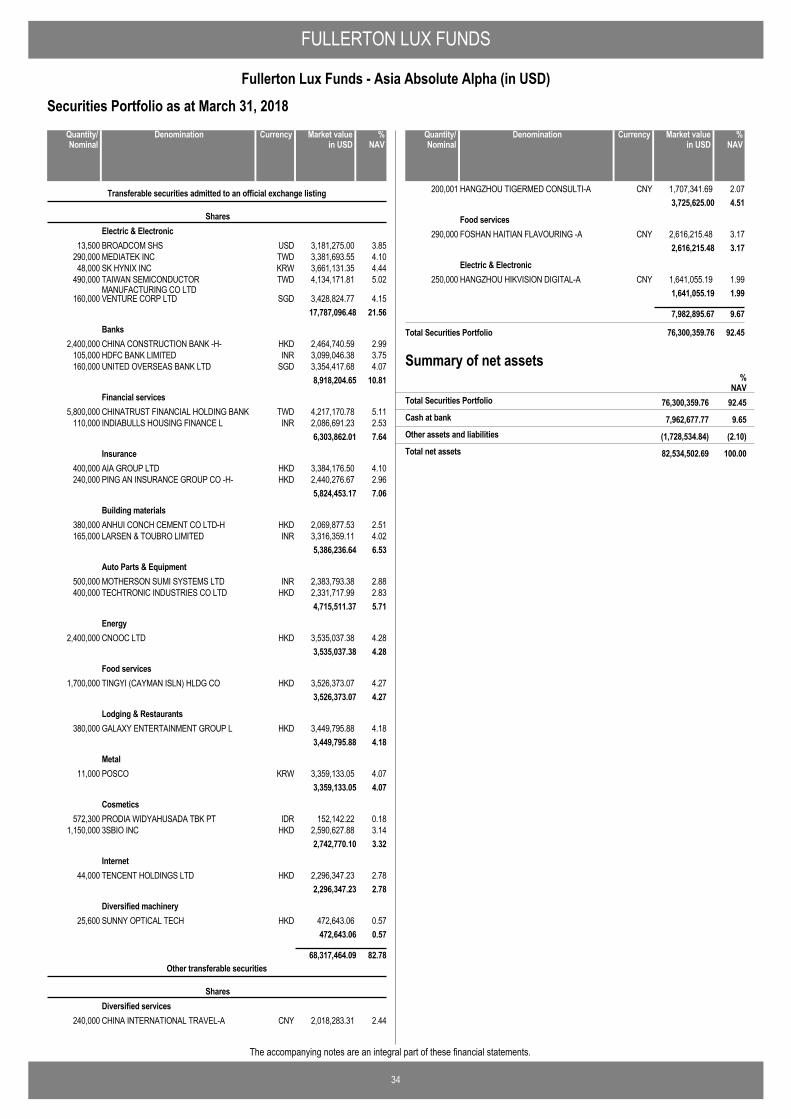
FULLERTON LUX FUNDS
34
Fullerton Lux Funds - Asia Absolute Alpha (in USD)
The accompanying notes are an integral part of these financial statements.
Securities Portfolio as at March 31, 2018
BROADCOM SHS USD 3,181,275.00 3.8513,500
Transferable securities admitted to an official exchange listing
SharesElectric & Electronic
MEDIATEK INC TWD 3,381,693.55 4.10290,000SK HYNIX INC KRW 3,661,131.35 4.4448,000TAIWAN SEMICONDUCTORMANUFACTURING CO LTD
TWD 4,134,171.81 5.02490,000
VENTURE CORP LTD SGD 3,428,824.77 4.15160,00017,787,096.48 21.56
CHINA CONSTRUCTION BANK -H- HKD 2,464,740.59 2.992,400,000Banks
HDFC BANK LIMITED INR 3,099,046.38 3.75105,000UNITED OVERSEAS BANK LTD SGD 3,354,417.68 4.07160,000
8,918,204.65 10.81
CHINATRUST FINANCIAL HOLDING BANK TWD 4,217,170.78 5.115,800,000Financial services
INDIABULLS HOUSING FINANCE L INR 2,086,691.23 2.53110,0006,303,862.01 7.64
AIA GROUP LTD HKD 3,384,176.50 4.10400,000Insurance
PING AN INSURANCE GROUP CO -H- HKD 2,440,276.67 2.96240,0005,824,453.17 7.06
ANHUI CONCH CEMENT CO LTD-H HKD 2,069,877.53 2.51380,000Building materials
LARSEN & TOUBRO LIMITED INR 3,316,359.11 4.02165,0005,386,236.64 6.53
MOTHERSON SUMI SYSTEMS LTD INR 2,383,793.38 2.88500,000Auto Parts & Equipment
TECHTRONIC INDUSTRIES CO LTD HKD 2,331,717.99 2.83400,0004,715,511.37 5.71
CNOOC LTD HKD 3,535,037.38 4.282,400,000Energy
3,535,037.38 4.28
TINGYI (CAYMAN ISLN) HLDG CO HKD 3,526,373.07 4.271,700,000Food services
3,526,373.07 4.27
GALAXY ENTERTAINMENT GROUP L HKD 3,449,795.88 4.18380,000Lodging & Restaurants
3,449,795.88 4.18
POSCO KRW 3,359,133.05 4.0711,000Metal
3,359,133.05 4.07
PRODIA WIDYAHUSADA TBK PT IDR 152,142.22 0.18572,300Cosmetics
3SBIO INC HKD 2,590,627.88 3.141,150,0002,742,770.10 3.32
TENCENT HOLDINGS LTD HKD 2,296,347.23 2.7844,000Internet
2,296,347.23 2.78
SUNNY OPTICAL TECH HKD 472,643.06 0.5725,600Diversified machinery
472,643.06 0.57
68,317,464.09 82.78
CHINA INTERNATIONAL TRAVEL-A CNY 2,018,283.31 2.44240,000
Other transferable securities
SharesDiversified services
DenominationQuantity/Nominal
Market valuein USD
Currency %NAV
HANGZHOU TIGERMED CONSULTI-A CNY 1,707,341.69 2.07200,0013,725,625.00 4.51
FOSHAN HAITIAN FLAVOURING -A CNY 2,616,215.48 3.17290,000Food services
2,616,215.48 3.17
HANGZHOU HIKVISION DIGITAL-A CNY 1,641,055.19 1.99250,000Electric & Electronic
1,641,055.19 1.99
7,982,895.67 9.67
Total Securities Portfolio 76,300,359.76 92.45
DenominationQuantity/Nominal
Market valuein USD
Currency %NAV
Summary of net assets%
NAV76,300,359.76 92.45Total Securities Portfolio
7,962,677.77 9.65Cash at bank
(1,728,534.84) (2.10)Other assets and liabilities
82,534,502.69 100.00Total net assets
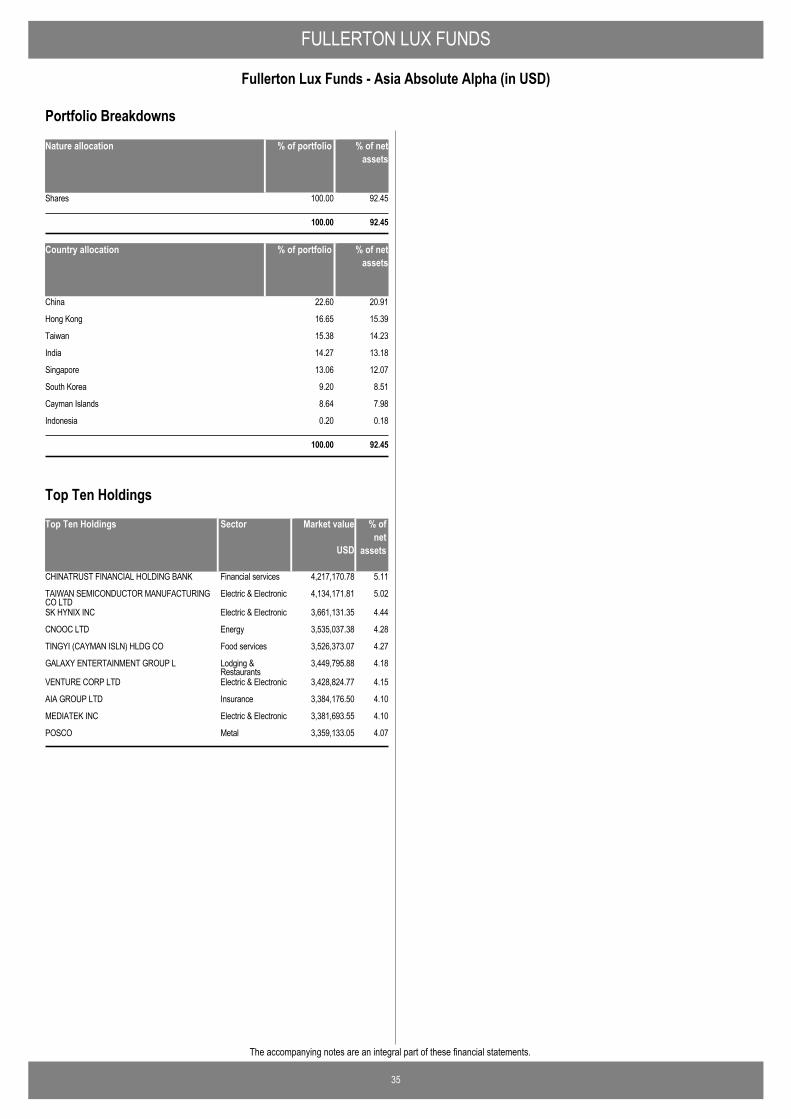
FULLERTON LUX FUNDS
35
Fullerton Lux Funds - Asia Absolute Alpha (in USD)
The accompanying notes are an integral part of these financial statements.
Nature allocation % of portfolio % of netassets
Shares 100.00 92.45
100.00 92.45
Country allocation % of portfolio % of netassets
China 22.60 20.91
Hong Kong 16.65 15.39
Taiwan 15.38 14.23
India 14.27 13.18
Singapore 13.06 12.07
South Korea 9.20 8.51
Cayman Islands 8.64 7.98
Indonesia 0.20 0.18
100.00 92.45
Portfolio Breakdowns
Top Ten Holdings Market value % ofnet
assets
CHINATRUST FINANCIAL HOLDING BANK 4,217,170.78 5.11Financial services
TAIWAN SEMICONDUCTOR MANUFACTURINGCO LTD
4,134,171.81 5.02Electric & Electronic
SK HYNIX INC 3,661,131.35 4.44Electric & Electronic
CNOOC LTD 3,535,037.38 4.28Energy
TINGYI (CAYMAN ISLN) HLDG CO 3,526,373.07 4.27Food services
GALAXY ENTERTAINMENT GROUP L 3,449,795.88 4.18Lodging &Restaurants
VENTURE CORP LTD 3,428,824.77 4.15Electric & Electronic
AIA GROUP LTD 3,384,176.50 4.10Insurance
MEDIATEK INC 3,381,693.55 4.10Electric & Electronic
POSCO 3,359,133.05 4.07Metal
USD
Sector
Top Ten Holdings
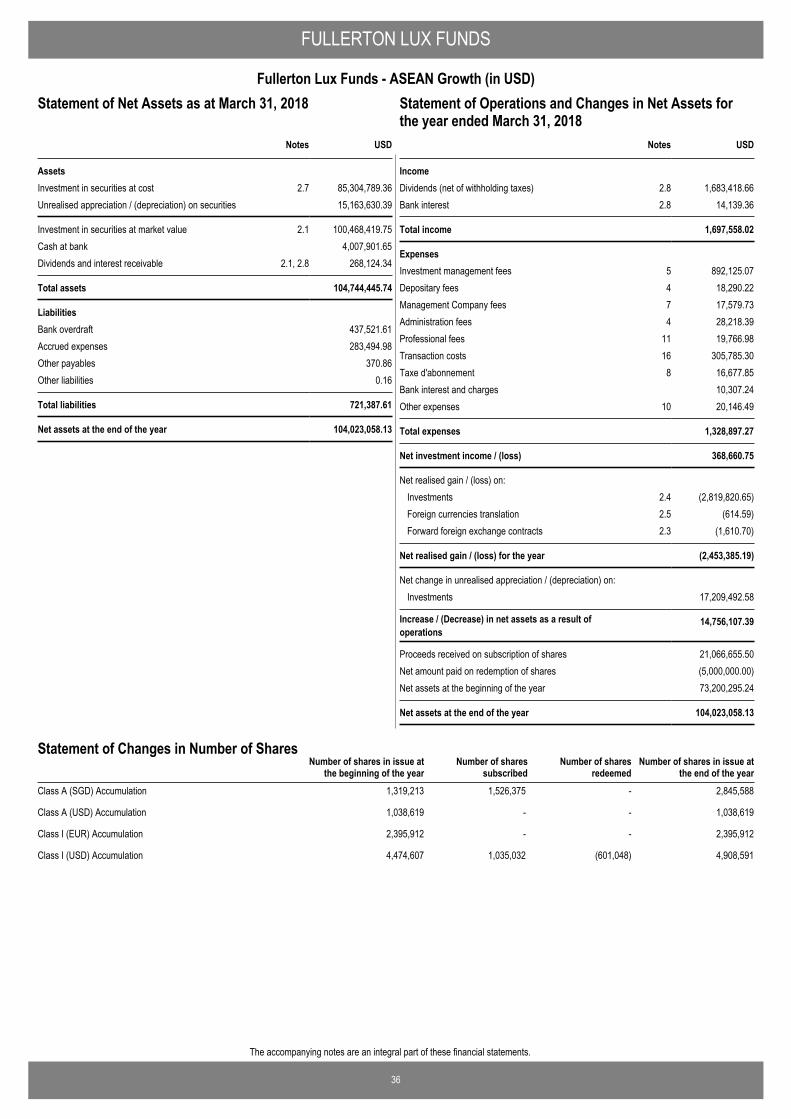
36
The accompanying notes are an integral part of these financial statements.
FULLERTON LUX FUNDS
Fullerton Lux Funds - ASEAN Growth (in USD)Statement of Operations and Changes in Net Assets for theyear ended March 31, 2018
USD
AssetsInvestment in securities at cost 2.7 85,304,789.36Unrealised appreciation / (depreciation) on securities 15,163,630.39
Investment in securities at market value 2.1 100,468,419.75Cash at bank 4,007,901.65Dividends and interest receivable 2.1, 2.8 268,124.34
Total assets 104,744,445.74
LiabilitiesBank overdraft 437,521.61Accrued expenses 283,494.98Other payables 370.86Other liabilities 0.16
Total liabilities 721,387.61
Net assets at the end of the year 104,023,058.13
Notes
Statement of Net Assets as at March 31, 2018
IncomeDividends (net of withholding taxes) 2.8 1,683,418.66Bank interest 2.8 14,139.36
Total income 1,697,558.02
ExpensesInvestment management fees 5 892,125.07Depositary fees 4 18,290.22Management Company fees 7 17,579.73Administration fees 4 28,218.39Professional fees 11 19,766.98Transaction costs 16 305,785.30Taxe d'abonnement 8 16,677.85Bank interest and charges 10,307.24Other expenses 10 20,146.49
Total expenses 1,328,897.27
Net investment income / (loss) 368,660.75
Net realised gain / (loss) on: Investments 2.4 (2,819,820.65)Foreign currencies translation 2.5 (614.59)Forward foreign exchange contracts 2.3 (1,610.70)
Net realised gain / (loss) for the year (2,453,385.19)
Net change in unrealised appreciation / (depreciation) on: Investments 17,209,492.58
Increase / (Decrease) in net assets as a result ofoperations
14,756,107.39
Proceeds received on subscription of shares 21,066,655.50Net amount paid on redemption of shares (5,000,000.00)Net assets at the beginning of the year 73,200,295.24
Net assets at the end of the year 104,023,058.13
USDNotes
Statement of Operations and Changes in Net Assets forthe year ended March 31, 2018
Number of shares in issue atthe end of the year
Number of shares in issue atthe beginning of the year
Number of sharessubscribed
Number of sharesredeemed
Statement of Changes in Number of Shares
Class A (SGD) Accumulation 1,319,213 1,526,375 - 2,845,588
Class A (USD) Accumulation 1,038,619 - - 1,038,619
Class I (EUR) Accumulation 2,395,912 - - 2,395,912
Class I (USD) Accumulation 4,474,607 1,035,032 (601,048) 4,908,591
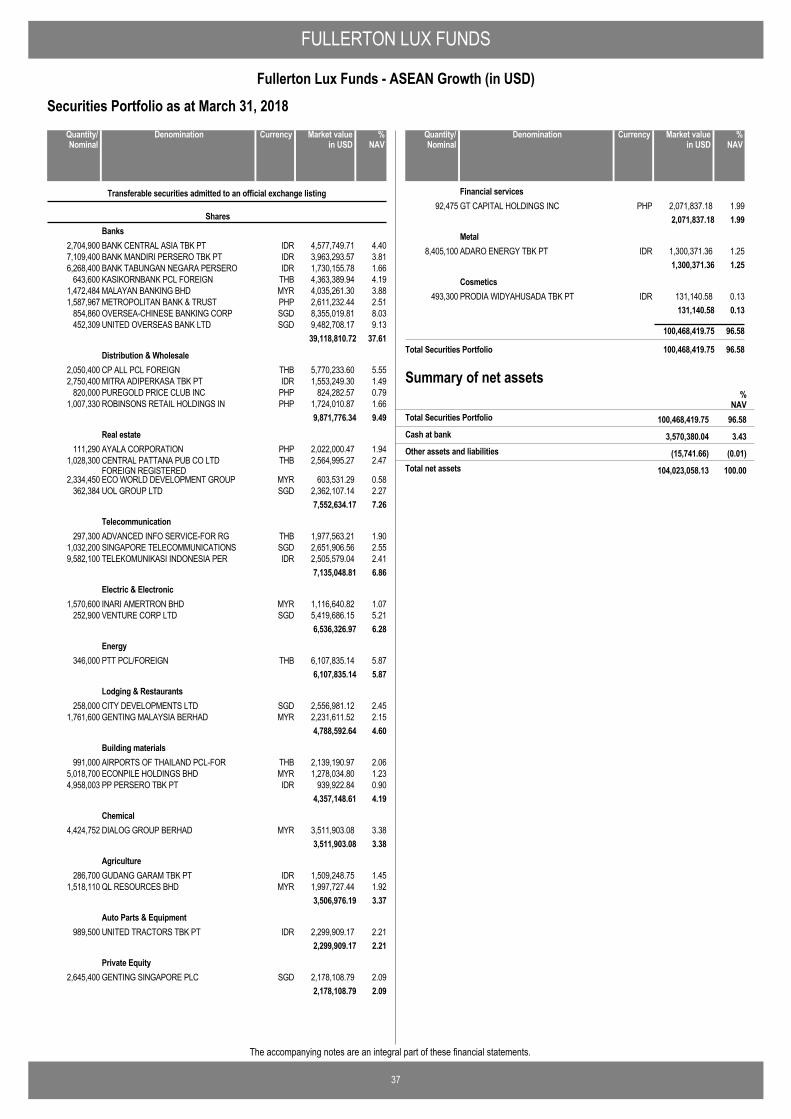
FULLERTON LUX FUNDS
37
Fullerton Lux Funds - ASEAN Growth (in USD)
The accompanying notes are an integral part of these financial statements.
Securities Portfolio as at March 31, 2018
BANK CENTRAL ASIA TBK PT IDR 4,577,749.71 4.402,704,900
Transferable securities admitted to an official exchange listing
SharesBanks
BANK MANDIRI PERSERO TBK PT IDR 3,963,293.57 3.817,109,400BANK TABUNGAN NEGARA PERSERO IDR 1,730,155.78 1.666,268,400KASIKORNBANK PCL FOREIGN THB 4,363,389.94 4.19643,600MALAYAN BANKING BHD MYR 4,035,261.30 3.881,472,484METROPOLITAN BANK & TRUST PHP 2,611,232.44 2.511,587,967OVERSEA-CHINESE BANKING CORP SGD 8,355,019.81 8.03854,860UNITED OVERSEAS BANK LTD SGD 9,482,708.17 9.13452,309
39,118,810.72 37.61
CP ALL PCL FOREIGN THB 5,770,233.60 5.552,050,400Distribution & Wholesale
MITRA ADIPERKASA TBK PT IDR 1,553,249.30 1.492,750,400PUREGOLD PRICE CLUB INC PHP 824,282.57 0.79820,000ROBINSONS RETAIL HOLDINGS IN PHP 1,724,010.87 1.661,007,330
9,871,776.34 9.49
AYALA CORPORATION PHP 2,022,000.47 1.94111,290Real estate
CENTRAL PATTANA PUB CO LTDFOREIGN REGISTERED
THB 2,564,995.27 2.471,028,300
ECO WORLD DEVELOPMENT GROUP MYR 603,531.29 0.582,334,450UOL GROUP LTD SGD 2,362,107.14 2.27362,384
7,552,634.17 7.26
ADVANCED INFO SERVICE-FOR RG THB 1,977,563.21 1.90297,300Telecommunication
SINGAPORE TELECOMMUNICATIONS SGD 2,651,906.56 2.551,032,200TELEKOMUNIKASI INDONESIA PER IDR 2,505,579.04 2.419,582,100
7,135,048.81 6.86
INARI AMERTRON BHD MYR 1,116,640.82 1.071,570,600Electric & Electronic
VENTURE CORP LTD SGD 5,419,686.15 5.21252,9006,536,326.97 6.28
PTT PCL/FOREIGN THB 6,107,835.14 5.87346,000Energy
6,107,835.14 5.87
CITY DEVELOPMENTS LTD SGD 2,556,981.12 2.45258,000Lodging & Restaurants
GENTING MALAYSIA BERHAD MYR 2,231,611.52 2.151,761,6004,788,592.64 4.60
AIRPORTS OF THAILAND PCL-FOR THB 2,139,190.97 2.06991,000Building materials
ECONPILE HOLDINGS BHD MYR 1,278,034.80 1.235,018,700PP PERSERO TBK PT IDR 939,922.84 0.904,958,003
4,357,148.61 4.19
DIALOG GROUP BERHAD MYR 3,511,903.08 3.384,424,752Chemical
3,511,903.08 3.38
GUDANG GARAM TBK PT IDR 1,509,248.75 1.45286,700Agriculture
QL RESOURCES BHD MYR 1,997,727.44 1.921,518,1103,506,976.19 3.37
UNITED TRACTORS TBK PT IDR 2,299,909.17 2.21989,500Auto Parts & Equipment
2,299,909.17 2.21
GENTING SINGAPORE PLC SGD 2,178,108.79 2.092,645,400Private Equity
2,178,108.79 2.09
DenominationQuantity/Nominal
Market valuein USD
Currency %NAV
GT CAPITAL HOLDINGS INC PHP 2,071,837.18 1.9992,475Financial services
2,071,837.18 1.99
ADARO ENERGY TBK PT IDR 1,300,371.36 1.258,405,100Metal
1,300,371.36 1.25
PRODIA WIDYAHUSADA TBK PT IDR 131,140.58 0.13493,300Cosmetics
131,140.58 0.13
100,468,419.75 96.58
Total Securities Portfolio 100,468,419.75 96.58
DenominationQuantity/Nominal
Market valuein USD
Currency %NAV
Summary of net assets%
NAV100,468,419.75 96.58Total Securities Portfolio
3,570,380.04 3.43Cash at bank
(15,741.66) (0.01)Other assets and liabilities
104,023,058.13 100.00Total net assets

FULLERTON LUX FUNDS
38
Fullerton Lux Funds - ASEAN Growth (in USD)
The accompanying notes are an integral part of these financial statements.
Nature allocation % of portfolio % of netassets
Shares 100.00 96.58
100.00 96.58
Country allocation % of portfolio % of netassets
Singapore 30.68 29.64
Thailand 22.82 22.04
Indonesia 20.41 19.71
Malaysia 14.71 14.21
Philippines 9.21 8.89
Isle of Man 2.17 2.09
100.00 96.58
Portfolio Breakdowns
Top Ten Holdings Market value % ofnet
assets
UNITED OVERSEAS BANK LTD 9,482,708.17 9.13Banks
OVERSEA-CHINESE BANKING CORP 8,355,019.81 8.03Banks
PTT PCL/FOREIGN 6,107,835.14 5.87Energy
CP ALL PCL FOREIGN 5,770,233.60 5.55Distribution &Wholesale
VENTURE CORP LTD 5,419,686.15 5.21Electric & Electronic
BANK CENTRAL ASIA TBK PT 4,577,749.71 4.40Banks
KASIKORNBANK PCL FOREIGN 4,363,389.94 4.19Banks
MALAYAN BANKING BHD 4,035,261.30 3.88Banks
BANK MANDIRI PERSERO TBK PT 3,963,293.57 3.81Banks
DIALOG GROUP BERHAD 3,511,903.08 3.38Chemical
USD
Sector
Top Ten Holdings
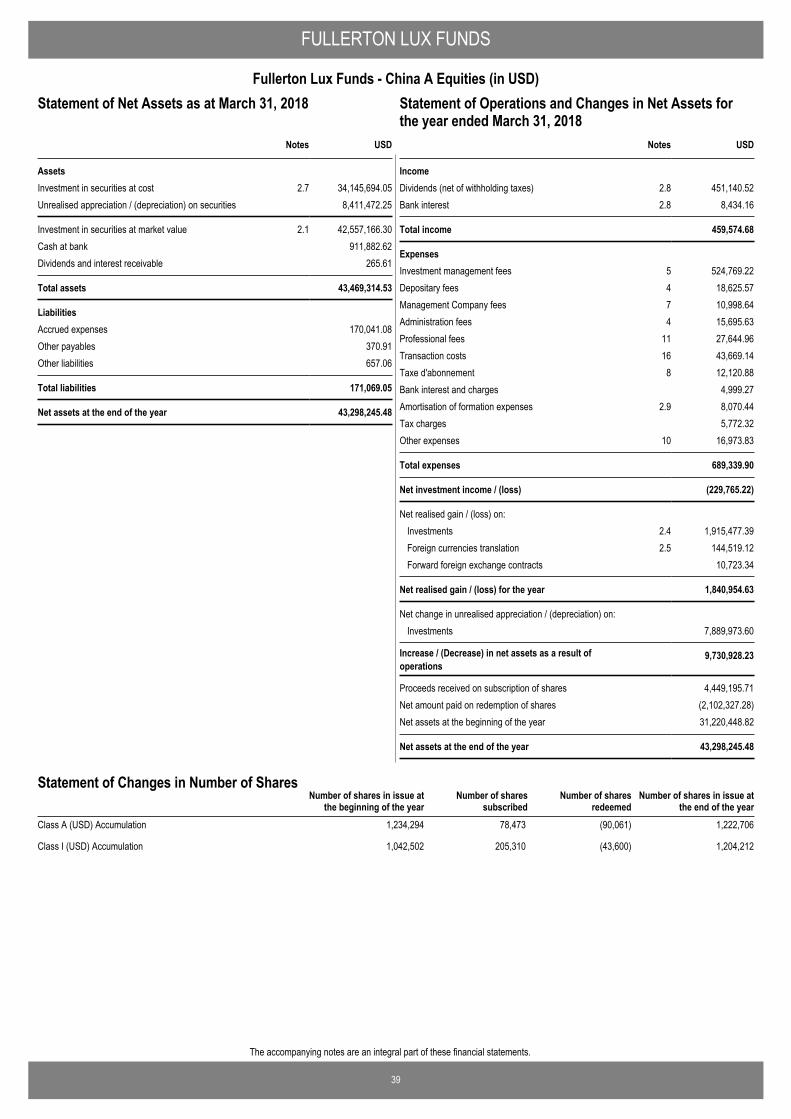
39
The accompanying notes are an integral part of these financial statements.
FULLERTON LUX FUNDS
Fullerton Lux Funds - China A Equities (in USD)Statement of Operations and Changes in Net Assets for theyear ended March 31, 2018
USD
AssetsInvestment in securities at cost 2.7 34,145,694.05Unrealised appreciation / (depreciation) on securities 8,411,472.25
Investment in securities at market value 2.1 42,557,166.30Cash at bank 911,882.62Dividends and interest receivable 265.61
Total assets 43,469,314.53
LiabilitiesAccrued expenses 170,041.08Other payables 370.91Other liabilities 657.06
Total liabilities 171,069.05
Net assets at the end of the year 43,298,245.48
Notes
Statement of Net Assets as at March 31, 2018
IncomeDividends (net of withholding taxes) 2.8 451,140.52Bank interest 2.8 8,434.16
Total income 459,574.68
ExpensesInvestment management fees 5 524,769.22Depositary fees 4 18,625.57Management Company fees 7 10,998.64Administration fees 4 15,695.63Professional fees 11 27,644.96Transaction costs 16 43,669.14Taxe d'abonnement 8 12,120.88Bank interest and charges 4,999.27Amortisation of formation expenses 2.9 8,070.44Tax charges 5,772.32Other expenses 10 16,973.83
Total expenses 689,339.90
Net investment income / (loss) (229,765.22)
Net realised gain / (loss) on: Investments 2.4 1,915,477.39Foreign currencies translation 2.5 144,519.12Forward foreign exchange contracts 10,723.34
Net realised gain / (loss) for the year 1,840,954.63
Net change in unrealised appreciation / (depreciation) on: Investments 7,889,973.60
Increase / (Decrease) in net assets as a result ofoperations
9,730,928.23
Proceeds received on subscription of shares 4,449,195.71Net amount paid on redemption of shares (2,102,327.28)Net assets at the beginning of the year 31,220,448.82
Net assets at the end of the year 43,298,245.48
USDNotes
Statement of Operations and Changes in Net Assets forthe year ended March 31, 2018
Number of shares in issue atthe end of the year
Number of shares in issue atthe beginning of the year
Number of sharessubscribed
Number of sharesredeemed
Statement of Changes in Number of Shares
Class A (USD) Accumulation 1,234,294 78,473 (90,061) 1,222,706
Class I (USD) Accumulation 1,042,502 205,310 (43,600) 1,204,212
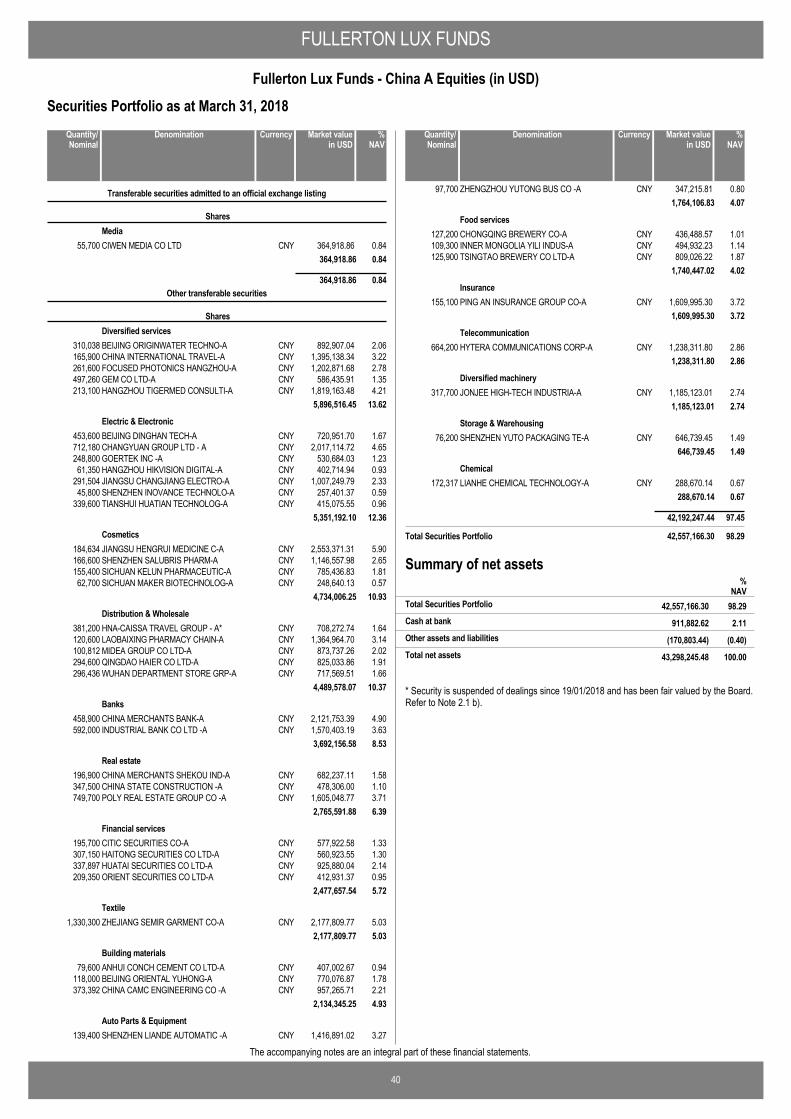
FULLERTON LUX FUNDS
40
Fullerton Lux Funds - China A Equities (in USD)
The accompanying notes are an integral part of these financial statements.
Securities Portfolio as at March 31, 2018
CIWEN MEDIA CO LTD CNY 364,918.86 0.8455,700
Transferable securities admitted to an official exchange listing
SharesMedia
364,918.86 0.84
364,918.86 0.84
BEIJING ORIGINWATER TECHNO-A CNY 892,907.04 2.06310,038
Other transferable securities
SharesDiversified services
CHINA INTERNATIONAL TRAVEL-A CNY 1,395,138.34 3.22165,900FOCUSED PHOTONICS HANGZHOU-A CNY 1,202,871.68 2.78261,600GEM CO LTD-A CNY 586,435.91 1.35497,260HANGZHOU TIGERMED CONSULTI-A CNY 1,819,163.48 4.21213,100
5,896,516.45 13.62
BEIJING DINGHAN TECH-A CNY 720,951.70 1.67453,600Electric & Electronic
CHANGYUAN GROUP LTD - A CNY 2,017,114.72 4.65712,180GOERTEK INC -A CNY 530,684.03 1.23248,800HANGZHOU HIKVISION DIGITAL-A CNY 402,714.94 0.9361,350JIANGSU CHANGJIANG ELECTRO-A CNY 1,007,249.79 2.33291,504SHENZHEN INOVANCE TECHNOLO-A CNY 257,401.37 0.5945,800TIANSHUI HUATIAN TECHNOLOG-A CNY 415,075.55 0.96339,600
5,351,192.10 12.36
JIANGSU HENGRUI MEDICINE C-A CNY 2,553,371.31 5.90184,634Cosmetics
SHENZHEN SALUBRIS PHARM-A CNY 1,146,557.98 2.65166,600SICHUAN KELUN PHARMACEUTIC-A CNY 785,436.83 1.81155,400SICHUAN MAKER BIOTECHNOLOG-A CNY 248,640.13 0.5762,700
4,734,006.25 10.93
HNA-CAISSA TRAVEL GROUP - A* CNY 708,272.74 1.64381,200Distribution & Wholesale
LAOBAIXING PHARMACY CHAIN-A CNY 1,364,964.70 3.14120,600MIDEA GROUP CO LTD-A CNY 873,737.26 2.02100,812QINGDAO HAIER CO LTD-A CNY 825,033.86 1.91294,600WUHAN DEPARTMENT STORE GRP-A CNY 717,569.51 1.66296,436
4,489,578.07 10.37
CHINA MERCHANTS BANK-A CNY 2,121,753.39 4.90458,900Banks
INDUSTRIAL BANK CO LTD -A CNY 1,570,403.19 3.63592,0003,692,156.58 8.53
CHINA MERCHANTS SHEKOU IND-A CNY 682,237.11 1.58196,900Real estate
CHINA STATE CONSTRUCTION -A CNY 478,306.00 1.10347,500POLY REAL ESTATE GROUP CO -A CNY 1,605,048.77 3.71749,700
2,765,591.88 6.39
CITIC SECURITIES CO-A CNY 577,922.58 1.33195,700Financial services
HAITONG SECURITIES CO LTD-A CNY 560,923.55 1.30307,150HUATAI SECURITIES CO LTD-A CNY 925,880.04 2.14337,897ORIENT SECURITIES CO LTD-A CNY 412,931.37 0.95209,350
2,477,657.54 5.72
ZHEJIANG SEMIR GARMENT CO-A CNY 2,177,809.77 5.031,330,300Textile
2,177,809.77 5.03
ANHUI CONCH CEMENT CO LTD-A CNY 407,002.67 0.9479,600Building materials
BEIJING ORIENTAL YUHONG-A CNY 770,076.87 1.78118,000CHINA CAMC ENGINEERING CO -A CNY 957,265.71 2.21373,392
2,134,345.25 4.93
SHENZHEN LIANDE AUTOMATIC -A CNY 1,416,891.02 3.27139,400Auto Parts & Equipment
DenominationQuantity/Nominal
Market valuein USD
Currency %NAV
ZHENGZHOU YUTONG BUS CO -A CNY 347,215.81 0.8097,7001,764,106.83 4.07
CHONGQING BREWERY CO-A CNY 436,488.57 1.01127,200Food services
INNER MONGOLIA YILI INDUS-A CNY 494,932.23 1.14109,300TSINGTAO BREWERY CO LTD-A CNY 809,026.22 1.87125,900
1,740,447.02 4.02
PING AN INSURANCE GROUP CO-A CNY 1,609,995.30 3.72155,100Insurance
1,609,995.30 3.72
HYTERA COMMUNICATIONS CORP-A CNY 1,238,311.80 2.86664,200Telecommunication
1,238,311.80 2.86
JONJEE HIGH-TECH INDUSTRIA-A CNY 1,185,123.01 2.74317,700Diversified machinery
1,185,123.01 2.74
SHENZHEN YUTO PACKAGING TE-A CNY 646,739.45 1.4976,200Storage & Warehousing
646,739.45 1.49
LIANHE CHEMICAL TECHNOLOGY-A CNY 288,670.14 0.67172,317Chemical
288,670.14 0.67
42,192,247.44 97.45
Total Securities Portfolio 42,557,166.30 98.29
DenominationQuantity/Nominal
Market valuein USD
Currency %NAV
Summary of net assets%
NAV42,557,166.30 98.29Total Securities Portfolio
911,882.62 2.11Cash at bank
(170,803.44) (0.40)Other assets and liabilities
43,298,245.48 100.00Total net assets
* Security is suspended of dealings since 19/01/2018 and has been fair valued by the Board.Refer to Note 2.1 b).
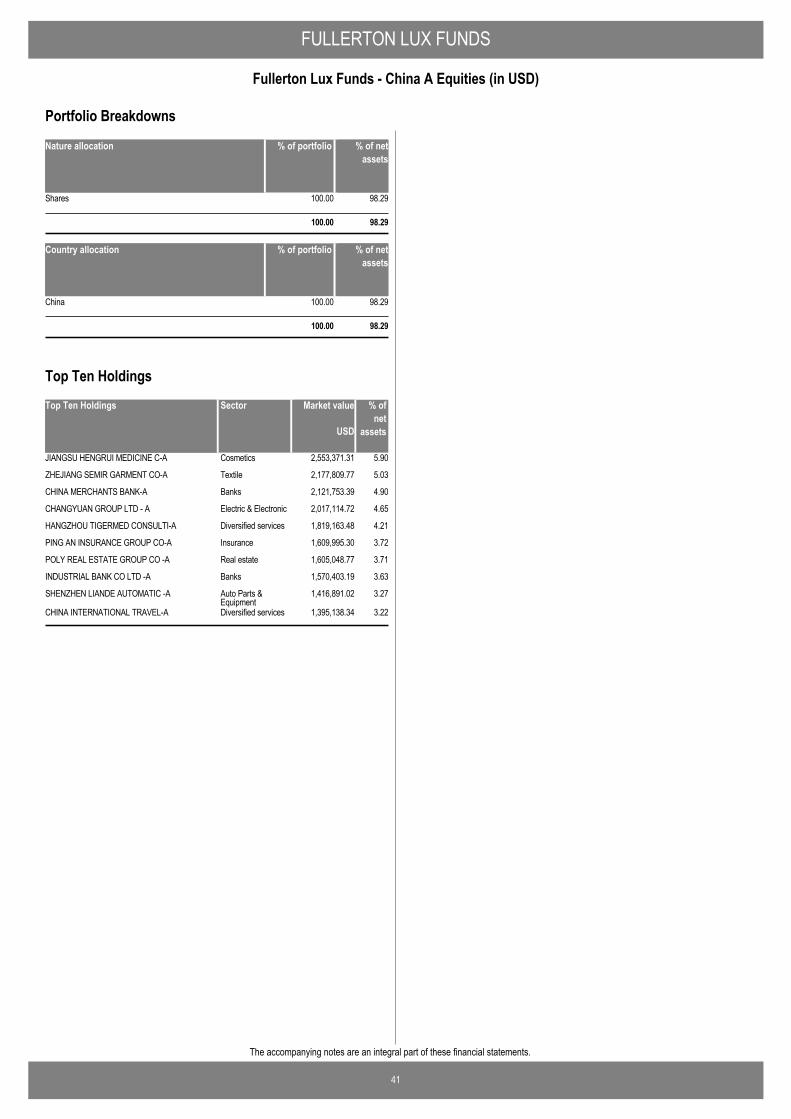
FULLERTON LUX FUNDS
41
Fullerton Lux Funds - China A Equities (in USD)
The accompanying notes are an integral part of these financial statements.
Nature allocation % of portfolio % of netassets
Shares 100.00 98.29
100.00 98.29
Country allocation % of portfolio % of netassets
China 100.00 98.29
100.00 98.29
Portfolio Breakdowns
Top Ten Holdings Market value % ofnet
assets
JIANGSU HENGRUI MEDICINE C-A 2,553,371.31 5.90Cosmetics
ZHEJIANG SEMIR GARMENT CO-A 2,177,809.77 5.03Textile
CHINA MERCHANTS BANK-A 2,121,753.39 4.90Banks
CHANGYUAN GROUP LTD - A 2,017,114.72 4.65Electric & Electronic
HANGZHOU TIGERMED CONSULTI-A 1,819,163.48 4.21Diversified services
PING AN INSURANCE GROUP CO-A 1,609,995.30 3.72Insurance
POLY REAL ESTATE GROUP CO -A 1,605,048.77 3.71Real estate
INDUSTRIAL BANK CO LTD -A 1,570,403.19 3.63Banks
SHENZHEN LIANDE AUTOMATIC -A 1,416,891.02 3.27Auto Parts &Equipment
CHINA INTERNATIONAL TRAVEL-A 1,395,138.34 3.22Diversified services
USD
Sector
Top Ten Holdings
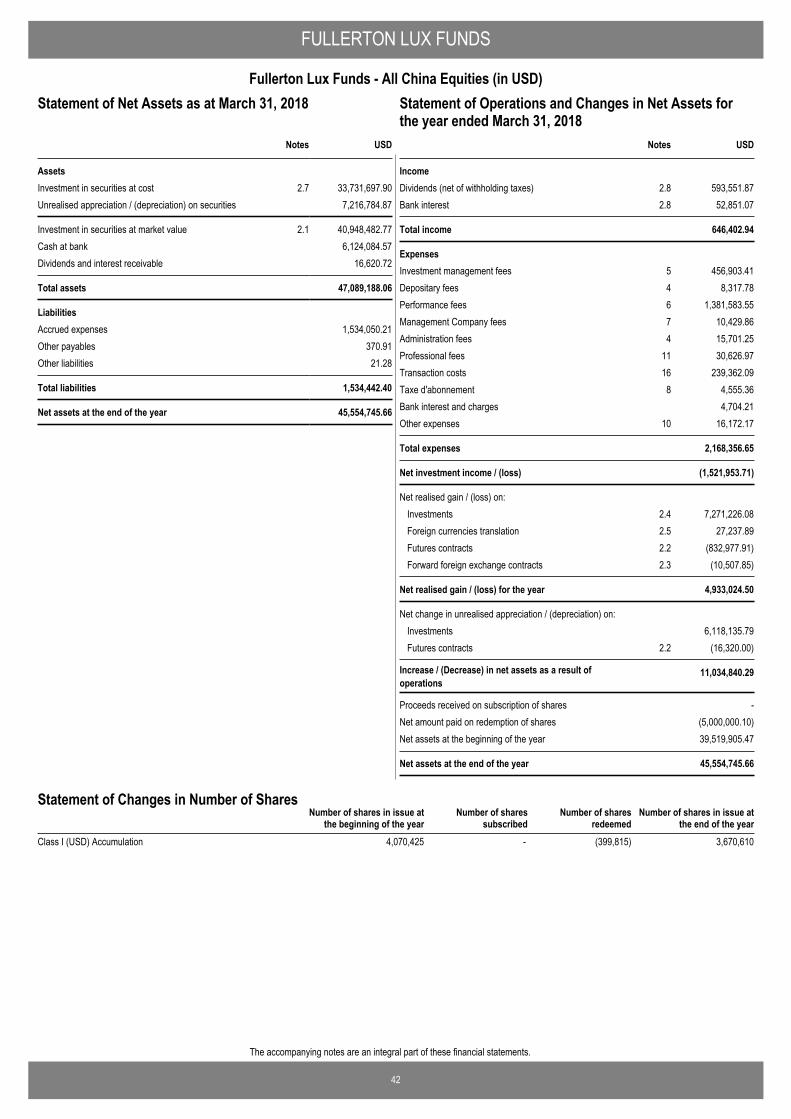
42
The accompanying notes are an integral part of these financial statements.
FULLERTON LUX FUNDS
Fullerton Lux Funds - All China Equities (in USD)Statement of Operations and Changes in Net Assets for theyear ended March 31, 2018
USD
AssetsInvestment in securities at cost 2.7 33,731,697.90Unrealised appreciation / (depreciation) on securities 7,216,784.87
Investment in securities at market value 2.1 40,948,482.77Cash at bank 6,124,084.57Dividends and interest receivable 16,620.72
Total assets 47,089,188.06
LiabilitiesAccrued expenses 1,534,050.21Other payables 370.91Other liabilities 21.28
Total liabilities 1,534,442.40
Net assets at the end of the year 45,554,745.66
Notes
Statement of Net Assets as at March 31, 2018
IncomeDividends (net of withholding taxes) 2.8 593,551.87Bank interest 2.8 52,851.07
Total income 646,402.94
ExpensesInvestment management fees 5 456,903.41Depositary fees 4 8,317.78Performance fees 6 1,381,583.55Management Company fees 7 10,429.86Administration fees 4 15,701.25Professional fees 11 30,626.97Transaction costs 16 239,362.09Taxe d'abonnement 8 4,555.36Bank interest and charges 4,704.21Other expenses 10 16,172.17
Total expenses 2,168,356.65
Net investment income / (loss) (1,521,953.71)
Net realised gain / (loss) on: Investments 2.4 7,271,226.08Foreign currencies translation 2.5 27,237.89Futures contracts 2.2 (832,977.91)Forward foreign exchange contracts 2.3 (10,507.85)
Net realised gain / (loss) for the year 4,933,024.50
Net change in unrealised appreciation / (depreciation) on: Investments 6,118,135.79Futures contracts 2.2 (16,320.00)
Increase / (Decrease) in net assets as a result ofoperations
11,034,840.29
Proceeds received on subscription of shares -Net amount paid on redemption of shares (5,000,000.10)Net assets at the beginning of the year 39,519,905.47
Net assets at the end of the year 45,554,745.66
USDNotes
Statement of Operations and Changes in Net Assets forthe year ended March 31, 2018
Number of shares in issue atthe end of the year
Number of shares in issue atthe beginning of the year
Number of sharessubscribed
Number of sharesredeemed
Statement of Changes in Number of Shares
Class I (USD) Accumulation 4,070,425 - (399,815) 3,670,610
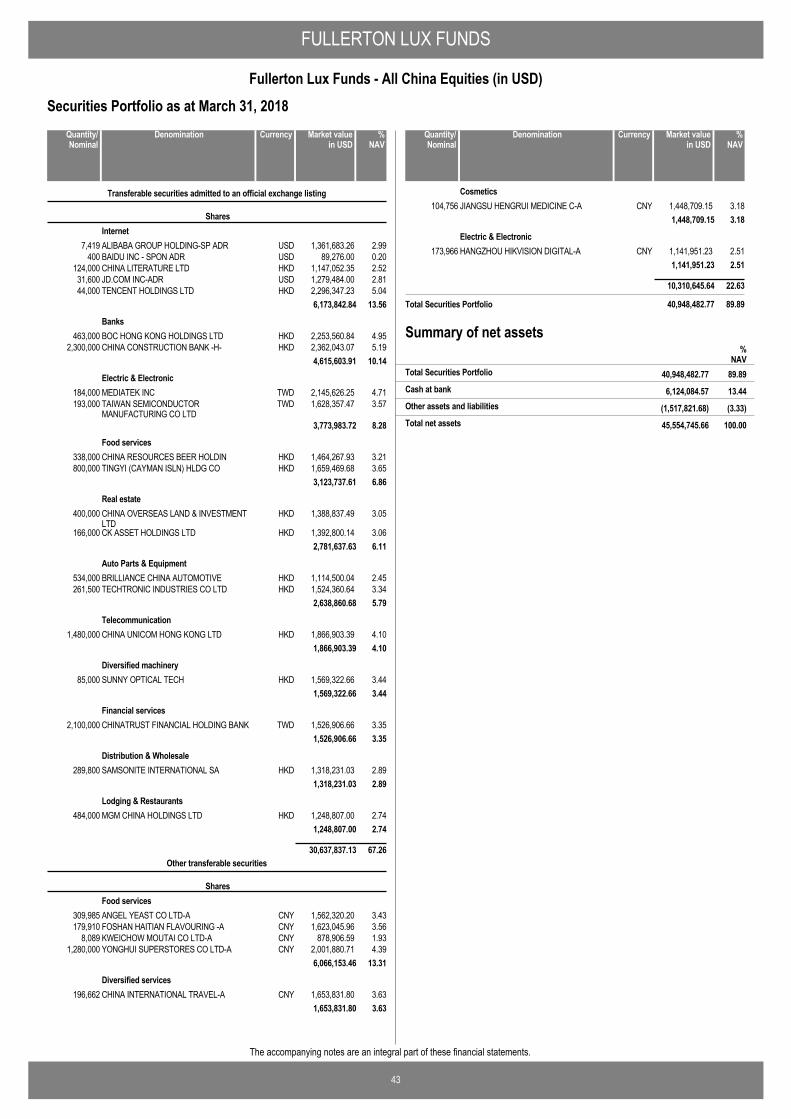
FULLERTON LUX FUNDS
43
Fullerton Lux Funds - All China Equities (in USD)
The accompanying notes are an integral part of these financial statements.
Securities Portfolio as at March 31, 2018
ALIBABA GROUP HOLDING-SP ADR USD 1,361,683.26 2.997,419
Transferable securities admitted to an official exchange listing
SharesInternet
BAIDU INC - SPON ADR USD 89,276.00 0.20400CHINA LITERATURE LTD HKD 1,147,052.35 2.52124,000JD.COM INC-ADR USD 1,279,484.00 2.8131,600TENCENT HOLDINGS LTD HKD 2,296,347.23 5.0444,000
6,173,842.84 13.56
BOC HONG KONG HOLDINGS LTD HKD 2,253,560.84 4.95463,000Banks
CHINA CONSTRUCTION BANK -H- HKD 2,362,043.07 5.192,300,0004,615,603.91 10.14
MEDIATEK INC TWD 2,145,626.25 4.71184,000Electric & Electronic
TAIWAN SEMICONDUCTORMANUFACTURING CO LTD
TWD 1,628,357.47 3.57193,000
3,773,983.72 8.28
CHINA RESOURCES BEER HOLDIN HKD 1,464,267.93 3.21338,000Food services
TINGYI (CAYMAN ISLN) HLDG CO HKD 1,659,469.68 3.65800,0003,123,737.61 6.86
CHINA OVERSEAS LAND & INVESTMENTLTD
HKD 1,388,837.49 3.05400,000Real estate
CK ASSET HOLDINGS LTD HKD 1,392,800.14 3.06166,0002,781,637.63 6.11
BRILLIANCE CHINA AUTOMOTIVE HKD 1,114,500.04 2.45534,000Auto Parts & Equipment
TECHTRONIC INDUSTRIES CO LTD HKD 1,524,360.64 3.34261,5002,638,860.68 5.79
CHINA UNICOM HONG KONG LTD HKD 1,866,903.39 4.101,480,000Telecommunication
1,866,903.39 4.10
SUNNY OPTICAL TECH HKD 1,569,322.66 3.4485,000Diversified machinery
1,569,322.66 3.44
CHINATRUST FINANCIAL HOLDING BANK TWD 1,526,906.66 3.352,100,000Financial services
1,526,906.66 3.35
SAMSONITE INTERNATIONAL SA HKD 1,318,231.03 2.89289,800Distribution & Wholesale
1,318,231.03 2.89
MGM CHINA HOLDINGS LTD HKD 1,248,807.00 2.74484,000Lodging & Restaurants
1,248,807.00 2.74
30,637,837.13 67.26
ANGEL YEAST CO LTD-A CNY 1,562,320.20 3.43309,985
Other transferable securities
SharesFood services
FOSHAN HAITIAN FLAVOURING -A CNY 1,623,045.96 3.56179,910KWEICHOW MOUTAI CO LTD-A CNY 878,906.59 1.938,089YONGHUI SUPERSTORES CO LTD-A CNY 2,001,880.71 4.391,280,000
6,066,153.46 13.31
CHINA INTERNATIONAL TRAVEL-A CNY 1,653,831.80 3.63196,662Diversified services
1,653,831.80 3.63
DenominationQuantity/Nominal
Market valuein USD
Currency %NAV
JIANGSU HENGRUI MEDICINE C-A CNY 1,448,709.15 3.18104,756Cosmetics
1,448,709.15 3.18
HANGZHOU HIKVISION DIGITAL-A CNY 1,141,951.23 2.51173,966Electric & Electronic
1,141,951.23 2.51
10,310,645.64 22.63
Total Securities Portfolio 40,948,482.77 89.89
DenominationQuantity/Nominal
Market valuein USD
Currency %NAV
Summary of net assets%
NAV40,948,482.77 89.89Total Securities Portfolio
6,124,084.57 13.44Cash at bank
(1,517,821.68) (3.33)Other assets and liabilities
45,554,745.66 100.00Total net assets
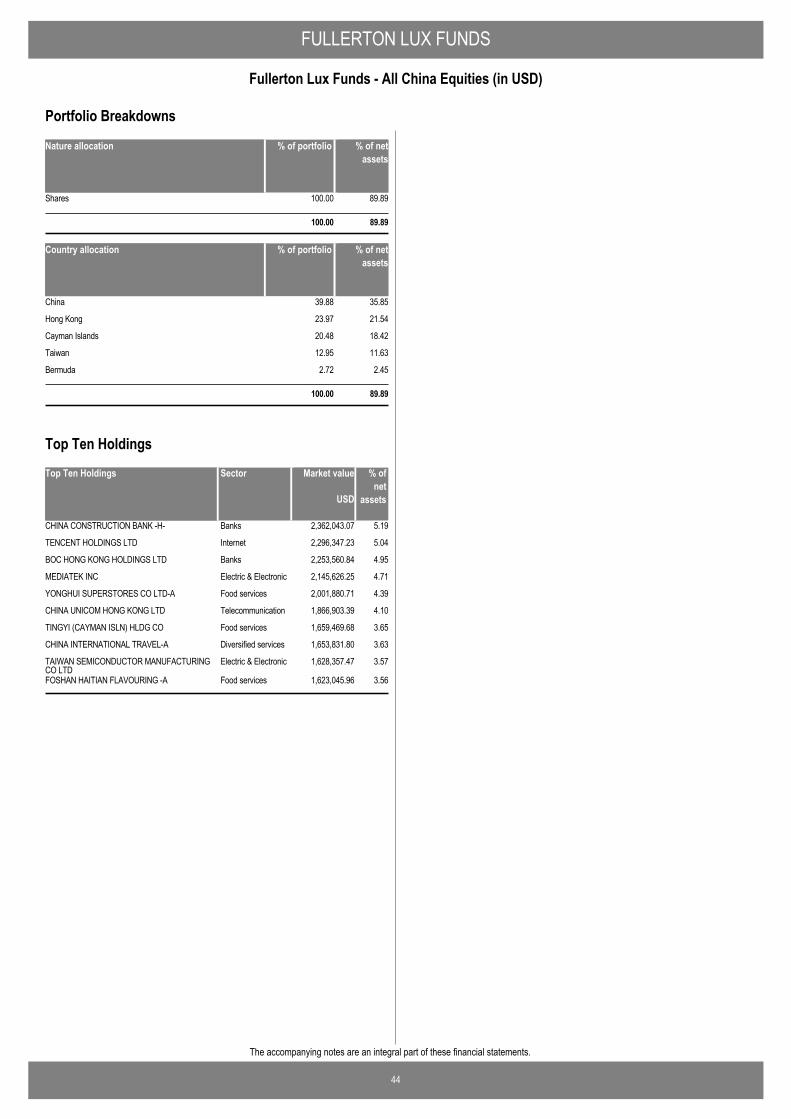
FULLERTON LUX FUNDS
44
Fullerton Lux Funds - All China Equities (in USD)
The accompanying notes are an integral part of these financial statements.
Nature allocation % of portfolio % of netassets
Shares 100.00 89.89
100.00 89.89
Country allocation % of portfolio % of netassets
China 39.88 35.85
Hong Kong 23.97 21.54
Cayman Islands 20.48 18.42
Taiwan 12.95 11.63
Bermuda 2.72 2.45
100.00 89.89
Portfolio Breakdowns
Top Ten Holdings Market value % ofnet
assets
CHINA CONSTRUCTION BANK -H- 2,362,043.07 5.19Banks
TENCENT HOLDINGS LTD 2,296,347.23 5.04Internet
BOC HONG KONG HOLDINGS LTD 2,253,560.84 4.95Banks
MEDIATEK INC 2,145,626.25 4.71Electric & Electronic
YONGHUI SUPERSTORES CO LTD-A 2,001,880.71 4.39Food services
CHINA UNICOM HONG KONG LTD 1,866,903.39 4.10Telecommunication
TINGYI (CAYMAN ISLN) HLDG CO 1,659,469.68 3.65Food services
CHINA INTERNATIONAL TRAVEL-A 1,653,831.80 3.63Diversified services
TAIWAN SEMICONDUCTOR MANUFACTURINGCO LTD
1,628,357.47 3.57Electric & Electronic
FOSHAN HAITIAN FLAVOURING -A 1,623,045.96 3.56Food services
USD
Sector
Top Ten Holdings
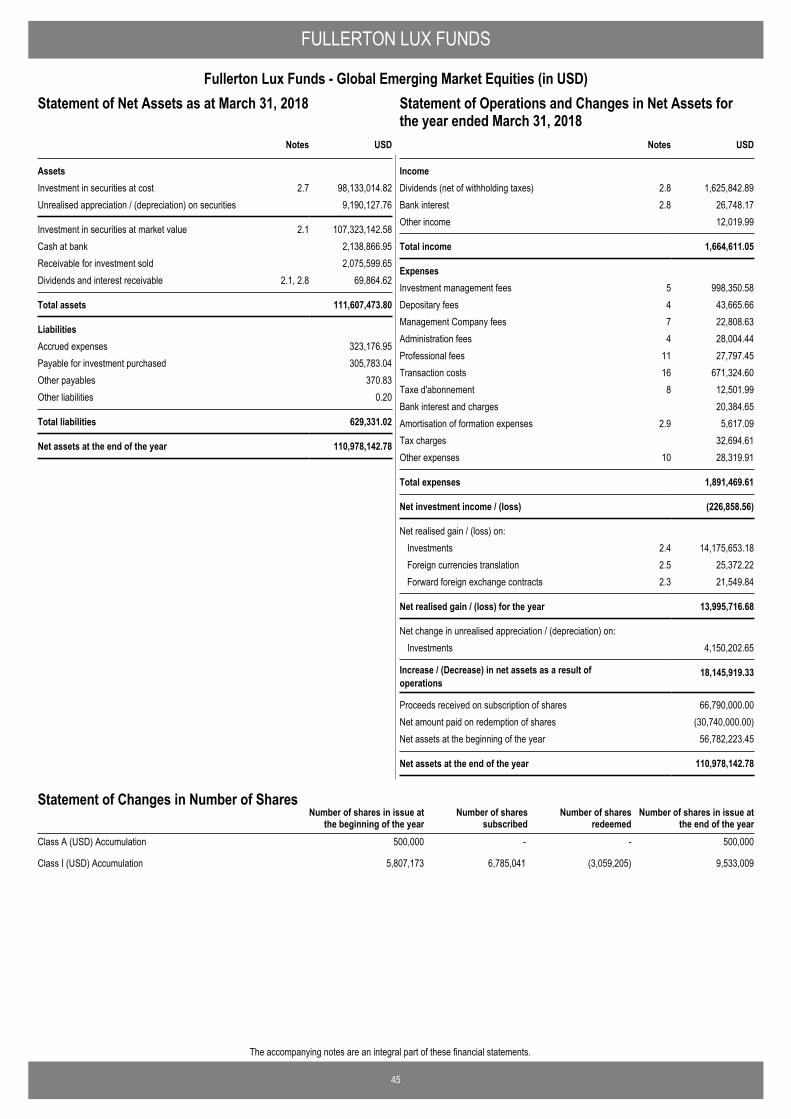
45
The accompanying notes are an integral part of these financial statements.
FULLERTON LUX FUNDS
Fullerton Lux Funds - Global Emerging Market Equities (in USD)Statement of Operations and Changes in Net Assets for theyear ended March 31, 2018
USD
AssetsInvestment in securities at cost 2.7 98,133,014.82Unrealised appreciation / (depreciation) on securities 9,190,127.76
Investment in securities at market value 2.1 107,323,142.58Cash at bank 2,138,866.95Receivable for investment sold 2,075,599.65Dividends and interest receivable 2.1, 2.8 69,864.62
Total assets 111,607,473.80
LiabilitiesAccrued expenses 323,176.95Payable for investment purchased 305,783.04Other payables 370.83Other liabilities 0.20
Total liabilities 629,331.02
Net assets at the end of the year 110,978,142.78
Notes
Statement of Net Assets as at March 31, 2018
IncomeDividends (net of withholding taxes) 2.8 1,625,842.89Bank interest 2.8 26,748.17Other income 12,019.99
Total income 1,664,611.05
ExpensesInvestment management fees 5 998,350.58Depositary fees 4 43,665.66Management Company fees 7 22,808.63Administration fees 4 28,004.44Professional fees 11 27,797.45Transaction costs 16 671,324.60Taxe d'abonnement 8 12,501.99Bank interest and charges 20,384.65Amortisation of formation expenses 2.9 5,617.09Tax charges 32,694.61Other expenses 10 28,319.91
Total expenses 1,891,469.61
Net investment income / (loss) (226,858.56)
Net realised gain / (loss) on: Investments 2.4 14,175,653.18Foreign currencies translation 2.5 25,372.22Forward foreign exchange contracts 2.3 21,549.84
Net realised gain / (loss) for the year 13,995,716.68
Net change in unrealised appreciation / (depreciation) on: Investments 4,150,202.65
Increase / (Decrease) in net assets as a result ofoperations
18,145,919.33
Proceeds received on subscription of shares 66,790,000.00Net amount paid on redemption of shares (30,740,000.00)Net assets at the beginning of the year 56,782,223.45
Net assets at the end of the year 110,978,142.78
USDNotes
Statement of Operations and Changes in Net Assets forthe year ended March 31, 2018
Number of shares in issue atthe end of the year
Number of shares in issue atthe beginning of the year
Number of sharessubscribed
Number of sharesredeemed
Statement of Changes in Number of Shares
Class A (USD) Accumulation 500,000 - - 500,000
Class I (USD) Accumulation 5,807,173 6,785,041 (3,059,205) 9,533,009
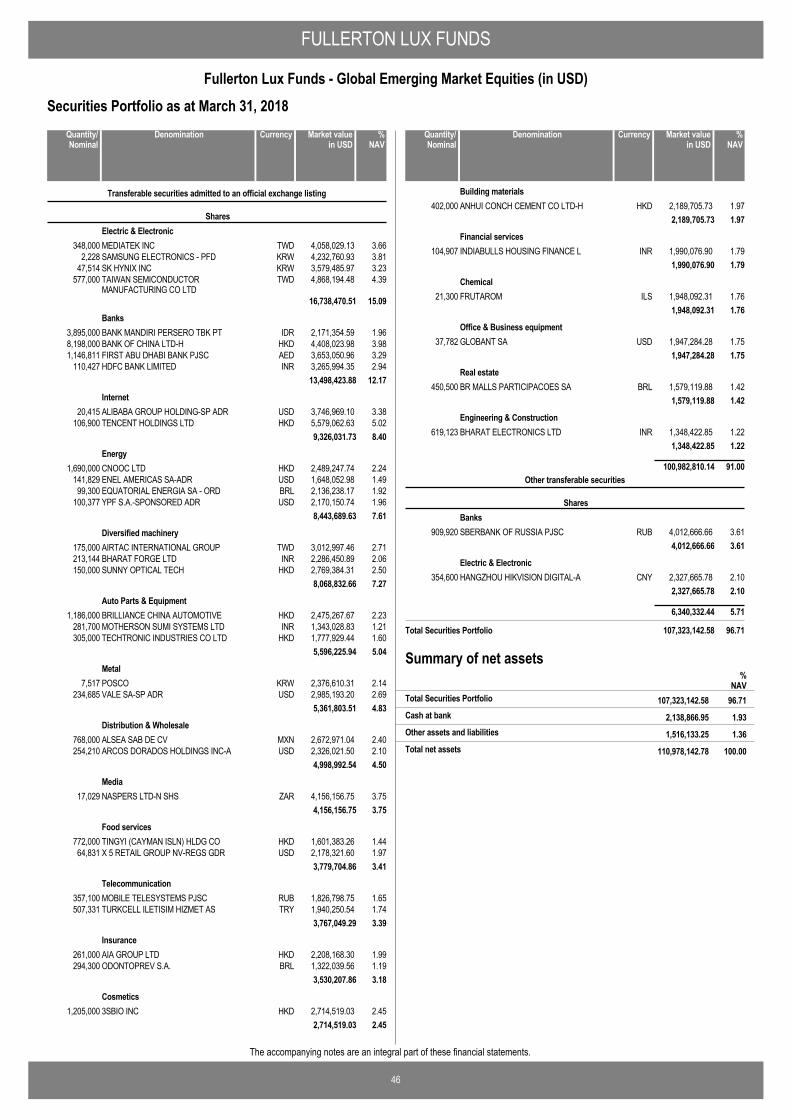
FULLERTON LUX FUNDS
46
Fullerton Lux Funds - Global Emerging Market Equities (in USD)
The accompanying notes are an integral part of these financial statements.
Securities Portfolio as at March 31, 2018
MEDIATEK INC TWD 4,058,029.13 3.66348,000
Transferable securities admitted to an official exchange listing
SharesElectric & Electronic
SAMSUNG ELECTRONICS - PFD KRW 4,232,760.93 3.812,228SK HYNIX INC KRW 3,579,485.97 3.2347,514TAIWAN SEMICONDUCTORMANUFACTURING CO LTD
TWD 4,868,194.48 4.39577,000
16,738,470.51 15.09
BANK MANDIRI PERSERO TBK PT IDR 2,171,354.59 1.963,895,000Banks
BANK OF CHINA LTD-H HKD 4,408,023.98 3.988,198,000FIRST ABU DHABI BANK PJSC AED 3,653,050.96 3.291,146,811HDFC BANK LIMITED INR 3,265,994.35 2.94110,427
13,498,423.88 12.17
ALIBABA GROUP HOLDING-SP ADR USD 3,746,969.10 3.3820,415Internet
TENCENT HOLDINGS LTD HKD 5,579,062.63 5.02106,9009,326,031.73 8.40
CNOOC LTD HKD 2,489,247.74 2.241,690,000Energy
ENEL AMERICAS SA-ADR USD 1,648,052.98 1.49141,829EQUATORIAL ENERGIA SA - ORD BRL 2,136,238.17 1.9299,300YPF S.A.-SPONSORED ADR USD 2,170,150.74 1.96100,377
8,443,689.63 7.61
AIRTAC INTERNATIONAL GROUP TWD 3,012,997.46 2.71175,000Diversified machinery
BHARAT FORGE LTD INR 2,286,450.89 2.06213,144SUNNY OPTICAL TECH HKD 2,769,384.31 2.50150,000
8,068,832.66 7.27
BRILLIANCE CHINA AUTOMOTIVE HKD 2,475,267.67 2.231,186,000Auto Parts & Equipment
MOTHERSON SUMI SYSTEMS LTD INR 1,343,028.83 1.21281,700TECHTRONIC INDUSTRIES CO LTD HKD 1,777,929.44 1.60305,000
5,596,225.94 5.04
POSCO KRW 2,376,610.31 2.147,517Metal
VALE SA-SP ADR USD 2,985,193.20 2.69234,6855,361,803.51 4.83
ALSEA SAB DE CV MXN 2,672,971.04 2.40768,000Distribution & Wholesale
ARCOS DORADOS HOLDINGS INC-A USD 2,326,021.50 2.10254,2104,998,992.54 4.50
NASPERS LTD-N SHS ZAR 4,156,156.75 3.7517,029Media
4,156,156.75 3.75
TINGYI (CAYMAN ISLN) HLDG CO HKD 1,601,383.26 1.44772,000Food services
X 5 RETAIL GROUP NV-REGS GDR USD 2,178,321.60 1.9764,8313,779,704.86 3.41
MOBILE TELESYSTEMS PJSC RUB 1,826,798.75 1.65357,100Telecommunication
TURKCELL ILETISIM HIZMET AS TRY 1,940,250.54 1.74507,3313,767,049.29 3.39
AIA GROUP LTD HKD 2,208,168.30 1.99261,000Insurance
ODONTOPREV S.A. BRL 1,322,039.56 1.19294,3003,530,207.86 3.18
3SBIO INC HKD 2,714,519.03 2.451,205,000Cosmetics
2,714,519.03 2.45
DenominationQuantity/Nominal
Market valuein USD
Currency %NAV
ANHUI CONCH CEMENT CO LTD-H HKD 2,189,705.73 1.97402,000Building materials
2,189,705.73 1.97
INDIABULLS HOUSING FINANCE L INR 1,990,076.90 1.79104,907Financial services
1,990,076.90 1.79
FRUTAROM ILS 1,948,092.31 1.7621,300Chemical
1,948,092.31 1.76
GLOBANT SA USD 1,947,284.28 1.7537,782Office & Business equipment
1,947,284.28 1.75
BR MALLS PARTICIPACOES SA BRL 1,579,119.88 1.42450,500Real estate
1,579,119.88 1.42
BHARAT ELECTRONICS LTD INR 1,348,422.85 1.22619,123Engineering & Construction
1,348,422.85 1.22
100,982,810.14 91.00
SBERBANK OF RUSSIA PJSC RUB 4,012,666.66 3.61909,920
Other transferable securities
SharesBanks
4,012,666.66 3.61
HANGZHOU HIKVISION DIGITAL-A CNY 2,327,665.78 2.10354,600Electric & Electronic
2,327,665.78 2.10
6,340,332.44 5.71
Total Securities Portfolio 107,323,142.58 96.71
DenominationQuantity/Nominal
Market valuein USD
Currency %NAV
Summary of net assets%
NAV107,323,142.58 96.71Total Securities Portfolio
2,138,866.95 1.93Cash at bank
1,516,133.25 1.36Other assets and liabilities
110,978,142.78 100.00Total net assets
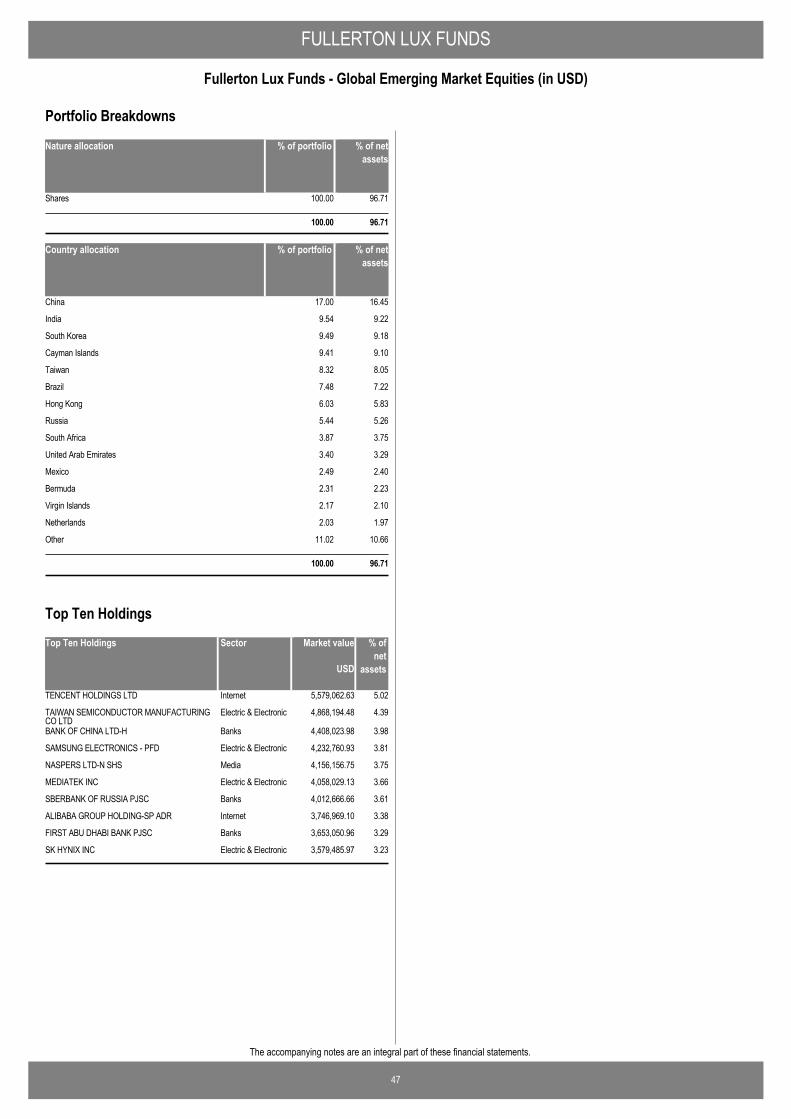
FULLERTON LUX FUNDS
47
Fullerton Lux Funds - Global Emerging Market Equities (in USD)
The accompanying notes are an integral part of these financial statements.
Nature allocation % of portfolio % of netassets
Shares 100.00 96.71
100.00 96.71
Country allocation % of portfolio % of netassets
China 17.00 16.45
India 9.54 9.22
South Korea 9.49 9.18
Cayman Islands 9.41 9.10
Taiwan 8.32 8.05
Brazil 7.48 7.22
Hong Kong 6.03 5.83
Russia 5.44 5.26
South Africa 3.87 3.75
United Arab Emirates 3.40 3.29
Mexico 2.49 2.40
Bermuda 2.31 2.23
Virgin Islands 2.17 2.10
Netherlands 2.03 1.97
Other 11.02 10.66
100.00 96.71
Portfolio Breakdowns
Top Ten Holdings Market value % ofnet
assets
TENCENT HOLDINGS LTD 5,579,062.63 5.02Internet
TAIWAN SEMICONDUCTOR MANUFACTURINGCO LTD
4,868,194.48 4.39Electric & Electronic
BANK OF CHINA LTD-H 4,408,023.98 3.98Banks
SAMSUNG ELECTRONICS - PFD 4,232,760.93 3.81Electric & Electronic
NASPERS LTD-N SHS 4,156,156.75 3.75Media
MEDIATEK INC 4,058,029.13 3.66Electric & Electronic
SBERBANK OF RUSSIA PJSC 4,012,666.66 3.61Banks
ALIBABA GROUP HOLDING-SP ADR 3,746,969.10 3.38Internet
FIRST ABU DHABI BANK PJSC 3,653,050.96 3.29Banks
SK HYNIX INC 3,579,485.97 3.23Electric & Electronic
USD
Sector
Top Ten Holdings
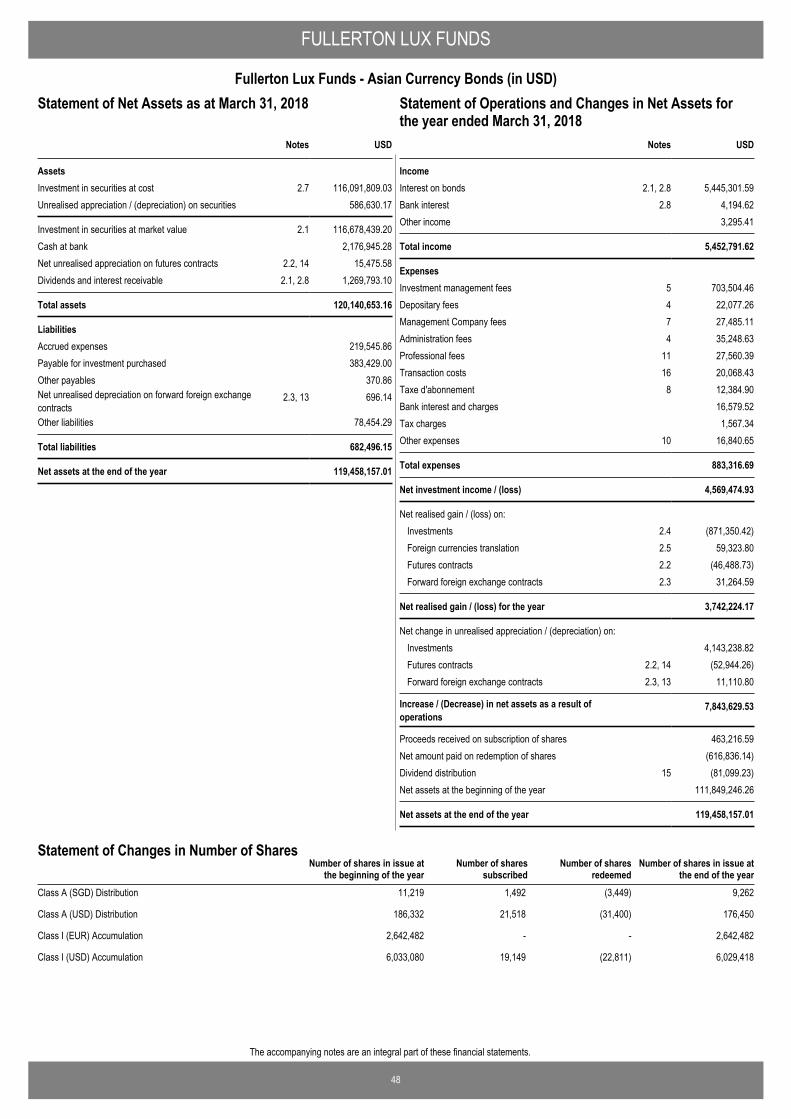
48
The accompanying notes are an integral part of these financial statements.
FULLERTON LUX FUNDS
Fullerton Lux Funds - Asian Currency Bonds (in USD)Statement of Operations and Changes in Net Assets for theyear ended March 31, 2018
USD
AssetsInvestment in securities at cost 2.7 116,091,809.03Unrealised appreciation / (depreciation) on securities 586,630.17
Investment in securities at market value 2.1 116,678,439.20Cash at bank 2,176,945.28Net unrealised appreciation on futures contracts 2.2, 14 15,475.58Dividends and interest receivable 2.1, 2.8 1,269,793.10
Total assets 120,140,653.16
LiabilitiesAccrued expenses 219,545.86Payable for investment purchased 383,429.00Other payables 370.86Net unrealised depreciation on forward foreign exchangecontracts
2.3, 13 696.14
Other liabilities 78,454.29
Total liabilities 682,496.15
Net assets at the end of the year 119,458,157.01
Notes
Statement of Net Assets as at March 31, 2018
IncomeInterest on bonds 2.1, 2.8 5,445,301.59Bank interest 2.8 4,194.62Other income 3,295.41
Total income 5,452,791.62
ExpensesInvestment management fees 5 703,504.46Depositary fees 4 22,077.26Management Company fees 7 27,485.11Administration fees 4 35,248.63Professional fees 11 27,560.39Transaction costs 16 20,068.43Taxe d'abonnement 8 12,384.90Bank interest and charges 16,579.52Tax charges 1,567.34Other expenses 10 16,840.65
Total expenses 883,316.69
Net investment income / (loss) 4,569,474.93
Net realised gain / (loss) on: Investments 2.4 (871,350.42)Foreign currencies translation 2.5 59,323.80Futures contracts 2.2 (46,488.73)Forward foreign exchange contracts 2.3 31,264.59
Net realised gain / (loss) for the year 3,742,224.17
Net change in unrealised appreciation / (depreciation) on: Investments 4,143,238.82Futures contracts 2.2, 14 (52,944.26)Forward foreign exchange contracts 2.3, 13 11,110.80
Increase / (Decrease) in net assets as a result ofoperations
7,843,629.53
Proceeds received on subscription of shares 463,216.59Net amount paid on redemption of shares (616,836.14)Dividend distribution 15 (81,099.23)Net assets at the beginning of the year 111,849,246.26
Net assets at the end of the year 119,458,157.01
USDNotes
Statement of Operations and Changes in Net Assets forthe year ended March 31, 2018
Number of shares in issue atthe end of the year
Number of shares in issue atthe beginning of the year
Number of sharessubscribed
Number of sharesredeemed
Statement of Changes in Number of Shares
Class A (SGD) Distribution 11,219 1,492 (3,449) 9,262
Class A (USD) Distribution 186,332 21,518 (31,400) 176,450
Class I (EUR) Accumulation 2,642,482 - - 2,642,482
Class I (USD) Accumulation 6,033,080 19,149 (22,811) 6,029,418
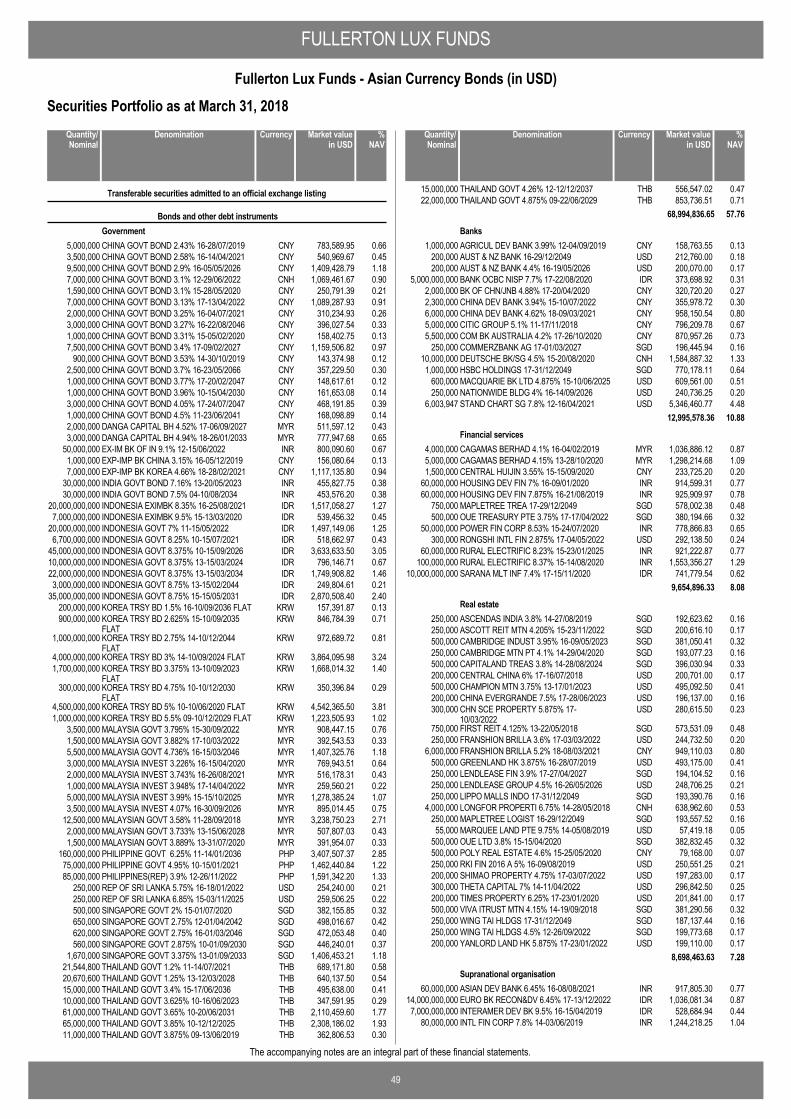
FULLERTON LUX FUNDS
49
Fullerton Lux Funds - Asian Currency Bonds (in USD)
The accompanying notes are an integral part of these financial statements.
Securities Portfolio as at March 31, 2018
CHINA GOVT BOND 2.43% 16-28/07/2019 CNY 783,589.95 0.665,000,000
Transferable securities admitted to an official exchange listing
Bonds and other debt instrumentsGovernment
CHINA GOVT BOND 2.58% 16-14/04/2021 CNY 540,969.67 0.453,500,000CHINA GOVT BOND 2.9% 16-05/05/2026 CNY 1,409,428.79 1.189,500,000CHINA GOVT BOND 3.1% 12-29/06/2022 CNH 1,069,461.67 0.907,000,000CHINA GOVT BOND 3.1% 15-28/05/2020 CNY 250,791.39 0.211,590,000CHINA GOVT BOND 3.13% 17-13/04/2022 CNY 1,089,287.93 0.917,000,000CHINA GOVT BOND 3.25% 16-04/07/2021 CNY 310,234.93 0.262,000,000CHINA GOVT BOND 3.27% 16-22/08/2046 CNY 396,027.54 0.333,000,000CHINA GOVT BOND 3.31% 15-05/02/2020 CNY 158,402.75 0.131,000,000CHINA GOVT BOND 3.4% 17-09/02/2027 CNY 1,159,506.82 0.977,500,000CHINA GOVT BOND 3.53% 14-30/10/2019 CNY 143,374.98 0.12900,000CHINA GOVT BOND 3.7% 16-23/05/2066 CNY 357,229.50 0.302,500,000CHINA GOVT BOND 3.77% 17-20/02/2047 CNY 148,617.61 0.121,000,000CHINA GOVT BOND 3.96% 10-15/04/2030 CNY 161,653.08 0.141,000,000CHINA GOVT BOND 4.05% 17-24/07/2047 CNY 468,191.85 0.393,000,000CHINA GOVT BOND 4.5% 11-23/06/2041 CNY 168,098.89 0.141,000,000DANGA CAPITAL BH 4.52% 17-06/09/2027 MYR 511,597.12 0.432,000,000DANGA CAPITAL BH 4.94% 18-26/01/2033 MYR 777,947.68 0.653,000,000EX-IM BK OF IN 9.1% 12-15/06/2022 INR 800,090.60 0.6750,000,000EXP-IMP BK CHINA 3.15% 16-05/12/2019 CNY 156,080.64 0.131,000,000EXP-IMP BK KOREA 4.66% 18-28/02/2021 CNY 1,117,135.80 0.947,000,000INDIA GOVT BOND 7.16% 13-20/05/2023 INR 455,827.75 0.3830,000,000INDIA GOVT BOND 7.5% 04-10/08/2034 INR 453,576.20 0.3830,000,000INDONESIA EXIMBK 8.35% 16-25/08/2021 IDR 1,517,058.27 1.2720,000,000,000INDONESIA EXIMBK 9.5% 15-13/03/2020 IDR 539,456.32 0.457,000,000,000INDONESIA GOVT 7% 11-15/05/2022 IDR 1,497,149.06 1.2520,000,000,000INDONESIA GOVT 8.25% 10-15/07/2021 IDR 518,662.97 0.436,700,000,000INDONESIA GOVT 8.375% 10-15/09/2026 IDR 3,633,633.50 3.0545,000,000,000INDONESIA GOVT 8.375% 13-15/03/2024 IDR 796,146.71 0.6710,000,000,000INDONESIA GOVT 8.375% 13-15/03/2034 IDR 1,749,908.82 1.4622,000,000,000INDONESIA GOVT 8.75% 13-15/02/2044 IDR 249,804.61 0.213,000,000,000INDONESIA GOVT 8.75% 15-15/05/2031 IDR 2,870,508.40 2.4035,000,000,000KOREA TRSY BD 1.5% 16-10/09/2036 FLAT KRW 157,391.87 0.13200,000,000KOREA TRSY BD 2.625% 15-10/09/2035FLAT
KRW 846,784.39 0.71900,000,000
KOREA TRSY BD 2.75% 14-10/12/2044FLAT
KRW 972,689.72 0.811,000,000,000
KOREA TRSY BD 3% 14-10/09/2024 FLAT KRW 3,864,095.98 3.244,000,000,000KOREA TRSY BD 3.375% 13-10/09/2023FLAT
KRW 1,668,014.32 1.401,700,000,000
KOREA TRSY BD 4.75% 10-10/12/2030FLAT
KRW 350,396.84 0.29300,000,000
KOREA TRSY BD 5% 10-10/06/2020 FLAT KRW 4,542,365.50 3.814,500,000,000KOREA TRSY BD 5.5% 09-10/12/2029 FLAT KRW 1,223,505.93 1.021,000,000,000MALAYSIA GOVT 3.795% 15-30/09/2022 MYR 908,447.15 0.763,500,000MALAYSIA GOVT 3.882% 17-10/03/2022 MYR 392,543.53 0.331,500,000MALAYSIA GOVT 4.736% 16-15/03/2046 MYR 1,407,325.76 1.185,500,000MALAYSIA INVEST 3.226% 16-15/04/2020 MYR 769,943.51 0.643,000,000MALAYSIA INVEST 3.743% 16-26/08/2021 MYR 516,178.31 0.432,000,000MALAYSIA INVEST 3.948% 17-14/04/2022 MYR 259,560.21 0.221,000,000MALAYSIA INVEST 3.99% 15-15/10/2025 MYR 1,278,385.24 1.075,000,000MALAYSIA INVEST 4.07% 16-30/09/2026 MYR 895,014.45 0.753,500,000MALAYSIAN GOVT 3.58% 11-28/09/2018 MYR 3,238,750.23 2.7112,500,000MALAYSIAN GOVT 3.733% 13-15/06/2028 MYR 507,807.03 0.432,000,000MALAYSIAN GOVT 3.889% 13-31/07/2020 MYR 391,954.07 0.331,500,000PHILIPPINE GOVT 6.25% 11-14/01/2036 PHP 3,407,507.37 2.85160,000,000PHILIPPINE GOVT 4.95% 10-15/01/2021 PHP 1,462,440.84 1.2275,000,000PHILIPPINES(REP) 3.9% 12-26/11/2022 PHP 1,591,342.20 1.3385,000,000REP OF SRI LANKA 5.75% 16-18/01/2022 USD 254,240.00 0.21250,000REP OF SRI LANKA 6.85% 15-03/11/2025 USD 259,506.25 0.22250,000SINGAPORE GOVT 2% 15-01/07/2020 SGD 382,155.85 0.32500,000SINGAPORE GOVT 2.75% 12-01/04/2042 SGD 498,016.67 0.42650,000SINGAPORE GOVT 2.75% 16-01/03/2046 SGD 472,053.48 0.40620,000SINGAPORE GOVT 2.875% 10-01/09/2030 SGD 446,240.01 0.37560,000SINGAPORE GOVT 3.375% 13-01/09/2033 SGD 1,406,453.21 1.181,670,000THAILAND GOVT 1.2% 11-14/07/2021 THB 689,171.80 0.5821,544,800THAILAND GOVT 1.25% 13-12/03/2028 THB 640,137.50 0.5420,670,600THAILAND GOVT 3.4% 15-17/06/2036 THB 495,638.00 0.4115,000,000THAILAND GOVT 3.625% 10-16/06/2023 THB 347,591.95 0.2910,000,000THAILAND GOVT 3.65% 10-20/06/2031 THB 2,110,459.60 1.7761,000,000THAILAND GOVT 3.85% 10-12/12/2025 THB 2,308,186.02 1.9365,000,000THAILAND GOVT 3.875% 09-13/06/2019 THB 362,806.53 0.3011,000,000
DenominationQuantity/Nominal
Market valuein USD
Currency %NAV
THAILAND GOVT 4.26% 12-12/12/2037 THB 556,547.02 0.4715,000,000THAILAND GOVT 4.875% 09-22/06/2029 THB 853,736.51 0.7122,000,000
68,994,836.65 57.76
AGRICUL DEV BANK 3.99% 12-04/09/2019 CNY 158,763.55 0.131,000,000Banks
AUST & NZ BANK 16-29/12/2049 USD 212,760.00 0.18200,000AUST & NZ BANK 4.4% 16-19/05/2026 USD 200,070.00 0.17200,000BANK OCBC NISP 7.7% 17-22/08/2020 IDR 373,698.92 0.315,000,000,000BK OF CHN/JNB 4.88% 17-20/04/2020 CNY 320,720.20 0.272,000,000CHINA DEV BANK 3.94% 15-10/07/2022 CNY 355,978.72 0.302,300,000CHINA DEV BANK 4.62% 18-09/03/2021 CNY 958,150.54 0.806,000,000CITIC GROUP 5.1% 11-17/11/2018 CNY 796,209.78 0.675,000,000COM BK AUSTRALIA 4.2% 17-26/10/2020 CNY 870,957.26 0.735,500,000COMMERZBANK AG 17-01/03/2027 SGD 196,445.94 0.16250,000DEUTSCHE BK/SG 4.5% 15-20/08/2020 CNH 1,584,887.32 1.3310,000,000HSBC HOLDINGS 17-31/12/2049 SGD 770,178.11 0.641,000,000MACQUARIE BK LTD 4.875% 15-10/06/2025 USD 609,561.00 0.51600,000NATIONWIDE BLDG 4% 16-14/09/2026 USD 240,736.25 0.20250,000STAND CHART SG 7.8% 12-16/04/2021 USD 5,346,460.77 4.486,003,947
12,995,578.36 10.88
CAGAMAS BERHAD 4.1% 16-04/02/2019 MYR 1,036,886.12 0.874,000,000Financial services
CAGAMAS BERHAD 4.15% 13-28/10/2020 MYR 1,298,214.68 1.095,000,000CENTRAL HUIJIN 3.55% 15-15/09/2020 CNY 233,725.20 0.201,500,000HOUSING DEV FIN 7% 16-09/01/2020 INR 914,599.31 0.7760,000,000HOUSING DEV FIN 7.875% 16-21/08/2019 INR 925,909.97 0.7860,000,000MAPLETREE TREA 17-29/12/2049 SGD 578,002.38 0.48750,000OUE TREASURY PTE 3.75% 17-17/04/2022 SGD 380,194.66 0.32500,000POWER FIN CORP 8.53% 15-24/07/2020 INR 778,866.83 0.6550,000,000RONGSHI INTL FIN 2.875% 17-04/05/2022 USD 292,138.50 0.24300,000RURAL ELECTRIFIC 8.23% 15-23/01/2025 INR 921,222.87 0.7760,000,000RURAL ELECTRIFIC 8.37% 15-14/08/2020 INR 1,553,356.27 1.29100,000,000SARANA MLT INF 7.4% 17-15/11/2020 IDR 741,779.54 0.6210,000,000,000
9,654,896.33 8.08
ASCENDAS INDIA 3.8% 14-27/08/2019 SGD 192,623.62 0.16250,000Real estate
ASCOTT REIT MTN 4.205% 15-23/11/2022 SGD 200,616.10 0.17250,000CAMBRIDGE INDUST 3.95% 16-09/05/2023 SGD 381,050.41 0.32500,000CAMBRIDGE MTN PT 4.1% 14-29/04/2020 SGD 193,077.23 0.16250,000CAPITALAND TREAS 3.8% 14-28/08/2024 SGD 396,030.94 0.33500,000CENTRAL CHINA 6% 17-16/07/2018 USD 200,701.00 0.17200,000CHAMPION MTN 3.75% 13-17/01/2023 USD 495,092.50 0.41500,000CHINA EVERGRANDE 7.5% 17-28/06/2023 USD 196,137.00 0.16200,000CHN SCE PROPERTY 5.875% 17-10/03/2022
USD 280,615.50 0.23300,000
FIRST REIT 4.125% 13-22/05/2018 SGD 573,531.09 0.48750,000FRANSHION BRILLA 3.6% 17-03/03/2022 USD 244,732.50 0.20250,000FRANSHION BRILLA 5.2% 18-08/03/2021 CNY 949,110.03 0.806,000,000GREENLAND HK 3.875% 16-28/07/2019 USD 493,175.00 0.41500,000LENDLEASE FIN 3.9% 17-27/04/2027 SGD 194,104.52 0.16250,000LENDLEASE GROUP 4.5% 16-26/05/2026 USD 248,706.25 0.21250,000LIPPO MALLS INDO 17-31/12/2049 SGD 193,390.76 0.16250,000LONGFOR PROPERTI 6.75% 14-28/05/2018 CNH 638,962.60 0.534,000,000MAPLETREE LOGIST 16-29/12/2049 SGD 193,557.52 0.16250,000MARQUEE LAND PTE 9.75% 14-05/08/2019 USD 57,419.18 0.0555,000OUE LTD 3.8% 15-15/04/2020 SGD 382,832.45 0.32500,000POLY REAL ESTATE 4.6% 15-25/05/2020 CNY 79,168.00 0.07500,000RKI FIN 2016 A 5% 16-09/08/2019 USD 250,551.25 0.21250,000SHIMAO PROPERTY 4.75% 17-03/07/2022 USD 197,283.00 0.17200,000THETA CAPITAL 7% 14-11/04/2022 USD 296,842.50 0.25300,000TIMES PROPERTY 6.25% 17-23/01/2020 USD 201,841.00 0.17200,000VIVA ITRUST MTN 4.15% 14-19/09/2018 SGD 381,290.56 0.32500,000WING TAI HLDGS 17-31/12/2049 SGD 187,137.44 0.16250,000WING TAI HLDGS 4.5% 12-26/09/2022 SGD 199,773.68 0.17250,000YANLORD LAND HK 5.875% 17-23/01/2022 USD 199,110.00 0.17200,000
8,698,463.63 7.28
ASIAN DEV BANK 6.45% 16-08/08/2021 INR 917,805.30 0.7760,000,000Supranational organisation
EURO BK RECON&DV 6.45% 17-13/12/2022 IDR 1,036,081.34 0.8714,000,000,000INTERAMER DEV BK 9.5% 16-15/04/2019 IDR 528,684.94 0.447,000,000,000INTL FIN CORP 7.8% 14-03/06/2019 INR 1,244,218.25 1.0480,000,000
DenominationQuantity/Nominal
Market valuein USD
Currency %NAV
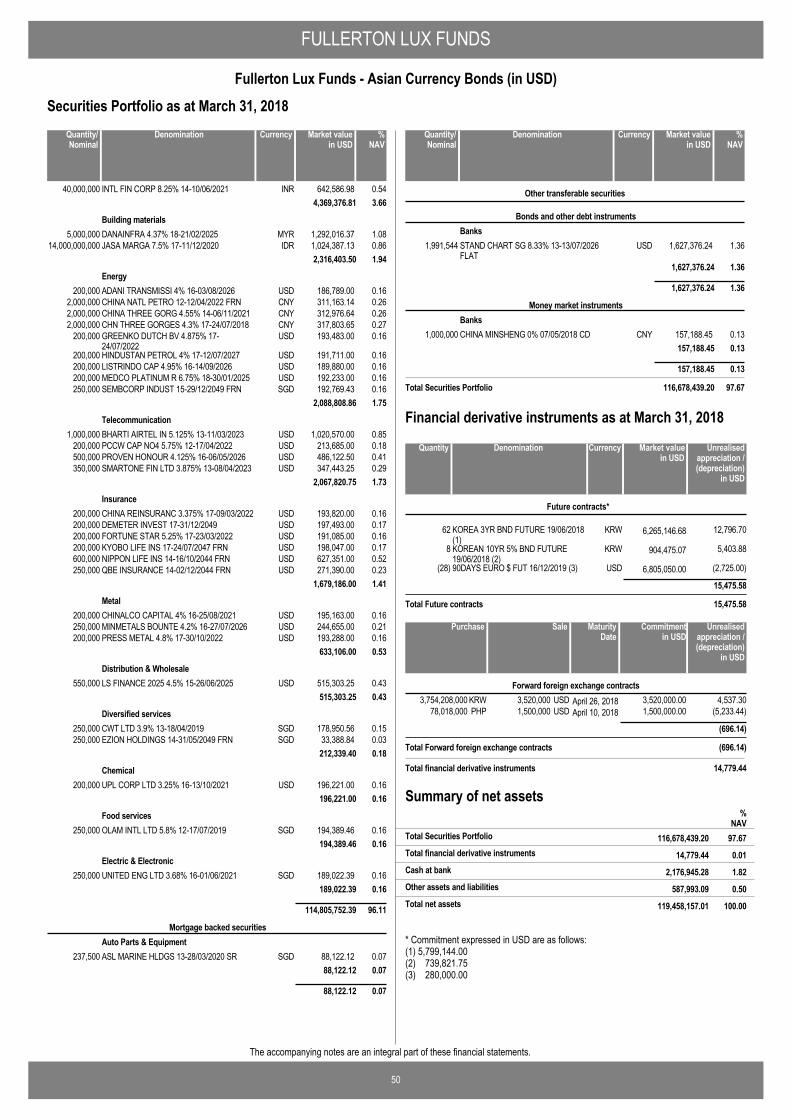
FULLERTON LUX FUNDS
50
Fullerton Lux Funds - Asian Currency Bonds (in USD)
The accompanying notes are an integral part of these financial statements.
Securities Portfolio as at March 31, 2018
INTL FIN CORP 8.25% 14-10/06/2021 INR 642,586.98 0.5440,000,0004,369,376.81 3.66
DANAINFRA 4.37% 18-21/02/2025 MYR 1,292,016.37 1.085,000,000Building materials
JASA MARGA 7.5% 17-11/12/2020 IDR 1,024,387.13 0.8614,000,000,0002,316,403.50 1.94
ADANI TRANSMISSI 4% 16-03/08/2026 USD 186,789.00 0.16200,000Energy
CHINA NATL PETRO 12-12/04/2022 FRN CNY 311,163.14 0.262,000,000CHINA THREE GORG 4.55% 14-06/11/2021 CNY 312,976.64 0.262,000,000CHN THREE GORGES 4.3% 17-24/07/2018 CNY 317,803.65 0.272,000,000GREENKO DUTCH BV 4.875% 17-24/07/2022
USD 193,483.00 0.16200,000
HINDUSTAN PETROL 4% 17-12/07/2027 USD 191,711.00 0.16200,000LISTRINDO CAP 4.95% 16-14/09/2026 USD 189,880.00 0.16200,000MEDCO PLATINUM R 6.75% 18-30/01/2025 USD 192,233.00 0.16200,000SEMBCORP INDUST 15-29/12/2049 FRN SGD 192,769.43 0.16250,000
2,088,808.86 1.75
BHARTI AIRTEL IN 5.125% 13-11/03/2023 USD 1,020,570.00 0.851,000,000Telecommunication
PCCW CAP NO4 5.75% 12-17/04/2022 USD 213,685.00 0.18200,000PROVEN HONOUR 4.125% 16-06/05/2026 USD 486,122.50 0.41500,000SMARTONE FIN LTD 3.875% 13-08/04/2023 USD 347,443.25 0.29350,000
2,067,820.75 1.73
CHINA REINSURANC 3.375% 17-09/03/2022 USD 193,820.00 0.16200,000Insurance
DEMETER INVEST 17-31/12/2049 USD 197,493.00 0.17200,000FORTUNE STAR 5.25% 17-23/03/2022 USD 191,085.00 0.16200,000KYOBO LIFE INS 17-24/07/2047 FRN USD 198,047.00 0.17200,000NIPPON LIFE INS 14-16/10/2044 FRN USD 627,351.00 0.52600,000QBE INSURANCE 14-02/12/2044 FRN USD 271,390.00 0.23250,000
1,679,186.00 1.41
CHINALCO CAPITAL 4% 16-25/08/2021 USD 195,163.00 0.16200,000Metal
MINMETALS BOUNTE 4.2% 16-27/07/2026 USD 244,655.00 0.21250,000PRESS METAL 4.8% 17-30/10/2022 USD 193,288.00 0.16200,000
633,106.00 0.53
LS FINANCE 2025 4.5% 15-26/06/2025 USD 515,303.25 0.43550,000Distribution & Wholesale
515,303.25 0.43
CWT LTD 3.9% 13-18/04/2019 SGD 178,950.56 0.15250,000Diversified services
EZION HOLDINGS 14-31/05/2049 FRN SGD 33,388.84 0.03250,000212,339.40 0.18
UPL CORP LTD 3.25% 16-13/10/2021 USD 196,221.00 0.16200,000Chemical
196,221.00 0.16
OLAM INTL LTD 5.8% 12-17/07/2019 SGD 194,389.46 0.16250,000Food services
194,389.46 0.16
UNITED ENG LTD 3.68% 16-01/06/2021 SGD 189,022.39 0.16250,000Electric & Electronic
189,022.39 0.16
114,805,752.39 96.11
ASL MARINE HLDGS 13-28/03/2020 SR SGD 88,122.12 0.07237,500
Mortgage backed securitiesAuto Parts & Equipment
88,122.12 0.07
88,122.12 0.07
DenominationQuantity/Nominal
Market valuein USD
Currency %NAV
STAND CHART SG 8.33% 13-13/07/2026FLAT
USD 1,627,376.24 1.361,991,544
Other transferable securities
Bonds and other debt instrumentsBanks
1,627,376.24 1.36
1,627,376.24 1.36
CHINA MINSHENG 0% 07/05/2018 CD CNY 157,188.45 0.131,000,000
Money market instrumentsBanks
157,188.45 0.13
157,188.45 0.13
Total Securities Portfolio 116,678,439.20 97.67
DenominationQuantity/Nominal
Market valuein USD
Currency %NAV
KOREA 3YR BND FUTURE 19/06/2018(1)
KRW 6,265,146.6862 12,796.70
Future contracts*
KOREAN 10YR 5% BND FUTURE19/06/2018 (2)
KRW 904,475.078 5,403.88
90DAYS EURO $ FUT 16/12/2019 (3) USD 6,805,050.00(28) (2,725.00)
15,475.58
Total Future contracts 15,475.58
DenominationQuantity Market valuein USD
Currency Unrealisedappreciation /(depreciation)
in USD
Financial derivative instruments as at March 31, 2018
3,520,000 April 26, 20183,754,208,000 4,537.30USDKRW 3,520,000.00Forward foreign exchange contracts
1,500,000 April 10, 201878,018,000 (5,233.44)USDPHP 1,500,000.00
(696.14)
Total Forward foreign exchange contracts (696.14)
SalePurchase Unrealisedappreciation /(depreciation)
in USD
MaturityDate
Commitmentin USD
Total financial derivative instruments 14,779.44
Summary of net assets
14,779.44 0.01Total financial derivative instruments
%NAV
116,678,439.20 97.67Total Securities Portfolio
2,176,945.28 1.82Cash at bank
587,993.09 0.50Other assets and liabilities
119,458,157.01 100.00Total net assets
* Commitment expressed in USD are as follows:(1) 5,799,144.00(2) 739,821.75(3) 280,000.00
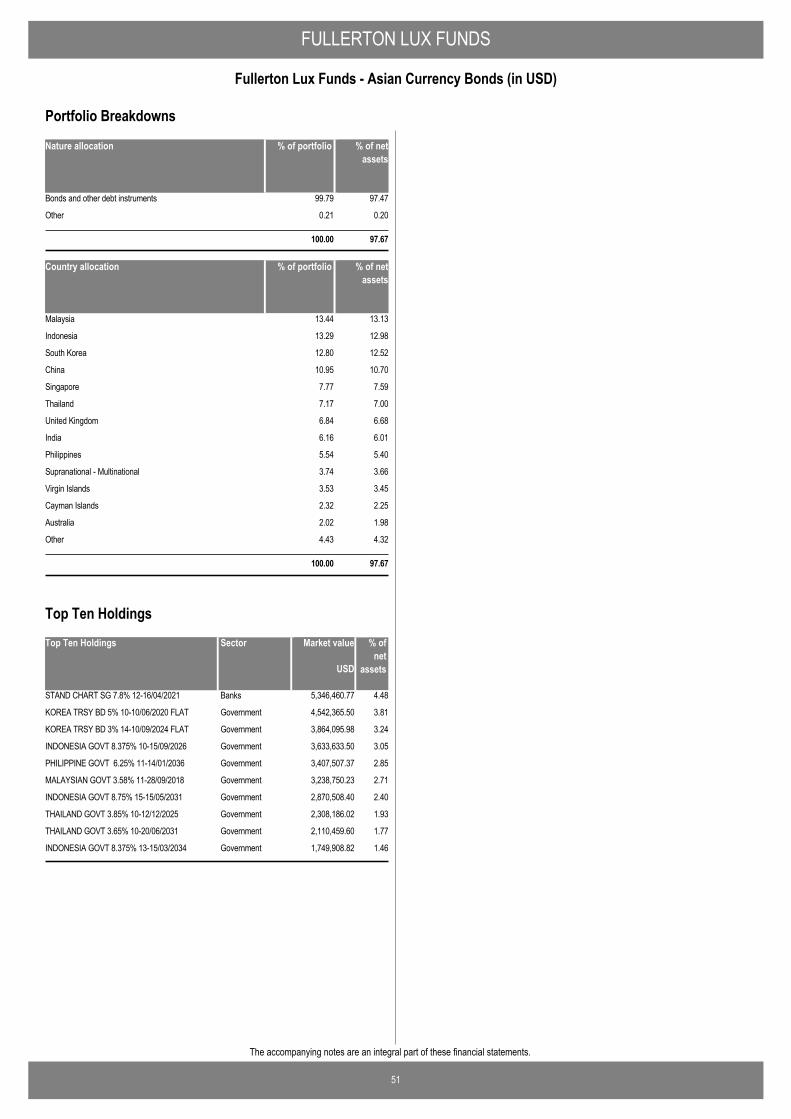
FULLERTON LUX FUNDS
51
Fullerton Lux Funds - Asian Currency Bonds (in USD)
The accompanying notes are an integral part of these financial statements.
Nature allocation % of portfolio % of netassets
Bonds and other debt instruments 99.79 97.47
Other 0.21 0.20
100.00 97.67
Country allocation % of portfolio % of netassets
Malaysia 13.44 13.13
Indonesia 13.29 12.98
South Korea 12.80 12.52
China 10.95 10.70
Singapore 7.77 7.59
Thailand 7.17 7.00
United Kingdom 6.84 6.68
India 6.16 6.01
Philippines 5.54 5.40
Supranational - Multinational 3.74 3.66
Virgin Islands 3.53 3.45
Cayman Islands 2.32 2.25
Australia 2.02 1.98
Other 4.43 4.32
100.00 97.67
Portfolio Breakdowns
Top Ten Holdings Market value % ofnet
assets
STAND CHART SG 7.8% 12-16/04/2021 5,346,460.77 4.48Banks
KOREA TRSY BD 5% 10-10/06/2020 FLAT 4,542,365.50 3.81Government
KOREA TRSY BD 3% 14-10/09/2024 FLAT 3,864,095.98 3.24Government
INDONESIA GOVT 8.375% 10-15/09/2026 3,633,633.50 3.05Government
PHILIPPINE GOVT 6.25% 11-14/01/2036 3,407,507.37 2.85Government
MALAYSIAN GOVT 3.58% 11-28/09/2018 3,238,750.23 2.71Government
INDONESIA GOVT 8.75% 15-15/05/2031 2,870,508.40 2.40Government
THAILAND GOVT 3.85% 10-12/12/2025 2,308,186.02 1.93Government
THAILAND GOVT 3.65% 10-20/06/2031 2,110,459.60 1.77Government
INDONESIA GOVT 8.375% 13-15/03/2034 1,749,908.82 1.46Government
USD
Sector
Top Ten Holdings
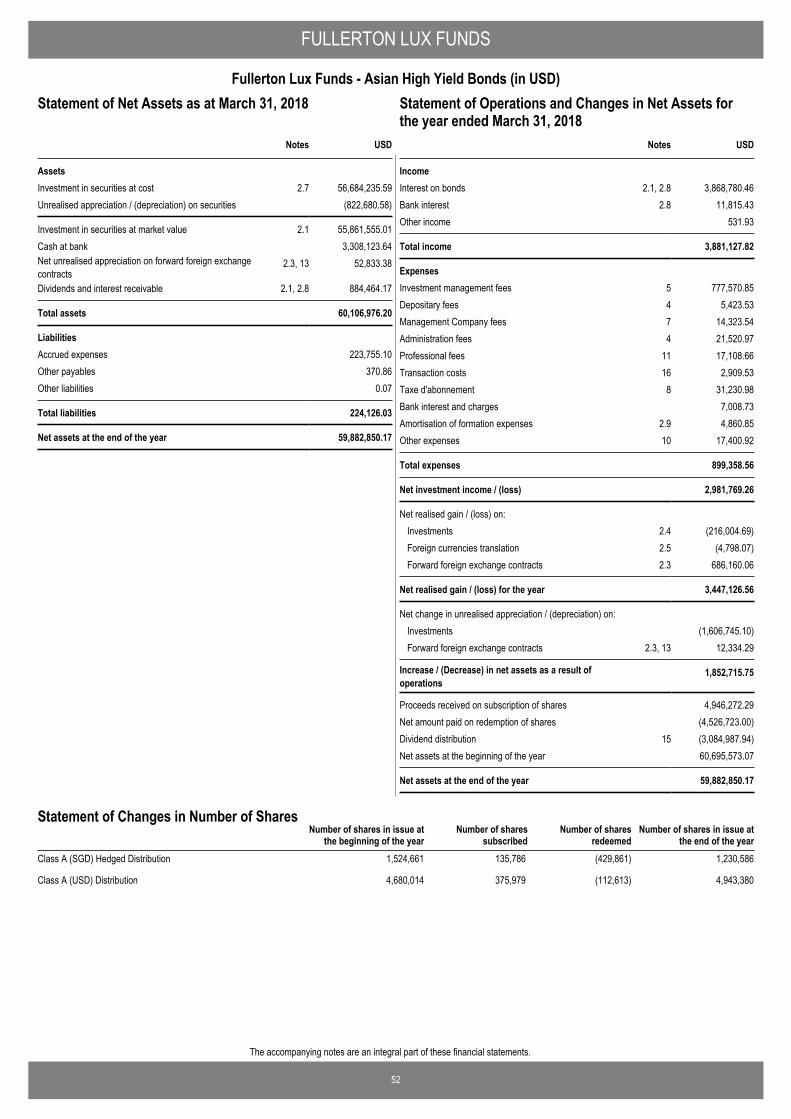
52
The accompanying notes are an integral part of these financial statements.
FULLERTON LUX FUNDS
Fullerton Lux Funds - Asian High Yield Bonds (in USD)Statement of Operations and Changes in Net Assets for theyear ended March 31, 2018
USD
AssetsInvestment in securities at cost 2.7 56,684,235.59Unrealised appreciation / (depreciation) on securities (822,680.58)
Investment in securities at market value 2.1 55,861,555.01Cash at bank 3,308,123.64Net unrealised appreciation on forward foreign exchangecontracts
2.3, 13 52,833.38
Dividends and interest receivable 2.1, 2.8 884,464.17
Total assets 60,106,976.20
LiabilitiesAccrued expenses 223,755.10Other payables 370.86Other liabilities 0.07
Total liabilities 224,126.03
Net assets at the end of the year 59,882,850.17
Notes
Statement of Net Assets as at March 31, 2018
IncomeInterest on bonds 2.1, 2.8 3,868,780.46Bank interest 2.8 11,815.43Other income 531.93
Total income 3,881,127.82
ExpensesInvestment management fees 5 777,570.85Depositary fees 4 5,423.53Management Company fees 7 14,323.54Administration fees 4 21,520.97Professional fees 11 17,108.66Transaction costs 16 2,909.53Taxe d'abonnement 8 31,230.98Bank interest and charges 7,008.73Amortisation of formation expenses 2.9 4,860.85Other expenses 10 17,400.92
Total expenses 899,358.56
Net investment income / (loss) 2,981,769.26
Net realised gain / (loss) on: Investments 2.4 (216,004.69)Foreign currencies translation 2.5 (4,798.07)Forward foreign exchange contracts 2.3 686,160.06
Net realised gain / (loss) for the year 3,447,126.56
Net change in unrealised appreciation / (depreciation) on: Investments (1,606,745.10)Forward foreign exchange contracts 2.3, 13 12,334.29
Increase / (Decrease) in net assets as a result ofoperations
1,852,715.75
Proceeds received on subscription of shares 4,946,272.29Net amount paid on redemption of shares (4,526,723.00)Dividend distribution 15 (3,084,987.94)Net assets at the beginning of the year 60,695,573.07
Net assets at the end of the year 59,882,850.17
USDNotes
Statement of Operations and Changes in Net Assets forthe year ended March 31, 2018
Number of shares in issue atthe end of the year
Number of shares in issue atthe beginning of the year
Number of sharessubscribed
Number of sharesredeemed
Statement of Changes in Number of Shares
Class A (SGD) Hedged Distribution 1,524,661 135,786 (429,861) 1,230,586
Class A (USD) Distribution 4,680,014 375,979 (112,613) 4,943,380
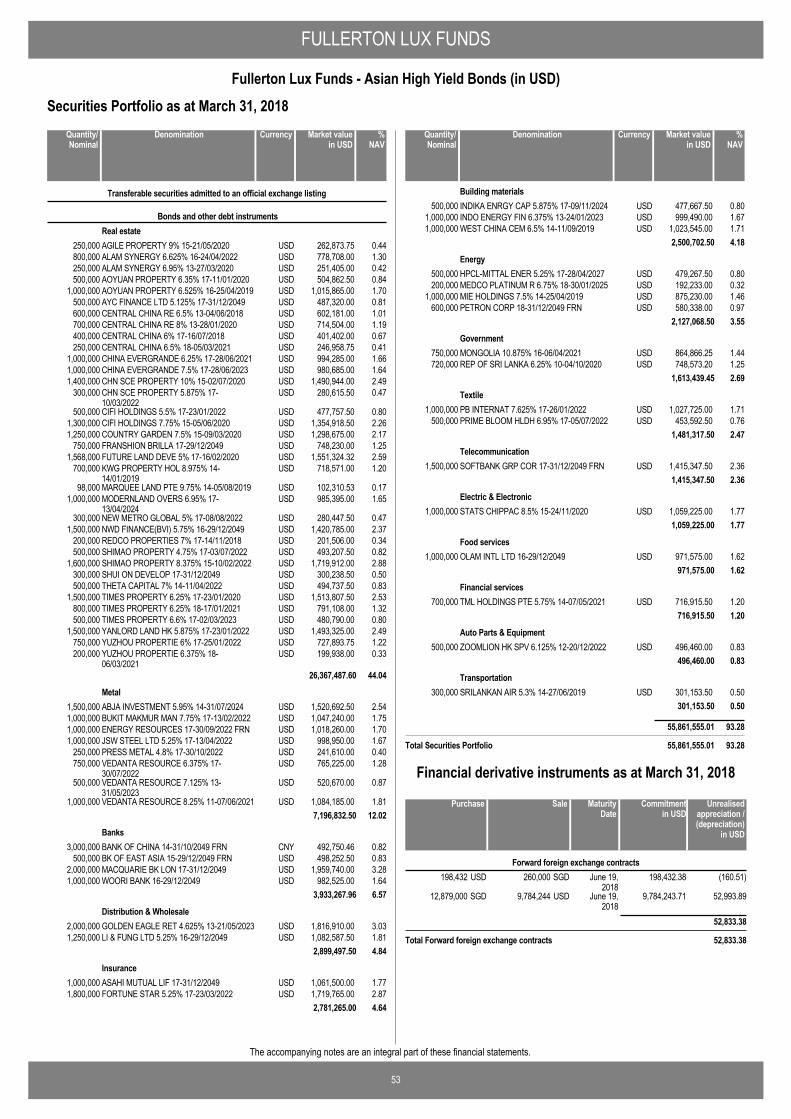
FULLERTON LUX FUNDS
53
Fullerton Lux Funds - Asian High Yield Bonds (in USD)
The accompanying notes are an integral part of these financial statements.
Securities Portfolio as at March 31, 2018
AGILE PROPERTY 9% 15-21/05/2020 USD 262,873.75 0.44250,000
Transferable securities admitted to an official exchange listing
Bonds and other debt instrumentsReal estate
ALAM SYNERGY 6.625% 16-24/04/2022 USD 778,708.00 1.30800,000ALAM SYNERGY 6.95% 13-27/03/2020 USD 251,405.00 0.42250,000AOYUAN PROPERTY 6.35% 17-11/01/2020 USD 504,862.50 0.84500,000AOYUAN PROPERTY 6.525% 16-25/04/2019 USD 1,015,865.00 1.701,000,000AYC FINANCE LTD 5.125% 17-31/12/2049 USD 487,320.00 0.81500,000CENTRAL CHINA RE 6.5% 13-04/06/2018 USD 602,181.00 1.01600,000CENTRAL CHINA RE 8% 13-28/01/2020 USD 714,504.00 1.19700,000CENTRAL CHINA 6% 17-16/07/2018 USD 401,402.00 0.67400,000CENTRAL CHINA 6.5% 18-05/03/2021 USD 246,958.75 0.41250,000CHINA EVERGRANDE 6.25% 17-28/06/2021 USD 994,285.00 1.661,000,000CHINA EVERGRANDE 7.5% 17-28/06/2023 USD 980,685.00 1.641,000,000CHN SCE PROPERTY 10% 15-02/07/2020 USD 1,490,944.00 2.491,400,000CHN SCE PROPERTY 5.875% 17-10/03/2022
USD 280,615.50 0.47300,000
CIFI HOLDINGS 5.5% 17-23/01/2022 USD 477,757.50 0.80500,000CIFI HOLDINGS 7.75% 15-05/06/2020 USD 1,354,918.50 2.261,300,000COUNTRY GARDEN 7.5% 15-09/03/2020 USD 1,298,675.00 2.171,250,000FRANSHION BRILLA 17-29/12/2049 USD 748,230.00 1.25750,000FUTURE LAND DEVE 5% 17-16/02/2020 USD 1,551,324.32 2.591,568,000KWG PROPERTY HOL 8.975% 14-14/01/2019
USD 718,571.00 1.20700,000
MARQUEE LAND PTE 9.75% 14-05/08/2019 USD 102,310.53 0.1798,000MODERNLAND OVERS 6.95% 17-13/04/2024
USD 985,395.00 1.651,000,000
NEW METRO GLOBAL 5% 17-08/08/2022 USD 280,447.50 0.47300,000NWD FINANCE(BVI) 5.75% 16-29/12/2049 USD 1,420,785.00 2.371,500,000REDCO PROPERTIES 7% 17-14/11/2018 USD 201,506.00 0.34200,000SHIMAO PROPERTY 4.75% 17-03/07/2022 USD 493,207.50 0.82500,000SHIMAO PROPERTY 8.375% 15-10/02/2022 USD 1,719,912.00 2.881,600,000SHUI ON DEVELOP 17-31/12/2049 USD 300,238.50 0.50300,000THETA CAPITAL 7% 14-11/04/2022 USD 494,737.50 0.83500,000TIMES PROPERTY 6.25% 17-23/01/2020 USD 1,513,807.50 2.531,500,000TIMES PROPERTY 6.25% 18-17/01/2021 USD 791,108.00 1.32800,000TIMES PROPERTY 6.6% 17-02/03/2023 USD 480,790.00 0.80500,000YANLORD LAND HK 5.875% 17-23/01/2022 USD 1,493,325.00 2.491,500,000YUZHOU PROPERTIE 6% 17-25/01/2022 USD 727,893.75 1.22750,000YUZHOU PROPERTIE 6.375% 18-06/03/2021
USD 199,938.00 0.33200,000
26,367,487.60 44.04
ABJA INVESTMENT 5.95% 14-31/07/2024 USD 1,520,692.50 2.541,500,000Metal
BUKIT MAKMUR MAN 7.75% 17-13/02/2022 USD 1,047,240.00 1.751,000,000ENERGY RESOURCES 17-30/09/2022 FRN USD 1,018,260.00 1.701,000,000JSW STEEL LTD 5.25% 17-13/04/2022 USD 998,950.00 1.671,000,000PRESS METAL 4.8% 17-30/10/2022 USD 241,610.00 0.40250,000VEDANTA RESOURCE 6.375% 17-30/07/2022
USD 765,225.00 1.28750,000
VEDANTA RESOURCE 7.125% 13-31/05/2023
USD 520,670.00 0.87500,000
VEDANTA RESOURCE 8.25% 11-07/06/2021 USD 1,084,185.00 1.811,000,0007,196,832.50 12.02
BANK OF CHINA 14-31/10/2049 FRN CNY 492,750.46 0.823,000,000Banks
BK OF EAST ASIA 15-29/12/2049 FRN USD 498,252.50 0.83500,000MACQUARIE BK LON 17-31/12/2049 USD 1,959,740.00 3.282,000,000WOORI BANK 16-29/12/2049 USD 982,525.00 1.641,000,000
3,933,267.96 6.57
GOLDEN EAGLE RET 4.625% 13-21/05/2023 USD 1,816,910.00 3.032,000,000Distribution & Wholesale
LI & FUNG LTD 5.25% 16-29/12/2049 USD 1,082,587.50 1.811,250,0002,899,497.50 4.84
ASAHI MUTUAL LIF 17-31/12/2049 USD 1,061,500.00 1.771,000,000Insurance
FORTUNE STAR 5.25% 17-23/03/2022 USD 1,719,765.00 2.871,800,0002,781,265.00 4.64
DenominationQuantity/Nominal
Market valuein USD
Currency %NAV
INDIKA ENRGY CAP 5.875% 17-09/11/2024 USD 477,667.50 0.80500,000Building materials
INDO ENERGY FIN 6.375% 13-24/01/2023 USD 999,490.00 1.671,000,000WEST CHINA CEM 6.5% 14-11/09/2019 USD 1,023,545.00 1.711,000,000
2,500,702.50 4.18
HPCL-MITTAL ENER 5.25% 17-28/04/2027 USD 479,267.50 0.80500,000Energy
MEDCO PLATINUM R 6.75% 18-30/01/2025 USD 192,233.00 0.32200,000MIE HOLDINGS 7.5% 14-25/04/2019 USD 875,230.00 1.461,000,000PETRON CORP 18-31/12/2049 FRN USD 580,338.00 0.97600,000
2,127,068.50 3.55
MONGOLIA 10.875% 16-06/04/2021 USD 864,866.25 1.44750,000Government
REP OF SRI LANKA 6.25% 10-04/10/2020 USD 748,573.20 1.25720,0001,613,439.45 2.69
PB INTERNAT 7.625% 17-26/01/2022 USD 1,027,725.00 1.711,000,000Textile
PRIME BLOOM HLDH 6.95% 17-05/07/2022 USD 453,592.50 0.76500,0001,481,317.50 2.47
SOFTBANK GRP COR 17-31/12/2049 FRN USD 1,415,347.50 2.361,500,000Telecommunication
1,415,347.50 2.36
STATS CHIPPAC 8.5% 15-24/11/2020 USD 1,059,225.00 1.771,000,000Electric & Electronic
1,059,225.00 1.77
OLAM INTL LTD 16-29/12/2049 USD 971,575.00 1.621,000,000Food services
971,575.00 1.62
TML HOLDINGS PTE 5.75% 14-07/05/2021 USD 716,915.50 1.20700,000Financial services
716,915.50 1.20
ZOOMLION HK SPV 6.125% 12-20/12/2022 USD 496,460.00 0.83500,000Auto Parts & Equipment
496,460.00 0.83
SRILANKAN AIR 5.3% 14-27/06/2019 USD 301,153.50 0.50300,000Transportation
301,153.50 0.50
55,861,555.01 93.28
Total Securities Portfolio 55,861,555.01 93.28
DenominationQuantity/Nominal
Market valuein USD
Currency %NAV
260,000 June 19,2018
198,432 (160.51)SGDUSD 198,432.38Forward foreign exchange contracts
9,784,244 June 19,2018
12,879,000 52,993.89USDSGD 9,784,243.71
52,833.38
Total Forward foreign exchange contracts 52,833.38
SalePurchase Unrealisedappreciation /(depreciation)
in USD
MaturityDate
Commitmentin USD
Financial derivative instruments as at March 31, 2018
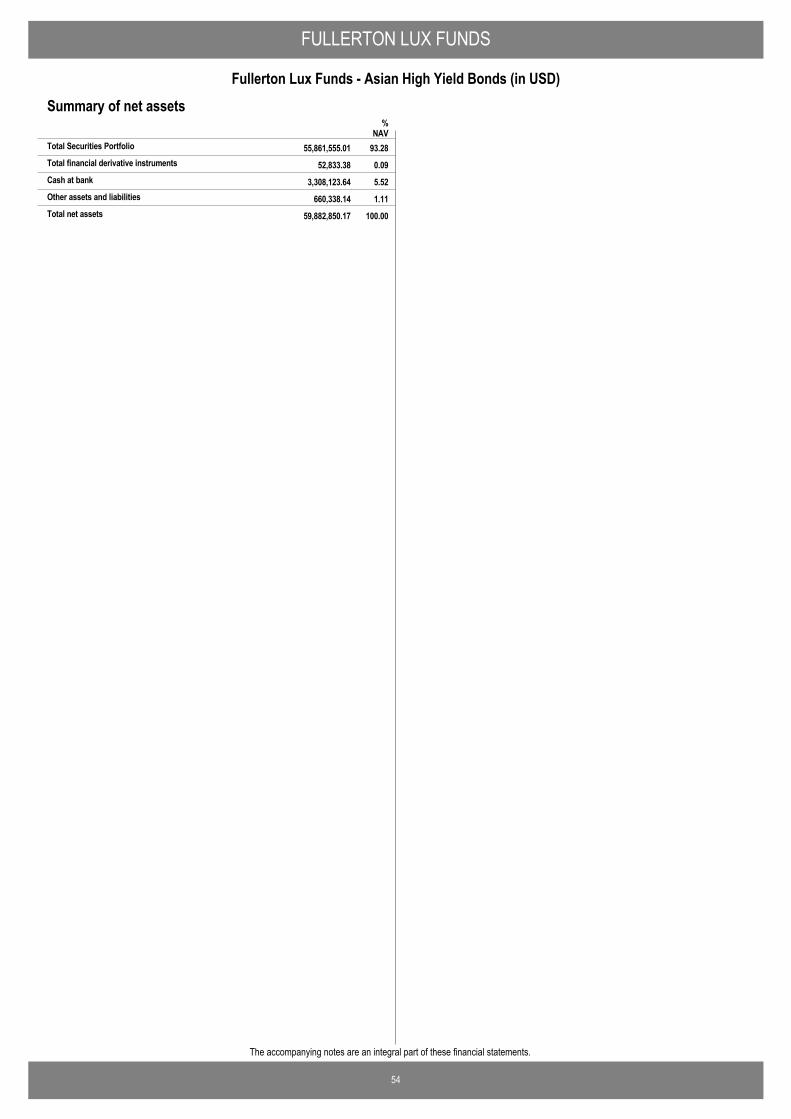
FULLERTON LUX FUNDS
54
Fullerton Lux Funds - Asian High Yield Bonds (in USD)
The accompanying notes are an integral part of these financial statements.
Summary of net assets
52,833.38 0.09Total financial derivative instruments
%NAV
55,861,555.01 93.28Total Securities Portfolio
3,308,123.64 5.52Cash at bank
660,338.14 1.11Other assets and liabilities
59,882,850.17 100.00Total net assets
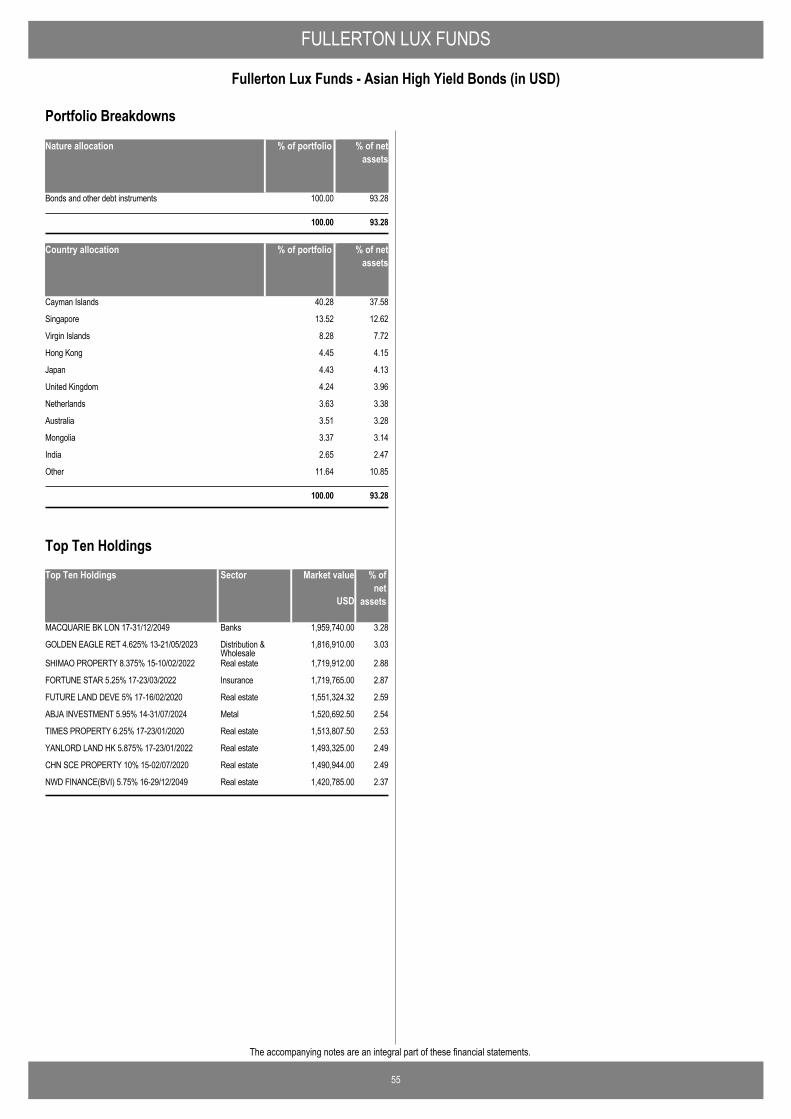
FULLERTON LUX FUNDS
55
Fullerton Lux Funds - Asian High Yield Bonds (in USD)
The accompanying notes are an integral part of these financial statements.
Nature allocation % of portfolio % of netassets
Bonds and other debt instruments 100.00 93.28
100.00 93.28
Country allocation % of portfolio % of netassets
Cayman Islands 40.28 37.58
Singapore 13.52 12.62
Virgin Islands 8.28 7.72
Hong Kong 4.45 4.15
Japan 4.43 4.13
United Kingdom 4.24 3.96
Netherlands 3.63 3.38
Australia 3.51 3.28
Mongolia 3.37 3.14
India 2.65 2.47
Other 11.64 10.85
100.00 93.28
Portfolio Breakdowns
Top Ten Holdings Market value % ofnet
assets
MACQUARIE BK LON 17-31/12/2049 1,959,740.00 3.28Banks
GOLDEN EAGLE RET 4.625% 13-21/05/2023 1,816,910.00 3.03Distribution &Wholesale
SHIMAO PROPERTY 8.375% 15-10/02/2022 1,719,912.00 2.88Real estate
FORTUNE STAR 5.25% 17-23/03/2022 1,719,765.00 2.87Insurance
FUTURE LAND DEVE 5% 17-16/02/2020 1,551,324.32 2.59Real estate
ABJA INVESTMENT 5.95% 14-31/07/2024 1,520,692.50 2.54Metal
TIMES PROPERTY 6.25% 17-23/01/2020 1,513,807.50 2.53Real estate
YANLORD LAND HK 5.875% 17-23/01/2022 1,493,325.00 2.49Real estate
CHN SCE PROPERTY 10% 15-02/07/2020 1,490,944.00 2.49Real estate
NWD FINANCE(BVI) 5.75% 16-29/12/2049 1,420,785.00 2.37Real estate
USD
Sector
Top Ten Holdings
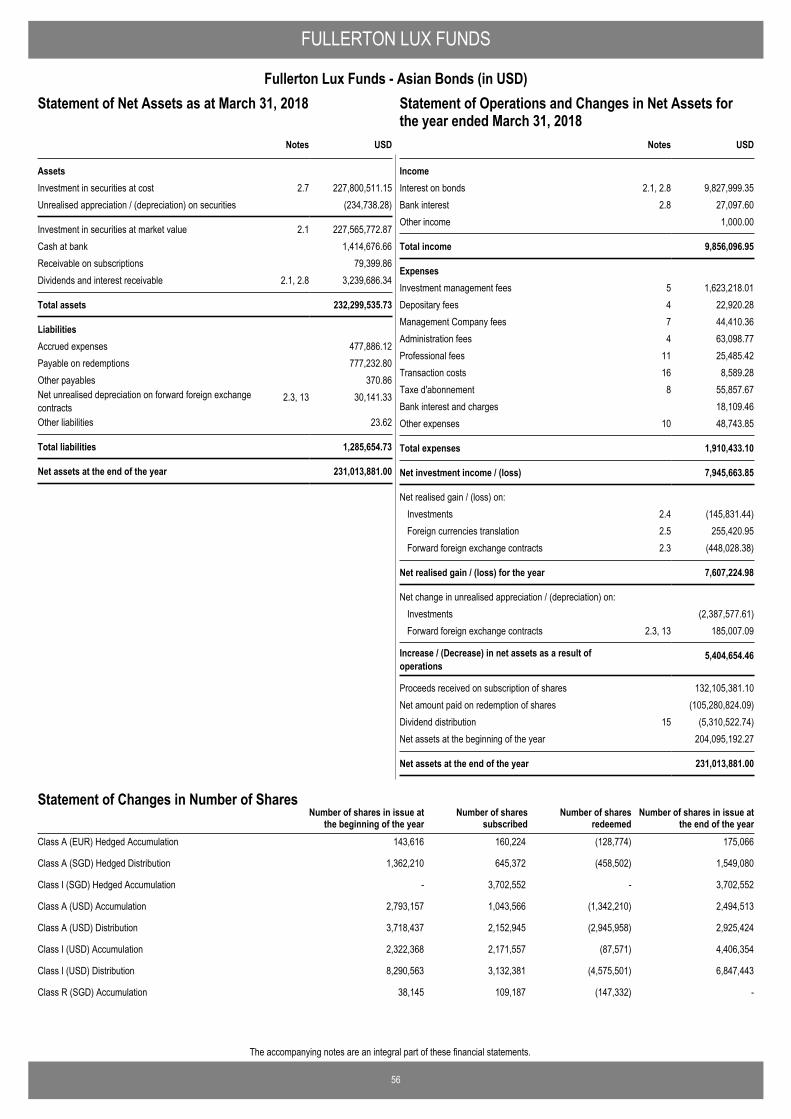
56
The accompanying notes are an integral part of these financial statements.
FULLERTON LUX FUNDS
Fullerton Lux Funds - Asian Bonds (in USD)Statement of Operations and Changes in Net Assets for theyear ended March 31, 2018
USD
AssetsInvestment in securities at cost 2.7 227,800,511.15Unrealised appreciation / (depreciation) on securities (234,738.28)
Investment in securities at market value 2.1 227,565,772.87Cash at bank 1,414,676.66Receivable on subscriptions 79,399.86Dividends and interest receivable 2.1, 2.8 3,239,686.34
Total assets 232,299,535.73
LiabilitiesAccrued expenses 477,886.12Payable on redemptions 777,232.80Other payables 370.86Net unrealised depreciation on forward foreign exchangecontracts
2.3, 13 30,141.33
Other liabilities 23.62
Total liabilities 1,285,654.73
Net assets at the end of the year 231,013,881.00
Notes
Statement of Net Assets as at March 31, 2018
IncomeInterest on bonds 2.1, 2.8 9,827,999.35Bank interest 2.8 27,097.60Other income 1,000.00
Total income 9,856,096.95
ExpensesInvestment management fees 5 1,623,218.01Depositary fees 4 22,920.28Management Company fees 7 44,410.36Administration fees 4 63,098.77Professional fees 11 25,485.42Transaction costs 16 8,589.28Taxe d'abonnement 8 55,857.67Bank interest and charges 18,109.46Other expenses 10 48,743.85
Total expenses 1,910,433.10
Net investment income / (loss) 7,945,663.85
Net realised gain / (loss) on: Investments 2.4 (145,831.44)Foreign currencies translation 2.5 255,420.95Forward foreign exchange contracts 2.3 (448,028.38)
Net realised gain / (loss) for the year 7,607,224.98
Net change in unrealised appreciation / (depreciation) on: Investments (2,387,577.61)Forward foreign exchange contracts 2.3, 13 185,007.09
Increase / (Decrease) in net assets as a result ofoperations
5,404,654.46
Proceeds received on subscription of shares 132,105,381.10Net amount paid on redemption of shares (105,280,824.09)Dividend distribution 15 (5,310,522.74)Net assets at the beginning of the year 204,095,192.27
Net assets at the end of the year 231,013,881.00
USDNotes
Statement of Operations and Changes in Net Assets forthe year ended March 31, 2018
Number of shares in issue atthe end of the year
Number of shares in issue atthe beginning of the year
Number of sharessubscribed
Number of sharesredeemed
Statement of Changes in Number of Shares
Class A (EUR) Hedged Accumulation 143,616 160,224 (128,774) 175,066
Class A (SGD) Hedged Distribution 1,362,210 645,372 (458,502) 1,549,080
Class I (SGD) Hedged Accumulation - 3,702,552 - 3,702,552
Class A (USD) Accumulation 2,793,157 1,043,566 (1,342,210) 2,494,513
Class A (USD) Distribution 3,718,437 2,152,945 (2,945,958) 2,925,424
Class I (USD) Accumulation 2,322,368 2,171,557 (87,571) 4,406,354
Class I (USD) Distribution 8,290,563 3,132,381 (4,575,501) 6,847,443
Class R (SGD) Accumulation 38,145 109,187 (147,332) -
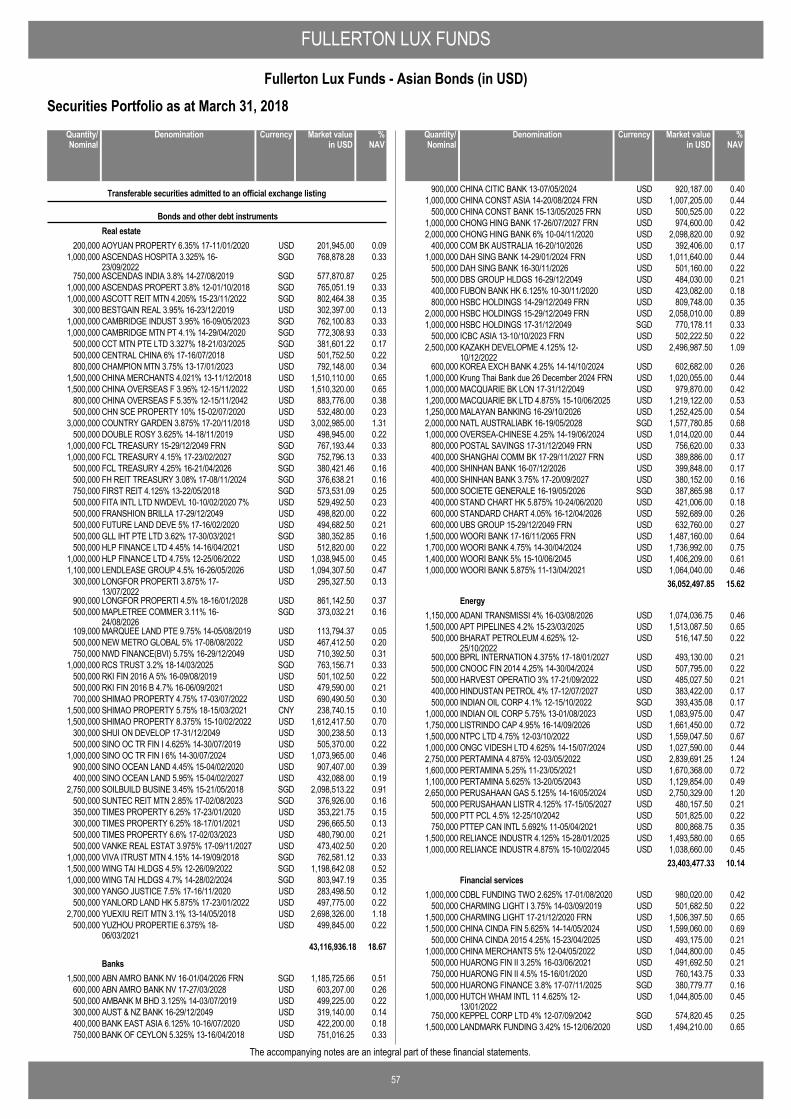
FULLERTON LUX FUNDS
57
Fullerton Lux Funds - Asian Bonds (in USD)
The accompanying notes are an integral part of these financial statements.
Securities Portfolio as at March 31, 2018
AOYUAN PROPERTY 6.35% 17-11/01/2020 USD 201,945.00 0.09200,000
Transferable securities admitted to an official exchange listing
Bonds and other debt instrumentsReal estate
ASCENDAS HOSPITA 3.325% 16-23/09/2022
SGD 768,878.28 0.331,000,000
ASCENDAS INDIA 3.8% 14-27/08/2019 SGD 577,870.87 0.25750,000ASCENDAS PROPERT 3.8% 12-01/10/2018 SGD 765,051.19 0.331,000,000ASCOTT REIT MTN 4.205% 15-23/11/2022 SGD 802,464.38 0.351,000,000BESTGAIN REAL 3.95% 16-23/12/2019 USD 302,397.00 0.13300,000CAMBRIDGE INDUST 3.95% 16-09/05/2023 SGD 762,100.83 0.331,000,000CAMBRIDGE MTN PT 4.1% 14-29/04/2020 SGD 772,308.93 0.331,000,000CCT MTN PTE LTD 3.327% 18-21/03/2025 SGD 381,601.22 0.17500,000CENTRAL CHINA 6% 17-16/07/2018 USD 501,752.50 0.22500,000CHAMPION MTN 3.75% 13-17/01/2023 USD 792,148.00 0.34800,000CHINA MERCHANTS 4.021% 13-11/12/2018 USD 1,510,110.00 0.651,500,000CHINA OVERSEAS F 3.95% 12-15/11/2022 USD 1,510,320.00 0.651,500,000CHINA OVERSEAS F 5.35% 12-15/11/2042 USD 883,776.00 0.38800,000CHN SCE PROPERTY 10% 15-02/07/2020 USD 532,480.00 0.23500,000COUNTRY GARDEN 3.875% 17-20/11/2018 USD 3,002,985.00 1.313,000,000DOUBLE ROSY 3.625% 14-18/11/2019 USD 498,945.00 0.22500,000FCL TREASURY 15-29/12/2049 FRN SGD 767,193.44 0.331,000,000FCL TREASURY 4.15% 17-23/02/2027 SGD 752,796.13 0.331,000,000FCL TREASURY 4.25% 16-21/04/2026 SGD 380,421.46 0.16500,000FH REIT TREASURY 3.08% 17-08/11/2024 SGD 376,638.21 0.16500,000FIRST REIT 4.125% 13-22/05/2018 SGD 573,531.09 0.25750,000FITA INTL LTD NWDEVL 10-10/02/2020 7% USD 529,492.50 0.23500,000FRANSHION BRILLA 17-29/12/2049 USD 498,820.00 0.22500,000FUTURE LAND DEVE 5% 17-16/02/2020 USD 494,682.50 0.21500,000GLL IHT PTE LTD 3.62% 17-30/03/2021 SGD 380,352.85 0.16500,000HLP FINANCE LTD 4.45% 14-16/04/2021 USD 512,820.00 0.22500,000HLP FINANCE LTD 4.75% 12-25/06/2022 USD 1,038,945.00 0.451,000,000LENDLEASE GROUP 4.5% 16-26/05/2026 USD 1,094,307.50 0.471,100,000LONGFOR PROPERTI 3.875% 17-13/07/2022
USD 295,327.50 0.13300,000
LONGFOR PROPERTI 4.5% 18-16/01/2028 USD 861,142.50 0.37900,000MAPLETREE COMMER 3.11% 16-24/08/2026
SGD 373,032.21 0.16500,000
MARQUEE LAND PTE 9.75% 14-05/08/2019 USD 113,794.37 0.05109,000NEW METRO GLOBAL 5% 17-08/08/2022 USD 467,412.50 0.20500,000NWD FINANCE(BVI) 5.75% 16-29/12/2049 USD 710,392.50 0.31750,000RCS TRUST 3.2% 18-14/03/2025 SGD 763,156.71 0.331,000,000RKI FIN 2016 A 5% 16-09/08/2019 USD 501,102.50 0.22500,000RKI FIN 2016 B 4.7% 16-06/09/2021 USD 479,590.00 0.21500,000SHIMAO PROPERTY 4.75% 17-03/07/2022 USD 690,490.50 0.30700,000SHIMAO PROPERTY 5.75% 18-15/03/2021 CNY 238,740.15 0.101,500,000SHIMAO PROPERTY 8.375% 15-10/02/2022 USD 1,612,417.50 0.701,500,000SHUI ON DEVELOP 17-31/12/2049 USD 300,238.50 0.13300,000SINO OC TR FIN I 4.625% 14-30/07/2019 USD 505,370.00 0.22500,000SINO OC TR FIN I 6% 14-30/07/2024 USD 1,073,965.00 0.461,000,000SINO OCEAN LAND 4.45% 15-04/02/2020 USD 907,407.00 0.39900,000SINO OCEAN LAND 5.95% 15-04/02/2027 USD 432,088.00 0.19400,000SOILBUILD BUSINE 3.45% 15-21/05/2018 SGD 2,098,513.22 0.912,750,000SUNTEC REIT MTN 2.85% 17-02/08/2023 SGD 376,926.00 0.16500,000TIMES PROPERTY 6.25% 17-23/01/2020 USD 353,221.75 0.15350,000TIMES PROPERTY 6.25% 18-17/01/2021 USD 296,665.50 0.13300,000TIMES PROPERTY 6.6% 17-02/03/2023 USD 480,790.00 0.21500,000VANKE REAL ESTAT 3.975% 17-09/11/2027 USD 473,402.50 0.20500,000VIVA ITRUST MTN 4.15% 14-19/09/2018 SGD 762,581.12 0.331,000,000WING TAI HLDGS 4.5% 12-26/09/2022 SGD 1,198,642.08 0.521,500,000WING TAI HLDGS 4.7% 14-28/02/2024 SGD 803,947.19 0.351,000,000YANGO JUSTICE 7.5% 17-16/11/2020 USD 283,498.50 0.12300,000YANLORD LAND HK 5.875% 17-23/01/2022 USD 497,775.00 0.22500,000YUEXIU REIT MTN 3.1% 13-14/05/2018 USD 2,698,326.00 1.182,700,000YUZHOU PROPERTIE 6.375% 18-06/03/2021
USD 499,845.00 0.22500,000
43,116,936.18 18.67
ABN AMRO BANK NV 16-01/04/2026 FRN SGD 1,185,725.66 0.511,500,000Banks
ABN AMRO BANK NV 17-27/03/2028 USD 603,207.00 0.26600,000AMBANK M BHD 3.125% 14-03/07/2019 USD 499,225.00 0.22500,000AUST & NZ BANK 16-29/12/2049 USD 319,140.00 0.14300,000BANK EAST ASIA 6.125% 10-16/07/2020 USD 422,200.00 0.18400,000BANK OF CEYLON 5.325% 13-16/04/2018 USD 751,016.25 0.33750,000
DenominationQuantity/Nominal
Market valuein USD
Currency %NAV
CHINA CITIC BANK 13-07/05/2024 USD 920,187.00 0.40900,000CHINA CONST ASIA 14-20/08/2024 FRN USD 1,007,205.00 0.441,000,000CHINA CONST BANK 15-13/05/2025 FRN USD 500,525.00 0.22500,000CHONG HING BANK 17-26/07/2027 FRN USD 974,600.00 0.421,000,000CHONG HING BANK 6% 10-04/11/2020 USD 2,098,820.00 0.922,000,000COM BK AUSTRALIA 16-20/10/2026 USD 392,406.00 0.17400,000DAH SING BANK 14-29/01/2024 FRN USD 1,011,640.00 0.441,000,000DAH SING BANK 16-30/11/2026 USD 501,160.00 0.22500,000DBS GROUP HLDGS 16-29/12/2049 USD 484,030.00 0.21500,000FUBON BANK HK 6.125% 10-30/11/2020 USD 423,082.00 0.18400,000HSBC HOLDINGS 14-29/12/2049 FRN USD 809,748.00 0.35800,000HSBC HOLDINGS 15-29/12/2049 FRN USD 2,058,010.00 0.892,000,000HSBC HOLDINGS 17-31/12/2049 SGD 770,178.11 0.331,000,000ICBC ASIA 13-10/10/2023 FRN USD 502,222.50 0.22500,000KAZAKH DEVELOPME 4.125% 12-10/12/2022
USD 2,496,987.50 1.092,500,000
KOREA EXCH BANK 4.25% 14-14/10/2024 USD 602,682.00 0.26600,000Krung Thai Bank due 26 December 2024 FRN USD 1,020,055.00 0.441,000,000MACQUARIE BK LON 17-31/12/2049 USD 979,870.00 0.421,000,000MACQUARIE BK LTD 4.875% 15-10/06/2025 USD 1,219,122.00 0.531,200,000MALAYAN BANKING 16-29/10/2026 USD 1,252,425.00 0.541,250,000NATL AUSTRALIABK 16-19/05/2028 SGD 1,577,780.85 0.682,000,000OVERSEA-CHINESE 4.25% 14-19/06/2024 USD 1,014,020.00 0.441,000,000POSTAL SAVINGS 17-31/12/2049 FRN USD 756,620.00 0.33800,000SHANGHAI COMM BK 17-29/11/2027 FRN USD 389,886.00 0.17400,000SHINHAN BANK 16-07/12/2026 USD 399,848.00 0.17400,000SHINHAN BANK 3.75% 17-20/09/2027 USD 380,152.00 0.16400,000SOCIETE GENERALE 16-19/05/2026 SGD 387,865.98 0.17500,000STAND CHART HK 5.875% 10-24/06/2020 USD 421,006.00 0.18400,000STANDARD CHART 4.05% 16-12/04/2026 USD 592,689.00 0.26600,000UBS GROUP 15-29/12/2049 FRN USD 632,760.00 0.27600,000WOORI BANK 17-16/11/2065 FRN USD 1,487,160.00 0.641,500,000WOORI BANK 4.75% 14-30/04/2024 USD 1,736,992.00 0.751,700,000WOORI BANK 5% 15-10/06/2045 USD 1,406,209.00 0.611,400,000WOORI BANK 5.875% 11-13/04/2021 USD 1,064,040.00 0.461,000,000
36,052,497.85 15.62
ADANI TRANSMISSI 4% 16-03/08/2026 USD 1,074,036.75 0.461,150,000Energy
APT PIPELINES 4.2% 15-23/03/2025 USD 1,513,087.50 0.651,500,000BHARAT PETROLEUM 4.625% 12-25/10/2022
USD 516,147.50 0.22500,000
BPRL INTERNATION 4.375% 17-18/01/2027 USD 493,130.00 0.21500,000CNOOC FIN 2014 4.25% 14-30/04/2024 USD 507,795.00 0.22500,000HARVEST OPERATIO 3% 17-21/09/2022 USD 485,027.50 0.21500,000HINDUSTAN PETROL 4% 17-12/07/2027 USD 383,422.00 0.17400,000INDIAN OIL CORP 4.1% 12-15/10/2022 SGD 393,435.08 0.17500,000INDIAN OIL CORP 5.75% 13-01/08/2023 USD 1,083,975.00 0.471,000,000LISTRINDO CAP 4.95% 16-14/09/2026 USD 1,661,450.00 0.721,750,000NTPC LTD 4.75% 12-03/10/2022 USD 1,559,047.50 0.671,500,000ONGC VIDESH LTD 4.625% 14-15/07/2024 USD 1,027,590.00 0.441,000,000PERTAMINA 4.875% 12-03/05/2022 USD 2,839,691.25 1.242,750,000PERTAMINA 5.25% 11-23/05/2021 USD 1,670,368.00 0.721,600,000PERTAMINA 5.625% 13-20/05/2043 USD 1,129,854.00 0.491,100,000PERUSAHAAN GAS 5.125% 14-16/05/2024 USD 2,750,329.00 1.202,650,000PERUSAHAAN LISTR 4.125% 17-15/05/2027 USD 480,157.50 0.21500,000PTT PCL 4.5% 12-25/10/2042 USD 501,825.00 0.22500,000PTTEP CAN INTL 5.692% 11-05/04/2021 USD 800,868.75 0.35750,000RELIANCE INDUSTR 4.125% 15-28/01/2025 USD 1,493,580.00 0.651,500,000RELIANCE INDUSTR 4.875% 15-10/02/2045 USD 1,038,660.00 0.451,000,000
23,403,477.33 10.14
CDBL FUNDING TWO 2.625% 17-01/08/2020 USD 980,020.00 0.421,000,000Financial services
CHARMING LIGHT I 3.75% 14-03/09/2019 USD 501,682.50 0.22500,000CHARMING LIGHT 17-21/12/2020 FRN USD 1,506,397.50 0.651,500,000CHINA CINDA FIN 5.625% 14-14/05/2024 USD 1,599,060.00 0.691,500,000CHINA CINDA 2015 4.25% 15-23/04/2025 USD 493,175.00 0.21500,000CHINA MERCHANTS 5% 12-04/05/2022 USD 1,044,800.00 0.451,000,000HUARONG FIN II 3.25% 16-03/06/2021 USD 491,692.50 0.21500,000HUARONG FIN II 4.5% 15-16/01/2020 USD 760,143.75 0.33750,000HUARONG FINANCE 3.8% 17-07/11/2025 SGD 380,779.77 0.16500,000HUTCH WHAM INTL 11 4.625% 12-13/01/2022
USD 1,044,805.00 0.451,000,000
KEPPEL CORP LTD 4% 12-07/09/2042 SGD 574,820.45 0.25750,000LANDMARK FUNDING 3.42% 15-12/06/2020 USD 1,494,210.00 0.651,500,000
DenominationQuantity/Nominal
Market valuein USD
Currency %NAV
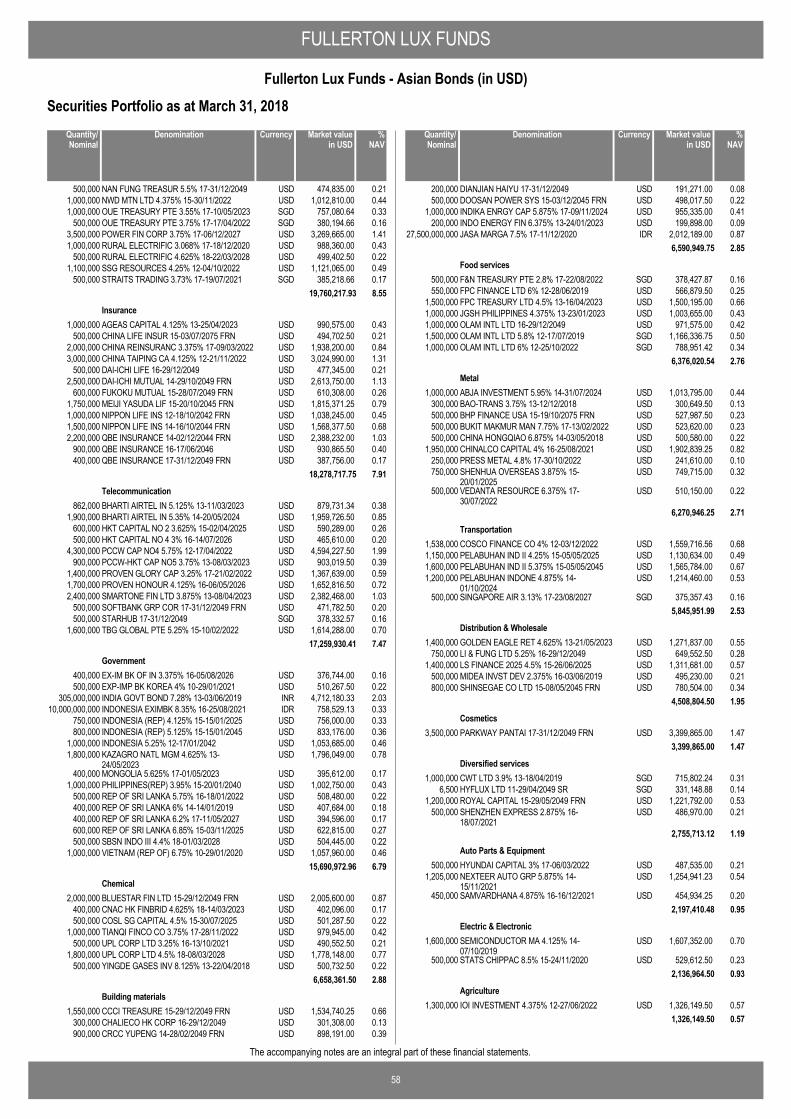
FULLERTON LUX FUNDS
58
Fullerton Lux Funds - Asian Bonds (in USD)
The accompanying notes are an integral part of these financial statements.
Securities Portfolio as at March 31, 2018
NAN FUNG TREASUR 5.5% 17-31/12/2049 USD 474,835.00 0.21500,000NWD MTN LTD 4.375% 15-30/11/2022 USD 1,012,810.00 0.441,000,000OUE TREASURY PTE 3.55% 17-10/05/2023 SGD 757,080.64 0.331,000,000OUE TREASURY PTE 3.75% 17-17/04/2022 SGD 380,194.66 0.16500,000POWER FIN CORP 3.75% 17-06/12/2027 USD 3,269,665.00 1.413,500,000RURAL ELECTRIFIC 3.068% 17-18/12/2020 USD 988,360.00 0.431,000,000RURAL ELECTRIFIC 4.625% 18-22/03/2028 USD 499,402.50 0.22500,000SSG RESOURCES 4.25% 12-04/10/2022 USD 1,121,065.00 0.491,100,000STRAITS TRADING 3.73% 17-19/07/2021 SGD 385,218.66 0.17500,000
19,760,217.93 8.55
AGEAS CAPITAL 4.125% 13-25/04/2023 USD 990,575.00 0.431,000,000Insurance
CHINA LIFE INSUR 15-03/07/2075 FRN USD 494,702.50 0.21500,000CHINA REINSURANC 3.375% 17-09/03/2022 USD 1,938,200.00 0.842,000,000CHINA TAIPING CA 4.125% 12-21/11/2022 USD 3,024,990.00 1.313,000,000DAI-ICHI LIFE 16-29/12/2049 USD 477,345.00 0.21500,000DAI-ICHI MUTUAL 14-29/10/2049 FRN USD 2,613,750.00 1.132,500,000FUKOKU MUTUAL 15-28/07/2049 FRN USD 610,308.00 0.26600,000MEIJI YASUDA LIF 15-20/10/2045 FRN USD 1,815,371.25 0.791,750,000NIPPON LIFE INS 12-18/10/2042 FRN USD 1,038,245.00 0.451,000,000NIPPON LIFE INS 14-16/10/2044 FRN USD 1,568,377.50 0.681,500,000QBE INSURANCE 14-02/12/2044 FRN USD 2,388,232.00 1.032,200,000QBE INSURANCE 16-17/06/2046 USD 930,865.50 0.40900,000QBE INSURANCE 17-31/12/2049 FRN USD 387,756.00 0.17400,000
18,278,717.75 7.91
BHARTI AIRTEL IN 5.125% 13-11/03/2023 USD 879,731.34 0.38862,000Telecommunication
BHARTI AIRTEL IN 5.35% 14-20/05/2024 USD 1,959,726.50 0.851,900,000HKT CAPITAL NO 2 3.625% 15-02/04/2025 USD 590,289.00 0.26600,000HKT CAPITAL NO 4 3% 16-14/07/2026 USD 465,610.00 0.20500,000PCCW CAP NO4 5.75% 12-17/04/2022 USD 4,594,227.50 1.994,300,000PCCW-HKT CAP NO5 3.75% 13-08/03/2023 USD 903,019.50 0.39900,000PROVEN GLORY CAP 3.25% 17-21/02/2022 USD 1,367,639.00 0.591,400,000PROVEN HONOUR 4.125% 16-06/05/2026 USD 1,652,816.50 0.721,700,000SMARTONE FIN LTD 3.875% 13-08/04/2023 USD 2,382,468.00 1.032,400,000SOFTBANK GRP COR 17-31/12/2049 FRN USD 471,782.50 0.20500,000STARHUB 17-31/12/2049 SGD 378,332.57 0.16500,000TBG GLOBAL PTE 5.25% 15-10/02/2022 USD 1,614,288.00 0.701,600,000
17,259,930.41 7.47
EX-IM BK OF IN 3.375% 16-05/08/2026 USD 376,744.00 0.16400,000Government
EXP-IMP BK KOREA 4% 10-29/01/2021 USD 510,267.50 0.22500,000INDIA GOVT BOND 7.28% 13-03/06/2019 INR 4,712,180.33 2.03305,000,000INDONESIA EXIMBK 8.35% 16-25/08/2021 IDR 758,529.13 0.3310,000,000,000INDONESIA (REP) 4.125% 15-15/01/2025 USD 756,000.00 0.33750,000INDONESIA (REP) 5.125% 15-15/01/2045 USD 833,176.00 0.36800,000INDONESIA 5.25% 12-17/01/2042 USD 1,053,685.00 0.461,000,000KAZAGRO NATL MGM 4.625% 13-24/05/2023
USD 1,796,049.00 0.781,800,000
MONGOLIA 5.625% 17-01/05/2023 USD 395,612.00 0.17400,000PHILIPPINES(REP) 3.95% 15-20/01/2040 USD 1,002,750.00 0.431,000,000REP OF SRI LANKA 5.75% 16-18/01/2022 USD 508,480.00 0.22500,000REP OF SRI LANKA 6% 14-14/01/2019 USD 407,684.00 0.18400,000REP OF SRI LANKA 6.2% 17-11/05/2027 USD 394,596.00 0.17400,000REP OF SRI LANKA 6.85% 15-03/11/2025 USD 622,815.00 0.27600,000SBSN INDO III 4.4% 18-01/03/2028 USD 504,445.00 0.22500,000VIETNAM (REP OF) 6.75% 10-29/01/2020 USD 1,057,960.00 0.461,000,000
15,690,972.96 6.79
BLUESTAR FIN LTD 15-29/12/2049 FRN USD 2,005,600.00 0.872,000,000Chemical
CNAC HK FINBRID 4.625% 18-14/03/2023 USD 402,096.00 0.17400,000COSL SG CAPITAL 4.5% 15-30/07/2025 USD 501,287.50 0.22500,000TIANQI FINCO CO 3.75% 17-28/11/2022 USD 979,945.00 0.421,000,000UPL CORP LTD 3.25% 16-13/10/2021 USD 490,552.50 0.21500,000UPL CORP LTD 4.5% 18-08/03/2028 USD 1,778,148.00 0.771,800,000YINGDE GASES INV 8.125% 13-22/04/2018 USD 500,732.50 0.22500,000
6,658,361.50 2.88
CCCI TREASURE 15-29/12/2049 FRN USD 1,534,740.25 0.661,550,000Building materials
CHALIECO HK CORP 16-29/12/2049 USD 301,308.00 0.13300,000CRCC YUPENG 14-28/02/2049 FRN USD 898,191.00 0.39900,000
DenominationQuantity/Nominal
Market valuein USD
Currency %NAV
DIANJIAN HAIYU 17-31/12/2049 USD 191,271.00 0.08200,000DOOSAN POWER SYS 15-03/12/2045 FRN USD 498,017.50 0.22500,000INDIKA ENRGY CAP 5.875% 17-09/11/2024 USD 955,335.00 0.411,000,000INDO ENERGY FIN 6.375% 13-24/01/2023 USD 199,898.00 0.09200,000JASA MARGA 7.5% 17-11/12/2020 IDR 2,012,189.00 0.8727,500,000,000
6,590,949.75 2.85
F&N TREASURY PTE 2.8% 17-22/08/2022 SGD 378,427.87 0.16500,000Food services
FPC FINANCE LTD 6% 12-28/06/2019 USD 566,879.50 0.25550,000FPC TREASURY LTD 4.5% 13-16/04/2023 USD 1,500,195.00 0.661,500,000JGSH PHILIPPINES 4.375% 13-23/01/2023 USD 1,003,655.00 0.431,000,000OLAM INTL LTD 16-29/12/2049 USD 971,575.00 0.421,000,000OLAM INTL LTD 5.8% 12-17/07/2019 SGD 1,166,336.75 0.501,500,000OLAM INTL LTD 6% 12-25/10/2022 SGD 788,951.42 0.341,000,000
6,376,020.54 2.76
ABJA INVESTMENT 5.95% 14-31/07/2024 USD 1,013,795.00 0.441,000,000Metal
BAO-TRANS 3.75% 13-12/12/2018 USD 300,649.50 0.13300,000BHP FINANCE USA 15-19/10/2075 FRN USD 527,987.50 0.23500,000BUKIT MAKMUR MAN 7.75% 17-13/02/2022 USD 523,620.00 0.23500,000CHINA HONGQIAO 6.875% 14-03/05/2018 USD 500,580.00 0.22500,000CHINALCO CAPITAL 4% 16-25/08/2021 USD 1,902,839.25 0.821,950,000PRESS METAL 4.8% 17-30/10/2022 USD 241,610.00 0.10250,000SHENHUA OVERSEAS 3.875% 15-20/01/2025
USD 749,715.00 0.32750,000
VEDANTA RESOURCE 6.375% 17-30/07/2022
USD 510,150.00 0.22500,000
6,270,946.25 2.71
COSCO FINANCE CO 4% 12-03/12/2022 USD 1,559,716.56 0.681,538,000Transportation
PELABUHAN IND II 4.25% 15-05/05/2025 USD 1,130,634.00 0.491,150,000PELABUHAN IND II 5.375% 15-05/05/2045 USD 1,565,784.00 0.671,600,000PELABUHAN INDONE 4.875% 14-01/10/2024
USD 1,214,460.00 0.531,200,000
SINGAPORE AIR 3.13% 17-23/08/2027 SGD 375,357.43 0.16500,0005,845,951.99 2.53
GOLDEN EAGLE RET 4.625% 13-21/05/2023 USD 1,271,837.00 0.551,400,000Distribution & Wholesale
LI & FUNG LTD 5.25% 16-29/12/2049 USD 649,552.50 0.28750,000LS FINANCE 2025 4.5% 15-26/06/2025 USD 1,311,681.00 0.571,400,000MIDEA INVST DEV 2.375% 16-03/06/2019 USD 495,230.00 0.21500,000SHINSEGAE CO LTD 15-08/05/2045 FRN USD 780,504.00 0.34800,000
4,508,804.50 1.95
PARKWAY PANTAI 17-31/12/2049 FRN USD 3,399,865.00 1.473,500,000Cosmetics
3,399,865.00 1.47
CWT LTD 3.9% 13-18/04/2019 SGD 715,802.24 0.311,000,000Diversified services
HYFLUX LTD 11-29/04/2049 SR SGD 331,148.88 0.146,500ROYAL CAPITAL 15-29/05/2049 FRN USD 1,221,792.00 0.531,200,000SHENZHEN EXPRESS 2.875% 16-18/07/2021
USD 486,970.00 0.21500,000
2,755,713.12 1.19
HYUNDAI CAPITAL 3% 17-06/03/2022 USD 487,535.00 0.21500,000Auto Parts & Equipment
NEXTEER AUTO GRP 5.875% 14-15/11/2021
USD 1,254,941.23 0.541,205,000
SAMVARDHANA 4.875% 16-16/12/2021 USD 454,934.25 0.20450,0002,197,410.48 0.95
SEMICONDUCTOR MA 4.125% 14-07/10/2019
USD 1,607,352.00 0.701,600,000Electric & Electronic
STATS CHIPPAC 8.5% 15-24/11/2020 USD 529,612.50 0.23500,0002,136,964.50 0.93
IOI INVESTMENT 4.375% 12-27/06/2022 USD 1,326,149.50 0.571,300,000Agriculture
1,326,149.50 0.57
DenominationQuantity/Nominal
Market valuein USD
Currency %NAV
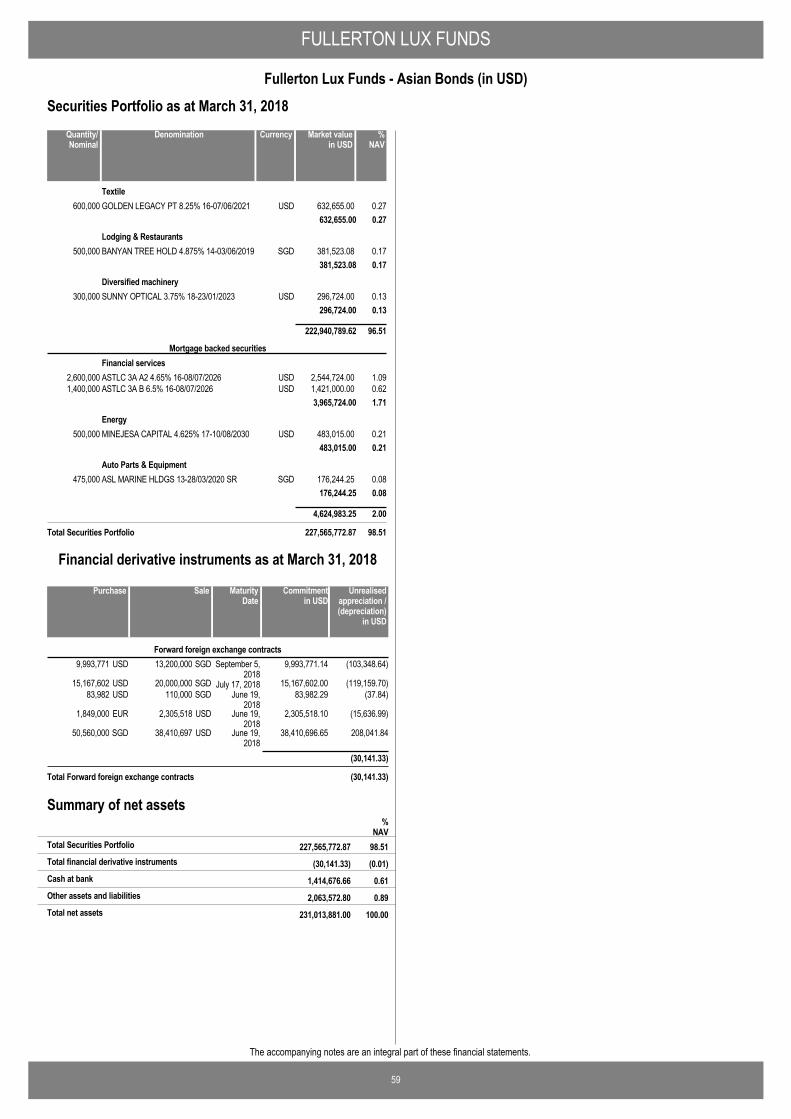
FULLERTON LUX FUNDS
59
Fullerton Lux Funds - Asian Bonds (in USD)
The accompanying notes are an integral part of these financial statements.
Securities Portfolio as at March 31, 2018
GOLDEN LEGACY PT 8.25% 16-07/06/2021 USD 632,655.00 0.27600,000Textile
632,655.00 0.27
BANYAN TREE HOLD 4.875% 14-03/06/2019 SGD 381,523.08 0.17500,000Lodging & Restaurants
381,523.08 0.17
SUNNY OPTICAL 3.75% 18-23/01/2023 USD 296,724.00 0.13300,000Diversified machinery
296,724.00 0.13
222,940,789.62 96.51
ASTLC 3A A2 4.65% 16-08/07/2026 USD 2,544,724.00 1.092,600,000
Mortgage backed securitiesFinancial services
ASTLC 3A B 6.5% 16-08/07/2026 USD 1,421,000.00 0.621,400,0003,965,724.00 1.71
MINEJESA CAPITAL 4.625% 17-10/08/2030 USD 483,015.00 0.21500,000Energy
483,015.00 0.21
ASL MARINE HLDGS 13-28/03/2020 SR SGD 176,244.25 0.08475,000Auto Parts & Equipment
176,244.25 0.08
4,624,983.25 2.00
Total Securities Portfolio 227,565,772.87 98.51
DenominationQuantity/Nominal
Market valuein USD
Currency %NAV
13,200,000 September 5,2018
9,993,771 (103,348.64)SGDUSD 9,993,771.14Forward foreign exchange contracts
20,000,000 July 17, 201815,167,602 (119,159.70)SGDUSD 15,167,602.00110,000 June 19,
201883,982 (37.84)SGDUSD 83,982.29
2,305,518 June 19,2018
1,849,000 (15,636.99)USDEUR 2,305,518.10
38,410,697 June 19,2018
50,560,000 208,041.84USDSGD 38,410,696.65
(30,141.33)
Total Forward foreign exchange contracts (30,141.33)
SalePurchase Unrealisedappreciation /(depreciation)
in USD
MaturityDate
Commitmentin USD
Financial derivative instruments as at March 31, 2018
Summary of net assets
(30,141.33) (0.01)Total financial derivative instruments
%NAV
227,565,772.87 98.51Total Securities Portfolio
1,414,676.66 0.61Cash at bank
2,063,572.80 0.89Other assets and liabilities
231,013,881.00 100.00Total net assets
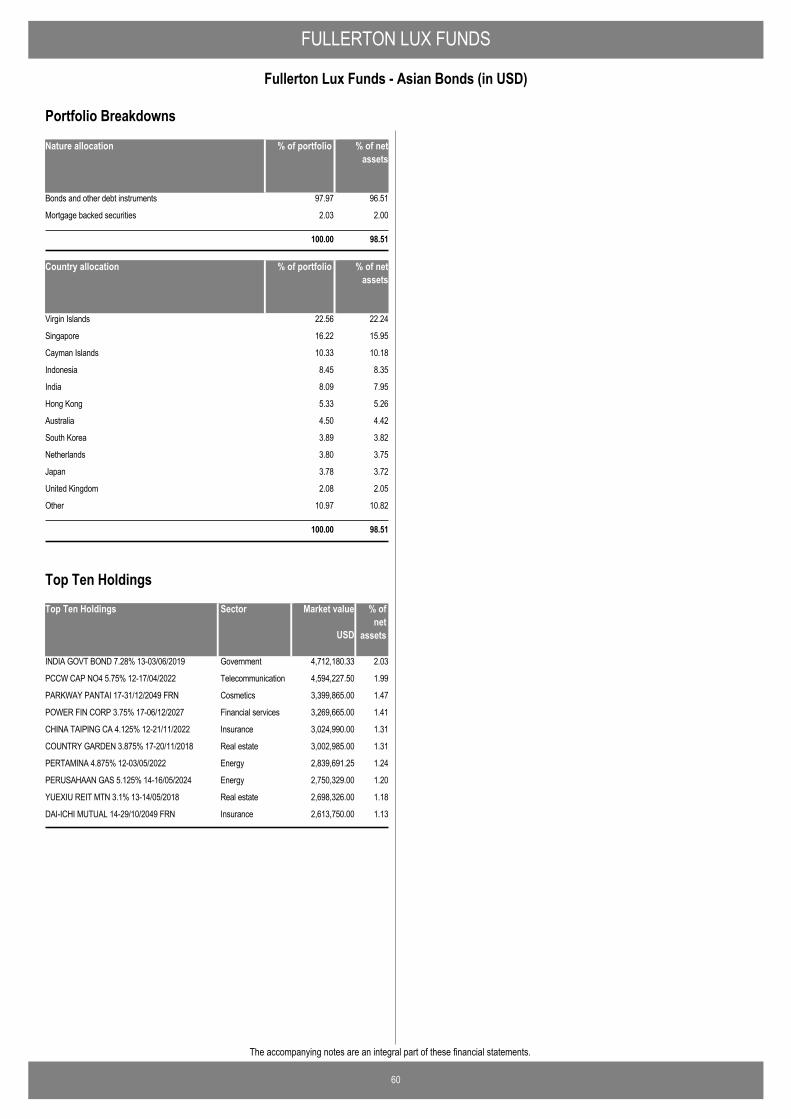
FULLERTON LUX FUNDS
60
Fullerton Lux Funds - Asian Bonds (in USD)
The accompanying notes are an integral part of these financial statements.
Nature allocation % of portfolio % of netassets
Bonds and other debt instruments 97.97 96.51
Mortgage backed securities 2.03 2.00
100.00 98.51
Country allocation % of portfolio % of netassets
Virgin Islands 22.56 22.24
Singapore 16.22 15.95
Cayman Islands 10.33 10.18
Indonesia 8.45 8.35
India 8.09 7.95
Hong Kong 5.33 5.26
Australia 4.50 4.42
South Korea 3.89 3.82
Netherlands 3.80 3.75
Japan 3.78 3.72
United Kingdom 2.08 2.05
Other 10.97 10.82
100.00 98.51
Portfolio Breakdowns
Top Ten Holdings Market value % ofnet
assets
INDIA GOVT BOND 7.28% 13-03/06/2019 4,712,180.33 2.03Government
PCCW CAP NO4 5.75% 12-17/04/2022 4,594,227.50 1.99Telecommunication
PARKWAY PANTAI 17-31/12/2049 FRN 3,399,865.00 1.47Cosmetics
POWER FIN CORP 3.75% 17-06/12/2027 3,269,665.00 1.41Financial services
CHINA TAIPING CA 4.125% 12-21/11/2022 3,024,990.00 1.31Insurance
COUNTRY GARDEN 3.875% 17-20/11/2018 3,002,985.00 1.31Real estate
PERTAMINA 4.875% 12-03/05/2022 2,839,691.25 1.24Energy
PERUSAHAAN GAS 5.125% 14-16/05/2024 2,750,329.00 1.20Energy
YUEXIU REIT MTN 3.1% 13-14/05/2018 2,698,326.00 1.18Real estate
DAI-ICHI MUTUAL 14-29/10/2049 FRN 2,613,750.00 1.13Insurance
USD
Sector
Top Ten Holdings
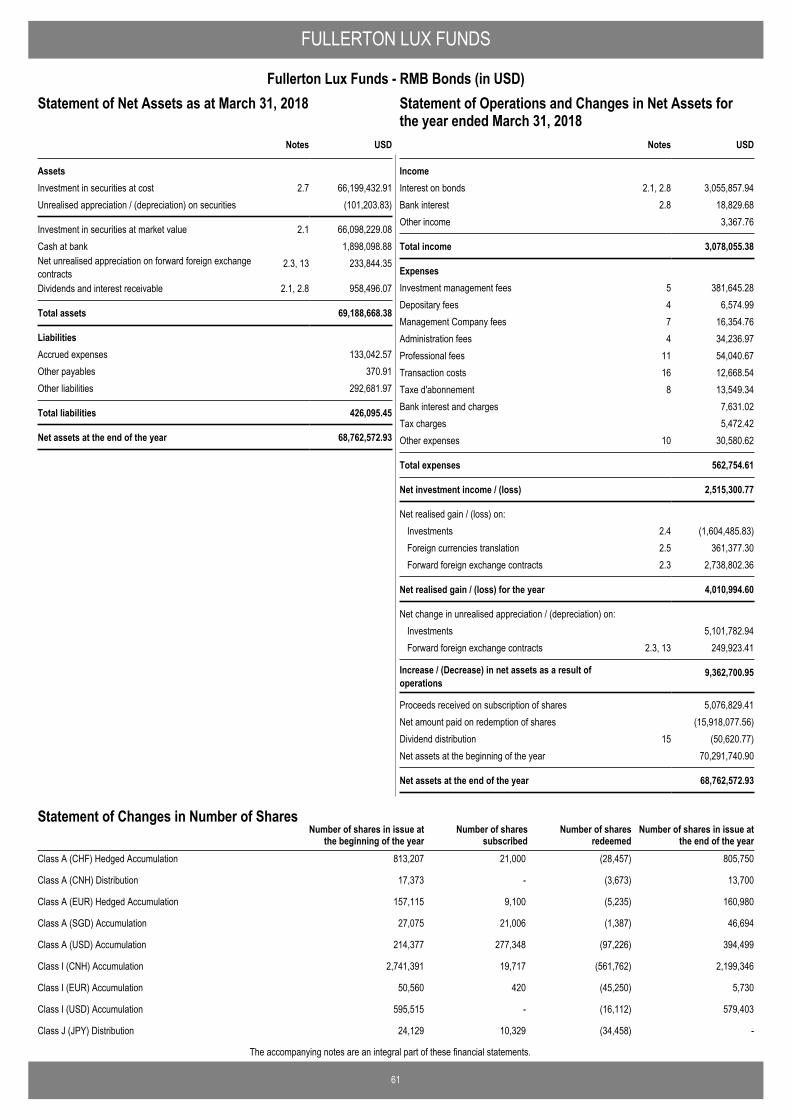
61
The accompanying notes are an integral part of these financial statements.
FULLERTON LUX FUNDS
Fullerton Lux Funds - RMB Bonds (in USD)Statement of Operations and Changes in Net Assets for theyear ended March 31, 2018
USD
AssetsInvestment in securities at cost 2.7 66,199,432.91Unrealised appreciation / (depreciation) on securities (101,203.83)
Investment in securities at market value 2.1 66,098,229.08Cash at bank 1,898,098.88Net unrealised appreciation on forward foreign exchangecontracts
2.3, 13 233,844.35
Dividends and interest receivable 2.1, 2.8 958,496.07
Total assets 69,188,668.38
LiabilitiesAccrued expenses 133,042.57Other payables 370.91Other liabilities 292,681.97
Total liabilities 426,095.45
Net assets at the end of the year 68,762,572.93
Notes
Statement of Net Assets as at March 31, 2018
IncomeInterest on bonds 2.1, 2.8 3,055,857.94Bank interest 2.8 18,829.68Other income 3,367.76
Total income 3,078,055.38
ExpensesInvestment management fees 5 381,645.28Depositary fees 4 6,574.99Management Company fees 7 16,354.76Administration fees 4 34,236.97Professional fees 11 54,040.67Transaction costs 16 12,668.54Taxe d'abonnement 8 13,549.34Bank interest and charges 7,631.02Tax charges 5,472.42Other expenses 10 30,580.62
Total expenses 562,754.61
Net investment income / (loss) 2,515,300.77
Net realised gain / (loss) on: Investments 2.4 (1,604,485.83)Foreign currencies translation 2.5 361,377.30Forward foreign exchange contracts 2.3 2,738,802.36
Net realised gain / (loss) for the year 4,010,994.60
Net change in unrealised appreciation / (depreciation) on: Investments 5,101,782.94Forward foreign exchange contracts 2.3, 13 249,923.41
Increase / (Decrease) in net assets as a result ofoperations
9,362,700.95
Proceeds received on subscription of shares 5,076,829.41Net amount paid on redemption of shares (15,918,077.56)Dividend distribution 15 (50,620.77)Net assets at the beginning of the year 70,291,740.90
Net assets at the end of the year 68,762,572.93
USDNotes
Statement of Operations and Changes in Net Assets forthe year ended March 31, 2018
Number of shares in issue atthe end of the year
Number of shares in issue atthe beginning of the year
Number of sharessubscribed
Number of sharesredeemed
Statement of Changes in Number of Shares
Class A (CHF) Hedged Accumulation 813,207 21,000 (28,457) 805,750
Class A (CNH) Distribution 17,373 - (3,673) 13,700
Class A (EUR) Hedged Accumulation 157,115 9,100 (5,235) 160,980
Class A (SGD) Accumulation 27,075 21,006 (1,387) 46,694
Class A (USD) Accumulation 214,377 277,348 (97,226) 394,499
Class I (CNH) Accumulation 2,741,391 19,717 (561,762) 2,199,346
Class I (EUR) Accumulation 50,560 420 (45,250) 5,730
Class I (USD) Accumulation 595,515 - (16,112) 579,403
Class J (JPY) Distribution 24,129 10,329 (34,458) -
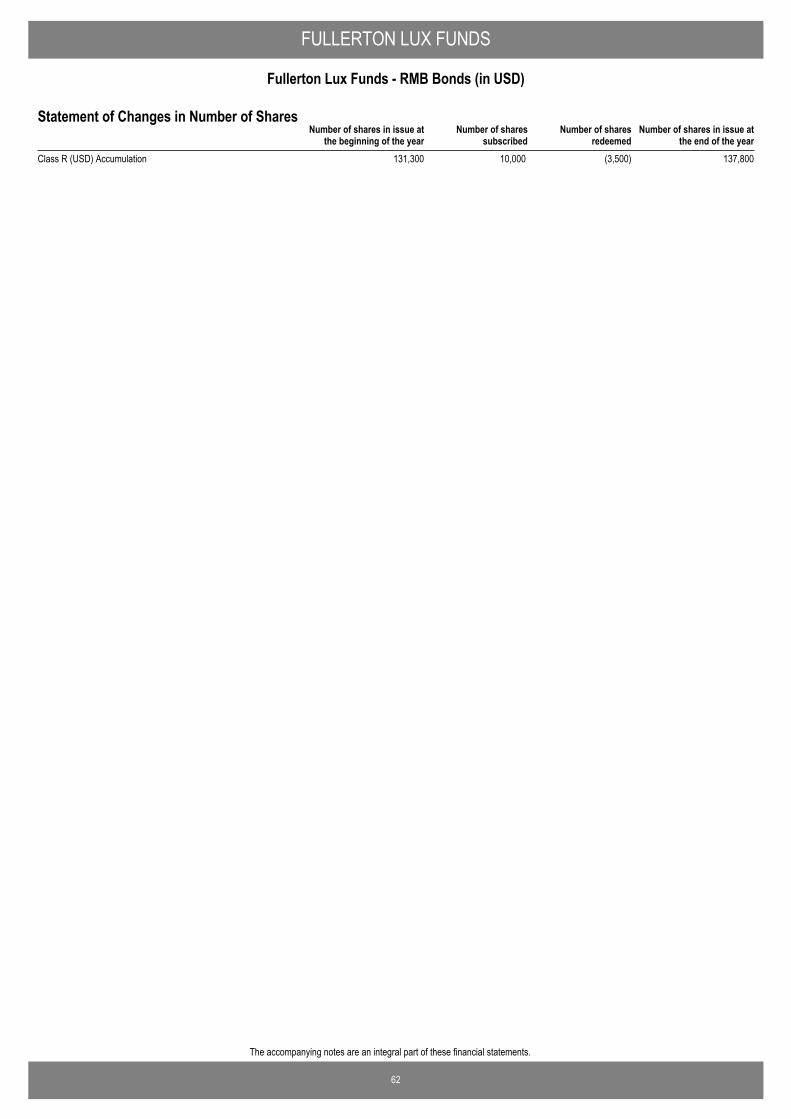
62
The accompanying notes are an integral part of these financial statements.
FULLERTON LUX FUNDS
Fullerton Lux Funds - RMB Bonds (in USD)
Number of shares in issue atthe end of the year
Number of shares in issue atthe beginning of the year
Number of sharessubscribed
Number of sharesredeemed
Statement of Changes in Number of Shares
Class R (USD) Accumulation 131,300 10,000 (3,500) 137,800
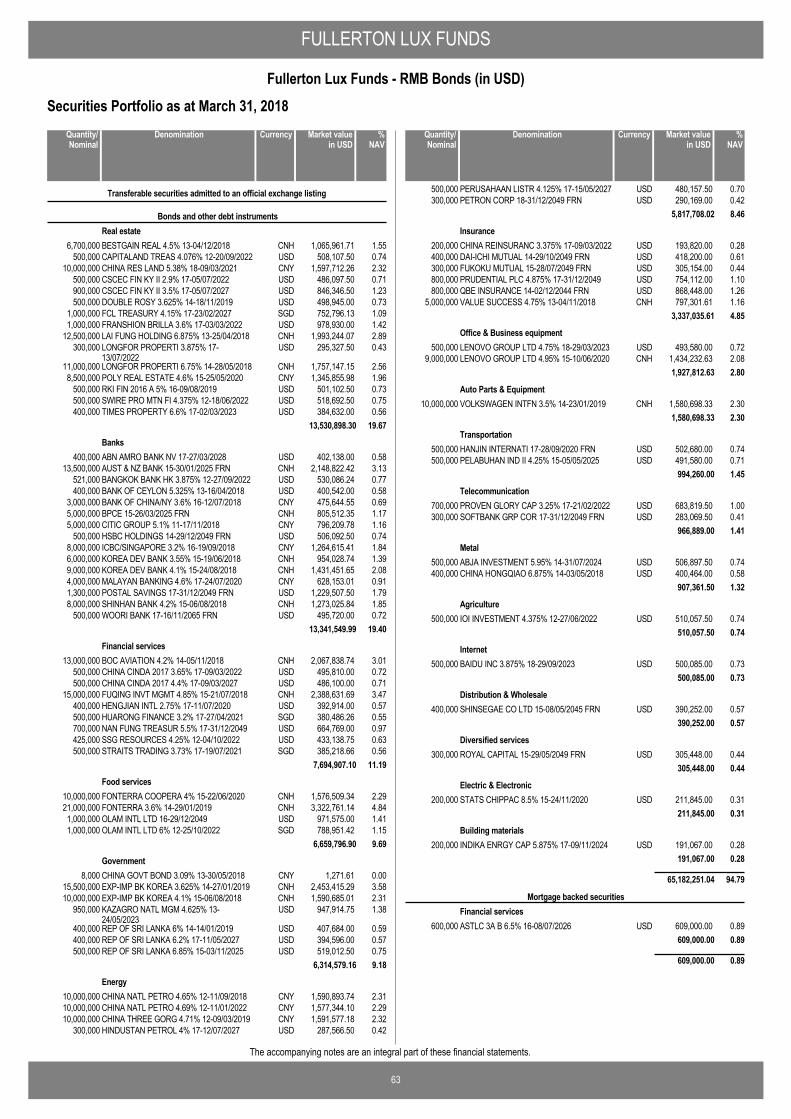
FULLERTON LUX FUNDS
63
Fullerton Lux Funds - RMB Bonds (in USD)
The accompanying notes are an integral part of these financial statements.
Securities Portfolio as at March 31, 2018
BESTGAIN REAL 4.5% 13-04/12/2018 CNH 1,065,961.71 1.556,700,000
Transferable securities admitted to an official exchange listing
Bonds and other debt instrumentsReal estate
CAPITALAND TREAS 4.076% 12-20/09/2022 USD 508,107.50 0.74500,000CHINA RES LAND 5.38% 18-09/03/2021 CNY 1,597,712.26 2.3210,000,000CSCEC FIN KY II 2.9% 17-05/07/2022 USD 486,097.50 0.71500,000CSCEC FIN KY II 3.5% 17-05/07/2027 USD 846,346.50 1.23900,000DOUBLE ROSY 3.625% 14-18/11/2019 USD 498,945.00 0.73500,000FCL TREASURY 4.15% 17-23/02/2027 SGD 752,796.13 1.091,000,000FRANSHION BRILLA 3.6% 17-03/03/2022 USD 978,930.00 1.421,000,000LAI FUNG HOLDING 6.875% 13-25/04/2018 CNH 1,993,244.07 2.8912,500,000LONGFOR PROPERTI 3.875% 17-13/07/2022
USD 295,327.50 0.43300,000
LONGFOR PROPERTI 6.75% 14-28/05/2018 CNH 1,757,147.15 2.5611,000,000POLY REAL ESTATE 4.6% 15-25/05/2020 CNY 1,345,855.98 1.968,500,000RKI FIN 2016 A 5% 16-09/08/2019 USD 501,102.50 0.73500,000SWIRE PRO MTN FI 4.375% 12-18/06/2022 USD 518,692.50 0.75500,000TIMES PROPERTY 6.6% 17-02/03/2023 USD 384,632.00 0.56400,000
13,530,898.30 19.67
ABN AMRO BANK NV 17-27/03/2028 USD 402,138.00 0.58400,000Banks
AUST & NZ BANK 15-30/01/2025 FRN CNH 2,148,822.42 3.1313,500,000BANGKOK BANK HK 3.875% 12-27/09/2022 USD 530,086.24 0.77521,000BANK OF CEYLON 5.325% 13-16/04/2018 USD 400,542.00 0.58400,000BANK OF CHINA/NY 3.6% 16-12/07/2018 CNY 475,644.55 0.693,000,000BPCE 15-26/03/2025 FRN CNH 805,512.35 1.175,000,000CITIC GROUP 5.1% 11-17/11/2018 CNY 796,209.78 1.165,000,000HSBC HOLDINGS 14-29/12/2049 FRN USD 506,092.50 0.74500,000ICBC/SINGAPORE 3.2% 16-19/09/2018 CNY 1,264,615.41 1.848,000,000KOREA DEV BANK 3.55% 15-19/06/2018 CNH 954,028.74 1.396,000,000KOREA DEV BANK 4.1% 15-24/08/2018 CNH 1,431,451.65 2.089,000,000MALAYAN BANKING 4.6% 17-24/07/2020 CNY 628,153.01 0.914,000,000POSTAL SAVINGS 17-31/12/2049 FRN USD 1,229,507.50 1.791,300,000SHINHAN BANK 4.2% 15-06/08/2018 CNH 1,273,025.84 1.858,000,000WOORI BANK 17-16/11/2065 FRN USD 495,720.00 0.72500,000
13,341,549.99 19.40
BOC AVIATION 4.2% 14-05/11/2018 CNH 2,067,838.74 3.0113,000,000Financial services
CHINA CINDA 2017 3.65% 17-09/03/2022 USD 495,810.00 0.72500,000CHINA CINDA 2017 4.4% 17-09/03/2027 USD 486,100.00 0.71500,000FUQING INVT MGMT 4.85% 15-21/07/2018 CNH 2,388,631.69 3.4715,000,000HENGJIAN INTL 2.75% 17-11/07/2020 USD 392,914.00 0.57400,000HUARONG FINANCE 3.2% 17-27/04/2021 SGD 380,486.26 0.55500,000NAN FUNG TREASUR 5.5% 17-31/12/2049 USD 664,769.00 0.97700,000SSG RESOURCES 4.25% 12-04/10/2022 USD 433,138.75 0.63425,000STRAITS TRADING 3.73% 17-19/07/2021 SGD 385,218.66 0.56500,000
7,694,907.10 11.19
FONTERRA COOPERA 4% 15-22/06/2020 CNH 1,576,509.34 2.2910,000,000Food services
FONTERRA 3.6% 14-29/01/2019 CNH 3,322,761.14 4.8421,000,000OLAM INTL LTD 16-29/12/2049 USD 971,575.00 1.411,000,000OLAM INTL LTD 6% 12-25/10/2022 SGD 788,951.42 1.151,000,000
6,659,796.90 9.69
CHINA GOVT BOND 3.09% 13-30/05/2018 CNY 1,271.61 0.008,000Government
EXP-IMP BK KOREA 3.625% 14-27/01/2019 CNH 2,453,415.29 3.5815,500,000EXP-IMP BK KOREA 4.1% 15-06/08/2018 CNH 1,590,685.01 2.3110,000,000KAZAGRO NATL MGM 4.625% 13-24/05/2023
USD 947,914.75 1.38950,000
REP OF SRI LANKA 6% 14-14/01/2019 USD 407,684.00 0.59400,000REP OF SRI LANKA 6.2% 17-11/05/2027 USD 394,596.00 0.57400,000REP OF SRI LANKA 6.85% 15-03/11/2025 USD 519,012.50 0.75500,000
6,314,579.16 9.18
CHINA NATL PETRO 4.65% 12-11/09/2018 CNY 1,590,893.74 2.3110,000,000Energy
CHINA NATL PETRO 4.69% 12-11/01/2022 CNY 1,577,344.10 2.2910,000,000CHINA THREE GORG 4.71% 12-09/03/2019 CNY 1,591,577.18 2.3210,000,000HINDUSTAN PETROL 4% 17-12/07/2027 USD 287,566.50 0.42300,000
DenominationQuantity/Nominal
Market valuein USD
Currency %NAV
PERUSAHAAN LISTR 4.125% 17-15/05/2027 USD 480,157.50 0.70500,000PETRON CORP 18-31/12/2049 FRN USD 290,169.00 0.42300,000
5,817,708.02 8.46
CHINA REINSURANC 3.375% 17-09/03/2022 USD 193,820.00 0.28200,000Insurance
DAI-ICHI MUTUAL 14-29/10/2049 FRN USD 418,200.00 0.61400,000FUKOKU MUTUAL 15-28/07/2049 FRN USD 305,154.00 0.44300,000PRUDENTIAL PLC 4.875% 17-31/12/2049 USD 754,112.00 1.10800,000QBE INSURANCE 14-02/12/2044 FRN USD 868,448.00 1.26800,000VALUE SUCCESS 4.75% 13-04/11/2018 CNH 797,301.61 1.165,000,000
3,337,035.61 4.85
LENOVO GROUP LTD 4.75% 18-29/03/2023 USD 493,580.00 0.72500,000Office & Business equipment
LENOVO GROUP LTD 4.95% 15-10/06/2020 CNH 1,434,232.63 2.089,000,0001,927,812.63 2.80
VOLKSWAGEN INTFN 3.5% 14-23/01/2019 CNH 1,580,698.33 2.3010,000,000Auto Parts & Equipment
1,580,698.33 2.30
HANJIN INTERNATI 17-28/09/2020 FRN USD 502,680.00 0.74500,000Transportation
PELABUHAN IND II 4.25% 15-05/05/2025 USD 491,580.00 0.71500,000994,260.00 1.45
PROVEN GLORY CAP 3.25% 17-21/02/2022 USD 683,819.50 1.00700,000Telecommunication
SOFTBANK GRP COR 17-31/12/2049 FRN USD 283,069.50 0.41300,000966,889.00 1.41
ABJA INVESTMENT 5.95% 14-31/07/2024 USD 506,897.50 0.74500,000Metal
CHINA HONGQIAO 6.875% 14-03/05/2018 USD 400,464.00 0.58400,000907,361.50 1.32
IOI INVESTMENT 4.375% 12-27/06/2022 USD 510,057.50 0.74500,000Agriculture
510,057.50 0.74
BAIDU INC 3.875% 18-29/09/2023 USD 500,085.00 0.73500,000Internet
500,085.00 0.73
SHINSEGAE CO LTD 15-08/05/2045 FRN USD 390,252.00 0.57400,000Distribution & Wholesale
390,252.00 0.57
ROYAL CAPITAL 15-29/05/2049 FRN USD 305,448.00 0.44300,000Diversified services
305,448.00 0.44
STATS CHIPPAC 8.5% 15-24/11/2020 USD 211,845.00 0.31200,000Electric & Electronic
211,845.00 0.31
INDIKA ENRGY CAP 5.875% 17-09/11/2024 USD 191,067.00 0.28200,000Building materials
191,067.00 0.28
65,182,251.04 94.79
ASTLC 3A B 6.5% 16-08/07/2026 USD 609,000.00 0.89600,000
Mortgage backed securitiesFinancial services
609,000.00 0.89
609,000.00 0.89
DenominationQuantity/Nominal
Market valuein USD
Currency %NAV
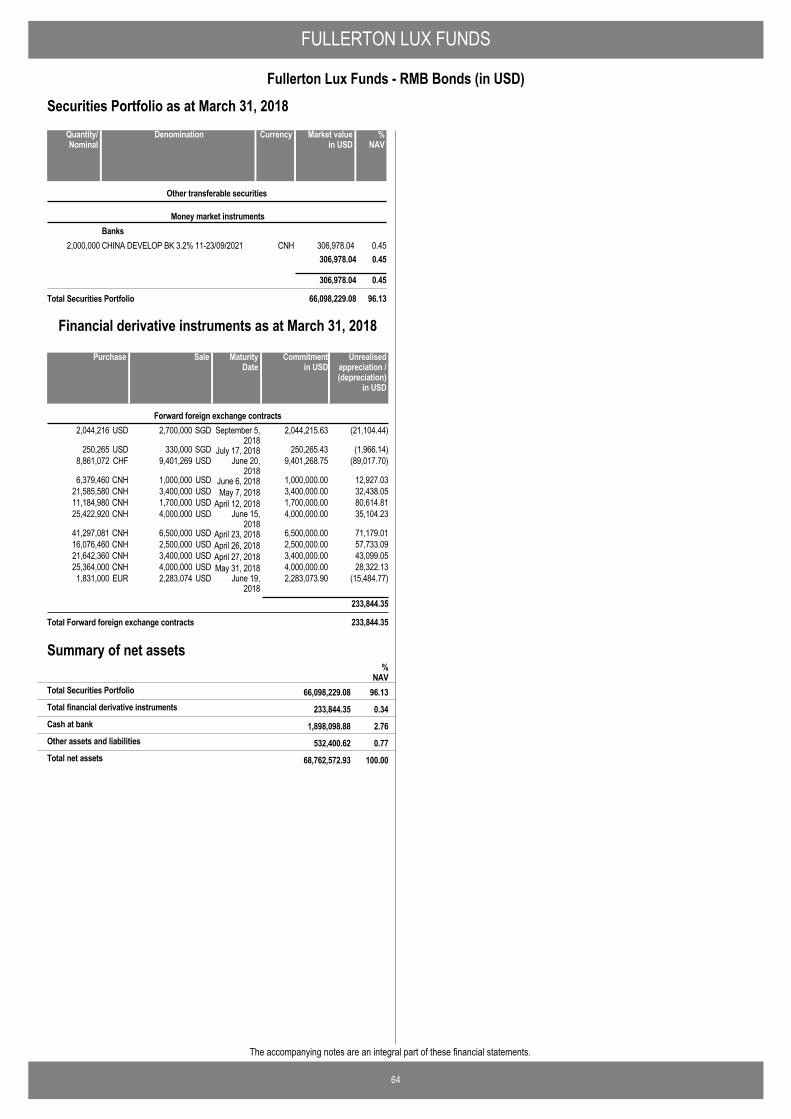
FULLERTON LUX FUNDS
64
Fullerton Lux Funds - RMB Bonds (in USD)
The accompanying notes are an integral part of these financial statements.
Securities Portfolio as at March 31, 2018
CHINA DEVELOP BK 3.2% 11-23/09/2021 CNH 306,978.04 0.452,000,000
Other transferable securities
Money market instrumentsBanks
306,978.04 0.45
306,978.04 0.45
Total Securities Portfolio 66,098,229.08 96.13
DenominationQuantity/Nominal
Market valuein USD
Currency %NAV
2,700,000 September 5,2018
2,044,216 (21,104.44)SGDUSD 2,044,215.63Forward foreign exchange contracts
330,000 July 17, 2018250,265 (1,966.14)SGDUSD 250,265.439,401,269 June 20,
20188,861,072 (89,017.70)USDCHF 9,401,268.75
1,000,000 June 6, 20186,379,460 12,927.03USDCNH 1,000,000.003,400,000 May 7, 201821,585,580 32,438.05USDCNH 3,400,000.001,700,000 April 12, 201811,184,980 80,614.81USDCNH 1,700,000.004,000,000 June 15,
201825,422,920 35,104.23USDCNH 4,000,000.00
6,500,000 April 23, 201841,297,081 71,179.01USDCNH 6,500,000.002,500,000 April 26, 201816,076,460 57,733.09USDCNH 2,500,000.003,400,000 April 27, 201821,642,360 43,099.05USDCNH 3,400,000.004,000,000 May 31, 201825,364,000 28,322.13USDCNH 4,000,000.002,283,074 June 19,
20181,831,000 (15,484.77)USDEUR 2,283,073.90
233,844.35
Total Forward foreign exchange contracts 233,844.35
SalePurchase Unrealisedappreciation /(depreciation)
in USD
MaturityDate
Commitmentin USD
Financial derivative instruments as at March 31, 2018
Summary of net assets
233,844.35 0.34Total financial derivative instruments
%NAV
66,098,229.08 96.13Total Securities Portfolio
1,898,098.88 2.76Cash at bank
532,400.62 0.77Other assets and liabilities
68,762,572.93 100.00Total net assets

FULLERTON LUX FUNDS
65
Fullerton Lux Funds - RMB Bonds (in USD)
The accompanying notes are an integral part of these financial statements.
Nature allocation % of portfolio % of netassets
Bonds and other debt instruments 98.61 94.79
Other 1.39 1.34
100.00 96.13
Country allocation % of portfolio % of netassets
China 15.41 14.81
South Korea 13.00 12.50
Virgin Islands 12.80 12.31
Cayman Islands 12.50 12.01
Singapore 10.58 10.18
New Zealand 7.41 7.13
Hong Kong 5.31 5.10
Australia 4.56 4.39
Netherlands 3.46 3.32
Sri Lanka 2.60 2.49
Malaysia 2.38 2.28
Other 9.99 9.61
100.00 96.13
Portfolio Breakdowns
Top Ten Holdings Market value % ofnet
assets
FONTERRA 3.6% 14-29/01/2019 3,322,761.14 4.84Food services
EXP-IMP BK KOREA 3.625% 14-27/01/2019 2,453,415.29 3.58Government
FUQING INVT MGMT 4.85% 15-21/07/2018 2,388,631.69 3.47Financial services
AUST & NZ BANK 15-30/01/2025 FRN 2,148,822.42 3.13Banks
BOC AVIATION 4.2% 14-05/11/2018 2,067,838.74 3.01Financial services
LAI FUNG HOLDING 6.875% 13-25/04/2018 1,993,244.07 2.89Real estate
LONGFOR PROPERTI 6.75% 14-28/05/2018 1,757,147.15 2.56Real estate
CHINA RES LAND 5.38% 18-09/03/2021 1,597,712.26 2.32Real estate
CHINA THREE GORG 4.71% 12-09/03/2019 1,591,577.18 2.32Energy
CHINA NATL PETRO 4.65% 12-11/09/2018 1,590,893.74 2.31Energy
USD
Sector
Top Ten Holdings
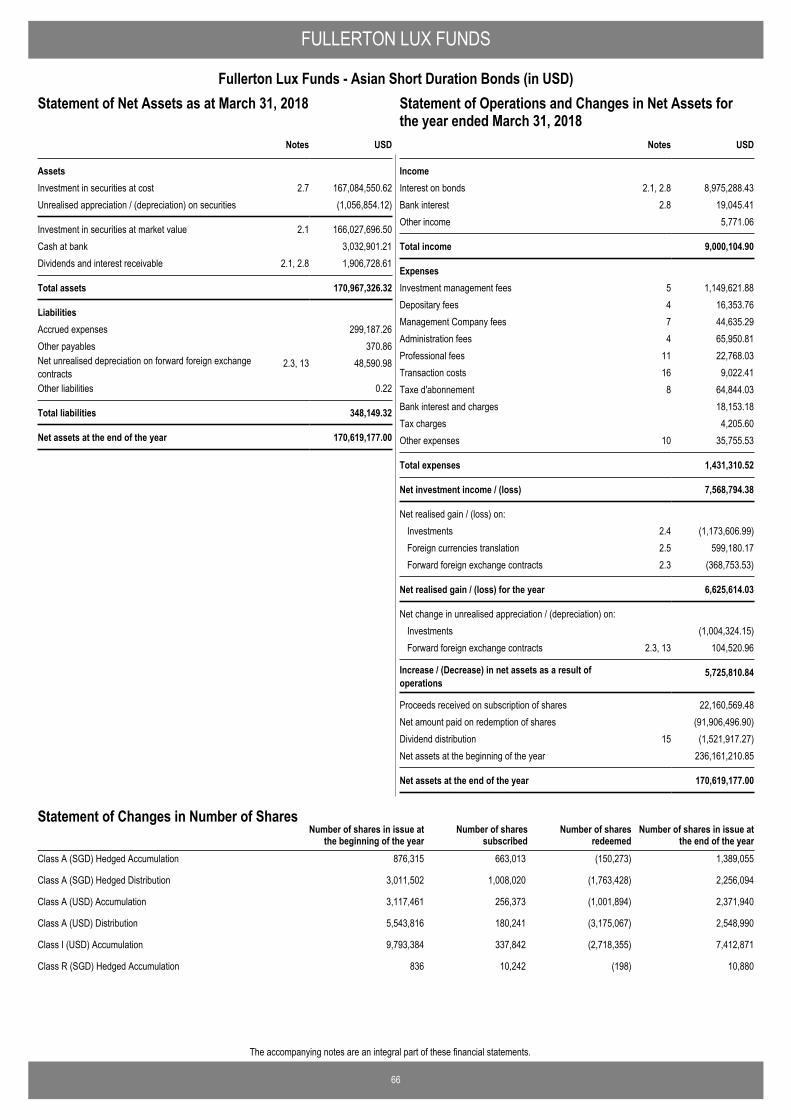
66
The accompanying notes are an integral part of these financial statements.
FULLERTON LUX FUNDS
Fullerton Lux Funds - Asian Short Duration Bonds (in USD)Statement of Operations and Changes in Net Assets for theyear ended March 31, 2018
USD
AssetsInvestment in securities at cost 2.7 167,084,550.62Unrealised appreciation / (depreciation) on securities (1,056,854.12)
Investment in securities at market value 2.1 166,027,696.50Cash at bank 3,032,901.21Dividends and interest receivable 2.1, 2.8 1,906,728.61
Total assets 170,967,326.32
LiabilitiesAccrued expenses 299,187.26Other payables 370.86Net unrealised depreciation on forward foreign exchangecontracts
2.3, 13 48,590.98
Other liabilities 0.22
Total liabilities 348,149.32
Net assets at the end of the year 170,619,177.00
Notes
Statement of Net Assets as at March 31, 2018
IncomeInterest on bonds 2.1, 2.8 8,975,288.43Bank interest 2.8 19,045.41Other income 5,771.06
Total income 9,000,104.90
ExpensesInvestment management fees 5 1,149,621.88Depositary fees 4 16,353.76Management Company fees 7 44,635.29Administration fees 4 65,950.81Professional fees 11 22,768.03Transaction costs 16 9,022.41Taxe d'abonnement 8 64,844.03Bank interest and charges 18,153.18Tax charges 4,205.60Other expenses 10 35,755.53
Total expenses 1,431,310.52
Net investment income / (loss) 7,568,794.38
Net realised gain / (loss) on: Investments 2.4 (1,173,606.99)Foreign currencies translation 2.5 599,180.17Forward foreign exchange contracts 2.3 (368,753.53)
Net realised gain / (loss) for the year 6,625,614.03
Net change in unrealised appreciation / (depreciation) on: Investments (1,004,324.15)Forward foreign exchange contracts 2.3, 13 104,520.96
Increase / (Decrease) in net assets as a result ofoperations
5,725,810.84
Proceeds received on subscription of shares 22,160,569.48Net amount paid on redemption of shares (91,906,496.90)Dividend distribution 15 (1,521,917.27)Net assets at the beginning of the year 236,161,210.85
Net assets at the end of the year 170,619,177.00
USDNotes
Statement of Operations and Changes in Net Assets forthe year ended March 31, 2018
Number of shares in issue atthe end of the year
Number of shares in issue atthe beginning of the year
Number of sharessubscribed
Number of sharesredeemed
Statement of Changes in Number of Shares
Class A (SGD) Hedged Accumulation 876,315 663,013 (150,273) 1,389,055
Class A (SGD) Hedged Distribution 3,011,502 1,008,020 (1,763,428) 2,256,094
Class A (USD) Accumulation 3,117,461 256,373 (1,001,894) 2,371,940
Class A (USD) Distribution 5,543,816 180,241 (3,175,067) 2,548,990
Class I (USD) Accumulation 9,793,384 337,842 (2,718,355) 7,412,871
Class R (SGD) Hedged Accumulation 836 10,242 (198) 10,880
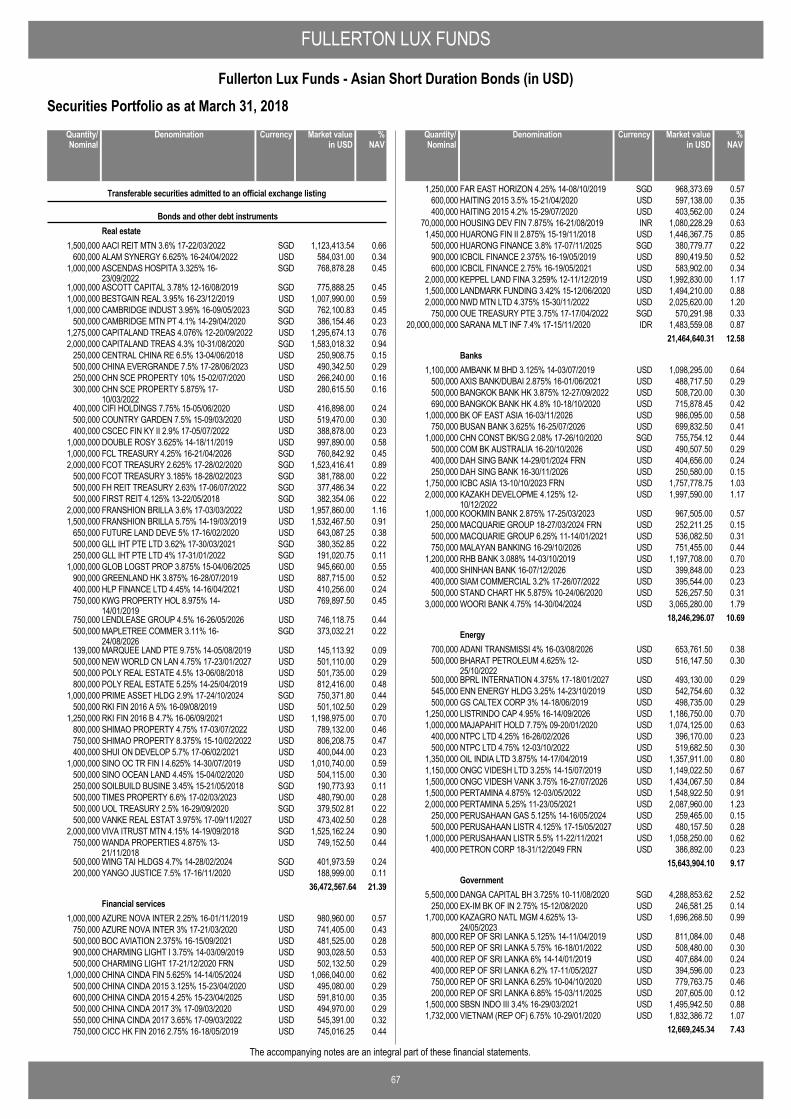
FULLERTON LUX FUNDS
67
Fullerton Lux Funds - Asian Short Duration Bonds (in USD)
The accompanying notes are an integral part of these financial statements.
Securities Portfolio as at March 31, 2018
AACI REIT MTN 3.6% 17-22/03/2022 SGD 1,123,413.54 0.661,500,000
Transferable securities admitted to an official exchange listing
Bonds and other debt instrumentsReal estate
ALAM SYNERGY 6.625% 16-24/04/2022 USD 584,031.00 0.34600,000ASCENDAS HOSPITA 3.325% 16-23/09/2022
SGD 768,878.28 0.451,000,000
ASCOTT CAPITAL 3.78% 12-16/08/2019 SGD 775,888.25 0.451,000,000BESTGAIN REAL 3.95% 16-23/12/2019 USD 1,007,990.00 0.591,000,000CAMBRIDGE INDUST 3.95% 16-09/05/2023 SGD 762,100.83 0.451,000,000CAMBRIDGE MTN PT 4.1% 14-29/04/2020 SGD 386,154.46 0.23500,000CAPITALAND TREAS 4.076% 12-20/09/2022 USD 1,295,674.13 0.761,275,000CAPITALAND TREAS 4.3% 10-31/08/2020 SGD 1,583,018.32 0.942,000,000CENTRAL CHINA RE 6.5% 13-04/06/2018 USD 250,908.75 0.15250,000CHINA EVERGRANDE 7.5% 17-28/06/2023 USD 490,342.50 0.29500,000CHN SCE PROPERTY 10% 15-02/07/2020 USD 266,240.00 0.16250,000CHN SCE PROPERTY 5.875% 17-10/03/2022
USD 280,615.50 0.16300,000
CIFI HOLDINGS 7.75% 15-05/06/2020 USD 416,898.00 0.24400,000COUNTRY GARDEN 7.5% 15-09/03/2020 USD 519,470.00 0.30500,000CSCEC FIN KY II 2.9% 17-05/07/2022 USD 388,878.00 0.23400,000DOUBLE ROSY 3.625% 14-18/11/2019 USD 997,890.00 0.581,000,000FCL TREASURY 4.25% 16-21/04/2026 SGD 760,842.92 0.451,000,000FCOT TREASURY 2.625% 17-28/02/2020 SGD 1,523,416.41 0.892,000,000FCOT TREASURY 3.185% 18-28/02/2023 SGD 381,788.00 0.22500,000FH REIT TREASURY 2.63% 17-06/07/2022 SGD 377,486.34 0.22500,000FIRST REIT 4.125% 13-22/05/2018 SGD 382,354.06 0.22500,000FRANSHION BRILLA 3.6% 17-03/03/2022 USD 1,957,860.00 1.162,000,000FRANSHION BRILLA 5.75% 14-19/03/2019 USD 1,532,467.50 0.911,500,000FUTURE LAND DEVE 5% 17-16/02/2020 USD 643,087.25 0.38650,000GLL IHT PTE LTD 3.62% 17-30/03/2021 SGD 380,352.85 0.22500,000GLL IHT PTE LTD 4% 17-31/01/2022 SGD 191,020.75 0.11250,000GLOB LOGST PROP 3.875% 15-04/06/2025 USD 945,660.00 0.551,000,000GREENLAND HK 3.875% 16-28/07/2019 USD 887,715.00 0.52900,000HLP FINANCE LTD 4.45% 14-16/04/2021 USD 410,256.00 0.24400,000KWG PROPERTY HOL 8.975% 14-14/01/2019
USD 769,897.50 0.45750,000
LENDLEASE GROUP 4.5% 16-26/05/2026 USD 746,118.75 0.44750,000MAPLETREE COMMER 3.11% 16-24/08/2026
SGD 373,032.21 0.22500,000
MARQUEE LAND PTE 9.75% 14-05/08/2019 USD 145,113.92 0.09139,000NEW WORLD CN LAN 4.75% 17-23/01/2027 USD 501,110.00 0.29500,000POLY REAL ESTATE 4.5% 13-06/08/2018 USD 501,735.00 0.29500,000POLY REAL ESTATE 5.25% 14-25/04/2019 USD 812,416.00 0.48800,000PRIME ASSET HLDG 2.9% 17-24/10/2024 SGD 750,371.80 0.441,000,000RKI FIN 2016 A 5% 16-09/08/2019 USD 501,102.50 0.29500,000RKI FIN 2016 B 4.7% 16-06/09/2021 USD 1,198,975.00 0.701,250,000SHIMAO PROPERTY 4.75% 17-03/07/2022 USD 789,132.00 0.46800,000SHIMAO PROPERTY 8.375% 15-10/02/2022 USD 806,208.75 0.47750,000SHUI ON DEVELOP 5.7% 17-06/02/2021 USD 400,044.00 0.23400,000SINO OC TR FIN I 4.625% 14-30/07/2019 USD 1,010,740.00 0.591,000,000SINO OCEAN LAND 4.45% 15-04/02/2020 USD 504,115.00 0.30500,000SOILBUILD BUSINE 3.45% 15-21/05/2018 SGD 190,773.93 0.11250,000TIMES PROPERTY 6.6% 17-02/03/2023 USD 480,790.00 0.28500,000UOL TREASURY 2.5% 16-29/09/2020 SGD 379,502.81 0.22500,000VANKE REAL ESTAT 3.975% 17-09/11/2027 USD 473,402.50 0.28500,000VIVA ITRUST MTN 4.15% 14-19/09/2018 SGD 1,525,162.24 0.902,000,000WANDA PROPERTIES 4.875% 13-21/11/2018
USD 749,152.50 0.44750,000
WING TAI HLDGS 4.7% 14-28/02/2024 SGD 401,973.59 0.24500,000YANGO JUSTICE 7.5% 17-16/11/2020 USD 188,999.00 0.11200,000
36,472,567.64 21.39
AZURE NOVA INTER 2.25% 16-01/11/2019 USD 980,960.00 0.571,000,000Financial services
AZURE NOVA INTER 3% 17-21/03/2020 USD 741,405.00 0.43750,000BOC AVIATION 2.375% 16-15/09/2021 USD 481,525.00 0.28500,000CHARMING LIGHT I 3.75% 14-03/09/2019 USD 903,028.50 0.53900,000CHARMING LIGHT 17-21/12/2020 FRN USD 502,132.50 0.29500,000CHINA CINDA FIN 5.625% 14-14/05/2024 USD 1,066,040.00 0.621,000,000CHINA CINDA 2015 3.125% 15-23/04/2020 USD 495,080.00 0.29500,000CHINA CINDA 2015 4.25% 15-23/04/2025 USD 591,810.00 0.35600,000CHINA CINDA 2017 3% 17-09/03/2020 USD 494,970.00 0.29500,000CHINA CINDA 2017 3.65% 17-09/03/2022 USD 545,391.00 0.32550,000CICC HK FIN 2016 2.75% 16-18/05/2019 USD 745,016.25 0.44750,000
DenominationQuantity/Nominal
Market valuein USD
Currency %NAV
FAR EAST HORIZON 4.25% 14-08/10/2019 SGD 968,373.69 0.571,250,000HAITING 2015 3.5% 15-21/04/2020 USD 597,138.00 0.35600,000HAITING 2015 4.2% 15-29/07/2020 USD 403,562.00 0.24400,000HOUSING DEV FIN 7.875% 16-21/08/2019 INR 1,080,228.29 0.6370,000,000HUARONG FIN II 2.875% 15-19/11/2018 USD 1,446,367.75 0.851,450,000HUARONG FINANCE 3.8% 17-07/11/2025 SGD 380,779.77 0.22500,000ICBCIL FINANCE 2.375% 16-19/05/2019 USD 890,419.50 0.52900,000ICBCIL FINANCE 2.75% 16-19/05/2021 USD 583,902.00 0.34600,000KEPPEL LAND FINA 3.259% 12-11/12/2019 USD 1,992,830.00 1.172,000,000LANDMARK FUNDING 3.42% 15-12/06/2020 USD 1,494,210.00 0.881,500,000NWD MTN LTD 4.375% 15-30/11/2022 USD 2,025,620.00 1.202,000,000OUE TREASURY PTE 3.75% 17-17/04/2022 SGD 570,291.98 0.33750,000SARANA MLT INF 7.4% 17-15/11/2020 IDR 1,483,559.08 0.8720,000,000,000
21,464,640.31 12.58
AMBANK M BHD 3.125% 14-03/07/2019 USD 1,098,295.00 0.641,100,000Banks
AXIS BANK/DUBAI 2.875% 16-01/06/2021 USD 488,717.50 0.29500,000BANGKOK BANK HK 3.875% 12-27/09/2022 USD 508,720.00 0.30500,000BANGKOK BANK HK 4.8% 10-18/10/2020 USD 715,878.45 0.42690,000BK OF EAST ASIA 16-03/11/2026 USD 986,095.00 0.581,000,000BUSAN BANK 3.625% 16-25/07/2026 USD 699,832.50 0.41750,000CHN CONST BK/SG 2.08% 17-26/10/2020 SGD 755,754.12 0.441,000,000COM BK AUSTRALIA 16-20/10/2026 USD 490,507.50 0.29500,000DAH SING BANK 14-29/01/2024 FRN USD 404,656.00 0.24400,000DAH SING BANK 16-30/11/2026 USD 250,580.00 0.15250,000ICBC ASIA 13-10/10/2023 FRN USD 1,757,778.75 1.031,750,000KAZAKH DEVELOPME 4.125% 12-10/12/2022
USD 1,997,590.00 1.172,000,000
KOOKMIN BANK 2.875% 17-25/03/2023 USD 967,505.00 0.571,000,000MACQUARIE GROUP 18-27/03/2024 FRN USD 252,211.25 0.15250,000MACQUARIE GROUP 6.25% 11-14/01/2021 USD 536,082.50 0.31500,000MALAYAN BANKING 16-29/10/2026 USD 751,455.00 0.44750,000RHB BANK 3.088% 14-03/10/2019 USD 1,197,708.00 0.701,200,000SHINHAN BANK 16-07/12/2026 USD 399,848.00 0.23400,000SIAM COMMERCIAL 3.2% 17-26/07/2022 USD 395,544.00 0.23400,000STAND CHART HK 5.875% 10-24/06/2020 USD 526,257.50 0.31500,000WOORI BANK 4.75% 14-30/04/2024 USD 3,065,280.00 1.793,000,000
18,246,296.07 10.69
ADANI TRANSMISSI 4% 16-03/08/2026 USD 653,761.50 0.38700,000Energy
BHARAT PETROLEUM 4.625% 12-25/10/2022
USD 516,147.50 0.30500,000
BPRL INTERNATION 4.375% 17-18/01/2027 USD 493,130.00 0.29500,000ENN ENERGY HLDG 3.25% 14-23/10/2019 USD 542,754.60 0.32545,000GS CALTEX CORP 3% 14-18/06/2019 USD 498,735.00 0.29500,000LISTRINDO CAP 4.95% 16-14/09/2026 USD 1,186,750.00 0.701,250,000MAJAPAHIT HOLD 7.75% 09-20/01/2020 USD 1,074,125.00 0.631,000,000NTPC LTD 4.25% 16-26/02/2026 USD 396,170.00 0.23400,000NTPC LTD 4.75% 12-03/10/2022 USD 519,682.50 0.30500,000OIL INDIA LTD 3.875% 14-17/04/2019 USD 1,357,911.00 0.801,350,000ONGC VIDESH LTD 3.25% 14-15/07/2019 USD 1,149,022.50 0.671,150,000ONGC VIDESH VANK 3.75% 16-27/07/2026 USD 1,434,067.50 0.841,500,000PERTAMINA 4.875% 12-03/05/2022 USD 1,548,922.50 0.911,500,000PERTAMINA 5.25% 11-23/05/2021 USD 2,087,960.00 1.232,000,000PERUSAHAAN GAS 5.125% 14-16/05/2024 USD 259,465.00 0.15250,000PERUSAHAAN LISTR 4.125% 17-15/05/2027 USD 480,157.50 0.28500,000PERUSAHAAN LISTR 5.5% 11-22/11/2021 USD 1,058,250.00 0.621,000,000PETRON CORP 18-31/12/2049 FRN USD 386,892.00 0.23400,000
15,643,904.10 9.17
DANGA CAPITAL BH 3.725% 10-11/08/2020 SGD 4,288,853.62 2.525,500,000Government
EX-IM BK OF IN 2.75% 15-12/08/2020 USD 246,581.25 0.14250,000KAZAGRO NATL MGM 4.625% 13-24/05/2023
USD 1,696,268.50 0.991,700,000
REP OF SRI LANKA 5.125% 14-11/04/2019 USD 811,084.00 0.48800,000REP OF SRI LANKA 5.75% 16-18/01/2022 USD 508,480.00 0.30500,000REP OF SRI LANKA 6% 14-14/01/2019 USD 407,684.00 0.24400,000REP OF SRI LANKA 6.2% 17-11/05/2027 USD 394,596.00 0.23400,000REP OF SRI LANKA 6.25% 10-04/10/2020 USD 779,763.75 0.46750,000REP OF SRI LANKA 6.85% 15-03/11/2025 USD 207,605.00 0.12200,000SBSN INDO III 3.4% 16-29/03/2021 USD 1,495,942.50 0.881,500,000VIETNAM (REP OF) 6.75% 10-29/01/2020 USD 1,832,386.72 1.071,732,000
12,669,245.34 7.43
DenominationQuantity/Nominal
Market valuein USD
Currency %NAV
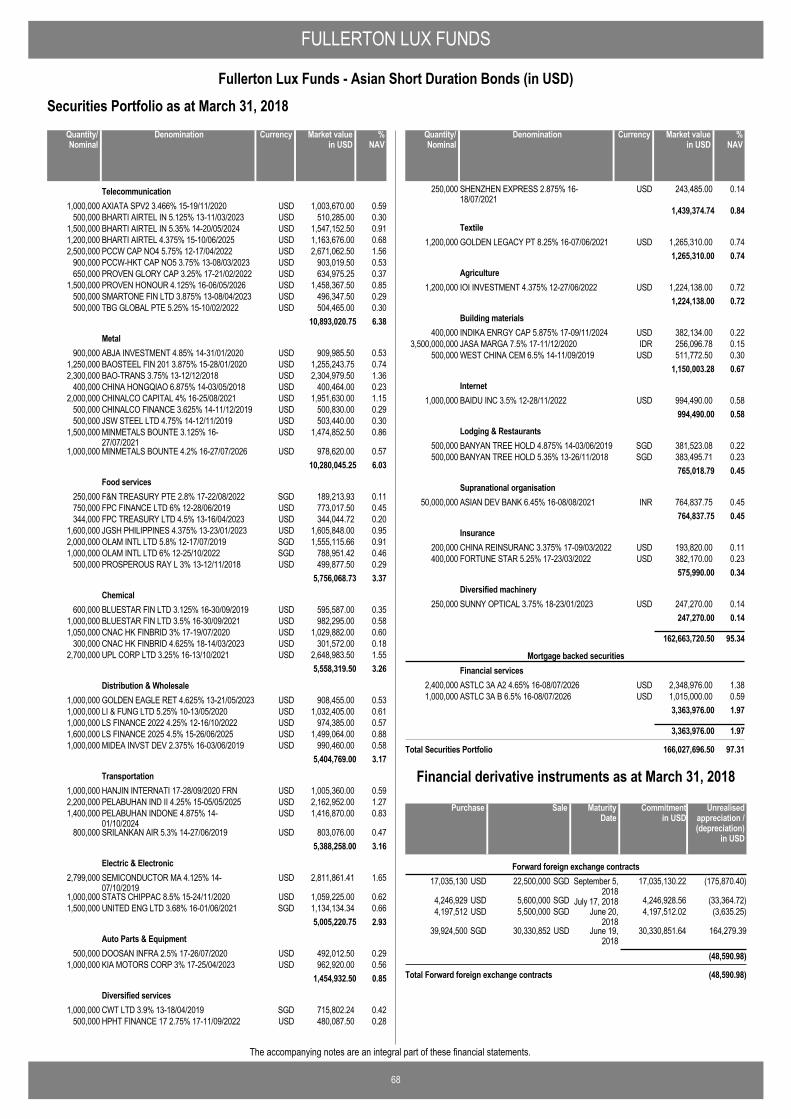
FULLERTON LUX FUNDS
68
Fullerton Lux Funds - Asian Short Duration Bonds (in USD)
The accompanying notes are an integral part of these financial statements.
Securities Portfolio as at March 31, 2018
AXIATA SPV2 3.466% 15-19/11/2020 USD 1,003,670.00 0.591,000,000Telecommunication
BHARTI AIRTEL IN 5.125% 13-11/03/2023 USD 510,285.00 0.30500,000BHARTI AIRTEL IN 5.35% 14-20/05/2024 USD 1,547,152.50 0.911,500,000BHARTI AIRTEL 4.375% 15-10/06/2025 USD 1,163,676.00 0.681,200,000PCCW CAP NO4 5.75% 12-17/04/2022 USD 2,671,062.50 1.562,500,000PCCW-HKT CAP NO5 3.75% 13-08/03/2023 USD 903,019.50 0.53900,000PROVEN GLORY CAP 3.25% 17-21/02/2022 USD 634,975.25 0.37650,000PROVEN HONOUR 4.125% 16-06/05/2026 USD 1,458,367.50 0.851,500,000SMARTONE FIN LTD 3.875% 13-08/04/2023 USD 496,347.50 0.29500,000TBG GLOBAL PTE 5.25% 15-10/02/2022 USD 504,465.00 0.30500,000
10,893,020.75 6.38
ABJA INVESTMENT 4.85% 14-31/01/2020 USD 909,985.50 0.53900,000Metal
BAOSTEEL FIN 201 3.875% 15-28/01/2020 USD 1,255,243.75 0.741,250,000BAO-TRANS 3.75% 13-12/12/2018 USD 2,304,979.50 1.362,300,000CHINA HONGQIAO 6.875% 14-03/05/2018 USD 400,464.00 0.23400,000CHINALCO CAPITAL 4% 16-25/08/2021 USD 1,951,630.00 1.152,000,000CHINALCO FINANCE 3.625% 14-11/12/2019 USD 500,830.00 0.29500,000JSW STEEL LTD 4.75% 14-12/11/2019 USD 503,440.00 0.30500,000MINMETALS BOUNTE 3.125% 16-27/07/2021
USD 1,474,852.50 0.861,500,000
MINMETALS BOUNTE 4.2% 16-27/07/2026 USD 978,620.00 0.571,000,00010,280,045.25 6.03
F&N TREASURY PTE 2.8% 17-22/08/2022 SGD 189,213.93 0.11250,000Food services
FPC FINANCE LTD 6% 12-28/06/2019 USD 773,017.50 0.45750,000FPC TREASURY LTD 4.5% 13-16/04/2023 USD 344,044.72 0.20344,000JGSH PHILIPPINES 4.375% 13-23/01/2023 USD 1,605,848.00 0.951,600,000OLAM INTL LTD 5.8% 12-17/07/2019 SGD 1,555,115.66 0.912,000,000OLAM INTL LTD 6% 12-25/10/2022 SGD 788,951.42 0.461,000,000PROSPEROUS RAY L 3% 13-12/11/2018 USD 499,877.50 0.29500,000
5,756,068.73 3.37
BLUESTAR FIN LTD 3.125% 16-30/09/2019 USD 595,587.00 0.35600,000Chemical
BLUESTAR FIN LTD 3.5% 16-30/09/2021 USD 982,295.00 0.581,000,000CNAC HK FINBRID 3% 17-19/07/2020 USD 1,029,882.00 0.601,050,000CNAC HK FINBRID 4.625% 18-14/03/2023 USD 301,572.00 0.18300,000UPL CORP LTD 3.25% 16-13/10/2021 USD 2,648,983.50 1.552,700,000
5,558,319.50 3.26
GOLDEN EAGLE RET 4.625% 13-21/05/2023 USD 908,455.00 0.531,000,000Distribution & Wholesale
LI & FUNG LTD 5.25% 10-13/05/2020 USD 1,032,405.00 0.611,000,000LS FINANCE 2022 4.25% 12-16/10/2022 USD 974,385.00 0.571,000,000LS FINANCE 2025 4.5% 15-26/06/2025 USD 1,499,064.00 0.881,600,000MIDEA INVST DEV 2.375% 16-03/06/2019 USD 990,460.00 0.581,000,000
5,404,769.00 3.17
HANJIN INTERNATI 17-28/09/2020 FRN USD 1,005,360.00 0.591,000,000Transportation
PELABUHAN IND II 4.25% 15-05/05/2025 USD 2,162,952.00 1.272,200,000PELABUHAN INDONE 4.875% 14-01/10/2024
USD 1,416,870.00 0.831,400,000
SRILANKAN AIR 5.3% 14-27/06/2019 USD 803,076.00 0.47800,0005,388,258.00 3.16
SEMICONDUCTOR MA 4.125% 14-07/10/2019
USD 2,811,861.41 1.652,799,000Electric & Electronic
STATS CHIPPAC 8.5% 15-24/11/2020 USD 1,059,225.00 0.621,000,000UNITED ENG LTD 3.68% 16-01/06/2021 SGD 1,134,134.34 0.661,500,000
5,005,220.75 2.93
DOOSAN INFRA 2.5% 17-26/07/2020 USD 492,012.50 0.29500,000Auto Parts & Equipment
KIA MOTORS CORP 3% 17-25/04/2023 USD 962,920.00 0.561,000,0001,454,932.50 0.85
CWT LTD 3.9% 13-18/04/2019 SGD 715,802.24 0.421,000,000Diversified services
HPHT FINANCE 17 2.75% 17-11/09/2022 USD 480,087.50 0.28500,000
DenominationQuantity/Nominal
Market valuein USD
Currency %NAV
SHENZHEN EXPRESS 2.875% 16-18/07/2021
USD 243,485.00 0.14250,000
1,439,374.74 0.84
GOLDEN LEGACY PT 8.25% 16-07/06/2021 USD 1,265,310.00 0.741,200,000Textile
1,265,310.00 0.74
IOI INVESTMENT 4.375% 12-27/06/2022 USD 1,224,138.00 0.721,200,000Agriculture
1,224,138.00 0.72
INDIKA ENRGY CAP 5.875% 17-09/11/2024 USD 382,134.00 0.22400,000Building materials
JASA MARGA 7.5% 17-11/12/2020 IDR 256,096.78 0.153,500,000,000WEST CHINA CEM 6.5% 14-11/09/2019 USD 511,772.50 0.30500,000
1,150,003.28 0.67
BAIDU INC 3.5% 12-28/11/2022 USD 994,490.00 0.581,000,000Internet
994,490.00 0.58
BANYAN TREE HOLD 4.875% 14-03/06/2019 SGD 381,523.08 0.22500,000Lodging & Restaurants
BANYAN TREE HOLD 5.35% 13-26/11/2018 SGD 383,495.71 0.23500,000765,018.79 0.45
ASIAN DEV BANK 6.45% 16-08/08/2021 INR 764,837.75 0.4550,000,000Supranational organisation
764,837.75 0.45
CHINA REINSURANC 3.375% 17-09/03/2022 USD 193,820.00 0.11200,000Insurance
FORTUNE STAR 5.25% 17-23/03/2022 USD 382,170.00 0.23400,000575,990.00 0.34
SUNNY OPTICAL 3.75% 18-23/01/2023 USD 247,270.00 0.14250,000Diversified machinery
247,270.00 0.14
162,663,720.50 95.34
ASTLC 3A A2 4.65% 16-08/07/2026 USD 2,348,976.00 1.382,400,000
Mortgage backed securitiesFinancial services
ASTLC 3A B 6.5% 16-08/07/2026 USD 1,015,000.00 0.591,000,0003,363,976.00 1.97
3,363,976.00 1.97
Total Securities Portfolio 166,027,696.50 97.31
DenominationQuantity/Nominal
Market valuein USD
Currency %NAV
22,500,000 September 5,2018
17,035,130 (175,870.40)SGDUSD 17,035,130.22Forward foreign exchange contracts
5,600,000 July 17, 20184,246,929 (33,364.72)SGDUSD 4,246,928.565,500,000 June 20,
20184,197,512 (3,635.25)SGDUSD 4,197,512.02
30,330,852 June 19,2018
39,924,500 164,279.39USDSGD 30,330,851.64
(48,590.98)
Total Forward foreign exchange contracts (48,590.98)
SalePurchase Unrealisedappreciation /(depreciation)
in USD
MaturityDate
Commitmentin USD
Financial derivative instruments as at March 31, 2018

FULLERTON LUX FUNDS
69
Fullerton Lux Funds - Asian Short Duration Bonds (in USD)
The accompanying notes are an integral part of these financial statements.
Summary of net assets
(48,590.98) (0.03)Total financial derivative instruments
%NAV
166,027,696.50 97.31Total Securities Portfolio
3,032,901.21 1.78Cash at bank
1,607,170.27 0.94Other assets and liabilities
170,619,177.00 100.00Total net assets
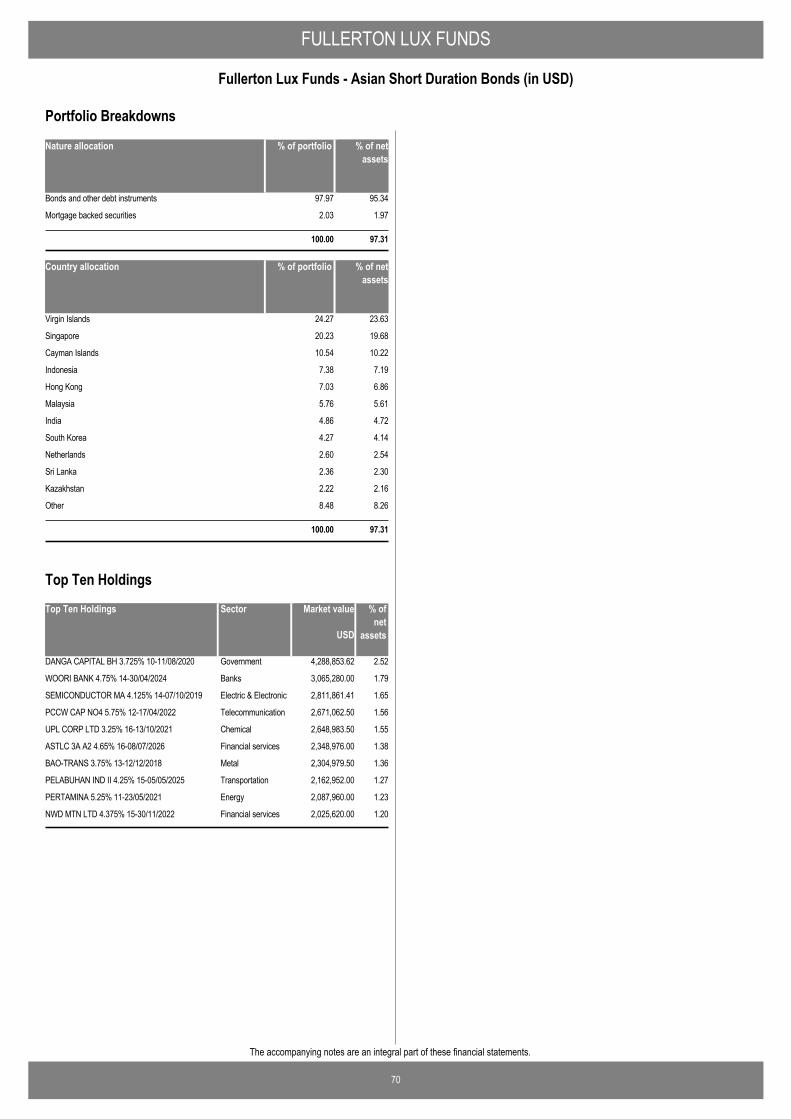
FULLERTON LUX FUNDS
70
Fullerton Lux Funds - Asian Short Duration Bonds (in USD)
The accompanying notes are an integral part of these financial statements.
Nature allocation % of portfolio % of netassets
Bonds and other debt instruments 97.97 95.34
Mortgage backed securities 2.03 1.97
100.00 97.31
Country allocation % of portfolio % of netassets
Virgin Islands 24.27 23.63
Singapore 20.23 19.68
Cayman Islands 10.54 10.22
Indonesia 7.38 7.19
Hong Kong 7.03 6.86
Malaysia 5.76 5.61
India 4.86 4.72
South Korea 4.27 4.14
Netherlands 2.60 2.54
Sri Lanka 2.36 2.30
Kazakhstan 2.22 2.16
Other 8.48 8.26
100.00 97.31
Portfolio Breakdowns
Top Ten Holdings Market value % ofnet
assets
DANGA CAPITAL BH 3.725% 10-11/08/2020 4,288,853.62 2.52Government
WOORI BANK 4.75% 14-30/04/2024 3,065,280.00 1.79Banks
SEMICONDUCTOR MA 4.125% 14-07/10/2019 2,811,861.41 1.65Electric & Electronic
PCCW CAP NO4 5.75% 12-17/04/2022 2,671,062.50 1.56Telecommunication
UPL CORP LTD 3.25% 16-13/10/2021 2,648,983.50 1.55Chemical
ASTLC 3A A2 4.65% 16-08/07/2026 2,348,976.00 1.38Financial services
BAO-TRANS 3.75% 13-12/12/2018 2,304,979.50 1.36Metal
PELABUHAN IND II 4.25% 15-05/05/2025 2,162,952.00 1.27Transportation
PERTAMINA 5.25% 11-23/05/2021 2,087,960.00 1.23Energy
NWD MTN LTD 4.375% 15-30/11/2022 2,025,620.00 1.20Financial services
USD
Sector
Top Ten Holdings
FULLERTON LUX FUNDS Notes to the Financial Statements as at March 31, 2018 Note 1. General information Fullerton Lux Funds (the “SICAV”) is an umbrella structured open-ended investment company with limited liability, organised as a société anonyme and qualifies as a société d’investissement à capital variable (“SICAV”) under part I of the law of December 17, 2010 (the “2010 Law”), as amended. The SICAV was incorporated on October 22, 2009 and its Articles of Association were published in the Mémorial on November 9, 2009. The SICAV is registered in the Luxembourg Trade Register under the number B 148 899. Funds are offered to subscribers: - Fullerton Lux Funds - Asia Growth & Income Equities (launched on January 29, 2010); - Fullerton Lux Funds - Asian Small Cap Equities (launched on April 1, 2010); - Fullerton Lux Funds - Asia Focus Equities (launched on June 14, 2010); - Fullerton Lux Funds - Asia Absolute Alpha (launched on July 31, 2014, became dormant on February 3, 2015 and reactivated on June 24, 2015); - Fullerton Lux Funds - ASEAN Growth (launched on May 27, 2013); - Fullerton Lux Funds - China A Equities (launched on November 10, 2014); - Fullerton Lux Funds - All China Equities (launched on September 8, 2016); - Fullerton Lux Funds - Global Emerging Market Equities (launched on July 24, 2014); - Fullerton Lux Funds - Asian Currency Bonds (launched on October 6, 2010); - Fullerton Lux Funds - Asian High Yield Bonds (launched on June 16, 2014); - Fullerton Lux Funds - Asian Bonds (launched on June 22, 2012); - Fullerton Lux Funds - RMB Bonds (launched on May 2, 2013); - Fullerton Lux Funds - Asian Short Duration Bonds (launched on October 18, 2013). The Directors may decide to create within each Fund different Share Classes. Shares are generally issued as Accumulation Shares. Distribution Shares are only issued within a Fund at the Directors’ discretion. Investors may enquire at the Administrator, Global Distributor or their Distributor whether any Distribution Shares are available within each Share Class and Fund. Class A Shares are available to all investors. Class I Shares and Class J Shares are only available to institutional investors. Class R Shares are available to retail investors in certain circumstances when investing through distributors, financial advisors, platforms or other intermediaries (together the “Intermediaries”) on the basis of a separate agreement or fee arrangement between the investor and an Intermediary. As at March 31, 2018, the only Share Classes available are Class A (CHF) Hedged Accumulation, Class A (CNH) Distribution, Class A (EUR) Hedged Accumulation, Class A (SGD) Accumulation, Class A (SGD) Distribution, Class A (SGD) Hedged Accumulation, Class A (SGD) Hedged Distribution, Class A (USD) Accumulation, Class A (USD) Distribution, Class I (CHF) Accumulation, Class I (CNH) Accumulation, Class I (EUR) Accumulation, Class I (SGD) Accumulation, Class I (USD) Accumulation, Class I (USD) Distribution, Class J (JPY) Distribution, Class R (SGD) Accumulation, Class R (SGD) Hedged Accumulation and Class R (USD) Accumulation. Refer to Statistics for Share Classes available to the respective Funds. Note 2. Summary of significant accounting policies The financial statements of the SICAV are prepared in accordance with the Luxembourg regulations for investment funds. The combined financial statements are expressed in USD. 2.1 Valuation of the investments The value of the assets held by each Fund is calculated as follows: a) Transferable Securities or Money Market Instruments quoted or traded on an official stock exchange or any other Regulated Market, are valued on the basis of the last known price. b) For Transferable Securities or Money Market Instruments not quoted or traded on an official stock exchange or any other Regulated Market, and for quoted or traded Transferable Securities or Money Market Instruments, but for which the last known price is not representative, valuation is based on the probable sales price estimated prudently and in good faith by the Board of Directors of the SICAV. c) Units and shares issued by UCITS or other UCIs will be valued at their last available net asset value. d) Evaluation of negotiable zero coupon debt securities The value of those instruments is based on their acquisition cost plus the prorata temporis price difference between the acquisition price and the reimbursement one. In the event of material changes in market conditions, the valuation basis of these instruments is adjusted to the new market yields. e) Evaluation of negotiable debt securities with floating rate Debt securities with floating interest rate are taken into account in portfolio at their nominal value and accrued interests are booked under “Dividends and interest receivable” in the Statement of Net Assets and under “Interest on bonds” in the Statement of Operations and Changes in Net Assets. The interest rates mentioned for those securities in the portfolio correspond to the floating interest rate applicable at the acquisition date of the securities. In the event of material changes in market conditions, the valuation basis of these instruments is adjusted to the new market yields.
71
FULLERTON LUX FUNDS Notes to the Financial Statements as at March 31, 2018 (continued) Note 2. Summary of significant accounting policies (continued) 2.2 Valuation of options and futures contracts The Funds may use options and futures contracts on currencies, securities, other indices, volatility, inflation and interest rates for hedging and/or investment purposes. The liquidating value of options and futures traded on exchanges or on other regulated markets shall be based upon the last available settlement prices of these contracts on exchanges and regulated markets on which the particular contracts are traded by the SICAV; provided that if such settlement prices are not available, the basis for determining the liquidating value of such contracts shall be such valued as the Directors may deem fair and reasonable. Resulting realised and change in unrealised gains or losses are included in the Statement of Operations and Changes in Net Assets. 2.3 Valuation of forward foreign exchange contracts The forward foreign exchange contracts opened at the year-end are valued at the forward exchange rate corresponding to the termination date of the contract. Resulting realised and change in unrealised gains or losses are included in the Statement of Operations and Changes in Net Assets. 2.4 Net realised gain or loss on sales of investments Realised gains or losses on sales of investments are calculated on the basis of the average cost of the investments sold. Redemptions from target investments funds are recorded when the net asset value applied to the redemptions is known. Consequently the recording date of the transaction (and the related realised gain or loss) may be different from the date of the redemption request. 2.5 Foreign currency translation The accounting records and the financial statements of each Fund are expressed in USD. Bank accounts, other net assets and market value of the investments in securities expressed in currencies other than USD are converted into USD at the exchange rates prevailing on the date of the balance sheet. Income and expenses in currencies other than USD are converted into USD at the rate of exchange prevailing at transaction date. The resulting gains and losses are recognised in the Statement of Operations and Changes in Net Assets. 2.6 Valuation of swaps contracts The valuation of swap and interest rate swaps transactions is based on counterparties’ prices. Resulting realised and change in unrealised gains or losses are included in the Statement of Operations and Changes in Net Assets. For the year ended March 31, 2018, the SICAV has no contracted swaps contracts. 2.7 Cost of investments Cost of investments in currencies other than USD are converted into USD at the exchange rate applicable at purchase date. 2.8 Income Dividends are taken into income on the date upon which the relevant securities are first listed as “ex-dividend”. Interest is booked on an accrual basis. 2.9 Formation expenses All expenses incurred in the formation of a Fund shall be paid by that Fund and amortised over a period not exceeding five (5) years. 2.10 Combined statements for the various Funds The combined financial statements of Fullerton Lux Funds are expressed in USD dollar (USD) by converting the financial statements of the Funds denominated in currencies other than US Dollar (USD) at the rate of exchange prevailing at the end of the year.
72
FULLERTON LUX FUNDS Notes to the Financial Statements as at March 31, 2018 (continued) Note 3. Exchange rates The NAV dated March 31, 2018 has been computed for all the Funds on March 30, 2018 with the exception of Fullerton Lux Funds - Global Emerging Market Equities which has been computed on April 3, 2018. The exchange rates as at March 31, 2018 used for the translation of the SICAV’s assets and liabilities (except for Fullerton Lux Funds - Global Emerging Market Equities) not denominated in USD are as follows: 1 USD = 1.304353 AUD 1 USD = 106.634979 JPY 1 USD = 0.957890 CHF 1 USD = 1,065.900024 KRW 1 USD = 6.278364 CNH 1 USD = 3.867985 MYR 1 USD = 6.291684 CNY 1 USD = 1.389548 NZD 1 USD = 0.812150 EUR 1 USD = 52.177495 PHP 1 USD = 7.848290 HKD 1 USD = 1.311703 SGD 1 USD = 13,767.500203 IDR 1 USD = 31.269999 THB 1 USD = 65.221676 INR 1 USD = 29.156989 TWD The valuation of Fullerton Lux Funds - Global Emerging Market Equities Fund as at March 31, 2018 is calculated on April 3, 2018 in using the following exchange rates: 1 USD = 3.673009 AED 1 USD = 1,065.900028 KRW 1 USD = 3.323576 BRL 1 USD = 18.253486 MXN 1 USD = 6.291702 CNY 1 USD = 3.867992 MYR 1 USD = 0.813107 EUR 1 USD = 57.500020 RUB 1 USD = 0.712851 GBP 1 USD = 1.311298 SGD 1 USD = 7.848315 HKD 1 USD = 3.961377 TRY 1 USD = 13,767.500305 IDR 1 USD = 29.157011 TWD 1 USD = 3.510835 ILS 1 USD = 11.848721 ZAR 1 USD = 65.221694 INR Note 4. Depositary, Administrative Agent, Registrar and Transfer Agent, Domiciliary Agent and Listing Agent The Board of Directors of the SICAV has appointed BNP Paribas Securities Services - Luxembourg Branch, as the Depositary, Administrative Agent, Domiciliary Agent, Registrar and Transfer Agent of the SICAV. BNP Paribas Securities Services - Luxembourg Branch receives a fee in relation to its services, which is set at as follows:
Type of fees Fees amount / rates
Depositary bank fees 0.65 bp per annum on the total assets of the SICAV.
Accounting fees For any NAV calculated on a daily basis, up to USD 500 million of the total assets of the SICAV, the fee is set at 2.75 bp; and 2.25 bp if the total assets of the SICAV are above USD 500 million.
Financial reporting fee Preparation of the annual and semi-annual reports of the SICAV, a fee of EUR 1,000.00 per annum and per sub-fund in the language of the prospectus will be charged. Any additional language will be charged separately at EUR 500 per annum.
Domiciliary agent fee A fee of EUR 1,250.00 is charged per annum and per Sub-Fund.
Transfer agent fee EUR 50 per share class and per month. An additional fee of 1 bp per annum on the assets subject to equalisation subject to a minimum of EUR 500 per month.
Note 5. Investment management fees The Investment manager receives from the SICAV an Investment management fee, as described below: Fullerton Lux Funds - Asia Growth & Income Equities Class A (SGD) Accumulation 1.50% of the total net assets per annum. Class A (USD) Accumulation 1.50% of the total net assets per annum. Class I (EUR) Accumulation 1.00% of the total net assets per annum. Class I (SGD) Accumulation 1.00% of the total net assets per annum. Class I (USD) Accumulation 1.00% of the total net assets per annum. Class I (USD) Distribution 1.00% of the total net assets per annum.
73
FULLERTON LUX FUNDS Notes to the Financial Statements as at March 31, 2018 (continued) Note 5. Investment management fees (continued)
Fullerton Lux Funds - Asian Small Cap Equities Class A (SGD) Accumulation 1.75% of the total net assets per annum. Class A (USD) Accumulation 1.75% of the total net assets per annum. Class I (CHF) Accumulation 1.00% of the total net assets per annum. Class I (EUR) Accumulation 1.00% of the total net assets per annum. Class I (USD) Accumulation 1.00% of the total net assets per annum. Fullerton Lux Funds - Asia Focus Equities Class A (SGD) Accumulation 1.75% of the total net assets per annum. Class A (USD) Accumulation 1.75% of the total net assets per annum. Class I (EUR) Accumulation 1.00% of the total net assets per annum. Class I (SGD) Accumulation 1.00% of the total net assets per annum. Class I (USD) Accumulation 1.00% of the total net assets per annum. Fullerton Lux Funds - Asia Absolute Alpha Class A (SGD) Accumulation 1.50% of the total net assets per annum. Class I (USD) Accumulation 1.00% of the total net assets per annum. Fullerton Lux Funds - ASEAN Growth Class A (SGD) Accumulation 1.50% of the total net assets per annum. Class A (USD) Accumulation 1.50% of the total net assets per annum. Class I (EUR) Accumulation 1.00% of the total net assets per annum. Class I (USD) Accumulation 1.00% of the total net assets per annum. Fullerton Lux Funds - China A Equities Class A (USD) Accumulation 1.75% of the total net assets per annum. Class I (USD) Accumulation 1.00% of the total net assets per annum. Fullerton Lux Funds - All China Equities Class I (USD) Accumulation 1.00% of the total net assets per annum. Fullerton Lux Funds - Global Emerging Market Equities Class A (USD) Accumulation 1.50% of the total net assets per annum. Class I (USD) Accumulation 1.00% of the total net assets per annum. Fullerton Lux Funds - Asian Currency Bonds Class A (SGD) Distribution 1.00% of the total net assets per annum. Class A (USD) Distribution 1.00% of the total net assets per annum. Class I (EUR) Accumulation 0.60% of the total net assets per annum. Class I (USD) Accumulation 0.60% of the total net assets per annum. Fullerton Lux Funds - Asian High Yield Bonds Class A (SGD) Hedged Distribution 1.25% of the total net assets per annum. Class A (USD) Distribution 1.25% of the total net assets per annum. Fullerton Lux Funds - Asian Bonds Class A (EUR) Hedged Accumulation 1.00% of the total net assets per annum. Class A (SGD) Hedged Distribution 1.00% of the total net assets per annum. Class A (USD) Accumulation 1.00% of the total net assets per annum. Class A (USD) Distribution 1.00% of the total net assets per annum. Class I (USD) Accumulation 0.60% of the total net assets per annum. Class I (USD) Distribution 0.60% of the total net assets per annum. Class R (SGD) Accumulation 0.60% of the total net assets per annum.
74
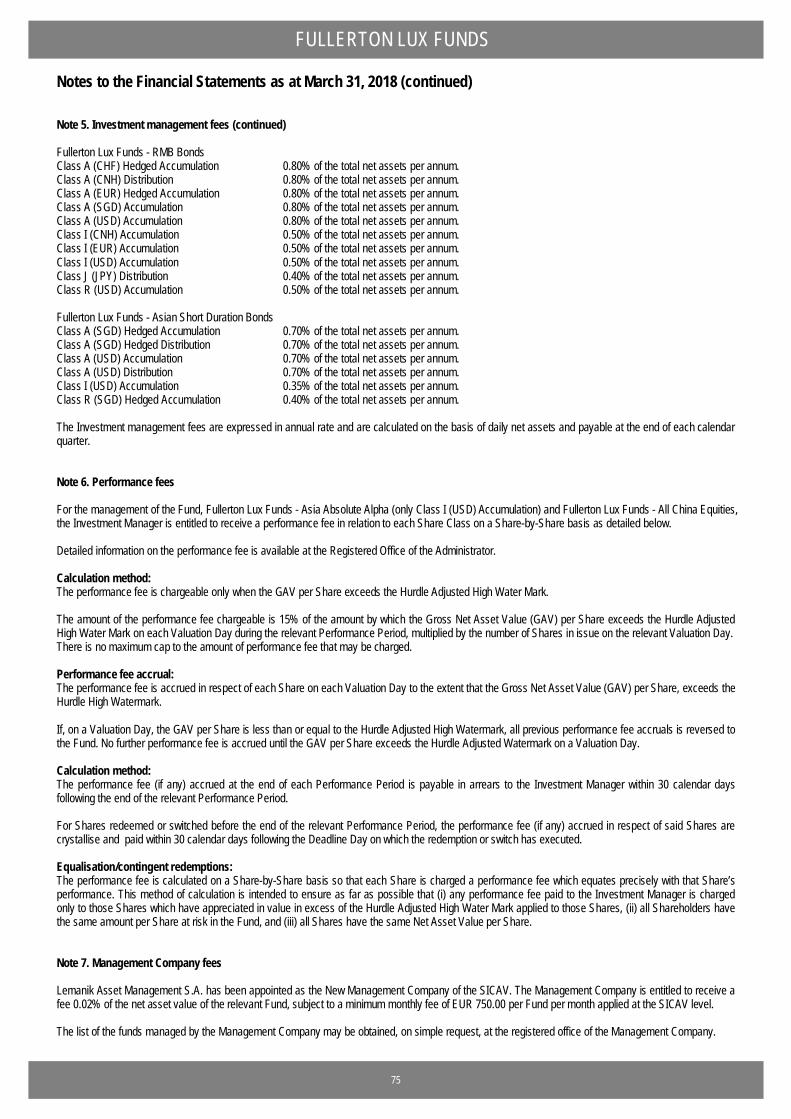
FULLERTON LUX FUNDS Notes to the Financial Statements as at March 31, 2018 (continued) Note 5. Investment management fees (continued) Fullerton Lux Funds - RMB Bonds Class A (CHF) Hedged Accumulation 0.80% of the total net assets per annum. Class A (CNH) Distribution 0.80% of the total net assets per annum. Class A (EUR) Hedged Accumulation 0.80% of the total net assets per annum. Class A (SGD) Accumulation 0.80% of the total net assets per annum. Class A (USD) Accumulation 0.80% of the total net assets per annum. Class I (CNH) Accumulation 0.50% of the total net assets per annum. Class I (EUR) Accumulation 0.50% of the total net assets per annum. Class I (USD) Accumulation 0.50% of the total net assets per annum. Class J (JPY) Distribution 0.40% of the total net assets per annum. Class R (USD) Accumulation 0.50% of the total net assets per annum.
Fullerton Lux Funds - Asian Short Duration Bonds Class A (SGD) Hedged Accumulation 0.70% of the total net assets per annum. Class A (SGD) Hedged Distribution 0.70% of the total net assets per annum. Class A (USD) Accumulation 0.70% of the total net assets per annum. Class A (USD) Distribution 0.70% of the total net assets per annum. Class I (USD) Accumulation 0.35% of the total net assets per annum. Class R (SGD) Hedged Accumulation 0.40% of the total net assets per annum. The Investment management fees are expressed in annual rate and are calculated on the basis of daily net assets and payable at the end of each calendar quarter. Note 6. Performance fees For the management of the Fund, Fullerton Lux Funds - Asia Absolute Alpha (only Class I (USD) Accumulation) and Fullerton Lux Funds - All China Equities, the Investment Manager is entitled to receive a performance fee in relation to each Share Class on a Share-by-Share basis as detailed below. Detailed information on the performance fee is available at the Registered Office of the Administrator. Calculation method: The performance fee is chargeable only when the GAV per Share exceeds the Hurdle Adjusted High Water Mark. The amount of the performance fee chargeable is 15% of the amount by which the Gross Net Asset Value (GAV) per Share exceeds the Hurdle Adjusted High Water Mark on each Valuation Day during the relevant Performance Period, multiplied by the number of Shares in issue on the relevant Valuation Day. There is no maximum cap to the amount of performance fee that may be charged. Performance fee accrual: The performance fee is accrued in respect of each Share on each Valuation Day to the extent that the Gross Net Asset Value (GAV) per Share, exceeds the Hurdle High Watermark. If, on a Valuation Day, the GAV per Share is less than or equal to the Hurdle Adjusted High Watermark, all previous performance fee accruals is reversed to the Fund. No further performance fee is accrued until the GAV per Share exceeds the Hurdle Adjusted Watermark on a Valuation Day. Calculation method: The performance fee (if any) accrued at the end of each Performance Period is payable in arrears to the Investment Manager within 30 calendar days following the end of the relevant Performance Period. For Shares redeemed or switched before the end of the relevant Performance Period, the performance fee (if any) accrued in respect of said Shares are crystallise and paid within 30 calendar days following the Deadline Day on which the redemption or switch has executed. Equalisation/contingent redemptions: The performance fee is calculated on a Share-by-Share basis so that each Share is charged a performance fee which equates precisely with that Share’s performance. This method of calculation is intended to ensure as far as possible that (i) any performance fee paid to the Investment Manager is charged only to those Shares which have appreciated in value in excess of the Hurdle Adjusted High Water Mark applied to those Shares, (ii) all Shareholders have the same amount per Share at risk in the Fund, and (iii) all Shares have the same Net Asset Value per Share. Note 7. Management Company fees Lemanik Asset Management S.A. has been appointed as the New Management Company of the SICAV. The Management Company is entitled to receive a fee 0.02% of the net asset value of the relevant Fund, subject to a minimum monthly fee of EUR 750.00 per Fund per month applied at the SICAV level. The list of the funds managed by the Management Company may be obtained, on simple request, at the registered office of the Management Company.
75
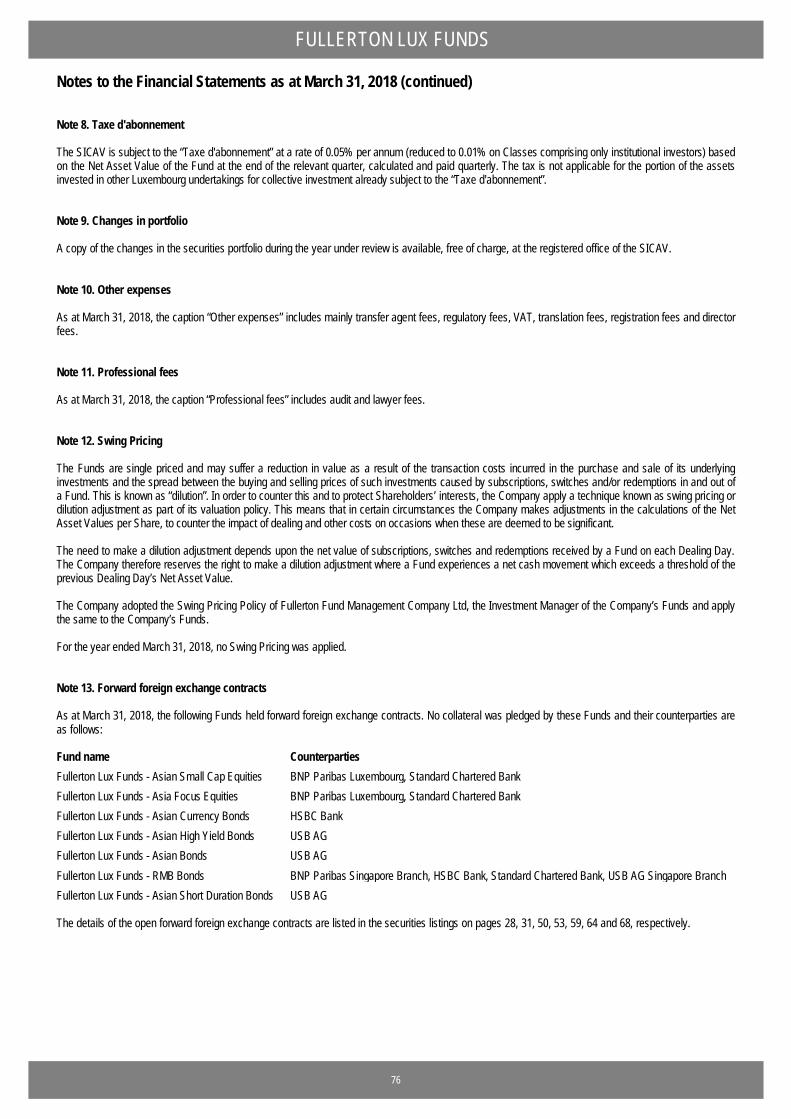
FULLERTON LUX FUNDS Notes to the Financial Statements as at March 31, 2018 (continued) Note 8. Taxe d'abonnement The SICAV is subject to the “Taxe d'abonnement” at a rate of 0.05% per annum (reduced to 0.01% on Classes comprising only institutional investors) based on the Net Asset Value of the Fund at the end of the relevant quarter, calculated and paid quarterly. The tax is not applicable for the portion of the assets invested in other Luxembourg undertakings for collective investment already subject to the “Taxe d'abonnement”. Note 9. Changes in portfolio A copy of the changes in the securities portfolio during the year under review is available, free of charge, at the registered office of the SICAV. Note 10. Other expenses As at March 31, 2018, the caption “Other expenses” includes mainly transfer agent fees, regulatory fees, VAT, translation fees, registration fees and director fees. Note 11. Professional fees As at March 31, 2018, the caption “Professional fees” includes audit and lawyer fees. Note 12. Swing Pricing The Funds are single priced and may suffer a reduction in value as a result of the transaction costs incurred in the purchase and sale of its underlying investments and the spread between the buying and selling prices of such investments caused by subscriptions, switches and/or redemptions in and out of a Fund. This is known as “dilution”. In order to counter this and to protect Shareholders’ interests, the Company apply a technique known as swing pricing or dilution adjustment as part of its valuation policy. This means that in certain circumstances the Company makes adjustments in the calculations of the Net Asset Values per Share, to counter the impact of dealing and other costs on occasions when these are deemed to be significant. The need to make a dilution adjustment depends upon the net value of subscriptions, switches and redemptions received by a Fund on each Dealing Day. The Company therefore reserves the right to make a dilution adjustment where a Fund experiences a net cash movement which exceeds a threshold of the previous Dealing Day’s Net Asset Value. The Company adopted the Swing Pricing Policy of Fullerton Fund Management Company Ltd, the Investment Manager of the Company’s Funds and apply the same to the Company’s Funds. For the year ended March 31, 2018, no Swing Pricing was applied. Note 13. Forward foreign exchange contracts As at March 31, 2018, the following Funds held forward foreign exchange contracts. No collateral was pledged by these Funds and their counterparties are as follows: Fund name Counterparties
Fullerton Lux Funds - Asian Small Cap Equities BNP Paribas Luxembourg, Standard Chartered Bank
Fullerton Lux Funds - Asia Focus Equities BNP Paribas Luxembourg, Standard Chartered Bank
Fullerton Lux Funds - Asian Currency Bonds HSBC Bank
Fullerton Lux Funds - Asian High Yield Bonds USB AG
Fullerton Lux Funds - Asian Bonds USB AG
Fullerton Lux Funds - RMB Bonds BNP Paribas Singapore Branch, HSBC Bank, Standard Chartered Bank, USB AG Singapore Branch
Fullerton Lux Funds - Asian Short Duration Bonds USB AG The details of the open forward foreign exchange contracts are listed in the securities listings on pages 28, 31, 50, 53, 59, 64 and 68, respectively.
76
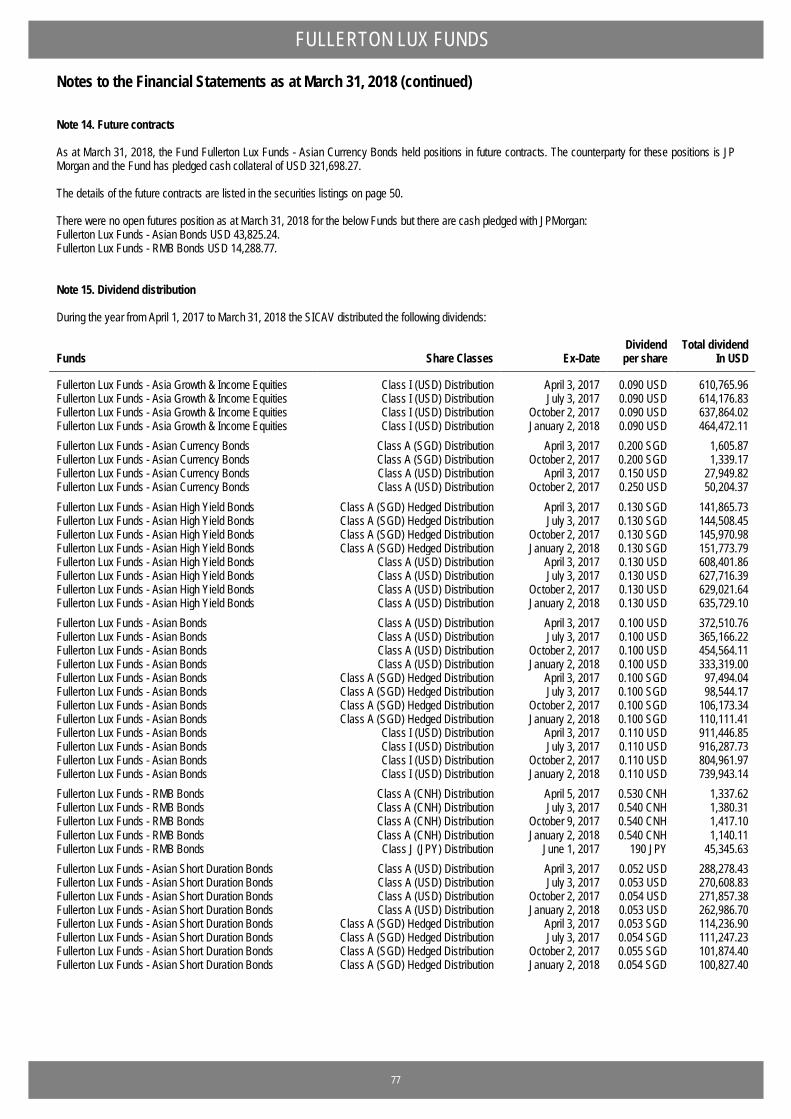
FULLERTON LUX FUNDS Notes to the Financial Statements as at March 31, 2018 (continued) Note 14. Future contracts As at March 31, 2018, the Fund Fullerton Lux Funds - Asian Currency Bonds held positions in future contracts. The counterparty for these positions is JP Morgan and the Fund has pledged cash collateral of USD 321,698.27. The details of the future contracts are listed in the securities listings on page 50. There were no open futures position as at March 31, 2018 for the below Funds but there are cash pledged with JPMorgan: Fullerton Lux Funds - Asian Bonds USD 43,825.24. Fullerton Lux Funds - RMB Bonds USD 14,288.77. Note 15. Dividend distribution During the year from April 1, 2017 to March 31, 2018 the SICAV distributed the following dividends:
Funds
Share Classes
Ex-Date
Dividend per share
Total dividend In USD
Fullerton Lux Funds - Asia Growth & Income Equities Class I (USD) Distribution April 3, 2017 0.090 USD 610,765.96 Fullerton Lux Funds - Asia Growth & Income Equities Class I (USD) Distribution July 3, 2017 0.090 USD 614,176.83 Fullerton Lux Funds - Asia Growth & Income Equities Class I (USD) Distribution October 2, 2017 0.090 USD 637,864.02 Fullerton Lux Funds - Asia Growth & Income Equities Class I (USD) Distribution January 2, 2018 0.090 USD 464,472.11
Fullerton Lux Funds - Asian Currency Bonds Class A (SGD) Distribution April 3, 2017 0.200 SGD 1,605.87 Fullerton Lux Funds - Asian Currency Bonds Class A (SGD) Distribution October 2, 2017 0.200 SGD 1,339.17 Fullerton Lux Funds - Asian Currency Bonds Class A (USD) Distribution April 3, 2017 0.150 USD 27,949.82 Fullerton Lux Funds - Asian Currency Bonds Class A (USD) Distribution October 2, 2017 0.250 USD 50,204.37
Fullerton Lux Funds - Asian High Yield Bonds Class A (SGD) Hedged Distribution April 3, 2017 0.130 SGD 141,865.73 Fullerton Lux Funds - Asian High Yield Bonds Class A (SGD) Hedged Distribution July 3, 2017 0.130 SGD 144,508.45 Fullerton Lux Funds - Asian High Yield Bonds Class A (SGD) Hedged Distribution October 2, 2017 0.130 SGD 145,970.98 Fullerton Lux Funds - Asian High Yield Bonds Class A (SGD) Hedged Distribution January 2, 2018 0.130 SGD 151,773.79 Fullerton Lux Funds - Asian High Yield Bonds Class A (USD) Distribution April 3, 2017 0.130 USD 608,401.86 Fullerton Lux Funds - Asian High Yield Bonds Class A (USD) Distribution July 3, 2017 0.130 USD 627,716.39 Fullerton Lux Funds - Asian High Yield Bonds Class A (USD) Distribution October 2, 2017 0.130 USD 629,021.64 Fullerton Lux Funds - Asian High Yield Bonds Class A (USD) Distribution January 2, 2018 0.130 USD 635,729.10
Fullerton Lux Funds - Asian Bonds Class A (USD) Distribution April 3, 2017 0.100 USD 372,510.76 Fullerton Lux Funds - Asian Bonds Class A (USD) Distribution July 3, 2017 0.100 USD 365,166.22 Fullerton Lux Funds - Asian Bonds Class A (USD) Distribution October 2, 2017 0.100 USD 454,564.11 Fullerton Lux Funds - Asian Bonds Class A (USD) Distribution January 2, 2018 0.100 USD 333,319.00 Fullerton Lux Funds - Asian Bonds Class A (SGD) Hedged Distribution April 3, 2017 0.100 SGD 97,494.04 Fullerton Lux Funds - Asian Bonds Class A (SGD) Hedged Distribution July 3, 2017 0.100 SGD 98,544.17 Fullerton Lux Funds - Asian Bonds Class A (SGD) Hedged Distribution October 2, 2017 0.100 SGD 106,173.34 Fullerton Lux Funds - Asian Bonds Class A (SGD) Hedged Distribution January 2, 2018 0.100 SGD 110,111.41 Fullerton Lux Funds - Asian Bonds Class I (USD) Distribution April 3, 2017 0.110 USD 911,446.85 Fullerton Lux Funds - Asian Bonds Class I (USD) Distribution July 3, 2017 0.110 USD 916,287.73 Fullerton Lux Funds - Asian Bonds Class I (USD) Distribution October 2, 2017 0.110 USD 804,961.97 Fullerton Lux Funds - Asian Bonds Class I (USD) Distribution January 2, 2018 0.110 USD 739,943.14
Fullerton Lux Funds - RMB Bonds Class A (CNH) Distribution April 5, 2017 0.530 CNH 1,337.62 Fullerton Lux Funds - RMB Bonds Class A (CNH) Distribution July 3, 2017 0.540 CNH 1,380.31 Fullerton Lux Funds - RMB Bonds Class A (CNH) Distribution October 9, 2017 0.540 CNH 1,417.10 Fullerton Lux Funds - RMB Bonds Class A (CNH) Distribution January 2, 2018 0.540 CNH 1,140.11 Fullerton Lux Funds - RMB Bonds Class J (JPY) Distribution June 1, 2017 190 JPY 45,345.63
Fullerton Lux Funds - Asian Short Duration Bonds Class A (USD) Distribution April 3, 2017 0.052 USD 288,278.43 Fullerton Lux Funds - Asian Short Duration Bonds Class A (USD) Distribution July 3, 2017 0.053 USD 270,608.83 Fullerton Lux Funds - Asian Short Duration Bonds Class A (USD) Distribution October 2, 2017 0.054 USD 271,857.38 Fullerton Lux Funds - Asian Short Duration Bonds Class A (USD) Distribution January 2, 2018 0.053 USD 262,986.70 Fullerton Lux Funds - Asian Short Duration Bonds Class A (SGD) Hedged Distribution April 3, 2017 0.053 SGD 114,236.90 Fullerton Lux Funds - Asian Short Duration Bonds Class A (SGD) Hedged Distribution July 3, 2017 0.054 SGD 111,247.23 Fullerton Lux Funds - Asian Short Duration Bonds Class A (SGD) Hedged Distribution October 2, 2017 0.055 SGD 101,874.40 Fullerton Lux Funds - Asian Short Duration Bonds Class A (SGD) Hedged Distribution January 2, 2018 0.054 SGD 100,827.40
77
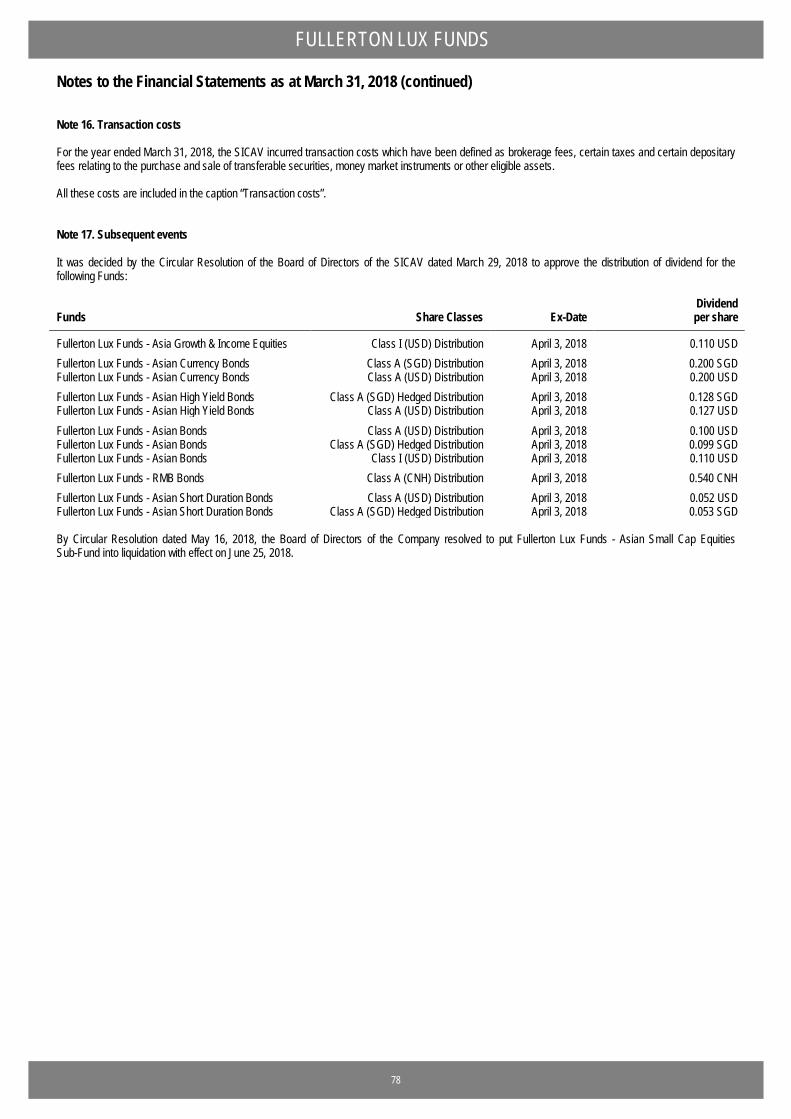
FULLERTON LUX FUNDS Notes to the Financial Statements as at March 31, 2018 (continued) Note 16. Transaction costs For the year ended March 31, 2018, the SICAV incurred transaction costs which have been defined as brokerage fees, certain taxes and certain depositary fees relating to the purchase and sale of transferable securities, money market instruments or other eligible assets. All these costs are included in the caption “Transaction costs”. Note 17. Subsequent events It was decided by the Circular Resolution of the Board of Directors of the SICAV dated March 29, 2018 to approve the distribution of dividend for the following Funds: Funds
Share Classes
Ex-Date
Dividend per share
Fullerton Lux Funds - Asia Growth & Income Equities Class I (USD) Distribution April 3, 2018 0.110 USD
Fullerton Lux Funds - Asian Currency Bonds Class A (SGD) Distribution April 3, 2018 0.200 SGD Fullerton Lux Funds - Asian Currency Bonds Class A (USD) Distribution April 3, 2018 0.200 USD
Fullerton Lux Funds - Asian High Yield Bonds Class A (SGD) Hedged Distribution April 3, 2018 0.128 SGD Fullerton Lux Funds - Asian High Yield Bonds Class A (USD) Distribution April 3, 2018 0.127 USD
Fullerton Lux Funds - Asian Bonds Class A (USD) Distribution April 3, 2018 0.100 USD Fullerton Lux Funds - Asian Bonds Class A (SGD) Hedged Distribution April 3, 2018 0.099 SGD Fullerton Lux Funds - Asian Bonds Class I (USD) Distribution April 3, 2018 0.110 USD
Fullerton Lux Funds - RMB Bonds Class A (CNH) Distribution April 3, 2018 0.540 CNH
Fullerton Lux Funds - Asian Short Duration Bonds Class A (USD) Distribution April 3, 2018 0.052 USD Fullerton Lux Funds - Asian Short Duration Bonds Class A (SGD) Hedged Distribution April 3, 2018 0.053 SGD By Circular Resolution dated May 16, 2018, the Board of Directors of the Company resolved to put Fullerton Lux Funds - Asian Small Cap Equities Sub-Fund into liquidation with effect on June 25, 2018.
78
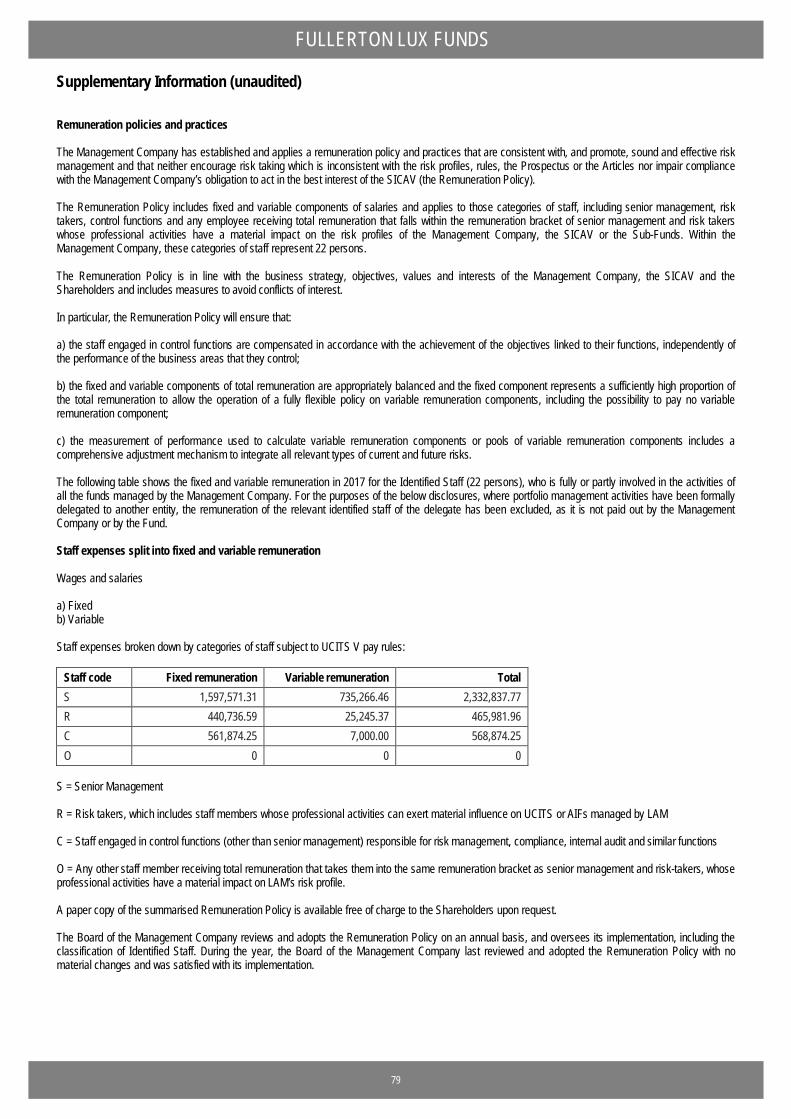
FULLERTON LUX FUNDS Supplementary Information (unaudited) Remuneration policies and practices The Management Company has established and applies a remuneration policy and practices that are consistent with, and promote, sound and effective risk management and that neither encourage risk taking which is inconsistent with the risk profiles, rules, the Prospectus or the Articles nor impair compliance with the Management Company’s obligation to act in the best interest of the SICAV (the Remuneration Policy). The Remuneration Policy includes fixed and variable components of salaries and applies to those categories of staff, including senior management, risk takers, control functions and any employee receiving total remuneration that falls within the remuneration bracket of senior management and risk takers whose professional activities have a material impact on the risk profiles of the Management Company, the SICAV or the Sub-Funds. Within the Management Company, these categories of staff represent 22 persons. The Remuneration Policy is in line with the business strategy, objectives, values and interests of the Management Company, the SICAV and the Shareholders and includes measures to avoid conflicts of interest. In particular, the Remuneration Policy will ensure that: a) the staff engaged in control functions are compensated in accordance with the achievement of the objectives linked to their functions, independently of the performance of the business areas that they control; b) the fixed and variable components of total remuneration are appropriately balanced and the fixed component represents a sufficiently high proportion of the total remuneration to allow the operation of a fully flexible policy on variable remuneration components, including the possibility to pay no variable remuneration component; c) the measurement of performance used to calculate variable remuneration components or pools of variable remuneration components includes a comprehensive adjustment mechanism to integrate all relevant types of current and future risks. The following table shows the fixed and variable remuneration in 2017 for the Identified Staff (22 persons), who is fully or partly involved in the activities of all the funds managed by the Management Company. For the purposes of the below disclosures, where portfolio management activities have been formally delegated to another entity, the remuneration of the relevant identified staff of the delegate has been excluded, as it is not paid out by the Management Company or by the Fund. Staff expenses split into fixed and variable remuneration Wages and salaries a) Fixed b) Variable Staff expenses broken down by categories of staff subject to UCITS V pay rules:
Staff code Fixed remuneration Variable remuneration Total S 1,597,571.31 735,266.46 2,332,837.77 R 440,736.59 25,245.37 465,981.96 C 561,874.25 7,000.00 568,874.25 O 0 0 0
S = Senior Management R = Risk takers, which includes staff members whose professional activities can exert material influence on UCITS or AIFs managed by LAM C = Staff engaged in control functions (other than senior management) responsible for risk management, compliance, internal audit and similar functions O = Any other staff member receiving total remuneration that takes them into the same remuneration bracket as senior management and risk-takers, whose professional activities have a material impact on LAM’s risk profile. A paper copy of the summarised Remuneration Policy is available free of charge to the Shareholders upon request. The Board of the Management Company reviews and adopts the Remuneration Policy on an annual basis, and oversees its implementation, including the classification of Identified Staff. During the year, the Board of the Management Company last reviewed and adopted the Remuneration Policy with no material changes and was satisfied with its implementation.
79
FULLERTON LUX FUNDS Supplementary Information (unaudited) (continued) Security Financing Transactions Regulation At the date of the financial statements, the SICAV is currently not concerned by the requirements of the SFTR regulation 2015/2365 on transparency of securities financing transactions and of reuse. Furthermore, no corresponding transactions were carried out during the period referring to the financial statement.
80