Embed Size (px)
Citation preview

Societal Uptake of Alternative Energy Futures FINAL REPORT
Anna Littleboy and Naomi Boughen: CSIRO Simon Niemeyer: Australian National University Kath Fisher: Southern Cross University For CSIRO’s Energy Transformed Research Flagship Report No. P2006/784

Enquiries should be addressed to:
Anna Littleboy
Project Leader
P: 07 3327 4180
Important Notice
© Copyright Commonwealth Scientific and Industrial Research Organisation
(‘CSIRO’) Australia 2005
All rights are reserved and no part of this publication covered by copyright may be
reproduced or copied in any form or by any means except with the written permission of
CSIRO.
The results and analyses contained in this Report are based on a number of technical,
circumstantial or otherwise specified assumptions and parameters. The user must make
its own assessment of the suitability for its use of the information or material contained in
or generated from the Report. To the extent permitted by law, CSIRO excludes all liability
to any party for expenses, losses, damages and costs arising directly or indirectly from
using this Report.
Use of this Report
The use of this Report is subject to the terms on which it was prepared by CSIRO. In
particular, the Report may only be used for the following purposes.
this Report may be copied for distribution within the Client’s organisation;
the information in this Report may be used by the entity for which it was prepared (“the
Client”), or by the Client’s contractors and agents, for the Client’s internal business
operations (but not licensing to third parties);
extracts of the Report distributed for these purposes must clearly note that the extract is
part of a larger Report prepared by CSIRO for the Client.
The Report must not be used as a means of endorsement without the prior written consent
of CSIRO.
The name, trade mark or logo of CSIRO must not be used without the prior written consent
of CSIRO.
Societal Uptake of Alternative Energy Futures – Final Report, October 2006 Page 2 of 40

Executive Summary
There is increasing recognition that the public is not a passive recipient of technological
innovation. The public’s relationship with technologies is influenced by a range of factors of
which are strong enough to change the trajectory of technology uptake. This is particularly
pertinent to the introduction and diffusion of technologies for achieving greenhouse emission
reductions.
The following report outlines the details of this research and its findings, discussing the links
between society and technology in general terms, before describing the research
methodology, its rationale and implementation. Running parallel to and informing the work of
the Energy Futures Forum the research investigates the social perspectives that will shape
different aspects of greenhouse emission reduction scenarios. A key aim was to provide
small groups of randomly selected public participants with the opportunity to reflect in detail
on Australia’s energy options.
Following a literature review, a dialogic methodology was designed to focus on how
perspectives change in the light of information provision, rather than a static assessment of
public attitudes as they stand. Based on theories of deliberative democracy, three ‘citizen’s
panels’ were undertaken, each involving approximately 20 people. Quantitative and
qualitative measures were used to record the perspectives of these groups and any changes
over the three day period. A form of quantitative discourse analysis known as Q methodology
was used in addition to qualitative data obtained from transcripts and follow-up interviews.
This information was used to ‘triangulate’ the Q results and built up a coherent picture of
responses and the dynamics of the discussion. Another method of tracking, separate from
the Q methodology, was a simple preference ranking exercise that participants undertook at
the start of the process, half way through and at the end.
The general feeling in all panels was that a paradigm shift is required to enable Australia to
become a more synergistic society where goods are shared, wastes are reduced, re-used
and/or recycled and services are provided on the basis of lifecycle management. This was
not seen as necessarily being detrimental to the economy if we can think differently about
how to run our businesses. The Panels were prepared to pay more in taxes to make this
happen, but wanted reassurance that the money raised was going to encourage low
emission energy pathways.
Societal Uptake of Alternative Energy Futures – Final Report, October 2006 Page 3 of 40

Analysis of the “Q sort” data revealed five different types of “discourse” or “factors” that
emerged over the course of deliberation (see Appendix F for details). These discourses
embody grouping of values and beliefs in relation to energy technologies. These have been
loosely typified as follows:
A Broad Scale Reform
B Centralised Energy Generation
C Orderly Reform
D Technologically Conservative
E Radically Alternative
The first three factors are the largest and share serious concern about greenhouse
emissions and climate change, which manifests in different combinations of energy
technology and different trajectories for the future. Tensions between the risks associated
with large-scale technologies and a desire for energy security are the main distinguishing
features between the discourses, as well as concern about the resulting shape of society.
Shifts in the strength of these discourses were identified as deliberation progressed:
For some, interest in renewable energy was offset by an emphasis on current
limitations such as meeting peak energy demand and high costs, thus shifting to
favour large-scale centralised solutions.
A shift towards orderly reform involving transition technologies occurred where there
was a concern with the short-term viability of renewables but a long term desire for
their widespread use.
The initially smaller discourses D: “Technologically Conservative” and E: “Radically
Alternative” both declined during deliberation.
Participants were asked to identify the important criteria that should be considered in defining
a technology mix for the future of energy in Australia. The ability to reduce greenhouse gas
emissions clearly dominated as the preferred attributes of energy technologies, followed by
other environmental impacts, and then costs and economics. Other important attributes
included reliability, social impact and the ease of implementation, but there were variations
between the different panels on the relative importance of these criteria. Participants were
able to make trade-offs between environmental impacts, and reliability and security of supply,
and engaged rapidly with the concept of interim technologies as a means of enabling an
orderly transition over the 100-year period as a step towards a desired future.
Societal Uptake of Alternative Energy Futures – Final Report, October 2006 Page 4 of 40

Table of Contents
1. Introduction................................................................................................... 6 2. Society and Technology – key concepts used in this research. ............. 8 3. Research Methodology .............................................................................. 12
3.1 Overall Research Design ........................................................................................ 12 3.2 Phase 1 Deliberation: Implementation .................................................................... 13 Recruitment........................................................................................................................ 13 The remit ............................................................................................................................ 14 A structured process .......................................................................................................... 14 Provision of information...................................................................................................... 14 3.3 Process review: Phase 2 Implementation ............................................................... 15 3.4 Monitoring the process and analysing the results ................................................... 16
4. Results......................................................................................................... 19
4.1 Perspectives on Energy Scenarios ......................................................................... 19 4.2 Perspectives on the process ................................................................................... 20 4.3 Factor Analysis: Identifying public discourses about energy................................... 21 4.4 Dynamic Analysis – The effect of the panel process............................................... 24 4.5 Perspectives on energy technologies...................................................................... 25 4.6 Integrated Analysis.................................................................................................. 33
5. Conclusions ................................................................................................ 36 6. References .................................................................................................. 38 7. Appendices ................................................................................................. 40 Annex 1 Review of CSIRO Citizens Panel Process (Victoria): A Futures Experience. Dr
Kristen Alford, Director, Bridges8
Societal Uptake of Alternative Energy Futures – Final Report, October 2006 Page 5 of 40

1. Introduction
There is increasing recognition of an important public dimension to the introduction and
diffusion of technologies for achieving greenhouse emission reductions. The public is not a
passive recipient of technological innovation. Their relationship with technologies is
influenced by a range of factors including need, ease of use, price, perceptions of risk and
trust in technology exponents. These factors are strong enough to change the trajectory of
technology uptake and, in the case of low emission energy technologies, the path of
emission reductions.
The overall objective of the research described in this report is to investigate the social
perspectives that will shape different aspects of greenhouse emission reduction scenarios. A
key component of the methodology was to provide small groups of randomly selected public
participants with the opportunity to reflect in detail on Australia’s energy options.
This research ran parallel with the work of the Energy Futures Forum1. The Energy Futures
Forum is an initiative established by CSIRO to explore potential futures for the provision and
use of energy in Australia, in terms of power generation (stationary energy) and transport
fuels. The purpose of the research presented here was to inform the Energy Futures Forum
about the social dimension of energy futures, fleshing out the potential nature of social
responses, rates of technology uptake and bottlenecks of resistance where there are
perceived risks. Specifically, this research aimed to provide:
information regarding public issues and concerns about energy futures and energy
technologies;
an understanding of the dynamic nature of those issues and concerns – how stable
they are, how strongly they are held, what factors could result in change; and
a map representing factors affecting social attitudes to energy scenarios and future
technologies and an indication of how these change.
In order to meet these research goals, three ‘Citizens’ Panels’ were held in Western
Australia, New South Wales and Victoria. These Citizens’ Panels involved groups of
approximately 20 people coming together over a period of three days to explore their ideas
about energy, both before and after receiving information on different aspects of the
1 An Overview of the Energy Futures Forum and its findings is provided in their final report – The Heat is On: The future of energy in Australia: A report by the Energy Futures Forum.
Societal Uptake of Alternative Energy Futures – Final Report, October 2006 Page 6 of 40

Australian energy sector. Both quantitative and qualitative measures were used to record the
perspectives of these groups and any changes over the three day period.
The following report outlines the research and its findings. In Chapter 2, the report discusses
the links between society and technology in general terms, before describing in Chapter 3
the research methodology, its rationale and implementation. In Chapter 4, raw data from the
process are summarised and in Chapter 5 a more detailed analysis and interpretation of the
results are presented.
Societal Uptake of Alternative Energy Futures – Final Report, October 2006 Page 7 of 40

2. Society and Technology – key concepts used in this research.
When it comes understanding how Australia’s energy future might unfold, a complex set of
relationships are involved. Interactions between industry, government and society occur
through a range of mechanisms that are summarised in Figure 2.1. Together, these combine
to influence future markets. The dynamics of these interactions - the manner in which they
form and change in response to exposure, information and experience - become a significant
influence on the rate of change.
Figure 2.1: The links between technology and
society Source: Niemeyer 2005
Technology does not just ‘happen’, but
emerges as a result of a relatively complex
set of processes whereby technologies are
conceived, developed and ultimately
adopted as part of social and economic
practices. The first stage of the project
sought to develop an understanding of
these processes via a literature review.
The review explored the theoretical
frameworks of various disciplines to
identify the factors that influence the
acceptance of new energy technologies
into society. Insights from the review were
then used to develop conceptual models
to inform the research methodology. The
full literature review is available as an
Appendix to this report (Appendix A)
Society
Industry Governance
Impact and uptake
Representation and consultation
Technology options and policy instruments
Industry Government
Society
Figure 2.2 below shows the main stages in technological development identified by the
literature review (development, adoption and use), which are linked via three types of social
process (diffusion, uptake and shaping). An important conclusion is, although much of the
existing literature is focussed on different stages in the technology chain, it is the processes
that drive the system. Of the different processes, technology diffusion dominates the
literature, defined by Rogers (1995, pp.5-6), as a spontaneous or planned process ‘by which
an innovation is communicated through certain channels over time among members of a
social system’. Moreover, diffusion is a particular type of communication, involving sharing of
new ideas. Social uptake and social shaping are less tightly defined, but generally fit in with
the communication theme.

Together these processes comprise the socio-technology system. Figure 2.2 emphasises
these processes cannot be artificially separated. Information flows in a circular manner and,
as a result of the interactions that occur, in which the system as a whole is transformed.
Figure 2. 2: Technology and Society Processes (Source: Niemeyer 2005)
Although the system in total is complex, consistent patterns emerge. Figure 2.3 shows a
typical technology diffusion curve, which reflects the rate at which a technology is adopted.
Identifiable stages include early uptake by ‘innovators’, where the rate of uptake is relatively
slow; through to a ‘take off’ phase of adoption by an early majority, followed by a decline in
the take up rate as the technology reaches saturation point.
Figure 2.3: Stylised Diffusion Process (Source: Niemeyer 2005 adapted from (Rogers 1995, p.11))
Societal Uptake of Alternative Energy Futures – Final Report, October 2006 Page 9 of 40

Although the model of a technology-society system in Figure 2.3 and diffusion process in
Figure 2.2 describes the dynamics of the system in general terms, they do not inform how
particular technologies will perform. For example, diffusions can follow a number of possible
paths, such as those shown by the curves A, B and C; each with different rates of uptake.
In short, although consistent patterns emerge, different technologies involve different
dynamics. With respect to energy technologies, an important distinction is between
consumer technologies (such as the hybrid car), where adoption of a technology occurs at a
small-scale or individual level (be it firm or household) and social technologies (such as
carbon capture and storage), which involve adoption decisions at a much larger scale and
require collective decision processes. This distinction is important because a different set of
motivations guides technology uptake (in the case of consumer technologies) and technology
acceptance (in the case of social technologies).
Social technologies
In terms of Australia’s energy future, many of the decisions take place within the political
sphere (involving citizens), rather than the economic one (the domain of consumers). In this
sphere, the literature on risk perception comes to the fore (Cvetlovich and Lofstedt 1999).
These perceptions have historically been attributed to problems of public information, but
more recently understood as generated as part of relationships and the nature of
communication within the technological system (Grove-White, Macnauten, and Wynne
2000). Trust in the messenger is an important part of the communication process, thus
influencing technology acceptance and/or uptake (Marks 2001; Pueppke 2001).
Trust is not something that can be decreed, but emerges as part of genuine engagement
with the public, its concerns and aspirations. A key conclusion is that engaging the public can
foster significant trust building and reshape the trajectory of technology uptake. Not only can
technology be reshaped to address citizens’ concerns, but also factors that amplify social risk
can be address by concerted efforts such as trust building and targeted information.
Additionally, the information gained from these processes can be used to shape the
technologies or to assess their viability.
Finally, because the technology system is complex and constantly transformed, information
should be obtained and interpreted in a dynamic, rather than static, sense. A methodology is
required that can gain insights into potential responses in light of future events, rather than a
static assessment of public attitudes as they stand. Hence the challenge for this research
Societal Uptake of Alternative Energy Futures – Final Report, October 2006 Page 10 of 40

was to establish a methodology for understanding the dynamics of public attitudes to energy
futures.
Deliberative democratic theory
Dynamic analysis in this research was achieved using formal deliberative process, which
also fits with the ‘communicative’ processes implied by technology diffusion, as well as
providing a useful avenue for informed pubic input. In general, a deliberative process simply
involves group discussion regarding a given topic with a view to forming some conclusion.
Following Dryzek (1990) authentic deliberation involves open communication between well-
informed individuals such that all reasoned arguments are given an equal hearing and
positions are not misrepresented2. More specifically, a deliberative process should satisfy a
number of ideals under which participants engage in discussion with an open mind within an
environment of mutual respect, seeking to understand different perspectives and forming
conclusions following the application of the best possible judgement.
2 An example of misrepresentation is where an individual is in favour of a particular technology and so highlights the negatives associated with alternatives without giving similar treatment to their preferred option.
Societal Uptake of Alternative Energy Futures – Final Report, October 2006 Page 11 of 40

3. Research Methodology
3.1 Overall Research Design
As with most research, an approach that enabled iterations between data collection and
analysis was required. In this instance, the source of the data was through dialogue with and
deliberation between members of the lay public. The research design incorporated two
discrete phases of public deliberation with the opportunity for review and interaction with the
Energy Futures Forum in between (Figure 3.1). These interactions were used to make
revisions to the methodology in the second research phase.
Literature Review and Deliberative
Design
Phase 1 Deliberation
Phase 1 Analysis
Phase 2 Deliberation
Phase 2 Analysis
Review and revision
Reporting
Energy FuturesForum
Research Team Public participation
Figure 3.1: Overall research design for the project
A review of potential participation mechanisms (Lovel et al 2004) compared to the research
needs of the project covering a large and complex issue tended to favour an intensive
deliberative process modelled on a ‘citizens’ jury’ (Crosby 1995) or ‘planning cell’ (Renn,
Webler, Rakel, Dienel, and Johnson 1993). Such processes have the following distinctive
features:
participants are randomly selected and structured to provide a representative sample
of the population being consulted (by age, postcode, gender, etc).
it involves relatively small numbers of participants (usually 12-25).
it requires an independent and skilled facilitator.
Societal Uptake of Alternative Energy Futures – Final Report, October 2006 Page 12 of 40

it is interactive, with participants meeting for 2-4 days.
participants are often provided with some written material before the process.
participants call in ‘expert’ witnesses (usually nominated by the organisers), which
allows the infusion of relevant levels of knowledge into the process to allow for
informed responses.
participants deliberate and produce recommendations.
Many of those selected to participate in such panels have had little previous experience with
political processes. Many initially underestimate their potential contribution. However, having
developed a deeper understanding of the issues, participants invariably gain a sense that
they can make a difference. They are also very appreciative of being taken seriously, that
their views actually count. As most participants come to the process with no particular vested
interest or previous expert knowledge, their minds are open, they are willing to listen, and
they make thoughtful and sensible recommendations influenced more by their role as
citizens’ acting for the common good than as individuals motivated by self-interest. At the
end of the process, either the recommendations are implemented, or a public explanation is
required (adapted from Carson and Gelber 2001).
3.2 Phase 1 Deliberation: Implementation
In Phase 1 of the process, two Citizens’ Panels were held in WA (Perth) and in New South
Wales (Newcastle). Implementation required the following steps:
the recruitment of a diverse cross-section of the public within the relevant catchment
areas, stratified according to appropriate demographic criteria;
definition of a clear remit, or task, to be addressed by the process;
a structured process and a safe environment in which to debate and deliberate;
the provision of balanced information sufficient to address the remit; and
a process to deliver the results of the deliberation.
Recruitment
Details on the recruitment process and the resulting demographic distribution of each of the
Citizens’ Panels are included in Appendix B.
The recruitment of a diverse cross-section of the public involved sending an invitation to a
random selection of 2000 people across each State (New South Wales and Western
Australia). Those interested in participating were asked to respond with essential
demographic information and a self assessment of their knowledge regarding energy
technologies and their personal response to technology adoption (e.g. whether they tended
to adopt early or wait until a technology was proven).
Societal Uptake of Alternative Energy Futures – Final Report, October 2006 Page 13 of 40

Over 180 responses were received, 110 from WA and 71 from NSW. A random stratification
process was used to select 22 individuals so that each major demographic category (age,
gender, employment status, education level and residence in urban or regional locations)
was represented by at least one person. Where this was not possible, preference was given
to those categories that most strongly influence attitudes towards technology, such as age
and education level. Once this was achieved, the next priority was to achieve quotas for each
of the demographic categories that reflect the proportions within the population for the
catchment area, based on Australian Bureau of Statistics (ABS) data. The final composition
of the two Phase 1 Citizens’ Panels comprised 23 citizens from around Western Australia
and 18 people from New South Wales.
The remit
The remit, or the task required of participants, was another important design consideration
for the project. Without a specific remit the objectives of the deliberative process can be
unclear. Moreover, given the wide-ranging scope of the material to be covered — climate
change information, the range of different energy technologies and alternative energy
scenarios — it was important to simplify the task as much as possible, making it tractable for
participants and giving them a clear goal to focus on as they engaged with the information
being presented to them.
The task of the Citizens’ Panel was twofold: to evaluate the range of energy technologies
that might be part of a future energy system for Australia and to make recommendations for
their preferred energy future. The remit presented to participants of the Citizens’ Panel is
outlined in more detail in Appendix C.
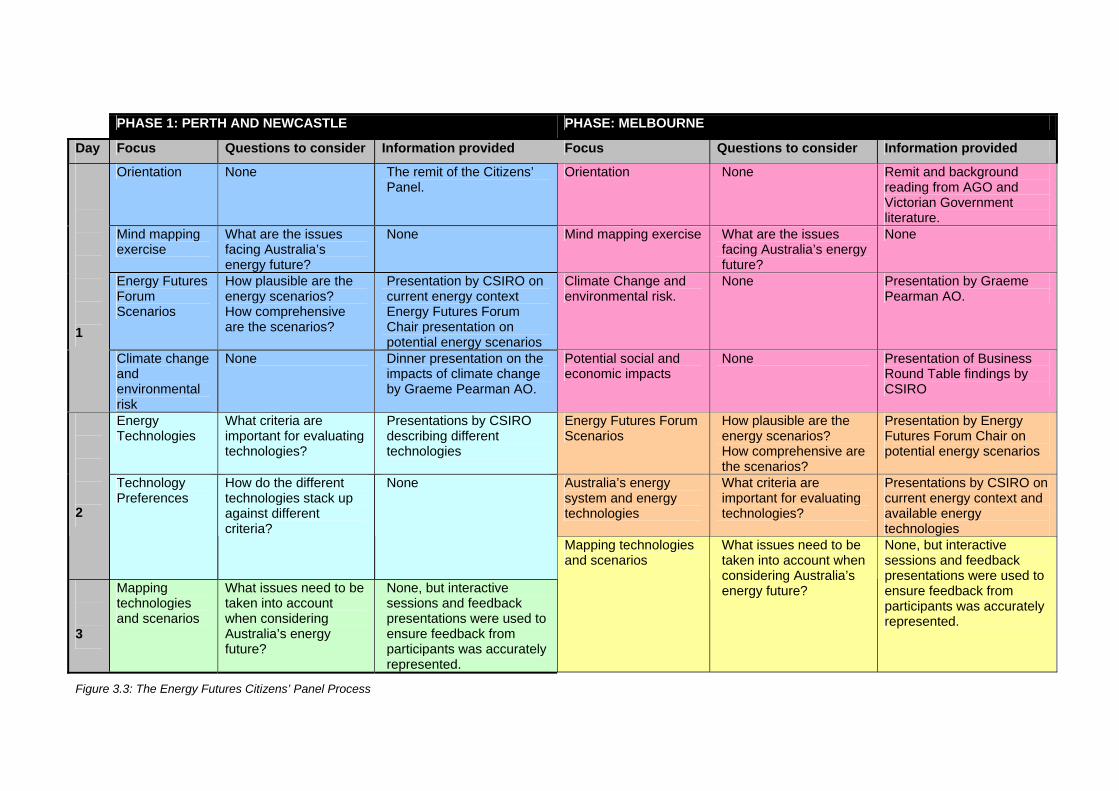
A structured process
To achieve the remit, the facilitator guided the participants through a process designed to:
elicit feedback from them about what they already knew about energy; present information
from energy experts; give opportunities to give feedback on Energy Futures Forum
scenarios; evaluate a range of energy technologies; and make recommendations on energy
futures. Both large and small group exercises were used throughout to maximise
participation. The process design is summarised in Figure 3.3.
Provision of information
No information was provided prior to the process for Phase 1 of the research (other than a
short introduction to the CSIRO and the Energy Futures Forum). The rationale was that, as
Societal Uptake of Alternative Energy Futures – Final Report, October 2006 Page 14 of 40

part of a dynamic analysis, it was important to identify participants’ perspectives at the outset
in order to track changes in their positions as they proceeded through the deliberative
process. Participants’ initial perspectives were identified through an individual survey process
(see below) and a group mind mapping exercise to determine the issues participants felt to
be important in determining Australia’s energy future. Subsequent to that early phase of the
process, information was provided to the participants with time for discussion and debate
according to the structure outlined in Figure 3.3.
In the first phase of deliberation, CSIRO experts presented the broad parameters of
Australia’s current energy situation. The Chair of the Energy Futures Forum then gave a
presentation on the scenarios (storylines about the future) developed by the Energy Futures
Forum followed by participant perspectives on the plausibility and comprehensiveness of the
scenarios. Climate change context was provided through a dinner presentation by Graeme
Pearman, followed by an intensive day of information and discussion around technology
options, presented by CSIRO energy experts.
Delivery of recommendations
The purpose of this deliberative process was to inform the Energy Futures Forum
deliberations and guide the Energy Transformed Flagship’s ongoing research portfolio. The
Panels were informed that CSIRO, through the Energy Transformed Flagship, is keen to
incorporate feedback and comment from members of the public. Hence a key part of the
Citizens’ Panel was the feeding back of the participants’ findings in the form of small group
presentations which were subsequently combined and delivered as a single presentation by
the research team to the Energy Futures Forum. Participants had the opportunity to modify
the proposed presentation and work on it with the research team to ensure that it
represented adequately their views and the messages they wanted to convey to the Energy
Futures Forum. This proved to be a useful opportunity for final deliberations.
3.3 Process review: Phase 2 Implementation
In Phase 2, a single Citizens’ Panel was held in Victoria (Melbourne) in 2006, about eight
months after Phase 1. Once again, recruitment followed the approach outlined in Appendix
B, with 18 participants ultimately attending the Victorian Citizens’ Panel.
Following analysis and review of the Perth and Newcastle panels, some process
modifications were made prior to the Phase 2 of deliberation. This phase was designed to
test the outcomes of Phase 1 and in response to participant feedback from exit surveys and
follow-up interviews to produce an updated methodology and information process. Changes
were made, primarily in order to:
Societal Uptake of Alternative Energy Futures – Final Report, October 2006 Page 15 of 40

provide more time for deliberation. There was evidence of ‘incomplete deliberation’
particularly in Perth where some aspects of deliberation were still exploratory at the
end of the three days;
ensure the opportunity to ask questions about the impacts of climate change in the
same format as other topics.
provide more opportunities for the participants to understand the nature of their task
through sending out more written information before the Panel process began.
The primary difference was in the approach to information provision. The context was set
through delivering information on climate change first, followed by a presentation based on a
recently published Business Round Table on Climate Change reports (available at
www.businessroundtable.com.au) on the economic costs of action on climate change and
thirdly the scenarios being developed by the Energy Futures Forum. In this way, the big
picture issues were addressed first with environmental concerns presented alongside
economic considerations. Subsequently, CSIRO experts presented on the current energy
situation and the range of energy technology options. The revised process used for Phase 2
is outlined in Figure 3.3 below.
3.4 Monitoring the process and analysing the results
The Citizens’ Panel environment provided the means for participants to explore their
perspectives in depth, in ways consistent with deliberative ideals, but not normally achieved.
The differences between these two phases provide important reference points for the
dynamic analysis. An important component of the research design was to ensure that these
perspectives, and the way they changed as deliberation proceeded, could be monitored.
Participants were asked to undertake identical survey exercises at the beginning, half way
through and at the end of the process. These surveys, which adopted both quantative and
qualitative tracking methods (described below), were used as measurement techniques to
explore how attitudes changed throughout the process as a result of information and
deliberation.
Inverted Factor Analysis
The first method was a form of quantitative discourse analysis based on Q methodology,
which has been demonstrated to be a powerful tool for analysis of behaviour using small
samples (Dryzek, 1990; Brown, 1980). It is also one of the few methodologies (particularly
among those that are quantitative in nature) that is consistent with discourse theory (Blaug,
1997).
Societal Uptake of Alternative Energy Futures – Final Report, October 2006 Page 16 of 40

This method usually begins by sampling opinions, dialogue or interviews about the subject in
question to form a ‘concourse’ (to use the term applied by Q-methodologists). These
statements are then organised thematically into groups from which statements are randomly
drawn to form the set of statements for the study.
Once the statements are selected, the Q study follows the following steps:
1. Ranking and sorting of statements (Q sorts) by participants
2. Obtaining discourses (factors) from raw data
3. Applying judgmental rotation to the initial factors; and
4. Interpreting and describing the resulting discourses.
The Q sort statements used in the Citizens’ Panels are included as Appendix D.
Technology Preferences
Technology preferences were tracked in conjunction with Q sorts, and were used to both
assist with the extraction of discourses and understand how changes to discourses impacted
technology preferences. The task simply involved each participant ranking their preferences
for a range of technologies each time they undertook the survey (i.e. as they entered the
process, half way through and at the end).
Qualitative Tracking
Factor analysis provided a quantitative method of tracking participant attitudes during the
process. In addition, a good deal of qualitative data was also obtained, in the form of
transcripts from the discursive process and follow-up interviews. This information was used
to ‘triangulate’ the Q results and built up a coherent picture of responses and the dynamics of
the discussion.
Societal Uptake of Alternative Energy Futures – Final Report, October 2006 Page 17 of 40
PHASE 1: PERTH AND NEWCASTLE PHASE: MELBOURNE
Day Focus Questions to consider Information provided Focus Questions to consider Information provided
Orientation None The remit of the Citizens’ Panel.
Orientation None Remit and background reading from AGO and Victorian Government literature.
Mind mapping exercise
What are the issues facing Australia’s energy future?
None Mind mapping exercise What are the issues facing Australia’s energy future?
None
Energy Futures Forum Scenarios
How plausible are the energy scenarios? How comprehensive are the scenarios?
Presentation by CSIRO on current energy context Energy Futures Forum Chair presentation on potential energy scenarios
Climate Change and environmental risk.
None Presentation by Graeme Pearman AO.
1
Climate change and environmental risk
None Dinner presentation on the impacts of climate change by Graeme Pearman AO.
Potential social and economic impacts
None Presentation of Business Round Table findings by CSIRO
Energy Technologies
What criteria are important for evaluating technologies?
Presentations by CSIRO describing different technologies
Energy Futures Forum Scenarios
How plausible are the energy scenarios? How comprehensive are the scenarios?
Presentation by Energy Futures Forum Chair on potential energy scenarios
Australia’s energy system and energy technologies
What criteria are important for evaluating technologies?
Presentations by CSIRO on current energy context and available energy technologies
2
Technology Preferences
How do the different technologies stack up against different criteria?
None
3
Mapping technologies and scenarios
What issues need to be taken into account when considering Australia’s energy future?
None, but interactive sessions and feedback presentations were used to ensure feedback from participants was accurately represented.
Mapping technologies and scenarios
What issues need to be taken into account when considering Australia’s energy future?
None, but interactive sessions and feedback presentations were used to ensure feedback from participants was accurately represented.
Figure 3.3: The Energy Futures Citizens’ Panel Process
4. Results
4.1 Perspectives on Energy Scenarios
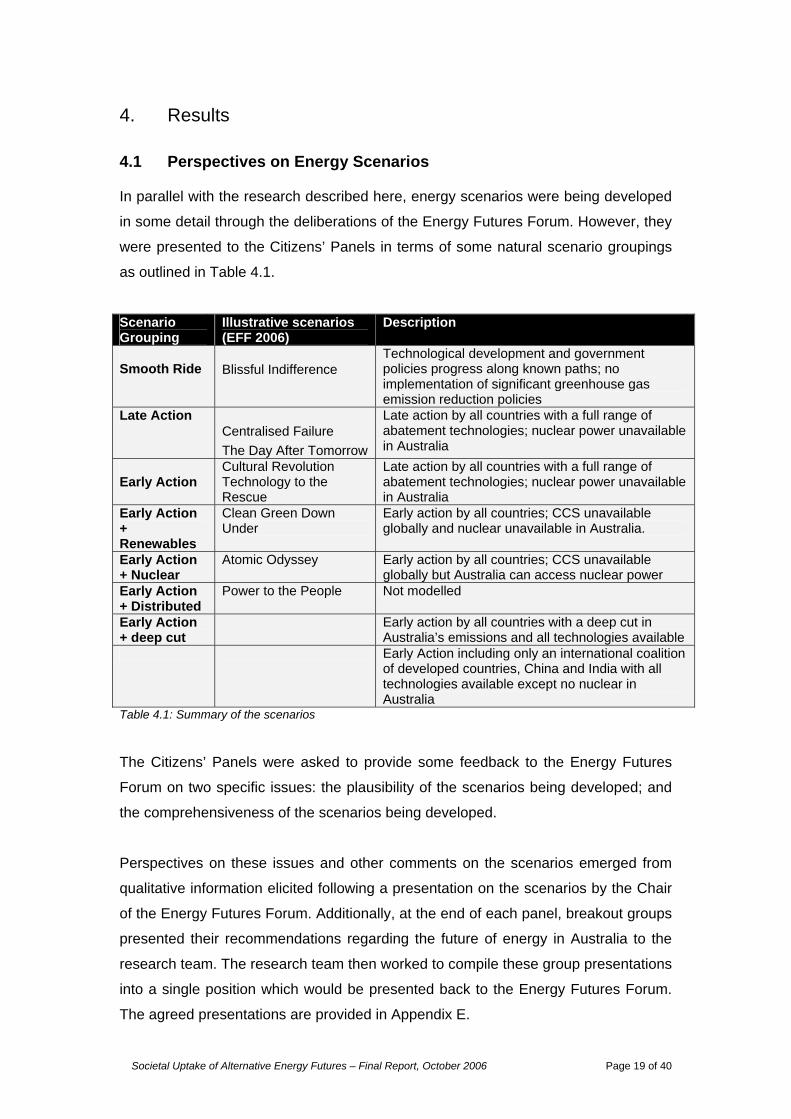
In parallel with the research described here, energy scenarios were being developed
in some detail through the deliberations of the Energy Futures Forum. However, they
were presented to the Citizens’ Panels in terms of some natural scenario groupings
as outlined in Table 4.1.
Scenario Grouping
Illustrative scenarios (EFF 2006)
Description
Smooth Ride Blissful Indifference
Technological development and government policies progress along known paths; no implementation of significant greenhouse gas emission reduction policies
Late Action Centralised Failure The Day After Tomorrow
Late action by all countries with a full range of abatement technologies; nuclear power unavailable in Australia
Early Action
Cultural Revolution Technology to the Rescue
Late action by all countries with a full range of abatement technologies; nuclear power unavailable in Australia
Early Action + Renewables
Clean Green Down Under
Early action by all countries; CCS unavailable globally and nuclear unavailable in Australia.
Early Action + Nuclear
Atomic Odyssey Early action by all countries; CCS unavailable globally but Australia can access nuclear power
Early Action + Distributed
Power to the People Not modelled
Early Action + deep cut
Early action by all countries with a deep cut in Australia’s emissions and all technologies available
Early Action including only an international coalition of developed countries, China and India with all technologies available except no nuclear in Australia
Table 4.1: Summary of the scenarios
The Citizens’ Panels were asked to provide some feedback to the Energy Futures
Forum on two specific issues: the plausibility of the scenarios being developed; and
the comprehensiveness of the scenarios being developed.
Perspectives on these issues and other comments on the scenarios emerged from
qualitative information elicited following a presentation on the scenarios by the Chair
of the Energy Futures Forum. Additionally, at the end of each panel, breakout groups
presented their recommendations regarding the future of energy in Australia to the
research team. The research team then worked to compile these group presentations
into a single position which would be presented back to the Energy Futures Forum.
The agreed presentations are provided in Appendix E.
Societal Uptake of Alternative Energy Futures – Final Report, October 2006 Page 19 of 40

The main outcomes of Panel feedback on the Energy Futures Forum scenarios were
as follows:
Plausibility of the scenarios
Late Action scenarios were considered plausible.
Early Action with distributed energy engendered the maximum interest from
all three Panels’ particularly in terms of the opportunities it presented for
localised (distributed) generation and the requirements for additional
regulation.
At the Melbourne panel, the business costs of Early Action were discussed
much more by the participants in the light of the additional information
provided on economic costs, but they still gravitated towards the Early Action
scenario.
Some of the assumptions implicit in the Early Action scenario were
considered implausible, most notably the notion of free global trading and
commerce.
Comprehensiveness of the scenarios
No additional scenarios were identified by the Panels. However, all three Panels
made suggestions about how to bring about the scenarios with an emphasis being
placed on public education and the establishment of an independent body to
administer revenue from a carbon tax back into energy research and development.
Summary of recommended energy futures
The general feeling in all panels was that a paradigm shift is required to enable
Australia to become a more synergistic society where goods are shared, wastes are
reduced, re-used and/or recycled and services are provided on the basis of lifecycle
management. This was not seen as necessarily being detrimental to the economy if
we can think differently about how to run our businesses. The Panels were prepared
to pay more in taxes to make this happen, but wanted reassurance that the money
raised was going to encourage low emission energy pathways.
4.2 Perspectives on the process
A fortuitous outcome of the Melbourne Panel was the presence of a participant who
asked if she could write up the process as part of an assignment3. This report she
3 Review of CSIRO Citizens Panel Process (Victoria): A Futures Experience. Dr Kristen Alford, Director, Bridges8
Societal Uptake of Alternative Energy Futures – Final Report, October 2006 Page 20 of 40

produced gives an external perspective on the value and overall management of the
Citizens Panel process as implemented in Melbourne. This gives a valuable external
perspective on the value and overall management of the Citizens Panel process as
implemented in Melbourne. As such it has been included as an Annex to this report.
4.3 Factor Analysis: Identifying public discourses about energy.
The factor analysis and surveys were the main method of tracking the shifts in
perspectives held by the participants during the process. Analysis of the “Q sort” data
revealed five different types of “discourse” or “factors” that emerged over the course
of deliberation (see Appendix F for details). These discourses embody grouping of
values and beliefs in relation to energy technologies. These have been loosely
typified as follows and are summarised in Table 4.2 and Figure 4.1:
A Broad Scale Reform
B Centralised Energy Generation
C Orderly Reform
D Technologically Conservative
E Radically Alternative
Societal Uptake of Alternative Energy Futures – Final Report, October 2006 Page 21 of 40

Figure 4.1: Prevalent public discourses with typifying statements from Q surveys.
Societal Uptake of Alternative Energy Futures – Final Report, October 2006 Page 22 of 40

Discourse Attractive Technologies A: Broad Scale Reform
Associated with a ‘whole energy system’ approach and a belief that all technologies can compete once all externalities are factored in. Attracted to renewable technologies. Willingness to endure some impact on lifestyle
Renewable / decentralised technologies, such as:
Wind Solar Biomass Geothermal
B: Centralised Energy Generation
Most strongly associated with emphasis on centralised generation and distribution of energy, and technologically intensive approaches to greenhouse gas reduction. It is consistent with a high degree of faith in large-scale solutions and the expertise in the policy and regulatory systems that implement them. Although there is sympathy for alternative energy solutions, such as renewable energy, this is tempered by a belief that they are not reliable enough to supply a large proportion of energy needs. While nuclear is not ruled out, it is not seen as the sole solution, just one that can have a fit with the aims of security of supply, large scale generation and low emissions.
Centralised technologies such as: Coal (only if combined
with carbon capture and sequestration)
Natural Gas Nuclear (in some cases)
C: Orderly Reform
Concerned about energy policy and how it might drive the system to evolve. Considered enthusiasm for technological possibilities. Incremental technology innovation across a spectrum of approaches, combined with demand management, is seen as the primary solution to greenhouse gas emissions.
Wide portfolio of technologies.
D: Technologically Conservative
Represents a potentially spirited defence of Australia’s energy policy system. It is the most technologically conservative and price-sensitive of the discourses. Evidence of cynicism in the role of experts. Greater emphasis is placed on behaviour and demand to reduce greenhouse gas emissions. Prefers approaches that ‘adapt’ rather than ‘mitigate’ climate change.
Averse to (radical) technological change
E: Radically Alternative
Concerned about many of the large-scale technologies, partly because of the risk involved. Rather than driving change to the energy system, technology should follow the lead, rather than drive the agenda. Mechanisms for achieving solutions are heavily centralist, with a strong role for government.
Low risk technologies (minimum supply disruption)
Table 4.2: Summary characteristics of the prevalent discourses
Societal Uptake of Alternative Energy Futures – Final Report, October 2006 Page 23 of 40

4.4 Dynamic Analysis – The effect of the panel process
Changes to discourses
Significant shifts in the strength of these discourses as dialogue progressed are
illustrated in Figure 4.2 and detailed in Appendix G. One trend that can be observed
across all three panels is a move away from Discourse D and E, representing the
dissipation of both conservative and radical views at both ends of the spectrum on
energy technologies. This finding contradicts the so-called ‘law of group polarization’
(which is sometimes observed in much less intensive processes (Sunstein 2000),
suggesting instead a movement toward the larger, more ‘moderate’ or commonly
shared perspectives. An important component of this shared perspective was a
dramatically increased level of concern about climate change, which became an
important driver for almost all of the resulting perspectives on energy futures.
These changes were not uniform. In the case of the Phase 1 panels, it was
Discourse B (Centralised Distribution) that grew most to become the largest
discourse. As outlined above, Discourse B represents a centralised energy
generation discourse that is heavily concerned about greenhouse emissions, but
averse to structural change in the energy system. This contrasts with the changes in
the Phase 2 panel in Victoria, which came to be dominated by Discourse C (Orderly
Reform) followed by Discourse A (Broad Scale Reform). Both discourses represent
energy system reform, though Discourse C adopts a more evolutionary perspective.
These differences reflect different pathways in publicly desired energy futures. This is
illustrated best via change to technology priorities, as shown in Figure 4.3, which
shows the change in average rank for each of the technologies during the panel
process (see Appendix G for details). In short, Phase 1 panels shifted towards
technologies which through the lens of Discourse B, were seen as consistent with the
existing system, capable of ‘keeping the lights on’ with minimal disruption and
capable of achieving deep cuts in greenhouse emissions. However, despite a good
deal of convergence during the process, a few key issues divided the groups
between differing visions for Australia’s energy future between centralised (usually
translated into nuclear) and reform toward decentralisation.
By contrast, the Phase 2 panel demonstrated much less division. It shifted very
strongly toward carbon capture and storage, which was, through the lens of
Societal Uptake of Alternative Energy Futures – Final Report, October 2006 Page 24 of 40

Discourse C, viewed as a step technology on the path to evolutionary change in the
energy system, though not a solution in itself.
These differences in part reflect different State contexts. The public discourse
surrounding energy options was different in Victoria, particularly following the
announcement of a trial Carbon Capture and Storage programme in the region,
which was just becoming public as the panel was formed. Another factor appears to
be the changes to the design of the panel for Phase 2. These changes were in part a
response to concerns about ‘incomplete deliberation’, which suggested the observed
Phase 1 changes were based on partial synthesis of the issues due to constraints
within the original design – many of which were also identified by the participants
themselves in follow-up interviews. These constraints appear to have unintentionally
privileged the impacts of climate change in contrast to the wider array of
environmental, social and economic impacts and led to an increase in a ‘do
something at any cost’ perspective.
O ve ra l
-1 0
0
1 0
2 0
3 0
4 0
5 0
A B C D EF a c t o r Figure 4.2: Shifts in perspectives as a result of the panel process
Follow up interviews from the Victorian Panel were generally positive (see Annex 1
for an example) which suggests the modifications were successful and implies that
the Victorian results may provide a more representative window into an ‘informed
public position’.
4.5 Perspectives on energy technologies
As part of the process, participants were asked to assess their preferences for the
technologies presented during the process, both before the deliberation and at the Societal Uptake of Alternative Energy Futures – Final Report, October 2006 Page 25 of 40

end. Two different types of exercise were undertaken. The first was a simple ranking
of technology priorities which was undertaken three times in conjunction with the Q
sort survey, before, during and after the deliberation. The second was a more
detailed multi-criteria assessment exercise.
Technology prioritisation
Participants were asked to consider what priority they would place on investing in
nine different technologies. This was done three times throughout the process to
examine any shifts that emerged as a result of information provision. Figure 4.3
shows how the technology priorities of each panel as a whole changed during the
deliberative process. Each bar represents the change in average rank for each of the
nine technologies in the Technology Priority survey. A positive value indicates a shift
in favour of a technology and vice versa for a negative value. The lines for each bar
indicate a 95% confidence interval so that where the interval does not cross the x-
axis the change is statistically significant at the 95% level. The data are detailed in
Appendix G.
-3
-2
-1
0
1
2
3
4
Wind Biomass CCS Hydro Natural Gas Geothermal Solar Nuclear Coal
Ave
rage
rank
cha
nge
(incr
ease
)
WA NSW VIC
Figure 4.3: Average Technology Priority Ranks before and after dialogue
Multi-criteria assessment of energy technologies
In each panel, a more structured multi-criteria attribute analysis was undertaken.
Participants were asked as a group to identify the criteria they felt most important
when assessing the value of different scenarios as part of Australia’s future. The
results are summarised in Figure 4.4. Greenhouse gas emissions clearly dominated
for all panels, followed by other environmental impacts. The Victorian panel was
clearly concerned with social impact (possibly the result of an increased profile of this
Societal Uptake of Alternative Energy Futures – Final Report, October 2006 Page 26 of 40

issue politically within the State), whereas NSW exhibits significantly higher concern
for reliability and resource sustainability – the ‘keeping the lights on’ position which is
also associated with Discourse B.
1
2
3
4
5
6
7
8A. Greenhousegas emissions
B. Otherenvironmental
impacts
C. Costs andeconomics
D. Reliability andresource
sustainability
E. Innovation andimplementation
F. Social impact G. Political powerand regulation
Avera
ge R
ati
ng
WA NSW Victoria
* Criteria G was not included in the WA survey
Figure 4.4: Assessment criteria for technology options
The criteria given above were weighted using individual ranking results. Panel
participants were asked to rank a range of technologies against each of the criteria.
Again, the individual results were compiled and assessed by the research team to
derive amalgamated group results for each technology (Figure 4.5). A higher score
reflects a more positive assessment for that technology against a given criteria.
There was reasonable consensus between all three panels regarding their overall
assessments. However, interesting subtleties emerged that provide a window into the
thought processes influencing the results emerging from the questionnaires and
exercises.
In the Phase 2 Victorian panel, there is an apparent discrepancy in the data between
the increasing profile of carbon capture and storage observed in the discourse
analysis and the relatively low ranking given to carbon capture and storage in the
Technology Assessment Exercise. Further analysis of all the monitoring data
provides a rationale for this difference. The desire to evolve the energy system and
implement orderly reform (Discourse C) came to dominate the discussions in
Societal Uptake of Alternative Energy Futures – Final Report, October 2006 Page 27 of 40

Victoria. Carbon Capture and Storage was seen fundamentally as part of that orderly
reform – hence it increased in profile during the discourse analysis. However, it was
not seen as the end of the reform process but as a transition technology. Hence the
Victorian Panel rated Carbon Capture and Storage lower in terms of its contribution
to innovation.
The debate around nuclear energy technologies was different between Phase 1 and
Phase 2. In Phase 1, the NSW and WA panels identified the strengths of nuclear as
being in greenhouse gas emission reduction and reliability, criteria which received
high rankings. However in the Phase 2 Victorian Panel, nuclear technology was
ranked lower in terms of social impact, environmental impact and reliability. One
interpretation of this data is that the Victorian panel were able to subject nuclear to
higher levels of scrutiny and became concerned about technological “lock in”,
whereby the vision of the future becomes dominated by a single technology thereby
reducing the potential for adaptation and flexibility as new solutions comes on line.
This raises the question about why CCS increased in favour during the Phase 2
panel. The answer lies not in the multi-criteria assessment, but in the results of the
discourse analysis. As previously mentioned, Discourse C became particularly strong
during deliberations in Victoria. The emphasis on the need to evolve the energy
system and do something about greenhouse emissions embodied in the discourse
reflects the actual nature of discussion during the panel. From this, CCS emerged not
as a goal for energy system, but a necessary step, if even an unfortunate one in the
perspective of many participants. In many ways this step is consistent with the
concerns about energy security embodied in Discourse B in WA and NSW.
In those cases, nuclear power appeared to fit the bill, but was subjected to greater
scrutiny in the phase 2 Victorian panel. Consequently, from the participants’
comments, it was seen as an expensive case of technological lock-in. Although it
apparently addressed greenhouse concerns, it was not consistent with the long-term
vision for the future, which was more akin to what is expressed in Discourse A, with
greater emphasis on renewables, than Discourse B’s emphasis on keeping the lights
on at all costs.
Societal Uptake of Alternative Energy Futures – Final Report, October 2006 Page 28 of 40

Wind
0
1
2
3
4
5
A. GreenhouseGas Emissions
B. EnvironmentalImpact
C. Costs andEconomics
D. Reliability andResource
Sustainability
E. Innovation andImplementation
F. Social Impact G. Political Powerand Regulation
WA NSW VIC
Biomass
0
1
2
3
4
5
A. Greenhouse GasEmissions
B. EnvironmentalImpact
C. Costs andEconomics
D. Reliability andResource
Sustainability
E. Innovation andImplementation
F. Social Impact G. Political Powerand Regulation
WA NSW VIC
CCS
0
1
2
3
4
5
A. GreenhouseGas Emissions
B. EnvironmentalImpact
C. Costs andEconomics
D. Reliability andResource
Sustainability
E. Innovation andImplementation
F. Social Impact G. Political Powerand Regulation
WA NSW VIC
A
vera
ge r
atin
g ag
ains
t ea
ch c
rite
ria
(hig
her
rati
ng)
Societal Uptake of Alternative Energy Futures – Final Report, October 2006 Page 29 of 40

Hydro
0
1
2
3
4
5
A. GreenhouseGas Emissions
B. EnvironmentalImpact
C. Costs andEconomics
D. Reliability andResource
Sustainability
E. Innovation andImplementation
F. Social Impact G. Political Powerand Regulation
WA NSW VIC
Geotherma
0
1
2
3
4
5
A. GreenhouseGas Emissions
B. EnvironmentalImpact
C. Costs andEconomics
D. Reliability andResource
Sustainability
E. Innovation andImplementation
F. Social Impact G. Political Powerand Regulation
WA NSW VIC
Natural Gas
0
1
2
3
4
5
A. GreenhouseGas Emissions
B. EnvironmentalImpact
C. Costs andEconomics
D. Reliability andResource
Sustainability
E. Innovation andImplementation
F. Social Impact G. Political Powerand Regulation
WA NSW VIC
A
vera
ge r
atin
g ag
ains
t ea
ch c
rite
ria
(hig
her
rati
ng)
Societal Uptake of Alternative Energy Futures – Final Report, October 2006 Page 30 of 40

Solar
0
1
2
3
4
5
A. GreenhouseGas Emissions
B. EnvironmentalImpact
C. Costs andEconomics
D. Reliability andResource
Sustainability
E. Innovation andImplementation
F. Social Impact G. Political Powerand Regulation
WA NSW VIC
Nuclear
0
1
2
3
4
5
A. GreenhouseGas Emissions
B. EnvironmentalImpact
C. Costs andEconomics
D. Reliability andResource
Sustainability
E. Innovation andImplementation
F. Social Impact G. Political Powerand Regulation
WA NSW VIC
Coal
0
1
2
3
4
5
A. GreenhouseGas Emissions
B. EnvironmentalImpact
C. Costs andEconomics
D. Reliability andResource
Sustainability
E. Innovation andImplementation
F. Social Impact G. Political Powerand Regulation
WA NSW VIC
A
vera
ge r
atin
g ag
ains
t ea
ch c
rite
ria
(hig
her
rati
ng)
Figure 4.5: Multi-criteria attribute analysis for individual energy technologies
Societal Uptake of Alternative Energy Futures – Final Report, October 2006 Page 31 of 40

Figure 4.6 shows the criteria assessment scores aggregated for each technology.
There are no statistically significant differences between the three panels. However
there are clear differences between technologies, with solar power consistently
scoring highly, particularly in WA, and coal (without carbon capture and storage)
scoring poorly overall.
0
5
10
15
20
25
30
35
Wind Biomass CCS Hydro NGas Geothermal Solar Nuclear Coal
Technology
WA NSW VIC
Figure 4.6: Average Aggregate Score for each technology, by state
Societal Uptake of Alternative Energy Futures – Final Report, October 2006 Page 32 of 40

4.6 Integrated Analysis
A consistent difference is seen in all three panels between the results of the two
different technology exercises:
Hydroelectricity ranks higher in the structured technology assessment
exercise than in the more subjective priority ranking exercise in all three
states;
Carbon capture and storage ranks consistently lower in the structured
technology assessment.
Behind the concept of deliberative democracy is the idea that the opinions of
individuals should be more reasonable, or more based on reflection towards the end
of the process. However, the challenge is in determining when deliberation is
completed. Where differences in ranking were observed between the two processes
(as in the case of hydroelectricity and carbon capture and storage) there are two
possible explanations:
An incomplete preference construction (Slovic 1995) whereby affinity with a
particular discourse has not been properly translated into technological
preferences, for example because of the salience problem as in the case of
nuclear power.
Unformed value systems whereby the values and beliefs that comprise the
underlying attitudes are themselves not yet fully formed — as would occur if
there were insufficient information.
Either of these could account for the observed differences with hydroelectricity and
carbon capture and storage, which are both non-standard technologies. However,
there is a significant question as to wether deliberation on emergent technologies can
ever be regarded as “complete”. This is not least because of epistemic limitations on
the certainty of knowledge, which mean that expectations of complete consensus are
usually unreasonable (Dryzek and Niemeyer 2006). However, the incomplete
preference construction hypothesis can be tested (partially) by using inter-subjective
comparisons where any two participants with a similar Q-sort should also have
similar technology preferences.
Societal Uptake of Alternative Energy Futures – Final Report, October 2006 Page 33 of 40

The result of this analysis is shown in Figure 4.7 for each of the panels at four
different stages in the process.4 Each scatter-plot depicts the consistency in
agreement between Q sorts and Technology Priority Exercise. The individual points
represent the Q sort correlation of individual pairs of participants (on the x-axis)
plotted against their Technology Priority Exercise correlation at that particular stage
of the process. The regression (straight) line and its 95% limits (curved lines) are also
shown, as is the overall correlation coefficient (Pearson5) in the lower right hand side
of each graph.
The strength of the relationship between Q and Technology Priority Exercise results
can be seen from both the slope of the regression line, the narrowness of the 95%
regression contours and, most importantly, the size of the correlation coefficient. In
terms of individual plots, this relationship is reflected in the extent to which the data
points converge toward the regression line. In addition, the overall level of consensus
can also be gauged from the position of the plots. Greater consensus among the Q
sorts results in a shift of the plots to the right, and toward the top in the case of
Technology Priority Exercise.
4 It was not possible to do this analysis for the ‘pre’ data for the VIC panel because no Q sort was performed at the same time as the Technology Priority Exercise. 5 The Pearson correlation is the measure of association for quantitative variables. The larger the absolute value, the stronger the degree of linear association i.e. -0.80 is stronger than 0.40. The slope must fall between -1 and +1. (Agresti 1999)
Societal Uptake of Alternative Energy Futures – Final Report, October 2006 Page 34 of 40

* = significant r value (95%) ** significant r value (99%)
Figure 4.7: Inter-subjective relationships between underlying attitudes (Q sort) and resulting preferences (Technology Priority Exercise)
Societal Uptake of Alternative Energy Futures – Final Report, October 2006 Page 35 of 40

The results in Figure 4.7 show a clear improvement in the Q-Technology Priority Exercise
relationship between stages 1 (pre-deliberation) and 3 (post-deliberation). A similar pattern of
improvement can be seen in both WA and NSW (from 0.16 in both cases to 0.42 and 0.49
respectively).
The magnitude of improvement is similar for Victoria, but beginning from a much higher
correlation pre-deliberation (0.30) to reach 0.60. This may reflect a particular design difference
for the Victorian panel, where participants performed a ‘pre’ Technology Priority Exercise survey
and were provided with a limited amount of information about different energy technologies to
prepare them for the Energy Futures Citizens’ Panel. This may have caused some pre-process
reflection about their respective positions regarding energy technologies and construction of
preferences. By contrast, the WA and NSW participants arrived at the process ‘cold’, not having
been giving prior information. For those participants who had not previously encountered the
relevant issue, this would have increased the chances of measuring un-constructed preferences
based on ‘non-attitudes’.
5. Conclusions
In terms of understanding the dynamics of technology uptake, two processes are captured in
the results. The first occurs where there is sudden alarm in the public sphere about climate
change and a shift toward intuitively appealing “silver bullet” solutions. The second type of
dynamic is where there is (arguably) a more sophisticated development of a position and a
transition of technologies is adopted.
Overall, the Phase 2 panel in Victoria is different to Phase 1 in a number of important ways.
Firstly, it emphasised qualitatively different criteria in assessments of Australia’s energy future. It
did so because, where climate change dominated much of the thinking of the earlier panels, in
Victoria it was not seen as any less important, but was viewed more so in the context of a wider
array of issues, such as the shape of the community. Moreover, on the continuum of extremes
between immediate responsiveness to more considered synthesis to the issues, it appears that
Phase 2 was farther along toward synthesis.
There are clear implications for the differences in these results for how public perceptions
surrounding energy futures might potentially unfold. These are best expressed using two
scenarios. The first scenario occurs where concerns about climate change come to the fore of
public discourse – though media coverage, strongly perceived climate impact or both – where
preferences become oriented toward intuitively appealing solutions to a narrow spectrum of
issues driven by concern about climate change. The second scenario is represented in Phase
2. Here public discourse is less dominated by single-shot solutions because greenhouse Societal Uptake of Alternative Energy Futures – Final Report, October 2006 Page 36 of 40

emissions, although important, are not the sole issue. Instead focus is on integrated solutions
across a range of energy portfolios and step-wise changes, avoiding technological lock-in.
The first scenario is a more likely outcome, particularly if dramatic climate events continue to
unfold. Scenario 2 represents a more reflective outcome where the public is given the
opportunity to reflect on the issues. Whatever the case, the results reveal a potentially strong
level of concern about greenhouse emissions and a desire to see something done about it.
They way in which these concerns translate into preferences for particular energy futures vary
based on a small number of criteria.
Societal Uptake of Alternative Energy Futures – Final Report, October 2006 Page 37 of 40

6. References
Agresti, A. and Finaly, B. 1999 Statistical Methods for the Social Sciences: Third Edition
Prentice Hall Inc, Upper Saddle River, New Jersey, USA.
Australian Business Roundtable on Climate Change (2006), The Business Case for Early
Action, available at www.businessroundtable.com.au accessed 13 November 2006.
Blaug, R. (1997). Between fear and disappointment: critical, empirical and political uses of
Habermas. Political Studies, 45, 100–117.
Brown, S. R. (1980). Political Subjectivity: Applications of Q methodology in political science.
New Haven: Yale University Press.
Carson, L and Gelber, K (2001) Ideas for Community Consultation: A discussion on Principles
and Procedures for Making Consultation Work. Sydney: NSW Dept of Urban Affairs and
Planning.
Crosby, N. (1995). Citizens Juries: One solution for difficult environmental questions. In O.
Renn, T. Webler and P. Wiedemann (Eds.), Fairness and Competence in Citizen
Participation: Evaluating Models for Environmental Discourse (Vol. 8, pp. 157–174).
Dordecht: Kluwer.
Cvetkovich, G., and Löfstedt, R. (Eds.). (1999). Social trust and the management of risk.
London: Earthscan.
Dryzek, J. S., and Niemeyer, S. J. (2006). Reconciling pluralism and consensus as political
ideals. American Journal of Political Science.
Dryzek, J. S. (1990). Discursive Democracy: Politics, Policy and Political Science. Cambridge:
Cambridge University Press.
Grove-White, Robin, Phil Macnaughten, and Brian Wynne. 2000. Wising Up: The public and
new technologies: Centre for the Study of Environmental Change, Lancaster University.
Lovel R, Katz E, Solomon FL. (2004) ‘Participation processes for the minerals industry’
CSIRO Minerals Report DMR-2375. Melbourne, Australia.
Marks, Leonie A. 2001. Communicating about agrobiotechnology. AgBioForum 4 (3-4):152–
154.
Niemeyer, N. and Littleboy, A. 2005 “Societal Uptake of Energy Technologies: A framework
for examining social responses to energy technologies in Australia Energy Futures”
Report No. P2006/30, CSIRO, Brisbane Australia.
Societal Uptake of Alternative Energy Futures – Final Report, October 2006 Page 38 of 40

Pueppke, S. G. 2001. Agricultural biotechnology and plant improvement: setting the stage for
social and economic dialogue. American behavioral scientist 44 (8):1233-1245.
Renn, O., Webler, T., Rakel, H., Dienel, P., and Johnson, B. (1993). Public participation in
decision making: a three-step procedure. Policy Sciences, 26, 189–241.
Rogers, Everett M. (1995) Diffusion of innovations. 4th ed. New York: Free Press.
Slovic, P. (1995). The construction of preference. American Psychologist, 50, 364–371.
Sunstein, Cass R. 2000. The Law of Group Polarization. Chicago: Chicago University Press.
Stephenson, W. (1953) The study of behavior: Q-technique and its methodology. Chicago:
University of Chicago Press.
Societal Uptake of Alternative Energy Futures – Final Report, October 2006 Page 39 of 40

7. Appendices
Societal Uptake of Alternative Energy Futures – Final Report, October 2006 Page 40 of 40

Appendix A - Literature Review
Societal Uptake of Energy Technologies
A framework for examining social responses to energy technologies in Australia
Energy Futures
Simon Niemeyer and Anna Littleboy
Report No. P2006/30
Page A.1
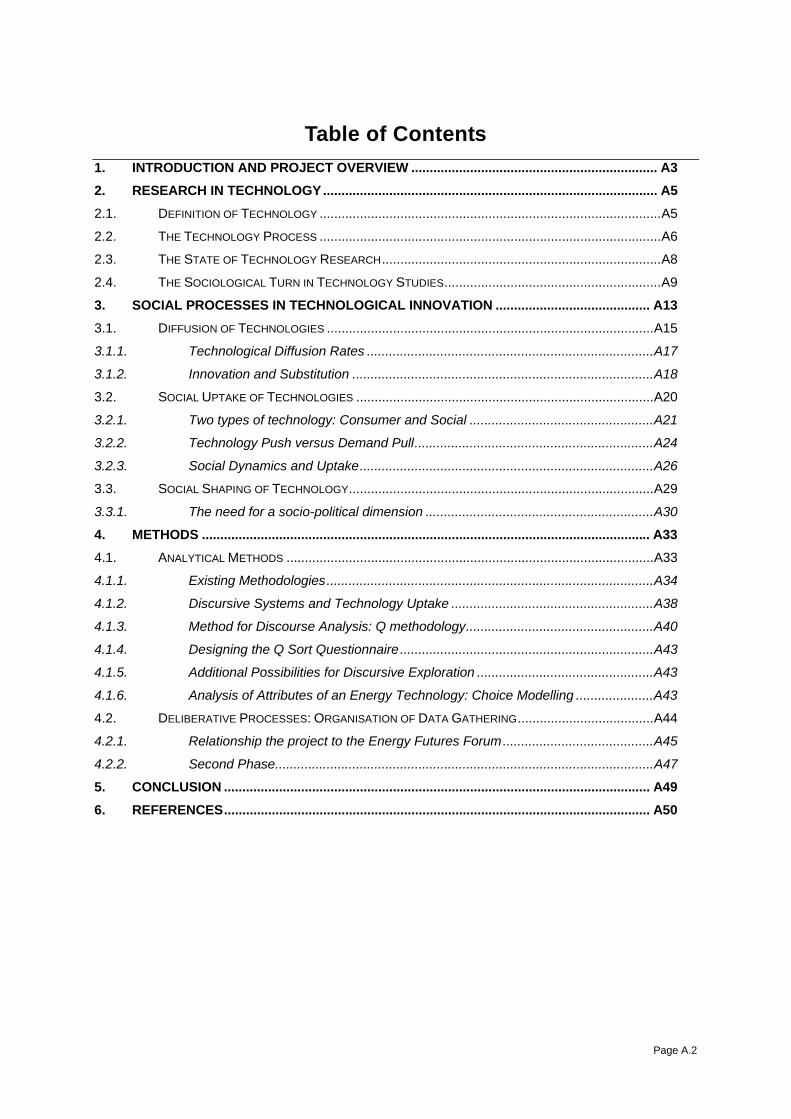
Table of Contents 1. INTRODUCTION AND PROJECT OVERVIEW ................................................................... A3 2. RESEARCH IN TECHNOLOGY........................................................................................... A5 2.1. DEFINITION OF TECHNOLOGY .............................................................................................A5 2.2. THE TECHNOLOGY PROCESS .............................................................................................A6 2.3. THE STATE OF TECHNOLOGY RESEARCH............................................................................A8 2.4. THE SOCIOLOGICAL TURN IN TECHNOLOGY STUDIES...........................................................A9 3. SOCIAL PROCESSES IN TECHNOLOGICAL INNOVATION .......................................... A13 3.1. DIFFUSION OF TECHNOLOGIES .........................................................................................A15 3.1.1. Technological Diffusion Rates ..............................................................................A17 3.1.2. Innovation and Substitution ..................................................................................A18 3.2. SOCIAL UPTAKE OF TECHNOLOGIES .................................................................................A20 3.2.1. Two types of technology: Consumer and Social ..................................................A21 3.2.2. Technology Push versus Demand Pull.................................................................A24 3.2.3. Social Dynamics and Uptake................................................................................A26 3.3. SOCIAL SHAPING OF TECHNOLOGY...................................................................................A29 3.3.1. The need for a socio-political dimension ..............................................................A30 4. METHODS .......................................................................................................................... A33 4.1. ANALYTICAL METHODS ....................................................................................................A33 4.1.1. Existing Methodologies.........................................................................................A34 4.1.2. Discursive Systems and Technology Uptake .......................................................A38 4.1.3. Method for Discourse Analysis: Q methodology...................................................A40 4.1.4. Designing the Q Sort Questionnaire.....................................................................A43 4.1.5. Additional Possibilities for Discursive Exploration ................................................A43 4.1.6. Analysis of Attributes of an Energy Technology: Choice Modelling .....................A43 4.2. DELIBERATIVE PROCESSES: ORGANISATION OF DATA GATHERING.....................................A44 4.2.1. Relationship the project to the Energy Futures Forum.........................................A45 4.2.2. Second Phase.......................................................................................................A47 5. CONCLUSION .................................................................................................................... A49 6. REFERENCES.................................................................................................................... A50
Page A.2

1. Introduction and Project Overview This literature review establishes the theoretical and conceptual underpinning of the
Societal Uptake of Alternative Energy Futures project (or social uptake of
technologies; SUT).1 The overall objective of the project is to investigate factors the
social contexts that will shape different aspects of low [greenhouse] emission
scenarios. These include in particular the role of energy technologies: their uptake
and use as part of a low greenhouse emissions future. An implicit assumption is that
technology will play a significant role in reducing greenhouse gas emissions.
However, as will be seen, the context in which energy technologies are introduced
and uptaken is important. Implementation takes time and the processes involved are
primarily a function of the society that is itself shaped by, as well as a shaper of
technology. The SUT project seeks to understand and apply these processes to the
Australian energy context, as well as gain insight into how they might shape future
energy outcomes. The primary instrument for gaining these insights is to undertake
empirical research via processes of public engagement.
Underpinning the empirical component of the research is the conceptual foundations
of energy technology uptake that this literature seeks to explore. In doing so the
review seeks to establish the framework for analysing responses to energy futures
and the social processes of energy technology uptake — how the public responds to,
shapes, and is shaped by technological developments. The challenge is to use the
insights gained from the review of the literature establish an innovative methodology
for eliciting public attitudes to energy futures.
The methodology that follows from the review seeks to provide a vehicle for gaining
insight into potential public responses to different energy futures. It will draw on a
number of existing approaches in the fields of technology studies, social psychology,
as well as other areas in the social sciences. In section 2, the field of technology
research will be briefly surveyed, with key concepts explored and elaborated. A
framework for organising existing ways of understanding technology uptake from a
1 The project is part of CSIRO’s Energy Transformed Flagship (ETF) and sits under Theme 1 (Energy
Futures) and Stream 3 (Social and Environmental Impacts).
Page A.3

social perspective will be advanced in section 3. The knowledge that is developed
will be used in section 4 to develop a research methodology for understanding the
dynamics of social uptake of technology, with conclusions then drawn in the following
section.
Page A.4

2. Research in Technology
Technology research (or studies) is a reasonably large field, if somewhat incoherent
and lacking consistency in intent, language and method.2 Much of its content tends
to focus on niche areas, such as educational information technologies — and indeed
energy technologies, which is an emerging area, particularly under the auspices of
the Energy Journal. However, overarching theories of technology development,
uptake and use tend to be more limited, with a small number of authors dominating
the field. The result is a somewhat underdeveloped approach, which is often
dominated by the baggage brought from other disciplinary frameworks — economics,
social psychology, among others — between which there is little convergence or
dialogue. In this section, the nature of this field and the concepts that are used is very
briefly explored.
2.1. Definition of Technology
Diversity in technology studies begins with the very definition technology (Fernandes
and Mendes 2003, p.151). These definitions vary in scope as well as focus, from the
broad and sweeping to the narrowly construed. Winner, (1999) for example, refers to
technology somewhat opaquely, defining it as ‘all of modern practical artifice’. By
contrast, particular specific niches in technology studies, such as education, tend to
segregate definitions to refer to particular applications relevant to a particular field.
Neither approach is particularly useful here. A better definition for the purposes of
this research is technology as the application of knowledge to some function
(Fernandes and Mendes 2003). Under this definition, technology can manifest in a
wide array of processes, devices, practices and products (Grübler et al. 1999), which
are usually devised in order to address some definable problem. In case of this
research, the specific problem is reducing the emission of greenhouse gases as part
of the production and consumption of energy.
2 See for example the article by Lynch (2001) and the ensuing debate in the American Sociological
Association Section on Science, Knowledge and Technology Newsletter.
Page A.5

Clearly, the range of possible technologies that can be applied to this reduction of
greenhouse gases is large. They may include the adoption of ‘hardware’ — goods
and materials that embody or produce lower emissions. Under the broad definition,
technologies may also include a wide variety of non-hardware solutions to problems
such as policies3 to influence consumer behaviour that combine knowledge about the
operation of social systems; and the organization of infrastructure, such as transport
networks. All of these various solutions are of interest to this research project
because they involve processes of uptake (and as will be seen, acceptance), which
have a strong social dimension.
2.2. The Technology Process
How do these technologies come to be uptaken? It is generally accepted that
technology does not just ‘happen’, but emerges as a result of a relatively complex set
of processes whereby different technologies are conceived developed and ultimately
adopted as part of social and economic practices. The definition of technology
outlined above implies a number of basic elements to this technology process:
development of knowledge to address some problem, the adoption of this knowledge
and, finally, its ongoing use. These elements are represented in Figure A.1 as a
straightforward linear process as part of a simple technology chain.
Figure A.1. Simple model of technology
This simple model, which will be revised below, can be associated with an approach
to technology research that treats the process of choosing and developing
technologies as relatively unproblematic, where social criteria is primarily concerned
with understanding are acceptability and/or uptake by the public (see Williams and
Edge 1996). According to this simple perspective, the adoption of a technology (the
3 A policy for the purposes here may be defined as ‘a formal rule formulated by some governmental
authority expressing an intention to influence the behaviour of citizens, individually or collectively, by the use of positive or negative sanctions’ (Lowi 1985, p.70).
Page A.6

process whereby a technological is chosen for use)4 is a function of its perceived
usefulness, where technology is developed to meet a pre-existing need.5 In the case
of greenhouse technologies, adoption links the development of technologies, the use
of which is aimed at achieving a desired end — here the reduction of greenhouse
gas emissions.
The assumption that this simple model fully described the technology process would
mean that technology uptake is a matter of understanding potential technological
niches to satisfy latent public demand. However, as this review will reveal, the
approach would have weak predictive power. As a survey by Nadel (1990) shows,
the case of energy saving technologies is a good example of how there is a
considerable lag between development of technologies and adoption that cannot
easily be explained using conventional economic explanations such as transaction
costs. A slightly different version of this problem also applies to examples of
technologies are complex and less visible to final energy users, such as energy
technologies involved in electricity generation and distribution. However, despite this
‘invisibility’, technologies, such as nuclear power, that are large in scale and involve
significant uncertainties and risks that will influence public perceptions about their
acceptability.
The nuclear example demonstrates that there is much more to the uptake of a
technology than its perceived usefulness, although it certainly is a factor. Social and
political factors also come into play. However, systematic research into social uptake
is still possible, but it is necessary to adopt a broad perspective that identifies a
number of relevant factors spanning concepts across the social and technological
sciences. It is an aim of this review to systematically identify these factors and use
them to inform a research methodology to help understand the dynamics of energy
technology uptake. The process begins with a survey of the existing literature.
4 (Carr 1999; Rogers 1995, p.21) 5 A process that is characterised below as ‘demand pull’.
Page A.7

2.3. The State of Technology Research It turns out that the three terms — development, adoption and use — reflect three
dominant streams in the technology literature. Of the three, adoption, which is
greatest interest here, is the far lesser researched area — at least if number of
citations is a reasonable indicator. It also the least consistently used, with differing
meanings depending on context, and is often substituted by a number of other terms
such as technological acceptance, diffusion and uptake. Table A.1 shows the results
of a reference database search of Cambridge Scientific Abstracts6 using
technological development, adoption and use as search keywords in two subject
areas — social science and engineering databases — from the beginning of
available records.
Keywords* Social
Sciences† Engineering‡ Total
Development 1368 >5000 >6000
Adoption 549 109 558
Acceptance 61 387 99
Diffusion 541 171 712
Uptake 7 1 8
1158 281 1377
Use 899 602 1301
* Keywords were use for the following searches: technolog* <<keyword>>; <<keyword>> of technolog*. (Where * denotes a wildcard.) † Social Science databases used include: EconLit, Library and Information Science Abstracts, PsycINFO, Sociological Abstracts. ‡ Engineering databases used include: Civil Engineering Abstracts, Mechanical & Transportation Engineering Abstracts, Mechanical Engineering
Abstracts, NTIS.
Table A.1. Survey of citations related to technology development, uptake and use
Not surprisingly, development of technologies has dominated technology studies,
particularly in the engineering field, the number of citations exceeding the maximum
possible using the database. Use of technology is a far less studied area, although it
appears to be of some interest in both the social and engineering sciences.
Technology adoption, by contrast, is primarily of research interest in the social
science arena. It has a smaller volume of literature than use, although when the
6 http://oh1.csa.com7 Most references in this category were concerned with acceptance by corporations or within firms.
Page A.8

related terms of acceptance, diffusion and uptake are included, the balance changes.
Overall, the results indicate that technological adoption is a relatively small field.
Studies into adoption are not only comparatively limited, relatively little of the
literature involves fundamental or systematic research. What exists is often narrowly
focussed on the development and evaluation of particular models explaining levels of
adoption (and diffusion). These tend to be borrowed from other fields — e.g.
economics, social psychology — and consistent with the simple uptake model
whereby adoption is mainly a function of perceived usefulness. A good example of
this is the Technology Assessment Model (TAM) that is reported below in section
4.1.1 as part of a review of existing methodologies. With the exception Theory of
Perceived Attributes (TPA), which is associated with the technological diffusion
literature, the existing approaches tend to understanding adoption tend to be
atomistic, rather than seeking to understand the underlying social processes.
The predominance of the simple model of technology adoption is not due to its
nascence, being an evolving research area that is still developing in sophistication.
Indeed, it is not particularly new. A survey by Ruttan (1996) argues that, despite a
promising start in the 1950s, technology adoption declined as a field of sociological
research in the 1960s, when the field came to be dominated by economists and
technologists. Thus, technology studies have moved from an integrative perspective
towards an atomistic and utilitarian one. More recently, however, there appears to
have been a trend back toward more integrative approaches.
2.4. The Sociological Turn in Technology Studies Despite the setback in technology studies just identified, the sociological ‘turn’ in
technology research has persisted and, more recently, grown. Much of this
sociological turn adopts a more nuanced model of technology development, adoption
and use than implied by the simple model. Instead of focussing on adoption, the
processes of uptake tend to be couched in terms of technology diffusion (see Table
A.1). The most commonly cited work here is that of Rogers (1995, pp.5–6), who
defines diffusion as a spontaneous or planned process ‘by which an innovation is
Page A.9

communicated through certain channels over time among members of a social
system’.8
This process involves more than a simple matching of means to ends. According to
Brown et al. (2003)9 apart from diffusion of a particular technology into widespread
use, other benefits of diffusion include:
1. Capturing the interest of consumers, businesses and societal institutions, which
lead to further experimentation in the same type of technology and social
arrangements, as well as additional investments.
2. Branching out into a new application or nucleating a new, different experiment.
3. Occurrence of higher order learning within the BSTE-oriented coalition and
beyond it, and the society at large.
On the third point, Brown et al. (2003, p.296) distinguish ‘higher order’ learning’ from
‘lower order learning’ in terms that are evocative of the differences between long and
short-run variables in economics. Lower order learning involves single looped
iterations within fixed policy objectives. An example they cite is improvements in
technological design, pricing and marketing electric vehicle transportation. Higher
order learning involves a ‘double loop’ heuristic involving changes to long run
variables, including the framing of the original problem. An example here is the
experimental use of electric vehicles in La Rouchelle, France; which resulted in
changes in attitudes to, and reconfiguration of, personal transport.
Rather than a discrete one-step ‘agent-client’ event, the process of interaction among
actors during technology diffusion may continue through several cycles of information
exchange (Rogers 1995, p.6). Moreover, it is a particular kind of communication.
8 Although there are competing definitions of diffusion that are more consistent with the simple
adoption model (see Jacobsen 2000) examples include: • Share of production; • Volume of Production; • Market Share; and • Number of producers relative to number of potential producers (Gottinger 1987)
9 Cited Hoogma et al. (2002).
Page A.10

Because the ideas are novel and unfamiliar, they involve uncertainty in relation to
levels of risk, depending on the level of information that is available (more on this
later). The way in which this information is engaged will depend on the nature of the
actors, which in turn is related to a given social system.
The central message here is that when trying to understand the process of
technology uptake, social context (political, information systems etc.) counts on par
with economic imperative. Not only is it transformed by technology; it provides the
very backdrop of technology uptake. To understand the process of uptake there is a
need to understand this broader context (Freudenberg and Pastor 1992, p.39); the
communicative processes between actors and the nature of mutual understanding;
and technology as a function of a number of processes, rather than a series of
stages in the technology chain. The following section is dedicated to the development
of a framework for exploring these processes.
Page A.11


3. Social Processes in Technological Innovation The previous section identified the need to understand the context of technology
development, uptake and use, particularly in relation to the social sphere. While the
need do this is compelling, the resulting picture is complex. Whereas as excessive
abstraction misses important processes, trying to account for too much is also error
prone, since interaction among even just a few basic social variables can produce
unanticipated results (e.g. Baxter et al. 1999). To add to this complexity, the social
sphere is itself is transformed by technology10, so that the dynamics that explain
uptake at time t may no longer explain events at t + 1. To help make sense of this
complexity, it is necessary to develop an approach that incorporates system change.
Rather than simply investigating time t, it is necessary to understand what factors
may precipitate a change between it and t + 1. The resulting approach is partly static
and partly sensitivity analysis, understanding which variables are most prone to
change and, more importantly, why.
To account for this dynamism, rather than the simple model outlined in the previous
section, the technological chain is better characterised as a circular, heuristic one
outlined in Figure A.2. Rather than stages in the technological model, the figure
emphases the processes at play in a system comprising development, adoption
through which information circulates, the outcome of which is the transformation of
the system as a whole.
The system as a whole can be encapsulated by what Grübler (1999) describes as
the innovation process, under which technologies are adopted by users and, ideally,
accepted by those who are subjected to its associated risks. The innovations
process, as opposed to invention, occurs where a technology is adopted (and often
adapted Grübler et al. 1999, p.250) for use — its potential thus becoming realised
even though it may have existed for some time (Rogers 1995, p.11).
10 One of the stronger assertions along these lines is that each new technology brings its own ethos
and demands new forms of relationships (Das and Kolack 1990).(Das and Kolack 1990).
Page A.13

Figure A.2. Technology and Social Processes
Categorisation of the different social processes outlined in Figure A.2 is somewhat
arbitrary, and there is considerable overlap between them. This is particularly the
case for diffusion of technologies and social uptake. Diffusion of technologies as
depicted here occurs between the development and adoption of technologies and
describes generic ‘macro’ processes that apply irrespective of different technology
types and contexts. However, although the figure reflects the kind of abstraction that
has been cautioned against earlier, it does help to gain some traction on the
complexity of the technology system, while permitting a more fine-grained analysis.
For example, the demarcation between diffusion and social uptake of technologies
has been done in part to reflect a distinction that is often made between processes of
diffusion and the act of adoption in ways that resonate with a macro-micro processes
dichotomy. One example is Lee et al. (2003), who contrasts individual consumer
adoption to overall diffusion processes. Further, the definition of diffusion emphasises
the communication process of technological knowledge among members of social
systems, which, as will be shown, focuses on aggregate processes over the life of a
technology.
Page A.14

The processes influencing individual decisions to adopt and use technologies are
described herein in terms of social uptake (as well as acceptance, more of which
later). Thus, diffusion and uptake are different sides of the same coin, but differ as
much in terms of the scale of analysis than location on the technology chain.
Social shaping of technologies, by contrast, is more distinct than the other two
processes. It describes an innovation heuristic in which technologies are shaped by
users as part of both a ‘learning by doing’ process and the incorporation of social
forces into the development process. Social shaping, in short, links users of
technology with the innovation process. As such it completes the feedback loop
shown in Figure A.2.
Each of the three processes of technology diffusion, uptake and social shaping are
discussed in greater detail in the remainder of this section. This will be followed by a
discussion of the implications of these processes for the research design for the
project.
3.1. Diffusion of Technologies For the purposes here, the process of technological diffusion includes the
development and adoption elements of the technology chain outlined in Figure A.1.
The technological diffusion as described here (pace Rogers 1995) operates at the
‘macro’ level and is relatively unproblematic from a sociological point of view. This
includes simple process of matching of means to ends on the part of the adopter for
suitable purposes11 and economic factors, such as investment costs, productivity and
supply (Stoneman 1983) — which are also factors in stimulating development.
The process of technology diffusion as an aggregate of individual adoption decisions
typically follows the pattern described by the three S-shaped curves shown in Figure
A.3. The figure depicts how the level of saturation changes with time. Saturation
occurs where the technology has reached its maximum market share (see Grübler et
al. 1999, esp. p.250).
11 Although it is recognised that this is slightly a narrower interpretation that that adopted by Rogers
(1995), which really describes the process of diffusion of innovations, which incorporates elements of the social uptake processes described below.
Page A.15

Adapted from (Rogers 1995, p.11)
Figure A.3. Stylised Diffusion Process
The early stage of diffusion (Early Adopters) occurs up to approximately 10% of
saturation. It is characterised by relatively slow levels of uptake, usually limited to a
small number of niche applications. The users who comprise the first 2.5% of
saturation are labelled ‘innovators’ (Rogers 1995, p.262), who ‘learn by doing’ or
‘learn by using’ and contribute to improved knowledge resulting in performance and
cost improvements (Grübler et al. 1999, p.250). These innovators often have access
to substantial financial resources. They are venturesome by nature, often
demonstrating a dogged determination to innovate, despite potential setbacks, where
otherwise there is an incentive for individuals and firms to delay the adoption of a
particular technology until it is sufficiently advanced (Doraszelski 2004). Innovators
may operate outside ‘normal’ system boundaries, from where they bring technologies
to the mainstream, thus playing a gate keeping role of ideas (Rogers 1995, p.264).
Early adopters (the next 13.5% of saturation level) tend to be opinion leaders within a
given social system from whom other potential adopters take their cue. They tend to
adopt shortly before the majority of members of the system. By adopting, using and
evaluating a technology, they reduce uncertainty for their peers.
Page A.16

Take-off begins after the early adopters when the remainder of the early majority (the
next 34%) adopt a new technology. These ‘deliberate’ adopters are more cautious
than early adopters, and may hold off for a period before using a new technology.
Although they tend to belong to communication networks, they are not opinion
leaders (Rogers 1995, p.264–5).
The remaining 34% and 16% comprise the late majority and laggards respectively.
Adoption for the late majority may be a matter of economic necessity (such as the
switch to unleaded petrol due to a price differential or absence of supply) or a result
of peer pressure. They tend to be sceptical with respect to new technologies, with a
traditional outlook — although they may possess a pro-innovation outlook. The most
defining feature of laggards is that they are cautious, and need to be assured about
the technology before deploying relatively scarce resources (Rogers 1995, p.265–6).
3.1.1. Technological Diffusion Rates
The S-curve shown in Figure A.3 has become de rigueur in technological diffusion
studies. Less understood is the factors determining the timing of different phases, the
rates at which they occur, and the level of saturation where technology has
maximized its market share (Dieperink et al. 2004, p.774). Figure A.3 shows three
different rates of diffusion, with curve A, B, and C representing progressively slower
rates of adoption. The rate of takeoff can also vary — as depicted by the dark area of
curve B.
Figure A.4 shows just how much diffusion can vary in practice. The graph shows the
distribution of diffusion rates (period to grow from 10% to 90% of saturation) for 265
technologies sampled by Grübler (1990). The mean rate of diffusion of innovations
from the sample is 41 years, and the median approximately 30 years, with 90% of
innovations reaching saturation somewhere between 5 and 100 years.
Page A.17

0
10
20
30
40
50
60
70
0 50 100 150 200 250 300Years
Mean = 41 years
Adapted from Grübler (1990)
Figure A.4. Distribution of diffusion rates12
In terms of understanding the likely rate of diffusion of energy technologies in
Australia, an uncertainty range of 95 years is exceedingly large.13 Although there are
a number of reasonably well-established dynamics of technological innovation and
uptake operating at the macro (economy wide) level, the events from which these
follow are difficult to predict.14
3.1.2. Innovation and Substitution
A good deal of innovation in energy technologies follows a process of substitution,
which involves the replacement of an old technology for a new one. This contrasts
with the development of complementary technologies, such as fuels and motor
vehicles, although a neat distinction between the two is not possible. Both have cost
implications, impacting supply and demand (Grübler et al. 1999, p.258) and cases of
12 Based on sample of examples from literature of energy, transport, manufacturing, agriculture,
consumer durables, communication and military technologies. The sample also includes economic and social processes: literacy, reduction of infant mortality and changes in job classes. Standard deviation is 42 years.
13 This would possibly be lower in the case of energy technologies alone. 14 For example, crises, such as wars or depressions, can have strongly negative impact on diffusion
rates (Hamblin et al. 1979).(Hamblin et al. 1979). There are also a number of well established processes describing innovation within the economic sphere, “Schumpeterian waves” being perhaps the best known (Freeman 1988) and empirically tested (Kleinknecht 1990; Parente 1994). (Kleinknecht 1990; Parente 1994).
Page A.18

substitution also exhibit features that characterise complementary technologies
(Batten 1989).
The classic example of technological substitution is that of cars for horses (Grübler et
al. 1999, p.256 & 258). Switching between fuels is an example of substitution, where
the demand is derived from the application of energy to some end purpose (Sweeney
2001). In addition, the process of substitution often occurs in waves of successive
technologies, as evidenced by Figure A.5, where four different steel production
technologies have vied for market share over a period of 150 years.
Year
0
100
80
60
40
20
1850 1900 1950 2000
Source: Grübler & Nakicenovic (1991).
Figure A.5. Substitution of US steel production technologies
It can be seen from Figure A.5 that the process of substitution similarly follows an ‘S’
shaped path described by technology diffusion, except that here the decline of one
technology is associated with the emergence of another substitute, which is adopted
owing to some competitive advantage. It should be noted that the technology that is
being substituted by a newer one may itself be subjected to a concerted phase of
innovation to remain competitive — a process referred to as the ‘sailing ship Energy
Futures Forumect’ (Grübler et al. 1999, p.259).15
15 After the improvements made to sailing ships transporting goods internationally in the face of
competitive pressures from steam ships in the 1850s resulting in the ‘golden age’ of clipper ships. See also Ward (1967) and Montroll (1978).
Page A.19

A sailing ship Energy Futures Forumect could be relevant to energy technologies,
particularly those that are carbon intensive in the face of pressures to reduce
greenhouse emissions. Innovations such as carbon sequestration are being
developed to reduce greenhouse gas emissions to a level on par less carbon
intensive sources such a renewables. Although the actual process of innovation is
not the focus of this research, the potential impact on uptake is of interest.
Substitution of one technology for another is impacted not least by cost factors, which
are captured by vintage models (e.g. Jacobsen 2000). But there is also a potentially
relevant ‘non-economic’ dimension of relevance here, say where public perceptions
have been formed over the life of the technology and do not change as quickly as the
technology itself.16 These perceptions are impacted by social processes, which are
the subject of discussion below.
3.2. Social Uptake of Technologies Unlike the process of diffusion, the processes that characterise uptake have a less
predictable, sociological flavour. It is this type of process, where attitudes of the
public come into play, with which this research is most concerned. There are a range
of (competing) theories available for explaining uptake that have been applied in
empirical studies — although few have been applied to the individual/consumer level
(Moldovan and Goldenberg 2004, p.426). Below, a number of these theories and
observations are discussed with a view to drawing-out the major factors that will need
to be explored in relation to understanding how technologies for reducing
greenhouse gases will be uptaken at the level of society.
However, before turning to the literature, there are a number of observations
regarding factors that would conceivably affect the nature of the uptake process, but
which are not considered in either the diffusion or uptake literature. One such
observation pertains to the different dynamics that might apply to the process of
uptake depending on whether the decision regarding the technology in question
involves an individual consumer or a wider range of actors, across whom the
benefits, costs and risks are unevenly spread.
16 One negative example could be an enduring image of coal as a ‘dirty’ technology. Alternatively, a
positive effect may occur where there is a nostalgic attachment to the older technology, such as sailing.
Page A.20

3.2.1. Two types of technology: Consumer and Social
There is a large body of literature within economics, sociology and philosophy
arguing that motivations of individuals differ depending on whether they are making
decisions based on the impact to themselves (consumer) or to society at large
(citizen).17 When it comes to collective decisions there is some debate over which of
the citizen (Goodin and Roberts 1975) or the consumer (Downs 1957) more
appropriately describes human behaviour, even when decisions are framed as
psuedo-market choices — such as in the case of contingent valuation (Blamey et al.
1995).18
Consistent with this consumer-citizen dichotomy, it follows that there are two kinds of
technology relevant to the reduction of greenhouse gases — though neither is
mutually exclusive. The first entails consumer technologies, where adoption occurs at
the individual level (be it firm or household). An example of this type of technology is
that of a hybrid car. The consumer makes the decision to adopt, by purchasing the
vehicle and enjoys exclusively the benefits of consumption, as well as incurring the
costs.
This hybrid car appears consistent with many examples in the diffusion literature,
which tend to deal with consumer-type dynamics. However, many technologies that
can be implemented to reduce greenhouse gases emissions involve either
considerable externalities or risks to other members of a social group than the
consumer. Moreover, the decision to adopt a technology that requires a large
infrastructure will tend to lock-in consumers who are not usually privy to the decision
to adopt a particular technology path.
These features define a second type of technology — social technologies. They
involve adoption decisions at a much larger scale, either at the level of the state
17 Most prominent of these in recent environmental philosophy is Sagoff (1988).(1988). Other
examples include: Blamey (1995),(1995), Elster (1986a),(1986a), O'Neill (1995),(1995), Lindenberg (1983), Spash (1999), Brennan (1993), Tetlock (1986), Zetterbaum (1982), Buchanan (1978). The distinction has also been explored in the context of public understanding of science (Michael 1998).
18 And it turns out that trying to use this distinction to account for behaviour in the case of public goods can be empirically problematic (Niemeyer 2002). Nonetheless, it remains a useful and instructive framework, not least because here we are dealing with both consumer and public choices.
Page A.21

(such as large hydro-electric projects) because of the scale of the technology or at
the level of the firm (as a producer, rather than consumer of technologies).
Whichever is the case there is some type of collective decision processes involved
and the possibility of public barriers to acceptance because the risks, perceived or
otherwise, are potentially large.
An example of a social technology is Carbon Capture and Storage (CCS). It is a
large-scale technology involving investment in considerable infrastructure and
significant (at least perceived) risks. Moreover, there is a strong public dimension to
the decision to adopt. Where public surveys regarding Carbon Capture and Storage
have been conducted there is significant potential for public resistance because of
fear regarding perceived risks — which could replace an existing level of indifference
based on unfamiliarity.19
The source of potential resistance is a product of wider social processes, which are
of particular interest to this research. As will be discussed below, the issue of
genetically modified organisms (GMO) is instructive, where the dynamics of uptake
involve a range of issues exogenous to the technology — such as trust in scientific
institutions (Marks 2001; Pueppke 2001). These can lead to dramatically different
outcomes in different contexts, as evidenced by the different adoption rates in the US
and public resistance in Europe (Weick and Walchli 2002, p.271).
In practice, the boundaries between consumer and social technologies are blurred.
There is a good deal of overlap between them in terms of response to technologies
(e.g. Gabriel and Lang 1995). And it is not always clear which process will dominate.
Take for example the case of genetically modified organisms (GMO’s), where
influential resistance to the technology in the European context has been expressed
at both in terms of consumer (Weick and Walchli 2002, p.266) and citizen (Grove-
White et al. 2000).
Consumer technologies often involve considerable externalities, the need for
infrastructure and path dependence. As will be seen below in relation to technological
19 Examples in include Japan (Itaoka et al. 2004), the US (Curry et al. 2004) and The Netherlands (de
Coninck and Huijts 2004; Faaij et al. 2004).
Page A.22

push, the hybrid car example involves considerable research and development
investment that can crowd-out alternative technologies, thus impacting on consumer
choice. It relies on the provision of public infrastructure (roads) when public
investment may otherwise be directed to other transport solutions. In addition, the
use of a hybrid car still produces greenhouse gases, albeit at a reduced rate
compared to conventional vehicles, thus involving a negative externality. On the
other side of the ledger, an individual may choose to adopt a hybrid car on the basis
of non-economic considerations, such as the desire to contribute to public benefit by
reducing greenhouse gases. Alternatively, Carbon Capture and Storage may be
characterised to some extent by consumer dynamics at the point of end-use of net
energy produced by the generation, capture and sequestration process.
In some cases the distinction between consumer and social responses is clear, such
as the study by Gould and Golob (1998) of consumer responses to electric vehicles,
where environmental attitudes did not dominate, and declined over time as a result of
exposure to media and interpersonal communication. By contrast, Farhar and
Buhrmann (1998) found that ‘altruism’ and ‘environmental values’ featured strongly in
participants willingness to participate in a grid-tied photovoltaic system.
Despite the potential for overlap, it is important to distinguish between consumer and
social technologies because each implies a significantly different set of uptake
processes — both of which may contribute to the uptake dynamics of the same
innovation. Determining which is likely to occur requires actual observation of social
processes, rather than top-down inference.
For the purposes here, consumer technologies involve processes of uptake; that is,
the consumer is an active decision agent in the adoption and use of the technology.
In the case of social technologies, the citizen is involved in a process of acceptance;
they are not directly involved in adoption per se, but actors as part of a broader
system. Here the connection between attitudes of individuals to the technology and
the adoption decision may be diffuse, and is generally mediated via existing
institutional or regulatory arrangements.
Page A.23

3.2.2. Technology Push versus Demand Pull
There is another distinction in relation to technological uptake between “technology
push” and “demand pull”. This concerns whether technology users (or rather their
needs) drive to process of technological development or are they simply of follower of
technological leads. The two process of demand-pull and technology push describe
paradigmatically different processes (van den Ende and Dolfsma 2002). This review
cannot hope to cover all the territory raised by this question, but its exploration
reveals some important insights relevant to technology uptake.
Basic argument of demand pull, or what Winner (1999) refers to as the ‘social
determination of technology’, follows a primarily economic account of uptake in which
the consumer is sovereign. Under this system technologies are advanced and goods
produced in response to the demands of the consumer, which are a product of
prevailing social conditions. The principal determinants are utility (the extent to which
consumers find the product useful) and price. Moreover, in basic economic theory
tastes are assumed to be fixed, so different rates of diffusion are primarily explained
by price.20 Under this simple model, in the case of greenhouse technologies,
consumers will tend to adopt to the extent that they save money (e.g. though lower
fuel costs) and/or the costs of a technology are decreased. Thus, under demand-pull
the technology development process is driven by the demand for greater fuel Energy
Futures Forumiciency and lower cost.
There is no doubt that demand pull defines the uptake process of technology uptake
to a large extent (e.g. Tidd et al. 2001, p.164), as well as the adoption of energy
technologies (Jacobsen 2000). However, it is only part of the uptake story. The
demand-pull explanation cannot explain why technologies often take considerable
time to be accepted as mainstream (see section 3.1.1 below). Bottlenecks in the
uptake process are not simply caused by transaction costs or information flow, as will
be discussed below. There is an array of processes involved in the decision to adopt
a technology not captured by standard economics. These need to be explored as
20 Although the overall (opportunity) cost of a technology involves more that price of that technology.
For example, the cost of adopting an energy saving device is a function not just of the purchase price, but also the relative savings in terms of energy use.
Page A.24

part of any exercise in understanding uptake that operates at both the individual and
institutional levels.
Most dramatic of the non-standard economic processes occurs where technologies
are ‘pushed’ into service. In economics, Galbraith (1979) has described ‘the revised
sequence’, which supplants consumer sovereignty with producer sovereignty. This
occurs where large firms who invest significant resources into product development.
Firms minimise risk to investment by inducing demand, usually via advertising.21 The
important point here is that it is at least notionally possible to create demand for a
technology (technology push) rather than simply anticipate uptake based on a pre-
disposition, or demand that has become technology-enabled.
A related theory, advanced in evolutionary economics, is that ‘technological
paradigms’ determine the range of technologies via a combination of physical and
institutional factors, within which consumer demand is constrained.22 Combined with
the problem of technological path-dependency (the role of history determining
technological development) these processes result in lock-in to a particular
technological trajectory.23
With respect to both consumer and social technologies, technological push is less
likely to be successful where the associated risks are readily understood — such as
in the case of visual impacts of wind turbines (Baxter et al. 1999). For these social
technologies, public dissent may be readily forthcoming, precluding acceptance.
However, technological choices that are dominated by scientific complexity may
result in uncritical public acquiescence (Mehta 1998, p.88) where ‘technification’ of
technological/scientific issues is used as means of mollifying the public in order to
maintain control (e.g. Todt 1999).
However, complexity is not automatically a route to public acceptance. Hypercritical
and misplaced public responses in which the risks are socially amplified are also
21 Indeed, technological push — or ‘engineering theories of innovation’ — precedes demand pull as a
theory of technological innovation. (Landry et al. 2000) 22 For a review, see van den Ende and Dolfsma (2002) 23 See Arthur (1989), David (1985), Mulder (2001), Schot (2001), Ruttan (1996) and Binswanger
(1978),.
Page A.25

possible (e.g. Petts and Niemeyer 2004).24 Moreover, in relation to consumer
technologies, while complexity will tend not to forestall innovation by innovators and
early adopters (see Figure A.3), others may be more influenced by negative
messages that are communicated to them by word of mouth (e.g. Brezet 1994), the
reverse also being the case for positive messages (Ornetzeder 2001).
3.2.3. Social Dynamics and Uptake
Having established some of the different dynamics that characterise the process of
technological uptake, attention is turned to frameworks that help to understand how
this process may unfold. The first of these is the information deficit model.
a) The information deficit model
Until recently, the standard response to influencing public perceptions (and facilitate
acceptance) was to provide information. This is now widely viewed among scholars
as an inEnergy Futures Forumective method for achieving technology acceptance
(e.g. Grove-White et al. 2000) and may even lead to a hardening of pre-existing
negative attitudes (Scholderer and Frewer 2003). The strategy is based on the
information deficit model, with (according to Grove-White et al. 2000) a grounding in
the political science conception of naïve individualism (Marquand 1988). The model
assumes that public is selfish and ignorant of complex scientific issues and/or
unwilling to develop sufficient understanding and appreciation of issue complexities
has increasingly come under critical scrutiny from social psychology (Gardner and
Stern 2002) and environmental sociology (e.g. Bulkeley 2000).
The information deficit model contradicts the social construction of knowledge, where
members of the public to relate issues, particularly ones involving a significant
degree of risk and complexity to their own personal experiences (Levasseur and
Carlin 2001). Moreover, knowledge, in addition to the formation of attitudes and
values are a product of social relationships (Grove-White et al. 2000, p.33). One
important dimension in these relationships is that of trust.
24 As many advocates of genetic modification technology assert. See for example Nelson (2001)
Page A.26

b) Trust
An implication of reliance on the information deficit model has been increasing
scepticism about technologies that have been ‘shoved down throats’ or which the
public has been encouraged to accept unquestionably. The problem is related to
what Grove-White et al. (2000, p.34) refer to as the professionalisation of
communication and information management in order to elicit a desired outcome —
which in the case of GMO may have actually hindered acceptance of the technology
because of decreasing trust in the messenger (Scholderer and Frewer 2003).
Trust is increasingly becoming cited as an important factor influencing acceptance
and/or uptake; be it the form of trust in the scientific community (e.g. Ungar 2000); in
industry producing or implementing the technology (Kemp 1990); the risk managers
or regulators (Marks 2001); or in the decision process (Baxter et al. 1999).
From an institutional economics perspective, trust is what makes everyday
transactions in society possible (Hardin 1992). Without it even the most basic
functions of social systems become problematic (Gates 1999). When it is present,
trust can serve to reduce the perceived complexity of an issue (Barber 1984). It also
reduces the cognitive load required to facilitate uptake. Alternatively, its absence
renders the uptake/acceptance process more vulnerable to manipulation (Mehta
1998). In either case, trust is an important dimension, particularly with respect
acceptance of social technologies, where the potential risks are perceived to be
significant as well as for consumer technologies, particularly with respect to potential
laggards (see section 3.1).
c) Elaboration likelihood model
Contrary to the information deficit model, studies have shown that, when there is
sufficient impetus, the lay public is commonly able to grasp and assimilate very
complex information (Irwin 1995). In many cases, the difference is a function context
and presence of sufficient impetus to engage in the cognition process (Goodin and
Niemeyer 2003).
One useful framework for understanding the processes whereby an individual is likely
to thoroughly evaluate the consequences of a technology is the elaboration likelihood
Page A.27

model (ELM). ELM is an attitude change model referring to the cognitive Energy
Futures Forumort applied to an issue — attitudes referring generally to evaluations
about a target object (Fazio 1995). The central tenet of ELM is that the strength of an
individual’s attitude toward a target is positively associated with the amount of issue
relevant thinking that has been done with respect to it (Petty 1995).
The continuum in the level of Energy Futures Forumort that can be applied, ranges
from ‘cognitive misers’, who engage in peripheral information processing (Fazio
1995), to the expenditure of considerable cognitive Energy Futures Forumort as part
of central information processing. The level of Energy Futures Forumort applied to
evaluation is determined by two sets of factors: motivational and situational (Petty
1995).
The more motivated an individual, the more likely they are to engage in evaluation.
There are two factors affecting levels of motivation: individual or situational. Some
individuals are simply more motivated to expend more cognitive Energy Futures
Forumort than others (Cacioppo and Petty 1982). And, in terms of situational factors,
the personal relevance of a situation will have an impact (Johnson and Eagly 1989).
The greater the personal impact, the more evaluation that will occur (Petty and
Cacioppo 1979).
Situational factors include the ability to engage in evaluation, which is itself a function
of the cognitive abilities of an individual and level of knowledge about the issue.
(Wood et al. 1985) and level of distraction (Festinger and Maccoby 1964).
d) Demonstration Energy Futures Forumect and Habituation
Of course, both trust and information processing require time, and the greater the
period over which society is exposed to a technology, the more likely that evaluation
will have occurred and trust established — at least where risks are not realised.
Thus, the very presence of a technology will have significant impact on its uptake and
acceptance. This is implicitly recognised in Rogers’ (1995) description of the diffusion
of innovations in section 3.1 during the take-off stage of technologies where
‘deliberate’ adopters hold off until the worth of the technology is demonstrated.
According to Gottinger (1987), this ‘demonstration Energy Futures Forumect’ —
Page A.28

which is defined as the number of producers adopting a technology compared to
saturation level — is the most important factor determining rate of uptake.25
A similar Energy Futures Forumect — labelled the habituation hypothesis — has
been observed in relation to social technologies, particularly in relation to wind farms.
Although initial resistance may often be strong, once a facility has been constructed,
public concern declines (Gipe 1995), although recent empirical evidence brings this
into question.
The phenomenon of demonstration Energy Futures Forumect and the habituation
hypothesis once again raise the tension between technological push and demand
pull. The observation that resistance to technology wanes over time raises a
normative question with respect to the appropriate role for social input into
technological decision making — particularly in relation to social technologies. If
there is potential for an individual to acquiesce in the face of technological progress,
should decisions be made on the basis of existing or future attitudes? As will be
discussed below, this has important implications for the role, design and analysis of
public dialogue with respect to technologies.
3.3. Social Shaping of Technology One impact of democratizing technology is to make explicit the processes that are
implicitly represented in Figure A.2, where social processes are not only shaped by,
but also shape technology. For example, Bijker (1997) stresses from a social-
constructivist view that technology is continually reshaped and redesigned by various
social groups during its diffusion. Users of innovations are no longer only adopters
but are actively shaping the technology they adopt. This perspective is also
supported by insights into the technological development process and uptake using
actor network theory (Ornetzeder 2001, p.105). One resulting perspective is that of
social shaping of technology.
25 Jacobsen (2000) notes that Gottinger examines technology diffusion using mainly new final
products. Although the model is likely to be relevant for new energy technologies there also some differences.
Page A.29

The social shaping of technology (SST)26 position adopts a broad perspective in
understanding how technological development is shaped by a range of social and
economic factors in conjunction with technical ones. Borrowing heavily from recent
developments in social science that expose weaknesses in the unproblematic linear
perspective in technology development, the SST position seeks explain how
technology is actually shaped in practice and the myriad of elements that contribute
to this process.
3.3.1. The need for a socio-political dimension
As well as an empirical need to account for technology uptake and shaping, there is
also a normative argument for including social shaping of technologies as part of a
social and political system. Technology is not value-free. It is both an artefact of
social processes as well as an influence of these processes: technology has politics
(Winner 1999) just as politics has technologies (Joerges 1999).
Depending on technology type, many individuals have a low sense of agency in the
face of technological development (Grove-White et al. 2000, p.22). While diffusion
theories of technologies focus almost entirely on the potential adopters as agents
(Ornetzeder 2001, p.105) a thoroughgoing theory of technology uptake should
include both processes of politics (Grove-White et al. 2000) and policy (Dieperink et
al. 2004). Similarly, Renn (2001) argues that risks need to be seen in their social and
political context, rather then merely in terms of the potential impact on human health
and the environment.
Whether technological outcomes are a product of technology push or social
amplification of risk, concern about loss of democratic control in the face of scientific
complexity is a recurring theme in both science and technology studies and
democratic theory.27 Mehta (1998) goes so far as to assert that we are at the ‘cross
roads of democracy’ in which technologies that involve greatest risks are increasingly
beyond the comprehension of the lay public — a theme that is also picked up in Beck
(1994) under the rubric of the risk society.
26 After Williams (1996). 27 Examples in science and technology studies include Plough (1987), Mehta (1998) and Turner
(2001). Examples in political science include Jasanoff (1990), Brickman et al. (1985), Habermas (1971) and Marcuse (1941).
Page A.30

In view of these challenges, Frodeman (2000) calls for a reinvigoration of politics and
the public sphere beyond the domain of ‘electioneering and special interest’. In some
constituencies, there are already well established attempts to democratize science
and technology policy, particularly in Europe (e.g. Roth and Küppers 2002) —
although these Energy Futures Forumorts wax and wane depending on the political
fortunes of the time.28
Although it is not the explicit role of this research to democratize technology, of
interest is the potential impact of democratization on the process of technology
uptake, or more appropriately, technology acceptance. Adopting methods for public
input into technological development/uptake can also provide a window into the
processes described above, such as habituation and amplification of risk. Ways in
which this can be done will be assessed below as part of developing an
understanding of the social processes that contribute to both changes to institutional
factors influencing technology uptake/acceptance (such as trust) as well as individual
factors (such as information processing). The next section develops a methodology
by which this might be achieved.
28 Such as in the case of Technology Assessments in Denmark, which have fallen from favour
following a change in the political climate with the election of a new government (Hansen and Clausen 2003).
Page A.31


4. Methods The preceding literature review has identified a large array of inter-related factors
involved in technology uptake by society. It has identified two main types of
technology (consumer and social) that entail different processes of uptake and
acceptance. There are also two processes of technology push and demand pull
driving the uptake process. An important component in the uptake process depends
on the extent to which individuals engage with in understanding the technology,
which is more a function of social processes than straightforward information
acquisition. Predisposition toward a given technology is dependent on levels of trust
in the technology, which may be facilitated by trust in institutions (scientific, industrial
and political) involved in the technology process. Trust may also evolve over time,
through demonstration of the worth of a technology or habituation gradually
dissipating resistance.
The relationship between society and technology is not neatly analogous to that of
consumer and producer, particularly where technologies involve uncertainties and
risk. There is element of path dependence where decisions made result in a degree
to technological ‘lock in’ (page 25). Although society may acquiesce in their
resistance to change, there is a normative question regarding the role of public input
into technology choices, which will have implications for the chosen methodology,
analysis and interpretation.
This section will seek to explore potential methodologies for exploring public attitudes
toward Australia’s energy future.
4.1. Analytical Methods This section begins with a brief review of two existing methodologies for analysing
the potential for uptake and acceptance of energy technologies. Although potentially
useful, both fall short of meeting the requirements of this particular exercise. Instead,
both approaches are adapted into two slightly different methodologies depending on
whether social or commercial technologies are being explored. Underpinning the
approach is the adoption of a method that is consistent with the ‘discursive turn’ in
cognitive psychology for exploring attitudes as potential states that may be activated
or dissipated as the process of technological uptake/acceptance proceeds. It will be
Page A.33
suggested that this be done in conjunction with a preference ranking exercise to
understand which underlying positions are consistent with different outcomes, as well
as linking the method to a discursive forum with pre- and post-testing to explore the
processes by which positions are transformed by time, policies or social forces.
Potential ways in which this assessment process could be linked the Energy Futures
Forum and associated modelling of energy futures scenarios will be explored.
4.1.1. Existing Methodologies
Two existing methods used for modelling technology uptake include the theory of
perceived attitudes (TPA) and the technology acceptance model (TAM). The former,
developed by Rogers (1995) has been developed from within diffusion of technology
studies. The second has emerged from within social psychology.
a) Theory of Perceived Attributes
The Theory of Perceived Attributes (TPA) (Rogers 1995, pp.204–251) uses five
assessment criteria used by potential adopters of a technology to explain the rate of
diffusion. According to the theory a technology will be up taken at a greater rate if it is
perceived that the innovation 1) has an advantage relative to other innovations (or
the status quo); 2) Is compatible with existing practices and values. 3) Is not overly
complex; 4) Can be tried on a limited basis before adoption; 5) and offers observable
results (Surry 1997) (see Table A.2).
Page A.34

Factor Description Relative social and
economic advantage
The level superiority of the technology compared to its predecessor. For
example:
• Economic profitability
• Social prestige
Compatibility with existing
values
The level consistency of the technology with existing values and past
experiences and the needs of adopters. These include:
• Sociocultural values and beliefs
• Previously introduced ideas
• Client needs for innovation
Complexity The extent to which the technology is perceived as easy to use and understand.
Trialability The extent to which the technology can be experimented with before adoption.
Observability The degree of visibility of the results of the technology and the extent to which
these are perceived as positive.
Table A.2. Assessment criteria used in the theory of perceived attributes
The advantage of TPA is that is renders possible empirical investigations of
characteristics of technologies that give rise to uptake. This has been done in a
number of studies, either using standardised surveys with questions falling into one
of the standard categories (Moore and Benbasat 1991) or be categorising ex post
statements made during interviews in relation to the technology (Farhar and
Buhrmann 1998). However, a significant problem with this approach is that is easier
to apply to postdiction than prediction of uptake, since the independent variable
(adoption) is a function of dependent variables (attributes) that were formed in the
past (Rogers 1995, pp.210–211).
b) Technology Acceptance Model
The same problem of postdiction applies to the technology acceptance model (TAM).
The model is an analytical framework designed to explore empirically factors that
lead to the uptake of information technology in the workplace (Davis 1989; Davis et
al. 1989) (Venkatesh and Davis 2000). The approach borrows heavily from the theory
of reasoned action (Ajzen and Fishbein 1980), which is illustrated in Figure A.6. The
theory is based on the assumption that behaviour (which is closely related to
behavioural intention) is a deliberate act whereby function of beliefs about an attitude
object and norms with respect to it. When an individual is positively predisposed
toward a particular behaviour, this translates into correlation with behavioural
Page A.35

intention. The same holds for subjective norms — or what individuals think that
others to expect them to do.
Adapted from (Fishbein and Azen 1975)
Figure A.6 Reasoned Action Model
The technology acceptance model adapts the TRA, but dispenses with motivational
norms, which have been found to have mixed impact on intention to use particular
technologies (Davis 1989). Instead, the model is based on the supposition that two
main beliefs are most prominent influencing attitudes towards using a technology:
perceived usefulness and perceived ease of use (Figure A.7). Perceived usefulness
relates to the subjective probability assigned to the functionality of the technology.
Perceived ease of use follows from the expectation about the level of Energy Futures
Forumort needed to master the technology. These perceptions are influenced by
“external variables”, such as system design characteristics, user characteristics
(including cognitive style and other personality variables), task characteristics, nature
of the development or implementation process, political influences, organizational
structure (Davis et al. 1989, p.984).
.
(Davis et al. 1989)
Figure A.7. Technology Acceptance Model
Studies using TAM have proven reasonably Energy Futures Forumicacious in
explaining uptake of technologies (Liu and Ma 2004), and applicable in a number of
Page A.36

different cultural domains (Al-Gahtani 2001). It is also amenable to fine-tuning, with
the addition and modification of input variables (Venkatesh and Davis 2000).
However, its applications has been limited to a particular type of technology
(information technology), and usually within the commercial domain, where the
dynamics of uptake are more likely to be characterised by that of diffusion (see
section 3.1) than uptake — and even less the case for acceptance.
a) Other Limitations of Existing Methods and Potential Solutions
Another problem with both the above methods is also associated with their ex post
nature. Both are based on the assumption that there is a link between perceptions
(attitudes, beliefs) and behaviour. Rogers (1995) cites an old dictum to justify his
approach: ‘If [people] perceive situations as real, then they are real in their
consequences’ (Thomas and Znaniecki 1927, p.81).
The link between perception and consequences is consistent with recent trends in
the sociology and the social construction of knowledge (see page 26). However, as a
concept for understanding and predicting behaviour it is out of date. For example,
within environmental sociology it is well established that there exists an attitude-
behaviour gap between the expression of attitudes and beliefs (which are almost
universally pro-environmental at some level) and behaviour (e.g. Hobson 2001).29
The problem with surveying perceptions regarding technologies as the basis for
understanding social uptake/acceptance is that perceptions change. So too does the
underlying knowledge from which these perceptions are derived, being a product of
ever evolving social processes. Adopting a modelling approach based on one or both
of the preceding methodologies assumes a prerequisite understanding of the main
drivers underlying perceptions when they are constantly evolving over the life of the
technology (see section 1.1.1.d)).
Another problem with these approaches is that, while the underlying belief systems
within particular social systems may be relatively stable, the motivational states that
are adducted during a particular decision moment are not. Each individual may
entertain a different set of motivational states, a particular one coming to the fore
29 See also (Endo and I974 1974).
Page A.37

depending on situation and context. The basic idea is captured by the consumer-
citizen schism discussed on page 21 where an individual may be motivated be one or
other position, with different outcomes (Sagoff 1988). Consistent with this, the idea of
the ‘multiple self’ is an emerging concept in social and political psychology (e.g.
Elster 1986b) in which different behavioural outcomes are situational and
probabilistic rather than predefined and deterministic, as assumed by many methods
associated with opinion polling. Moreover, mechanisms whereby individuals behave
according to one or another behavioural mode have been developed — such as
Schwartz’s ‘norm activation’ (1981). The challenge is to develop a methodology that
captures these processes.
These dynamics, it is anticipated, are more likely to manifest in relation to social
technologies, with a ‘technology attributes’ approach more valid for consumer
technologies — although of course many still embody a social dimension. The way in
which these differences are dealt with will depend on the nature of the case studies
chosen — whether they are energy scenario or technology based (see discussion
below). Arguably, either kind of study should involve an analysis of discourse,
combined with an assessment of technology or scenario preference. Where a
consumer technology is being investigated, some attribute measurement approach
should be used in conjunction with preference (such as choice modelling) — which
could also be combined with analysis of discourse. These analyses should be
conducted along a longitudinal scale, where observations are made before and after
a discursive process during which participants become familiar with the object
(technology or energy scenario) of interest. Elaboration and justification of these
methods will be detailed below.
4.1.2. Discursive Systems and Technology Uptake
The ‘discursive turn’ in cognitive psychology (Harré and Gillett 1994) offers a
promising alternative to standard psychometric methods for assessing potential
responses to energy technologies. It operationalises in an analytical sense the
normative ideals that underpin the use of discursive research designs — such as
Habermas’ theory of communicative rationality (1984) — that has been used in used
within CSIRO, particularly in the natural resource management field (e.g. Bellamy et
al. 2004). Moreover, rather than analyzing uptake/acceptance of technologies ex
Page A.38

post, a discursive approach is phenomenological, permitting ‘real time’ assessment
and producing contextually sensitive information (Guston and Sarewitz 2002).
Under this discursive framework there emerge ‘social regularities’, or sharing of
symbols that influence behavior (Bandura 1989) as part of the dynamics of social
systems as discourses.30 The basic idea is something similar to Rockeach’s (1973,
p.11) conception of a ‘value system’, but takes the form of a relatively stable
subjective state (or states) that crystallize from a constellation of beliefs and values
that are relevant to the technology uptake/acceptance process. That these
discourses embody both values and beliefs contrasts strongly to the reasoned action
approach of Fishbein and Ajzen (1975), as described in Figure A.6, because here
they cannot be artificially separated in the cognitive process.31
The relationship between these discourses and attitudes toward a particular energy
technology (or energy scenario) is depicted in Figure A.8. The figure shows a series
of discourses that emerge from the discursive system from the constellation of
arguments, assertions and understandings that may potentially influence the
formation of predisposition at a particular time. Because an individual may subscribe
to more than one discourse, the actual attitude that measured may change with time,
context or following some other process. One example here is the switch between
cognitive and peripheral processing (as discussed on page 27) whereby one
particular discourse is associated with lower level of cognition than the other.
30 Cited in Rizzello and Turvani (2002). 31 For example Elster (1983, p.19) recognises that motivations will influence that way that an
individual deals information at hand — which is captured by the phrase ‘an individual will believe what they want to’. Conversely, the information that is held will also influence the motivations that come into play (Palfrey and Poole 1987).
Page A.39

Figure A.8. Relationship between discourses and attitude
This approach to understanding attitudes toward energy technologies implies three
main components as part of methodology. First, it is necessary to elucidate the
relevant discourses that impact these attitudes — or preferences for particular
technology outcomes. Second, it is necessary to survey these preferences. Finally, a
method is needed for linking discourses to preferences, so that it is possible to
understand potential social responses to different energy futures and the processes
whereby these responses are evoked. The approach that is suggested here involved
combining analysis of discourse and preference using Q methodology.
4.1.3. Method for Discourse Analysis: Q methodology
One method for elucidating discourses that influence behavior is Q methodology
(Brown 1980, pp.3–4), which has been demonstrated as a powerful tool for analysis
of behavior (Stephenson 1953). Q methodology also had the advantages of avoiding
many of the problems of standard survey methodology (Brown 1980; Dryzek 1990),32
enabling an exploration of subjectivity that maintains robustness and external validity,
32 Basher (2001) points out, there are many potential problems to face when undertaking or using
surveys, such as issues of sampling, communication, surveyor bias and influence, and halo effects. Many of these problems are associated with a particular form of opinion surveying, which often log responses along a Likert scale using sample sizes intended to be statistically representative — a particularly pressing problem for a small study such as this one.
Page A.40

particularly with small participant samples.33 It is also one of the few methodologies
(particularly among those that are quantitative in nature) that is consistent with
discourse theory (Blaug 1997).
Q methodology can be used as a form of discourse analysis; to both identify the
predominant discourses (in the form of factors) in relation to climate change, as well
as the extent to which particular discourses influenced subjectivity under different
climate change scenarios.
The statements used in Q studies are almost always drawn from actual dialogue or
interviews, such as the issues distilled in the early interview stages of the Energy
Futures Forum. From the discourse, a series of statements (or ‘concourse’ to use the
term applied by Q-methodologists) associated with a particular issue are selected.
These are then organised thematically into groups from which statements are
randomly drawn to form the set of statements for the study.34
33 Small sample sizes are feasible using Q method because the discovery of factors can be done
more effectively among a small group. Once the sample size reaches a particular threshold the ‘marginal benefit’, or probability of finding a new subjective type decreases dramatically. Additional subjects produce little new information. The ‘representativeness’ of Q studies using small numbers of individuals can be explained by invoking an ecology analogue. When ecologists survey a particular area to identify resident species, rather than investigate the entire area only a small number of select sites are selected. The reason for this is that the probability of finding a new species decreases exponentially with each subsequent sample. Q methodology intensively samples small numbers of individuals with a comparatively large number of statements (Brown 1993). The most important condition is that each sample is intensively explored so that nothing is missed. Thus, sample size is secondary to the choice of statements to ensure a good representation of all aspects of subjectivity from which factors are extracted.
34 According to Brown (1980, p.186) the process selecting statements for a Q sort is more an ‘art’ than a science — although this probably understates the systematic nature of the task. Nonetheless, it does involve negotiating the potentially immense complexity of the concourse under study, but there are useful principles that guide the process. The main guiding principle for statement selection concerns the systematic selection of a representative sample of statements based on Fishers’ (1960 pp.17-21) principle of randomisation. To this end, Q methodologists tend to use block or ‘factorial’ designs (Brown 1970). In short, the approach involves establishing the major categories relevant to the phenomenon being surveyed and allocating statements among them. The statements can be devised a number of ways. What is most important is that they grounded in the actual discourse pertaining to the subject at hand (Brown 1993, p.95). Statements for this study were organised according to whether they pertained to attitudes toward the operation of existing institutions (social, political and economic) in relation to climate as well as more general attitudes toward climate and climate change. Subsidiary dimensions for selection included whether statements related to personal responsibility, trust and salience.
Page A.41
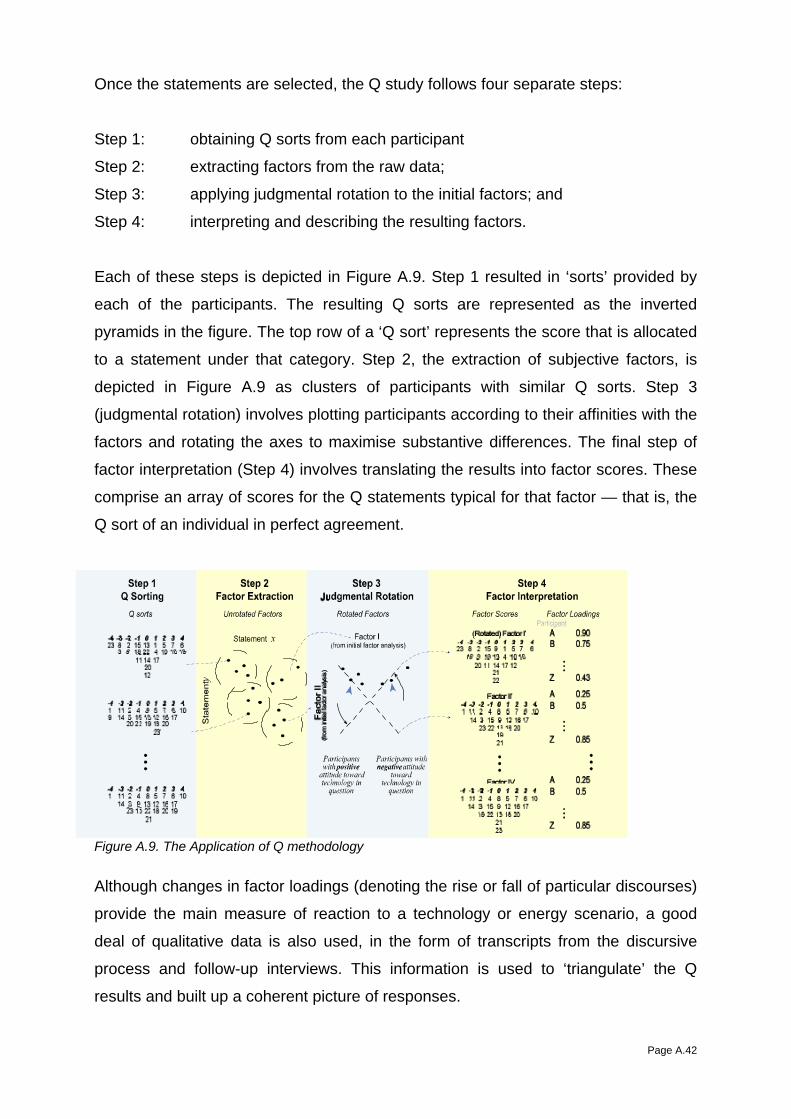
Once the statements are selected, the Q study follows four separate steps:
Step 1: obtaining Q sorts from each participant
Step 2: extracting factors from the raw data;
Step 3: applying judgmental rotation to the initial factors; and
Step 4: interpreting and describing the resulting factors.
Each of these steps is depicted in Figure A.9. Step 1 resulted in ‘sorts’ provided by
each of the participants. The resulting Q sorts are represented as the inverted
pyramids in the figure. The top row of a ‘Q sort’ represents the score that is allocated
to a statement under that category. Step 2, the extraction of subjective factors, is
depicted in Figure A.9 as clusters of participants with similar Q sorts. Step 3
(judgmental rotation) involves plotting participants according to their affinities with the
factors and rotating the axes to maximise substantive differences. The final step of
factor interpretation (Step 4) involves translating the results into factor scores. These
comprise an array of scores for the Q statements typical for that factor — that is, the
Q sort of an individual in perfect agreement.
Figure A.9. The Application of Q methodology
Although changes in factor loadings (denoting the rise or fall of particular discourses)
provide the main measure of reaction to a technology or energy scenario, a good
deal of qualitative data is also used, in the form of transcripts from the discursive
process and follow-up interviews. This information is used to ‘triangulate’ the Q
results and built up a coherent picture of responses.
Page A.42

4.1.4. Designing the Q Sort Questionnaire
This review has revealed a number of elements that may potential impact on the
dynamics of social uptake/acceptance of technologies. These include the nature of
the individual adopter –whether they are an innovator, early adopter etc. — and their
engagement with the issues surrounding a technology, level of trust in institutions,
and so on. Problems associated with predefining models about how these elements
interact have already been highlighted. An advantage of using Q methodology is that
the method permits exploration of ways in which these elements may coalesce in the
form of factors, from which more detailed analysis can then be designed. It is
important, however, that these elements be included in the survey instrument from
which the analysis is drawn. This is achieved by ensuring that the selection of
statements for the Q sort covers the range of possible influences on the technology
uptake and acceptance processes.
4.1.5. Additional Possibilities for Discursive Exploration
One interesting complement to analysis of lay participants with respect to responses
to energy technologies using Q method is to conduct the same exercise among
members of the energy futures forum. Examining discourses among both lay
communities (ie. participants) and ‘experts’ in this way would permit an exploration of
potential dissonance that may impact levels of trust in experts (Turner 2001), and
thus the likelihood that the public will accept a technology for which there are
associated perceptions of significant risk.
4.1.6. Analysis of Attributes of an Energy Technology: Choice Modelling
A complementary method to the use of discourse analysis that could be used for
analysis of energy futures is choice modelling (e.g. Bennett and Blamey 2001). In
short, the method involves decomposing preferences for a product (or potentially,
scenario) based on a number of varying attributes. The approach is used in cases
where normal regression models are inEnergy Futures Forumective. As for Q
method, it is possible to use choice modelling with relatively small sample sizes, so
long as the number of option sets is sufficiently large. The output of choice modelling
is in the form of relative utility attached to different attributes (usually in the form of
monetary values).
Page A.43

There are a number of possibilities for the application of choice modelling for the SUT
project. The simplest approach would be to select a consumer technology (such as a
hybrid vehicle) and model attributes — which would ideally be chosen for consistency
with the theory of perceived attributes and/or the technology acceptance model
(Section 4.1.1). This analysis could then be linked with ‘technological learning’
models (Grübler et al. 1999) to assess levels of uptake as different combinations of
attributes become possible and prices change.
Another approach is to model choices between different energy scenarios that will be
produced by the Energy Futures Forum process (with the same choice data being
used to extract the Q factors). The output of this type of analysis could be in the form
of willingness to individuals to forgo wealth with a given change in attribute between
energy scenarios (such as reduction in greenhouse emissions). One advantage of
this approach would be to permit iteration in the development of scenarios by the
Energy Futures Forum in light of public responses and/or consumer behaviour.
It may also be useful to combine the choice modelling exercise with a longitudinal
study along the lines what is proposed above in relation to Q methodology, where the
survey is administered pre- and post-deliberatively. This approach has already been
trailed, with some success (James and Blamey forthcoming; James and Blamey
2000). If used in conjunction with Q method it would be possible to build a more
complete picture of how public preferences for different energy futures might evolve
over time, or following some event such as change in government policy sudden
climate change that impacts on public perceptions.35
4.2. Deliberative Processes: Organisation of Data Gathering Attention is now turned to the method for gathering data for analysis. The SUT
project will adopt an analytic-deliberative approach and will be linked to the Energy
Futures Forum through the use and refinement of energy scenarios. The main
vehicle for collecting empirical data for the research will be public deliberation.
Initially, this will involve an intensive and exploratory process, with the aim of gaining
broad insights about the plausibility of given scenarios. This could establish an initial
35 As has already been done using Q methodology by Niemeyer et al (2004) in relation to rapid
climate change in the UK.
Page A.44

linking between the SUT project and the Energy Futures Forum deliberations.
Subsequently, a process could be designed to identify the factors affecting
technology uptake based on the insights gained from the first process. The data will
be analysed using both quantitative and qualitative analytical frameworks.
4.2.1. Relationship the project to the Energy Futures Forum
An important consideration for the design of the SUT project is the desire to integrate
this research with the Energy Futures Forum (EFF). The Energy Futures Forum,
which is also being conducted by the Energy Transformed Flagship, brings together
representatives from industry and community groups to discuss, in a structured
forum, the future of Australian Stationery Energy and Transport Industries (ETF
2004). The objective of the Energy Futures Forum is to identify up to ten possible
energy pathways (scenarios) and associated challenges from an industry and
community perspective. The impact of each scenario will be evaluated over a period
to 2020 and beyond using technology and economic models (ETF 2004).
The manner in which the linkage between the SUT project and the Energy Futures
Forum is conceived is outlined in Figure A.10. The main relationship involves feeding
information from one to the other. The scenarios produced by the Energy Futures
Forum will help to form the basis of deliberations of participants in the SUT project to
gain insights into the dynamics of energy technology uptake. In turn, the results from
the SUT project may help to refine these scenarios as well as improve the modelling
possible outcomes.
Adapted from Graham (2004).
Page A.45

Figure A.10. SUT project timetable
The SUT project will primarily involve two phases of public deliberation. The first is
intensive and exploratory, with the aim of gaining familiarity with the Forum’s
scenarios and eliciting an initial response to these scenarios from a lay audience.
The second involves a larger public cross-section, to gain insight into the factors
influencing energy technology uptake and the stability across the community of key
themes identified from the first deliberative process.
This report represents the culmination of the first three phases of the SUT project.
The remainder of the research begins in stage 4 (see Figure A.10) once the
preliminary scenarios have been shaped by the Energy Futures Forum. These will be
scenarios that will be presented to the first deliberative process. The responses will
be systematically analysed using the methodology outlined in section 4.1. The
second phase of deliberation begins in stage 5, following the development of the
refined scenarios by the Energy Futures Forum. This phase of the SUT project will
involve more detailed research into the factors affecting technology uptake.
The deliberative phase begins in stage 4 (see Figure A.10), once the preliminary
scenarios have been shaped by the Energy Futures Forum. These scenarios36 will
be presented to the first deliberative process for an initial response from the lay
public and the responses systematically analysed. The second phase of deliberation
begins in stage 5, following the development of the refined scenarios by the Energy
Futures Forum. This phase of the SUT project will involve a more detailed
assessment of technologies within the scenarios involving a larger subsection of the
public.
The first of the two deliberative processes (stage 4) will approximate a citizens jury
format (Crosby 1996) to gain an intensive understanding of the kinds of social
dynamics that may be encountered in relation to different energy futures. It will
provide preliminary data for identifying the major attitudinal factors and the nature of
36 The maximum number of scenarios is ten. A much smaller number is desirable for the purposes of
administering a Q sort, since the process takes some time and effort. If the number is greater than four, then it will be more effective to administer a single Q sort before and after deliberation to elicit overall attitudes in relation to energy futures and a much simpler survey in relation to each scenario.
Page A.46

changes during deliberation forming the basis for more detailed analysis in stage 5.
In addition, the results from this phase could be fed back into the Energy Futures
Forum scenario refinement process.
The first deliberative phase will involve relatively small numbers (n<25) in a series of
deliberative groups drawn from different geographical areas.37 Members of the group
will be drawn across a range of demographic and attitudinal groups. This approach
will help to analyse the results of the process, since a relationship with the research
has already established.38
The objective here is to engage in detailed analysis of attitudinal positions and
reactions to the initial Energy Futures Forum scenarios and their validity to the lay
public. Such an approach is also more likely to throw up unanticipated aspects of
energy futures from a public perspective. The good quality deliberation required for
this objective is best achieved with small numbers. Small numbers are not a barrier
for analysis, since identification of statistically relevant factors using Q methodology
does not require large sample sizes (see section 4.1.3).39
Deliberation will involve considering different aspects of each of the scenarios,
particularly in relation to the mix of technologies. Information in respect to these
elements would presented by researchers (primarily from within CSIRO), with
provision for follow-up questions and other information required by participants.
4.2.2. Second Phase
The second research phase will ideally build from the first process and involve a
more extensive process of analysing public reactions towards technologies in the
scenarios, using a larger sample and cross section of the community.40 The process
here more closely approximates a focus-group format; that is, there would be a range
of sessions involving up to three hours discussion with pre- and post-surveys
37 This will most likely be done in two deliberative processes on the east and west coasts of Australia
respectively. 38 Participants will only be identified by a coding system to maintain anonymity. 39 So long as the number of statements is relatively large (between 40 and 60). 40 This will include upper-secondary school children (who will be most affected by the scenarios) and
groups that are diversely affected by energy futures, such as urban and rural communities.
Page A.47

administered and scenarios ranked in order of preference.41 Depending on budgetary
considerations, up to six focus groups could be conducted in different locations within
Australia.
This process will involve a more extensive analysis, one that is more statistically
representative, using targeted survey instruments based on insights from the results
of analysis of the first deliberative phase. Tools used could include choice modelling
in regard to specific technologies identified in the first phase. However the actual
design of the instrument will be guided by the results and insights that have been
gained at that point.
41 To maximise time for discussion, the pre-surveys should be administered to participants before
arriving for the focus group.
Page A.48

5. Conclusion This review has suggested methodologies for gaining insights into public responses
to potential energy futures, either in the form uptake/acceptance of energy
technologies or energy scenarios. These have been conceived to account for a
complex array of factors that contribute to social uptake and/or acceptance of
technologies that have been identified in Section 1.
The approach that has been recommended involves two main stages of deliberation
and analysis, the first being exploratory and intensive, teasing out important elements
contributing social dynamics that have been identified in this report. The approach
will also provide a good scope for a wide range of analysis, not restricted to what has
been discussed so far, including triangulation between multiple sets of data —
quantitative and qualitative. It may well reveal unanticipated results, not yet
discussed in the literature.
The second phase will draw insights from the first, which will be used for the basis of
deliberative process design as well as the survey instrument. Choice modelling has
already been identified as one possibility, although the final choice will depend on the
outcome of the analysis of phase 1. The aim of this approach is develop an
understanding of potential social dynamics without imposing a pre-existing analytical
framework. By combining the analysis with a deliberative process, it is also hoped to
gain some insight into how these dynamics may change in both the passage of time
and in light of changing circumstances.
Page A.49

6. References Ajzen, Icek, and Martin Fishbein. 1980. Understanding attitudes and predicting social
behavior. Englewood Cliffs ; London: Prentice-Hall. Al-Gahtani, S. 2001. The applicability of TAM outside North America: an empirical
test in the United Kingdom. Information Resources Management Journal 14 (3):37-46.
Arthur, W B. 1989. Competing technologies, increasing returns, and lock-in by historical events. The Economic Journal 99 (394):116–131.
Bandura, Anthony. 1989. Social Cognitive Theory. Annals of Child Development 6 (1):1–60.
Barber, Benjamin. 1984. Strong Democracy: Participatory Politics for a New Age. Berkley and Los Angeles: University of California Press.
Batten, David. 1989. The future of transport and interface communication: debating the scope of substitution growth. In Transportation for the Future, edited by D. Batten and R. Thord. Berlin: Springer-Verlag.
Baxter, Jamie, J Eyles, and S Elliott. 1999. From Siting Principles to Siting Practices: A Case Study of Discord among Trust, Equity and Community Participation. Journal of Environmental Planning and Management 42 (4):501–525.
Beck, U. 1994. The re-invention of Politics: Towards a theory of reflexitive modernisation. In Reflexive Modernisation: Politics, Tradition and Aesthetics in the Modern Social Order, edited by U. Beck, A. Giddens and S. Lash. Cambridge: Polity in Association with Blackwell.
Bellamy, J., B. Bishop, and A. Browne. 2004. Ord Bonaparte Program Evaluation: Process and Impact. Brisbane: CSIRO Sustainable Ecosystems.
Bennett, JEnergy Futures Forum, and Russell Blamey, eds. 2001. The choice modelling approach to environmental valuation, New Horizons in Environmental Economics. Cheltenham, U.K. and Northampton, Mass: Edward Elgar.
Bijker, Wiebe E. 1997. Of Bicycles, Bakelites and Bulbs: Towards a Theory of Sociotechnical Change. Cambridge, Mass.: MIT Press.
Binswanger, H. P. 1978. Induced technical change: evolution of thought. In Innovation: Technology, Institutions and Development, edited by H. P. Binswanger and V. W. Ruttan. Baltimore: Johns Hopkins University Press.
Blamey, R, M Common, and J Quiggin. 1995. Respondents to contingent valuation surveys: consumers or citizens? Australian Journal of Agricultural Economics 39:263–288.
Blaug, Ricardo. 1997. Between fear and disappointment: critical, empirical and political uses of Habermas. Political Studies 45:100–117.
Brennan, Geoffrey, and Loren E Lomasky. 1993. Democracy and Decision: The Pure Theory of Electoral Preference. Cambridge: Cambridge University Press.
Brezet, J.C. 1994. Van prototype tot standaard; De diffusie van energiebesparende technologie Een onderzoek naar het diffusieproces van Hoog-Rendement CV-
Page A.50

ketels in de particuliere huishoudelijke sector in Nederland over de periode 1981–1992. Rotterdam: Denhatex.
Brickman, R S, S. Jasanoff, and T. Ugen. 1985. Controlling Chemicals: The Politics of Regulation in Europe and the United States. Ithaca: Cornell University Press.
Brown, Halina Szejnwald, Philip Vergragt, Ken Green, and Luca Berchicci. 2003. Learning for sustainability transition through bounded socio-technical experiments in personal mobility. Technology Analysis & Strategic Management 15 (3):291–315.
Brown, Steven R. 1970. On the use of variance designs in Q methodology. Psychological Record 20:179–189.
Brown, Steven R. 1980. Political Subjectivity: Applications of Q methodology in political science. New Haven: Yale University Press.
Brown, Steven R. 1993. A primer on Q methodology. Operant Subjectivity 16 (3/4):91–138.
Buchanan, James. 1978. Markets, states, and the extent of morals. American Economic Review 2:364–368.
Bulkeley, Harriet. 2000. Common knowledge? Public understanding of climate change in Newcastle, Australia. Public Understanding of Science 9:313–333.
Cacioppo, J. T., and R. E. Petty. 1982. The need for cognition. Journal of Personality and Social Psychology 42:116–131.
Carr, V. H. 2004. Technology adoption and diffusion [website]. United States Air Force Air War College Gateway to Internet Resource, 1999 [cited 12 August 2004]. Available from http://www.au.af.mil/au/awc/awcgate/innovation/adoptiondiffusion.htm.
Crosby, Ned. 1996. Creating and Authentic Voice of the People. Paper read at A paper presented at the annual meeting of the Midwest Political Science Association, April 18-20, 1996, for the panel on Deliberation in Democratic Theory and Practice, April 18-20.
How aware is the public of carbon capture and storage? IEA Greenhouse Gas Programme, Cheltenham, UK.
Das, Mitra, and Shirley Kolack. 1990. Technology, Values and Society: Social Forces in Technological Change. New York: Lang Publishing.
David, P.A. 1985. Clio and the economics of QWERTY. American Economic Review 75 (2):332–337.
Davis, F.D. 1989. Perceived usefulness, perceived ease of use, and user acceptance of information technology. MIS Quarterly 13 (3):319–339.
Davis, F.D., R. P. Bagozzi, and P. R. Warshaw. 1989. User acceptance of computer technology: A comparison of two theoretical models. Management Science 35 (8):982–1002.
Carbon dioxide capture and storage: public perception, policy and regulatory issues in The Netherlands. IEA Greenhouse Gas Programme, Cheltenham, UK.
Page A.51

Dieperink, Carel, Iemy Brand, and Walter Vermeulen. 2004. Diffusion of energy-saving innovations in industry and the built environment: Dutch studies as inputs for a more integrated analytical framework. Energy Policy 32 (6):773–784.
Doraszelski, Ulrich. 2004. Innovations, Improvements, and the Optimal Adoption of New Technologies. Journal of Economic Dynamics and Control 28 (7):1461-80.
Downs, A. 1957. An Economic Theory of Democracy. New York: Harper & Row. Dryzek, John S. 1990. Discursive Democracy: Politics, Policy and Political Science.
Cambridge: Cambridge University Press. Elster, J. 1986a. The market and the forum. In Foundations of Social Choice Theory,
edited by J. Elster and A. Hylland. Cambridge: Cambridge University Press. Elster, Jon. 1983. Sour Grapes: Studies in the Subversion of Rationality. Cambridge:
Cambridge University Press. Elster, Jon, ed. 1986b. The Multiple Self. Cambridge: Cambridge University Press. Endo, R., and J. M. Nielsen, and I974. 1974. Beyond public opinion: behavioral
responses to air pollution. In Carbon Monoxide and the People of Denver, edited by M. Orleans and G. F. White. Boulder, CO: Institute of Behavioral science.
ETF. 2004. Energy Futures Forum. Newcastle: Energy Transformed Flagship, CSIRO.
Transition to sustainable use of fossil fuels: impacts of CFF options and Societal preferences. IEA Greenhouse Gas Programme, Cheltenham, UK.
Farhar, Barbara C., and Jan Buhrmann. 1998. Public Response to Residential Grid-Tied PV Systems in Colorado: A Qualitative Market Assessment. Golden, CO.: National Renewable Energy Laboratory.
Fazio, Russell H. 1995. Attitudes as object-evaluation associations: determinants, consequences, and correlates of attitude accessibility. In Attitude strength : antecedents and consequences, edited by R. E. Petty and J. A. Krosnick. Mahwah, N.J.: Lawrence Erlbaum Associates.
Fernandes, Antonio S C, and Pedro Melo Mendes. 2003. Technology as culture and embodied knowledge. European Journal of Engineering Education 28 (2):151–160.
Festinger, L., and N. Maccoby. 1964. On resistance to persuasive communications. Journal of Abnormal and Social Psychology 68:359–366.
Fishbein, M, and I Azen. 1975. Belief, Attitude, Intention and Behaviour: An Introduction to Theory and Research. Reading, Mass.: Addison-Wesley.
Fisher, R A. 1960. The Design of Experiments. 7th edition ed. New York: Hafner. Freeman, Ch. 1988. Introduction. In Technical Change and Economic Theory, edited
by G. Dosi, C. Freeman, R. Nelson, G. Silverberg and L. Soete. London: Pinter.
Freudenberg, W R, and S K Pastor. 1992. NIMBYs and LULUs: stalking the syndromes. Journal of Social Issues 48 (4):36-61.
Page A.52

Frodeman, Robert. 2000. Science and the public self. Technology in Society 22:341–352.
Gabriel, Yianis, and Tim Lang. 1995. The Unmanageable Consumer: Contemporary Consumption and its Fragmentation. London: Sage.
Galbraith, J. K. 1979. The New Industrial State. Third Edition, revised ed. Boston: Houghton Mifflin.
Gardner, G. T., and P. C. Stern. 2002. Environmental Problems and Human Behavior. 2nd ed ed. Boston, MA: Pearson Custom Publishing.
Gates, Christopher. 1999. Community governance. Futures 31:519–525. Gipe, Paul. 1995. Wind energy comes of age. New York: Wiley. Goodin, Robert E., and Simon John Niemeyer. 2003. When does deliberation begin?
Internal reflection versus public discussion in deliberative democracy. Political Studies (4).
Goodin, Robert E., and K. W. S. Roberts. 1975. The ethical voter. American Political Science Review 69:926–8?
Gottinger, Hans W. 1987. Econometric estimation of a technology diffusion model — Pan 2. International Journal of Technology Management 2 (1):101–118.
Gould, Jane, and Thomas F Golob. 1998. Clean air forever? A longitudinal analysis of opinions about air pollution and electric vehicles. Transportation Research Part D: Transport and Environment 3 (3):157–169.
Graham, Paul. 2004. Energy futures forum: thoughts on integration of societal uptake research. In SUT steering group meeting. Canberra.
Grove-White, Robin, Phil Macnaughten, and Brian Wynne. 2000. Wising Up: The public and new technologies: Centre for the Study of Environmental Change, Lancaster University.
Grübler, Arnulf. 1990. The rise and fall of infrastructures : dynamics of evolution and technological change in transport, Contributions to economics. Heidelberg: Physica Verlag.
Grübler, Arnulf, and Nebojsa Nakicenovic. 1991. Diffusion of technologies and social behavior. Berlin ; New York: Springer-Verlag.
Grübler, Arnulf, Nebojsa Nakicenovic, and David G. Victor. 1999. Dynamics of energy technologies and global change. Energy Policy 27 (5):247–280.
Guston, David H., and Daniel Sarewitz. 2002. Real-time technology assessment. Technology in Society 24:93–109.
Habermas, Jurgen. 1984. Theory of Communicative Action. Volume 2. Translated by T. McCarthy. Boston: Beacon Press.
Habermas, Jürgen. 1971. Toward a Rational Society. Boston: Beacon Press. Hamblin, Robert L, Jerry L L Miller, and D Eugene Saxton. 1979. Modeling use
diffusion. Social Forces 57 (3):799–811. Hansen, Annegrethe, and Christian Clausen. 2003. Social shaping perspectives in
Danish technology assessment. Technology in Society 25:431–451.
Page A.53

Hardin, Russell. 1992. The street-level epistemology of trust. Politics and Society 21 (December):505–29.
Harré, Rom, and Grant Gillett. 1994. The discursive mind. Thousand Oaks, Calif.: Sage Publications.
Hobson, Kersty. 2001. Talking habits into action: An investigation of Global Action Plan's "Action at Home" programme. PhD Thesis, Department of Geography, University College London, London.
Hoogma, R., R. Kemp, J. Schot, and B. Truffer. 2002. Experimenting for Sustainable Transport. The Approach of Strategic Niche Management. London: Spon Press.
IEA. 2001. Australia Energy Policy. Irwin, A. 1995. Citizen Science: A Study of People, Expertise and Sustainable
Development. New York: Routledge. Public acceptance of CO2 capture and storage technology: a survey of public opinion
to explore influential factors. IEA Greenhouse Gas Programme, Cheltenham, UK.
Jacobsen, Henrik Klinge. 2000. Technology diffusion in energy-economy models: the case of danish vintage models. The Energy Journal 21 (1):43–71.
James, Rosemary, and Russell Blamey. forthcoming. Deliberative Valuation. In Developing Alternatives to Valuing Nature, edited by M. Getzner, S. Stagl and C. Spash.
James, Rosemary, and Russell K Blamey. 2000. A Citizens ’ Jury Study of National Park Management. Canberra: Research School of Social Sciences, The Australian National University.
Jasanoff, S. 1990. The Fifth Branch: Science Advisers as Policymakers. Cambridge, Mass.: Harvard University Press.
Joerges, Bernward. 1999. Do politics have artefacts? Social Studies of Science 29 (3):411–431.
Johnson, B, and A. H. Eagly. 1989. Energy Futures Forumects of involvement on persuasion: a meta-analysis. Psychological Bulletin 106:290–314.
Kemp, R. 1990. Why not in my backyard? A radical interpretation of public opposition to the deep disposal of radioactive waste in the United Kingdom. Environment and Planning A 22:1239-1258.
Kleinknecht, Alfred. 1990. Are There Schumpeterian Waves of Innovations? Cambridge Journal of Economics 14 (1):81-92.
Landry, Réjean, Nabil Amara, and Moktar Lamari. 2000. Does Social Capital Determine Innovation? To What Extent? Paper read at 4th International Conference on Technology Policy and Innovation, August 28-31, at Curitiba, Brazil.
Lee, Eun-Ju, Jinkook Lee, and David Eastwood. 2003. A Two-Step Estimation of Consumer Adoption of Technology-Based Service Innovations. Journal of Consumer Affairs 37 (2):256-82.
Page A.54

Levasseur, David G., and Diana B. Carlin. 2001. Egocentric argument and the public sphere: citizen deliberations on public policy and policymakers. Rhetoric & Public Affairs 3:407–431.
Lindenberg, Siegwart. 1983. Utility and morality. Kyklos 36:450–468. Liu, Liping, and Qingxiong Ma. 2004. The technology acceptance model: a meta-
analysis of empirical findings. Journal of Organizational and End User Computing 16 (1):59-72.
Lowi, T.J. 1985. The State in Politics: The Relation Between Policy and Administration. In Regulatory Policy and the Social Sciences, edited by R. G. Noll. Berkely: University of California Press.
Lynch, Michael. 2001. The Epistemology of Epistopics: Science and Technology Studies as an Emergent (Non)Discipline. American Sociological Association Section on Science, Knowledge and Technology Newsletter (Fall 2001):2–3.
Marcuse, H. 1941. Social Implications of Modem Technology. Zeitschrift fur Sozialforschung 9.
Marks, Leonie A. 2001. Communicating about agrobiotechnology. AgBioForum 4 (3&4):152–154.
Marquand, D. 1988. The Unprincipled Society Individualism. London: Fontana Press. Mehta, Michael D. 1998. Risk and decision-making: a theoretical approach to public
participation in technoscientific conflict situations. Technology in Society 20 (1):87–98.
Michael, Mike. 1998. Between citizen and consumer: multiplying the meanings of the “public understanding of science”. Public Understanding of Science 7 (4):313–327.
Moldovan, Sarit, and Jacob Goldenberg. 2004. Cellular automata modeling of resistance to innovations: Energy Futures Forumects and solutions. Technological Forecasting & Social Change 71:425–442.
Montroll, E W. 1978. Social dynamics and the quantifying of social forces. Proceedings National Academy of Sciences 75:4633–4637.
Moore, Gary C, and Izak Benbasat. 1991. Development of an instrument to measure the percieved characteristics of adopting an information technology innovation. Information System Research 11:192–220.
Mulder, Peter, Henri L.F. De Groot, and Marjan W. Hofkes. 2001. Economic growth and technological change: A comparison of insights from a neo-classical and an evolutionary perspective. Technological Forecasting & Social Change 68:151–171.
Nadel, S. 1990. Lesson Learned. Albany: New York State Energy Research & Development Authority (Albany) / New York State Energy
Office / Niagara Mohawk Power Corp. / American Council for an Energy-Energy Futures Forumicient Economy.
Nelson, C. H. 2001. Risk perception, behavior, and consumer response to genetically modified organisms: toward understanding American and European public reaction. American Behavioral Scientist 44 (8):1371-1388.
Page A.55

Niemeyer, Simon John. 2002. Deliberation in the wilderness: transforming policy preferences through discourse. PhD, Social and Political Theory Programme, Research School of Social Sciences, The Australian National University, Canberra.
Niemeyer, Simon, Judith Petts, Kersty Hobson, and Glenn McGregor. 2004. Understanding thresholds in human behaviour and responses to rapid climate change. Birmingham: Centre for Environmental Research & Training, School of Geography, Earth and Environmental Sciences, University of Birmingham.
O'Neill, John. 1995. Public Choice, Insititutional Economics, Environmental Goods. Environmental Politics 4 (2):197–218.
Ornetzeder, Michael. 2001. Old Technology and Social Innovations. Inside the Austrian Success Story on Solar Water Heaters. Technology Analysis & Strategic Management 13 (1):105–115.
Palfrey, Thomas R, and Keith T Poole. 1987. The relationship between information, ideology, and voting Behavior. American Journal of Political Science 31 (3):511–530.
Parente, Stephen L. 1994. Technology Adoption, Learning-by-Doing, and Economic Growth. Journal of Economic Theory 63 (2):346-69.
Petts, Judith, and Simon John Niemeyer. 2004. Health risk communication and amplification: learning from the MMR vaccination controversy. Health, Risk and Society 6 (1):7–23.
Petty, R. E. 1995. Attitude change. In Advanced Social Psychology, edited by A. Tesser. New York: McGraw-Hill.
Petty, R. E., and J. T. Cacioppo. 1979. Issue-involvement can increase or decrease persuasion by enhancing message-relevant cognitive responses. Journal of Personality and Social Psychology 37:1915–1926.
Plough, A, and S. Krimsky. 1987. The Emergence of Risk Communications Studies: Social and Political Contexts. Science, Technology, and Human Values 12.
Pueppke, S. G. 2001. Agricultural biotechnology and plant improvement: setting the stage for social and economic dialogue. American behavioral scientist 44 (8):1233-1245.
Renn, Ortwin. 2001. The need for integration: risk policies require the input from experts, stakeholders and the public at large. Reliability Engineering and System Safety 72 (2):131–135.
Rizzello, Salvatore, and Margherita Turvani. 2002. Subjective diversity and social learning: A cognitive perspective for understanding institutional behavior. Constitutional Political Economy 13:197–210.
Rogers, Everett M. 1995. Diffusion of innovations. 4th ed. New York: Free Press. Rokeach, Milton. 1973. The Nature of Human Values. New York: Free Press. Roth, J., and G. Küppers. 2002. Democratizing European science and technology
policies? On users, problems and the quest for legitimacy. Innovation: the European journal of social sciences 15 (4):307-324.
Page A.56

Ruttan, Vernon W. 1996. What Happened to Technology Adoption-Diffusion Research? Sociologia Ruralis 36 (1):51-73.
Sagoff, Mark. 1988. The Economy of the Earth: Philosophy, Law and the Environment. Cambridge: Cambridge University Press.
Scholderer, J., and L. J. Frewer. 2003. The biotechnology communication paradox: experimental evidence and the need for a new strategy. Journal of Consumer Policy 26 (2):125-157.
Schot, J. 2001. Towards new forms of participatory technology development. Technology Analysis & Strategic Management 13 (1):39-52.
Schwartz, S.H., and J.A. Howard. 1981. A normative decision-making model of altruism. In Altruism and Helping Behaviour, edited by J. P. Rushton and R. M. Sorrentino. Mahwah, N.J.: Lawrence Erlbaum Associates.
Spash, Clive L. 1999. Reflections upon the role of moral sentiments in economics. In Sustainability in Question: the search for a conceptual framework, edited by J. Köhn, J. Gowdy, F. Hinterberger and J. v. d. Straaten. Cheltenham, UK: Edward Elgar.
Stephenson, W. 1953. The study of behavior: Q-technique and its methodology. Chicago: University of Chicago Press.
Stoneman, P. 1983. The Economic Analysis of Technological Change. Oxford.: Oxford University Press.
Diffusion Theory and Instructional Technology. University of Southern Mississippi, Albuquerque, New Mexico.
Sweeney, James L. 2001. Energy economics. International Encyclopedia of the Social and Behavioral Sciences 4.9 (Article 48):4513–20.
Tetlock, Philip E. 1986. A value pluralism model of ideleological reasoning. Journal of Personality and Social Psychology 50:819–827.
Thomas, Robert J, and Florian Znaniecki. 1927. The Polish Peasant in Europe and America. New York: Knopf.
Tidd, J., J. Bessant, and K. Pavitt. 2001. Managing Innovation: Integrating Technological, Market and Organizational Change. 2nd ed. ed. Chichester: Wiley.
Todt, Oliver. 1999. Social decision making on technology and the environment in Spain. Technology in Society 21:201–216.
Turner, Stephen. 2001. What is the problem with experts? Social Studies of Science 31 (1):123–49.
Ungar, Sheldon. 2000. Knowledge, ignorance and the popular culture: climate change versus the ozone hole. Public Understanding of Science 9:297–312.
van den Ende, Jan, and Wilfred Dolfsma. 2002. Technology Push, Demand Pull And The Shaping Of Technological Paradigms — Patterns In The Development Of Computing Technology.
Venkatesh, V., and F.D. Davis. 2000. A Theoretical Extension of the Technology Acceptance Model: Four Longitudinal Field Studies. Management Science 46 (2):186–205.
Page A.57

Ward, W H. 1967. The sailing ship Energy Futures Forumect: Buttelin Institute of Physics and Physics Society.
Weick, C. Wagner, and S.B. Walchli. 2002. Genetically engineered crops and foods: back to the basics of technology diffusion. Technology in Society 24:265–283.
Williams, Robin, and David Edge. 1996. The social shaping of technology. Research Policy 25:865–899.
Winner, Landon. 1999. Do artifacts have politics. In The social shaping of technology, edited by D. A. MacKenzie and J. Wajcman. Buckingham Eng. ; Philadelphia: Open University Press.
Wood, W., C. A. Kallgren, and R. M. Preisler. 1985. Access to attitude relevant information in memory as a determinant of persuasion: The role of message attributes. Journal of Experimental Social Psychology 21:73–85.
Zetterbaum, M. 1982. Self and subjectivity in political theory. Review of Politics 44:59–82.
Page A.58

Appendix B – Recruitment Process
The recruitment of a diverse cross-section of the public within the relevant catchment
area involved sending an invitation to a random selection of 2000 people across each
catchment area. The three catchment areas selected for this research were Western
Australia (WA) and New South Wales (NSW) and Victoria (VIC).
A response card was enclosed with the invitation so that those interested in
participating could return the response card either by using the enclosed pre-paid
envelope, or alternatively by the web response page set up on the CSIRO website.
The response cards indicated the respondent’s interest in participating and also
gathered essential demographic information. To maintain consistency the categories
used for the demographic information were similar to the categories used by the
Australian Bureau of Statistics (ABS). The essential demographic data included:
Age
Gender
Level of education
Working status
To get an idea of perceptions of technologies, which was deemed more likely to be
important in determining rates of uptake than demographic variables, the following
attitudinal statements were also included:
I am at the forefront of technology use, contributing to its development and
improvement.
I tend to be among the first to implement new technologies
I ten to adopt technologies once their worth has been proven
I only use new technologies when I am in no doubt about the benefits or have
little choice.
Page B.1

Figure B1: Example of response card
Over 180 responses were received, 110 from WA, 71 from NSW and 63 from VIC.
Groups of 23 were subsequently selected to attend. In selecting participants a
random stratification process was used so that each major demographic category
was represented by at least one person. Where this was not possible, preference
was given to those categories most strongly influencing attitudes towards technology,
such as residential location (to ensure representation from regional areas), age and
education level. Once this was achieved, the next priority was to achieve quotas for
each of the demographic categories that reflect the proportions within the population
for the catchment area — gathered from ABS data.
The final composition of the three deliberative groups included 23 citizens from
around Western Australia, 18 people from New South Wales and 19 from Victoria
and is summarised on the table overleaf.
In essence, there were even numbers of men and women; three young people aged
19-24 (all male university students); two people aged over 65; two aged between 55
and 64; six aged between 45 and 54; four between 35 and 44; and one (female)
aged between 25 and 34. Ten participants had tertiary education (far higher than in
the general population); with five having Year 10 and three with Year 12
qualifications. Half the participants lived in metropolitan areas, with the others coming
from small to medium regional centres (such as Warren, Kandos, Griffith, Coffs
Harbour and Port Stephens). As well as the three students, five people were retired
(one medically); six worked part-time; three were part-time workers and one (male)
was on full-time home duties. Interestingly, two of the retired men had worked in the
coal industry, and one of the students was studying photovoltaic engineering. One of
the women was very active in local environmental issues.
Page B.2

Summary Statistics – Participant demographics Gender
WA NSW VIC
No. % ABS% No. % ABS% No. % ABS%
Male 11 47.8 49.9 9 50 48.9 8 42.1 48.4
Female 12 52.2 50.1 9 50 51.1 11 57.9 51.6
TOTAL 23 100 100 18 100 100 19 100 100
Age
WA NSW VIC
No. % ABS% No. % ABS% No. % ABS%
18 – 24 2 8.7 9.7 3 16.7 9.2 2 10.5 9.5
25 – 34 3 13.0 14.5 1 5.6 14.5 4 21.1 15.0
35 – 44 5 21.7 15.5 4 22.2 15.3 3 15.8 15.4
45 – 54 7 30.4 14.0 6 33.3 13.5 5 26.3 13.6
55 – 64 3 13.0 9.1 2 11.1 9.4 2 10.5 9.2
65+ 3 13.0 11.1 2 11.1 13.1 3 15.8 12.7
TOTAL* 23 100 18 100 19 100 100 *Total percentages based on population over 18
Employment
WA NSW VIC
No. % ABS% No. % ABS% No. % ABS%
Full Time 12 52.2 37.6 6 33.3 37.9 6 31.6 36.9
Part Time 4 17.4 20.6 3 16.7 18.0 5 26.3 18.1
Retired 4 17.4 16.2 5 27.8 18.8 4 21.1 17.4
Unemployed 0 0 4.9 0 0 4.5 1 5.3 4.1
Student 2 8.7 5.3 3 16.7 7.3 0 0 7
Not in labour force*
8 34.7 35.2
(19.0)
1 5.6 34.8
(16.0)
3 15.8 33.4
(26.0)
TOTAL 23 100 120**
(104) 18 100 121**
(102) 19 100 118**
(101) *ABS figures include retirees, which are deducted to produce the figure in brackets. ** Total percentages exceed 100 per cent because of overlap between categories in the ABS data.
Page B.3

Education*
WA NSW VIC
No. % ABS% No. % ABS% No. % ABS%
Year 8 1 4.3 13.5 0 0 17.0 0 0 18.2
Year 10 2 8.7 37.3 4 22.2 32.1 3 15.8 29.9
Year 12** 3 13.0 38.3
(21.5)
3 16.7 38.0
(8.1)
1 5.2 38.9
(24.4)
Certificate 5 21.7 16.8 4 22.2 16.4 8 42.1 14.5 *All figures for education level include the population over 15. However, the age of participants was generally much higher, hence the higher education level among the recruited participants. **Figures in parenthesis are a crude estimate of the population who completed year 12 but did not go on to complete a higher qualification (not including Certificate)
Diploma 2 8.7 1 5.6 3 15.8
Advanced Diploma
2 8.7 1 5.6 1 5.2
Advance Diploma & Diploma
4 13.8 2 17.8 4 18.5
Bachelor Degree 6 26.1 9.4 4 22.2 10.1 2 10.5 10.7
Masters Degree 1 4.3 0 0 0 0
Doctoral/PhD 1 4.3 1 5.6 1 5.2
Postgraduate Degree
3.1 2.2 1.8
TOTAL 23 100 18 100 19 100
Page B.4

Appendix C – The remit presented to participants of the Citizens Panel
This document was given to the participants prior to the Citizens Panel to outline their
remit and define their task.
YOUR TASK - HOW YOUR PARTICIPATION WILL CONTRIBUTE TO OUR ENERGY FUTURE
Our lives are powered by energy. It comes in many forms from the electricity that
powers our homes and industry, the gas that is used for cooking and heating and the
fuel in our cars. Meeting this demand for energy requires technology and resources.
As the world’s population grows and we seek ways to increase health and wealth and
reduce poverty, the International Energy Agency says that we will need 60% more
energy in 2030 than we had in 2002.
CSIRO is looking at what this might mean for Australia. Energy affects all of us, and
the way we as individuals use energy will affect the future of all Australia’s energy
industries. As well as expert opinions, we want to have ideas about energy based on
the common sense of the Australian public. The panel you have been invited to is a
way of developing those ideas using “deliberation” – a process of interlinked
discussion, information provision, feedback and activity that will involve you and a
number of fellow participants. The perspectives that we gain from these panels and
your personal responses will help inform us about the future of energy and its impact
on society.
The citizens’ panel is part of a larger CSIRO project, including an initiative
established in 2004 called the “Energy Futures Forum” which provides a mechanism
for energy experts to explore the future of energy. The enclosed brochure in this
participant pack tells you a bit more about this Forum which will continue to meet until
the middle of 2006. The Energy Futures Forum is developing a range of scenarios
(visions of a potential future) which CSIRO and its partners can analyse in terms of
the effect on the Australian economy and the social and natural environment.
Page C.1

For example, it is plausible that in the future (say by 2050) we may all have little
power stations in our yards, perhaps powered directly by the sun and providing all the
energy we need to run our homes. Alternatively, we may still have large central
power stations distributing electricity to where it needs to be. The future may be a
mixture of these two visions or it may be something completely different thanks to
new technology that is only just emerging out of our research institutions.
Your task as a deliberative group is to consider a range of technologies that might be
part of a future energy system for Australia. Through a series of exercises that will
be guided by a professional facilitator, you will have the opportunity to discuss
information with other participants and with experts and develop a considered
position on different scenarios for the future and your perceptions about different
energy technologies. You need have no prior knowledge about energy.
Above all, we hope you will have a bit of fun and help us to understand the kind of
reactions that the general public may have to energy futures.

Appendix D – The Q sort statements used for the factor analysis survey
These statements are real life, real language argument intended to encourage a reaction
which is measured through the survey process. They were generated through a structured
process involving:
Trawling media literature and key documents representing the initial energy
landscape at the beginning of the EFF
Identification of >150 statements from this trawl
Classification of the statements by”
o Type of technology
o Whether it represents a value or a belief
o What attribute it refers to (economic, environmental, social, risk etc)
Selection of 45 statements that have an even balance in terms of the three categories
above
Resulting Statements
1. Reducing greenhouse gases should not mean prices have to go up.
2. Can we be confident, that if we store CO2 the storage facility is going to hold it
forever? That's really the issue. And I don't think anybody can answer that question.
3. Our present energy system is so cheap precisely because it is unsustainable.
4. Many big ticket solutions to energy problems that we don’t understand are just too
risky
5. Combining technologies in the energy sector is a much more promising and more
productive approach than relying on a single approach.
6. Energy technologies such as nuclear power and geosequestration are too risky. It’s
better to improve the technologies that we already have.
7. Governments must fund new infrastructure investment in the face of uncertainty in the
economics of energy technologies.
8. Energy technologies are pretty complex, so I leave it to the experts.
9. Wind power has its downsides — it is highly visible and can kill birds. The fact is
though, that any man-made structure can kill birds.
10. Coal gasification is needed to produce hydrogen on the scale required for a possible
transition to a hydrogen-based economy.
Page D.1

11. Australia should turn more attention to biomass energy sources because it is CO2
neutral (the carbon dioxide used by the growing plants is released when they are
burned).
12. Any tax to reduce greenhouse gas emissions will have a detrimental economic effect
on the nation.
13. There is no need to make expensive investments in technological changes within the
energy sector.
14. If the cost of greenhouse gas emissions is factored in, the cost of renewables
compared to coal isn't so big.
15. Reducing our reliance on oil would be good for the economy and the environment.
16. Solar power is pointless because it can't guarantee constant supply, for obvious
reasons: the sun doesn't always shine.
17. Nuclear has a few dangers, but they're trivial compared with the dangers of emitting
greenhouse gases and letting global warming happen.
18. Fuzzy-headed thinking about alternative energy sources seems not to appreciate the
need for certainty of supply and excess capacity to keep economies growing.
19. Nuclear power is a more proven technology than it was 30 years ago. In reality atomic
power generation can be a very safe system if designed and operated correctly.
20. It is very hard to trust all these so-called experts arguing for one energy technology or
another, especially when they, or their bosses, are just in it to make money.
21. Rather than look at costly renewable energy a more fair-dinkum strategy would be to
encourage technology that captures greenhouse emissions like carbon dioxide.
22. If Australia mines uranium, the country should be able to generate power from it.
23. Local energy solutions such as windfarms are good for jobs, local economies and
tourism.
24. Energy is going to get costly so we had better start investing in alternatives.
25. Australia doesn't support alternative energy opportunities. Industry comes along and
says, 'Have I got something for you' (such as carbon sequestration, or a new power
station) and they get government subsidies to do it.
26. I'm not pro-nuclear, I'm not pro-coal, I'm not pro-wind, I'm not pro any kind of
generation. I'm pro-energy conservation through changes to our behavioural and
design practices.

27. Environmental, reliability and cost issues will limit the adoption of large-scale of
certain renewable technologies.
28. Australia spends too much on research and development in energy technologies.
29. Nuclear is the inevitable replacement for old hydrocarbon technology. It is cost-
competitive with coal and will cogenerate potable water and hydrogen also at
societally acceptable costs.
30. You could have a wind farm across all of the outback that would kill every
kookaburra, but it wouldn't provide the baseload power we need.
31. Climate change considerations have no role in the development of national and
global energy policies.
32. Prices of alternative energy will fall as technology improves.
33. The limited strategic and technical insight that is so entrenched in Australia is limiting
the development of innovative energy technologies.
34. Any return on geosequestration is 15 to 20 years off, whereas the proven technology
of renewable energy offers immediate gains.
35. The petroleum age is far from over; we will still be able to keep finding more oil.
36. The urgency of addressing greenhouse emissions cannot stay on back burner for too
much longer. So we need to find a solution quickly, such as CO2 capture and
storage.
37. We need coal because it is a cheap and reliable energy source.
38. Geothermal or hot rock technology will provide a reliable and unlimited and cheap
energy source.
39. I don’t want the implementation of new energy technologies to disrupt my way of life.
40. Natural gas is the bridging fuel between the oil economy and the hydrogen economy.
41. Renewable sources do not have the potential to meet our future energy needs as
they stand.
42. Renewables are part of the long-term solution, but for the foreseeable future, they just
can't do the job.
43. Apart from coal, natural gas is the only other potentially reliable source of power for
the state.
44. Using biomass from crops has significant expansion potential and would be good for
the rural industry.
Page D.3

45. Coal-powered energy needs to be minimised because of its high greenhouse gas
emissions.

Appendix E – Feedback from each panel – the agreed presentations
The following three documents are the position agreed upon by participants at each of the
three panels respectively. The presentations use their language and were presented back to
the Energy Futures Forum as feedback regarding the plausibility and comprehensiveness of
the scenarios currently under development. It was originally presented as a PowerPoint
presentation.
Page E.1

EnergyEnergy FuturesFutures
Feedback Feedback precisprecis -- Perth Citizens Perth Citizens panelpanel
The future is now!The future is now!
Late Action is not an Late Action is not an optionoption
• This briefing is based on feedback from a Citizens Panel held in WA in late July 2005
• The Panel met over 3 days and considered information about:– The current energy system in Australia– Scenarios being developed by the Energy
Futures Forum– Energy Technologies
• The following material summarises key recommendations of the Panel.
• Where do we want to get to? (Gives decisions makers input about what characteristics need to be considered in an energy scenario)
• What do we need to do to get there?(Gives decision-makers input about the changes we can make to change the energy system)
• What role is envisaged for specific energy technologies ( gives DMs an idea about technology development priorities)
• What further considerations are there?Gives DM an idea of important but unresolved issues)
Page E.2
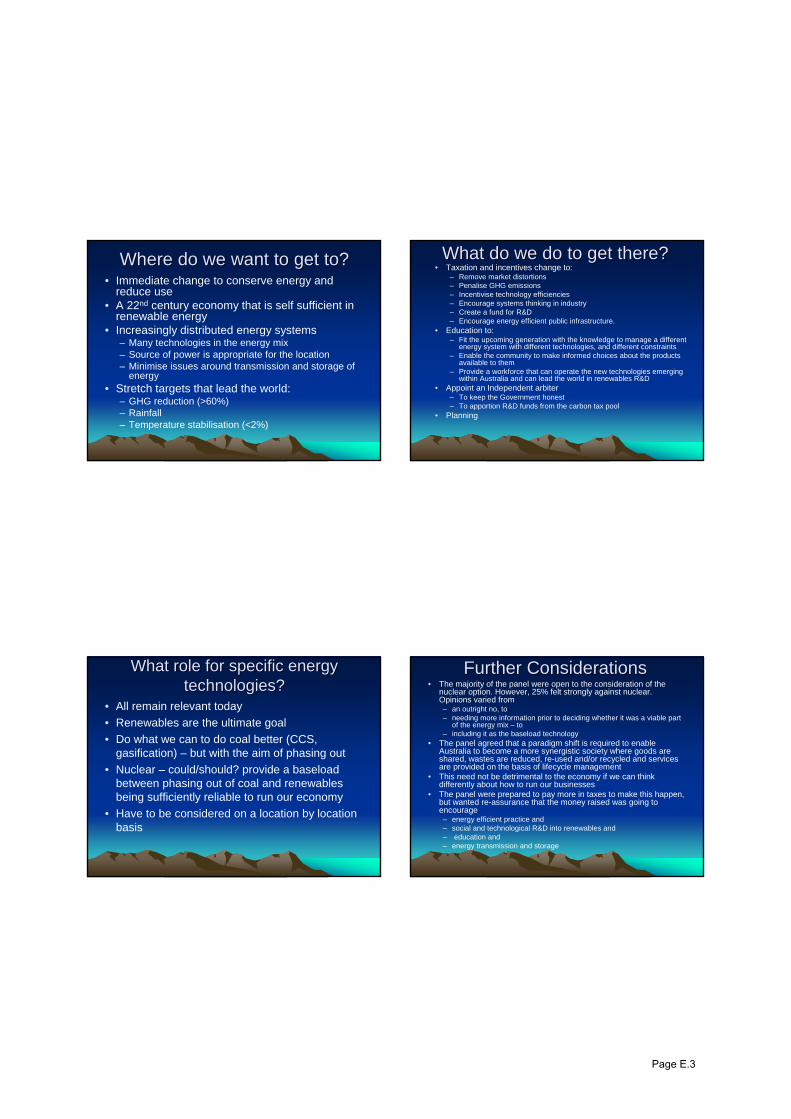
Where do we want to get to?Where do we want to get to?• Immediate change to conserve energy and
reduce use• A 22nd century economy that is self sufficient in
renewable energy • Increasingly distributed energy systems
– Many technologies in the energy mix– Source of power is appropriate for the location– Minimise issues around transmission and storage of
energy• Stretch targets that lead the world:
– GHG reduction (>60%)– Rainfall – Temperature stabilisation (<2%)
What do we do to get there?What do we do to get there?• Taxation and incentives change to:
– Remove market distortions– Penalise GHG emissions– Incentivise technology efficiencies– Encourage systems thinking in industry– Create a fund for R&D– Encourage energy efficient public infrastructure.
• Education to:– Fit the upcoming generation with the knowledge to manage a different
energy system with different technologies, and different constraints– Enable the community to make informed choices about the products
available to them– Provide a workforce that can operate the new technologies emerging
within Australia and can lead the world in renewables R&D• Appoint an Independent arbiter
– To keep the Government honest– To apportion R&D funds from the carbon tax pool
• Planning
What role for specific energy What role for specific energy technologies?technologies?
• All remain relevant today• Renewables are the ultimate goal• Do what we can to do coal better (CCS,
gasification) – but with the aim of phasing out• Nuclear – could/should? provide a baseload
between phasing out of coal and renewablesbeing sufficiently reliable to run our economy
• Have to be considered on a location by location basis
Further ConsiderationsFurther Considerations• The majority of the panel were open to the consideration of the
nuclear option. However, 25% felt strongly against nuclear. Opinions varied from – an outright no, to – needing more information prior to deciding whether it was a viable part
of the energy mix – to– including it as the baseload technology
• The panel agreed that a paradigm shift is required to enable Australia to become a more synergistic society where goods are shared, wastes are reduced, re-used and/or recycled and services are provided on the basis of lifecycle management
• This need not be detrimental to the economy if we can think differently about how to run our businesses
• The panel were prepared to pay more in taxes to make this happen, but wanted re-assurance that the money raised was going to encourage – energy efficient practice and – social and technological R&D into renewables and– education and – energy transmission and storage
Page E.3

Visions of the Future #1Visions of the Future #1
% dependence
Time 2050
coalgas
BiomassHydro
Wind, solar
Geo, other
Visions of the future #2Visions of the future #2Community attitudes reduce demand
CCS study and implementation
Research nuclear
Tax incentives – carbon tax and salary packaging
Legislated reductions in emissions
Nat Gas expanded
Dirty coal phased out Sustainable renewables in place (solar, wind, geo
Decision on nuclear
Coal and CCS outNG /CCS out
2050
2010
2025
Page E.4

Energy FuturesEnergy FuturesEnergy FuturesEnergy FuturesEnergy FuturesEnergy FuturesEnergy FuturesEnergy Futures
Feedback Feedback precisprecis –– Newcastle Newcastle Citizens panelCitizens panel
�� This briefing is based on feedback from a This briefing is based on feedback from a Citizens Panel held in Newcastle in early Citizens Panel held in Newcastle in early August 2005August 2005
�� The Panel met over 3 days and The Panel met over 3 days and considered information about:considered information about:�� The current energy system in AustraliaThe current energy system in Australia
�� Scenarios being developed by the Energy Scenarios being developed by the Energy Futures ForumFutures Forum
�� Energy TechnologiesEnergy Technologies
�� The following material summarises key The following material summarises key recommendations of the Panel.recommendations of the Panel.
Structure of feedbackStructure of feedbackStructure of feedbackStructure of feedbackStructure of feedbackStructure of feedbackStructure of feedbackStructure of feedback
�� A vision of a future:A vision of a future: ((Gives decisions makers Gives decisions makers input about what the Panel wants to move input about what the Panel wants to move towards)towards)
�� Some areas of debate: (Some areas of debate: (Gives Gives DMsDMs an idea of an idea of uncertainty about the future)uncertainty about the future)
�� Moving towards the future:Moving towards the future: ((Gives decisionGives decision--makers recommendations for changing the makers recommendations for changing the system)system)
�� Technologies for the futureTechnologies for the future ( gives ( gives DMsDMs an an idea about technology development priorities)idea about technology development priorities)
�� Specific examplesSpecific examples
A vision of a futureA vision of a futureA vision of a futureA vision of a futureA vision of a futureA vision of a futureA vision of a futureA vision of a future
�� The crisis isn’t looming The crisis isn’t looming ––its here nowits here now
�� We want a futureWe want a future
�� We have to act nowWe have to act now
�� Distributed EnergyDistributed Energy
�� 60% reduction in GHG by 60% reduction in GHG by 20502050
�� Phase out of fossil fuelsPhase out of fossil fuels
Page E.5

Alternatives
Fossil Fuels
Some areas of debateSome areas of debateSome areas of debateSome areas of debateSome areas of debateSome areas of debateSome areas of debateSome areas of debateMoving towards the futureMoving towards the futureMoving towards the futureMoving towards the futureMoving towards the futureMoving towards the futureMoving towards the futureMoving towards the future
�� We need:We need:�� An energy policy of An energy policy of clean energy clean energy
production production andand strong energy reductionstrong energy reduction�� A committed GovernmentA committed Government�� An energy commissionAn energy commission�� Commitment to a transport strategyCommitment to a transport strategy�� Continued deliberation through future forumsContinued deliberation through future forums�� Information dissemination, transparency and Information dissemination, transparency and
consultationconsultation
Policy InstrumentsPolicy InstrumentsPolicy InstrumentsPolicy InstrumentsPolicy InstrumentsPolicy InstrumentsPolicy InstrumentsPolicy Instruments
�� Clean ProductionClean Production�� IncentivesIncentives�� Carbon taxCarbon tax�� Pricing signalsPricing signals�� InnovationInnovation
�� Strong ReductionsStrong Reductions�� Pricing signalsPricing signals�� Planning and building Planning and building
(CSIRO model)(CSIRO model)�� Building codesBuilding codes�� EducationEducation�� Population distributionPopulation distribution
And a portfolio approach to energy technology
Technologies for the futureTechnologies for the futureTechnologies for the futureTechnologies for the futureTechnologies for the futureTechnologies for the futureTechnologies for the futureTechnologies for the future�� A two tiered approach is valuableA two tiered approach is valuable
�� Small scaleSmall scale�� Fit for purpose and suited to locationFit for purpose and suited to location�� Encourage holistic solutionsEncourage holistic solutions
�� Large scaleLarge scale�� BaseloadBaseload�� Nuclear could be considered as a solution to help meet Nuclear could be considered as a solution to help meet
baseloadbaseload requirements. However, 25% of participants were requirements. However, 25% of participants were opposed to nuclear because of the risk of catastrophic failure opposed to nuclear because of the risk of catastrophic failure and lack of social acceptabilityand lack of social acceptability
�� For those for whom nuclear was not a long term option, the For those for whom nuclear was not a long term option, the ultimate solution was for large scale ultimate solution was for large scale renewablesrenewables to provide to provide baseloadbaseload
�� The need for interim measures is recognised The need for interim measures is recognised �� But urgent solutions are requiredBut urgent solutions are required
Page E.6

Transport StrategyTransport StrategyTransport StrategyTransport StrategyTransport StrategyTransport StrategyTransport StrategyTransport StrategySpecific Examples Specific Examples Specific Examples Specific Examples Specific Examples Specific Examples Specific Examples Specific Examples ––––––––
“Fusion Futures”“Fusion Futures”“Fusion Futures”“Fusion Futures”“Fusion Futures”“Fusion Futures”“Fusion Futures”“Fusion Futures”
Clean Coal And CCS
Nuclear asap Fusion
Renewables fit for purpose
Specific Examples Specific Examples Specific Examples Specific Examples Specific Examples Specific Examples Specific Examples Specific Examples ––––––––
Energy with MERITEnergy with MERITEnergy with MERITEnergy with MERITEnergy with MERITEnergy with MERITEnergy with MERITEnergy with MERIT
�� InterimInterim�� CSIRO modelCSIRO model
�� Now to 2030Now to 2030
�� Improve efficiency (CCS)Improve efficiency (CCS)
�� Phase out coalPhase out coal
�� Radical building codesRadical building codes
�� DecentraliseDecentralise
�� Now Now –– 20202020
�� Improve monitoringImprove monitoring
�� Targets and penaltiesTargets and penalties
�� Assume an interest in powerAssume an interest in power
�� Long termLong term�� CSIRO model and CSIRO model and
emerging technologyemerging technology
�� Monitoring ongoingMonitoring ongoing
�� IncreasweIncreaswe wind/solar and wind/solar and designdesign
Small scale
Large scale
Specific Example Specific Example Specific Example Specific Example Specific Example Specific Example Specific Example Specific Example –––––––– clean clean clean clean clean clean clean clean
energyenergyenergyenergyenergyenergyenergyenergy
Page E.7

Specific Example Specific Example Specific Example Specific Example Specific Example Specific Example Specific Example Specific Example –––––––– EA+DGEA+DGEA+DGEA+DGEA+DGEA+DGEA+DGEA+DG
Page E.8

Energy Futures Energy Futures Citizens Panel 3Citizens Panel 3
VictoriaVictoria
May 2006May 2006
ContentContent
�� A Citizen’s perspective on the greenhouse A Citizen’s perspective on the greenhouse debatedebate
�� Overarching vision from the panelOverarching vision from the panel
�� Achieving the visionAchieving the vision
�� Implementing the visionImplementing the vision
�� Questions for ongoing deliberationQuestions for ongoing deliberation
Panel perspectivePanel perspective
�� We value lifeWe value life
�� We need to do somethingWe need to do something
�� We need to do something doWe need to do something do--ableable
�� We recognise that it will impact our lifestyleWe recognise that it will impact our lifestyle
�� We have to change the presentWe have to change the present
�� Need action nowNeed action now
2050 Vision for Australia’s Energy 2050 Vision for Australia’s Energy FuturesFutures
�� Support stabilisation at or below a 2 degree Support stabilisation at or below a 2 degree increase in global temperaturesincrease in global temperatures
�� Australia should take a leadership role in the Australia should take a leadership role in the global debateglobal debate
�� We recognise the need for a portfolio We recognise the need for a portfolio approach to the problemapproach to the problem
Page E.9

Think globally, act locallyThink globally, act locally�� World solutions are required to address climate World solutions are required to address climate
changechange�� Recognised that global action is unrealisticRecognised that global action is unrealistic�� But that should not be used as an excuse for But that should not be used as an excuse for
Australian inactionAustralian inaction�� Opportunity for Australia to show global leadership Opportunity for Australia to show global leadership
which may translate into new markets/replacement which may translate into new markets/replacement economic benefiteconomic benefit
�� Recognised that multinationals might go Recognised that multinationals might go elsewhere ( alumina industry)elsewhere ( alumina industry)–– Size of any price signal needs to be carefully Size of any price signal needs to be carefully
establishedestablished–– Should not be held to ransom by multinationalsShould not be held to ransom by multinationals
Areas of emphasis to reduce Areas of emphasis to reduce greenhouse gas emissionsgreenhouse gas emissions
other
coal
oil
gas
solar and wind
coal with ccs
reduction indemand
nuclear
biomass
geothermal
gas
To this…
From this… 2050 vision
2005
other
coal
oil
gas
solar and wind
coal with ccs
reduction indemand
nuclear
biomass
geothermal
gas
To this…
From this…
other
coal
oil
gas
solar and wind
coal with ccs
reduction indemand
nuclear
biomass
geothermal
gas
To this…
other
coal
oil
gas
solar and wind
coal with ccs
reduction indemand
nuclear
biomass
geothermal
gas
other
coal
oil
gas
solar and wind
coal with ccs
reduction indemand
nuclear
biomass
geothermal
gas
To this…
From this… 2050 vision
2005
2050 portfolio rationale2050 portfolio rationale�� Coal Coal –– recognise that this needs to continue to be part of recognise that this needs to continue to be part of
the mix but work to cleanup emissionsthe mix but work to cleanup emissions�� Solar, wind Solar, wind –– significant increasesignificant increase�� Hydro Hydro –– no consensus but potential for increase?no consensus but potential for increase?�� Biomass Biomass –– significant increase and encouragement of significant increase and encouragement of
localised generationlocalised generation�� Oil Oil –– substitute with alternative fuelssubstitute with alternative fuels�� Nuclear Nuclear –– not a consensus, but general recognition that not a consensus, but general recognition that
this should be considered in the mixthis should be considered in the mix�� Geothermal Geothermal –– probably viable for localised solutionsprobably viable for localised solutions�� Reduction in demand Reduction in demand –– requires a big pushrequires a big push
�� Environmental impacts of all technologies have to be Environmental impacts of all technologies have to be assessed as part of the decision processassessed as part of the decision process
Achieving the visionAchieving the vision�� Reducing greenhouse gas emissions per unit energyReducing greenhouse gas emissions per unit energy
–– Technology developmentTechnology development–– Economic “carrot and stick”Economic “carrot and stick”
�� Reward low emissionsReward low emissions�� Penalise high emissionsPenalise high emissions�� Use revenue for ongoing R&DUse revenue for ongoing R&D
–– Legislation and regulationLegislation and regulation�� Establish independent “Energy Futures” board to facilitate balanEstablish independent “Energy Futures” board to facilitate balanced ced
education and allocation of R&D fundseducation and allocation of R&D funds
�� Reducing energy requirements per unit of activityReducing energy requirements per unit of activity–– Efficiency R&D ( both industrial and domestic)Efficiency R&D ( both industrial and domestic)–– Change behaviours through educationChange behaviours through education
�� Of industryOf industry�� Of the publicOf the public�� Of future generationsOf future generations
–– Regulations for new buildings and new plantRegulations for new buildings and new plant
Page E.10

Implementing the visionImplementing the vision�� Encourage localised actionEncourage localised action
–– Incentives for community based solutionsIncentives for community based solutions–– Enable market opportunities for small scale selling into Enable market opportunities for small scale selling into
gridgrid–– Rural communities as well as big city solutionsRural communities as well as big city solutions
�� Sharpen the link between generating costs and Sharpen the link between generating costs and consumptionconsumption–– Encourage domestic solutionsEncourage domestic solutions–– Target consumer at the point of consumptionTarget consumer at the point of consumption–– Smart metersSmart meters–– Simple cost structuresSimple cost structures
�� Awareness, eduction and dialogue at community, Awareness, eduction and dialogue at community, regional, state, federal and international scalesregional, state, federal and international scales
Climate change in societyClimate change in society�� Climate change is the most significant global Climate change is the most significant global
threat facing the world tomorrowthreat facing the world tomorrow�� But most people think about todayBut most people think about today�� Need a profound cultural shift and a holistic Need a profound cultural shift and a holistic
consideration of linkages within societyconsideration of linkages within society�� Climate change is enormousClimate change is enormous
–– How do we humanise the enormity of the issueHow do we humanise the enormity of the issue–– Personalise problem and personalise solutionsPersonalise problem and personalise solutions–– Need to start rasing awareness now but it will Need to start rasing awareness now but it will
take timetake time
Where will the panel findings be Where will the panel findings be used?used?
DataPresentation
Energy Futures ForumGHGT8 conferenceFederal Government agencies
Report Academic LiteratureIndustry Presentations
CSIROUQMelbourne UniANUSCU
Intelligent Grid research
Council of Australian GovernmentsAustralia 21Climate Institute
International Energy AgencyFederal Government
Page E.11

Appendix F - Q-Sort results: Different types of “discourse” that emerged over the course of deliberation
Raw Data Analysis of data from the Q-sorts revealed five different types of discourse.1 Table
F.1 shows the factor scores for the five factors extracted from the Q sort data. These
scores reflect the typical response to a statement for each discourse. The
significance of each statement in defining a discourse is indicated by shading, with
light shading indicating a significant difference to the other discourses at the 95%
level and dark shading at the 99% level.
1 Although ‘factor’ is the standard term used in Q methodology, for the sake of simplicity and consistency, the
remaining discussion will use the term discourse, except where terms such as ‘factor score’ and ‘factor loading’ are used, which are formal terms used in Q methodology.
Page F.1

No. Statement A B C D E 1 Reducing greenhouse gases should not mean prices have to go up. 0 -1 -2 4 0 2 Can we be confident, that if we store CO2 the storage facility is going to
hold it forever? That's really the issue. And I don't think anybody can answer that question.
2 0 0 -1 -1
3 Our present energy system is so cheap precisely because it is unsustainable. 2 -1 -2 -3 1
4 Many big ticket solutions to energy problems that we don’t understand are just too risky. 0 -3 0 -3 5
5 Combining technologies in the energy sector is a much more promising and more productive approach than relying on a single approach. 5 4 5 2 -1
6 Energy technologies such as nuclear power and geosequestration are too risky. It’s better to improve the technologies that we already have. 1 -3 -2 -1 1
7 Governments must fund new infrastructure investment in the face of uncertainty in the economics of energy technologies. 3 3 3 1 3
8 Energy technologies are pretty complex, so I leave it to the experts. -2 -2 -2 4 1 9 Wind power has its downsides it is highly visible and can kill birds. The
fact is though, that any man-made structure can kill birds. 2 1 0 -5 2
10 Coal gasification is needed to produce hydrogen on the scale required for a possible transition to a hydrogen-based economy. 0 -1 1 -1 0
11 Australia should turn more attention to biomass energy sources because it is CO2 neutral (the carbon dioxide used by the growing plants is released when they are burned).
1 -1 2 1 4
12 Any tax to reduce greenhouse gas emissions will have a detrimental economic effect on the nation. -2 -2 -3 -1 1
13 There is no need to make expensive investments in technological changes within the energy sector. -3 -5 -4 -3 -2
14 If the cost of greenhouse gas emissions is factored in, the cost of renewables compared to coal isn't so big. 4 1 -1 -1 -1
15 Reducing our reliance on oil would be good for the economy and the environment. 4 2 2 -1 2
16 Solar power is pointless because it can't guarantee constant supply, for obvious reasons: the sun doesn't always shine. -3 -3 -3 -4 2
17 Nuclear has a few dangers, but they're trivial compared with the dangers of emitting greenhouse gases and letting global warming happen.
-4 5 -3 1 -2
18 Fuzzy-headed thinking about alternative energy sources seems not to appreciate the need for certainty of supply and excess capacity to keep economies growing.
-1 0 -1 -3 5
19 Nuclear power is a more proven technology than it was 30 years ago. In reality atomic power generation can be a very safe system if designed and operated correctly.
-3 5 0 -1 -3
20 It is very hard to trust all these so-called experts arguing for one energy technology or another, especially when they, or their bosses, are just in it to make money.
0 0 1 5 1
21 Rather than look at costly renewable energy a more fair-dinkum strategy would be to encourage technology that captures greenhouse emissions like carbon dioxide.
-1 -1 -1 1 0
22 If Australia mines uranium, the country should be able to generate power from it. -3 4 0 3 0
23 Local energy solutions such as wind farms are good for jobs, local economies and tourism. 2 0 1 -1 -2
24 Energy is going to get costly so we had better start investing in alternatives. 3 3 2 -3 3
25 Australia doesn't support alternative energy opportunities. Industry comes along and says, 'Have I got something for you' (such as carbon sequestration, or a new power station) and they get government subsidies to do it.
1 0 -1 -3 0
Page F.2

No. Statement A B C D E 26 I'm not pro-nuclear, I'm not pro-coal, I'm not pro-wind, I'm not pro any
kind of generation. I'm pro-energy conservation through changes to our behavioural and design practices.
3 1 4 5 0
27 Environmental, reliability and cost issues will limit the adoption of large-scale of certain renewable technologies. 0 0 1 3 2
28 Australia spends too much on research and development in energy technologies. -4 -5 -5 -4 -5
29 Nuclear is the inevitable replacement for old hydrocarbon technology. It is cost-competitive with coal and will co-generate potable water and hydrogen also at socially acceptable costs.
-5 3 -4 -1 -2
30 You could have a wind farm across all of the outback that would kill every kookaburra, but it wouldn't provide the baseload power we need. -1 -1 0 -1 -3
31 Climate change considerations have no role in the development of national and global energy policies. -5 -4 -5 -5 -1
32 Prices of alternative energy will fall as technology improves. 3 2 2 -1 3 33 The limited strategic and technical insight that is so entrenched in
Australia is limiting the development of innovative energy technologies. 1 2 0 2 3
34 Any return on geosequestration is 15 to 20 years off, whereas the proven technology of renewable energy offers immediate gains. 1 0 -1 -3 3
35 The petroleum age is far from over, we will still be able to keep finding more oil. -1 -2 -2 2 -3
36 The urgency of addressing greenhouse emissions cannot stay on back burner for too much longer. So we need to find a solution quickly, such as CO2 capture and storage.
2 2 5 2 1
37 We need coal because it is a cheap and reliable energy source. -2 -2 1 3 -3 38 Geothermal or hot rock technology will provide a reliable and unlimited
and cheap energy source. 0 -2 -1 -3 -1
39 I don’t want the implementation of new energy technologies to disrupt my way of life. -2 -4 1 3 0
40 Natural gas is the bridging fuel between the oil economy and the hydrogen economy. 0 2 2 -1 -4
41 Renewable sources do not have the potential to meet our future energy needs as they stand. -1 1 4 -3 -5
42 Renewables are part of the long-term solution, but for the foreseeable future, they just can't do the job. -1 1 3 -1 -2
43 Apart from coal, natural gas is the only other potentially reliable source of power for the state. -2 -3 -3 1 -4
44 Using biomass from crops has significant expansion potential and would be good for the rural industry. 1 1 3 1 2
45 Coal-powered energy needs to be minimised because of its high greenhouse gas emissions. 5 3 3 -1 -1
Distinguishing statements = 95% level = 99% level
Table F.1. Factor Array continued
Factor Descriptions
Discourse A: Broadscale Reform
Table F.2 shows selected statements from the Q sort most relevant to the interpretation of
Discourse A. Discourse A reflects a broad perspective on energy issues, taking into account
a wider array of issues than the other four discourses. It is associated with a ‘whole energy
system’ approach and a belief that the existing system is unsustainable because of incorrect
price signals.
Many individuals who strongly loaded on Discourse A were very sceptical about large-scale
technologies for a number of reasons. They were concerned about the associated risks,
particularly in relation to nuclear (19) and, to a lesser extent Carbon Capture and Storage
Page F.3

(CCS) (2), but this was only part of a larger equation. For example, a particular objection to
hydrocarbons is that they are effectively subsidised by not including the costs of pollution
(14). There is a belief that renewable and decentralised technologies can compete once the
external impacts of other technologies are factored in.
There is some sensitivity to the social impacts of large-scale energy industries in Discourse
A. These were seen to impact negatively on particular ideas of community empowerment,
which is seen as best achieved via small-scale decentralised technologies. Although it is
difficult to discern this theme from any particular statement(s) in the Q sort, it was certainly a
feature in the contributions to the discussions of some of the most strongly loaded individuals
on it. A preference for localised energy solutions is evident in statement 23, as is aversion to
large-scale options such as coal (37) and nuclear.
This aversion to large-scale solutions also manifests in a strong desire for change to the
energy system and a willingness to endure some impact on lifestyle to achieve this (39).
Discourse A includes a strongly held perception that there are fundamental problems with the
existing energy system (3) and communicates a robust desire for a different approach; and
adoption of a wider set of solutions to reducing GHG emissions than technological ones. This
includes much more experimentation with renewables, particularly at the local level,
reviewing energy pricing to reflect costs of pollution (14), and active measures to reduce
energy demand.
Page F.4

No. Statement A B C D E
5 Combining technologies in the energy sector is a much more promising and more productive approach than relying on a single approach.
5 4 5 2 -1
45 Coal-powered energy needs to be minimised because of its high greenhouse gas emissions. 5 3 3 -1 -1
14 If the cost of greenhouse gas emissions is factored in, the cost of renewables compared to coal isn't so big. 4 1 -1 -1 -1
15 Reducing our reliance on oil would be good for the economy and the environment. 4 2 2 -1 2
7 Governments must fund new infrastructure investment in the face of uncertainty in the economics of energy technologies. 3 3 3 1 3
24 Energy is going to get costly so we had better start investing in alternatives. 3 3 2 -3 3
26 I'm not pro-nuclear, I'm not pro-coal, I'm not pro-wind, I'm not pro any kind of generation. I'm pro-energy conservation through changes to our behavioural and design practices.
3 1 4 5 0
32 Prices of alternative energy will fall as technology improves. 3 2 2 -1 3
2 Can we be confident, that if we store CO2 the storage facility is going to hold it forever? That's really the issue. And I don't think anybody can answer that question.
2 0 0 -1 -1
23 Local energy solutions such as wind farms are good for jobs, local economies and tourism. 2 0 1 -1 -2
34 Any return on geosequestration is 15 to 20 years off, whereas the proven technology of renewable energy offers immediate gains. 1 0 -1 -3 3
39 I don’t want the implementation of new energy technologies to disrupt my way of life. -2 -4 1 3 0
13 There is no need to make expensive investments in technological changes within the energy sector. -3 -5 -4 -3 -2
16 Solar power is pointless because it can't guarantee constant supply, for obvious reasons: the sun doesn't always shine. -3 -3 -3 -4 2
19 Nuclear power is a more proven technology than it was 30 years ago. In reality atomic power generation can be a very safe system if designed and operated correctly.
-3 5 0 -1 -3
22 If Australia mines uranium, the country should be able to generate power from it. -3 4 0 3 0
17 Nuclear has a few dangers, but they're trivial compared with the dangers of emitting greenhouse gases and letting global warming happen.
-4 5 -3 1 -2
28 Australia spends too much on research and development in energy technologies. -4 -5 -5 -4 -5
29 Nuclear is the inevitable replacement for old hydrocarbon technology. It is cost-competitive with coal and will co-generate potable water and hydrogen also at socially acceptable costs.
-5 3 -4 -1 -2
31 Climate change considerations have no role in the development of national and global energy policies. -5 -4 -5 -5 -1
Distinguishing statements = 95% level = 99% level
Table F.2. Statements Associated with Discourse A
Discourse B. Centralised Energy Generation
Discourse B is most strongly associated with emphasis on centralised generation and
distribution of energy, and technologically intensive approaches to greenhouse gas
reduction. It is consistent with a high degree of faith in large scale solutions and the expertise
and policy and regulatory systems that implement them. Although there is sympathy for
alternative energy solutions such as renewables, this is tempered by a belief that they are
not reliable enough to supply a large proportion of energy needs.
Table F.3 shows that both Discourse A and Discourse B share a strong concern about
greenhouse gas emissions, with the latter exhibiting an even stronger preparedness to
accept some disruption to current lifestyles to address the threat of climate change.
Page F.5

However, the preferred approach for doing so differs strongly. Where Discourse A seeks
emission cuts via a new generation of mainly small-scale technologies, Discourse B is more
technologically conservative. The emphasis here is on ‘big ticket’ off-the-shelf solutions that
can be readily implemented and can guarantee a desired level of emission cuts. Given these
parameters, the obvious choice is nuclear power, which is seen as a proven technology (19),
cost competitive (29) and uses a fuel that is mined in Australia anyway. Although it may bring
incipient risks, it is a far lesser evil than global warming (17).
No. Statement A B C D E
19 Nuclear power is a more proven technology than it was 30 years ago. In reality atomic power generation can be a very safe system if designed and operated correctly.
-3 5 0 -1 -3
17 Nuclear has a few dangers, but they're trivial compared with the dangers of emitting greenhouse gases and letting global warming happen.
-4 5 -3 1 -2
5 Combining technologies in the energy sector is a much more promising and more productive approach than relying on a single approach.
5 4 5 2 -1
22 If Australia mines uranium, the country should be able to generate power from it. -3 4 0 3 0
45 Coal-powered energy needs to be minimised because of its high greenhouse gas emissions. 5 3 3 -1 -1
7 Governments must fund new infrastructure investment in the face of uncertainty in the economics of energy technologies. 3 3 3 1 3
24 Energy is going to get costly so we had better start investing in alternatives. 3 3 2 -3 3
41 Renewable sources do not have the potential to meet our future energy needs as they stand. -1 1 4 -3 -5
29 Nuclear is the inevitable replacement for old hydrocarbon technology. It is cost-competitive with coal and will co-generate potable water and hydrogen also at socially acceptable costs.
-5 3 -4 -1 -2
6 Energy technologies such as nuclear power and geosequestration are too risky. It’s better to improve the technologies that we already have.
1 -3 -2 -1 1
4 Many big ticket solutions to energy problems that we don’t understand are just too risky. 0 -3 0 -3 5
43 Apart from coal, natural gas is the only other potentially reliable source of power for the state. -2 -3 -3 1 -4
16 Solar power is pointless because it can't guarantee constant supply, for obvious reasons: the sun doesn't always shine. -3 -3 -3 -4 2
39 I don’t want the implementation of new energy technologies to disrupt my way of life. -2 -4 1 3 0
31 Climate change considerations have no role in the development of national and global energy policies. -5 -4 -5 -5 -1
13 There is no need to make expensive investments in technological changes within the energy sector. -3 -5 -4 -3 -2
28 Australia spends too much on research and development in energy technologies. -4 -5 -5 -4 -5
Distinguishing statements = 95% level = 99% level
Table F.3. Statements Associated with Discourse B
Though it is heavily emphasised, it would be a mistake to overemphasise Discourse B as
solely focused on nuclear power. The discourse does not discount the use of other
technologies and is associated with a portfolio approach, whereby a suite of technologies is
simultaneously adopted (5). Its main focus is with definitive solutions to the problem of
climate change. Large, centralised technologies are intuitively appealing to this group, which
is consistent with the existing system, somewhat viewed as both sustainable and cost
Page F.6

effective (3). Nuclear power appears to be consistent with this centralised approach, as well
as being the most definitive solution of all.
Discourse C: Orderly Transition
Discourse C overlaps heavily with both Discourse A and Discourse B (see Table F.4). It
shares with them a strong concern about climate change (31); the need to adopt of portfolio
approach (5); and a belief in a strong role for government in addressing greenhouse gas
reduction (7, 28). With Discourse B it shares a higher propensity toward investment in
expensive technologies (read large-scale) to reduce greenhouse gas emissions (13). The
overlap is stronger with Discourse A. In contrast to Discourse B, Discourse A and Discourse
C share scepticism about the use of nuclear power (29, 17) and greater emphasis on
achieving emission reductions through behavioural and design changes (36).
Where Discourse C stands alone from Discourse A and Discourse B is in relation to greater
need to see immediate action to reduce greenhouse gas emissions, to extent that it is willing
to explore uncertain options, such as Carbon Capture and Storage (36) which may provide
an interim solution that is consistent with existing technologies, giving longer term solutions
time to be rolled out. There is also a strong perception that existing renewable energy
technologies cannot meet future energy needs (41) but are a longer term solution.
Page F.7

No. Statement A B C D E
5 Combining technologies in the energy sector is a much more promising and more productive approach than relying on a single approach.
5 4 5 2 -1
36 The urgency of addressing greenhouse emissions cannot stay on back burner for too much longer. So we need to find a solution quickly, such as CO2 capture and storage.
2 2 5 2 1
26 I'm not pro-nuclear, I'm not pro-coal, I'm not pro-wind, I'm not pro any kind of generation. I'm pro-energy conservation through changes to our behavioural and design practices.
3 1 4 5 0
41 Renewable sources do not have the potential to meet our future energy needs as they stand. -1 1 4 -3 -5
45 Coal-powered energy needs to be minimised because of its high greenhouse gas emissions. 5 3 3 -1 -1
7 Governments must fund new infrastructure investment in the face of uncertainty in the economics of energy technologies. 3 3 3 1 3
44 Using biomass from crops has significant expansion potential and would be good for the rural industry. 1 1 3 1 2
42 Renewables are part of the long-term solution, but for the foreseeable future, they just can't do the job. -1 1 3 -1 -2
9 Wind power has its downsides it is highly visible and can kill birds. The fact is though, that any man-made structure can kill birds. 2 1 0 -5 2
17 Nuclear has a few dangers, but they're trivial compared with the dangers of emitting greenhouse gases and letting global warming happen.
-4 5 -3 1 -2
12 Any tax to reduce greenhouse gas emissions will have a detrimental economic effect on the nation. -2 -2 -3 -1 1
43 Apart from coal, natural gas is the only other potentially reliable source of power for the state. -2 -3 -3 1 -4
16 Solar power is pointless because it can't guarantee constant supply, for obvious reasons: the sun doesn't always shine. -3 -3 -3 -4 2
29 Nuclear is the inevitable replacement for old hydrocarbon technology. It is cost-competitive with coal and will co-generate potable water and hydrogen also at socially acceptable costs.
-5 3 -4 -1 -2
13 There is no need to make expensive investments in technological changes within the energy sector. -3 -5 -4 -3 -2
31 Climate change considerations have no role in the development of national and global energy policies. -5 -4 -5 -5 -1
28 Australia spends too much on research and development in energy technologies. -4 -5 -5 -4 -5
Distinguishing statements = 95% level = 99% level
Table F.4. Statements Associated with Discourse C
Where Discourse B latches onto dramatic, but proven solutions, Discourse C adopts a more
incremental approach. It is more sensitive to lifestyle and economic disruption than
Discourse B, being concerned about potential disruption (39). In this respect there is concern
that renewable energies cannot achieve this central goal (41), although it is quite possible, if
not likely, that they will do so in the future (42). Rather than stepping off the deep end with
unproven technologies, adherents of Discourse D would prefer approaches that evolve the
existing system, which is seen as relatively viable (3); but where Discourse B looks to
nuclear power, Discourse C is very sceptical about this approach (29), which, unlike
renewables, is not widely viewed as having an acceptable risk (17).
The solution as to what to do about greenhouse gas emissions is addressed by Discourse C
by adopting something similar to a portfolio approach (5), but one in which the mix of
technologies is distributed through time, beginning incrementally with modest changes to the
system and evolving toward more enduring changes as alternative technologies develop.
Coal is viewed as a fuel whose use should ultimately be minimised (45); but it is also a
Page F.8

somewhat cheap and reliable energy source (37). Given that something needs to be done
quickly about greenhouse gas emissions, it might be better to first do what is both practical
and possible by adopting Carbon Capture and Storage (36), which performs relatively well
against renewables (34) with the bonus of ensuring a secure energy supply in the medium
term. Doing so provides some breathing space to both develop alternatives and shift in
behavioural and design practices (26) that can underpin a low-carbon energy future.
Discourse D: Technologically Conservative
Discourse D represents a potentially spirited defence of Australia’s energy policy system
(25). It is the most technologically-conservative and price-sensitive of the discourses.
Instead, greater emphasis is placed on behaviour and demand to reduce greenhouse gas
emissions.
This discourse contrasts strongly with Discourse A and Discourse B on the issues
concerning lifestyle/certainty of supply and concern for greenhouse gas emissions. All the
discourses want something done, to varying degrees. Discourse D would like any measures
to involve minimum fuss and least expense. It is satisfied to a greater extent than the other
discourses with how things are, and would like to keep it that way.
Although Discourse D is conservative, it is not associated with blind faith. There is very
strong cynicism about the role of experts. Rather than acting in the public interest, many are
seen as overstating technological benefits and pushing particular energy solution (20) out of
self-interest. However, rather than provoke interest in debate about energy technologies,
there is disengagement with the issue, possibly because of perceived complexity.
Paradoxically, this means that there is a tendency to defer to the very experts in whom this
trust is lacking (8).
Page F.9

No. Statement A B C D E
26 I'm not pro-nuclear, I'm not pro-coal, I'm not pro-wind, I'm not pro any kind of generation. I'm pro-energy conservation through changes to our behavioural and design practices.
3 1 4 5 0
20 It is very hard to trust all these so-called experts arguing for one energy technology or another, especially when they, or their bosses, are just in it to make money.
0 0 1 5 1
1 Reducing greenhouse gases should not mean prices have to go up. 0 -1 -2 4 0 8 Energy technologies are pretty complex, so I leave it to the experts. -2 -2 -2 4 1 27 Environmental, reliability and cost issues will limit the adoption of
large-scale of certain renewable technologies. 0 0 1 3 2 37 We need coal because it is a cheap and reliable energy source. -2 -2 1 3 -3 39 I don’t want the implementation of new energy technologies to disrupt
my way of life. -2 -4 1 3 0
22 If Australia mines uranium, the country should be able to generate power from it. -3 4 0 3 0
35 The petroleum age is far from over, we will still be able to keep finding more oil. -1 -2 -2 2 -3
17 Nuclear has a few dangers, but they're trivial compared with the dangers of emitting greenhouse gases and letting global warming happen.
-4 5 -3 1 -2
43 Apart from coal, natural gas is the only other potentially reliable source of power for the state. -2 -3 -3 1 -4
4 Many big ticket solutions to energy problems that we don’t understand are just too risky. 0 -3 0 -3 5
13 There is no need to make expensive investments in technological changes within the energy sector. -3 -5 -4 -3 -2
18 Fuzzy-headed thinking about alternative energy sources seems not to appreciate the need for certainty of supply and excess capacity to keep economies growing.
-1 0 -1 -3 5
24 Energy is going to get costly so we had better start investing in alternatives. 3 3 2 -3 3
25 Australia doesn't support alternative energy opportunities. Industry comes along and says, 'Have I got something for you' (such as carbon sequestration, or a new power station) and they get government subsidies to do it.
1 0 -1 -3 0
34 Any return on geosequestration is 15 to 20 years off, whereas the proven technology of renewable energy offers immediate gains. 1 0 -1 -3 3
41 Renewable sources do not have the potential to meet our future energy needs as they stand. -1 1 4 -3 -5
3 Our present energy system is so cheap precisely because it is unsustainable. 2 -1 -2 -3 1
38 Geothermal or hot rock technology will provide a reliable and unlimited and cheap energy source. 0 -2 -1 -3 -1
16 Solar power is pointless because it can't guarantee constant supply, for obvious reasons: the sun doesn't always shine. -3 -3 -3 -4 2
28 Australia spends too much on research and development in energy technologies. -4 -5 -5 -4 -5
9 Wind power has its downsides it is highly visible and can kill birds. The fact is though, that any man-made structure can kill birds. 2 1 0 -5 2
31 Climate change considerations have no role in the development of national and global energy policies. -5 -4 -5 -5 -1
Distinguishing statements = 95% level = 99% level
Table F.5. Statements Associated with Discourse D
These combinations of low trust in experts and technological apprehension go a long way
towards explaining technological conservatism. Individuals loaded on Discourse D can do
without obsessing about technological solutions; but there is still a desire to do something
about greenhouse gas emissions (31, 36) — though somewhat less so than Discourse A and
Discourse B (and more so than Discourse E).
In developing a technologically conservative position, the logic behind Discourse D appears
to work as follows: it is difficult to comprehend and/or trust new technological horizons; the
Page F.10

current energy system is more or less sound as it stands; negative impacts on lifestyle
should be avoided (39); and therefore greenhouse gas reductions should be made on the
margins rather than at the core of the system, through behaviour and design practices (26).
Thus, as for Discourse C, in Discourse D we have a cautious approach to reducing
greenhouse gas emissions; one which involves minimal disruption. It is in favour of
approaches such as Carbon Capture and Storage (34); but neither to the same extent as
Discourse C, nor with the same evolutionary thinking involved. Although there are no direct
statements covering the issue, it is a position that would be consistent with the ‘adapt’ rather
than ‘mitigate’ perspective in climate change debates.
Although exponents of Discourse D do not want (or perhaps feel capable enough) to sort out
the rhetoric from reality on what should be done, climate change is clearly an important issue
(31). So, despite much cynicism, there is emphasis on finding someone trustworthy who can.
This is perhaps why, in common with most of the other discourses, Discourse D strongly
favours increased public expenditure on R&D (28) — perhaps as opposed to private industry
research on solutions.2 Doing so may be seen as a way of facilitating more certainty, or at
least trust in the messenger. With renewed confidence in the system they can then enjoy
minimal disruption while dealing with the issue of greenhouse gas emissions.
Discourse E – Radically Alternative
Discourse E is a marginal (very small) factor with a strong dislike for large-scale technologies
and in favour of radically different thinking in respect to finding energy solutions. It could be
most easily summarised as a very optimistic version of Discourse A, with a much strong
tendency to embrace alternative technologies.
As for Discourse D, Discourse E also has a number of contradictions. It embodies dislike for
large-scale initiatives, manifestly due to incipient risks (4). There is also a mild aversion to
adopting a portfolio approach (5). These characteristics appear to give rise to tendency
toward a ‘go for broke’ approach, technologically speaking (33), supporting early stage or as
yet largely unproven approaches to reducing greenhouse gas emissions, but also a very
strong emphasis on ‘keeping the lights on’ (18).
2 Although there is no direct evidence of this and it contradicts the desire to minimise the tax burden.
Page F.11

No. Statement A B C D E
4 Many big ticket solutions to energy problems that we don’t understand are just too risky. 0 -3 0 -3 5
18 Fuzzy-headed thinking about alternative energy sources seems not to appreciate the need for certainty of supply and excess capacity to keep economies growing.
-1 0 -1 -3 5
11 Australia should turn more attention to biomass energy sources because it is CO2 neutral (the carbon dioxide used by the growing plants is released when they are burned).
1 -1 2 1 4
33 The limited strategic and technical insight that is so entrenched in Australia is limiting the development of innovative energy technologies.
1 2 0 2 3
7 Governments must fund new infrastructure investment in the face of uncertainty in the economics of energy technologies. 3 3 3 1 3
32 Prices of alternative energy will fall as technology improves. 3 2 2 -1 3 24 Energy is going to get costly so we had better start investing in
alternatives. 3 3 2 -3 3
34 Any return on geosequestration is 15 to 20 years off, whereas the proven technology of renewable energy offers immediate gains. 1 0 -1 -3 3
8 Energy technologies are pretty complex, so I leave it to the experts. -2 -2 -2 4 1
5 Combining technologies in the energy sector is a much more promising and more productive approach than relying on a single approach.
5 4 5 2 -1
31 Climate change considerations have no role in the development of national and global energy policies. -5 -4 -5 -5 -1
37 We need coal because it is a cheap and reliable energy source. -2 -2 1 3 -3 35 The petroleum age is far from over, we will still be able to keep
finding more oil. -1 -2 -2 2 -3
19 Nuclear power is a more proven technology than it was 30 years ago. In reality atomic power generation can be a very safe system if designed and operated correctly.
-3 5 0 -1 -3
30 You could have a wind farm across all of the outback that would kill every kookaburra, but it wouldn't provide the baseload power we need.
-1 -1 0 -1 -3
43 Apart from coal, natural gas is the only other potentially reliable source of power for the state. -2 -3 -3 1 -4
40 Natural gas is the bridging fuel between the oil economy and the hydrogen economy. 0 2 2 -1 -4
41 Renewable sources do not have the potential to meet our future energy needs as they stand. -1 1 4 -3 -5
28 Australia spends too much on research and development in energy technologies. -4 -5 -5 -4 -5
Distinguishing statements = 95% level = 99% level
Table F.6. Statements associated with Discourse E
These apparent contradictions are reconciled by a strong faith in existing niche technologies
and their ability to meet energy demands (30): there simply has not been the insight and will-
power to make it happen (33). ‘Fuzzy-headed thinking’ about renewable technologies in
relation to statement 18 appears here to mean ‘too small-picture’ in both scale and
technological possibilities rather than unrealistic.
Meanwhile, it is perceived that we are currently chasing risky and uncertain investments,
such as Carbon Capture and Storage (34) to prop up an unsustainable energy system (3),
which is going to get expensive (24) when viable alternatives, such as biomass (11) are
readily available.
Although there are few strong adherents of Discourse E among the participants, they tended
to be reasonably emphatic in their positions. However, emphatic need not be constant, when
Page F.12

ardent positions can be transformed by deliberation, just as they change in public discourse
as information and circumstances change.
Overlap between factors
Table F.7 shows the correlation between the factors. There is a significant level of overlap
between the discourses, which is a result of the way in which they were extracted (i.e. to
maximise the ability to explain differences in technology priorities). 3
A B C D E A 40 67 14 36 B 40 60 23 7 C 67 60 41 17 D 14 23 41 -5 E 36 7 17 -5 Average 39 33 46 18 14
Table F.7. Correlations between Discourses (x100)
The overlap between the factors is schematically represented in Figure F.1, where the
discourses are represented by spheres that contain representative statements, paraphrased
from the Q survey. Together these statements represent the ‘story’ told by that particular
discourse. Most of these statements are not unique to any particular discourse; in some
cases different factors yield similar factor scores. Where this is the case, the statement is
located in the overlap between spheres.
The size of the spheres roughly reflects the overall level of ‘agreement’ with that discourse
among all the participants discourse across all three stages of the deliberative process.
3 The technical term for distinct or uncorrelated factors is orthogonality, as opposed to oblique or related factors (discourses)
(see Brown, 1980, p.163; Burt, 1940). That there are similarities between the discourses does not mean that they are not useful in describing differences among different discourse types. It is useful to highlight these similarities, not least because it is possible to use the description of one to contrast with another, thereby leading to a better understanding of both.
Page F.13

Figure F.1. Factor Description Diagram
Page F.14

Appendix G: Analysis of the Technology Assessment Exercise
Technology Priority Exercise
Raw Data A Technology Priority Exercise (TPE) was undertaken in all three Citizens’ Panels.
The results illustrated in Figure G.1 show the aggregated technology priority rankings
for each of the Panels at the different stages at which the Technology Priority
Exercise was administered.
Figure G.1 shows Victoria has a much flatter profile across all technologies than the
other States. It also experienced a decline in priority for nuclear power, as well as an
increase for Carbon Capture and Storage (CCS).
Page G.1

WA1
2
3
4
5
6
7
8
9Wind Biomass Coal with CO2
burialHydroelectric
damsNatural Gas Geothermal Solar Nuclear Coal
First Second Third Fourth
NSW1
2
3
4
5
6
7
8
9Wind Biomass Coal with CO2
burialHydroelectric
damsNatural Gas Geothermal Solar Nuclear Coal
First Second Third Fourth
VIC1
2
3
4
5
6
7
8
9Wind Biomass Coal with CO2
burialHydroelectric
damsNatural Gas Geothermal Solar Nuclear Coal
Pre First Second Third
Ave
rage
Tec
hnol
ogy
Pri
orit
y (i
ncre
ased
pri
orit
y)
Figure G.1. Average Technology Priority Ranks
Page G.2

To gain an appreciation of the differences in the spread of technology priorities
between the panels, Figure G.2 shows a box-plot graph of the Technology Priority
Exercise data for each State.
Figure G.2. Box-plots of ranking data
Figure G. 2 shows that in the Victorian panel, the increase in priority given to Carbon
Capture and Storage was not uniform among participants. By contrast, the low
Page G.3

priority given to nuclear power at the end of the panel process is almost unanimous,
apart from one outlier. This contrasts with an increase for nuclear power in WA and,
to a lesser extent NSW, which is far from uniform. There is reasonable consistency in
the high ranking for solar (except in Victoria) and low rank for coal.
The resulting priorities for each of the technologies have been converted into
aggregate ranks, shown in Table G.1, which reflects the abovementioned trends in
the data.
Pre First Second Third Fourth
TECHNOLOGY WA Wind - 2 2 2 2 Biomass - 6 6 7 4 CCS - 7 7 6 7 Hydro - 5 5 8 8 Natural Gas - 3 3 3 3 Geothermal - 4 4 5 6 Solar - 1 1 1 1 Nuclear - 8 8 4 5 Coal - 9 9 9 9
NSW Wind - 2 4 3 4 Biomass - 7 6 5 5 CCS - 8 5 6 6 Hydro - 5 8 8 8 Natural Gas - 4 2 2 3 Geothermal - 3 7 7 7 Solar - 1 1 1 1 Nuclear - 6 3 4 2 Coal - 9 9 9 9
VIC Wind 3 3 2 3 Biomass 2 2 3 1 CCS 8 9 6 4 Hydro 5 6 5 6 Natural Gas 6 4 4 5 Geothermal 4 5 7 7 Solar 1 1 1 2 Nuclear 7 7 8 9 Coal 9 8 9 8
Table G.1. Technology Priority Exercise Aggregate Ranks
Changes in Rank during Panel Process Figure G.3 shows the average change in rank for each technology used in the
Technology Priority Exercise across all participants in each State, with the 95%
confidence interval shown. For each State, there was a tendency towards little
Page G.4

change for technologies that began with an overall high or low rank, such as wind
and solar at the high end (although solar declined substantially between the pre and
third survey in the case of Victoria, see Figure G.2), and coal at the low end.
-3
-2
-1
0
1
2
3
4
Wind Biomass CCS Hydro Natural Gas Geothermal Solar Nuclear Coal
Ave
rage
rank
cha
nge
(incr
ease
)
WA NSW VIC
Figure G.3. Average change in rank before and after panel
Two main features distinguishing WA and NSW from the later Victorian panel are
noteworthy. Nuclear power has increased in priority in WA and NSW (not significantly
in the latter case), but decreased in the case of Victoria. Conversely, Carbon Capture
and Storage has increased much more in Victoria.
Technology assessment criteria
Criteria Weights As part of the Technology Assessment Exercise participants from each State
completed a survey ranking the criteria developed as part of the mind mapping
exercise. Figure G.4 shows the aggregate results for the weighting exercise
conducted by participants in which the criteria were ranked in order of importance.
The table shows the average rank for each of the criteria as well as the aggregate
rank across all participants. Overall, criterion A (reduction of greenhouse gas
emissions) was clearly the first in priority for both the WA and NSW panels. Other
environmental impacts (B) also tended to rank highly, followed by reliability (D), costs
(C), social impact (F), innovations (E) and political power and regulation.
Page G.5

1
2
3
4
5
6
7
8A. Greenhousegas emissions
B. Otherenvironmental
impacts
C. Costs andeconomics
D. Reliabilityand resourcesustainability
E. Innovationand
implementation
F. Social impact G. Politicalpower andregulation
Criteria
WA NSW Victoria
Figure G.4. Average Criteria Weight, State Comparison1
There are some notable differences between the States. Reliability and resource
sustainability (criteria D) is significantly more important for the NSW group than the
other States, with a lower (not statistically significant) emphasis on costs and
economics (C). Other notable, but not significant, differences include a higher
emphasis on social impact (F) and lower concern with innovation and implementation
(E) in Victoria.
Criteria Assessments As well as providing a weighting for each of the criteria, participants were asked as
part of the Technology Assessment Exercise to evaluate each technology against the
criteria and provide a score indicating how well they thought it performed. The results
of this exercise are shown for each technology in Figure G.5, with separate results
for each panel. Interestingly, there is relatively strong agreement among the panels in
respect to many of the technologies. Small exceptions to this trend include higher
resource reliability for Carbon Capture and Storage and solar (as well as for criteria C
and E) in WA. Nuclear shows a decreasing score for reliability and sustainability (D)
and social impact (F) from WA through to NSW and Victoria, with the latter panel also
providing a lower score for environmental impact (B). The Victorian panel also
provided higher scores for biomass on criteria A, B and E.
1 Criteria G (Political Power and Regulation) did not emerge as part of the mind-mapping exercise in WA, so was not
included in the survey. However, this dimension did feature prominently in group discourse and, had the mind-mapping occurred toward the end of the process, would conceivably have featured strongly among the criteria.
Page G.6

Wind
0
1
2
3
4
5
A. GreenhouseGas Emissions
B. EnvironmentalImpact
C. Costs andEconomics
D. Reliability andResource
Sustainability
E. Innovation andImplementation
F. Social Impact G. Political Powerand Regulation
WA NSW VIC
Biomass
0
1
2
3
4
5
A. Greenhouse GasEmissions
B. EnvironmentalImpact
C. Costs andEconomics
D. Reliability andResource
Sustainability
E. Innovation andImplementation
F. Social Impact G. Political Powerand Regulation
WA NSW VIC
A
vera
ge r
atin
g ag
ains
t ea
ch c
rite
rion
(hi
gher
rat
ing)
CCS
0
1
2
3
4
5
A. GreenhouseGas Emissions
B. EnvironmentalImpact
C. Costs andEconomics
D. Reliability andResource
Sustainability
E. Innovation andImplementation
F. Social Impact G. Political Powerand Regulation
WA NSW VIC
Page G.7

Hydro
0
1
2
3
4
5
A. GreenhouseGas Emissions
B. EnvironmentalImpact
C. Costs andEconomics
D. Reliability andResource
Sustainability
E. Innovation andImplementation
F. Social Impact G. Political Powerand Regulation
WA NSW VIC
Geotherma
0
1
2
3
4
5
A. GreenhouseGas Emissions
B. EnvironmentalImpact
C. Costs andEconomics
D. Reliability andResource
Sustainability
E. Innovation andImplementation
F. Social Impact G. Political Powerand Regulation
WA NSW VIC
Natural Gas
0
1
2
3
4
5
A. GreenhouseGas Emissions
B. EnvironmentalImpact
C. Costs andEconomics
D. Reliability andResource
Sustainability
E. Innovation andImplementation
F. Social Impact G. Political Powerand Regulation
WA NSW VIC
A
vera
ge r
atin
g ag
ains
t ea
ch c
rite
rion
(hi
gher
rat
ing)
Page G.8

Solar
0
1
2
3
4
5
A. GreenhouseGas Emissions
B. EnvironmentalImpact
C. Costs andEconomics
D. Reliability andResource
Sustainability
E. Innovation andImplementation
F. Social Impact G. Political Powerand Regulation
WA NSW VIC
Nuclear
0
1
2
3
4
5
A. GreenhouseGas Emissions
B. EnvironmentalImpact
C. Costs andEconomics
D. Reliability andResource
Sustainability
E. Innovation andImplementation
F. Social Impact G. Political Powerand Regulation
WA NSW VIC
Coal
0
1
2
A
vera
ge r
atin
g ag
ains
t ea
ch c
rite
rion
(hi
gher
rat
ing)
3
4
5
A. GreenhouseGas Emissions
B. EnvironmentalImpact
C. Costs andEconomics
D. Reliability andResource
Sustainability
E. Innovation andImplementation
F. Social Impact G. Political Powerand Regulation
WA NSW VIC
Figure G.5. Average criteria rating for each technology, by State
Page G.9

Aggregate Technology Assessment Scores The aggregate results shown in Figure G.6 were calculated by averaging the score
for each technology across all participants in each State. The individual scores were
obtained by S =(Sc −1)
(Wc × 4)m∑ ×100⎛
⎝ ⎜
⎞
⎠ ⎟ m , where m is the number of criteria (c) and
the maximum score (Sc) that a technology can gain for a particular criterion is 5 so
that the result reflects the percentage of the maximum possible aggregate score.
0
5
10
15
20
25
30
35
Wind Biomass CCS Hydro NGas Geothermal Solar Nuclear Coal
Technology
WA NSW VIC
Figure G.6. Average Aggregate Score for each technology, by State
Table G.2 shows the technology ranks implied from the aggregate scores shown in
Figure G.6. The small differences in assessment scores indicate that there are no
statistically significant differences between the three panels. However there are clear
differences between technologies, with solar consistently scoring highly, particular in
WA and coal scoring poorly.
WA NSW VIC Wind 2 3 2 Biomass 8 7 4 CCS 7 8 8 Hydro 3 5 1 NGas 6 4 5 Geothermal 4 6 6 Solar 1 1 3 Nuclear 5 2 7 Coal 9 9 9
Table G.2. Technology Assessment Aggregated Ranks
Page G.10

Comparison of the results of the technology priority exercise and the technology assessment exercise The results from these exercises are in no way representative of any societal
preferences as they were determined from a small scale process focussed
specifically on how perspective change, not what they are. However, these results
provide insight into the dynamics of these priorities as they might evolve as part of
unfolding energy futures, thus affecting technology acceptance. Any differences
between the results from the Technology Priority Exercise and the Technology
Assessment Exercise help us to understand how these dynamics are shaped by the
experiences that precede them.
In aggregate there is a reasonable level of similarity between the Technology Priority
Exercise and Technology Assessment Exercise. Table G.3 shows the resulting
priority ranks from the Technology Priority Exercise compared to the ranks inferred
from the aggregate scores from the Technology Assessment Exercise. The most
notable differences are in the ranking of hydroelectricity (which tends to rank more
highly in Technology Assessment Exercise in all three States) and Carbon Capture
and Storage (which tends to rank higher in the Technology Priority Exercise,
particularly for the latter stages in NSW and Victoria. Natural gas also ranks much
lower in the WA Technology Assessment Exercise than for all the Technology Priority
Exercise’s.
Page G.11

Aggregate Technology Priority Exercise
Pre First Second Third Fourth TAE WA Wind 2 2 2 2 2 Biomass 6 6 7 4 8 CCS 7 7 6 7 7 Hydro 5 5 8 8 3 Natural Gas 3 3 3 3 6 Geothermal 4 4 5 6 4 Solar 1 1 1 1 1 Nuclear 8 8 4 5 5 Coal 9 9 9 9 9 NSW Wind 2 4 3 4 3 Biomass 7 6 5 5 7 CCS 8 5 6 6 8 Hydro 5 8 8 8 5 Natural Gas 4 2 2 3 4 Geothermal 3 7 7 7 6 Solar 1 1 1 1 1 Nuclear 6 3 4 2 2 Coal 9 9 9 9 9 VIC Wind 3 3 2 3 2 Biomass 2 2 3 1 4 CCS 8 9 6 4 8 Hydro 5 6 5 6 1 Natural Gas 6 4 4 5 5 Geothermal 4 5 7 7 6 Solar 1 1 1 2 3 Nuclear 7 7 8 9 7 Coal 9 8 9 8 9
Table G.3. Comparison of Aggregate Ranks between Technology Priority Exercise and Technology Assessment Exercise
However, the individual data indicates strong differences at the individual level, which
vary between the different deliberative stages. Figure G.7 shows the relationship
between individual results, by way of correlation coefficient, between participant’s
Technology Priority Exercise results at different stages to the aggregate Technology
Assessment Exercise ranks (Figure F.8 shows the same, but in a more condensed
format for comparison between panels).
Page G.12

Page G.13
WA
0.0
0.2
0.4
0.6
0.8
NSW
0.0
0.2
0.4
0.6
0.8
VIC
0.0
0.2
0.4
0.6
0.8
Overall
0.0
0.2
0.4
0.6
0.8
Pre Stage 1 Stage 2 Stage 3 Follow up
Cor
rela
tion
wit
h A
ggre
gate
d T
echn
olog
y A
sses
smen
t Exe
rcis
e R
ank
Figure G.7. Relationship between Technology Priority Exercise and Technology Assessment Exercise results (by State)

0.0
0.2
0.4
0.6
0.8
WA NSW VIC OverallState
Stage 1 Stage 2 Stage 3
Figure G.8. Relationship between Technology Priority Exercise and Technology Assessment Exercise results
The 95% error bars shown in Figure G.6 suggests that there is no systematic
relationship between the results of the Technology Priority Exercise and the multi-
criteria based Technology Assessment exercise, even where the results for all three
panels are combined in Figure G.8. In other words, it is not possible to definitively
associate the Technology Assessment Exercise results with any particular level of
deliberation. However, in the absence of statistical significance there is a clear trend
with increasing correlation up to the second Technology Priority Exercise, followed by
a decline.
Interestingly, the relationship between the Technology Assessment Exercise and the
Technology Priority Exercise at Stage 3 declines with successive panels, being
highest in WA and lowest in Victoria. Although there is no definitive evidence, this
may reflect the additional time given to deliberation after the Technology Assessment
Exercise was completed in NSW, and even more in Victoria. Whether or not this is
the case still leaves the question about which results provide a better guide to the
technology priorities of participants.
To answer this question it is necessary to dig a little deeper into both the data and
the concept of what it means to deliberate. When talking about deliberation there is
an assumption that the resulting preferences of individuals should be more
Page G.14

reasonable, or more based on reflection (incomplete preference construction: Slovic
1995) would occur where affinity with a particular discourse has not been properly
translated into technological preferences.
The other occurs where the underlying values and beliefs that comprise the
underlying attitudes are themselves not yet fully formed — as would occur if there
were insufficient information. To be sure, there is a significant question regarding
whether this process can ever be complete. This is not least because of epistemic
limitations on the certainty of knowledge, which mean that expectations of complete
consensus are usually unreasonable (Dryzek and Niemeyer 2006). However, the
incomplete preference construction hypothesis can be tested (partially) by using
inter-subjective comparisons where any two participants with a similar Q-sort should
also have similar technology preferences.
The result of this analysis is shown in Figure G.9 for each of the panels at four
different stages in the process.2 Each scatter-plot depicts the consistency in
agreement between Q sorts and Technology Priority Exercise ranks. The individual
points represent the Q sort correlation of individual pairs of participants (on the x-
axis) plotted against their Technology Priority Exercise correlation at that particular
stage of the process. The regression (straight) line and its 95% limits (curved lines)
are also shown, as is the overall correlation coefficient (Pearson) in the lower right
hand side of each graph.
The strength of the relationship between Q and Technology Priority Exercise results
can be seen from both the slope of the regression line, the narrowness of the 95%
regression contours and, most importantly, the size of the correlation coefficient. In
terms of individual plots, this relationship is reflected in the extent to which the data
points converge toward the regression line. In addition, the overall level of consensus
can also be gauged from the position of the plots. Greater consensus among the Q
sorts results in a shift of the plots to the right, and toward the top in the case of
Technology Priority Exercise ranks.
.
2 It was not possible to do this analysis for the ‘pre’ data for the Victorian panel because no Q sort was performed at
the same time as the Technology Priority Exercise.
Page G.15

Figure G.9. Inter-subjective relationships between underlying attitudes (Q sort) and resulting preferences
Page G.16

The results in Figure G.9 show a clear improvement in the Q-Technology Priority Exercise
relationship between stages 1 (pre-deliberation) and 3 (post-deliberation). A similar pattern of
improvement can be seen in both WA and NSW (from 0.16 in both cases to 0.42 and 0.49
respectively).
The magnitude of improvement is similar for Victoria, but beginning from a much higher
correlation pre-deliberation (0.30) to reach 0.60. This may reflect a particular design
difference for the Victorian panel, where participants performed a ‘pre’ Technology Priority
Exercise survey and were provided with a limited amount of information about different
energy technologies to prepare them for the citizens’ panel. This may have caused some
pre-process reflection about their respective positions regarding energy technologies and
construction of preferences. By contrast, the WA and NSW participants arrived at the
process ‘cold’, not having been giving prior information. For those participants who had not
previously encountered the relevant issue, this would have increased the chances of
measuring un-constructed preferences based on ‘non-attitudes’ (Converse 1970)
The Q-Technology Priority Exercise relationship becomes curious at the second (middle)
stage of deliberation, particularly in the case of WA, where the correlation coefficient
decreases to -0.11.
Page G.17

Annex 1 – Review of CSIRO Citizens Panel Process (Victoria): A Futures Experience. Dr Kristen Alford, Director, Bridges8
Page E.1

Review of the CSIRO Energy Futures Citizens’ Panel
Kristin Alford Page i
Report
Review of the CSIRO Energy Futures Citizens’ Panel (Victoria): A Futures Experience
Dr Kristin Alford Director, Bridge8 Pty Ltd
Executive summary The Energy Transformed Flagship project at CSIRO was designed to investigate the future of energy technologies addressing issues associated with climate change. As part of this project a number of Energy Futures Citizens’ Panels (EFCPs) were convened to understand community attitudes towards new energy technologies and energy use. The tangible outcomes of the EFCP are to better understand what affects the acceptance of different types of energy technologies and how this changes with awareness. It then becomes possible to develop technologies that are in line with societal values. The Victorian EFCP was held in Melbourne in mid-May 2006. This provided an opportunity to examine the EFCP from a futures thinking perspective. A critical review of the methods and processes adopted in order to engage in futures thinking was undertaken. This included a review of methods against theoretical models that examine strategic foresight, social change and the processes involved in futures exploration. It was interesting to note that in reviewing these methods against the models, the EFCP demonstrated a comprehensive approach to futures thinking. This is commendable given the relative inexperience of the community participants in such an exercise. In addition supplementary methods were undertaken and offered as an extended view of some of the deeper issues affecting community views on the future of energy in Australia. Furthermore, the opportunity to observe a high quality facilitation process provided learnings which are expressed in an analysis of the process and an account of personal experience. It was personally satisfying to be able to experience a futures process; thinking about the approaches and noting varied changes in emotions and responses to the various activities. It is hoped that this report will provide valuable feedback to the CSIRO team on the EFCP process and further insight into the energy issues raised during the EFCP. The report provides a unique perspective for CSIRO energy projects. Acknowledgements Thanks to Dr Kath Fisher and Dr Simon Niemeyer for answering questions about the process and genesis of the Energy Transformed Flagship and Energy Futures Citizens’ Panels and to Naomi Boughen for providing as much information as possible. Thanks to the other EFCP participants for sharing their interests and knowledge. Thanks also to colleagues from the Masters of Science in Strategic Foresight - Foresight Methodologies 1 at Swinburne University for delving into the issues related to nuclear energy in Australia.

Review of the CSIRO Energy Futures Citizens’ Panel
Kristin Alford Page ii
Contents Executive summary ...............................................................................................................................i Acknowledgements ...............................................................................................................................i Figures .................................................................................................................................................ii Tables ..................................................................................................................................................ii 1 Purpose of Report ........................................................................................................................1 2 Context of Energy Futures Citizens’ Panel ...................................................................................1 3 Review of Energy Futures Citizens’ Panel....................................................................................3
3.1 Purpose and foundation........................................................................................................3 3.2 Process methodology ...........................................................................................................4
3.2.1 Inputs ..........................................................................................................................5 3.2.2 Analysis ......................................................................................................................5 3.2.3 Interpretation...............................................................................................................6 3.2.4 Prospection..................................................................................................................6 3.2.5 Outputs .......................................................................................................................7
3.3 Social transformation...........................................................................................................8 4 Supplementary methods ...............................................................................................................9
4.1 Be ridiculous .......................................................................................................................9 4.2 Think deeply........................................................................................................................9 4.3 Include a future voice ........................................................................................................11
5 Process observations ..................................................................................................................12 5.1 Organisation, facilitation and agenda .................................................................................12 5.2 A participant’s perspective.................................................................................................13
6 Conclusions ...............................................................................................................................14 7 References .................................................................................................................................14 Figures Figure 1: Stakeholders and contributions for the Energy Futures Forum 2 Figure 2: Inputs and outcomes for the Energy Futures Forum 2 Figure 3: Strategic landscape for the future 3 Figure 4: The Generic Foresight Process 4 Figure 5: Scenario tree for EFF energy futures 6 Figure 6: Small group for scenario development 7 Figure 7: Small group scenario generation for the future of energy in Australia 7 Figure 8: The Transformative Cycle for energy futures 8 Figure 9: Rich Picturing on a nuclear energy future for Australia 11 Figure 10: EFCP participants at the venue 12 Tables Table 1: An integral approach to process inputs 5 Table 2: Causal Layered Analysis on a nuclear energy future for Australia 10

Review of the CSIRO Energy Futures Citizens’ Panel
Kristin Alford Page 1 of 15
1 Purpose of Report A recent report submitted to the Australian Department of Environment and Heritage indicated that there was a greater risk that global warming could exceed earlier predictions of up 5.8 degrees rise in temperatures by 2100 (‘Global warming may exceed predictions’ 2006; Seffen 2006). A rise of this amount will magnify the impacts of global warming, resulting in an increase in number and severity of heatwaves, increases in cyclone intensity, loss of biodiversity and rising ocean levels. There has never been a more critical time to be examining the future impact of energy generation and energy use on climate change and how that impacts the actions that need to be taken now. An Energy Futures Citizens’ Panel (EFCP) hosted by the Commonwealth Scientific and Industrial Research Organisation (CSIRO) was held to discuss energy futures for Australia. This report provides a review of the process, experience and outcomes from the perspective of a participant in the panel. The purpose of this review is two fold. Firstly, participation in the EFCP provided a valuable futures experience which illuminated foresight methodologies and provided a practical aspect to theoretical learning. Secondly, following discussions with the CSIRO team, it seemed that a review of the process and experience would provide unique feedback which could be useful for their energy research projects, especially those concerning societal interaction. This report looks at the context of the EFCP within the broader CSIRO research agenda. A framework to review the futures methodologies is presented, followed by a discussion of the activities and outcomes against these models. Supplementary methods providing greater insight are considered. Finally a review of the processes and a summary of the experience from a participant’s point of view are offered. The overall objective of the report is to enhance learning about energy futures. 2 Context of Energy Futures Citizens’ Panel The EFCP was conceived by the CSIRO as an opportunity for members of the general community to receive and discuss issues related to energy futures. This was the third panel to be convened with previous panels being conducted in Newcastle and Perth. The Victorian EFCP was held in Melbourne from 11 - 13 May 2006. The panel consisted of less than twenty people, small enough to allow for the contribution of individuals with different perspectives, experiences and value sets. It involved a mix of receiving information on energy futures and providing new input through surveys and discussions. The EFCP seems to feed directly into a project called ‘Societal update of new technologies’ which is part of the larger Energy Transformed Flagship project within CSIRO (Energy Transformed 2006). This particular project has been designed to investigate the future of energy technologies in light of issues associated with climate change (Boughen 2006). The EFCP takes a social perspective to understand community sentiment as it is assumed that understanding and uptake of new technologies is required to achieve change in the acceptance of new technologies and current energy use (Boughen 2006). Outcomes of the EFCP are intended to be a better understanding of the drivers of acceptance of different types of energy technologies and how this changes with awareness (Boughen 2006). Understanding the broader social and technological contexts could help to develop technologies that are in line with societal values and therefore more readily adopted (Boughen 2006). Furthermore, information gathered from the EFCP feeds directly into the Energy Futures Forum. This is a group that has been convened by the CSIRO to bring together stakeholders from the energy, government and social sectors together to develop scenarios for further modelling in order to test likely impacts on Australia’s energy future (The Energy Futures Forum 2005). Membership of this group includes mining and manufacturing companies, power generators from around Australia, electricity retailers, the banking sector, the Federal Department of Industry Tourism and Resources, and organisations representing community and environmental interests (The Energy Futures Forum 2005).

Review of the CSIRO Energy Futures Citizens’ Panel
Kristin Alford Page 2 of 15
Figures 1 and 2 illustrate the stakeholders, inputs and activities and outcomes for the Energy Futures Forum.
Figure 1: Stakeholders and contributions for the Energy Futures Forum
Source: Adapted from The Energy Futures Forum 2005, Brochure, CSIRO, 25 February, p. 1.
Figure 2: Inputs and outcomes for the Energy Futures Forum
Source: Adapted from The Energy Futures Forum 2005, Brochure, CSIRO, 25 February, p. 2.

Review of the CSIRO Energy Futures Citizens’ Panel
Kristin Alford Page 3 of 15
3 Review of Energy Futures Citizens’ Panel 3.1 Purpose and foundation Defining the purpose and scope of any futures project is critical to ensure the process achieves the desired outcomes. To help define the project, the overarching organisational vision, specific purpose of the futures work and level of depth of enquiry could be considered. The overarching futures vision could be considered using the strategic landscape illustrated in Figure 3. This shows both the strategic objective and a higher, more enduring goal, both of which are important in orientating the futures issue to be addressed. Vision could be supplemented by determining the purpose of the futures work. Some possible purposes include being more futures orientated, thinking more deeply and systematically, being more creative and dealing better with change (Hines 2005, p.17). It also helps to consider the foundations for the futures work in terms of the level of depth of thinking required for the problem. This might be at a pop, pragmatic, critical or epistemological level (Slaughter 1999, pp. 456-457). Pop futures tend to explore matters superficially and are most often reported in the popular media. Pragmatic futures work examines the issues and challenges and seeks responses. This level of work is mostly found in futures work for industry and policy-makers. Critical work aims to explore the issues even more deeply by considering issues of meaning and worldviews. Finally epistemological futures work goes deeper still to question the structures on which the knowledge is understood and queried. The vision for the EFCP should be guided by the purpose of the Energy Transformed Flagship program. The objectives for this program are to seek sustainable energy solutions, halve greenhouse gases and double the efficiency of Australia’s new energy generation technologies (Energy Transformed 2006). These objectives remain strategic and do not capture the ‘star’, that is the enduring social role (Tibbs 2000).
Figure 3: Strategic landscape for the future
Source: Adapted from Tibbs, H 2000, Making the Future Visible: Psychology, Scenarios, and Strategy, Global Business Network, March, accessed 3 May 2006, www.hardintibbs.com, p. 4.

Review of the CSIRO Energy Futures Citizens’ Panel
Kristin Alford Page 4 of 15
As representatives of the community, the guiding star of the EFCP should also be the guiding star for the community. At the conclusion of the panel, the importance of human life and biodiversity had been stressed. The vision was summarised by two of the small groups generating scenarios when they stated ‘we value life’ and ‘kill CO2 or we are through’. That the participants in the EFCP voluntarily generated their own vision makes it more powerful. The main purposes of the EFCP were to examine how better to deal with change by considering the views of the community to get a broader perspective. The futures panel was approached on a pragmatic level; however given the serious, global nature of the issue, the approach was broad and deep in its execution. In summary, the overall purpose of the EFCP was to get community input at a deep level on the issue of global warming and energy futures to deliver energy solutions that support diverse life. 3.2 Process methodology In support of the objectives of the futures work, it is useful to have a framework to ensure the desired outcomes are achieved. One way in which to approach this is to use the Generic Process Framework as illustrated in Figure 4 (Voros 2003). The process consists of a number of steps that are then fed into further strategic development and planning. These include inputs such as data and knowledge from different sources and perspectives. This information undergoes analysis to determine some high-level trends and occurrences. A deeper level of interpretation considers the analysis from a range of perspectives and delves deeper into meaning. A genuine futures approach called prospection is used to generate and consider a range of alternative futures. These steps combine to inform the outputs of the process. It should be noted that the process does not necessarily follow a linear timeframe. This framework can also be used a diagnostic tool, to see where further depth or breadth may be useful (Voros 2003).
Figure 4: The Generic Foresight Process
Source: Adapted from Voros, J 2003, ‘A generic foresight process framework’, Foresight, vol. 5, no. 3, p. 14.

Review of the CSIRO Energy Futures Citizens’ Panel
Kristin Alford Page 5 of 15
3.2.1 Inputs Inputs for the process provided data, information and knowledge that participants in the EFCP required to be able to think about energy futures. There were two types of inputs observed during the EFCP. The first was preparation. This included providing participants with appropriate background knowledge. This included talks from Dr Graeme Pearman on greenhouse gases and Dr Steve Hatfield-Dodds on the social and economic impact of energy solutions. Additional, presentations from Dr Luke Reedman and Dr Andrew Beath explained energy use and energy generation technologies in details. These talks were supplemented by glossaries and background information on energy strategies for Victoria and Australia (Broad 2002) The second type of input was generated by the community participants. For example, at the start of the panel process, small groups were convened to discuss the main energy issues for Australia’s future. This was a brainstorming session that gave participants an opportunity to air grievances. Further discussions around energy issues surfaced a lot of issues (not just technical) that clearly embraced a holistic approach as summarised in the Four-Quadrant model in Table 1 (Wilber 2001; 2005). The use of this model ensures a more complete picture of an issue is built up considering impacts on individuals and groups in a social, cultural and technical way. Other types of input generated by participants were surveys that on technology prioritisation, technology usage and attitudes to energy (Q-sort) that provided inputs for broader CSIRO projects. This input method was slightly different as the information was not analysed further during the EFCP However, panel members will see the report containing this information, and the thinking developed by doing the surveys would have had some impact on the contributions of participants in discussions.
Table 1: An integral approach to process inputs Interior Exterior
I / Self
Intentional It / Nature
Behavioural Individual
Attitudes, perhaps tendencies towards short-term action thinking rather than long-term thinking on consequences.
Individual behaviours such as ‘addition to comfort’, habit, consumerist behaviours.
We / Culture Cultural
Its / Nature Social / Functional Fit
Collective
Australia at the beach (little tidal or wind power at sea), social shifts in water and energy availability and use, social resilience and adaptability to change, education in schools and communities.
Economic effects of carbon taxes, greenhouse gas impacts, political stalling, industry influences.
Source: Adapted from Wilber, K 2005, ‘Introduction to integral theory and practice:
IOS Basic and the AQAL map’, in KBFS, vol. 3, pt 4 p. 16. 3.2.2 Analysis Overall, little analysis was conducted on the inputs to the panel process, although as stated, some of the data collected will undergo extensive analysis to support broader projects. In terms of trying to understand the question, ‘what seems to be happening’, the presentations by Dr Graeme Pearman and Dr Steve Hatfield-Dodds provided extensive analysis using research data to map, graph and trend various hypothesis. These presentations provided a rich and detailed view of current energy issues. It should also be remembered that although little explicit analysis was completed, the process of deliberate democracy involves both internal reflection and public discussion (Goodwin & Niemeyer 2005). It is therefore likely that participants analysed the information they received in their own minds to help work out what seems to be happening.

Review of the CSIRO Energy Futures Citizens’ Panel
Kristin Alford Page 6 of 15
3.2.3 Interpretation As discussed, there was a lot of information gathered using the integral Four-Quadrant model that explained some of the underlying causes to issues. These included a consumerist approach to energy use, societal expectations of maintaining certain standards of living, the invisibility of energy technologies and supply to consumers, lack of acceptance and understanding of greenhouse issues and the politicisation of greenhouse modelling. However, explicit methods to extract these insights at depth were not used. Additionally, there were some issues where further exploration of the issues might have clarified the group’s thinking. For example, a lot of the issues associated with nuclear power were skipped over. A consensus on hydroelectricity was not reached either as there seemed to be two contrary ideas surfacing; hydroelectricity as a renewable method on one hand and the lack of water in Australia on the other. 3.2.4 Prospection There were three examples of futures work in the EFCP that related to the process of prospection. The first was the extensions of models presented by Dr Graeme Pearman and Dr Steve Hatfield-Dodds that showed possible forecasts of global warming and economic indicators towards 2100. The second was to consider a bunch of scenarios previously prepared by the Energy Futures Forum as illustrated by the scenario tree in Figure 5. Futurist Kate Delaney provided the guidance for the creation of a set of energy scenarios to be analysed. The EFCP participants were divided into small groups and asked to consider the plausibility of these scenarios, what might be important and whether there were any issues that had not been considered. This was interesting as many groups found it difficult to consider the scenarios generally, focussing instead on the plausibility of each separate scenario. Participants found it a challenge to jump to 2050 and tended to focus on what could or should be done now, and strategies to do this. It was very difficult for most to separate possible and desirable futures in the scenarios. The early action futures were consistently raised as the most desirable, even if they were optimistic. On the third day, the participants were divided into small groups again and asked to develop their own scenarios for the future of energy in Australia. Figure 6 shows one group developing scenarios and Figure 7 shows the scenario presentation materials. These were ‘true’ scenarios as they worked towards achieving a specific vision by describing the overall objective (‘we value life’) and how to achieve this vision by changing the mix of energy technologies, introducing a carbon tax to encourage reduction in greenhouse emissions and reducing domestic, commercial and manufacturing energy consumption.
Figure 5: Scenario tree for EFF energy futures
Source: Adapted from Energy Futures Forum Scenarios 2006, Handout, Energy Futures Citizens’ Panel, CSIRO, 12 May, p. 1.
Early Action + Dist Gen
Early Action +Renewables
Early Action Early Action with Nuclear
Late Response
Smooth Ride
Rough Ride
NOW
Rapid energy eff. imp.Trend Oil Price
Trend energy eff. imp.Trend Oil Price
Rapid energy eff. imp. High Oil Price High carbon tax
Late carbon tax
No carbon tax

Review of the CSIRO Energy Futures Citizens’ Panel
Kristin Alford Page 7 of 15
Figure 6: Small group for scenario development
John, Keith, Kristin & Kaye with their scenario presentation.
Figure 7: Small group scenario generation for the future of energy in Australia
3.2.5 Outputs There are both tangible and intangible outputs to a futures or deliberative democracy process (Voros 2003). By considering the context of the Energy Futures Citizens’ Panel within the Energy Futures Forum and Energy Transformed Flagship programs, it is possible to specifically define the tangible outputs of the citizens’ panel. These were to comment on the plausibility and completeness of the scenarios developed by the Energy Futures Forum, to provide input into a number of bodies considering energy issues and energy futures (achieved through the production of a slide pack on the third day by Dr Anna Littleboy), to demonstrate community attitudes towards various technologies and to provide insight through the completion of surveys on how energy use and preferred generation methods change with awareness.

Review of the CSIRO Energy Futures Citizens’ Panel
Kristin Alford Page 8 of 15
Intangible outputs are more difficult to observe and include changes in thinking (Voros 2003). For participants, this will be reflected by the changes people make to their own energy use and their future involvement in communicating and acting on energy issues in their communities. It also includes the unexpected connections or friendships made. For the CSIRO team, intangible outputs might manifest through a slight change to the direction or methods used in the research projects. 3.3 Social transformation The panel process itself also has a role play in affecting outcomes. Participation in a futures or deliberative democracy process may prompt internal reflection, challenge thinking or change attitudes (Goodwin & Niemeyer 2005; Slaughter 2005). It is important in reviewing the futures process to consider any change in knowledge, behaviour and attitudes for participants. The Transformative Cycle outlines some steps for social change that groups may go through when their original mindsets or understandings of the world are challenged (Jungk & Mullert cited in Dator 2005b, pp 1-2; Slaughter 2005). From this breakdown in meaning and venting of grievances, a search for new meaning commences. These concepts are then argued and negotiated by the group who develop alternatives. Some of these alternatives are then selected as the new social norm and the cycle starts again. The EFCP aimed to use open and honest discussion to enliven participants’ views in a fair and productive way (Boughen 2006). Figure 8 illustrates the Transformative Cycle annotated with examples of how the social debate around energy futures can change, and showing the effectiveness of the deliberate democracy and futures process. There examples were noted during the EFCP and are echoed by observations in the broader community. Another interesting observation is that the EFCP engaged participants in integral and deep learning processes when compared to the futures models. This is quite an achievement given the relative inexperience of the participants in this type of activity (Hines 2005, p. 16).
Figure 8: The Transformative Cycle for energy futures
Source: Adapted from Slaughter, RA 2005, Futures for the third millennium: enabling the forward view, Towards a wise culture, CD-ROM, Foresight International, Brisbane, section 5, part 2.
Too hard Too late to fix the
problem World will never agree
Start of ecological concerns (eg Clean-Up Australia)
Renewables supply greater proportion of power
‘Green’ energy People are
custodians of nature Global cooperation
Portfolio approach
Prioritisation of alternatives
Change at all levels from government to industry to communities
Progress is ‘good’ More is better People control nature Continuity Nation states Throw waste away

Review of the CSIRO Energy Futures Citizens’ Panel
Kristin Alford Page 9 of 15
4 Supplementary methods The EFCP covered many of the steps of the framework discussed through presentations, activities and group discussions. However, it is useful to consider a few examples of futures techniques that may have expanded the panel’s thinking and responses. 4.1 Be ridiculous A useful idea about the future is one that appears to be ridiculous (Dator 2005a). The EFCP never considered any truly ridiculous ideas. For example, there were no discussions of wildcards or implausible but possible scenarios (Voros 2003). It is curious to examine the reasons for this. One obvious reason is that the situation in relation to energy use, demand and greenhouse gas effects is already so serious and so difficult to rectify that real change seems remote. If this is the case, then generally the real wildcards affecting the scenarios are those that involve mass catastrophe or miracle solutions. Although such thinking may provide further insight, perhaps neither one of these events reveals alternative actions that can be taken in the present. It would be interesting to understand the Energy Futures Forum process to test whether some ‘ridiculous’ thinking had been employed in the initial creation of the scenarios. 4.2 Think deeply In section 3.2.3, the effectiveness of the group in using interpretative methods to really understand the issues and events was discussed. It was noted that although many deeper levels of the issues were discussed generally, some of the more difficult issues were left unexplored. One of these issues in particular was a nuclear energy future for Australia, on which no consensus was reached by the panel. This is of particular interest given recent discussions about a nuclear debate for Australia in the news (‘PM flags full scale nuclear debate’ 2006). Causal Layered Analysis and Rich Picturing exercises were undertaken by a different group1 to explore the issue of a nuclear energy future for Australia in more depth, and to understand the perceptions people have around nuclear energy (Inayatullah 2005; Jarvis 2002). Outcomes from these methods often provide insight; reframe the issues to generate more possible solutions and enable a deeper understanding of the problem. In the Causal Layered Analysis, the first level examined was the litany level which refers to the public debate about issues, news and quantitative trends. The second level was social causes which included economic, cultural and generally common (Inayatullah 2005, p. 5). The third level was to examine the worldviews and discourse that takes place. This level is concerned with structure, language and the deeper assumptions behind the issue (Inayatullah 2005, p. 5). Finally, there was a fourth layer which examined myth and metaphor; that is the stories, archetypes and emotional responses to the issue (Inayatullah 2005, p. 6). Many of these issues were raised as part of the third level and fed easily into the first level. Sharing stories is effective for explaining feelings and values and in a deliberative democracy process it builds a sense of community and helps people to become engaged in a discussion (Ryfe 2006). The Causal Layered Analysis is summarised in Table 2. Rich Picturing is a method whereby the people, environment and mechanisms in a particular problem are drawn as the issues are discussed (Jarvis 2002). In contrast to the Causal Layered Analysis, this method provided an opportunity for people to take a more personal view and to disagree. The images generated by one group discussion are shown in Figure 9. Many of the first images generated related to a dying earth and issues of resource and nuclear power security. As the discussion widened and the views of more stakeholders were illustrated, it became clear that a solution would need to consider industrial, technological, societal and spiritual responses. 1 The Causal Layered Analysis and Rich Picturing exercise were undertaken by a class on Foresight Methodologies 1 as part of the Masters of Science in Strategic Foresight at Swinburne University, 25 May 2006.

Review of the CSIRO Energy Futures Citizens’ Panel
Kristin Alford Page 10 of 15
These analyses provided a deeper exploration of attitudes to nuclear energy in Australia. The main concerns surfaced from this deeper level thinking included attitudes to technology development; issues of control, risk and safety; consideration of the Earth as ‘resource’ or ‘Gaia’; and issues associated with the long life cycle of nuclear waste. Although no specific solutions were defined during these exercises, it seems that providing safeguards and mechanisms for the long-term guardianship of potential hazards would be something to consider (Macy 2006; Slaughter 2005). These types of approaches could be critical for gaining public acceptance of nuclear energy in Australia.
Table 2: Causal Layered Analysis on a nuclear energy future for Australia Level Interpretation
Litany Carbon dioxide in the atmosphere is increasing causing global warming
Australia needs a debate on nuclear energy Nuclear energy is a viable energy option given the issues with carbon dioxide for other
methods There are financial costs to consider in relation to nuclear energy (both favourable and
negative depending on perspective). Nuclear energy could become a security threat Chernobyl provides a powerful, fearful image of the risks associated with nuclear energy. There are long-term storage issues associated with nuclear energy. Population is increasing, as in the demand for energy Australia’s economy depends on the supply of cheap and plentiful energy. Australia has natural resources such as uranium and we should decide how to best exploit thes
for nuclear energy.
Social Causes Energy use is currently inefficient It is likely that the oil price will increase or that the oil supply could be put at risk, leading
to a demand for other energy technologies. There are deficiencies in other energy technologies, such as renewables. Energy needs (specifically energy consumption) is increasing. There is a readily available resource for exploitation. Australia and the world have finite energy resources Perceptions about nuclear energy seem to be changing. The long-term waste implications could stall the development of nuclear energy. There are other uses of nuclear resources including weapons. There has been a lack of investment in renewable energy methods. Awareness of energy resource issues is increasing. There have been political pressures. The impact on the environment has had varying degrees of importance attributed to it.
Worldviews / Discourse Technology will save the world
o It’s too late to fix global warming anyway There is a need for more energy – growth is good
o Do more with less, adopt voluntary simplicity Use of language – climate change as opposed to global warming Fear that nuclear energy is related to nuclear weapons Mass or centralised provision of energy needs to required
o Look at micro or distributed energy sources Competition as opposed to cooperation – not sure if people can be trusted Waste can be put somewhere else, not in my backyard
o There is ‘no away’ and we need to include waste in the system (Macy 1983) Human inventiveness and capability is limitless – we can control nuclear energy
o Small stimulus can have big and unintended consequences Science shows the way
o Science is not infallible Human centric view – conquer the earth
o Earth as Gaia – live in and be a custodian of nature Nuclear energy is good for the ‘good’ but not for the ‘evil’ (and we are the ‘good’)
Myth & Metaphor Pandora’s Box
Genie out of the bottle David & Goliath (where Goliath is greenhouse gases) The Magic Pudding Fairy tales always end ‘happily ever after’ Ostrich with its head in the sand

Review of the CSIRO Energy Futures Citizens’ Panel
Kristin Alford Page 11 of 15
Figure 9: Rich Picturing on a nuclear energy future for Australia
4.3 Include a future voice The EFCP specifically considered scenarios developed for the year 2050. Since consideration of the future has an impact on future generations, the inclusion of a ‘future voice’ on deliberate democracy panels and other constitutional bodies can be powerful (Ekeli 2005; Tough 2005). It has been argued that deliberate democracy decisions cannot truly be considered effective if they have not given a voice to posterity (Ekeli 2005). Providing a voice to future generations in the current discussion also opens up worldviews and insights which may not have been considered by the existing stakeholders. The voice of future generations in relation to resource use, waste, greenhouse gas effects and energy use were not truly considered during the EFCP. This would be a very interesting addition to the process which may further define preferable futures and galvanise action in the present. For example what would a future voice say in relation to long-term nuclear waste storage? What would be their concerns about the loss of the Great Barrier Reef and biodiversity in a range of other environments? What about the displacement of South Pacific peoples and cultures? What about the changes to industry, travel opportunities and lifestyle? It seems that the inclusion of a future voice makes it even more compelling to affect action now in pursuit of a preferred future. Perhaps the use of such a voice would be clever and attention-grabbing way of communicating the project outcomes, especially in terms of expressing community concern and prioritisation of actions.

Review of the CSIRO Energy Futures Citizens’ Panel
Kristin Alford Page 12 of 15
5 Process observations 5.1 Organisation, facilitation and agenda Consideration of process and facilitation is important as foresight practitioners need to be capable of leading successful futures processes. The effectiveness of the process affects both the tangible and intangible outcomes for projects. Learning from the expertise and example of others is a useful learning tool. Firstly, the participants in the EFCP provided a wide representation of the community in terms of gender, age (20s to 80s) working backgrounds and family experiences. Such a broad representation of the community reflected a range of values and worldviews, providing ample opportunity for rich discussions. There were very few people with specific issues or interests to promote and most people seemed eager and ready to learn. Secondly, arrangements were very well organised and communicated. Travel and accommodation arrangements were made well ahead of time. The meeting venue was set at a comfortable temperature, and, as Figure 10 shows, provided plenty of light and space. Participants were fed well and provided with plenty of breaks. The ease of these arrangements meant that nothing extraneous detracted from the panel objectives and energy futures activities. Dr Kath Fisher as the facilitator demonstrated a range of techniques to engage the participants in the process. She included grounding activities such as ‘checking in’ in the mornings to ease people back into the process and smooth out any concerns. She created a safe space by creating shared experiences in the introductory processes so that people were willing to express ideas. Agreements were efficiently discussed and this resulted in an awareness of the need for people to be heard and their views respected. There was very little conflict even though a spectrum of views was represented. A particular strength of the facilitator was to ensure that everyone had a say and that the panel was not dominated by one or two individuals. Dr Fisher showed a novel way of handling questions for guest speakers by removing them from the room after their presentation for ten to fifteen minutes. In this time, she worked with the participants to float their questions. This gave everyone an opportunity to make statements, give opinions and think out their questions aloud. It also reduced any doubling-up of issues. Once the speakers were invited back into the room, the participants were able to ask insightful questions and speakers were given maximum opportunity to respond.
Figure 10: EFCP participants at the venue

Review of the CSIRO Energy Futures Citizens’ Panel
Kristin Alford Page 13 of 15
In terms of the overall schedule, quite a lot of technical information was delivered, especially on the second day. It would be interesting to consider alternative delivery methods to lectures such as moving around a number of ‘expert stations’ for different technologies or the use of physical models. This would allow people to experience and learn about the technologies in a different way. It was also observed that although the different steps of the generic foresight process were covered, these were not tackled in a linear fashion (Voros 2003). Much of the content provided was based on inputs from other areas which meant that a trend analysis or projection of a future scenario would then provide input into group discussions on energy futures (which were an input into broader CSIRO projects). The group discussions tended to expand on the analysis and interpretation of the information participants received. 5.2 A participant’s perspective As well as considering the process, thinking about one’s own role within the process allowed for personal reflection and learning. As a foresight practitioner, experiencing a futures process provided a valuable insight into the energy and emotional commitment that such a process invites. This learning experience was a critical output of the EFCP. For a subject matter perhaps considered technical or dry, there were a noticeable range of emotions experienced during the process. Energy levels throughout the three days also waxed and waned. The discussions covered broad individual and national issues affecting society as well as the technical issues. This too was surprising for a forum that could have presented a very narrow focus on technologies. The presentation by Dr Graeme Pearman was particularly sobering and a pertinent example of feeling overwhelmed by an image of the future and needing to balance these fears by being able to respond in a highly engaged and focussed manner (Slaughter 2005, p. 123). Receiving a lot of technical information at once with this presentation and the technology presentations on the second day was a little draining, but these provided essential information as well as a contrast with the highs. The high point was definitely the final small group discussion and presentation on what the energy future looks like for Australia. It was enjoyable to develop a logical framework for the group to present ideas. The presentation was well received and managed to communicate the thinking of the group well. Most of all it provided an opportunity to imagine something new, to shape something and develop a workable image of a plausible future, as well as considering some of actions to take now to preserve what is important – life. The group was very proud of their contribution. Another positive was seeing the group discussions and presentations summarised so succinctly and accurately in Dr Anna Littleboy’s presentation. Knowing that this would reach a range of audiences provided a very powerful high quality response to the futures work undertaken. Oddly enough, completing the Q-sort surveys was also a highlight as it provided an insight into how thinking changed with knowledge and awareness. It was interesting to be able to observe such a tangible measure of this. There were very few personality clashes although one or two people were frustrating. It was useful to approach them differently, one by engaging in discussions on their particular interests and one by ignoring. This in itself also gave a little insight into the way the facilitator had dealt with various personalities in a neutral way. These experiences were helpful for thinking about facilitating futures workshops. Opportunities for socialisation were another unexpected highlight. It was rewarding to be able share experiences and make friends in a very non-judgemental and supporting manner. It is difficult to work out exactly why this was possible, but perhaps it was because thinking about energy futures (and the future in general) leads back to an assessment of important values. Futures thinking can be very effective in making these values real, powerful and immediate.
Review of the CSIRO Energy Futures Citizens’ Panel
Kristin Alford Page 14 of 15
6 Conclusions Examining the EFCP has provided a great understanding of the CSIRO energy projects, community participation experiences such as deliberative democracy and futures and foresight processes. Placing the EFCP into the broader CSIRO framework gave a greater understanding of the purposes and aims of the EFCP. Considering a number of theoretical models also served to highlight areas of the process such as input methods, transformative social change and interpretation. Delving further into interpretative methods such as Causal Layered Analysis, Rich Picturing and the concept of the voice of future generations gave time and space to consider some of the issues more deeply. It is recommended that the CSIRO team consider the introduction of methods that examine these issues deeply, either within the EFCP framework or for broader CSIRO energy projects. Exploration of these issues has been timely given the sheer amount of media and government focus on energy options and the environment in the past month. And so it should be. As the EFCP determined, there is a need for an immediate and active responses to these issues. Review of the panel process has also been valuable as a foresight practitioner. The experience has already informed the planning and delivery of a project considering the social impacts of new technologies, especially nanotechnology. These programs have been designed with a greater awareness of the emotional response of participants and are flexible enough to draw on a variety of methods to depth and insight into issues that difficult to discuss. Hopefully this critical review of the process has provided the CSIRO with feedback to enable them to also continue the development of their community participation and futures processes. The report on the Victorian EFCP is highly anticipated and it will be interesting to hear feedback in relation to the thinking developed by the participants in the EFCP. It is hoped that the project secures additional funding to conduct more EFCPs around Australia. 7 References Boughen, N 2006, Societal Uptake of Energy Technologies, Internal Communication, Energy Transformed Flagship, CSIRO. Broad, C 2002, Energy for Victoria: A statement by the Minister for energy and resources, Department of Natural Resources and Environment, The State of Victoria, accessed 9 May 2006, www.doi.vic.gov.au/doi/internet/energy.nsf/headingpagesdisplay/energy+publications. Dator, J 2005a, ‘Foreword’, in KBFS. Dator J 2005b, ‘From future workshops to envisioning alternative futures’, in KBFS, vol. 2, pt. 2. Ekeli KS 2005, ‘Giving a voice to posterity – deliberative democracy and representation of future people’, Journal of Agricultural and Environmental Ethics, vol. 18, no. 5, September, pp. 429 – 450. Energy Futures Forum Scenarios 2006, Handout, Energy Futures Citizens’ Panel, CSIRO, 12 May. Energy Transformed 2006, CSIRO, updated 7 April, accessed 26 May 2006, www.csiro.au/csiro/channel/ppch1d,,.html. ‘Global warming may exceed predictions’ 2006, The Age, 24 May, accessed 26 May, www.theage.com.au/news/business/global-warming-may-exceed-predictions/2006/05/23/1148150256544.html. Goodin, RE & Niemeyer, SJ 2003, ‘When does deliberation begin? Internal reflection versus public discussion in deliberative democracy’, Political Studies, vol. 51, pp. 627–649.

Review of the CSIRO Energy Futures Citizens’ Panel
Kristin Alford Page 15 of 15
Hines, A 2005, ‘Ten questions every organisational futurist should be able to answer’, in KBFS, vol. 2, pt 2. Inayatullah, S 2005, ‘Causal Layered Analysis: post-structuralism as method’ in KBFS, vol. 2, pt 2. Jarvis, C 2002, Peter Checkland’s Soft Systems Methodology and CATWOE, Business Open Learning Archive, accessed 24 June 2002, sol.brunel.ac.uk/~jarvis/bola/information/ssm.html. KBFS—see Slaughter, Inayatullah & Ramos (2005). Macy, J 2006, Nuclear guardianship: responsible care for radioactive materials, accessed 30 May 2006, www.joannamacy.net/html/nuclear.html. Ogilvy, J 2005, ‘Scenario planning, critical theory and the role of hope’, in KBFS, vol. 1, pt 4. ‘PM flags full scale nuclear debate’ 2006, The Age, 22 May, accessed 30 May, www.theage.com.au/news/National/PM-flags-full-scale-nuclear-debate/2006/05/22/1148150147204.html. Ryfe, DM 2006, ‘Narrative and deliberation in small group forums, Journal of Applied Communication Research, vol. 34, iss. 1, pp. 72. Seffen, W 2006, Stronger Evidence but New Challenges: Climate Change Science 2001-2005, Australia Government Department of Environment and Heritage, Australian Greenhouse Office. Slaughter, RA 1999, ‘A new framework for environmental scanning’, Foresight, vol. 1, no. 5, October, pp 441 – 451. Slaughter, RA 2005, Futures for the third millennium: enabling the forward view, Towards a wise culture, CD-ROM, Foresight International, Brisbane. Slaughter, R, Inayatullah, S & Ramos, J (eds) 2005, The knowledge base of futures studies, CD-ROM, Professional edn, Foresight International, Brisbane. The Energy Futures Forum 2005, Brochure, CSIRO, 25 February. Tibbs, H 2000, Making the Future Visible: Psychology, Scenarios, and Strategy, Global Business Network, March, accessed 3 May 2006, www.hardintibbs.com. Tough, A 2005, ‘What future generations need from us’ in KBFS, vol. 5, pt. 2. Voros, J 2003, ‘A generic foresight process framework’, Foresight, vol. 5, no. 3, pp. 10-21. Wilber, K 2001, A theory of everything: an integral vision for business, politics, science and spirituality, Shambhala, Boston. Wilber, K 2005, ‘Introduction to integral theory and practice: IOS Basic and the AQAL map’, in KBFS, vol. 3, pt 4.