Embed Size (px)
Citation preview
Computers & Geosciences 49 (2012) 164–169
Contents lists available at SciVerse ScienceDirect
Computers & Geosciences
0098-30
http://d
n Corr
E-m
cslowry
journal homepage: www.elsevier.com/locate/cageo
Social.Water—A crowdsourcing tool for environmental data acquisition
Michael N. Fienen a,n, Christopher S. Lowry b
a US Geological Survey, Wisconsin Water Science Center, 8505 Research Way, Middleton, WI 53562, USAb University at Buffalo, Geology Department, 411 Cooke Hall, Buffalo, NY 14260, USA
a r t i c l e i n f o
Article history:
Received 16 April 2012
Received in revised form
14 June 2012
Accepted 18 June 2012Available online 26 June 2012
Keywords:
E-geoscience
Citizen science
Hydrology
Streamgaging
Python
04/$ - see front matter Published by Elsevier
x.doi.org/10.1016/j.cageo.2012.06.015
esponding author.
ail addresses: [email protected] (M.N. Fiene
@buffalo.edu (C.S. Lowry).
a b s t r a c t
Remote telemetry has a long history of use for collection of environmental measurements. With the rise
of mobile phones and SMS text-messaging capacity, many members of the general pubic carry
communications equipment in their pockets at all times. Enabling the general public to provide
environmental data through text messages has the potential both to provide additional data to
scientific projects and also to raise awareness of the projects through participation. Hydrologic
measurements – some of which can be made without training, involve a single measurement, and
are often made in rural areas – are well-suited to text-message conveyance. Many other environmental
measurements are similarly well-suited for this technology. Social.Water is a software package, written
in Python, that collects, parses, and categorizes text messages sent to a dedicated phone number,
updates a simple database, and posts both graphical results and the database on the Web. Social.Water
was designed as the backend to the Crowdhydrology project and is written in an object-oriented design
that makes customization and modification straightforward.
Published by Elsevier Ltd.
1. Introduction
Acquisition of field data is an expensive part of most geoscienceprojects—it is also an opportunity for geoscientists to interact withthe public. Lowering the cost of data acquisition in concert withincreasing public interaction can provide science benefits to pro-jects from reducing the expense of data collection and throughincreased public engagement. Allowing citizen-scientists to con-tribute data to a scientific project is an example of crowdsourcing.Crowdsourcing means obtaining information or analysis from the‘‘crowd’’ – the general public – and is so-named as an adjunct tooutsourcing (Howe, 2006). An example of this approach is theCrowdhydrology project (Lowry and Fienen, in press). In thisproject, the authors used text messages to obtain stream waterlevels at multiple sites in upstate New York, USA. Visitors to thesites saw signs posted on water level gages asking that they send atext message with the station number and the water level readingfrom the gage. These messages are forwarded to an email serverwhere they are parsed by a script to associate measurements withspecific gages, and then displayed in near real time on the Web.Between May 2011 and February 2012, nearly 150 measurementsfrom nine locations were submitted by citizen scientists in this way.This work details the software package, Social.Water, which forms
Ltd.
n),
the backbone infrastructure for the Crowdhydrology project. Lowryand Fienen (in press) also describe a variety of previous projectsusing crowdsourcing technology in natural science applications.
Social.Water is a program written in Python, building on theopen-source tools that form the protocol for Crowdhydrology. Themain objective for Social.Water is to provide a simple, modular,and inexpensive way to enlist the general public in collectingscientific data (stream water levels in the case of Crowdhydrol-ogy). The data are transmitted using text message protocols. Thedata obtained in this way can supplement measurements madeby project staff when telemetry or continuous recording areinfeasible. A secondary but important outcome of using thisprotocol is engagement and, in a sense, ownership by citizenswho encounter the field sites and contribute information. Enlist-ing citizen-scientists in data collection efforts dates at least backto the inception of the Audobon Society’s Christmas Bird Counts(Wiersma, 2010) in 1900. The recent proliferation of mobilephones and smartphones means telemetry more sophisticatedthan one dreamt of 20 years ago is in nearly everyone’s pocket.
Social.Water depends on text messages forwarded to an IMAP-enabled email account for the transmission of data. An obviousalternative would be the use of a smartphone application such asCreekWatch (IBM, 2012). Smartphone applications allow forautomatic geolocation, submission of photographs, and otheradvantages such as delayed synching when off-network. Recentdevelopments in HTML5 standards also make cross-platformdevelopment realistic (Isaac, 2011). However, a goal with Social.-Water is to allow transmission of strictly text and numerical data
M.N. Fienen, C.S. Lowry / Computers & Geosciences 49 (2012) 164–169 165
on a platform that is most commonly available. Despite thepopularity of smartphones in the United States, only 46% of adultshave them, compared to 87% of adults who have some kind ofmobile phone (Smith, 2012). Furthermore, a smartphone apprequires users to download and install the app prior to participa-tion. The guiding precept of this project was to lower the barriers toparticipation as much as possible such that the simplest imple-mentation with the lowest burden on users would be realized.
One challenge in using text messages rather than a dedicatedsmartphone application is the need to interpret, parse, and categor-ize the messages to extract the relevant data. In the Crowdhydrol-ogy project, instructions to observers were intentionally simple andimprecise. Adaptations to the code, discussed below, were requiredfor successful parsing and categorization of results.
In the remainder of this paper, we discuss the details ofimplementation of the Social.Water code, review the applicationto the Crowdhydrology project, and provide conclusions andfuture plans.
2. Social.Water code
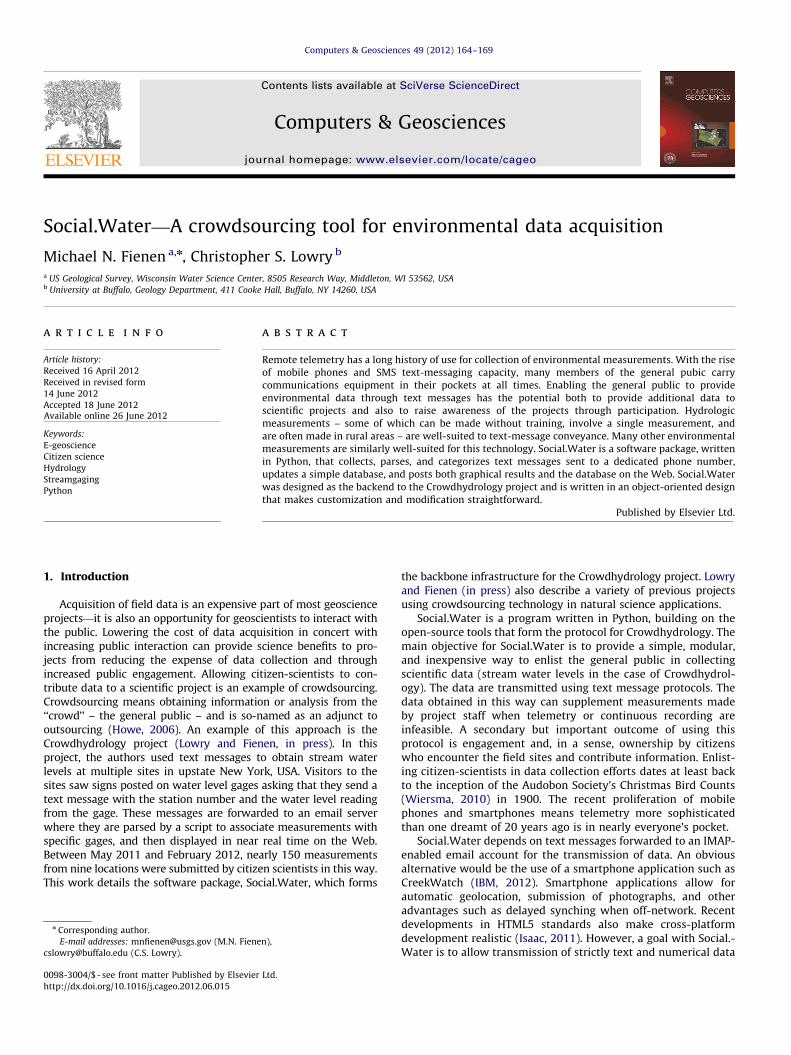
Social.Water is written using an object-oriented approach inPython (van Rossum, 2012) version 2.7.2. Because Social.Water isdesigned in an object-oriented way, the main code in sw_dri-ver.py is only a few lines that initialize an object to contain theinformation in the code and call methods that perform actions onthat object. Several dependent files must be in the path forsw_driver.py to access them. The classes used by Social.Waterare in social_water.py. Two other dependent scripts are infuzz.py and process.py. These two scripts contain functionsfrom the fuzzy-search algorithm fuzzywuzzy (Cohen, 2011) dis-cussed below. In the remainder of this section, we discuss themechanics of Social.Water implementation. The code is meant tobalance generality with code maintenance and customization. Asa result, some customization is required to deploy Social.Water onprojects other than Crowdhydrology. Fig. 1 illustrates the generalprocess flow of Social.Water. The entire Social.Water code, alongwith ancillary code and datafiles, are installed on a server and run
Fig. 1. Schematic representation of the Social.Water program flow from text messa
through a cron script every 5 min. The runtime is typically lessthan a second and the majority of times the cron script executes,Social.Water logs into an email account, detects that no newmessages are present, and immediately exits.
An initial requirement to implement Social.Water is to forwardtext messages to an Internet Message Access Protocol (IMAP,Internet Engineering Task Force, 2003b)-enabled email account.We chose Google Voice (voice.google.com) because it is free andcan be set up with a dedicated phone number serving the solepurpose of receiving text messages and forwarding them to theemail account. Social.Water is run on a server and, using IMAP,checks a free email account every 5 min, parses new messages todetermine if they contain valid water level measurements asso-ciated with known gages, updates a simple flat database, anddisplays a graphical result on an HTML page.
Information required to initialize the class email_reader is auser name for an email account, an obfuscated password, and thescope of the email search (‘‘UNSEEN’’ only reads messages markedas unread and ‘‘ALL’’ reads all messages in the email account). Forthe Crowdhydrology project, we used a Gmail account (gmail.-google.com) as a free, IMAP-enabled email client—if a differentemail client is desired, email_reader.login() would need to beupdated. The password is obfuscated using the python base64
module implementing RFC 3548 (Internet Engineering Task Force,2003a). This obfuscation is not meant to be highly secure, but itprevents a non-human hack from obtaining the password in plaintext from the codebase. Nonetheless, we recommend using asacrificial, dedicated email account for this purpose to avoid anyconflict with private data.
After initialization, email_reader.login() is called to con-nect to the IMAP server. email_reader.checkmail() checks tosee if new messages, based on the email_scope outlined above,are present in the IMAP account. If no new messages are present,Social.Water exits because no new work is required of it. If newmessages are present, email_reader.parsemail() pulls thedate stamps and message bodies from the new messages, onlyconsidering new messages with the text ‘‘SMS from’’ in thesubject line. This prevents spam, advertisements, or any othernon-data email messages from being further considered.
ge, forwarded to email, parsed, and displayed as a data table and graphically.
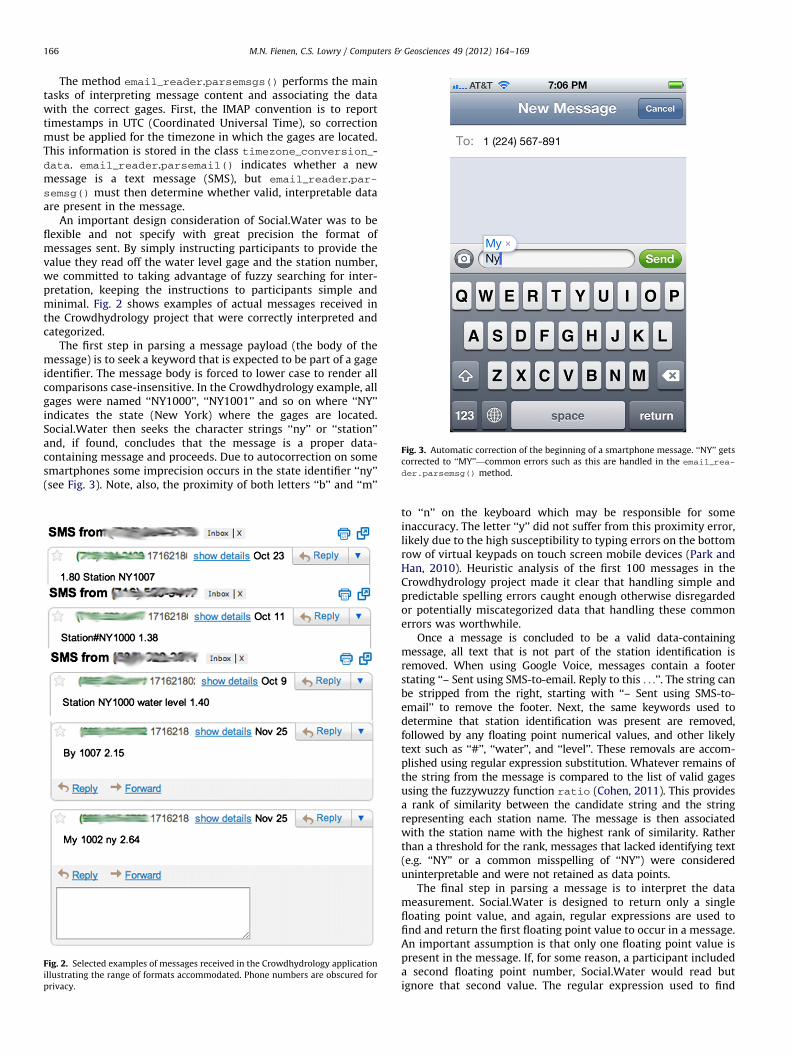
Fig. 3. Automatic correction of the beginning of a smartphone message. ‘‘NY’’ gets
corrected to ‘‘MY’’—common errors such as this are handled in the email_rea-
der.parsemsg() method.
M.N. Fienen, C.S. Lowry / Computers & Geosciences 49 (2012) 164–169166
The method email_reader.parsemsgs() performs the maintasks of interpreting message content and associating the datawith the correct gages. First, the IMAP convention is to reporttimestamps in UTC (Coordinated Universal Time), so correctionmust be applied for the timezone in which the gages are located.This information is stored in the class timezone_conversion_-data. email_reader.parsemail() indicates whether a newmessage is a text message (SMS), but email_reader.par-semsg() must then determine whether valid, interpretable dataare present in the message.
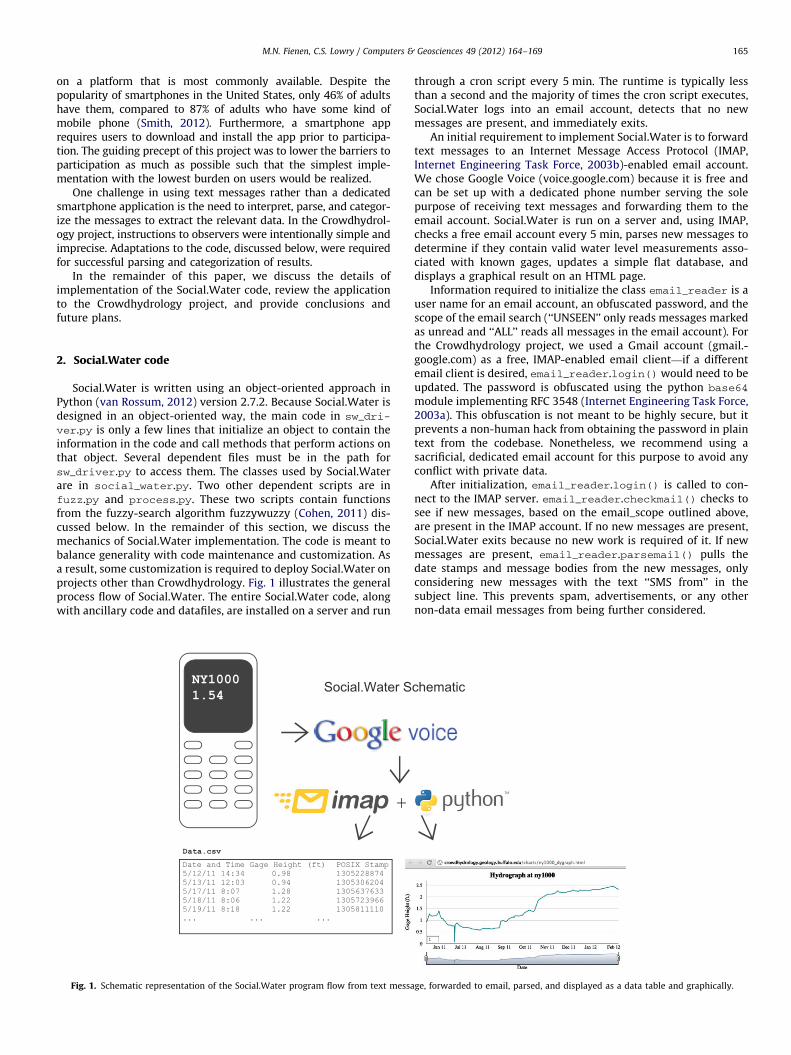
An important design consideration of Social.Water was to beflexible and not specify with great precision the format ofmessages sent. By simply instructing participants to provide thevalue they read off the water level gage and the station number,we committed to taking advantage of fuzzy searching for inter-pretation, keeping the instructions to participants simple andminimal. Fig. 2 shows examples of actual messages received inthe Crowdhydrology project that were correctly interpreted andcategorized.
The first step in parsing a message payload (the body of themessage) is to seek a keyword that is expected to be part of a gageidentifier. The message body is forced to lower case to render allcomparisons case-insensitive. In the Crowdhydrology example, allgages were named ‘‘NY1000’’, ‘‘NY1001’’ and so on where ‘‘NY’’indicates the state (New York) where the gages are located.Social.Water then seeks the character strings ‘‘ny’’ or ‘‘station’’and, if found, concludes that the message is a proper data-containing message and proceeds. Due to autocorrection on somesmartphones some imprecision occurs in the state identifier ‘‘ny’’(see Fig. 3). Note, also, the proximity of both letters ‘‘b’’ and ‘‘m’’
Fig. 2. Selected examples of messages received in the Crowdhydrology application
illustrating the range of formats accommodated. Phone numbers are obscured for
privacy.
to ‘‘n’’ on the keyboard which may be responsible for someinaccuracy. The letter ‘‘y’’ did not suffer from this proximity error,likely due to the high susceptibility to typing errors on the bottomrow of virtual keypads on touch screen mobile devices (Park andHan, 2010). Heuristic analysis of the first 100 messages in theCrowdhydrology project made it clear that handling simple andpredictable spelling errors caught enough otherwise disregardedor potentially miscategorized data that handling these commonerrors was worthwhile.
Once a message is concluded to be a valid data-containingmessage, all text that is not part of the station identification isremoved. When using Google Voice, messages contain a footerstating ‘‘– Sent using SMS-to-email. Reply to this . . .’’. The string canbe stripped from the right, starting with ‘‘– Sent using SMS-to-email’’ to remove the footer. Next, the same keywords used todetermine that station identification was present are removed,followed by any floating point numerical values, and other likelytext such as ‘‘#’’, ‘‘water’’, and ‘‘level’’. These removals are accom-plished using regular expression substitution. Whatever remains ofthe string from the message is compared to the list of valid gagesusing the fuzzywuzzy function ratio (Cohen, 2011). This providesa rank of similarity between the candidate string and the stringrepresenting each station name. The message is then associatedwith the station name with the highest rank of similarity. Ratherthan a threshold for the rank, messages that lacked identifying text(e.g. ‘‘NY’’ or a common misspelling of ‘‘NY’’) were considereduninterpretable and were not retained as data points.
The final step in parsing a message is to interpret the datameasurement. Social.Water is designed to return only a singlefloating point value, and again, regular expressions are used tofind and return the first floating point value to occur in a message.An important assumption is that only one floating point value ispresent in the message. If, for some reason, a participant includeda second floating point number, Social.Water would read butignore that second value. The regular expression used to find
M.N. Fienen, C.S. Lowry / Computers & Geosciences 49 (2012) 164–169 167
floating point values is
½þ��?nð? : \dþð? : \:\dnÞ9\:\dþÞð? : ½eE�½þ��?\dþÞ?
This requires a numerical value to both precede and follow a‘‘�’’ such that messages ending with the station name followed bya period are not misinterpreted as floating point values.
After the station names are associated and the data values areread, a simple, flat, text-file-based database is updated with thenew measurements. The file – a .csv file for each gage – is kepton the server along with the code. Social.Water reads thedatabase using the email_reader.read_CSV_data() method,appends the new measurements using the email_reader.upda-te_data_fields() method, along with a POSIX datestamp col-umn (it is easier to sort on the POSIX datestamp than on the stringrepresentation of the date), and sorts by date removing duplicates(in case all messages were reread). The updated .csv file replacesthe previous file using email_reader.write_all_data_to_CSV().The methods interacting with the database could easily beexchanged with more sophisticated code to interact with a rela-tional database or geographical information system (GIS).
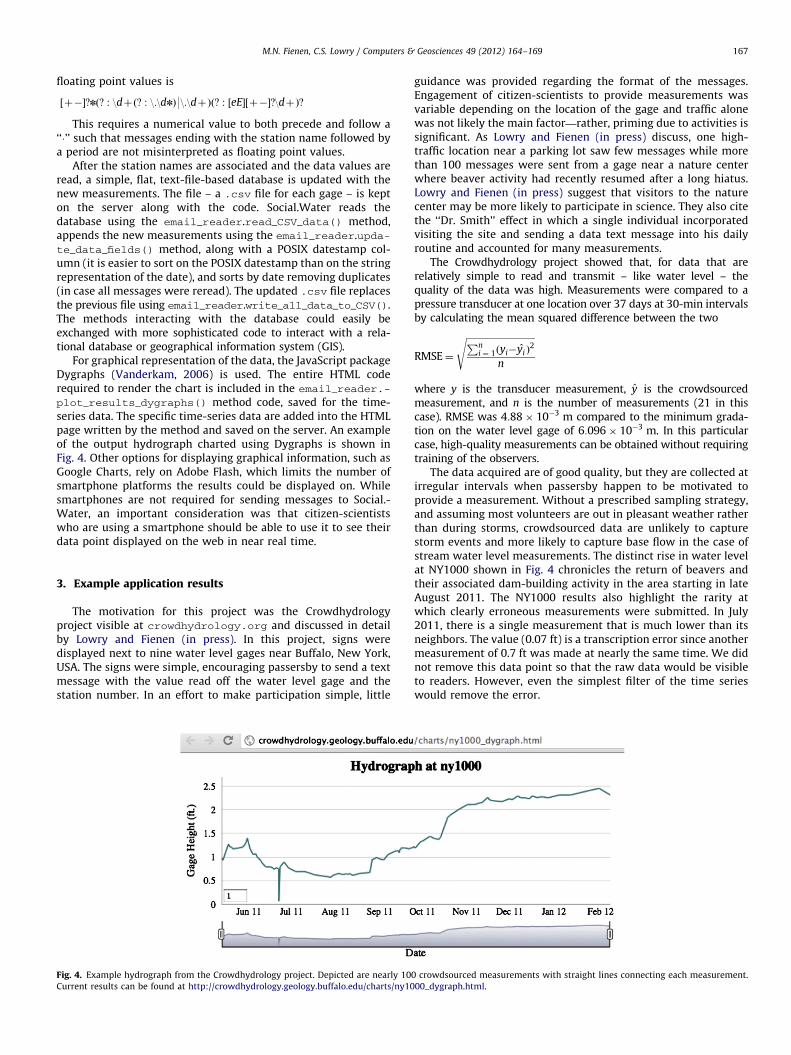
For graphical representation of the data, the JavaScript packageDygraphs (Vanderkam, 2006) is used. The entire HTML coderequired to render the chart is included in the email_reader.-plot_results_dygraphs() method code, saved for the time-series data. The specific time-series data are added into the HTMLpage written by the method and saved on the server. An exampleof the output hydrograph charted using Dygraphs is shown inFig. 4. Other options for displaying graphical information, such asGoogle Charts, rely on Adobe Flash, which limits the number ofsmartphone platforms the results could be displayed on. Whilesmartphones are not required for sending messages to Social.-Water, an important consideration was that citizen-scientistswho are using a smartphone should be able to use it to see theirdata point displayed on the web in near real time.
3. Example application results
The motivation for this project was the Crowdhydrologyproject visible at crowdhydrology.org and discussed in detailby Lowry and Fienen (in press). In this project, signs weredisplayed next to nine water level gages near Buffalo, New York,USA. The signs were simple, encouraging passersby to send a textmessage with the value read off the water level gage and thestation number. In an effort to make participation simple, little
Fig. 4. Example hydrograph from the Crowdhydrology project. Depicted are nearly 10
Current results can be found at http://crowdhydrology.geology.buffalo.edu/charts/ny10
guidance was provided regarding the format of the messages.Engagement of citizen-scientists to provide measurements wasvariable depending on the location of the gage and traffic alonewas not likely the main factor—rather, priming due to activities issignificant. As Lowry and Fienen (in press) discuss, one high-traffic location near a parking lot saw few messages while morethan 100 messages were sent from a gage near a nature centerwhere beaver activity had recently resumed after a long hiatus.Lowry and Fienen (in press) suggest that visitors to the naturecenter may be more likely to participate in science. They also citethe ‘‘Dr. Smith’’ effect in which a single individual incorporatedvisiting the site and sending a data text message into his dailyroutine and accounted for many measurements.
The Crowdhydrology project showed that, for data that arerelatively simple to read and transmit – like water level – thequality of the data was high. Measurements were compared to apressure transducer at one location over 37 days at 30-min intervalsby calculating the mean squared difference between the two
RMSE¼
ffiffiffiffiffiffiffiffiffiffiffiffiffiffiffiffiffiffiffiffiffiffiffiffiffiffiffiffiffiffiPni ¼ 1ðyi�yi Þ
2
n
s
where y is the transducer measurement, y is the crowdsourcedmeasurement, and n is the number of measurements (21 in thiscase). RMSE was 4:88� 10�3 m compared to the minimum grada-tion on the water level gage of 6:096� 10�3 m. In this particularcase, high-quality measurements can be obtained without requiringtraining of the observers.
The data acquired are of good quality, but they are collected atirregular intervals when passersby happen to be motivated toprovide a measurement. Without a prescribed sampling strategy,and assuming most volunteers are out in pleasant weather ratherthan during storms, crowdsourced data are unlikely to capturestorm events and more likely to capture base flow in the case ofstream water level measurements. The distinct rise in water levelat NY1000 shown in Fig. 4 chronicles the return of beavers andtheir associated dam-building activity in the area starting in lateAugust 2011. The NY1000 results also highlight the rarity atwhich clearly erroneous measurements were submitted. In July2011, there is a single measurement that is much lower than itsneighbors. The value (0.07 ft) is a transcription error since anothermeasurement of 0.7 ft was made at nearly the same time. We didnot remove this data point so that the raw data would be visibleto readers. However, even the simplest filter of the time serieswould remove the error.
0 crowdsourced measurements with straight lines connecting each measurement.
00_dygraph.html.
M.N. Fienen, C.S. Lowry / Computers & Geosciences 49 (2012) 164–169168
As Lowry and Fienen (in press) indicated, the crowdsourcing ofhydrologic data in this context may be of secondary utility foracquiring data, but of principal utility for public engagement. Thetechnical backend, through Social.Water has the potential to scaleto other contexts as discussed in the next section.
4. Discussion and future plans
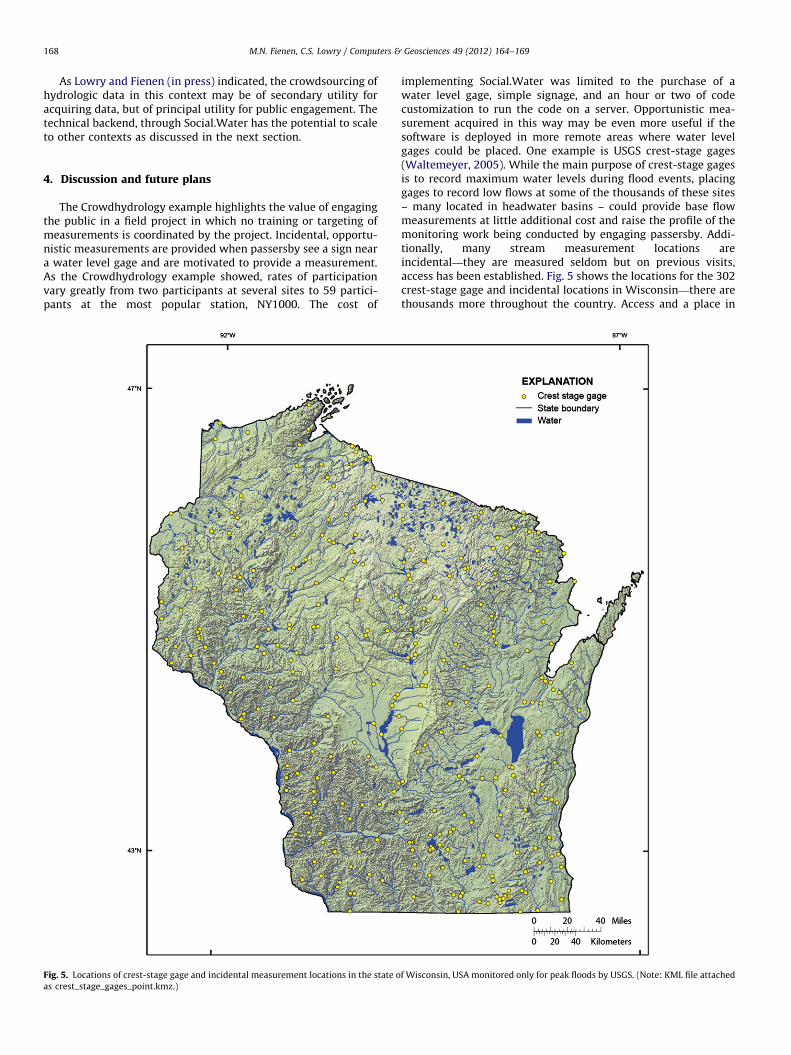
The Crowdhydrology example highlights the value of engagingthe public in a field project in which no training or targeting ofmeasurements is coordinated by the project. Incidental, opportu-nistic measurements are provided when passersby see a sign neara water level gage and are motivated to provide a measurement.As the Crowdhydrology example showed, rates of participationvary greatly from two participants at several sites to 59 partici-pants at the most popular station, NY1000. The cost of
Fig. 5. Locations of crest-stage gage and incidental measurement locations in the state o
as crest_stage_gages_point.kmz.)
implementing Social.Water was limited to the purchase of awater level gage, simple signage, and an hour or two of codecustomization to run the code on a server. Opportunistic mea-surement acquired in this way may be even more useful if thesoftware is deployed in more remote areas where water levelgages could be placed. One example is USGS crest-stage gages(Waltemeyer, 2005). While the main purpose of crest-stage gagesis to record maximum water levels during flood events, placinggages to record low flows at some of the thousands of these sites– many located in headwater basins – could provide base flowmeasurements at little additional cost and raise the profile of themonitoring work being conducted by engaging passersby. Addi-tionally, many stream measurement locations areincidental—they are measured seldom but on previous visits,access has been established. Fig. 5 shows the locations for the 302crest-stage gage and incidental locations in Wisconsin—there arethousands more throughout the country. Access and a place in
f Wisconsin, USA monitored only for peak floods by USGS. (Note: KML file attached
M.N. Fienen, C.S. Lowry / Computers & Geosciences 49 (2012) 164–169 169
existing data systems are already in place, so it would bestraightforward to incorporate these sites into a citizen-scientistnetwork, using Social.Water to obtain more volunteerobservations.
A similar plan is to monitor lake levels at boat landings innorthern Wisconsin. This will be part of the NSF North TemperateLakes Long Term Ecological Research Program in the Trout Lakebasin. Collaboration with social scientists will help to quantifychanges in the valuation or perception of environmental data bymembers of the general public who interface with the project byproviding water level data.
An additional application may be more targeted either at userswho receive some training or for users with more of a vestedinterest in the data. For example, the University of WisconsinExtension program maintains a Citizen-Based Water MonitoringNetwork http://watermonitoring.uwex.edu/index.html with threelevels of training ranging from non-trained measurements (simi-lar to the water levels in Crowdhydrology) to specialized projectsrequiring training and specialized instrumentation (for example,road salt monitoring in urban waters http://watermonitoring.uwex.edu/level3/UrbanRoadSalt.html). At all levels, Social.Watercould be expanded and customized to make submitting the datafrom such projects easier both for researchers and citizen-scien-tists. Other example applications include recreational users suchas whitewater enthusiasts for whom ungaged rivers of paddlinginterest can be determined runnable or not based on water level.Hydrographs updated by users on such rivers would be a valuablepublic service and, depending on the popularity of the site, wouldhave the potential to provide time-series data of benefit toresearchers and potentially measure the popularity of the rivers.
The Social.Water code was designed to be object-oriented in partso that various classes could be changed and updated to accom-modate different needs. For example, geolocated photographs canbe sent by smartphones as attachments to text messages, so withoutrequiring a custom smartphone application, photographs and loca-tion tagging could be obtained by updating how messages areparsed. Furthermore, the flat table .csv file database is adequatefor small projects, but for larger datasets, a relational database mightbe required. The methods that read and write the data file areindependent from those that parse and interpret the data frommessages, so database code using, for example, SQL (Structure QueryLanguage) could be implemented. The code for Social.Water isavailable for download at https://github.com/mnfienen-
usgs/Social.Water and is open-source so that this customizationor any other can be made by any user. This backend technologycould also be applied to dedicated smartphone applications thatcould include photographs and location information.
The proof-of-concept in this work is one contribution towardfuller engagement of the public in providing scientific observa-tions, leveraging new technology but remaining consistent withefforts spanning back over a century to the beginning of theAudubon Society Christmas Bird Count.
Acknowledgments
We wish to thank Laura De Cicco (USGS) for introducing us toDygraphs and David Yearke (University at Buffalo) for server-sidelogistics. We also thank David Steward and William Bartlett (USGS)for compiling information on the crest-stage gage and incidentalmeasurements location network. Wesley Brooks (USGS/Universityof Wisconsin–Madison) provided a valuable review. Any use oftrade, firm, or product names is for descriptive purposes only anddoes not imply endorsement by the U.S. Government.
Appendix A. Supplementary data
Supplementary data associated with this article can be foundin the online version at doi:http://dx.doi.org.10.1016/j.cageo.2012.06.015crest_stage_gages_point.kml. These data includeGoogle maps of the most important areas described in this article.
References
Cohen, A., 2011. Fuzzywuzzy: Fuzzy String Matching Like a Boss. Available onlineat /https://github.com/seatgeek/fuzzywuzzyS (accessed May 26, 2012).
Howe, J., 2006. The Rise of Crowdsourcing, Wired, 14.06.IBM, 2012. Creek Watch. /http://www.ibm.com/smarterplanet/us/en/water_man
agement/article/creek_watch.htmlS.Internet Engineering Task Force, 2003a. The Base16, Base32, and Base64 Data
Encodings. /http://tools.ietf.org/html/rfc3548.htmlS.Internet Engineering Task Force, 2003b. Internet Message Access
Protocol—Version 4rev1. /http://tools.ietf.org/html/rfc3501S.Isaac, M., 2011. Jobs Was Right: Adobe Abandons Mobile Flash, backs html5.
Wired, Gadget Lab, Online.Lowry, C.S., Fienen, M.N. Crowdsourcing to acquire hydrologic data and engage
citizen scientists: CrowdHydrology. Ground Water, http://dx.doi.org/10.1111/j.1745-6584.2012.00956.x, in press.
Park, Y.S., Han, S.H., 2010. Touch key design for one-handed thumb interactionwith a mobile phone: effects of touch key size and touch key location.International Journal of Industrial Ergonomics 40 (1), 68–76.
Smith, A., 2012. Nearly Half of American Adults are Smartphone Owners. TechnicalReport. Pew Research Center.
van Rossum, G., 2012. Python Reference Manual.Vanderkam, D., 2006. Dygraphs Javascript Charting Library.Waltemeyer, S.D., 2005. Automated Crest-Stage Gage Application in Ephemeral
Streams in New Mexico, Fact Sheet 2005-3136. USGS.Wiersma, Y.F., 2010. Birding 2.0: citizen science and effective monitoring in the
web 2.0 world. Avian Conservation and Ecology 5 (2).