Embed Size (px)
Citation preview

Socially Responsible Investing
Sudheer ChavaAssociate Professor of Finance
College of ManagementGeorgia Institute of Technology
Sudheer Chava Socially Responsible Investing April 2011 1 / 37

Environmental Externalities
How can environmental externalities be internalized by a firm?
Regulation
Taxes
Socially Responsible Investing
Environmentally Responsible Lending
Sudheer Chava Socially Responsible Investing April 2011 2 / 37
Motivation: Socially Responsible Investing
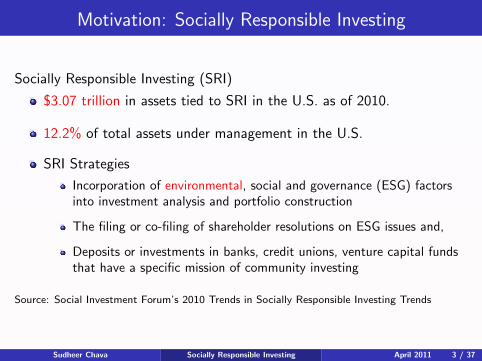
Socially Responsible Investing (SRI)
$3.07 trillion in assets tied to SRI in the U.S. as of 2010.
12.2% of total assets under management in the U.S.
SRI Strategies
Incorporation of environmental, social and governance (ESG) factorsinto investment analysis and portfolio construction
The filing or co-filing of shareholder resolutions on ESG issues and,
Deposits or investments in banks, credit unions, venture capital fundsthat have a specific mission of community investing
Source: Social Investment Forum’s 2010 Trends in Socially Responsible Investing Trends
Sudheer Chava Socially Responsible Investing April 2011 3 / 37
Motivation: Significant Growth in Socially ResponsibleInvesting
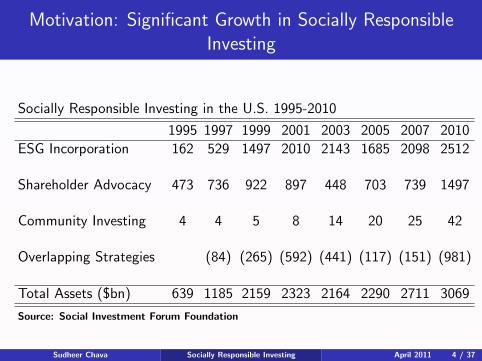
Socially Responsible Investing in the U.S. 1995-2010
1995 1997 1999 2001 2003 2005 2007 2010
ESG Incorporation 162 529 1497 2010 2143 1685 2098 2512
Shareholder Advocacy 473 736 922 897 448 703 739 1497
Community Investing 4 4 5 8 14 20 25 42
Overlapping Strategies (84) (265) (592) (441) (117) (151) (981)
Total Assets ($bn) 639 1185 2159 2323 2164 2290 2711 3069
Source: Social Investment Forum Foundation
Sudheer Chava Socially Responsible Investing April 2011 4 / 37
Motivation: Significant Growth in Socially ResponsibleInvesting
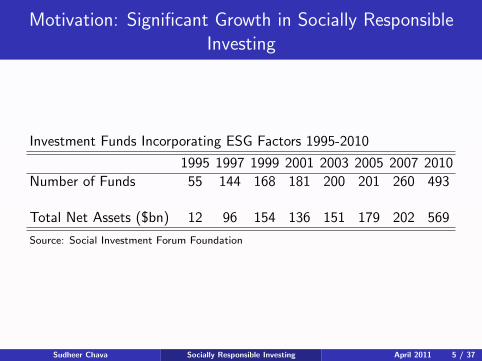
Investment Funds Incorporating ESG Factors 1995-2010
1995 1997 1999 2001 2003 2005 2007 2010
Number of Funds 55 144 168 181 200 201 260 493
Total Net Assets ($bn) 12 96 154 136 151 179 202 569
Source: Social Investment Forum Foundation
Sudheer Chava Socially Responsible Investing April 2011 5 / 37
Motivation: Environmentally Responsible Lending
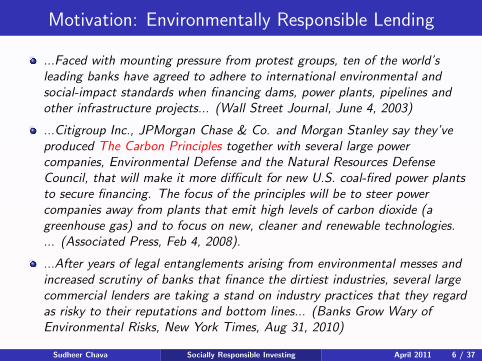
...Faced with mounting pressure from protest groups, ten of the world’sleading banks have agreed to adhere to international environmental andsocial-impact standards when financing dams, power plants, pipelines andother infrastructure projects... (Wall Street Journal, June 4, 2003)
...Citigroup Inc., JPMorgan Chase & Co. and Morgan Stanley say they’veproduced The Carbon Principles together with several large powercompanies, Environmental Defense and the Natural Resources DefenseCouncil, that will make it more difficult for new U.S. coal-fired power plantsto secure financing. The focus of the principles will be to steer powercompanies away from plants that emit high levels of carbon dioxide (agreenhouse gas) and to focus on new, cleaner and renewable technologies.... (Associated Press, Feb 4, 2008).
...After years of legal entanglements arising from environmental messes andincreased scrutiny of banks that finance the dirtiest industries, several largecommercial lenders are taking a stand on industry practices that they regardas risky to their reputations and bottom lines... (Banks Grow Wary ofEnvironmental Risks, New York Times, Aug 31, 2010)
Sudheer Chava Socially Responsible Investing April 2011 6 / 37
Motivation: Environmentally Responsible Lending
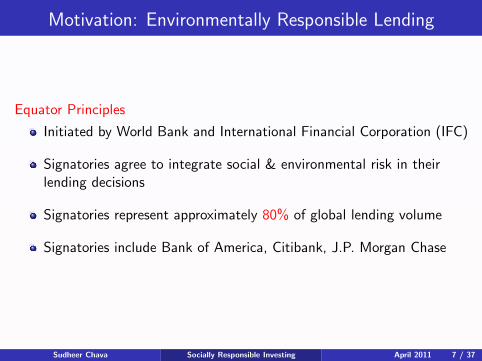
Equator Principles
Initiated by World Bank and International Financial Corporation (IFC)
Signatories agree to integrate social & environmental risk in theirlending decisions
Signatories represent approximately 80% of global lending volume
Signatories include Bank of America, Citibank, J.P. Morgan Chase
Sudheer Chava Socially Responsible Investing April 2011 7 / 37

Motivation: Environmentally Responsible Lending
CERES and RiskMetrics Survey
Citi, Mitsubishi UFJ Financial Group, Mizuho Financial Group, RoyalBank of Canada and Wells Fargo are formally calculating carbon riskin their loan portfolios.
Bank of America announced a specific target to reduce green housegas (GHG) emissions associated with its lending portfolio targeting a7% reduction in the rate of GHG emissions
29 of the 40 banks analyzed in the study document their involvementin the burgeoning renewable energy and clean tech markets.
Several U.S. and European banks have made multibillion dollarinvestments or financing commitments clean energy sector.
Sudheer Chava Socially Responsible Investing April 2011 8 / 37
Implications of Socially Responsible Investing (Lending)
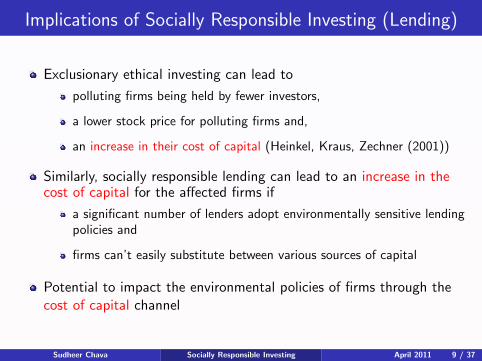
Exclusionary ethical investing can lead to
polluting firms being held by fewer investors,
a lower stock price for polluting firms and,
an increase in their cost of capital (Heinkel, Kraus, Zechner (2001))
Similarly, socially responsible lending can lead to an increase in thecost of capital for the affected firms if
a significant number of lenders adopt environmentally sensitive lendingpolicies and
firms can’t easily substitute between various sources of capital
Potential to impact the environmental policies of firms through thecost of capital channel
Sudheer Chava Socially Responsible Investing April 2011 9 / 37

Research Questions
Does the environmental profile of a firm affect
the firm’s expected stock returns?
the price and non-price term’s of its bank loans?
Sudheer Chava Socially Responsible Investing April 2011 10 / 37
Firm Level Environmental Data
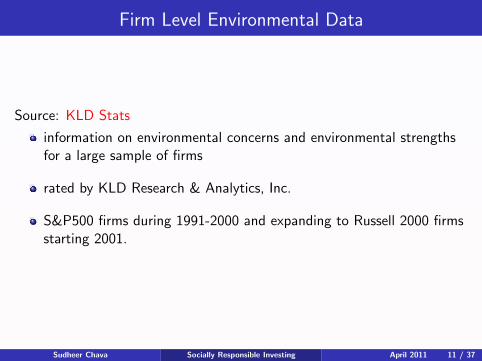
Source: KLD Stats
information on environmental concerns and environmental strengthsfor a large sample of firms
rated by KLD Research & Analytics, Inc.
S&P500 firms during 1991-2000 and expanding to Russell 2000 firmsstarting 2001.
Sudheer Chava Socially Responsible Investing April 2011 11 / 37

Alternate Data Sources for Firm Level Environmental Data
Alternate Sources
Firm’s 10-K filings
EPA Toxic Release Inventory (TRI)
Carbon Data (CD) project
Issues
Disclosure of green house gas emissions is not mandatory,
Difficult to evaluate and quantify the risk implied by the disclosednumbers
KLD collects information from a number of data sources
KLD’s team of qualified analysts evaluate the data and make decisionson whether the firm has a specific environment exposure or not.
KLD data is also available for a larger cross-section of firms over alonger time period than any of the alternate data sources
Sudheer Chava Socially Responsible Investing April 2011 12 / 37
Firm’s Environmental Profile
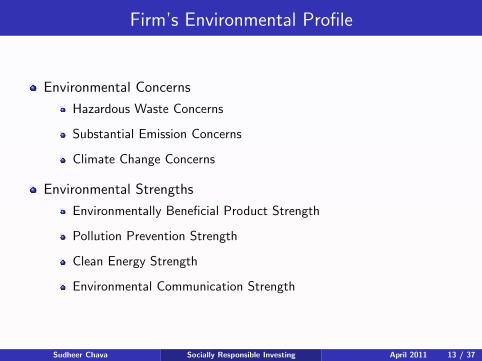
Environmental Concerns
Hazardous Waste Concerns
Substantial Emission Concerns
Climate Change Concerns
Environmental Strengths
Environmentally Beneficial Product Strength
Pollution Prevention Strength
Clean Energy Strength
Environmental Communication Strength
Sudheer Chava Socially Responsible Investing April 2011 13 / 37
Summary Environmental Measures
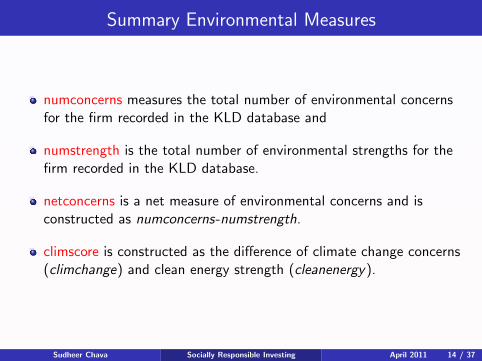
numconcerns measures the total number of environmental concernsfor the firm recorded in the KLD database and
numstrength is the total number of environmental strengths for thefirm recorded in the KLD database.
netconcerns is a net measure of environmental concerns and isconstructed as numconcerns-numstrength.
climscore is constructed as the difference of climate change concerns(climchange) and clean energy strength (cleanenergy).
Sudheer Chava Socially Responsible Investing April 2011 14 / 37
Expected Stock Returns
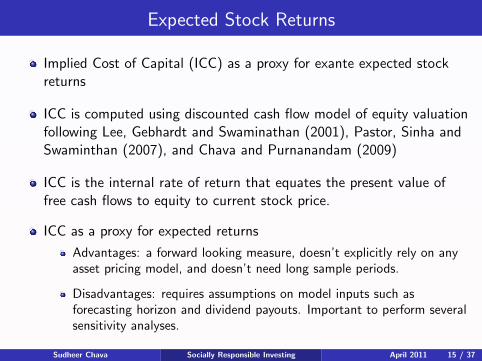
Implied Cost of Capital (ICC) as a proxy for exante expected stockreturns
ICC is computed using discounted cash flow model of equity valuationfollowing Lee, Gebhardt and Swaminathan (2001), Pastor, Sinha andSwaminthan (2007), and Chava and Purnanandam (2009)
ICC is the internal rate of return that equates the present value offree cash flows to equity to current stock price.
ICC as a proxy for expected returns
Advantages: a forward looking measure, doesn’t explicitly rely on anyasset pricing model, and doesn’t need long sample periods.
Disadvantages: requires assumptions on model inputs such asforecasting horizon and dividend payouts. Important to perform severalsensitivity analyses.
Sudheer Chava Socially Responsible Investing April 2011 15 / 37

Implied Cost of Capital (ICC)
The stock price Pi ,t of firm i at time t is given by:
Pi ,t =k=∞∑k=1
Et(FCFEi ,t+k)
(1 + ri ,e)k,
where
FCFEi,t+k is the free cash flow to equity of firm i in year t + k,
Et is the expectation operator conditional on the information at time tand
ri,e is the ICC.
I/B/E/S database is the source for all the analyst estimate data(future cashflows and long-term growth) required to compute ICC.
Sudheer Chava Socially Responsible Investing April 2011 16 / 37
Computing Expected Returns: Steps
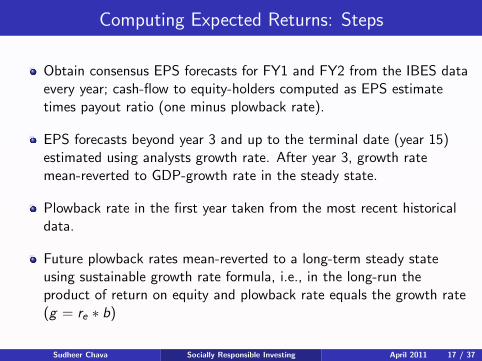
Obtain consensus EPS forecasts for FY1 and FY2 from the IBES dataevery year; cash-flow to equity-holders computed as EPS estimatetimes payout ratio (one minus plowback rate).
EPS forecasts beyond year 3 and up to the terminal date (year 15)estimated using analysts growth rate. After year 3, growth ratemean-reverted to GDP-growth rate in the steady state.
Plowback rate in the first year taken from the most recent historicaldata.
Future plowback rates mean-reverted to a long-term steady stateusing sustainable growth rate formula, i.e., in the long-run theproduct of return on equity and plowback rate equals the growth rate(g = re ∗ b)
Sudheer Chava Socially Responsible Investing April 2011 17 / 37

Descriptive Statistics: ICC
Variable Mean 10th 25th 50th 75th 90th Std.percentile percentile percentile percentile percentile dev.
Panel A: Inputs for expected return computationEPS1 1.86 0.29 0.82 1.55 2.45 3.58 2.15EPS2 2.23 0.54 1.09 1.85 2.83 4.09 2.22LTG 0.16 0.07 0.10 0.14 0.20 0.25 0.11
Panel B: Measures of Expected Returnre 8.00 6.00 7.00 8.00 9.00 11.0 3.00re − rf 4.25 0.95 2.35 3.99 5.84 7.72 2.93
Sudheer Chava Socially Responsible Investing April 2011 18 / 37

Descriptive Statistics: Environmental Profile
Panel A: Environmental Indices
Variable mean median std. dev.
netconcerns 0.16 0.00 0.84numconcern 0.37 0.00 0.84numstrength 0.21 0.00 0.52climscore 0.02 0.00 0.31
Panel B: Environmental Concerns
Variable number of firms % of sample
hazardwaste 1555 9.87%subemissions 1185 7.52%climchange 842 7.10%Panel C: Environmental Strengths
benproduct 581 3.69%polprevent 549 3.49%cleanenergy 924 5.87%envcomm 523 3.94%
Sudheer Chava Socially Responsible Investing April 2011 19 / 37
Regression Specification
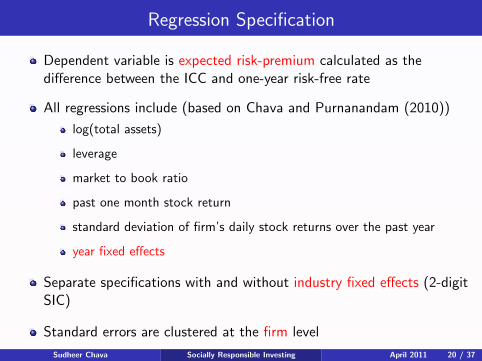
Dependent variable is expected risk-premium calculated as thedifference between the ICC and one-year risk-free rate
All regressions include (based on Chava and Purnanandam (2010))
log(total assets)
leverage
market to book ratio
past one month stock return
standard deviation of firm’s daily stock returns over the past year
year fixed effects
Separate specifications with and without industry fixed effects (2-digitSIC)
Standard errors are clustered at the firm level
Sudheer Chava Socially Responsible Investing April 2011 20 / 37
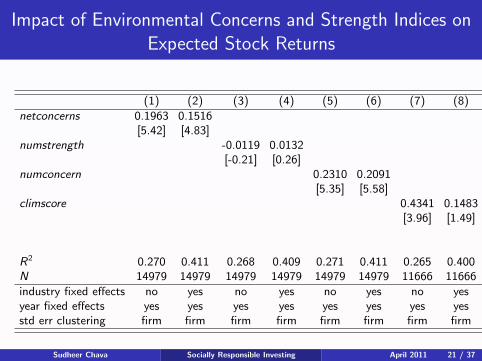
Impact of Environmental Concerns and Strength Indices onExpected Stock Returns
(1) (2) (3) (4) (5) (6) (7) (8)
netconcerns 0.1963 0.1516[5.42] [4.83]
numstrength -0.0119 0.0132[-0.21] [0.26]
numconcern 0.2310 0.2091[5.35] [5.58]
climscore 0.4341 0.1483[3.96] [1.49]
R2 0.270 0.411 0.268 0.409 0.271 0.411 0.265 0.400N 14979 14979 14979 14979 14979 14979 11666 11666
industry fixed effects no yes no yes no yes no yesyear fixed effects yes yes yes yes yes yes yes yesstd err clustering firm firm firm firm firm firm firm firm
Sudheer Chava Socially Responsible Investing April 2011 21 / 37
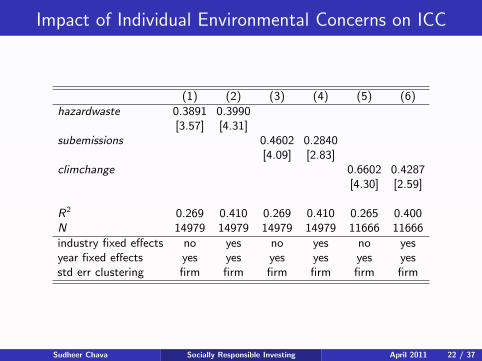
Impact of Individual Environmental Concerns on ICC
(1) (2) (3) (4) (5) (6)
hazardwaste 0.3891 0.3990[3.57] [4.31]
subemissions 0.4602 0.2840[4.09] [2.83]
climchange 0.6602 0.4287[4.30] [2.59]
R2 0.269 0.410 0.269 0.410 0.265 0.400N 14979 14979 14979 14979 11666 11666
industry fixed effects no yes no yes no yesyear fixed effects yes yes yes yes yes yesstd err clustering firm firm firm firm firm firm
Sudheer Chava Socially Responsible Investing April 2011 22 / 37
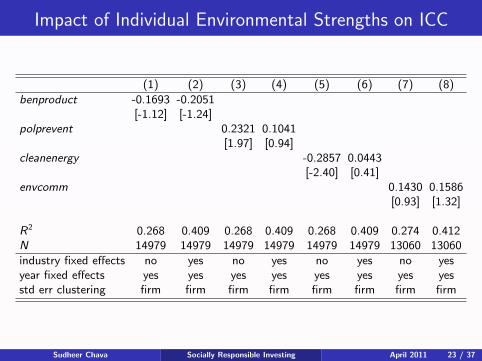
Impact of Individual Environmental Strengths on ICC
(1) (2) (3) (4) (5) (6) (7) (8)
benproduct -0.1693 -0.2051[-1.12] [-1.24]
polprevent 0.2321 0.1041[1.97] [0.94]
cleanenergy -0.2857 0.0443[-2.40] [0.41]
envcomm 0.1430 0.1586[0.93] [1.32]
R2 0.268 0.409 0.268 0.409 0.268 0.409 0.274 0.412N 14979 14979 14979 14979 14979 14979 13060 13060
industry fixed effects no yes no yes no yes no yesyear fixed effects yes yes yes yes yes yes yes yesstd err clustering firm firm firm firm firm firm firm firm
Sudheer Chava Socially Responsible Investing April 2011 23 / 37

Possible Explanations
Why do investors demand higher expected returns on stocks withenvironmental concerns?
Risk
Regulatory Risk
Litigation and Compliance Costs for Borrower
Credit Risk
Exclusionary Socially Responsible Investing
Sudheer Chava Socially Responsible Investing April 2011 24 / 37

Impact of Environmental Concerns and Strengths onInstitutional Ownership
(1) (2) (3) (4) (5) (6)
Environmental Concernshazardwaste -0.0399 -0.0282 -0.0312 -0.0226
[-2.98] [-2.10] [-2.43] [-1.69]subemissions -0.0192 -0.0037 -0.0156 0.0006
[-1.88] [-0.35] [-1.55] [0.06]climchange -0.0848 -0.0403 -0.0790 -0.0404
[-6.04] [-2.70] [-5.63] [-2.71]Environmental Strengthsbenproduct 0.0173 0.0001 0.0110 -0.0020
[1.07] [0.01] [0.65] [-0.12]polprevent 0.0147 -0.0133 0.0180 -0.0085
[1.00] [-0.90] [1.14] [-0.52]cleanenergy -0.0841 -0.0235 -0.0639 -0.0233
[-6.10] [-1.94] [-4.57] [-1.82]envcomm -0.0364 -0.0378 -0.0271 -0.0376
[-2.52] [-2.73] [-1.83] [-2.56]industry fixed effects no yes no yes no yes
Sudheer Chava Socially Responsible Investing April 2011 25 / 37

Socially Responsible Investing: Summary of the Results
Yes. The environmental profile of a firm affects the expected stockreturns
Environmental Concerns: increases the ICC
Environmental Strengths: no meaningful relation with ICC
Environmental profile is not simply proxying for an omittedcomponent of default risk of the firm.
But it is a challenging task to conclusively rule out the risk story
Why do investors expect higher returns on stocks with environmentalconcerns?
Stocks with environmental concerns have a lower institutionalownership and are held by fewer institutional investors
Consistent with exclusionary socially responsible investing having animpact on the expected returns
Sudheer Chava Socially Responsible Investing April 2011 26 / 37
Socially Responsible Lending and Terms of Banks Loans
Source for Bank Loan Data: Dealscan
distributed by the Loan Pricing Corporation (Reuters)
contains information on approximately 106, 000 facilities to domesticcompanies
approximately 50, 000 facilities can be linked firm level balance sheetinformation in Compustat (using Chava and Roberts (2008) link file)
merging with the KLD database results in 6525 bank loans tonon-financial firms during 1990 − 2008
Sudheer Chava Socially Responsible Investing April 2011 27 / 37
Bank Loan Data
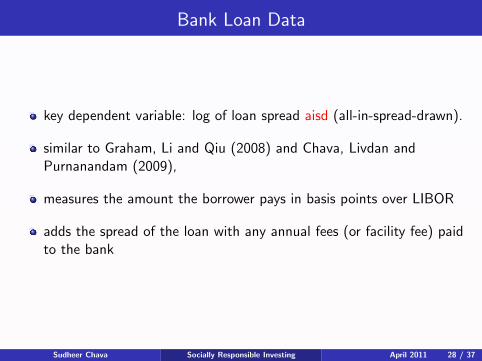
key dependent variable: log of loan spread aisd (all-in-spread-drawn).
similar to Graham, Li and Qiu (2008) and Chava, Livdan andPurnanandam (2009),
measures the amount the borrower pays in basis points over LIBOR
adds the spread of the loan with any annual fees (or facility fee) paidto the bank
Sudheer Chava Socially Responsible Investing April 2011 28 / 37
Regression Specification
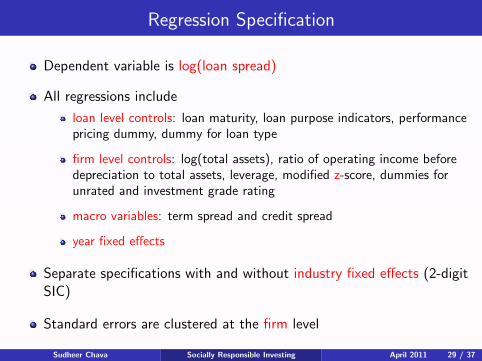
Dependent variable is log(loan spread)
All regressions include
loan level controls: loan maturity, loan purpose indicators, performancepricing dummy, dummy for loan type
firm level controls: log(total assets), ratio of operating income beforedepreciation to total assets, leverage, modified z-score, dummies forunrated and investment grade rating
macro variables: term spread and credit spread
year fixed effects
Separate specifications with and without industry fixed effects (2-digitSIC)
Standard errors are clustered at the firm level
Sudheer Chava Socially Responsible Investing April 2011 29 / 37
Impact of Environmental Concerns and Strength Indices onBank Loan Spreads
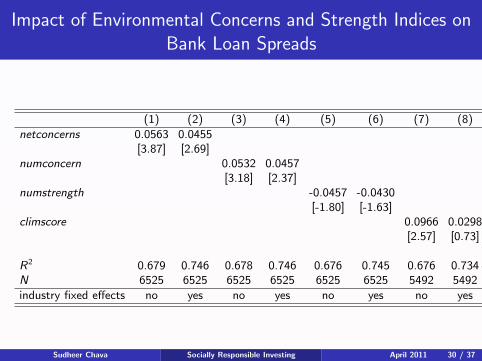
(1) (2) (3) (4) (5) (6) (7) (8)
netconcerns 0.0563 0.0455[3.87] [2.69]
numconcern 0.0532 0.0457[3.18] [2.37]
numstrength -0.0457 -0.0430[-1.80] [-1.63]
climscore 0.0966 0.0298[2.57] [0.73]
R2 0.679 0.746 0.678 0.746 0.676 0.745 0.676 0.734N 6525 6525 6525 6525 6525 6525 5492 5492
industry fixed effects no yes no yes no yes no yes
Sudheer Chava Socially Responsible Investing April 2011 30 / 37
Impact of Individual Environmental Concerns on BankLoan Spreads
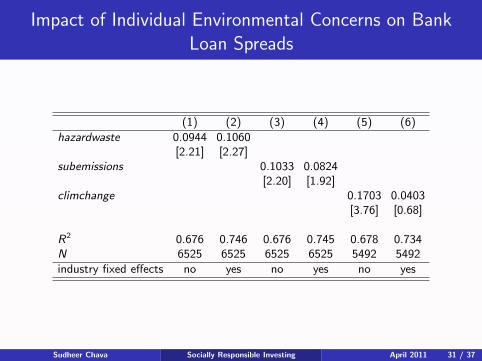
(1) (2) (3) (4) (5) (6)
hazardwaste 0.0944 0.1060[2.21] [2.27]
subemissions 0.1033 0.0824[2.20] [1.92]
climchange 0.1703 0.0403[3.76] [0.68]
R2 0.676 0.746 0.676 0.745 0.678 0.734N 6525 6525 6525 6525 5492 5492
industry fixed effects no yes no yes no yes
Sudheer Chava Socially Responsible Investing April 2011 31 / 37

Impact of Individual Environmental Strengths on BankLoan Spreads
(1) (2) (3) (4) (5) (6) (7) (8)
benproduct -0.2048 -0.2147[-4.06] [-3.69]
cleanenergy 0.0347 -0.0317[0.72] [-0.60]
polprevent -0.1003 -0.0330[-1.44] [-0.42]
envcomm -0.0192 -0.0128[-0.28] [-0.19]
R2 0.677 0.746 0.676 0.745 0.676 0.745 0.681 0.744N 6525 6525 6525 6525 6525 6525 5997 5997
industry fixed effects no yes no yes no yes no yes
Sudheer Chava Socially Responsible Investing April 2011 32 / 37
Environmentally Responsible Lending
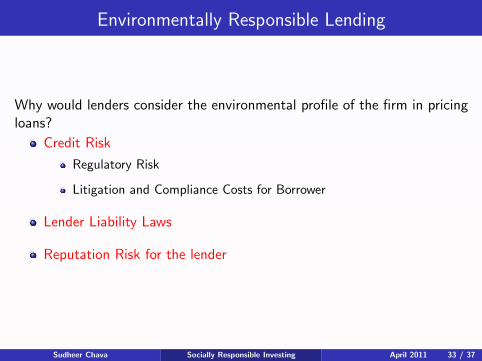
Why would lenders consider the environmental profile of the firm in pricingloans?
Credit Risk
Regulatory Risk
Litigation and Compliance Costs for Borrower
Lender Liability Laws
Reputation Risk for the lender
Sudheer Chava Socially Responsible Investing April 2011 33 / 37
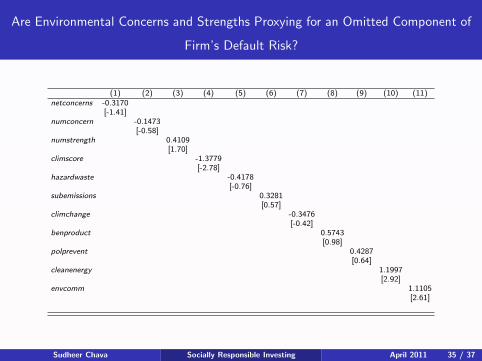
Are Environmental Concerns and Strengths Proxying for an Omitted Component of
Firm’s Default Risk?
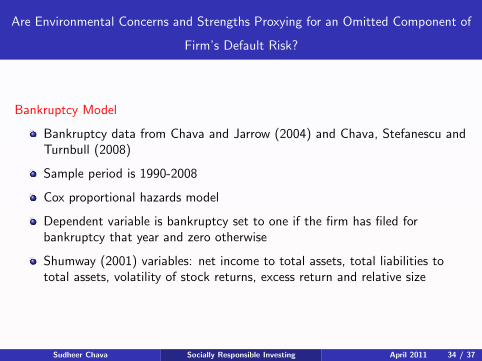
Bankruptcy Model
Bankruptcy data from Chava and Jarrow (2004) and Chava, Stefanescu andTurnbull (2008)
Sample period is 1990-2008
Cox proportional hazards model
Dependent variable is bankruptcy set to one if the firm has filed forbankruptcy that year and zero otherwise
Shumway (2001) variables: net income to total assets, total liabilities tototal assets, volatility of stock returns, excess return and relative size
Sudheer Chava Socially Responsible Investing April 2011 34 / 37
Are Environmental Concerns and Strengths Proxying for an Omitted Component of
Firm’s Default Risk?
(1) (2) (3) (4) (5) (6) (7) (8) (9) (10) (11)netconcerns -0.3170
[-1.41]numconcern -0.1473
[-0.58]numstrength 0.4109
[1.70]climscore -1.3779
[-2.78]hazardwaste -0.4178
[-0.76]subemissions 0.3281
[0.57]climchange -0.3476
[-0.42]benproduct 0.5743
[0.98]polprevent 0.4287
[0.64]cleanenergy 1.1997
[2.92]envcomm 1.1105
[2.61]
Sudheer Chava Socially Responsible Investing April 2011 35 / 37
Environmentally Responsible Lending: Summary of theResults
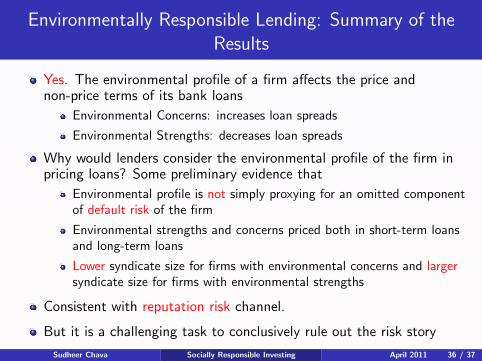
Yes. The environmental profile of a firm affects the price andnon-price terms of its bank loans
Environmental Concerns: increases loan spreads
Environmental Strengths: decreases loan spreads
Why would lenders consider the environmental profile of the firm inpricing loans? Some preliminary evidence that
Environmental profile is not simply proxying for an omitted componentof default risk of the firm
Environmental strengths and concerns priced both in short-term loansand long-term loans
Lower syndicate size for firms with environmental concerns and largersyndicate size for firms with environmental strengths
Consistent with reputation risk channel.
But it is a challenging task to conclusively rule out the risk story
Sudheer Chava Socially Responsible Investing April 2011 36 / 37

Conclusion
Socially responsible investing / lending
can increase the cost of capital of firms with environmental concerns
has a potential to impact the environmental policies of the firmthrough the cost of capital channel
Sudheer Chava Socially Responsible Investing April 2011 37 / 37