Embed Size (px)
Citation preview
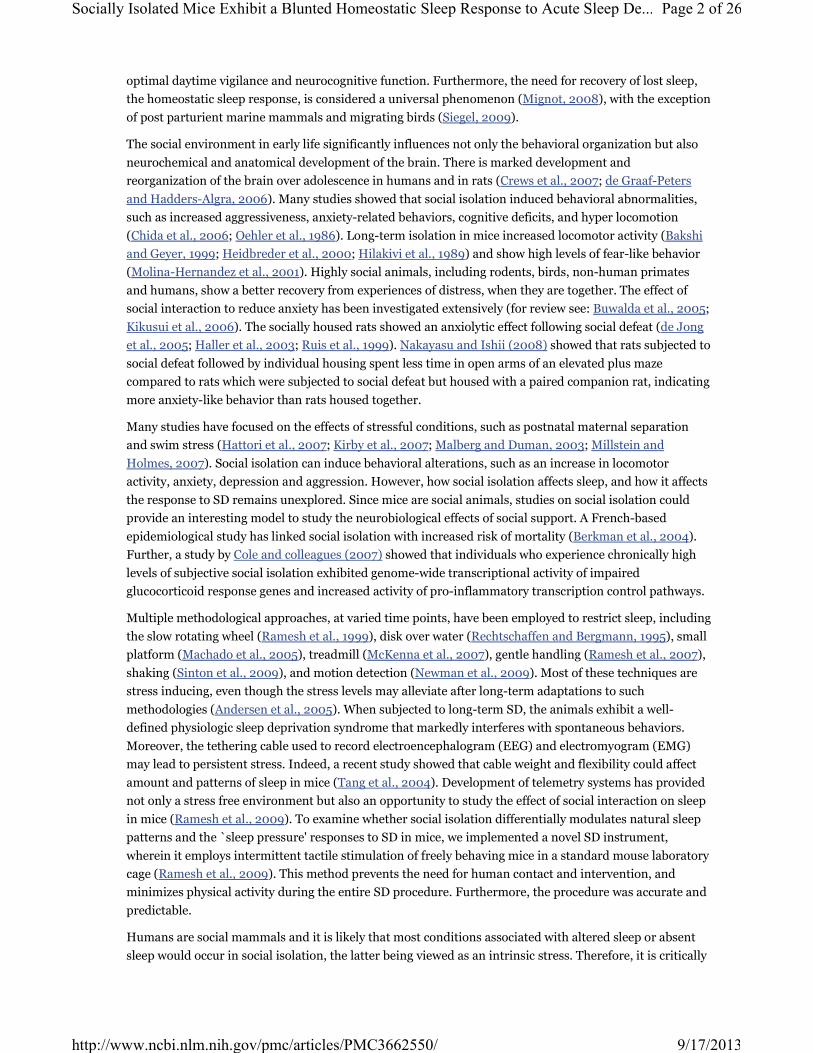
Brain Res. Author manuscript; available in PMC 2013 May 23.
Published in final edited form as:
Brain Res. 2012 May 15; 1454: 65–79.
Published online 2012 March 15. doi: 10.1016/j.brainres.2012.03.019
PMCID: PMC3662550
NIHMSID: NIHMS364567
Socially Isolated Mice Exhibit a Blunted Homeostatic Sleep Response to Acute
Sleep Deprivation Compared to Socially Paired Mice
Navita Kaushal, Deepti Nair, David Gozal, and Vijay Ramesh
Department of Pediatrics, Section of Sleep Medicine, University of Chicago, Chicago, Illinois, United States of America
Corresponding Author: Ramesh Vijay PhD, Department of Pediatrics, University of Chicago, 900 E 57 St, Chicago, IL. Phone: (773) 702-6872;
FAX: (773) 702-6888; Email: [email protected] .
Copyright notice and Disclaimer
Publisher's Disclaimer
Abstract
Sleep is an important physiological process underlying maintenance of physical, mental and emotional
health. Consequently, sleep deprivation (SD) is associated with adverse consequences and increases the
risk for anxiety, immune, and cognitive disorders. SD is characterized by increased energy expenditure
responses and sleep rebound upon recovery that are regulated by homeostatic processes, which in turn are
influenced by stress. Since all previous studies on SD were conducted in a setting of social isolation, the
impact of the social contextual setting is unknown. Therefore, we used a relatively stress-free SD paradigm
in mice to assess the impact of social isolation on sleep, wakefulness and delta electroencephalogram
(EEG) power during non-rapid eye movement (NREM) sleep. Paired or isolated C57BL/6J adult
chronically-implanted male mice were exposed to SD for 6 hours and telemetric polygraphic recordings
were conducted, including 18 hours recovery. Recovery from SD in the paired group showed a significant
decrease in wake and significant increase in NREM sleep and rapid eye movement (REM), and a similar,
albeit less robust response occurred in the isolated mice. Delta power during NREM sleep was increased in
both groups immediately following SD, but paired mice exhibited significantly higher delta power
throughout the dark period. The increase in body temperature and gross motor activity observed during
the SD procedure was decreased during the dark period. In both open field and elevated plus maze tests,
socially isolated mice showed significantly higher anxiety than paired mice. The homeostatic processes
altered by SD are differentially affected in paired and isolated mice, suggesting that the social context of
isolation stress may adversely affect the quantity and quality of sleep in mice.
Keywords: Sleep, Sleep deprivation, Social isolation stress, Delta power, Sleep homeostasis, Anxiety
1. Introduction
Sleep deprivation (SD) is a commonly used methodological strategy that enables differential evaluation of
sleep homeostasis resulting in `sleep debt'. The slow wave activity (SWA) rebound after SD provides a
reliable index of the sleep homeostatic response (Daan et al., 1984) and induces a predictable increase in
EEG delta power in non-rapid eye movement (NREM) sleep during subsequent sleep (Dijk et al., 1990),
which may be locally increased in a use-dependent manner (Vyazovskiy and Tobler, 2008). Many studies
have shown that sleep loss has a significant effect on stress response (Martinez-Gonzalez et al., 2004),
motivation (Kennedy, 2002), learning (Stickgold et al., 2001) and performance (Pilcher and Huffcutt,
1996). Stepanski (2002) observed that uninterrupted sleep for a minimum length of time is required for
1 1 1 1,*
1
* th
Page 1 of 26Socially Isolated Mice Exhibit a Blunted Homeostatic Sleep Response to Acute Sleep De...
9/17/2013http://www.ncbi.nlm.nih.gov/pmc/articles/PMC3662550/
optimal daytime vigilance and neurocognitive function. Furthermore, the need for recovery of lost sleep,
the homeostatic sleep response, is considered a universal phenomenon (Mignot, 2008), with the exception
of post parturient marine mammals and migrating birds (Siegel, 2009).
The social environment in early life significantly influences not only the behavioral organization but also
neurochemical and anatomical development of the brain. There is marked development and
reorganization of the brain over adolescence in humans and in rats (Crews et al., 2007; de Graaf-Peters
and Hadders-Algra, 2006). Many studies showed that social isolation induced behavioral abnormalities,
such as increased aggressiveness, anxiety-related behaviors, cognitive deficits, and hyper locomotion
(Chida et al., 2006; Oehler et al., 1986). Long-term isolation in mice increased locomotor activity (Bakshi
and Geyer, 1999; Heidbreder et al., 2000; Hilakivi et al., 1989) and show high levels of fear-like behavior
(Molina-Hernandez et al., 2001). Highly social animals, including rodents, birds, non-human primates
and humans, show a better recovery from experiences of distress, when they are together. The effect of
social interaction to reduce anxiety has been investigated extensively (for review see: Buwalda et al., 2005;
Kikusui et al., 2006). The socially housed rats showed an anxiolytic effect following social defeat (de Jong
et al., 2005; Haller et al., 2003; Ruis et al., 1999). Nakayasu and Ishii (2008) showed that rats subjected to
social defeat followed by individual housing spent less time in open arms of an elevated plus maze
compared to rats which were subjected to social defeat but housed with a paired companion rat, indicating
more anxiety-like behavior than rats housed together.
Many studies have focused on the effects of stressful conditions, such as postnatal maternal separation
and swim stress (Hattori et al., 2007; Kirby et al., 2007; Malberg and Duman, 2003; Millstein and
Holmes, 2007). Social isolation can induce behavioral alterations, such as an increase in locomotor
activity, anxiety, depression and aggression. However, how social isolation affects sleep, and how it affects
the response to SD remains unexplored. Since mice are social animals, studies on social isolation could
provide an interesting model to study the neurobiological effects of social support. A French-based
epidemiological study has linked social isolation with increased risk of mortality (Berkman et al., 2004).
Further, a study by Cole and colleagues (2007) showed that individuals who experience chronically high
levels of subjective social isolation exhibited genome-wide transcriptional activity of impaired
glucocorticoid response genes and increased activity of pro-inflammatory transcription control pathways.
Multiple methodological approaches, at varied time points, have been employed to restrict sleep, including
the slow rotating wheel (Ramesh et al., 1999), disk over water (Rechtschaffen and Bergmann, 1995), small
platform (Machado et al., 2005), treadmill (McKenna et al., 2007), gentle handling (Ramesh et al., 2007),
shaking (Sinton et al., 2009), and motion detection (Newman et al., 2009). Most of these techniques are
stress inducing, even though the stress levels may alleviate after long-term adaptations to such
methodologies (Andersen et al., 2005). When subjected to long-term SD, the animals exhibit a well-
defined physiologic sleep deprivation syndrome that markedly interferes with spontaneous behaviors.
Moreover, the tethering cable used to record electroencephalogram (EEG) and electromyogram (EMG)
may lead to persistent stress. Indeed, a recent study showed that cable weight and flexibility could affect
amount and patterns of sleep in mice (Tang et al., 2004). Development of telemetry systems has provided
not only a stress free environment but also an opportunity to study the effect of social interaction on sleep
in mice (Ramesh et al., 2009). To examine whether social isolation differentially modulates natural sleep
patterns and the `sleep pressure' responses to SD in mice, we implemented a novel SD instrument,
wherein it employs intermittent tactile stimulation of freely behaving mice in a standard mouse laboratory
cage (Ramesh et al., 2009). This method prevents the need for human contact and intervention, and
minimizes physical activity during the entire SD procedure. Furthermore, the procedure was accurate and
predictable.
Humans are social mammals and it is likely that most conditions associated with altered sleep or absent
sleep would occur in social isolation, the latter being viewed as an intrinsic stress. Therefore, it is critically
Page 2 of 26Socially Isolated Mice Exhibit a Blunted Homeostatic Sleep Response to Acute Sleep De...
9/17/2013http://www.ncbi.nlm.nih.gov/pmc/articles/PMC3662550/
2.2.1. Sleep measures
2.2.2. EEG delta power during NREM sleep
important to ascertain the impact of sleep manipulations in the social context in which they occur to
enable extrapolation of disease states and their consequences, particularly in relation to the social
contextual setting in which they develop. Restricted sleep and social isolation are frequent occurrences in
humans, and have been both responsible for increased frequency and severity of multiple neurological and
social disorders, suggesting the presence of interactive or cooperative mechanisms between them
(Berkman et al., 2004; Cole et al., 2007). We therefore tested the hypothesis that the social contextual
setting (isolation vs. social pairing) would differentially modulate natural sleep patterns and also alter the
homeostatic sleep response to SD in mice. Since circadian distribution of vigilance states, body
temperature (Tb) changes and gross motor activity (MAg) are tightly coupled, and play important roles in
modulating arousal in rodents (McGinty et al., 2001), we also studied changes in Tb and MAg during the
post SD recovery period in socially isolated and paired mice. Our findings suggest that social isolation-
induced changes in sleep homeostasis is relevant to various clinical symptoms observed in
neuropsychiatric disorders, including ADHD, schizophrenia and depression, and that socially isolated
mice are a useful animal model to study the pathophysiology/ pathogenesis of these diseases.
2. Results
The main objectives of the present study were to assess changes in sleep architecture during and after SD
under socially paired and isolated conditions (Fig. 1). The SD procedure achieved significantly high
efficiency in preventing sleep.
2.1. Effect of SD on state
Multivariate analysis showed that behavioral state varied with time, state and condition, as reflected in a
significant two-way interaction of time×state [F=4.05, p<0.0001] and condition×state [F=2.77,
p<0.0001]. Furthermore, the significant three-way interaction of time×condition×state showed that the
experimental manipulations did have an influence on state and across 24 h recordings [F=2.27,
p<0.0001].
2.2. Sleep, wakefulness and EEG delta power in NREM sleep in socially paired mice
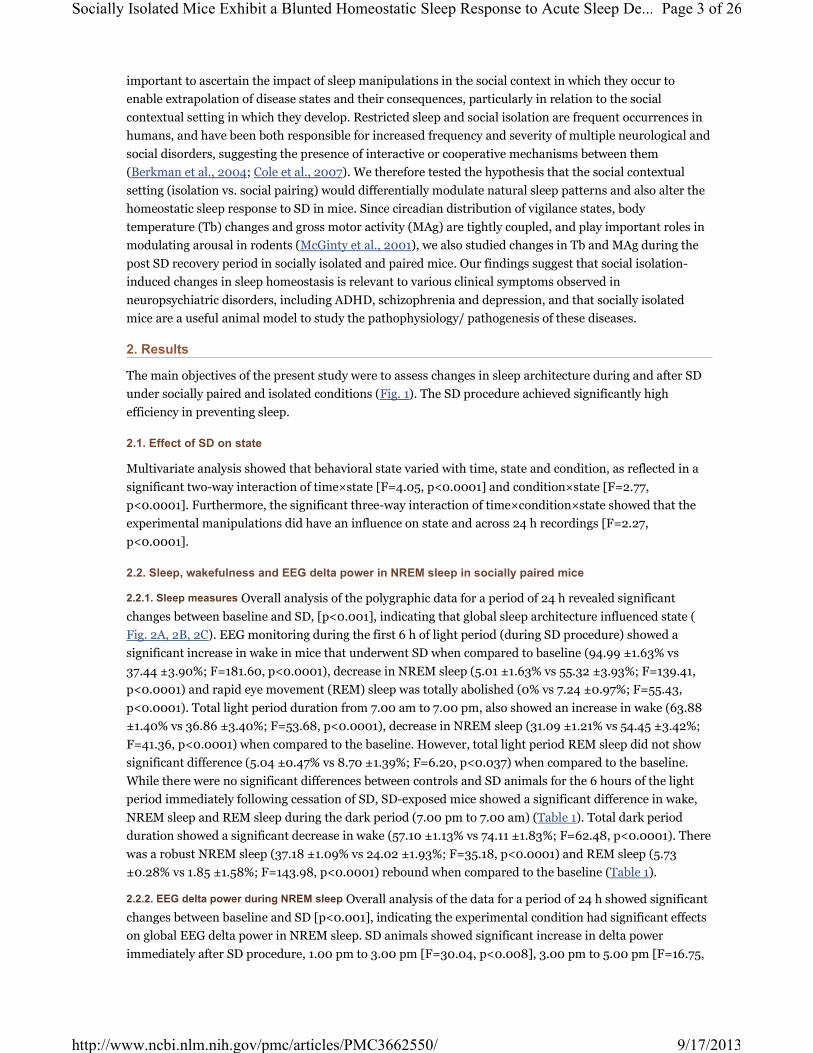
Overall analysis of the polygraphic data for a period of 24 h revealed significant
changes between baseline and SD, [p<0.001], indicating that global sleep architecture influenced state (
Fig. 2A, 2B, 2C). EEG monitoring during the first 6 h of light period (during SD procedure) showed a
significant increase in wake in mice that underwent SD when compared to baseline (94.99 ±1.63% vs
37.44 ±3.90%; F=181.60, p<0.0001), decrease in NREM sleep (5.01 ±1.63% vs 55.32 ±3.93%; F=139.41,
p<0.0001) and rapid eye movement (REM) sleep was totally abolished (0% vs 7.24 ±0.97%; F=55.43,
p<0.0001). Total light period duration from 7.00 am to 7.00 pm, also showed an increase in wake (63.88
±1.40% vs 36.86 ±3.40%; F=53.68, p<0.0001), decrease in NREM sleep (31.09 ±1.21% vs 54.45 ±3.42%;
F=41.36, p<0.0001) when compared to the baseline. However, total light period REM sleep did not show
significant difference (5.04 ±0.47% vs 8.70 ±1.39%; F=6.20, p<0.037) when compared to the baseline.
While there were no significant differences between controls and SD animals for the 6 hours of the light
period immediately following cessation of SD, SD-exposed mice showed a significant difference in wake,
NREM sleep and REM sleep during the dark period (7.00 pm to 7.00 am) (Table 1). Total dark period
duration showed a significant decrease in wake (57.10 ±1.13% vs 74.11 ±1.83%; F=62.48, p<0.0001). There
was a robust NREM sleep (37.18 ±1.09% vs 24.02 ±1.93%; F=35.18, p<0.0001) and REM sleep (5.73
±0.28% vs 1.85 ±1.58%; F=143.98, p<0.0001) rebound when compared to the baseline (Table 1).
Overall analysis of the data for a period of 24 h showed significant
changes between baseline and SD [p<0.001], indicating the experimental condition had significant effects
on global EEG delta power in NREM sleep. SD animals showed significant increase in delta power
immediately after SD procedure, 1.00 pm to 3.00 pm [F=30.04, p<0.008], 3.00 pm to 5.00 pm [F=16.75,
Page 3 of 26Socially Isolated Mice Exhibit a Blunted Homeostatic Sleep Response to Acute Sleep De...
9/17/2013http://www.ncbi.nlm.nih.gov/pmc/articles/PMC3662550/
2.3.1. Sleep Measures
2.3.2. EEG delta power during NREM sleep
p<0.008], 5.00 pm to 7.00 pm [F=19.83, p<0.05] and also during the dark period, 9.00 pm to 11.00 pm
[F=16.69, p<0.04], 1.00 am to 3.00 am [F=17.975, p<0.05] (Fig. 2D and 3D).
2.3. Sleep, wakefulness and EEG delta power in NREM sleep in socially isolated mice
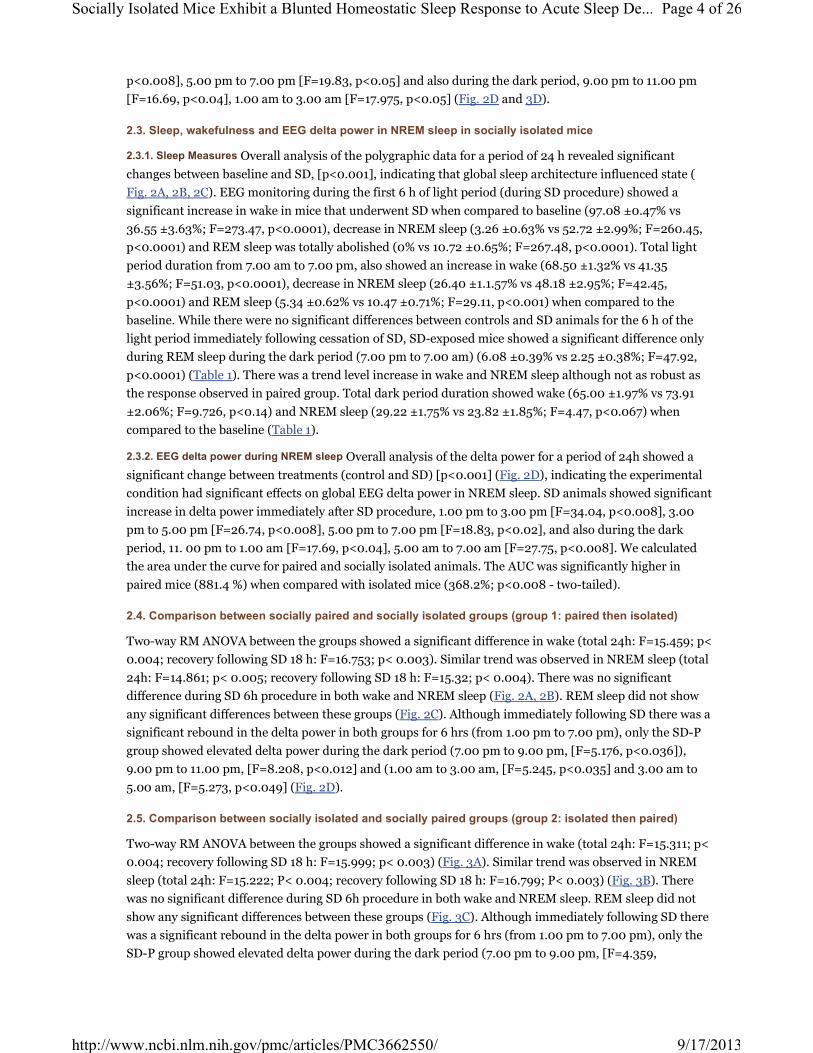
Overall analysis of the polygraphic data for a period of 24 h revealed significant
changes between baseline and SD, [p<0.001], indicating that global sleep architecture influenced state (
Fig. 2A, 2B, 2C). EEG monitoring during the first 6 h of light period (during SD procedure) showed a
significant increase in wake in mice that underwent SD when compared to baseline (97.08 ±0.47% vs
36.55 ±3.63%; F=273.47, p<0.0001), decrease in NREM sleep (3.26 ±0.63% vs 52.72 ±2.99%; F=260.45,
p<0.0001) and REM sleep was totally abolished (0% vs 10.72 ±0.65%; F=267.48, p<0.0001). Total light
period duration from 7.00 am to 7.00 pm, also showed an increase in wake (68.50 ±1.32% vs 41.35
±3.56%; F=51.03, p<0.0001), decrease in NREM sleep (26.40 ±1.1.57% vs 48.18 ±2.95%; F=42.45,
p<0.0001) and REM sleep (5.34 ±0.62% vs 10.47 ±0.71%; F=29.11, p<0.001) when compared to the
baseline. While there were no significant differences between controls and SD animals for the 6 h of the
light period immediately following cessation of SD, SD-exposed mice showed a significant difference only
during REM sleep during the dark period (7.00 pm to 7.00 am) (6.08 ±0.39% vs 2.25 ±0.38%; F=47.92,
p<0.0001) (Table 1). There was a trend level increase in wake and NREM sleep although not as robust as
the response observed in paired group. Total dark period duration showed wake (65.00 ±1.97% vs 73.91
±2.06%; F=9.726, p<0.14) and NREM sleep (29.22 ±1.75% vs 23.82 ±1.85%; F=4.47, p<0.067) when
compared to the baseline (Table 1).
Overall analysis of the delta power for a period of 24h showed a
significant change between treatments (control and SD) [p<0.001] (Fig. 2D), indicating the experimental
condition had significant effects on global EEG delta power in NREM sleep. SD animals showed significant
increase in delta power immediately after SD procedure, 1.00 pm to 3.00 pm [F=34.04, p<0.008], 3.00
pm to 5.00 pm [F=26.74, p<0.008], 5.00 pm to 7.00 pm [F=18.83, p<0.02], and also during the dark
period, 11. 00 pm to 1.00 am [F=17.69, p<0.04], 5.00 am to 7.00 am [F=27.75, p<0.008]. We calculated
the area under the curve for paired and socially isolated animals. The AUC was significantly higher in
paired mice (881.4 %) when compared with isolated mice (368.2%; p<0.008 - two-tailed).
2.4. Comparison between socially paired and socially isolated groups (group 1: paired then isolated)
Two-way RM ANOVA between the groups showed a significant difference in wake (total 24h: F=15.459; p<
0.004; recovery following SD 18 h: F=16.753; p< 0.003). Similar trend was observed in NREM sleep (total
24h: F=14.861; p< 0.005; recovery following SD 18 h: F=15.32; p< 0.004). There was no significant
difference during SD 6h procedure in both wake and NREM sleep (Fig. 2A, 2B). REM sleep did not show
any significant differences between these groups (Fig. 2C). Although immediately following SD there was a
significant rebound in the delta power in both groups for 6 hrs (from 1.00 pm to 7.00 pm), only the SD-P
group showed elevated delta power during the dark period (7.00 pm to 9.00 pm, [F=5.176, p<0.036]),
9.00 pm to 11.00 pm, [F=8.208, p<0.012] and (1.00 am to 3.00 am, [F=5.245, p<0.035] and 3.00 am to
5.00 am, [F=5.273, p<0.049] (Fig. 2D).
2.5. Comparison between socially isolated and socially paired groups (group 2: isolated then paired)
Two-way RM ANOVA between the groups showed a significant difference in wake (total 24h: F=15.311; p<
0.004; recovery following SD 18 h: F=15.999; p< 0.003) (Fig. 3A). Similar trend was observed in NREM
sleep (total 24h: F=15.222; P< 0.004; recovery following SD 18 h: F=16.799; P< 0.003) (Fig. 3B). There
was no significant difference during SD 6h procedure in both wake and NREM sleep. REM sleep did not
show any significant differences between these groups (Fig. 3C). Although immediately following SD there
was a significant rebound in the delta power in both groups for 6 hrs (from 1.00 pm to 7.00 pm), only the
SD-P group showed elevated delta power during the dark period (7.00 pm to 9.00 pm, [F=4.359,
Page 4 of 26Socially Isolated Mice Exhibit a Blunted Homeostatic Sleep Response to Acute Sleep De...
9/17/2013http://www.ncbi.nlm.nih.gov/pmc/articles/PMC3662550/
2.7.1. Comparison between baselines
2.7.2. Comparisons between SD in paired and isolated conditions
2.7.3. Delta power comparisons between experimental group and age matched controls
p<0.021]), 9.00 pm to 11.00 pm, [F=6.508, p<0.012], 11.00 pm to 1.00 am, [F=18.448, p<0.001], 1.00 am
to 3.00 am, [F=23.993, p<0.001] and 3.00 am to 5.00 am, [F=4.614, p<0.046] (Fig. 3D).
2.6. Sleep, wakefulness and EEG delta power in NREM sleep in age-matched control groups
Overall analysis and pair wise comparisons showed there was no significant change in wake, NREM sleep,
REM and EEG delta power in NREM sleep (except for 1.00 am to 3.00 am, [F=5.877, p<0.042 in age
matched controls.
2.7. Delta power during NREM sleep is attenuated in socially isolated groups
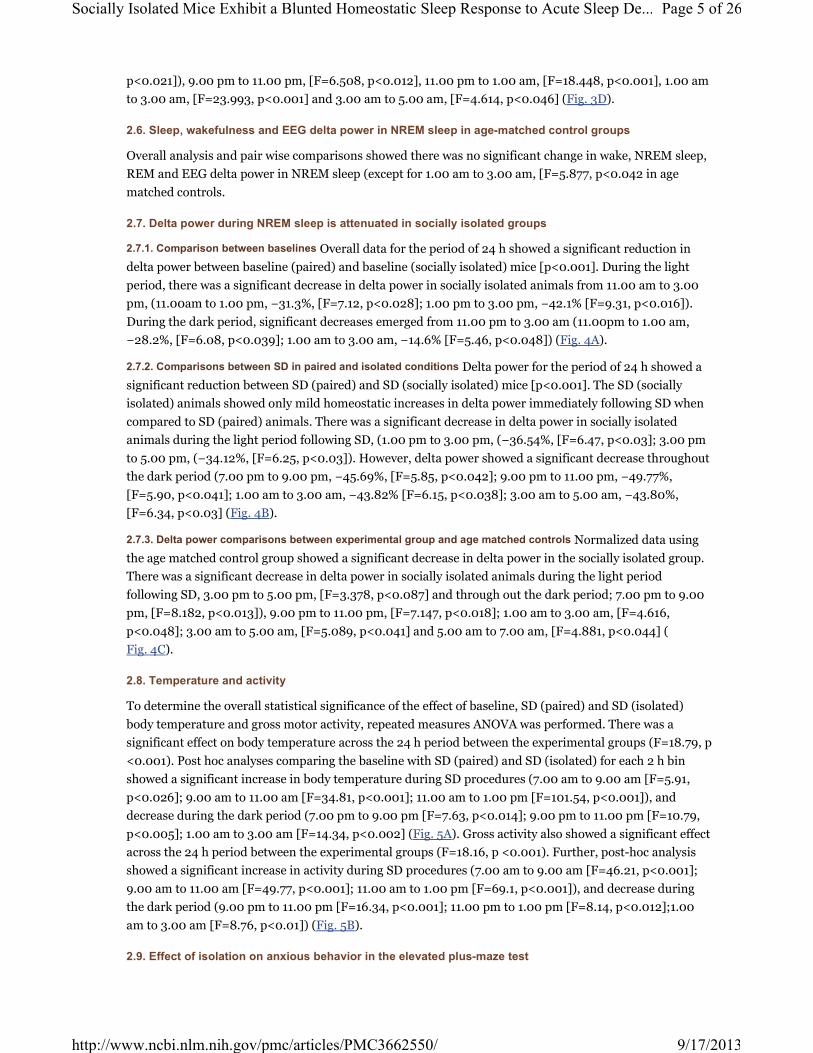
Overall data for the period of 24 h showed a significant reduction in
delta power between baseline (paired) and baseline (socially isolated) mice [p<0.001]. During the light
period, there was a significant decrease in delta power in socially isolated animals from 11.00 am to 3.00
pm, (11.00am to 1.00 pm, −31.3%, [F=7.12, p<0.028]; 1.00 pm to 3.00 pm, −42.1% [F=9.31, p<0.016]).
During the dark period, significant decreases emerged from 11.00 pm to 3.00 am (11.00pm to 1.00 am,
−28.2%, [F=6.08, p<0.039]; 1.00 am to 3.00 am, −14.6% [F=5.46, p<0.048]) (Fig. 4A).
Delta power for the period of 24 h showed a
significant reduction between SD (paired) and SD (socially isolated) mice [p<0.001]. The SD (socially
isolated) animals showed only mild homeostatic increases in delta power immediately following SD when
compared to SD (paired) animals. There was a significant decrease in delta power in socially isolated
animals during the light period following SD, (1.00 pm to 3.00 pm, (−36.54%, [F=6.47, p<0.03]; 3.00 pm
to 5.00 pm, (−34.12%, [F=6.25, p<0.03]). However, delta power showed a significant decrease throughout
the dark period (7.00 pm to 9.00 pm, −45.69%, [F=5.85, p<0.042]; 9.00 pm to 11.00 pm, −49.77%,
[F=5.90, p<0.041]; 1.00 am to 3.00 am, −43.82% [F=6.15, p<0.038]; 3.00 am to 5.00 am, −43.80%,
[F=6.34, p<0.03] (Fig. 4B).
Normalized data using
the age matched control group showed a significant decrease in delta power in the socially isolated group.
There was a significant decrease in delta power in socially isolated animals during the light period
following SD, 3.00 pm to 5.00 pm, [F=3.378, p<0.087] and through out the dark period; 7.00 pm to 9.00
pm, [F=8.182, p<0.013]), 9.00 pm to 11.00 pm, [F=7.147, p<0.018]; 1.00 am to 3.00 am, [F=4.616,
p<0.048]; 3.00 am to 5.00 am, [F=5.089, p<0.041] and 5.00 am to 7.00 am, [F=4.881, p<0.044] (
Fig. 4C).
2.8. Temperature and activity
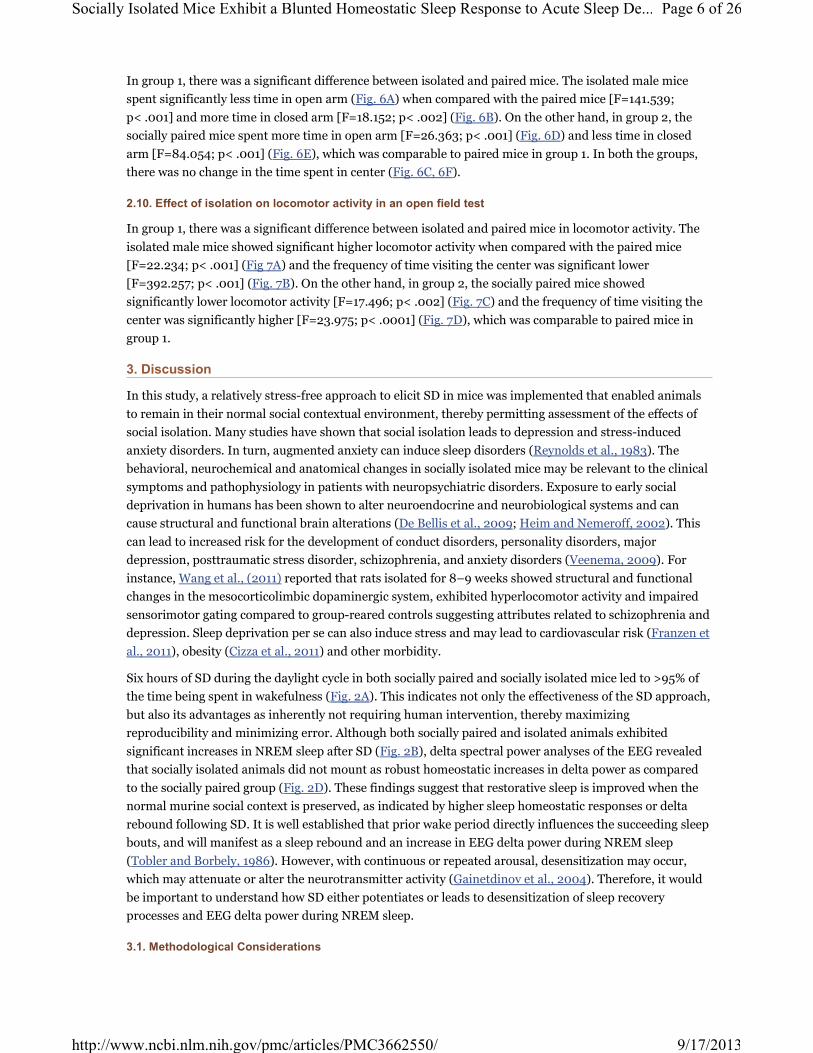
To determine the overall statistical significance of the effect of baseline, SD (paired) and SD (isolated)
body temperature and gross motor activity, repeated measures ANOVA was performed. There was a
significant effect on body temperature across the 24 h period between the experimental groups (F=18.79, p
<0.001). Post hoc analyses comparing the baseline with SD (paired) and SD (isolated) for each 2 h bin
showed a significant increase in body temperature during SD procedures (7.00 am to 9.00 am [F=5.91,
p<0.026]; 9.00 am to 11.00 am [F=34.81, p<0.001]; 11.00 am to 1.00 pm [F=101.54, p<0.001]), and
decrease during the dark period (7.00 pm to 9.00 pm [F=7.63, p<0.014]; 9.00 pm to 11.00 pm [F=10.79,
p<0.005]; 1.00 am to 3.00 am [F=14.34, p<0.002] (Fig. 5A). Gross activity also showed a significant effect
across the 24 h period between the experimental groups (F=18.16, p <0.001). Further, post-hoc analysis
showed a significant increase in activity during SD procedures (7.00 am to 9.00 am [F=46.21, p<0.001];
9.00 am to 11.00 am [F=49.77, p<0.001]; 11.00 am to 1.00 pm [F=69.1, p<0.001]), and decrease during
the dark period (9.00 pm to 11.00 pm [F=16.34, p<0.001]; 11.00 pm to 1.00 pm [F=8.14, p<0.012];1.00
am to 3.00 am [F=8.76, p<0.01]) (Fig. 5B).
2.9. Effect of isolation on anxious behavior in the elevated plus-maze test
Page 5 of 26Socially Isolated Mice Exhibit a Blunted Homeostatic Sleep Response to Acute Sleep De...
9/17/2013http://www.ncbi.nlm.nih.gov/pmc/articles/PMC3662550/
In group 1, there was a significant difference between isolated and paired mice. The isolated male mice
spent significantly less time in open arm (Fig. 6A) when compared with the paired mice [F=141.539;
p< .001] and more time in closed arm [F=18.152; p< .002] (Fig. 6B). On the other hand, in group 2, the
socially paired mice spent more time in open arm [F=26.363; p< .001] (Fig. 6D) and less time in closed
arm [F=84.054; p< .001] (Fig. 6E), which was comparable to paired mice in group 1. In both the groups,
there was no change in the time spent in center (Fig. 6C, 6F).
2.10. Effect of isolation on locomotor activity in an open field test
In group 1, there was a significant difference between isolated and paired mice in locomotor activity. The
isolated male mice showed significant higher locomotor activity when compared with the paired mice
[F=22.234; p< .001] (Fig 7A) and the frequency of time visiting the center was significant lower
[F=392.257; p< .001] (Fig. 7B). On the other hand, in group 2, the socially paired mice showed
significantly lower locomotor activity [F=17.496; p< .002] (Fig. 7C) and the frequency of time visiting the
center was significantly higher [F=23.975; p< .0001] (Fig. 7D), which was comparable to paired mice in
group 1.
3. Discussion
In this study, a relatively stress-free approach to elicit SD in mice was implemented that enabled animals
to remain in their normal social contextual environment, thereby permitting assessment of the effects of
social isolation. Many studies have shown that social isolation leads to depression and stress-induced
anxiety disorders. In turn, augmented anxiety can induce sleep disorders (Reynolds et al., 1983). The
behavioral, neurochemical and anatomical changes in socially isolated mice may be relevant to the clinical
symptoms and pathophysiology in patients with neuropsychiatric disorders. Exposure to early social
deprivation in humans has been shown to alter neuroendocrine and neurobiological systems and can
cause structural and functional brain alterations (De Bellis et al., 2009; Heim and Nemeroff, 2002). This
can lead to increased risk for the development of conduct disorders, personality disorders, major
depression, posttraumatic stress disorder, schizophrenia, and anxiety disorders (Veenema, 2009). For
instance, Wang et al., (2011) reported that rats isolated for 8–9 weeks showed structural and functional
changes in the mesocorticolimbic dopaminergic system, exhibited hyperlocomotor activity and impaired
sensorimotor gating compared to group-reared controls suggesting attributes related to schizophrenia and
depression. Sleep deprivation per se can also induce stress and may lead to cardiovascular risk (Franzen et
al., 2011), obesity (Cizza et al., 2011) and other morbidity.
Six hours of SD during the daylight cycle in both socially paired and socially isolated mice led to >95% of
the time being spent in wakefulness (Fig. 2A). This indicates not only the effectiveness of the SD approach,
but also its advantages as inherently not requiring human intervention, thereby maximizing
reproducibility and minimizing error. Although both socially paired and isolated animals exhibited
significant increases in NREM sleep after SD (Fig. 2B), delta spectral power analyses of the EEG revealed
that socially isolated animals did not mount as robust homeostatic increases in delta power as compared
to the socially paired group (Fig. 2D). These findings suggest that restorative sleep is improved when the
normal murine social context is preserved, as indicated by higher sleep homeostatic responses or delta
rebound following SD. It is well established that prior wake period directly influences the succeeding sleep
bouts, and will manifest as a sleep rebound and an increase in EEG delta power during NREM sleep
(Tobler and Borbely, 1986). However, with continuous or repeated arousal, desensitization may occur,
which may attenuate or alter the neurotransmitter activity (Gainetdinov et al., 2004). Therefore, it would
be important to understand how SD either potentiates or leads to desensitization of sleep recovery
processes and EEG delta power during NREM sleep.
3.1. Methodological Considerations
Page 6 of 26Socially Isolated Mice Exhibit a Blunted Homeostatic Sleep Response to Acute Sleep De...
9/17/2013http://www.ncbi.nlm.nih.gov/pmc/articles/PMC3662550/
One of the major limitations of existing methods aiming to induce sleep loss is that they are stressors per
se, and as such, the intrinsic stress effect of sleep loss can not be ascertained. Sleep deprivation induced
either by the `inverted flower pot' method, gentle manual handling, or by the forced locomotion method
has been shown to increase levels of adrenocorticotropic hormone and corticosterone (CT) (Rechtschaffen
and Bergmann, 1995; Ramesh et al., 2009). In addition, these methods are either labor intensive (e.g.,
manual handling) or impose forced locomotion (McKenna et al., 2007; Ramesh et al., 2007). In contrast,
the automated SD approach used in the present study was not associated with global increases in CT after
6 hours, but CT serum concentrations may not be sensitive enough to detect organ specific stress hormone
activity (Ramesh et al., 2009). Future studies are needed to determine whether how extended SD
exposures affect the hypothalamic-pituitary-adrenal responses. Another surrogate indicator of stress is
alterations in body temperature. Restraint and social stress has shown to increase Tb in mice (Bhatnagar
et al., 2006; Gilmore et al., 2008). In the current study, the SD procedure increased body temperature (
Fig. 5A), suggesting the increase in Tb may be due to the increased wakefulness activity observed during
the same period (Fig. 5B). In addition, social isolation may also impose a direct modulatory influence on
the stressor response associated with SD. In the present study, the SD procedure allowed for comparisons
between the responses to SD in the context of social isolation and social pairing.
3.2. Social Isolation Affects Various Physiological Functions
Even though there was no change in the total time spent in sleep and wakefulness, socially isolated mice
showed a dramatic decrease in EEG delta power in NREM sleep even during basal conditions (Fig. 4A).
Following the SD procedure, both socially isolated and paired mice showed significant EEG delta power in
NREM sleep rebound for the rest of the light period (6 hrs). However, only the socially paired mice
showed increases in EEG delta power in NREM sleep in the dark period (Fig. 4B). Even when the delta
power was normalized using an age-matched group, the isolated group showed significant reductions in
delta power (Fig. 4C). This observation rules out the possibility that signal decay may occur in delta power
during NREM sleep in the post-isolation condition (due to time difference and age). Reductions in delta
power, without gross change in sleep-wake activity, were also reported when NF-κB activity was blocked
by the inhibitor peptide, SN50 in rats, particularly during the first 2 h of recovery sleep following 6h SD
(Ramesh et al., 2007). In addition to sleep, social isolation dramatically affects many physiological
functions, including aggressiveness, anxiety-related behaviors, cognitive deficits, and hyperlocomotion
(Machado et al., 2006; Oehler et al., 1986). Early social isolation in domestic pigs showed sustained
changes in behavioral, neuroendocrine and immune regulation (Tuchscherer et al., 2009). In fact, a single
social isolation in piglets caused age-dependent neuroendocrine and behavioral changes that indicate
increased arousal and experienced distress (Tuchscherer et al., 2009). A recent study has shown that
chronic immobilization stress can induce bimodal distribution of REM sleep, both stress-enhanced REM
sleep and stress-reduced REM sleep (Hegde et al., 2011) and manual restraint reduced NREM sleep and
REM sleep and increased delta power for the first 4h period (Tang et al., 2004).
In the present study, NREM sleep showed immediate rebounds in delta power in both paired and socially
isolated animals, but only socially paired mice exhibited persistent increases in EEG delta power in NREM
sleep throughout the dark period, irrespective of the order in which they were paired, indicating improved
sleep depth and quality compared to the matched isolated condition. 18 h post deprivation recordings
indicated that delta power did not return to baseline values within this time frame. We speculate that
recovery from EEG delta power in NREM sleep following SD even for short periods such as 6 h will require
more time. Although sleep rebound during the recovery period after acute SD is tightly regulated by
homeostatic processes (Borbely, 1982), the present results indicate that social isolation may modulate the
magnitude of this sleep rebound. In addition, the case may be advanced that the innate social nature of the
mouse species may play a role in the prolonged elevated delta power following SD. Indeed, since mice are
highly social animals, direct contact with a companion mouse would allow for the needed social bonding
thereby reducing stress and fear, and thus, enabling improved quality sleep following perturbations such
Page 7 of 26Socially Isolated Mice Exhibit a Blunted Homeostatic Sleep Response to Acute Sleep De...
9/17/2013http://www.ncbi.nlm.nih.gov/pmc/articles/PMC3662550/
as SD. Acute stressors lead to a subsequent sleep rebound, while prolonged and/or chronic stress reduce
the time spent in NREM sleep, thereby affecting sleep quality (McKenna et al., 2007; Tobler and
Scherschlicht, 1990).
The immediate increase in REM sleep following SD in both groups could be related to a compensatory
mechanism for the total REM deprivation seen during SD. Stress may affect REM sleep but the issue
remains somewhat controversial. On the one hand, when restraint stress was used, REM sleep was
suppressed (Tobler and Scherschlicht, 1990). Conversely, stress was associated with an increase in REM
sleep in other studies (Wiberg and Grice, 1963). It is possible that different types of stressors and the
underlying conditions in which the particular stressors are applied (i.e., time of day, intensity of stimulus
applied and duration of stressor) may all account for the opposite effects of stress on REM sleep. Machado
et al., (2006) showed in rats subjected to 6h SD using a modified multiple platform method, who had their
bonding renovated everyday for the remainder 18 h, showed marked rebounds in REM sleep compared to
socially isolated rats.
As anticipated, the effects of acute SD were more prominent than those following acute sleep
fragmentation (SF) (Ramesh et al., 2009), and could be related to the differences between SD and SF in
the amount of prior wake. In the paired group, the percent time spent in wake was 95% in SD vs 57.8% in
SF, such that during SF procedures, mice successfully and gradually acclimatize to the repeated arousals
and thus maintain reasonable amount of NREM sleep. This is opposed to the virtually absent (5%) NREM
sleep during SD. Similar patterns and differences emerged for REM sleep among SF and SD-exposed mice.
3.3. Isolation-induced behavior changes in anxiety
The elevated plus-maze induces anxiety caused by fear of heights and open spaces (Pellow et al., 1985).
Some reports show that social isolation causes anxiety in rats (Jankowska et al., 1991; Maisonnette et al.,
1993; Morinan et al., 1992) while other studies showed no significant effect (Lapiz et al., 2001). In the
present study, isolated mice, in both the groups, spent shorter duration in the open arms (Fig. 6A, 6D) and
more entries on the closed arms (Fig. 6B, 6E) in the elevated plus-maze test, indicating increased anxiety.
We investigated the social-isolation induced anxiety-like behavior in mice, which is consistent with
previous studies (Hellemans et al., 2004; Wei et al., 2007; Wright et al., 1991). It is possible that social
isolation-induced hyperactivity may be attributable to the anxiolytic-like effect under a novel environment.
In our study, socially isolated mice exhibited increase in locomotor activity (Fig. 7A, 7C) response to a
novel environment compared with paired housing mice. Under such conditions, anxiety-like behaviors
were demonstrated with socially-isolated mice. Social-isolated mice exhibited increased anxiety and social
interactions in both the experiments.
In humans, social isolation predicts the onset of depression, as well as increased morbidity and mortality
from cardiovascular and cerebrovascular diseases (Boden-Albala et al., 2005; Norman et al., 2010).
Moreover, social isolation is a strong determinant of outcomes following experimental stroke and
predisposes to ischemic damage (Karelina et al., 2009). Taken together, we can infer that chronic isolation
could initiate early molecular changes leading to early neuronal damage, which in turn may lead to
blunted homeostatic sleep and delta power responses in the socially isolated group. In summary, social
interactions in the context of SD play an important role in modulating the quality of sleep and its recovery
from SD, thereby emphasizing the need to incorporate the contextual social setting in future experiments
aiming to determine the regulation of sleep homeostatic responses.
3.4. Isolation-induced hyperactivity
Many studies have reported that social isolation causes hyperactivity in male mice (Heidbreder et al.,
2000; Hilakivi et al., 1989). Open field behavior in nonhuman animals represents a compromise between
predator evasion tactics and the reinstatement of contact with in a group (Hofer, 2009). In the present
Page 8 of 26Socially Isolated Mice Exhibit a Blunted Homeostatic Sleep Response to Acute Sleep De...
9/17/2013http://www.ncbi.nlm.nih.gov/pmc/articles/PMC3662550/
study, similar results were also observed. Social isolation, in both the groups, caused higher accounts of
locomotor activity (Fig. 7A, 7B) and lower exploratory activity towards the center (Fig. 7B, 7D) when
compared to paired mice. The increased locomotor activity found among socially isolated mice is
intriguing and establishes a potential causative link between social isolation and symptoms of
hyperactivity. These findings are analogous to several studies that have documented socially isolated
patients tend to have anxiety-related problems (Gazelle et al., 2010; Heinrich and Gullone, 2006; Modin et
al., 2011).
4. Methods
4.1. Animals
Male C57BL/6J mice (20–25 g; age 10 weeks) were purchased from Jackson Laboratories, (Bar Harbor,
Maine), were housed in a 12 hr light/dark cycle (light on 7:00 A.M. to 7:00 PM) at a constant temperature
(26 ±1°C) and were allowed access to food and water ad libitum. All protocols were approved by the
Institutional Animal Care and Use Committee and are in close agreement with the National Institutes of
Health Guide in the Care and Use of Animals. All efforts were made to minimize animal suffering and to
reduce the number of animals used.
4.2. Surgical procedure and implantation of telemetric transmitter and electrodes
All surgical procedures were performed under sterile conditions and general anesthesia (Induction: 3%
isoflurane and 1 liter per min of O . Maintenance: 2% isoflurane and ½ liter per min of O ) (Ramesh et al.,
2009; Nair et al., 2011). A telemetric transmitter weighing 3.5 g, F20-EET (DSI, Minnesota, USA), which
allows simultaneous monitoring of EEG and EMG, temperature and locomotor activity was chronically
implanted (Ramesh et al., 2009; Nair et al., 2011). Following surgery, Ketoprofen, 3–5 mg/kg, s.c., every
24 h for 2 days was given for post-operative pain management.
4.3. Sleep deprivation
The device used to induce SD in rodents has been previously described (Ramesh et al., 2009 and Nair et
al., 2011). Briefly, it employs intermittent tactile stimulation of freely behaving mice in a standard mouse
laboratory cage, using a nearly-silent motorized mechanical device. Tactile stimulation is achieved with a
horizontal bar sweeping just above the cage floor from one side to the other side of the mouse cage, the
sweeper being powered by an electrical motor system in which the speed, torque, and interval of the
intermittent/continuous functioning mode are controlled, eliminating error induced by human
intervention. Indeed, many of the routine handling procedures may result in a stress response that does
not readily habituate (Balcombe et al., 2004). The sweeper requires around 9 sec to sweep the floor of the
cage one way, at which time, a relay engages the sweeper to move in the opposite direction and the cycle is
repeated continuously. During sweeper motion, animals need to step over the sweeper and then resume
their unrestrained behavior. The SD procedure was designed such as to minimize stress to the animals
(although no technique can be totally stress free), while effectively eliciting SD. To verify this assumption,
we determined the absence of significant increases in corticosterone (CT) plasma levels, as a surrogate
indicator of stress (Ramesh et al., 2009).
4.4. Acclimatization, sleep recording and sleep deprivation
After recovery from surgery (7–10 days), the mice were transferred to the SD device for habituation to the
cage and the sweeper for 7 days. During habituation, the device was switched on for 15 min (2 times per
day) at random intervals during the light period. The recording cages were mounted on a DSI telemetry
receiver (RPC-1), which was in turn connected to an acquisition computer through a data exchange matrix.
After acclimatization in the cages, the magnetic switch of the transmitter was activated, and polygraphic
recordings were begun at 7.00 AM. Physiological data were continuously acquired for 24h using Dataquest
2 2
Page 9 of 26Socially Isolated Mice Exhibit a Blunted Homeostatic Sleep Response to Acute Sleep De...
9/17/2013http://www.ncbi.nlm.nih.gov/pmc/articles/PMC3662550/
4.7.1. Group 1: paired then isolated
ART acquisition software (DSI, Minnesota, USA; version 3.1), at a sampling rate of 500 Hz. Data were first
scored automatically using Sleepsign software (Kissei Comtec, Japan) (Espana et al., 2007; Ramesh et al.,
2009; Nair et al., 2011), and records were visually confirmed or corrected as needed by an investigator
who was blinded to the experimental condition.
Behavior was classified into 3 different states: wake, NREM sleep and REM sleep. EEG during wake had
low-amplitude, high-frequency (desynchronized) waves. During wake, EMG records showed gross body
movement artifacts and behaviorally, animals had grooming, scratching and orienting activity. The NREM
sleep stage was characterized by low-frequency, high-amplitude (synchronized) EEG with a considerable
reduction in EMG amplitude. REM sleep was characterized by desynchronized EEG, and a drastic
reduction in EMG (muscle atonia). Sleep-related low frequency (delta) activity was also derived from the
records using bandpass filtering of 1– 4.0 Hz. Delta power was computed offline by using SleepSign
software by Fast Fourier Transform (FFT), which was based on 512 points corresponding to 10 sec epochs,
at a sampling rate of 250 Hz with Hanning as the window filter of FFT. The software algorithm analysis
was based on The Nyquist–Shannon sampling theorem, which states that perfect reconstruction of a signal
is possible when the sampling frequency is greater than twice the maximum frequency of the signal being
sampled. Those NREM sleep epochs that showed movement artifacts were excluded when computing delta
power, since EEG signals are especially sensitive to movement, with the resulting artifact specifically
enhancing signals in the delta band.
4.5. Temperature and activity
Body temperature and gross motor activity were acquired every 10 sec throughout all experiments. To
increase the precision of recordings, the lower limit of temperature records was set at 34°C and the upper
limit at 41°C, while in the activity record the lower limit was set at 0 counts (no gross activity) and upper
limit was set at 3840 counts (a high level of activity) at the polling rate of 64 Hz. The transmitter
underwent 3 point calibration at 35 °C, 37 °C and 39 °C.
4.6. Anxiety Behavior Test
Separate experiments, on two groups (n=12/group) were carried out for anxiety behavior tests. Group 1
(social isolation): Mice were paired with another male mouse with whom they had previously co-habited.
On day 8, open field (OF) and elevated plus maze (EPM) tests were carried out. Following the above
experiment, the companion mice were removed from the cages, and the experimental mice were placed in
social isolation for 5 weeks. On day 45, OF and EPM were conducted. Group 2 (social paring): During the
7-day acclimatization period and prior to recordings, mice were isolated from their corresponding cage
mate with whom they had previously co-habited. On day 8, open field (OF) and elevated plus maze (EPM)
tests were carried out. Following the above experiment, the companion mice were introduced into the
cages, and the experimental mice were allowed for social paring for 5 weeks. On day 45, OF and EPM were
conducted.
4.7. Experimental design
The various phases of the experimental paradigm are illustrated in Fig. 1.
Part 1 :During the 7-day acclimatization period and prior to recordings,
mice (n=5) were paired with another male mouse with whom they had previously co-habited. On day 8,
baseline sleep recordings were carried out for 24h from 7.00 am to 7.00 am the next day (Fig. 1). The
animals were left undisturbed on day 9. On day 10, animals were subjected to SD for 6 h during the light
period from 7.00 am to 1.00 pm, and recovery sleep recordings were continued for the subsequent 18 h
until 7.00 am next day.
Part 2: Following the above experiment, the companion mice were removed from the cages, and the
experimental mice were placed in social isolation for 5 weeks. On day 45, baseline sleep recordings were
Page 10 of 26Socially Isolated Mice Exhibit a Blunted Homeostatic Sleep Response to Acute Sleep ...
9/17/2013http://www.ncbi.nlm.nih.gov/pmc/articles/PMC3662550/
4.7.2. Group 2: isolated then paired
4.7.3. Group 3: Age-matched controls
4.7.4. Elevated plus maze
4.7.5. Open field
conducted for 24h from 7.00 am to 7.00 am next day. The animals were left undisturbed on day 46. On
day 47, the animals were subjected to SD for 6 h during the light period from 7.00 am to 1.00 pm, and
recovery sleep recordings were continued for the subsequent 18 h until 7.00 am the next day.
Although the main purpose of this study was to understand the effect of
social isolation in the same group of animals, we also conducted assessment of social paring using a
paradigm aiming to exclude the possibility of an order effect.
Part 1: During the 7-day acclimatization period and prior to recordings, mice (n=5) were isolated from
their corresponding cage mate with whom they had previously co-habited. On day 8, baseline sleep
recordings were conducted for 24h from 7.00 am to 7.00 am the next day (Fig. 1). The animals were left
undisturbed on day 9. On day 10, animals were subjected to SD for 6 h during the light period from 7.00
am to 1.00 pm, and recovery sleep recordings were continued for the subsequent 18 h until 7.00 am next
day.
Part 2: Following the above experiment, the companion mice were introduced into the cages, and the
experimental mice were allowed for social paring for 5 weeks. On day 45, baseline sleep recordings were
conducted for 24h from 7.00 am to 7.00 am next day. The animals were left undisturbed on day 46. On
day 47, the animals were subjected to SD for 6 h during the light period from 7.00 am to 1.00 pm, and
recovery sleep recordings were continued for the subsequent 18 h until 7.00 am the next day.
Part 1: During the 7-day acclimatization period and prior to recordings,
implanted animals (n=5) were paired with another male mouse with which they had previously been
housed. On day 8, baseline sleep recordings were carried out for 24h from 7.00 am to 7.00 am next day (
Fig. 1). The animals were left undisturbed on day 9. On day 10, animals were subjected to SD for 6 h
during the light period from 7.00 am to 1.00 pm, and recovery sleep recordings were continued for the
subsequent 18 h until 7.00 am next day.
Part 2: Following the above experiment, the companion mice continued to stay in the cages. On day 47,
baseline sleep recordings were conducted for 24h from 7.00 am to 7.00 am next day.
The EPM was used to assess anxiety in 2 groups of mice, Group1: paired followed
by social isolation and Group 2: isolation followed by social paring (n=12/group). The basic measure is the
animal preference for dark, enclosed places over bright, exposed places (Montgomery, 1955; Nair et al.,
2011). A 60 w light was placed above the apparatus and the test was recorded by an overhead camera using
Ethovision software from Noldus. Mice were placed in the center of the maze facing a closed arm, and
allowed to explore for 10 min in isolation. Each mouse received one recorded trial. Mice prefer to enter
into closed arms compared to open arms. Time spent in the dark area is viewed as avoidance or anxiety-
like behavior. The following parameters were scored: (a) Percent time spent in open and closed arms; (b)
number of entries to closed arms; (c) Time spent in the center. An arm entry was defined as the entry of all
four feet into either one of the closed arm. The maze was cleaned with 30 % ethanol between trials to
remove any odor cues.
Locomotor activity was assessed in a black Plexiglas chamber (22 × 22 × 22 in.) in 2 groups
of mice, Group1: paired followed by social isolation and Group 2: isolation followed by social paring
(n=12/group). Activity was recorded by a video camera suspended above the open field (OF) and
interfaced with a video tracking system (Noldus, Sterling, VA, U.S.A.). The mice were randomly selected
animals from each group were acclimatized to the open field for 10 min before the start of the activity
monitoring session, which lasted for 10 min. The chamber was thoroughly cleaned with 30% ethanol
between trials to eliminate any confounding odor effects.
4.8. Data analysis
Page 11 of 26Socially Isolated Mice Exhibit a Blunted Homeostatic Sleep Response to Acute Sleep ...
9/17/2013http://www.ncbi.nlm.nih.gov/pmc/articles/PMC3662550/
In all the experimental conditions, the sleep-wake data were divided into 10 sec epochs and scored. They
were then divided into 2-h bins to observe the circadian variations, if any, between the groups. EEG delta
power (1–4 Hz) during NREM sleep was calculated as percentage of each animal's baseline recording 2
days prior to SD. The baseline data on EEG delta power in NREM sleep is expressed relative to the mean
total power in the NREM EEG. Data on EEG delta power in NREM sleep, during recovery sleep, is
expressed as a percentage of the mean NREM EEG delta power value taken from the baseline recording 2
days prior to SD. EEG delta power (absolute activity) in NREM sleep was compared between the baseline
(paired and isolated). We used multivariate MANOVA (SPSS 11) with the following model: Two hr time
bins as within factors (12 time points) and Two between factors: (1) Condition (four levels): BL (paired),
SD (paired), BL (socially isolation) and SD (socially isolation) (2) State (three levels): wakefulness, NREM
sleep, and REM sleep. All F statistics are reported using Pillai's Trace. The interaction of three different
factors, i.e., time, condition and state were determined using this mixed model repeated measures
MANOVA. Further, we did a two-way RM ANOVA on factors, condition, (within-subjects with levels
“paired” and “isolated”) and time (total 24h, during SD 6h and recovery 18h).
To further elucidate the nature of identified interactions for the paired and socially isolated conditions, all
data were analyzed by one way RM ANOVA. The baseline data of paired (Day 8) and isolated mice (Day
45) were grouped together for statistical comparison. First, overall statistical significance was determined
for the 24-h period between the treatment groups (baseline Paired and Isolated). In addition, statistical
significance for 2 h bins for 24 h was assessed, followed by post-hoc Holm-Sidak analyses, as needed. For
all comparisons, a p value <0.05 was considered to achieve statistical significance. To rule out the effect of
signal decay on delta power during NREM sleep in post-isolation condition (due to time difference and
age), the SD (paired) group was normalized with the day 8 of age control group and SD (socially isolated)
group was normalized with day 47 of age control group (Fig. 4C).
Acknowledgments
Part of this work was conducted while authors were in the Department of Pediatrics, Kosair Children's
Hospital Research Institute, University of Louisville School of Medicine, Louisville, KY 40202.
Financial Support: DG is supported by National Institutes of Health grants HL-065270 and HL-
086662.
Abbreviations
ANOVA analysis of variance
BL baseline
EEG electroencephalogram
EMG electromyogram
EPM elevated plus maze
FFT Fast Fourier Transform
MAg gross motor activity
MANOVA multivariate analysis of variance
NREM non-rapid eye movement
OF open field
REM rapid eye movement
SD sleep deprivation
SWA slow wave activity
Tb body temperature
Footnotes
Page 12 of 26Socially Isolated Mice Exhibit a Blunted Homeostatic Sleep Response to Acute Sleep ...
9/17/2013http://www.ncbi.nlm.nih.gov/pmc/articles/PMC3662550/
Publisher's Disclaimer: This is a PDF file of an unedited manuscript that has been accepted for publication. As a service
to our customers we are providing this early version of the manuscript. The manuscript will undergo copyediting,
typesetting, and review of the resulting proof before it is published in its final citable form. Please note that during the
production process errors may be discovered which could affect the content, and all legal disclaimers that apply to the
journal pertain.
References
1. Andersen ML, Martins PJ, D'Almeida V, Bignotto M, Tufik S. Endocrinological and
catecholaminergic alterations during sleep deprivation and recovery in male rats. J Sleep Res.
2005;14:83–83. [PubMed: 15743338]
2. Bakshi VP, Geyer MA. Ontogeny of isolation rearing-induced deficits in sensorimotor gating in rats.
Physiol Behav. 1999;67:385–385. [PubMed: 10497957]
3. Balcombe JP, Barnard ND, Sandusky C. Laboratory routines cause animal stress. Contemp Top Lab
Anim Sci. 2004;43:42–42. [PubMed: 15669134]
4. Berkman LF, Melchior M, Chastang JF, Niedhammer I, Leclerc A, Goldberg M. Social integration
and mortality: a prospective study of French employees of Electricity of France-Gas of France: the
GAZEL Cohort. Am J Epidemiol. 2004;159:167–167. [PubMed: 14718219]
5. Bhatnagar S, Vining C, Iyer V, Kinni V. Changes in hypothalamic-pituitary-adrenal function, body
temperature, body weight and food intake with repeated social stress exposure in rats. J
Neuroendocrinol. 2006;18:13–13. [PubMed: 16451216]
6. Boden-Albala B, Litwak E, Elkind MS, Rundek T, Sacco RL. Social isolation and outcomes post
stroke. Neurology. 2005;64:1888–1888. [PubMed: 15955939]
7. Borbely AA. A two process model of sleep regulation. Hum Neurobiol. 1982;1:195–204.
[PubMed: 7185792]
8. Buwalda B, Kole MH, Veenema AH, Huininga M, de Boer SF, Korte SM, Koolhaas JM. Long-term
effects of social stress on brain and behavior: a focus on hippocampal functioning. Neurosci
Biobehav Rev. 2005;29:83–83. [PubMed: 15652257]
9. Chida Y, Sudo N, Mori J, Kubo C. Social isolation stress impairs passive avoidance learning in
senescence-accelerated mouse (SAM) Brain Res. 2006;1067:201–201. [PubMed: 16332359]
10. Cizza G, Requena M, Galli G, de Jonge L. Chronic sleep deprivation and seasonality: implications for
the obesity epidemic. J Endocrinol Invest. 2011 Jun 27; [PMCID: PMC3297412]
11. Cole SW, Hawkley LC, Arevalo JM, Sung CY, Rose RM, Cacioppo JT. Social regulation of gene
expression in human leukocytes. Genome Biol. 2007;8:R189. [PMCID: PMC2375027]
[PubMed: 17854483]
12. Crews F, He J, Hodge C. Adolescent cortical development: a critical period of vulnerability for
addiction. Pharmacol Biochem Behav. 2007;86:189–189. [PubMed: 17222895]
13. Daan S, Beersma DG, Borbely AA. Timing of human sleep: recovery process gated by a circadian
pacemaker. Am J Physiol. 1984;246:R161–83. [PubMed: 6696142]
14. De Bellis MD, Hooper SR, Spratt EG, Woolley DP. Neuropsychological findings in childhood neglect
and their relationships to pediatric PTSD. J Int Neuropsychol Soc. 2009;15:868–868.
[PMCID: PMC3036972] [PubMed: 19703321]
15. de Graaf-Peters VB, Hadders-Algra M. Ontogeny of the human central nervous system: what is
happening when? Early Hum Dev. 2006;82:257–257. [PubMed: 16360292]
16. de Jong JG, van der Vegt BJ, Buwalda B, Koolhaas JM. Social environment determines the long-
term effects of social defeat. Physiol Behav. 2005;84:87–87. [PubMed: 15642611]
17. Dijk DJ, Brunner DP, Beersma DG, Borbely AA. Electroencephalogram power density and slow wave
sleep as a function of prior waking and circadian phase. Sleep. 1990;13:430–430.
[PubMed: 2287855]
Page 13 of 26Socially Isolated Mice Exhibit a Blunted Homeostatic Sleep Response to Acute Sleep ...
9/17/2013http://www.ncbi.nlm.nih.gov/pmc/articles/PMC3662550/
18. Espana RA, McCormack SL, Mochizuki T, Scammell TE. Running promotes wakefulness and
increases cataplexy in orexin knockout mice. Sleep. 2007;30:1417–1417. [PMCID: PMC2082091]
[PubMed: 18041476]
19. Franzen PL, Gianaros PJ, Marsland AL, Hall MH, Siegle GJ, Dahl RE, Buysse DJ. Cardiovascular
reactivity to acute psychological stress following sleep deprivation. Psychosom Med. 2011;73:679
–82. [PMCID: PMC3614084] [PubMed: 21949422]
20. Gainetdinov RR, Premont RT, Bohn LM, Lefkowitz RJ, Caron MG. Desensitization of G protein-
coupled receptors and neuronal functions. Annu Rev Neurosci. 2004;27:107–107.
[PubMed: 15217328]
21. Gazelle H, Workman JO, Allan W. Anxious solitude and clinical disorder in middle childhood:
bridging developmental and clinical approaches to childhood social anxiety. J Abnorm Child
Psychol. 2010;38:1–1. [PubMed: 19707867]
22. Gilmore AJ, Billing RL, Einstein R. The effects on heart rate and temperature of mice and vas
deferens responses to noradrenaline when their cage mates are subjected to daily restraint stress.
Lab Anim. 2008;42:140–140. [PubMed: 18435872]
23. Haller J, Leveleki C, Baranyi J, Mikics E, Bakos N. Stress, social avoidance and anxiolytics: a
potential model of stress-induced anxiety. Behav Pharmacol. 2003;14:439–439.
[PubMed: 14501256]
24. Hattori S, Hashimoto R, Miyakawa T, Yamanaka H, Maeno H, Wada K, Kunugi H. Enriched
environments influence depression-related behavior in adult mice and the survival of newborn cells
in their hippocampi. Behav Brain Res. 2007;180:69–69. [PubMed: 17397941]
25. Hegde P, Jayakrishnan HR, Chattarji S, Kutty BM, Laxmi TR. Chronic stress-induced changes in
REM sleep on theta oscillations in the rat hippocampus and amygdala. Brain Res. 2011;1382:155
–155. [PubMed: 21276772]
26. Heidbreder CA, Weiss IC, Domeney AM, Pryce C, Homberg J, Hedou G, Feldon J, Moran MC,
Nelson P. Behavioral, neurochemical and endocrinological characterization of the early social
isolation syndrome. Neuroscience. 2000;100:749–68. [PubMed: 11036209]
27. Heinrich LM, Gullone E. The clinical significance of loneliness: a literature review. Clin Psychol Rev.
2006;26:695–695. [PubMed: 16952717]
28. Heim C, Nemeroff CB. Neurobiology of early life stress: clinical studies, Semin. Clin.
Neuropsychiatry. 2002;7:147–147.
29. Hellemans KG, Benge LC, Olmstead MC. Adolescent enrichment partially reverses the social
isolation syndrome. Brain Res Dev Brain Res. 2004;150:103–103.
30. Hilakivi LA, Ota M, Lister RG. Effect of isolation on brain monoamines and the behavior of mice in
tests of exploration, locomotion, anxiety and behavioral 'despair'. Pharmacol Biochem Behav.
1989;33:371–371. [PubMed: 2479036]
31. Hofer MA. In Handbook of Neuroscience for the Behavioral Sciences. 2009. Developmental
neuroscience.
32. Jankowska E, Pucilowski O, Kostowski W. Chronic oral treatment with diltiazem or verapamil
decreases isolation-induced activity impairment in elevated plus maze. Behav Brain Res.
1991;43:155–155. [PubMed: 1867756]
33. Karelina K, Norman GJ, Zhang N, Morris JS, Peng H, DeVries AC. Social isolation alters
neuroinflammatory response to stroke. Proc Natl Acad Sci U S A. 2009;106:5895–5895.
[PMCID: PMC2667090] [PubMed: 19307557]
34. Kennedy CH. Effects of REM sleep deprivation on a multiple schedule of appetitive reinforcement.
Behav Brain Res. 2002;128:205–205. [PubMed: 11796165]
35. Kikusui T, Winslow JT, Mori Y. Social buffering: relief from stress and anxiety. Philos Trans R Soc
Lond B Biol Sci. 2006;361:2215–2215. [PMCID: PMC1764848] [PubMed: 17118934]
Page 14 of 26Socially Isolated Mice Exhibit a Blunted Homeostatic Sleep Response to Acute Sleep ...
9/17/2013http://www.ncbi.nlm.nih.gov/pmc/articles/PMC3662550/
36. Kirby LG, Pan YZ, Freeman-Daniels E, Rani S, Nunan JD, Akanwa A, Beck SG. Cellular effects of
swim stress in the dorsal raphe nucleus. Psychoneuroendocrinology. 2007;32:712–712.
[PMCID: PMC2824561] [PubMed: 17602840]
37. Lapiz MD, Mateo Y, Durkin S, Parker T, Marsden CA. Effects of central noradrenaline depletion by
the selective neurotoxin DSP-4 on the behaviour of the isolated rat in the elevated plus maze and
water maze. Psychopharmacology (Berl) 2001;155:251–251. [PubMed: 11432687]
38. Machado RB, Suchecki D, Tufik S. Sleep homeostasis in rats assessed by a long-term intermittent
paradoxical sleep deprivation protocol. Behav Brain Res. 2005;160:356–356. [PubMed: 15863232]
39. Machado RB, Suchecki D, Tufik S. Comparison of the sleep pattern throughout a protocol of chronic
sleep restriction induced by two methods of paradoxical sleep deprivation. Brain Res Bull.
2006;70:213–213. [PubMed: 16861105]
40. Maisonnette S, Morato S, Brandao ML. Role of resocialization and of 5-HT1A receptor activation on
the anxiogenic effects induced by isolation in the elevated plus-maze test. Physiol Behav.
1993;54:753–753. [PubMed: 7902588]
41. Malberg JE, Duman RS. Cell proliferation in adult hippocampus is decreased by inescapable stress:
reversal by fluoxetine treatment. Neuropsychopharmacology. 2003;28:1562–1562.
[PubMed: 12838272]
42. Martinez-Gonzalez D, Obermeyer W, Fahy JL, Riboh M, Kalin NH, Benca RM. REM sleep
deprivation induces changes in coping responses that are not reversed by amphetamine. Sleep.
2004;27:609–609. [PubMed: 15282995]
43. McGinty D, Alam MN, Szymusiak R, Nakao M, Yamamoto M. Hypothalamic sleep-promoting
mechanisms: coupling to thermoregulation. Arch Ital Biol. 2001;139:63–63. [PubMed: 11256188]
44. McKenna JT, Tartar JL, Ward CP, Thakkar MM, Cordeira JW, McCarley RW, Strecker RE. Sleep
fragmentation elevates behavioral, electrographic and neurochemical measures of sleepiness.
Neuroscience. 2007;146:1462–1462. [PMCID: PMC2156190] [PubMed: 17442498]
45. Mignot E. Why we sleep: the temporal organization of recovery. PLoS Biol. 2008;6:e106.
[PMCID: PMC2689703] [PubMed: 18447584]
46. Millstein RA, Holmes A. Effects of repeated maternal separation on anxiety- and depression-related
phenotypes in different mouse strains. Neurosci Biobehav Rev. 2007;31:3–3. [PubMed: 16950513]
47. Modin B, Ostberg V, Almquist Y. Childhood peer status and adult susceptibility to anxiety and
depression. A 30-year hospital follow-up. J Abnorm Child Psychol. 2011;39:187–187.
[PubMed: 20886279]
48. Molina-Hernandez M, Tellez-Alcantara P, Perez-Garcia J. Isolation rearing induced fear-like
behavior without affecting learning abilities of Wistar rats. Prog Neuropsychopharmacol Biol
Psychiatry. 2001;25:1111–1111. [PubMed: 11444680]
49. Montgomery KC. The relation between fear induced by novel stimulation and exploratory behavior.
J Comp Physiol Psychol. 1955;48:254–254. [PubMed: 13252152]
50. Morinan A, Parker V, Rich DA, Cariuk P, Horton RW. Social isolation does not alter brain regional
benzodiazepine binding site numbers, affinity and coupling in the rat. Psychopharmacology (Berl)
1992;106:565–565. [PubMed: 1315974]
51. Nair D, Zhang SX, Ramesh V, Hakim F, Kaushal N, Wang Y, Gozal D. Sleep fragmentation induces
cognitive deficits via Nnicotinamide Adenine Dinucleotide Phosphate Oxidase-dependent pathways
in mouse. Am J Respir Crit Care Med. 2011;184:1305–1305. [PMCID: PMC3262045]
[PubMed: 21868506]
52. Nakayasu T, Ishii K. Effects of pair-housing after social defeat experience on elevated plus-maze
behavior in rats. Behav Processes. 2008;78:477–477. [PubMed: 18358638]
53. Newman SM, Paletz EM, Obermeyer WH, Benca RM. Sleep deprivation in pigeons and rats using
motion detection. Sleep. 2009;32:1299–1299. [PMCID: PMC2753808] [PubMed: 19848359]
Page 15 of 26Socially Isolated Mice Exhibit a Blunted Homeostatic Sleep Response to Acute Sleep ...
9/17/2013http://www.ncbi.nlm.nih.gov/pmc/articles/PMC3662550/
54. Norman GJ, Zhang N, Morris JS, Karelina K, Berntson GG, DeVries AC. Social interaction
modulates autonomic, inflammatory, and depressive-like responses to cardiac arrest and
cardiopulmonary resuscitation. Proc Natl Acad Sci U S A. 2010;107:16342–16342.
[PMCID: PMC2941316] [PubMed: 20805484]
55. Oehler J, Jahkel M, Schmidt J. Altered neurobiological responses to acute immobilization in social-
isolated mice. Pharmacol Biochem Behav. 1986;25:41–41. [PubMed: 2875473]
56. Pellow S, Chopin P, File SE, Briley M. Validation of open:closed arm entries in an elevated plus-
maze as a measure of anxiety in the rat. J Neurosci Methods. 1985;14:149–149. [PubMed: 2864480]
57. Pilcher JJ, Huffcutt AI. Effects of sleep deprivation on performance: a meta-analysis. Sleep.
1996;19:318–318. [PubMed: 8776790]
58. Ramesh V, Lakshmana MK, S B, Rao S, Raju TR, Kumar VM. Alterations in monoamine
neurotransmitters and dendritic spine densities at the medial preoptic area after sleep deprivation.
Sleep Res Online. 1999;2:49–49. [PubMed: 11382882]
59. Ramesh V, Thatte HS, McCarley RW, Basheer R. Adenosine and sleep deprivation promote NF-
kappaB nuclear translocation in cholinergic basal forebrain. J Neurochem. 2007;100:1351–1351.
[PubMed: 17316404]
60. Ramesh V, Kaushal N, Gozal D. Sleep fragmentation in mice differentially modifies EEG delta power
during slow wave sleep in socially isolated and paired mice. Sleep Sci. 2009;2:64–64.
61. Rechtschaffen A, Bergmann BM. Sleep deprivation in the rat by the disk-over-water method. Behav
Brain Res. 1995;69:55–55. [PubMed: 7546318]
62. Reynolds CF, 3rd, Shaw DH, Newton TF, Coble PA, Kupfer DJ. EEG sleep in outpatients with
generalized anxiety: a preliminary comparison with depressed outpatients. Psychiatry Res.
1983;8:81–81. [PubMed: 6574533]
63. Ruis MA, te Brake JH, Buwalda B, De Boer SF, Meerlo P, Korte SM, Blokhuis HJ, Koolhaas JM.
Housing familiar male wildtype rats together reduces the long-term adverse behavioural and
physiological effects of social defeat. Psychoneuroendocrinology. 1999;24:285–285.
[PubMed: 10101734]
64. Siegel JM. Sleep viewed as a state of adaptive inactivity. Nat Rev Neurosci. 2009;10:747–53.
[PubMed: 19654581]
65. Sinton CM, Kovakkattu D, Friese RS. Validation of a novel method to interrupt sleep in the mouse. J
Neurosci Methods. 2009;184:71–71. [PubMed: 19646474]
66. Stepanski EJ. The effect of sleep fragmentation on daytime function. Sleep. 2002;25:268–268.
[PubMed: 12003157]
67. Stickgold R, Hobson JA, Fosse R, Fosse M. Sleep, learning, and dreams: off-line memory
reprocessing. Science. 2001;294:1052–1052. [PubMed: 11691983]
68. Tang X, Orchard SM, Liu X, Sanford LD. Effect of varying recording cable weight and flexibility on
activity and sleep in mice. Sleep. 2004;27:803–803. [PubMed: 15283018]
69. Tobler I, Borbely AA. Sleep EEG in the rat as a function of prior waking. Electroencephalogr Clin
Neurophysiol. 1986;64:74–74. [PubMed: 2424723]
70. Tobler I, Scherschlicht R. Sleep and EEG slow-wave activity in the domestic cat: effect of sleep
deprivation. Behav Brain Res. 1990;37:109–109. [PubMed: 2322413]
71. Tuchscherer M, Kanitz E, Puppe B, Tuchscherer A, Viergutz T. Changes in endocrine and immune
responses of neonatal pigs exposed to a psychosocial stressor. Res Vet Sci. 2009;87:380–380.
[PubMed: 19433330]
72. Veenema AH. Early life stress, the development of aggression and neuroendocrine and
neurobiological correlates: what can we learn from animal models? Front Neuroendocrinol.
2009;30:497–497. [PubMed: 19341763]
73. Vyazovskiy VV, Tobler I. Handedness leads to interhemispheric EEG asymmetry during sleep in the
rat. J Neurophysiol. 2008;99:969–969. [PubMed: 18077659]
Page 16 of 26Socially Isolated Mice Exhibit a Blunted Homeostatic Sleep Response to Acute Sleep ...
9/17/2013http://www.ncbi.nlm.nih.gov/pmc/articles/PMC3662550/
74. Wang YC, Ho UC, Ko MC, Liao CC, Lee LJ. Differential neuronal changes in medial prefrontal
cortex, basolateral amygdala and nucleus accumbens after postweaning social isolation. Brain Struct
Funct. 2011 [Epub ahead of print], PubMed PMID: 22002740.
75. Wei XY, Yang JY, Dong YX, Wu CF. Anxiolytic-like effects of oleamide in group-housed and socially
isolated mice. Prog Neuropsychopharmacol Biol Psychiatry. 2007;31:1189–1189.
[PubMed: 17521793]
76. Wiberg GS, Grice HC. Long-term isolation stress in rats. Science. 1963;142:507.
[PubMed: 14064449]
77. Wright IK, Upton N, Marsden CA. Resocialisation of isolation-reared rats does not alter their
anxiogenic profile on the elevated X-maze model of anxiety. Physiol Behav. 1991;50:1129–1129.
[PubMed: 1798767]
Figures and Tables
Page 17 of 26Socially Isolated Mice Exhibit a Blunted Homeostatic Sleep Response to Acute Sleep ...
9/17/2013http://www.ncbi.nlm.nih.gov/pmc/articles/PMC3662550/
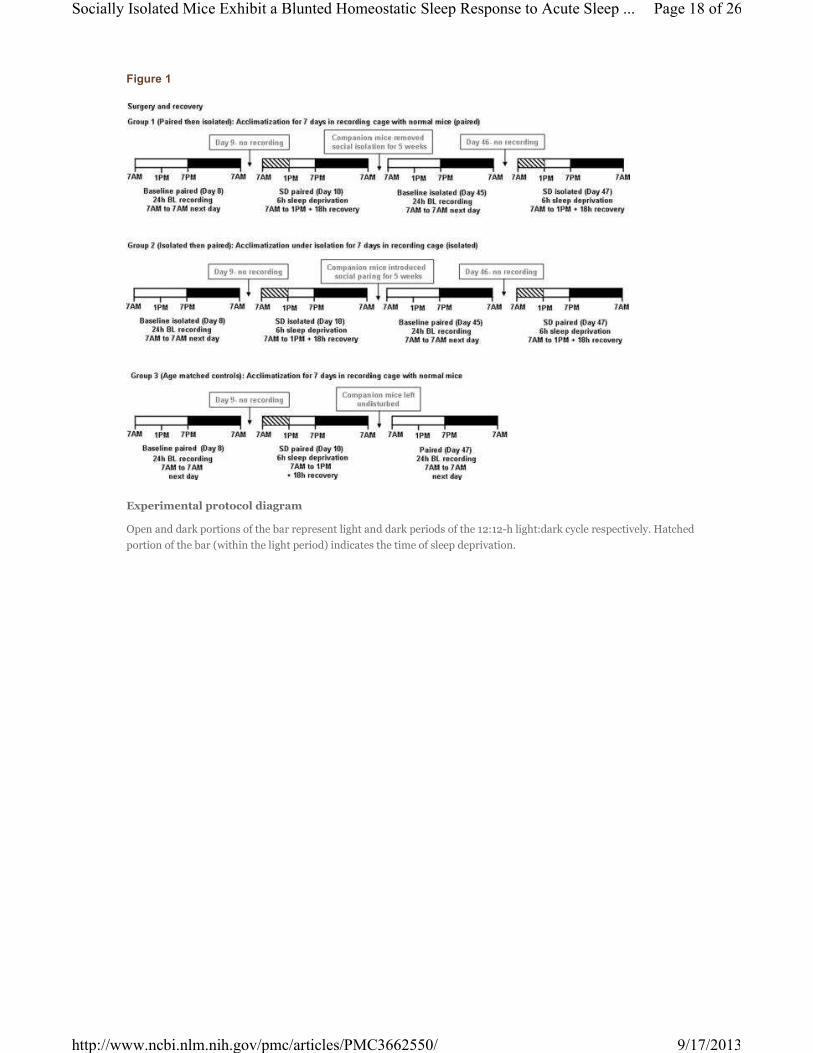
Figure 1
Experimental protocol diagram
Open and dark portions of the bar represent light and dark periods of the 12:12-h light:dark cycle respectively. Hatched
portion of the bar (within the light period) indicates the time of sleep deprivation.
Page 18 of 26Socially Isolated Mice Exhibit a Blunted Homeostatic Sleep Response to Acute Sleep ...
9/17/2013http://www.ncbi.nlm.nih.gov/pmc/articles/PMC3662550/
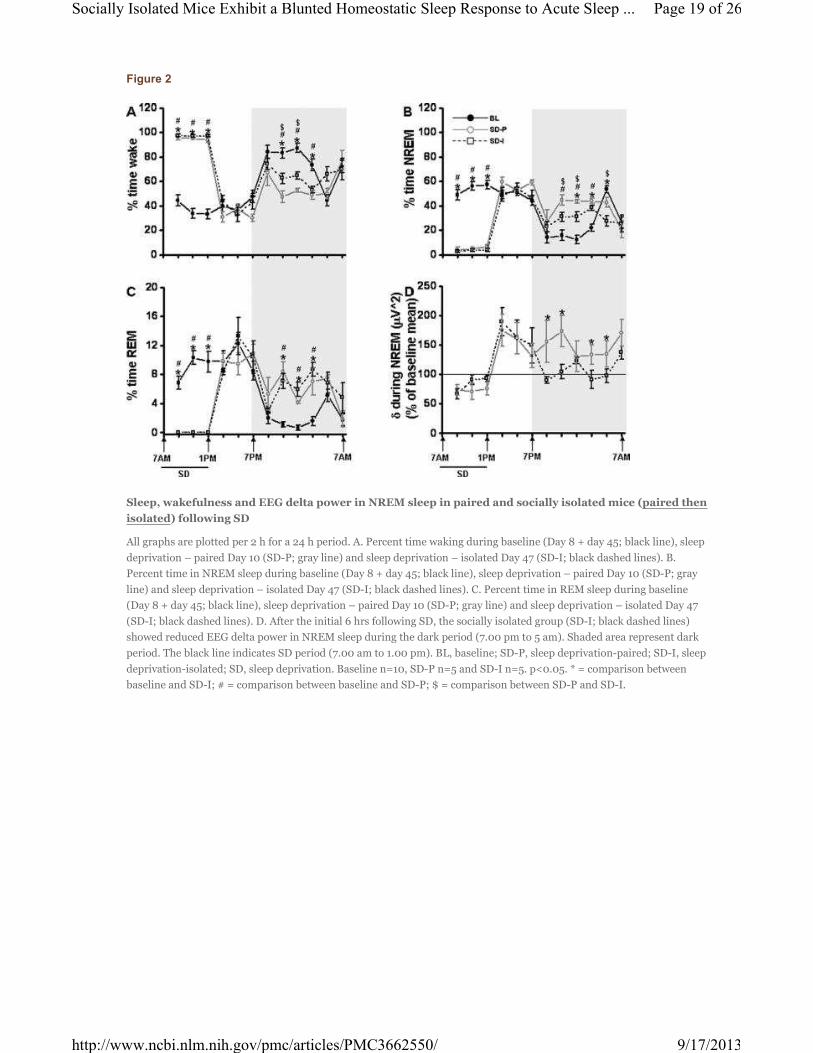
Figure 2
Sleep, wakefulness and EEG delta power in NREM sleep in paired and socially isolated mice (paired then
isolated) following SD
All graphs are plotted per 2 h for a 24 h period. A. Percent time waking during baseline (Day 8 + day 45; black line), sleep
deprivation – paired Day 10 (SD-P; gray line) and sleep deprivation – isolated Day 47 (SD-I; black dashed lines). B.
Percent time in NREM sleep during baseline (Day 8 + day 45; black line), sleep deprivation – paired Day 10 (SD-P; gray
line) and sleep deprivation – isolated Day 47 (SD-I; black dashed lines). C. Percent time in REM sleep during baseline
(Day 8 + day 45; black line), sleep deprivation – paired Day 10 (SD-P; gray line) and sleep deprivation – isolated Day 47
(SD-I; black dashed lines). D. After the initial 6 hrs following SD, the socially isolated group (SD-I; black dashed lines)
showed reduced EEG delta power in NREM sleep during the dark period (7.00 pm to 5 am). Shaded area represent dark
period. The black line indicates SD period (7.00 am to 1.00 pm). BL, baseline; SD-P, sleep deprivation-paired; SD-I, sleep
deprivation-isolated; SD, sleep deprivation. Baseline n=10, SD-P n=5 and SD-I n=5. p<0.05. * = comparison between
baseline and SD-I; # = comparison between baseline and SD-P; $ = comparison between SD-P and SD-I.
Page 19 of 26Socially Isolated Mice Exhibit a Blunted Homeostatic Sleep Response to Acute Sleep ...
9/17/2013http://www.ncbi.nlm.nih.gov/pmc/articles/PMC3662550/
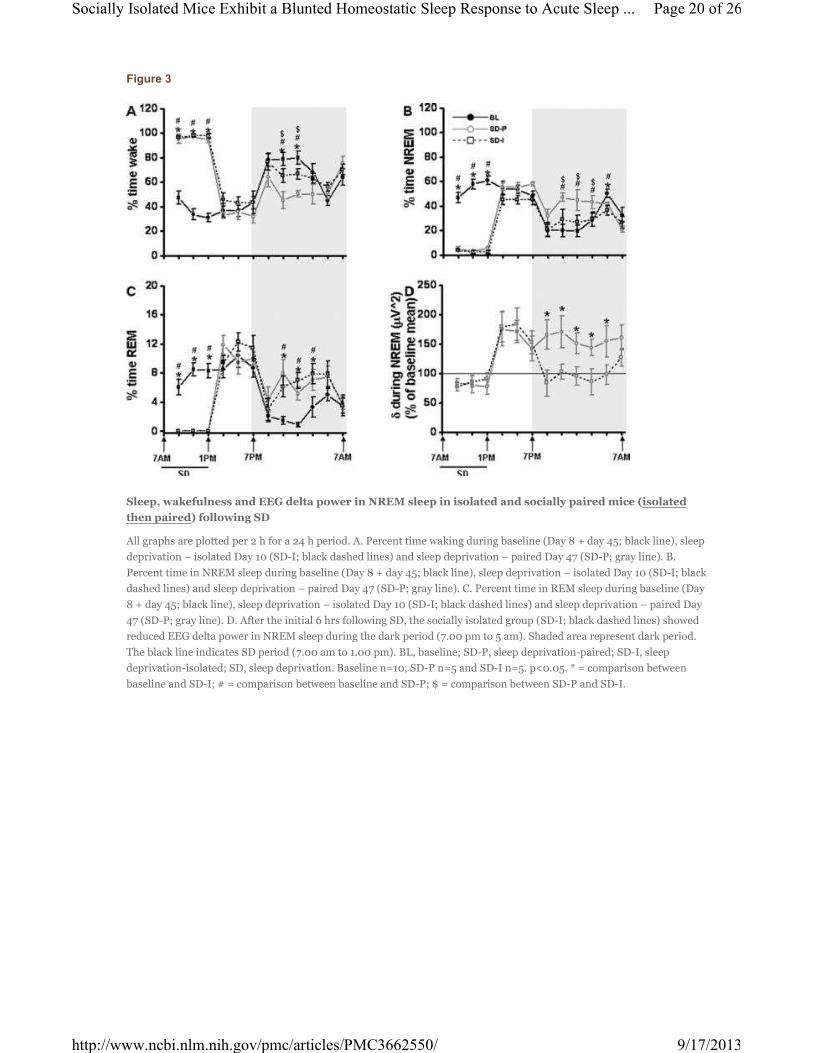
Figure 3
Sleep, wakefulness and EEG delta power in NREM sleep in isolated and socially paired mice (isolated
then paired) following SD
All graphs are plotted per 2 h for a 24 h period. A. Percent time waking during baseline (Day 8 + day 45; black line), sleep
deprivation – isolated Day 10 (SD-I; black dashed lines) and sleep deprivation – paired Day 47 (SD-P; gray line). B.
Percent time in NREM sleep during baseline (Day 8 + day 45; black line), sleep deprivation – isolated Day 10 (SD-I; black
dashed lines) and sleep deprivation – paired Day 47 (SD-P; gray line). C. Percent time in REM sleep during baseline (Day
8 + day 45; black line), sleep deprivation – isolated Day 10 (SD-I; black dashed lines) and sleep deprivation – paired Day
47 (SD-P; gray line). D. After the initial 6 hrs following SD, the socially isolated group (SD-I; black dashed lines) showed
reduced EEG delta power in NREM sleep during the dark period (7.00 pm to 5 am). Shaded area represent dark period.
The black line indicates SD period (7.00 am to 1.00 pm). BL, baseline; SD-P, sleep deprivation-paired; SD-I, sleep
deprivation-isolated; SD, sleep deprivation. Baseline n=10, SD-P n=5 and SD-I n=5. p<0.05. * = comparison between
baseline and SD-I; # = comparison between baseline and SD-P; $ = comparison between SD-P and SD-I.
Page 20 of 26Socially Isolated Mice Exhibit a Blunted Homeostatic Sleep Response to Acute Sleep ...
9/17/2013http://www.ncbi.nlm.nih.gov/pmc/articles/PMC3662550/
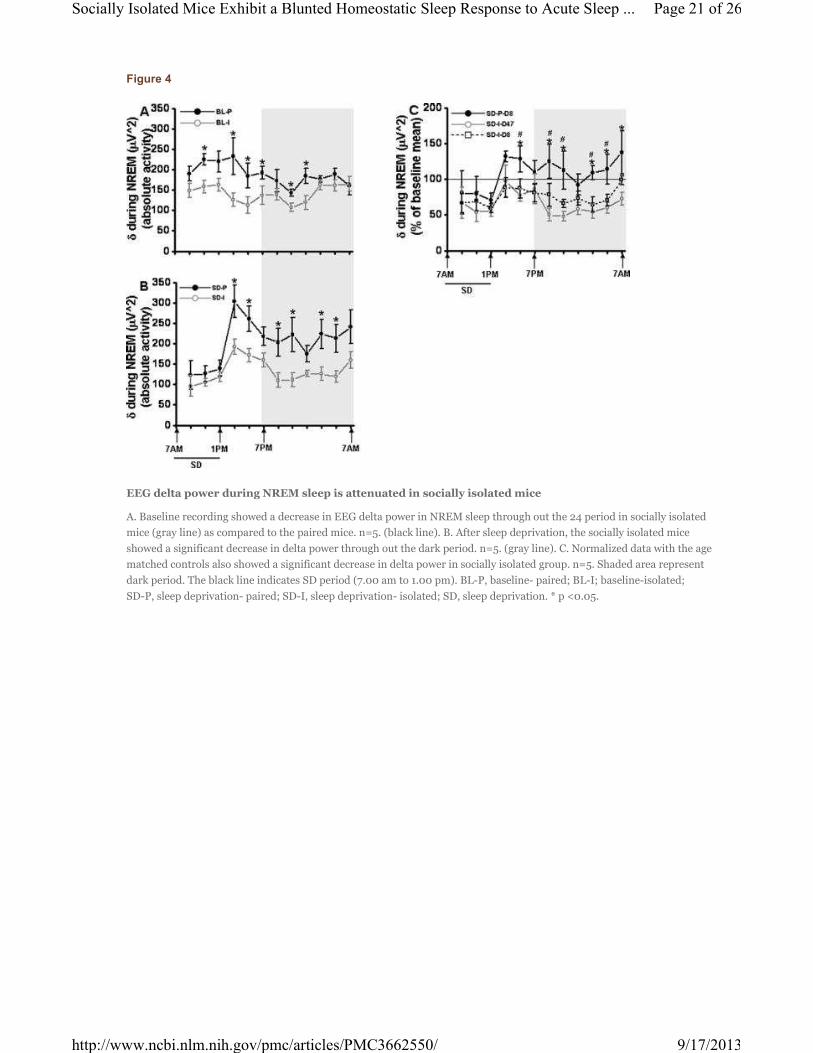
Figure 4
EEG delta power during NREM sleep is attenuated in socially isolated mice
A. Baseline recording showed a decrease in EEG delta power in NREM sleep through out the 24 period in socially isolated
mice (gray line) as compared to the paired mice. n=5. (black line). B. After sleep deprivation, the socially isolated mice
showed a significant decrease in delta power through out the dark period. n=5. (gray line). C. Normalized data with the age
matched controls also showed a significant decrease in delta power in socially isolated group. n=5. Shaded area represent
dark period. The black line indicates SD period (7.00 am to 1.00 pm). BL-P, baseline- paired; BL-I; baseline-isolated;
SD-P, sleep deprivation- paired; SD-I, sleep deprivation- isolated; SD, sleep deprivation. * p <0.05.
Page 21 of 26Socially Isolated Mice Exhibit a Blunted Homeostatic Sleep Response to Acute Sleep ...
9/17/2013http://www.ncbi.nlm.nih.gov/pmc/articles/PMC3662550/
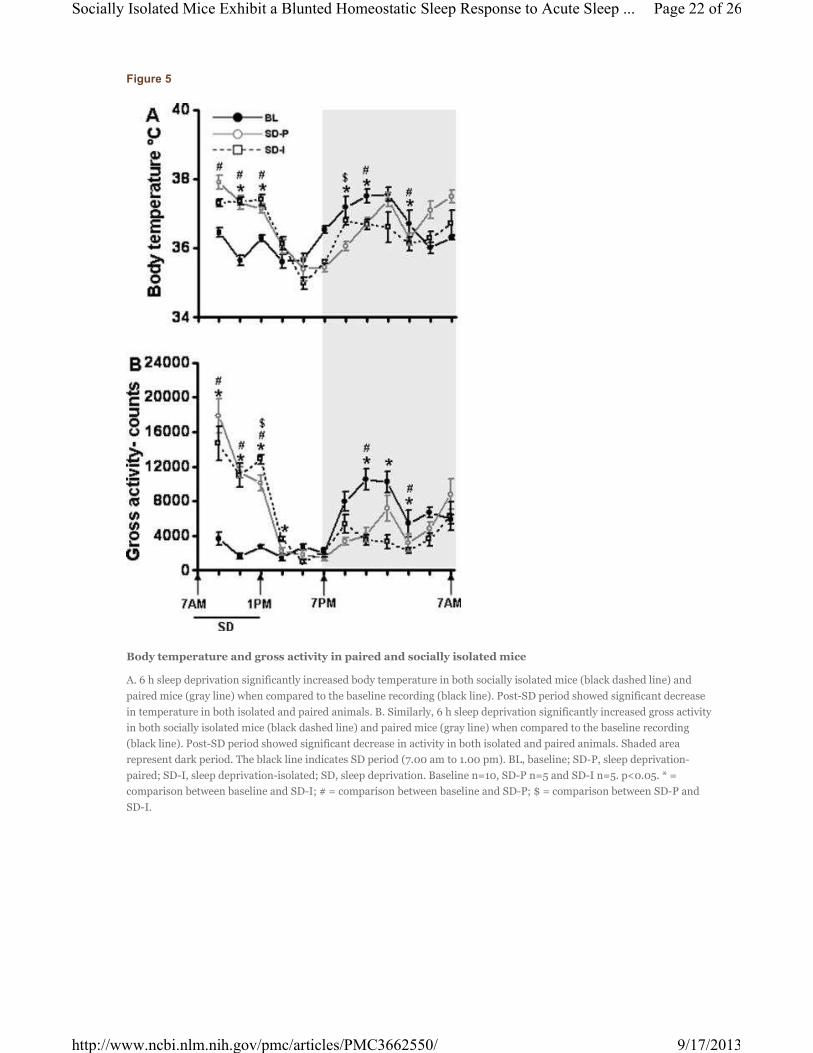
Figure 5
Body temperature and gross activity in paired and socially isolated mice
A. 6 h sleep deprivation significantly increased body temperature in both socially isolated mice (black dashed line) and
paired mice (gray line) when compared to the baseline recording (black line). Post-SD period showed significant decrease
in temperature in both isolated and paired animals. B. Similarly, 6 h sleep deprivation significantly increased gross activity
in both socially isolated mice (black dashed line) and paired mice (gray line) when compared to the baseline recording
(black line). Post-SD period showed significant decrease in activity in both isolated and paired animals. Shaded area
represent dark period. The black line indicates SD period (7.00 am to 1.00 pm). BL, baseline; SD-P, sleep deprivation-
paired; SD-I, sleep deprivation-isolated; SD, sleep deprivation. Baseline n=10, SD-P n=5 and SD-I n=5. p<0.05. * =
comparison between baseline and SD-I; # = comparison between baseline and SD-P; $ = comparison between SD-P and
SD-I.
Page 22 of 26Socially Isolated Mice Exhibit a Blunted Homeostatic Sleep Response to Acute Sleep ...
9/17/2013http://www.ncbi.nlm.nih.gov/pmc/articles/PMC3662550/
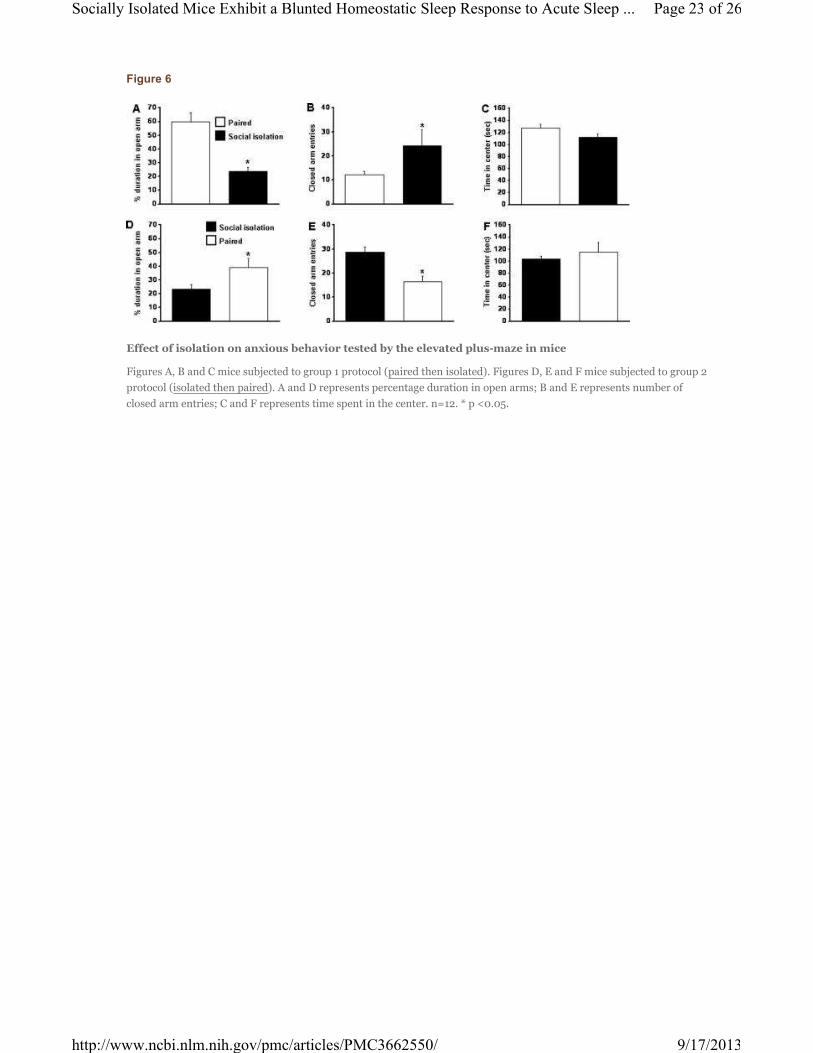
Figure 6
Effect of isolation on anxious behavior tested by the elevated plus-maze in mice
Figures A, B and C mice subjected to group 1 protocol (paired then isolated). Figures D, E and F mice subjected to group 2
protocol (isolated then paired). A and D represents percentage duration in open arms; B and E represents number of
closed arm entries; C and F represents time spent in the center. n=12. * p <0.05.
Page 23 of 26Socially Isolated Mice Exhibit a Blunted Homeostatic Sleep Response to Acute Sleep ...
9/17/2013http://www.ncbi.nlm.nih.gov/pmc/articles/PMC3662550/
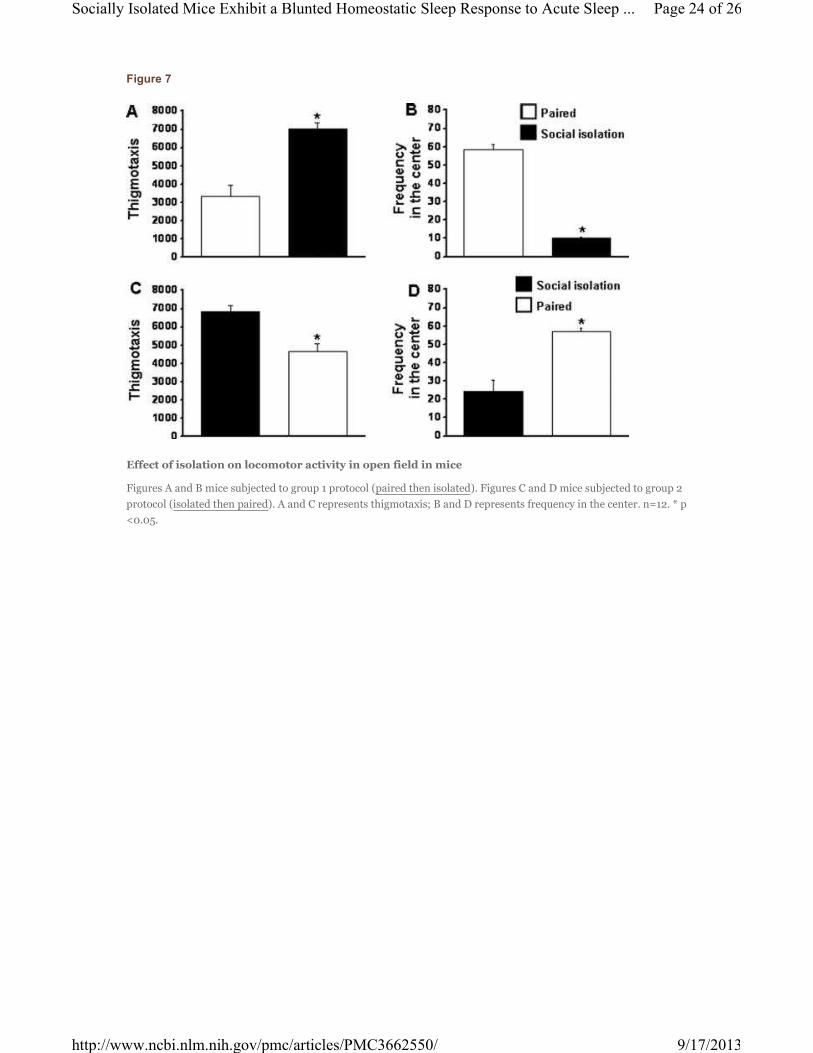
Figure 7
Effect of isolation on locomotor activity in open field in mice
Figures A and B mice subjected to group 1 protocol (paired then isolated). Figures C and D mice subjected to group 2
protocol (isolated then paired). A and C represents thigmotaxis; B and D represents frequency in the center. n=12. * p
<0.05.
Page 24 of 26Socially Isolated Mice Exhibit a Blunted Homeostatic Sleep Response to Acute Sleep ...
9/17/2013http://www.ncbi.nlm.nih.gov/pmc/articles/PMC3662550/
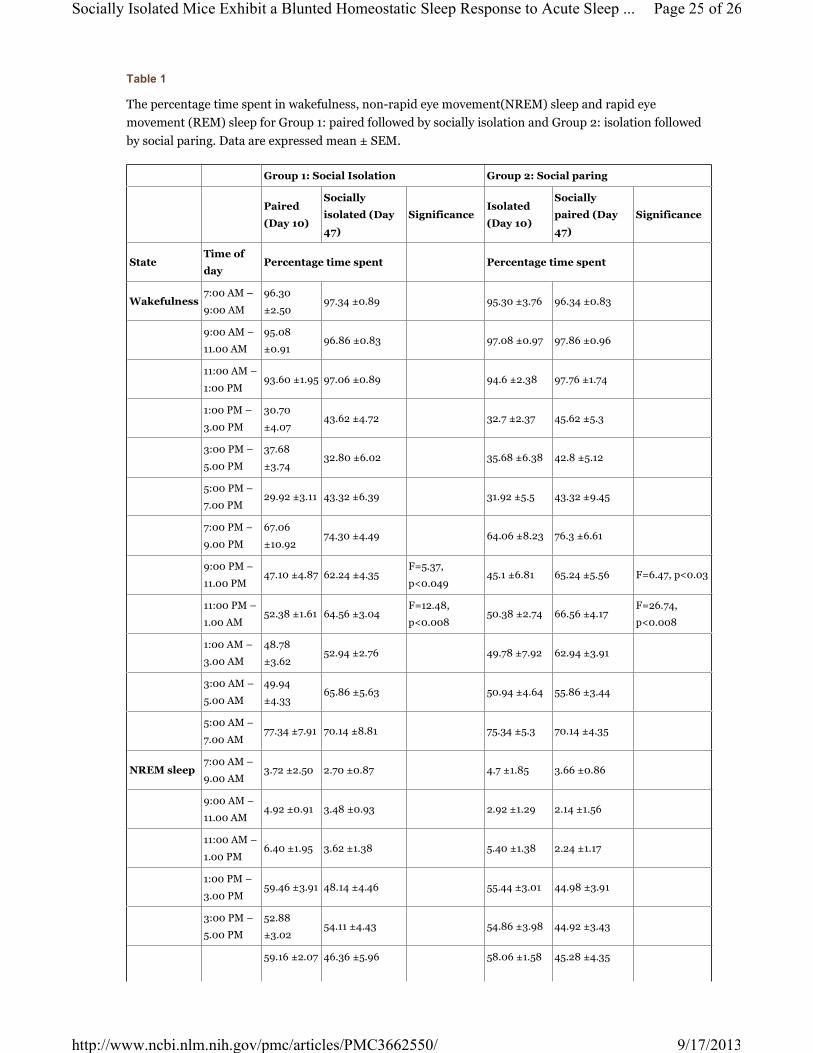
Table 1
The percentage time spent in wakefulness, non-rapid eye movement(NREM) sleep and rapid eye
movement (REM) sleep for Group 1: paired followed by socially isolation and Group 2: isolation followed
by social paring. Data are expressed mean ± SEM.
Group 1: Social Isolation Group 2: Social paring
Paired
(Day 10)
Socially
isolated (Day
47)
SignificanceIsolated
(Day 10)
Socially
paired (Day
47)
Significance
StateTime of
dayPercentage time spent Percentage time spent
Wakefulness7:00 AM –
9:00 AM
96.30
±2.5097.34 ±0.89 95.30 ±3.76 96.34 ±0.83
9:00 AM –
11.00 AM
95.08
±0.9196.86 ±0.83 97.08 ±0.97 97.86 ±0.96
11:00 AM –
1:00 PM93.60 ±1.95 97.06 ±0.89 94.6 ±2.38 97.76 ±1.74
1:00 PM –
3.00 PM
30.70
±4.0743.62 ±4.72 32.7 ±2.37 45.62 ±5.3
3:00 PM –
5.00 PM
37.68
±3.7432.80 ±6.02 35.68 ±6.38 42.8 ±5.12
5:00 PM –
7.00 PM29.92 ±3.11 43.32 ±6.39 31.92 ±5.5 43.32 ±9.45
7:00 PM –
9.00 PM
67.06
±10.9274.30 ±4.49 64.06 ±8.23 76.3 ±6.61
9:00 PM –
11.00 PM47.10 ±4.87 62.24 ±4.35
F=5.37,
p<0.04945.1 ±6.81 65.24 ±5.56 F=6.47, p<0.03
11:00 PM –
1.00 AM52.38 ±1.61 64.56 ±3.04
F=12.48,
p<0.00850.38 ±2.74 66.56 ±4.17
F=26.74,
p<0.008
1:00 AM –
3.00 AM
48.78
±3.6252.94 ±2.76 49.78 ±7.92 62.94 ±3.91
3:00 AM –
5.00 AM
49.94
±4.3365.86 ±5.63 50.94 ±4.64 55.86 ±3.44
5:00 AM –
7.00 AM77.34 ±7.91 70.14 ±8.81 75.34 ±5.3 70.14 ±4.35
NREM sleep7:00 AM –
9.00 AM3.72 ±2.50 2.70 ±0.87 4.7 ±1.85 3.66 ±0.86
9:00 AM –
11.00 AM4.92 ±0.91 3.48 ±0.93 2.92 ±1.29 2.14 ±1.56
11:00 AM –
1.00 PM6.40 ±1.95 3.62 ±1.38 5.40 ±1.38 2.24 ±1.17
1:00 PM –
3.00 PM59.46 ±3.91 48.14 ±4.46 55.44 ±3.01 44.98 ±3.91
3:00 PM –
5.00 PM
52.88
±3.0254.11 ±4.43 54.86 ±3.98 44.92 ±3.43
59.16 ±2.07 46.36 ±5.96 58.06 ±1.58 45.28 ±4.35
Page 25 of 26Socially Isolated Mice Exhibit a Blunted Homeostatic Sleep Response to Acute Sleep ...
9/17/2013http://www.ncbi.nlm.nih.gov/pmc/articles/PMC3662550/
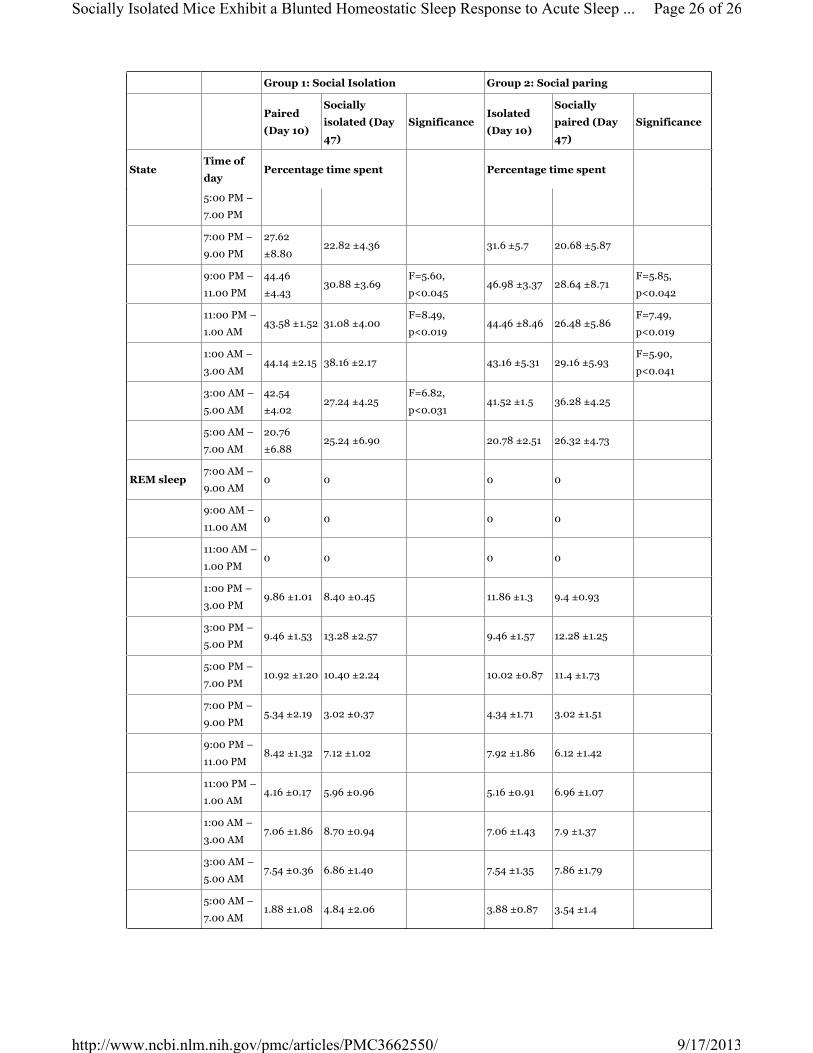
Group 1: Social Isolation Group 2: Social paring
Paired
(Day 10)
Socially
isolated (Day
47)
SignificanceIsolated
(Day 10)
Socially
paired (Day
47)
Significance
StateTime of
dayPercentage time spent Percentage time spent
5:00 PM –
7.00 PM
7:00 PM –
9.00 PM
27.62
±8.8022.82 ±4.36 31.6 ±5.7 20.68 ±5.87
9:00 PM –
11.00 PM
44.46
±4.4330.88 ±3.69
F=5.60,
p<0.04546.98 ±3.37 28.64 ±8.71
F=5.85,
p<0.042
11:00 PM –
1.00 AM43.58 ±1.52 31.08 ±4.00
F=8.49,
p<0.01944.46 ±8.46 26.48 ±5.86
F=7.49,
p<0.019
1:00 AM –
3.00 AM44.14 ±2.15 38.16 ±2.17 43.16 ±5.31 29.16 ±5.93
F=5.90,
p<0.041
3:00 AM –
5.00 AM
42.54
±4.0227.24 ±4.25
F=6.82,
p<0.03141.52 ±1.5 36.28 ±4.25
5:00 AM –
7.00 AM
20.76
±6.8825.24 ±6.90 20.78 ±2.51 26.32 ±4.73
REM sleep7:00 AM –
9.00 AM0 0 0 0
9:00 AM –
11.00 AM0 0 0 0
11:00 AM –
1.00 PM0 0 0 0
1:00 PM –
3.00 PM9.86 ±1.01 8.40 ±0.45 11.86 ±1.3 9.4 ±0.93
3:00 PM –
5.00 PM9.46 ±1.53 13.28 ±2.57 9.46 ±1.57 12.28 ±1.25
5:00 PM –
7.00 PM10.92 ±1.20 10.40 ±2.24 10.02 ±0.87 11.4 ±1.73
7:00 PM –
9.00 PM5.34 ±2.19 3.02 ±0.37 4.34 ±1.71 3.02 ±1.51
9:00 PM –
11.00 PM8.42 ±1.32 7.12 ±1.02 7.92 ±1.86 6.12 ±1.42
11:00 PM –
1.00 AM4.16 ±0.17 5.96 ±0.96 5.16 ±0.91 6.96 ±1.07
1:00 AM –
3.00 AM7.06 ±1.86 8.70 ±0.94 7.06 ±1.43 7.9 ±1.37
3:00 AM –
5.00 AM7.54 ±0.36 6.86 ±1.40 7.54 ±1.35 7.86 ±1.79
5:00 AM –
7.00 AM1.88 ±1.08 4.84 ±2.06 3.88 ±0.87 3.54 ±1.4
Page 26 of 26Socially Isolated Mice Exhibit a Blunted Homeostatic Sleep Response to Acute Sleep ...
9/17/2013http://www.ncbi.nlm.nih.gov/pmc/articles/PMC3662550/