Embed Size (px)
Citation preview
InternationalLabourOrganization
Social Security System of Ukraine in 2014–15 and BeyondTowards effective social protection fl oors
SOCIAL PROTECTION
DECENT WORK TECHNICAL SUPPORT TEAM AND COUNTRY OFFICE FOR CENTRAL AND EASTERN EUROPE

ILO DECENT WORK TECHNICAL SUPPORT TEAM AND COUNTRY OFFICE FOR CENTRAL AND EASTERN EUROPE
Social Security System of Ukraine in 2014–15 and Beyond
Towards effective social protection fl oors
Copyright © International Labour Organization 2016First published 2016
Publications of the International Labour Offi ce enjoy copyright under Protocol 2 of the Universal Copyright Convention. Nevertheless, short excerpts from them may be reproduced without authorization, on condition that the source is indicated. For rights of reproduction or translation, application should be made to ILO Publications (Rights and Licensing), International Labour Offi ce, CH–1211 Geneva 22, Switzerland, or by email: [email protected]. The International Labour Offi ce welcomes such applications.
Libraries, institutions and other users registered with a reproduction rights organization may make copies in accordance with the licences issued to them for this purpose. Visit www.ifrro.org to fi nd the reproduction rights organization in your country.
Social security system of Ukraine in 2014–15 and beyond: towards effective social protection fl oors / International Labour Organization; ILO DWT and Country Offi ce for Central and Eastern Europe. – Budapest: ILO, 2016
Система соціального забезпечення в Україні y 2014–2015 рр. і після: У напрямку ефективних мінімальних рівнів соціального захисту / Міжнародна організація праці; Група технічної підтримки з питань гідної праці та Бюро МОП для країн Центральної та Східної Європи. – Будапешт: МОП, 2016
ISBN: 978-92-2-031086-1 (print); 978-92-2-031087-8 (web pdf)
International Labour Organization; ILO DWT and Country Offi ce for Central and Eastern Europe
social security reform / social protection / Ukraine
02.03.1
ILO Cataloguing in Publication Data
The designations employed in ILO publications, which are in conformity with United Nations practice, and the presentation of material therein do not imply the expression of any opinion whatsoever on the part of the International Labour Offi ce concerning the legal status of any country, area or territory or of its authorities, or concerning the delimitation of its frontiers.
The responsibility for opinions expressed in signed articles, studies and other contributions rests solely with their authors, and publication does not constitute an endorsement by the International Labour Offi ce of the opinions expressed in them.
Reference to names of fi rms and commercial products and processes does not imply their endorsement by the International Labour Offi ce, and any failure to mention a particular fi rm, commercial product or process is not a sign of disapproval.
ILO publications and digital products can be obtained through major booksellers and digital distribution platforms, or ordered directly from [email protected]. For more information, visit our website: www.ilo.org/publns or contact [email protected].
Printed in Ukraine Cover photo © Ivan Aleksić 2010
i
CHAP TER 1 • ECONOMIC AND FISC AL CONTEX T
Contents
Foreword ......................................................................................................................................... iii
Summary ......................................................................................................................................... v
1. Economic and fi scal context ..................................................................................................... 1 1.1. Macroeconomic and labour market indicators .............................................................. 1 1.2. Household income ......................................................................................................... 4 1.3. Government budget ....................................................................................................... 6
2. Recent changes in the Ukrainian social security system ........................................................... 9 2.1. The social security expenditure ..................................................................................... 9 2.2. Financing of social insurance funds .............................................................................. 12 2.3. The subsistence minimum and State social guarantees ................................................. 14 2.4. Organizational changes in social insurance funds ......................................................... 17 2.5. Changes in the pension system ..................................................................................... 17 2.6. Unemployment benefi ts ................................................................................................ 21 2.7. Benefi ts for sickness, maternity, death and employment injury .................................... 23 2.8. Health care .................................................................................................................... 25 2.9. Non-contributory cash social benefi ts ........................................................................... 27 2.10. Housing subsidies .......................................................................................................... 32 2.11. Subsidies facilitating access to goods and services ....................................................... 34 2.12. Benefi ts for internally displaced persons ...................................................................... 35
3. Conclusions ............................................................................................................................... 37 3.1. The ILO assessment of the recent changes to the Ukrainian social security system .... 37 3.2. Views of social partners ................................................................................................ 39 3.3. Comments on the Poverty Reduction Strategy of Ukraine ........................................... 39 3.4. Concluding remarks – towards effective social protection floors in Ukraine ............... 41
References ....................................................................................................................................... 43
ii
SOCIAL SECURIT Y SYSTEM OF UKR AINE IN 2014�15 AND BE YOND
List of tables, figures and boxesTable 1. Income inequality indicators (based on total household income), 2013–2015 ............. 5Table 2. Poverty indicators, 2012–2014 ...................................................................................... 6Table 3. Social security expenditure by type, Ukraine and selected EU countries, 2013 ........... 10Table 4. Government expenditure on social security benefi ts (excluding health care),
2011–2020 ..................................................................................................................... 11Table 5. Changes in single social contribution rates in 2016 ...................................................... 12Table 6. Allocation of single social contributions to social insurance funds, 2013–2016 .......... 12Table 7. Relation between social guarantees and the subsistence minimum, 2016 .................... 14Table 8. Subsistence minimum by social group, 2010–2016 ...................................................... 15Table 9. Average pensions by type, 2010–2015 .......................................................................... 19Table 10. Distribution of pensions, 2013–2016 ............................................................................ 20Table 11. Revenue and expenditure of the Pension Fund, 2013–2016 ......................................... 20Table 12. Revenue and expenditure of the Unemployment Benefi t Fund, 2013–2016 ................ 23Table 13. Revenue and expenditure of the Temporary Incapacity Benefi ts Fund, 2013–2015 ..... 25Table 14. Revenue and expenditure of the Employment Injury Benefi t Fund, 2013–2015 .......... 25Table 15. Health expenditure by fi nancing source, 2010–2014 .................................................... 26Table 16. Composition of health expenditure by type of service and source of funds, 2014 ....... 26Table 17. Amounts of social benefi ts, 2014–2016 ........................................................................ 28Table 18. Number of recipients of social benefi ts by type, 2013–2015 ........................................ 29Table 19. Expenditure on cash social benefi ts by type, 2013–2015 ............................................. 29Table 20. Subsidy from the State budget to local budgets for social benefi ts, 2013–2016 ........... 30Table 21. Changes in childbirth benefi t (effective on 1 July 2014) .............................................. 31Table 22. Number of recipients and expenditure of housing subsidies, 2014–2015..................... 33Table 23. Composition of the funding of “privileges” by group, 2012 ........................................ 34Table 24. Subsidy from the State budget to local budgets for various subsidies, 2013–2015 ...... 35
Figure 1. Real GDP growth rates, 2005–2020 .............................................................................. 1Figure 2. Rates of increase in the Consumer Price Index, 2005–2019 ......................................... 2Figure 3. Unemployment rates, 2005–2015 ................................................................................. 3Figure 4. Labour force participation rates by sex, 2005–2015 ..................................................... 3Figure 5. Year-on-year change in real average monthly wages, 2014–2015 ................................ 4Figure 6. Composition of household revenues, 2010–2015 ......................................................... 5Figure 7. Government revenue, 2010–2020 ................................................................................. 7Figure 8. Government expenditure, 2010–2020 ........................................................................... 7Figure 9. Changes in the subsistence minimum (able-bodied persons) in nominal and
real terms, 2011–2015 ................................................................................................... 15Figure 10. Comparison of the statutory and estimated subsistence minimums, November 2015 ... 16Figure 11. Average unemployment benefi t, subsistence minimum for able-bodied persons
and average wage, 2012–2016 ...................................................................................... 22Figure 12. Number of internally displaced persons and benefi t expenditure, 2014–2015 ............. 36
Box 1. Excerpts from the Memorandum of Economic and Financial Policies attached to the Letter of Intent to the IMF on 21 July 2015.......................................... 19
Box 2. Excerpts from the Memorandum of Economic and Financial Policies attached to the Letter of Intent to the IMF on 21 July 2015.......................................... 33
Box 3. Key features of the ILO Social Protection Floors Recommendation No. 202 (2012) .... 41
iii
CHAP TER 1 • ECONOMIC AND FISC AL CONTEX T
Foreword
In the context of the prolonged and deepening economic downturn, the Ukrainian Government implemented a number of changes in its social security system as part of its austerity measures in 2014 and 2015. The ILO carried out a review of the recent changes made to the Ukrainian social security system and of the planned future reforms in the light of international social security standards. The ILO assessment aims to assist the Ukrainian Government and the social partners in effectively formulating and implementing measures to sustain the social security system under unfavourable socioeconomic and political conditions.
This report is organized as follows: Chapter 1 presents the current and forecasted economic and fi scal situation in Ukraine, and its implications for the social security system. Chapter 2 analyses the changes made to the social security system implemented between 2014 and 2015. Chapter 3 reviews these changes and discusses their policy implications. Recommendations derived from the review are intended to enhance the effectiveness of the policy guaranteeing basic income security for all.
The report was developed as a part of the ILO project, coordinated by Kenichi Hirose, Senior Social Protection Specialist in the ILO Decent Work Technical Support Team and Country Offi ce for Central and Eastern Europe (ILO DWT/CO-Budapest). The report was prepared by Krzysztof Hagemejer and Michal Polakowski of the International Centre for Research and Analysis (ICRA). This fi nal report was completed under the supervision of Kenichi Hirose. Technical comments were provided by the Social Protection Department of the ILO Geneva. The main fi ndings and recommendations of this report were presented and discussed at the national tripartite meeting in Kyiv in May 2016. Comments from the Ukrainian tripartite partners have been refl ected in this fi nal report.
The project and the report profi ted enormously from the assistance of Sergiy Savchuk, the ILO National Correspondent in Ukraine. The background study, prepared by Natalia Poliak, Olena Tarasiuk and Zoryana Samerkhanova of the Institute of Labour and Employment of Population of Ministry of Social Policy and National Academy of Sciences of Ukraine, also contributed substantially to the report. Important insights into the situation in Ukraine and the national policy debates were provided by the tripartite partners from the Ukrainian Government (Ministry of Social Policy) and from the employers’ and workers’ organizations. Athena Bochanis provided English editing and Olena Guz translated this report into Ukrainian.
We trust that the policy recommendations in this report will contribute to the development of a national policy for ensuring adequate social security for all, in line with the ILO Social Security Minimum Standards Convention, No. 102 (1952) – which Ukraine has committed to ratifying – and the ILO Social Protection Floors Recommendation, No. 202 (2012).
Budapest, June 2016
Antonio Graziosi Kenichi HiroseDirector Senior Social Protection SpecialistILO DWT/CO Budapest ILO DWT/CO Budapest

v
CHAP TER 1 • ECONOMIC AND FISC AL CONTEX T
Summary
This report presents a review of the changes made to the Ukrainian social security system between 2014 and 2015, and of the reforms planned for the near future. The review aims to assist the Ukrainian Government and the social partners in effectively formulating and implementing measures to help sustain the social security system under unfavourable socioeconomic and political conditions.
Economic and fiscal context – deep recession and high inflationAfter the global economic and fi nancial crisis in 2009, the Ukrainian economy began recovering in 2010. However, continuous confl icts since late 2013 have resulted in falling levels of economic activity, currency erosion and high infl ation. The economic contraction from 2014 to 2015 further resulted in deep reductions of private consumption and investment.
Infl ation accelerated dramatically from 2014 to 2015, largely due to an increase in energy prices. Unemployment (according to the ILO defi nition) increased, but only one-third of the unemployed are actually registered with employment offi ces and receive unemployment benefi ts. As a result of the confl icts in the east of Ukraine, more than 1.6 million people were displaced within Ukraine. Internally displaced persons face particular diffi culties in fi nding employment. In 2015, the average household income declined by 28 percent in real terms due to the signifi cant devaluation of wages, pensions and other social benefi ts. Inequality and poverty likely increased as well, although up-to-date statistical data fully assessing the poverty impact are not yet available.
Government revenues decreased by 5 percent of GDP, mainly because of the decrease in revenue from social security contributions and income taxes. In 2016 and onwards, there is a risk of further decrease due to the recent decision to lower social security contributions. The declining Government revenues have led to reductions in Government expenditure, largely through the reduction in social expenditure particularly pensions. This has been done so that Ukraine can meet the terms agreed to with the IMF, specifi cally to contain the Government defi cit within 3.7 percent of GDP for 2016, a key condition for the IMF lending.
Changes in the Ukrainian social security system – as part of austerity measuresIn the context of the prolonged and deepening economic downturn in Ukraine, the Government has implemented a number of changes in the social security system as part of its austerity measures. These measures include modifying the organization and fi nancing of social insurance funds; freezing, delaying and reducing the indexation of social security benefi ts; and changing benefi t entitlements, benefi t amounts and taxation rules. The recent developments in the Ukrainian social security system from 2014 to 2015 are summarized below.
vi
SOCIAL SECURIT Y SYSTEM OF UKR AINE IN 2014�15 AND BE YOND
Declining social security expenditure
The total non-health social security expenditure was reduced from 23.0 percent of GDP in 2013 to 18.5 percent in 2015, and is projected to be further reduced to 17.8 percent of GDP mainly due to the reduction of social insurance benefi ts, particularly pensions. However, expenditure on the social benefi ts funded directly from the State budget is projected to increase from its current level, as it is expected that the costs for housing subsidies and social assistance benefi ts for low-income households continue to increase.
Frozen subsistence minimum levels and reduced indexation
In Ukraine, the subsistence minimum is a key policy parameter that is linked to the minimum wage, the minimum levels of pensions and other social security benefi ts. Due to the freeze of the subsistence minimum levels during 2014, the average subsistence minimum has lost nearly 40 percent of its value in real terms under high infl ation. Indexation was also frozen or reduced for other benefi ts, including employment injury benefi ts.
Failing to adequately adjust the benefi ts in a high infl ation period has had major negative consequences for all households, particularly low-income households. As of November 2015, the average statutory subsistence minimum represents 53.5 percent of the estimated subsistence minimum amount calculated based on the prices of predefi ned baskets of goods and services and price changes.
Reduction of the single social contribution rate
The single social contribution rate has been reduced signifi cantly – from 36.76–49.7 percent to 22 percent for employers, and from 3.6 percent to zero for workers. This measure would make sense only if the reduced contribution rate widens the tax base and results in positive fi scal effects. Based on preliminary observations, however, it is likely that the total contribution revenue will decrease, specifi cally affecting the pension system through the signifi cantly reduced allocation rate. The additional fi scal pressure on the State budget to cover the widening fi nancial defi cit will likely lead to additional cuts in benefi t entitlements.
Organizational changes of social insurance funds
With a view to saving administrative costs and improving coordination, it was decided to merge the Temporary Incapacity Benefi ts Fund and the Employment Injury Benefi t Fund into a single fund in 2015. However, one year later, the merger has still not been completed, indicating a lack of preparedness as observed by the social partners. One downside to this restructuring is related to the change in the governance structure, which diminishes the role of the social partners in the management and decision-making process of the social insurance funds and reduces the autonomy of the funds.
Reduction and restriction of pensions and other benefi ts
The Ukrainian pension system has undergone signifi cant transformations in recent years. The fi rst wave of major reforms started in 2011, when the Government decided to increase the retirement age of women from 55 to 60 years by 2021. The reform also increased the contribution period required for
vii
SUMMARY
the minimum pension by 5 years for both sexes. Moreover, a maximum pension equaling ten times the minimum pension has been introduced for newly-granted pensions.
The reform measures implemented in 2014 and 2015 continue to tighten the benefi t eligibility conditions and restrict benefi t payments. Specifi cally, these measures reduce the pensions for special groups, eliminate preferential pension provisions for special occupational groups, reduce the pensions for working pensioners, and tax pensions above a certain threshold (although the Government increased signifi cantly the minimum threshold for the pension taxation in 2016). The Government is planning further pension reforms, including the introduction of a mandatory funded pension tier.
In addition, various auxiliary benefi ts paid by the Temporary Incapacity Benefi ts Fund have also been removed from the list of benefi ts fi nanced by social security contributions.
More targeting of non-contributory cash social benefi ts and other income support
There is a pronounced tendency for Ukraine to transform universal or categorical social benefi ts to means-tested benefi ts targeted to low-income families.
Among Eastern European countries, Ukraine was known to provide relatively sizable benefi ts to support families with children through non-contributory universal social benefi ts. However, child benefi ts were abolished, and childbirth benefi ts have been cut signifi cantly for second and third children.
The Government plans to further expand the targeted social assistance for low-income families. The number of benefi ciaries and the expenditure on this programme increased substantially in comparison with other categorical benefi ts. Although this programme is expected to cover all households in the lowest income decile by 2019, the fi scal priority has been shifted to housing subsidies, which started to play a major role in cushioning the impact of the increase in energy prices in 2015.
In 2014 and 2015, a series of amendments were implemented to the programme providing subsidized access to certain goods and services with discounted prices (the so-called “privileges”). These amendments aimed at targeting these benefi ts to low income groups and restricting the categories of the benefi ciaries. At the same time, new special benefi ts were introduced for participants in anti-terrorist operations.
In 2014, a new benefi t was introduced for internally displaced persons who meet certain eligibility conditions. They may not possess a residence or bank deposits above certain amount, and able-bodied family members must use their capacity for work.
Health care fi nancing – increasing burden on households
The Ukrainian health care system is characterized by an extensive level of private fi nancing, which has been strongly affected by the national macroeconomic instability. Although public sources cover almost all costs of inpatient care, day care, prevention, public health, and health management, the households are asked to pay almost all pharmaceutical and other medical product costs, and more than one-third of outpatient care costs. Consequently, 47.1 percent of the health expenditure is fi nanced by out-of-pocket payments. The majority of households, particularly low-income households, cite the high costs of medicine, medical products and services as the main obstacles to accessing medical care.
viii
SOCIAL SECURIT Y SYSTEM OF UKR AINE IN 2014�15 AND BE YOND
ILO assessment and recommendationsThe last chapter of the report analyses the policy implications of the current policies, looks at the views of the social partners identifi ed during the project, reviews the recently-adopted National Poverty Reduction Strategy, and recommends the development of a more comprehensive national social protection strategy.
The assessment suggests a different approach, whereby key stakeholders should fi rst agree on benefi t levels and the mechanisms to safeguard them, and then discuss measures to make the system sustainable in the long term. This process should be based on a well-informed and participatory policy dialogue, and an in-depth fi nancial and social impact assessment of the recent and proposed reforms of the Ukrainian social security system in line with international social security instruments.
Based on the ILO assessment, it is recommended that Ukraine undertake the following measures:
• Ukraine should adopt a mechanism to adequately adjust the subsistence minimum and re-establish the social security benefi ts levels.
• In restructuring the social insurance funds, the Government should ensure that the social partners continue to play a key role in the management and decision-making process of the social insurance funds and maintain the autonomy of the funds.
• The country should conduct a proper assessment of the fi nancial impact and social consequences of the proposed reforms in the fi nancing structure and benefi t entitlements, in consultation with the social partners.
• Before considering the introduction of a mandatory funded pension tier, the Government and the social partners should examine the experiences of failure of similar reforms in countries in Central and Eastern Europe and in Latin America.
• As the Government aims to expand the role of the targeted social assistance benefi ts for low-income families, it should carefully analyse the pros and cons of such a policy direction. On the one hand, such targeting could achieve a more effi cient resource allocation under tight resource constraints. On the other hand, targeting may not effectively address the underlying poverty issues. Targeted systems typically exclude many low-paid working families thus failing to lift them out of poverty, involve extremely high administrative costs in identifying the poor, and undermine incentives to work.
• It should be observed that cutting energy price subsidies has led the Government to fi nance an unexpectedly large amount of housing subsidies to compensate the energy price increases for low-income households. Such an ad hoc approach not only undermines the expected cost savings but also creates more negative consequences, simply shifting the burden to another area.
The Ukrainian Government has recently taken crucial steps towards protecting the minimum benefi t levels under severe austerity measures and towards fulfi lling the goals of the EU Association Agreement. With the strong support of the trade unions and employers’ organizations, the Government adopted the Law on the ratifi cation of the ILO Social Security Minimum Standards Convention, No. 102 (1952) on 16 March 2016. The Government is also considering ratifying the European Code of Social Security. All of these actions will contribute to strengthening the Ukrainian social protection system in compliance with the ILO Social Protection Floors Recommendation No. 202 (2012).
Ukraine’s ratifi cation of ILO Convention No. 102 is a major milestone in its efforts to maintain a well-functioning social protection system that ensures effective access to basic health care and adequate income security for all. The ILO, together with the UN System in Ukraine, stand ready to provide further assistance in translating these standards into reality.
1
CHAP TER 1 • ECONOMIC AND FISC AL CONTEX T
Economic and fiscal context
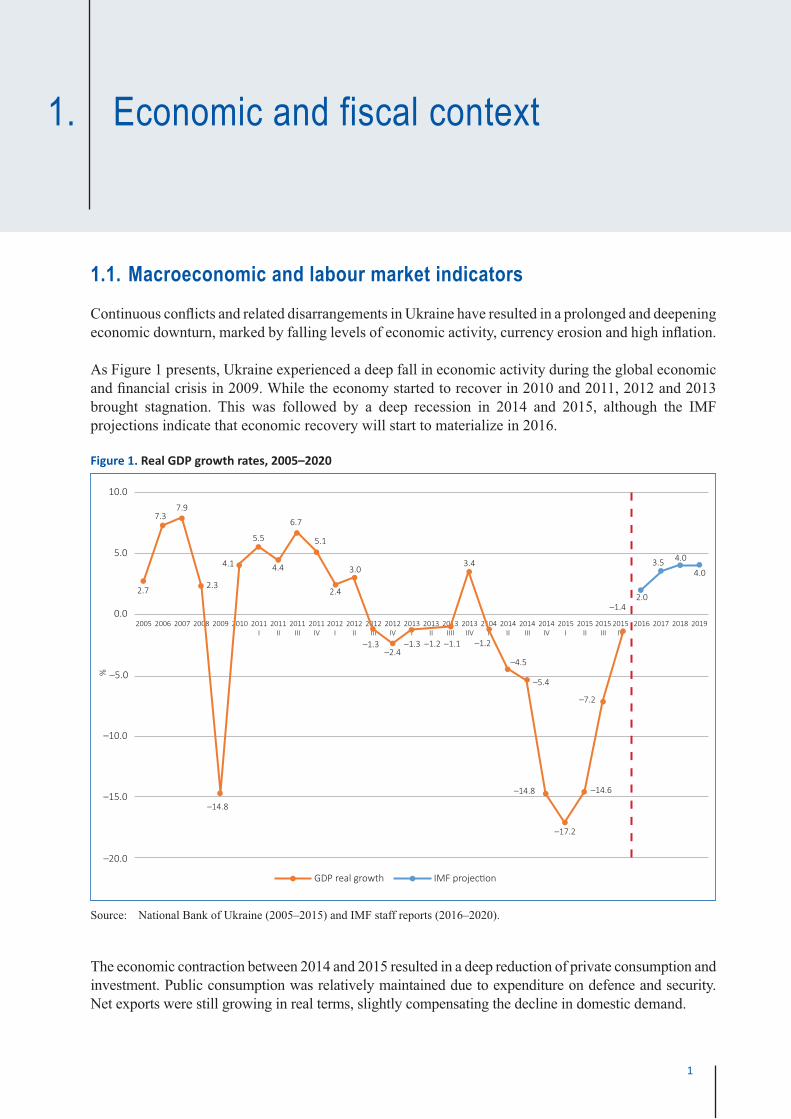
1.1. Macroeconomic and labour market indicators Continuous confl icts and related disarrangements in Ukraine have resulted in a prolonged and deepening economic downturn, marked by falling levels of economic activity, currency erosion and high infl ation.
As Figure 1 presents, Ukraine experienced a deep fall in economic activity during the global economic and fi nancial crisis in 2009. While the economy started to recover in 2010 and 2011, 2012 and 2013 brought stagnation. This was followed by a deep recession in 2014 and 2015, although the IMF projections indicate that economic recovery will start to materialize in 2016.
Figure 1. Real GDP growth rates, 2005–2020
10.0
5.0
–5.0
0.0
–10.0
–15.0–14.8
2.7
7.37.9
2.3
4.1
5.5
4.4
6.7
5.1
3.0
2.4
–1.3–2.4
–1.3 –1.2 –1.1
3.4
–1.2
–4.5
–5.4
–14.8
–17.2
–14.6
–7.2
–1.42.0
3.5 4.0
4.0
%
–20.0
2005 2006 2007 2008 2009 2010 2011I
2011II
2011III
2011IV
2012I
2012II
2012III
2012IV
2013I
2013II
2013IIII
2013IIV
2104I
2014II
2014III
2014IV
2015I
2015II
2015III
2015IV
2016 2017 2018 2019
GDP real growth IMF projec� on
Source: National Bank of Ukraine (2005–2015) and IMF staff reports (2016–2020).
The economic contraction between 2014 and 2015 resulted in a deep reduction of private consumption and investment. Public consumption was relatively maintained due to expenditure on defence and security. Net exports were still growing in real terms, slightly compensating the decline in domestic demand.
1.
2
SOCIAL SECURIT Y SYSTEM OF UKR AINE IN 2014�15 AND BE YOND
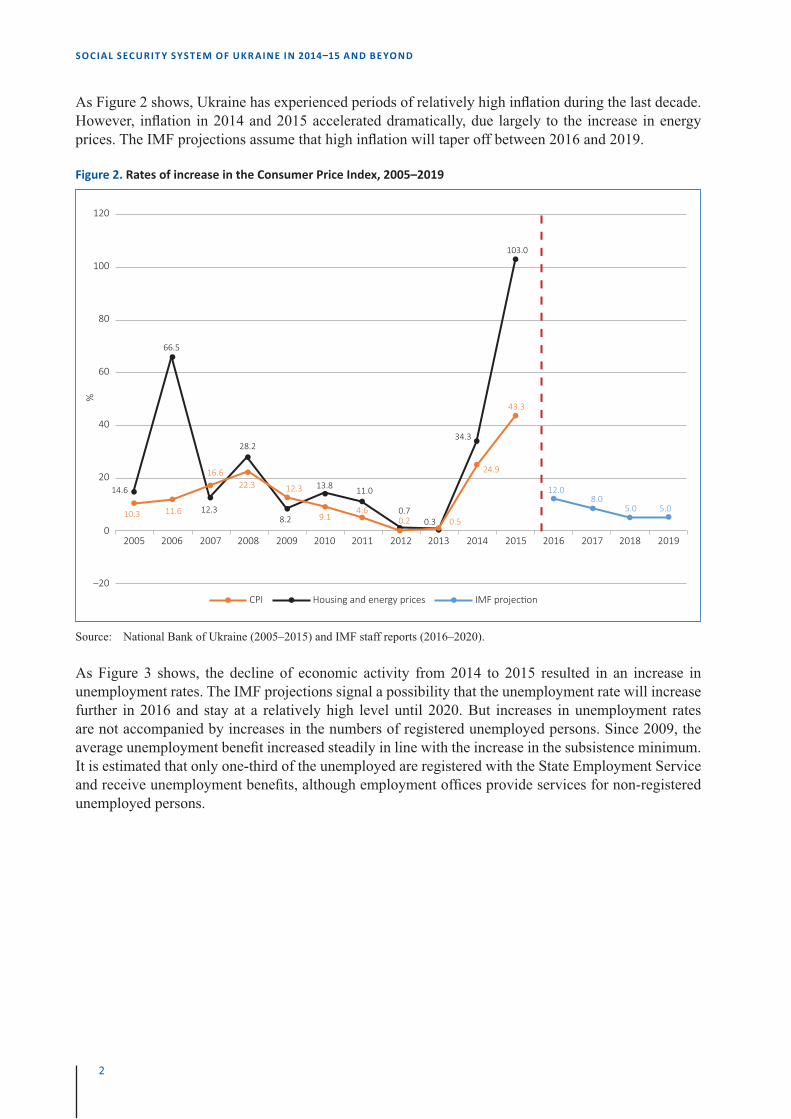
As Figure 2 shows, Ukraine has experienced periods of relatively high infl ation during the last decade. However, infl ation in 2014 and 2015 accelerated dramatically, due largely to the increase in energy prices. The IMF projections assume that high infl ation will taper off between 2016 and 2019.
Figure 2. Rates of increase in the Consumer Price Index, 2005–2019
–20
0
20
40
60
80
100
120
2005 2006 2007 2008 2009 2010 2011 2012 2013 2014 2015 2016 2017 2018 2019
CPI Housing and energy prices IMF projec� on
%
14.6
66.5
28.2
13.8 11.0
0.7
34.3
103.0
8.212.3
0.3
22.3 12.3
9.14.6
24.9
43.3
11.610.3
16.6
0.50.2
12.08.0
5.0 5.0
Source: National Bank of Ukraine (2005–2015) and IMF staff reports (2016–2020).
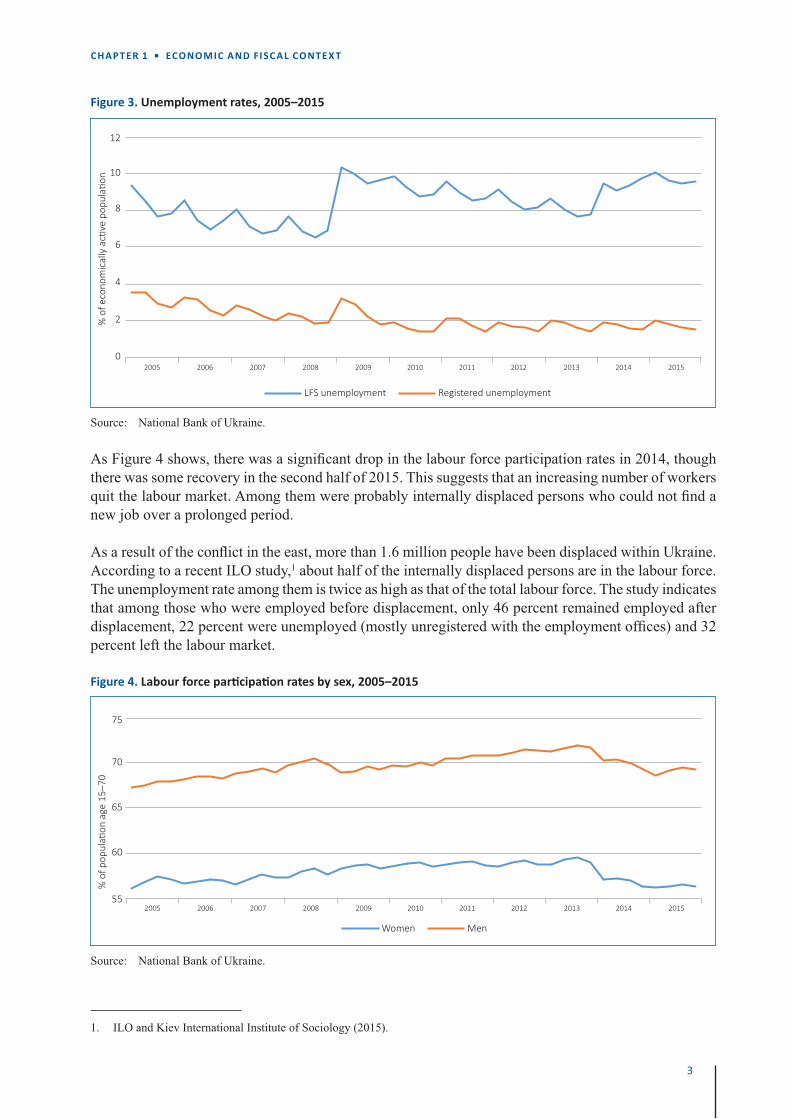
As Figure 3 shows, the decline of economic activity from 2014 to 2015 resulted in an increase in unemployment rates. The IMF projections signal a possibility that the unemployment rate will increase further in 2016 and stay at a relatively high level until 2020. But increases in unemployment rates are not accompanied by increases in the numbers of registered unemployed persons. Since 2009, the average unemployment benefi t increased steadily in line with the increase in the subsistence minimum. It is estimated that only one-third of the unemployed are registered with the State Employment Service and receive unemployment benefi ts, although employment offi ces provide services for non-registered unemployed persons.
3
CHAP TER 1 • ECONOMIC AND FISC AL CONTEX T
Figure 3. Unemployment rates, 2005–2015
2005 2006 2007 2008 2009 2010 2011 2012 2013 2014 2015
12
10
8
6
4
2
0
% o
f eco
nom
ical
ly a
c� v
e po
pula
� on
LFS unemployment Registered unemployment
Source: National Bank of Ukraine.
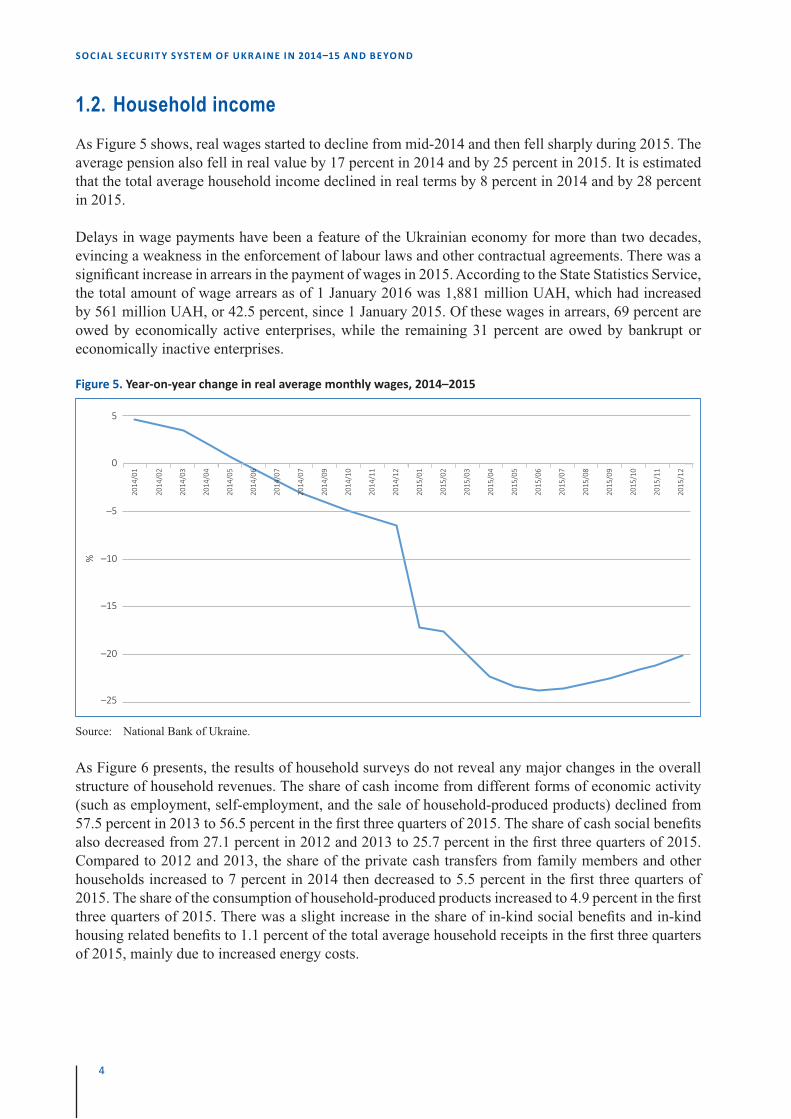
As Figure 4 shows, there was a signifi cant drop in the labour force participation rates in 2014, though there was some recovery in the second half of 2015. This suggests that an increasing number of workers quit the labour market. Among them were probably internally displaced persons who could not fi nd a new job over a prolonged period.
As a result of the confl ict in the east, more than 1.6 million people have been displaced within Ukraine. According to a recent ILO study,1 about half of the internally displaced persons are in the labour force. The unemployment rate among them is twice as high as that of the total labour force. The study indicates that among those who were employed before displacement, only 46 percent remained employed after displacement, 22 percent were unemployed (mostly unregistered with the employment offi ces) and 32 percent left the labour market.
Figure 4. Labour force par� cipa� on rates by sex, 2005–2015
75
70
65
60
55
% o
f pop
ula�
on
age
15–7
0
Women Men
2005 2006 2007 2008 2009 2010 2011 2012 2013 2014 2015
Source: National Bank of Ukraine.
1. ILO and Kiev International Institute of Sociology (2015).
4
SOCIAL SECURIT Y SYSTEM OF UKR AINE IN 2014�15 AND BE YOND
1.2. Household income As Figure 5 shows, real wages started to decline from mid-2014 and then fell sharply during 2015. The average pension also fell in real value by 17 percent in 2014 and by 25 percent in 2015. It is estimated that the total average household income declined in real terms by 8 percent in 2014 and by 28 percent in 2015.
Delays in wage payments have been a feature of the Ukrainian economy for more than two decades, evincing a weakness in the enforcement of labour laws and other contractual agreements. There was a signifi cant increase in arrears in the payment of wages in 2015. According to the State Statistics Service, the total amount of wage arrears as of 1 January 2016 was 1,881 million UAH, which had increased by 561 million UAH, or 42.5 percent, since 1 January 2015. Of these wages in arrears, 69 percent are owed by economically active enterprises, while the remaining 31 percent are owed by bankrupt or economically inactive enterprises.
Figure 5. Year-on-year change in real average monthly wages, 2014–2015
%
–20
–25
–15
–10
–5
0
5
2014
/01
2014
/02
2014
/03
2014
/04
2014
/05
2014
/06
2014
/07
2014
/07
2014
/09
2014
/10
2014
/11
2014
/12
2015
/01
2015
/02
2015
/03
2015
/04
2015
/05
2015
/06
2015
/07
2015
/08
2015
/09
2015
/10
2015
/11
2015
/12
Source: National Bank of Ukraine.
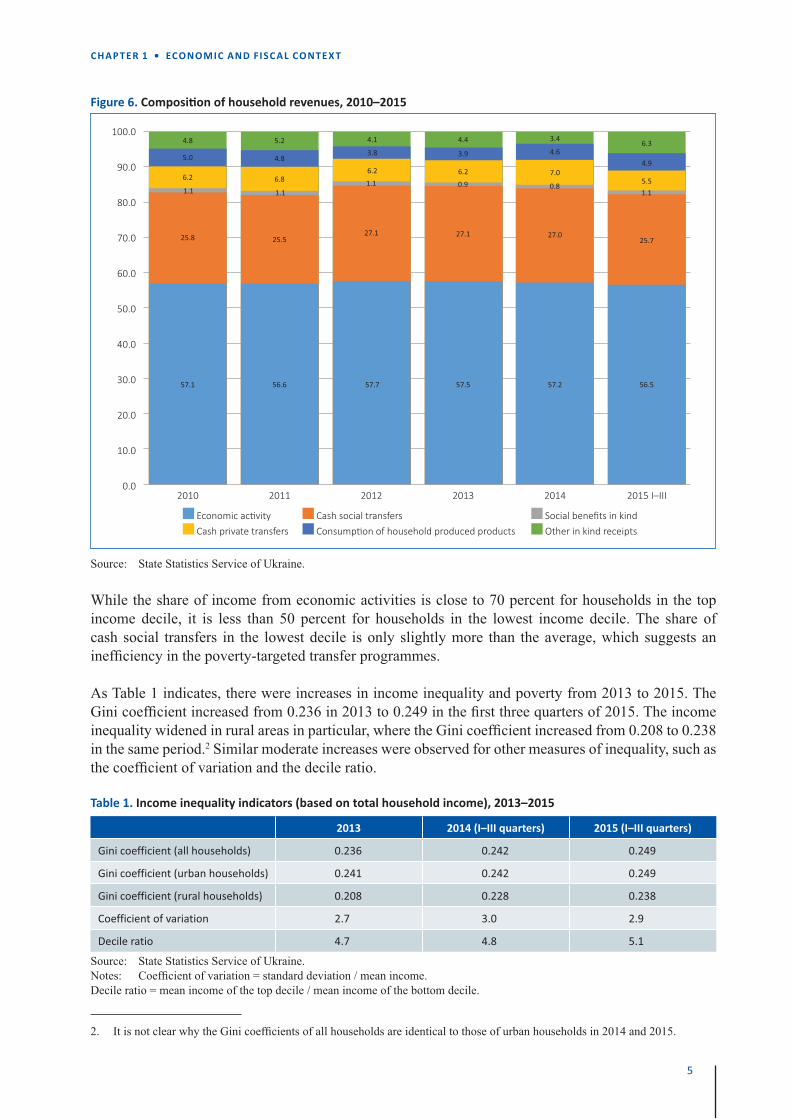
As Figure 6 presents, the results of household surveys do not reveal any major changes in the overall structure of household revenues. The share of cash income from different forms of economic activity (such as employment, self-employment, and the sale of household-produced products) declined from 57.5 percent in 2013 to 56.5 percent in the fi rst three quarters of 2015. The share of cash social benefi ts also decreased from 27.1 percent in 2012 and 2013 to 25.7 percent in the fi rst three quarters of 2015. Compared to 2012 and 2013, the share of the private cash transfers from family members and other households increased to 7 percent in 2014 then decreased to 5.5 percent in the fi rst three quarters of 2015. The share of the consumption of household-produced products increased to 4.9 percent in the fi rst three quarters of 2015. There was a slight increase in the share of in-kind social benefi ts and in-kind housing related benefi ts to 1.1 percent of the total average household receipts in the fi rst three quarters of 2015, mainly due to increased energy costs.
5
CHAP TER 1 • ECONOMIC AND FISC AL CONTEX T
Figure 6. Composi� on of household revenues, 2010–2015
100.0
90.0
80.0
70.0
60.0
50.0
40.0
30.0
20.0
10.0
0.02010 2011 2012 2013 2014 2015 I–III
57.1
25.8
6.2
5.0
4.8
56.6
25.5
6.8
4.8
5.2
57.7
27.1
3.8
6.2
4.1
57.5
27.1
3.9
6.2
4.4
57.2
27.0
4.6
7.0
3.4
56.5
25.7
5.5
4.9
6.3
Economic ac� vity Cash social transfers Social benefi ts in kind Cash private transfers Consump� on of household produced products Other in kind receipts
1.1 1.11.1 0.9 0.8
1.1
Source: State Statistics Service of Ukraine.
While the share of income from economic activities is close to 70 percent for households in the top income decile, it is less than 50 percent for households in the lowest income decile. The share of cash social transfers in the lowest decile is only slightly more than the average, which suggests an ineffi ciency in the poverty-targeted transfer programmes.
As Table 1 indicates, there were increases in income inequality and poverty from 2013 to 2015. The Gini coeffi cient increased from 0.236 in 2013 to 0.249 in the fi rst three quarters of 2015. The income inequality widened in rural areas in particular, where the Gini coeffi cient increased from 0.208 to 0.238 in the same period.2 Similar moderate increases were observed for other measures of inequality, such as the coeffi cient of variation and the decile ratio.
Table 1. Income inequality indicators (based on total household income), 2013–2015
2013 2014 (I–III quarters) 2015 (I–III quarters)
Gini coefficient (all households) 0.236 0.242 0.249
Gini coefficient (urban households) 0.241 0.242 0.249
Gini coefficient (rural households) 0.208 0.228 0.238
Coefficient of variation 2.7 3.0 2.9
Decile ratio 4.7 4.8 5.1
Source: State Statistics Service of Ukraine.Notes: Coeffi cient of variation = standard deviation / mean income.Decile ratio = mean income of the top decile / mean income of the bottom decile.
2. It is not clear why the Gini coeffi cients of all households are identical to those of urban households in 2014 and 2015.
6
SOCIAL SECURIT Y SYSTEM OF UKR AINE IN 2014�15 AND BE YOND
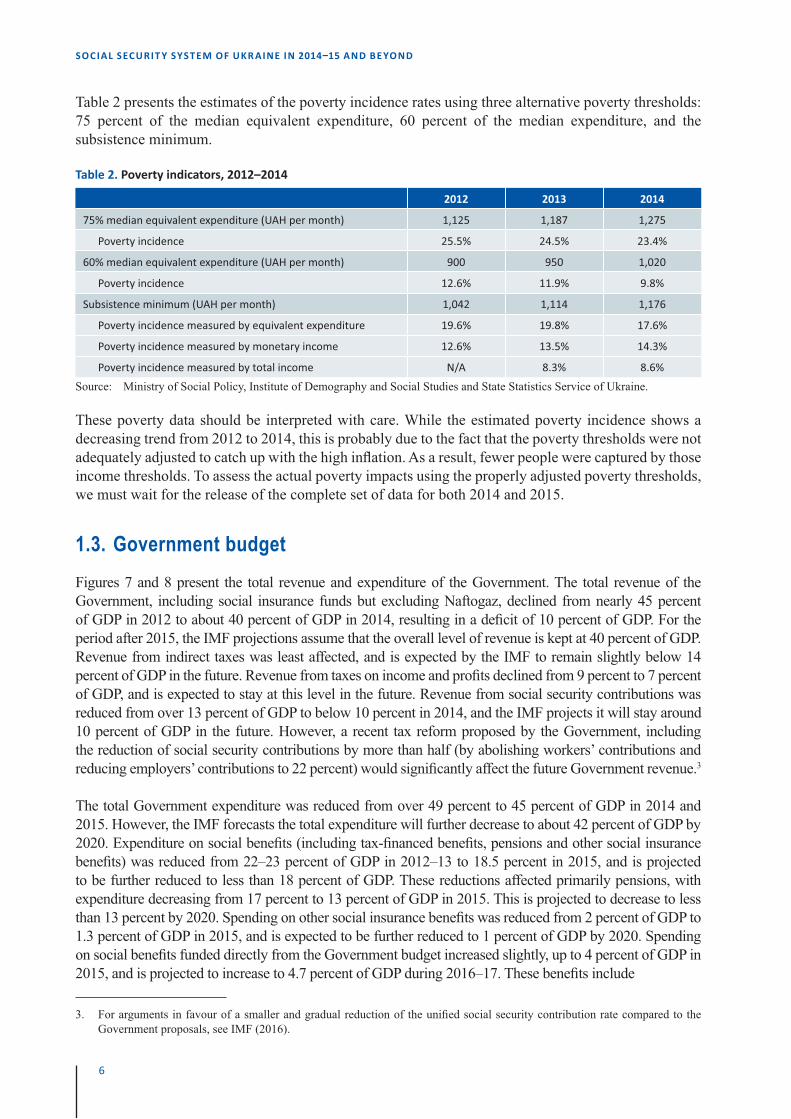
Table 2 presents the estimates of the poverty incidence rates using three alternative poverty thresholds: 75 percent of the median equivalent expenditure, 60 percent of the median expenditure, and the subsistence minimum.
Table 2. Poverty indicators, 2012–2014
2012 2013 2014
75% median equivalent expenditure (UAH per month) 1,125 1,187 1,275
Poverty incidence 25.5% 24.5% 23.4%
60% median equivalent expenditure (UAH per month) 900 950 1,020
Poverty incidence 12.6% 11.9% 9.8%
Subsistence minimum (UAH per month) 1,042 1,114 1,176
Poverty incidence measured by equivalent expenditure 19.6% 19.8% 17.6%
Poverty incidence measured by monetary income 12.6% 13.5% 14.3%
Poverty incidence measured by total income N/A 8.3% 8.6%
Source: Ministry of Social Policy, Institute of Demography and Social Studies and State Statistics Service of Ukraine.
These poverty data should be interpreted with care. While the estimated poverty incidence shows a decreasing trend from 2012 to 2014, this is probably due to the fact that the poverty thresholds were not adequately adjusted to catch up with the high infl ation. As a result, fewer people were captured by those income thresholds. To assess the actual poverty impacts using the properly adjusted poverty thresholds, we must wait for the release of the complete set of data for both 2014 and 2015.
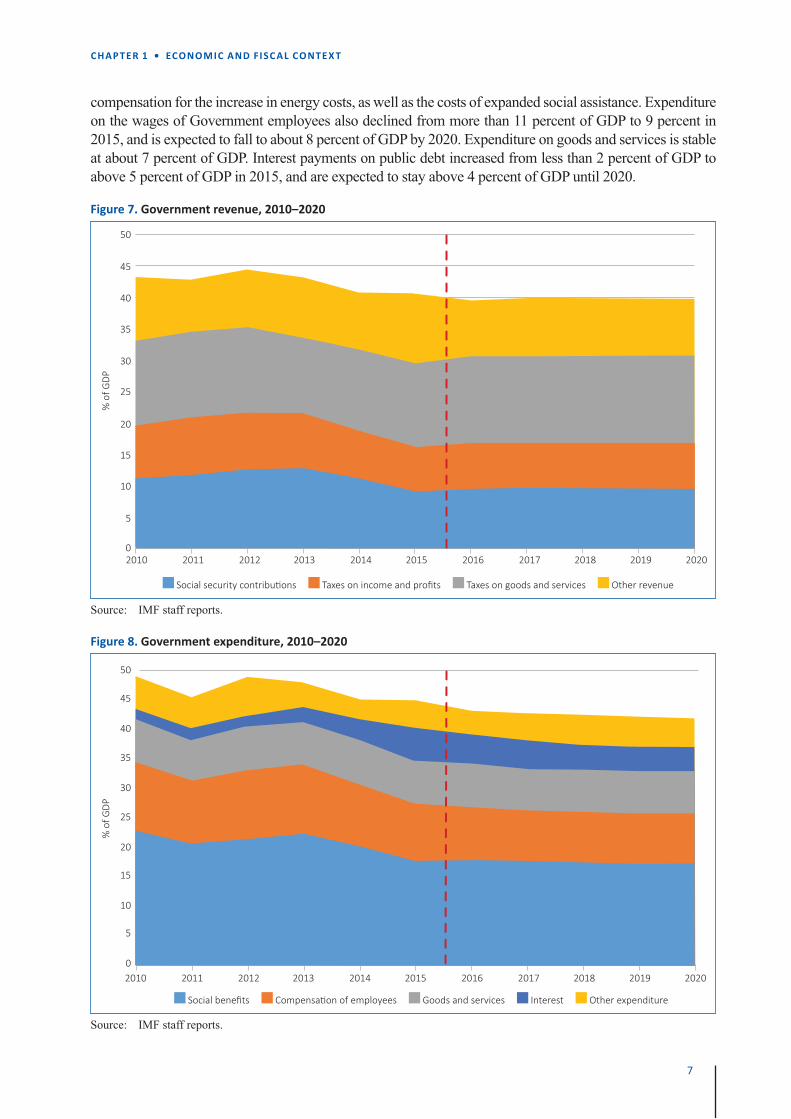
1.3. Government budget Figures 7 and 8 present the total revenue and expenditure of the Government. The total revenue of the Government, including social insurance funds but excluding Naftogaz, declined from nearly 45 percent of GDP in 2012 to about 40 percent of GDP in 2014, resulting in a defi cit of 10 percent of GDP. For the period after 2015, the IMF projections assume that the overall level of revenue is kept at 40 percent of GDP. Revenue from indirect taxes was least affected, and is expected by the IMF to remain slightly below 14 percent of GDP in the future. Revenue from taxes on income and profi ts declined from 9 percent to 7 percent of GDP, and is expected to stay at this level in the future. Revenue from social security contributions was reduced from over 13 percent of GDP to below 10 percent in 2014, and the IMF projects it will stay around 10 percent of GDP in the future. However, a recent tax reform proposed by the Government, including the reduction of social security contributions by more than half (by abolishing workers’ contributions and reducing employers’ contributions to 22 percent) would signifi cantly affect the future Government revenue.3
The total Government expenditure was reduced from over 49 percent to 45 percent of GDP in 2014 and 2015. However, the IMF forecasts the total expenditure will further decrease to about 42 percent of GDP by 2020. Expenditure on social benefi ts (including tax-fi nanced benefi ts, pensions and other social insurance benefi ts) was reduced from 22–23 percent of GDP in 2012–13 to 18.5 percent in 2015, and is projected to be further reduced to less than 18 percent of GDP. These reductions affected primarily pensions, with expenditure decreasing from 17 percent to 13 percent of GDP in 2015. This is projected to decrease to less than 13 percent by 2020. Spending on other social insurance benefi ts was reduced from 2 percent of GDP to 1.3 percent of GDP in 2015, and is expected to be further reduced to 1 percent of GDP by 2020. Spending on social benefi ts funded directly from the Government budget increased slightly, up to 4 percent of GDP in 2015, and is projected to increase to 4.7 percent of GDP during 2016–17. These benefi ts include
3. For arguments in favour of a smaller and gradual reduction of the unifi ed social security contribution rate compared to the Government proposals, see IMF (2016).
7
CHAP TER 1 • ECONOMIC AND FISC AL CONTEX T
compensation for the increase in energy costs, as well as the costs of expanded social assistance. Expenditure on the wages of Government employees also declined from more than 11 percent of GDP to 9 percent in 2015, and is expected to fall to about 8 percent of GDP by 2020. Expenditure on goods and services is stable at about 7 percent of GDP. Interest payments on public debt increased from less than 2 percent of GDP to above 5 percent of GDP in 2015, and are expected to stay above 4 percent of GDP until 2020.
Figure 7. Government revenue, 2010–2020
% o
f GDP
5
0
10
15
20
25
30
35
40
45
50
2010 2011 2012 2013 2014 2015 2016 2017 2018 2019 2020
Social security contribu� ons Taxes on income and profi ts Taxes on goods and services Other revenue
Source: IMF staff reports.
Figure 8. Government expenditure, 2010–2020
Social benefi ts Compensa� on of employees Goods and services Interest Other expenditure
% o
f GDP
2010 2011 2012 2013 2014 2015 2016 2017 2018 2019 20200
5
10
15
20
25
30
35
40
45
50
Source: IMF staff reports.

9
CHAP TER 2 • RECENT CHANGES IN THE UKR AINIAN SOCIAL SECURIT Y SYSTEM
Recent changes in the Ukrainian social security system
The current economic and fi scal situation in Ukraine has not only affected the well-being of citizens, but has placed pressure on the Government to reform the social security system as part of its austerity measures. The changes have involved modifying the organization of the social insurance funds, and changing the benefi t entitlements and fi nancing structure of the social security system. This chapter presents the developments of the Ukrainian social security system from 2014 to 2015 with respect to the implemented changes and the evolution of key indicators for each type of benefi t.4
In Ukraine, the right to social security is established by the Constitution of 1996, as well as specifi c laws on social security benefi ts. In 2015, the Ukrainian Government initiated the process for ratifying the ILO Social Security (Minimum Standards) Convention, 1952 (No. 102), which was concluded on 16 March 2016, and initiated the process for signing the European Code of Social Security. Analyses conducted by the Government and ILO experts in 2015 confi rmed that the Ukrainian social security legislation complies with both Convention No. 102 and with the European Code of Social Security.
The Ukrainian social security system comprises contributory social insurance and non-contributory social benefi ts of a universal or categorical nature. At the same time, targeted social assistance programmes have recently been expanding. The system also provides benefi ts in kind, which secure access to services or goods at subsidised prices.
Although the legal coverage of the Ukrainian social security system is almost universal, the effective coverage is lower due to the prevalence of the informal employment and undeclared work. For example, there are cases where contractual wage is set at the minimum level while the rest of salary is paid informally in cash. Similarly, while everyone has access to free public health care services, the signifi cant levels of out-of-pocket payments estimated at over 40 percent suggest restrictions in the actual access to health care services.
2.1. The social security expenditureIn 2015, the State Statistics Service of Ukraine published estimates of the National Health Accounts and the National Social Protection Accounts, the latter following the methodology of ESSPROS (European Integrated System of Social Protection Statistics) developed by EUROSTAT.5 Although there are still some problems in estimating the full range of revenue and expenditure,6 these data allow us to
2.
4. For a description and analysis of the Ukrainian social security system before 2012, see Baranova and Hirose (2010) and ILO (2012).
5. See the statistical reports and collections of the State Statistics Service of Ukraine, cited in the References.
6. In the published estimates, an important funding gap of the Pension Fund is not allocated to any funding source. Expenditure on survivors’ and disability pensions paid by Pension Fund is allocated together with the old-age pensions under the old-age function. There is also an important difference between the public health expenditure estimated in the ESSPROS-type accounts and that in the National Health Accounts.
10
SOCIAL SECURIT Y SYSTEM OF UKR AINE IN 2014�15 AND BE YOND
better assess the functional and fi nancial structure of the Ukrainian social security system and to make international comparisons.
According to this methodology, the total social security expenditure of Ukraine in 2013 was estimated at 24.6 percent of GDP (24.2 percent for benefi ts and 0.4 percent for administrative and other expenditure). Of the social security benefi ts, 76 percent were paid by social insurance funds, and 3 percent were means-tested. According to the ESSPROS estimate, public health expenditure was 3.5 percent of GDP (the National Health Accounts estimates it at 4.3 percent of GDP). Non-health social security benefi t expenditures were 20.7 percent of GDP, and a large majority of these (97.5 percent) were cash benefi ts.7
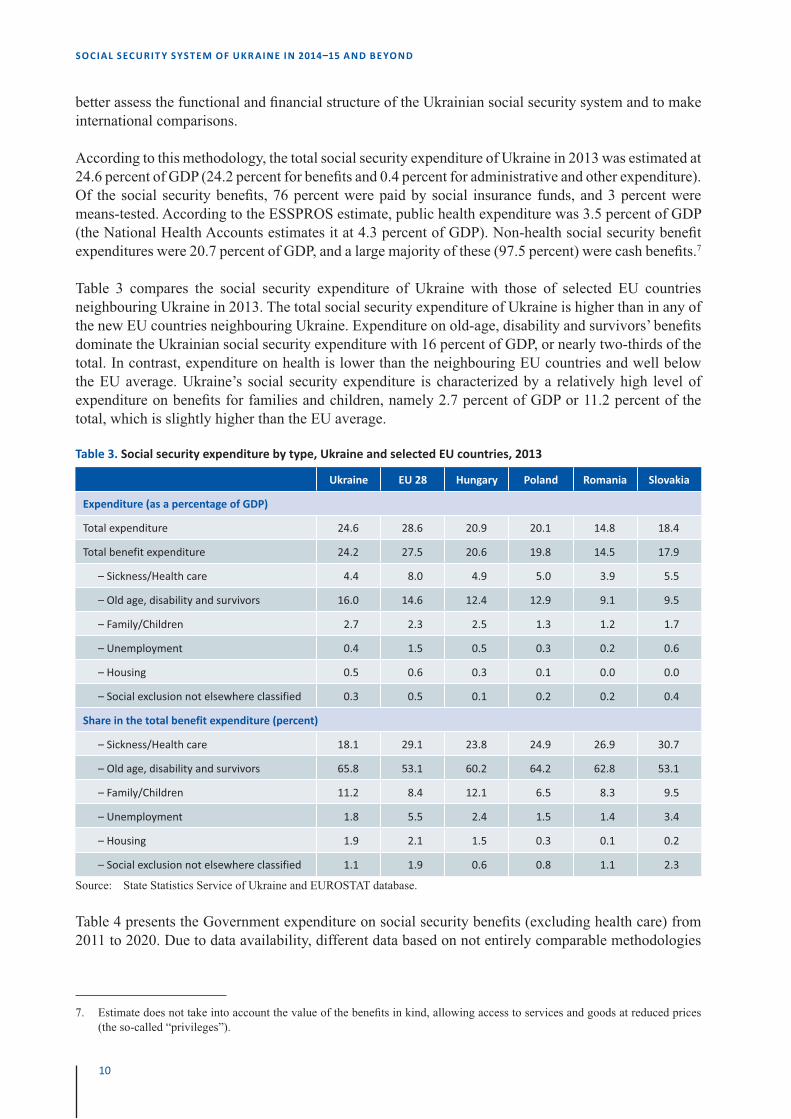
Table 3 compares the social security expenditure of Ukraine with those of selected EU countries neighbouring Ukraine in 2013. The total social security expenditure of Ukraine is higher than in any of the new EU countries neighbouring Ukraine. Expenditure on old-age, disability and survivors’ benefi ts dominate the Ukrainian social security expenditure with 16 percent of GDP, or nearly two-thirds of the total. In contrast, expenditure on health is lower than the neighbouring EU countries and well below the EU average. Ukraine’s social security expenditure is characterized by a relatively high level of expenditure on benefi ts for families and children, namely 2.7 percent of GDP or 11.2 percent of the total, which is slightly higher than the EU average.
Table 3. Social security expenditure by type, Ukraine and selected EU countries, 2013
Ukraine EU 28 Hungary Poland Romania Slovakia
Expenditure (as a percentage of GDP)
Total expenditure 24.6 28.6 20.9 20.1 14.8 18.4
Total benefit expenditure 24.2 27.5 20.6 19.8 14.5 17.9
– Sickness/Health care 4.4 8.0 4.9 5.0 3.9 5.5
– Old age, disability and survivors 16.0 14.6 12.4 12.9 9.1 9.5
– Family/Children 2.7 2.3 2.5 1.3 1.2 1.7
– Unemployment 0.4 1.5 0.5 0.3 0.2 0.6
– Housing 0.5 0.6 0.3 0.1 0.0 0.0
– Social exclusion not elsewhere classified 0.3 0.5 0.1 0.2 0.2 0.4
Share in the total benefit expenditure (percent)
– Sickness/Health care 18.1 29.1 23.8 24.9 26.9 30.7
– Old age, disability and survivors 65.8 53.1 60.2 64.2 62.8 53.1
– Family/Children 11.2 8.4 12.1 6.5 8.3 9.5
– Unemployment 1.8 5.5 2.4 1.5 1.4 3.4
– Housing 1.9 2.1 1.5 0.3 0.1 0.2
– Social exclusion not elsewhere classified 1.1 1.9 0.6 0.8 1.1 2.3
Source: State Statistics Service of Ukraine and EUROSTAT database.
Table 4 presents the Government expenditure on social security benefi ts (excluding health care) from 2011 to 2020. Due to data availability, different data based on not entirely comparable methodologies
7. Estimate does not take into account the value of the benefi ts in kind, allowing access to services and goods at reduced prices (the so-called “privileges”).
11
CHAP TER 2 • RECENT CHANGES IN THE UKR AINIAN SOCIAL SECURIT Y SYSTEM
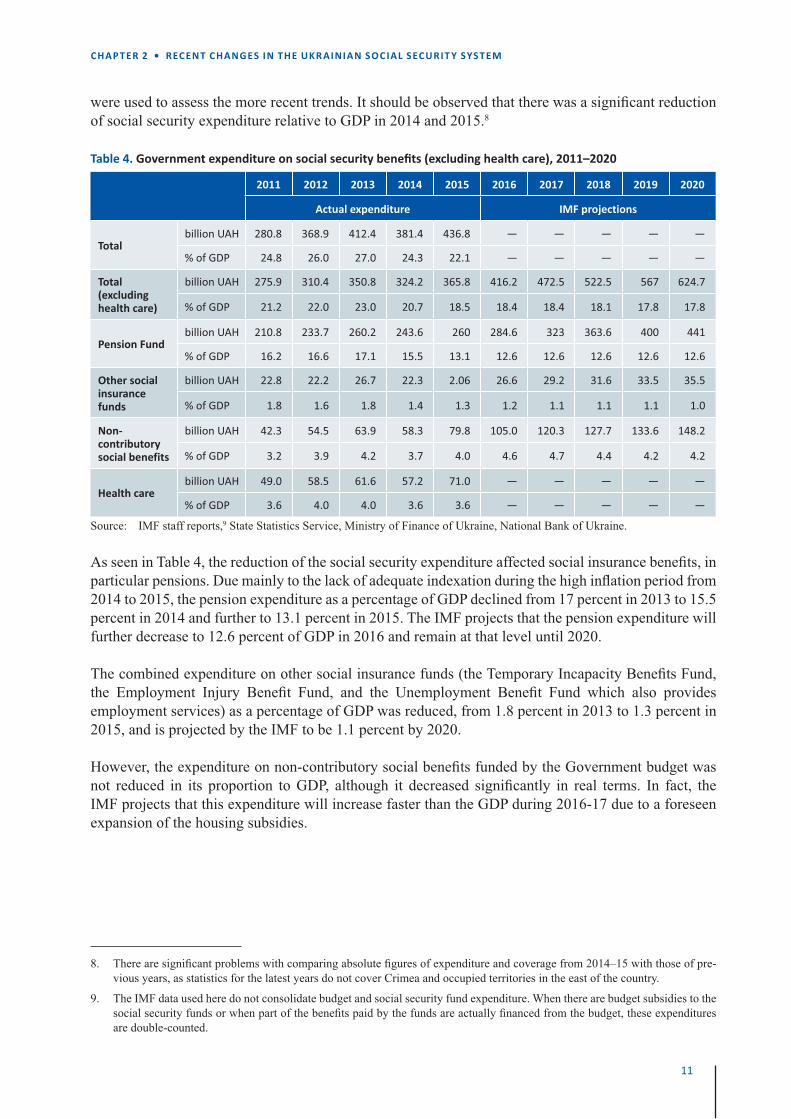
were used to assess the more recent trends. It should be observed that there was a signifi cant reduction of social security expenditure relative to GDP in 2014 and 2015.8
Table 4. Government expenditure on social security benefi ts (excluding health care), 2011–2020
2011 2012 2013 2014 2015 2016 2017 2018 2019 2020
Actual expenditure IMF projections
Totalbillion UAH 280.8 368.9 412.4 381.4 436.8 — — — — —
% of GDP 24.8 26.0 27.0 24.3 22.1 — — — — —
Total (excluding health care)
billion UAH 275.9 310.4 350.8 324.2 365.8 416.2 472.5 522.5 567 624.7
% of GDP 21.2 22.0 23.0 20.7 18.5 18.4 18.4 18.1 17.8 17.8
Pension Fundbillion UAH 210.8 233.7 260.2 243.6 260 284.6 323 363.6 400 441
% of GDP 16.2 16.6 17.1 15.5 13.1 12.6 12.6 12.6 12.6 12.6
Other social insurance funds
billion UAH 22.8 22.2 26.7 22.3 2.06 26.6 29.2 31.6 33.5 35.5
% of GDP 1.8 1.6 1.8 1.4 1.3 1.2 1.1 1.1 1.1 1.0
Non-contributory social benefits
billion UAH 42.3 54.5 63.9 58.3 79.8 105.0 120.3 127.7 133.6 148.2
% of GDP 3.2 3.9 4.2 3.7 4.0 4.6 4.7 4.4 4.2 4.2
Health carebillion UAH 49.0 58.5 61.6 57.2 71.0 — — — — —
% of GDP 3.6 4.0 4.0 3.6 3.6 — — — — —
Source: IMF staff reports,9 State Statistics Service, Ministry of Finance of Ukraine, National Bank of Ukraine. As seen in Table 4, the reduction of the social security expenditure affected social insurance benefi ts, in particular pensions. Due mainly to the lack of adequate indexation during the high infl ation period from 2014 to 2015, the pension expenditure as a percentage of GDP declined from 17 percent in 2013 to 15.5 percent in 2014 and further to 13.1 percent in 2015. The IMF projects that the pension expenditure will further decrease to 12.6 percent of GDP in 2016 and remain at that level until 2020.
The combined expenditure on other social insurance funds (the Temporary Incapacity Benefi ts Fund, the Employment Injury Benefi t Fund, and the Unemployment Benefi t Fund which also provides employment services) as a percentage of GDP was reduced, from 1.8 percent in 2013 to 1.3 percent in 2015, and is projected by the IMF to be 1.1 percent by 2020.
However, the expenditure on non-contributory social benefi ts funded by the Government budget was not reduced in its proportion to GDP, although it decreased signifi cantly in real terms. In fact, the IMF projects that this expenditure will increase faster than the GDP during 2016-17 due to a foreseen expansion of the housing subsidies.
8. There are signifi cant problems with comparing absolute fi gures of expenditure and coverage from 2014–15 with those of pre-vious years, as statistics for the latest years do not cover Crimea and occupied territories in the east of the country.
9. The IMF data used here do not consolidate budget and social security fund expenditure. When there are budget subsidies to the social security funds or when part of the benefi ts paid by the funds are actually fi nanced from the budget, these expenditures are double-counted.
12
SOCIAL SECURIT Y SYSTEM OF UKR AINE IN 2014�15 AND BE YOND
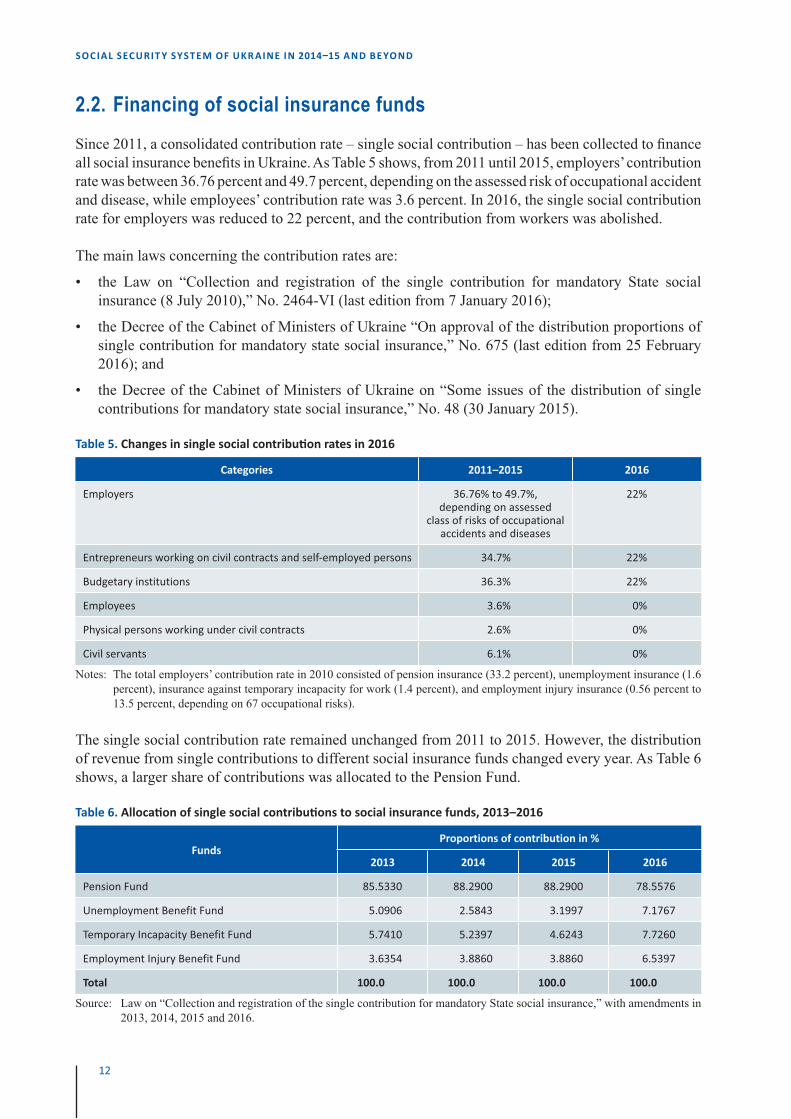
2.2. Financing of social insurance fundsSince 2011, a consolidated contribution rate – single social contribution – has been collected to fi nance all social insurance benefi ts in Ukraine. As Table 5 shows, from 2011 until 2015, employers’ contribution rate was between 36.76 percent and 49.7 percent, depending on the assessed risk of occupational accident and disease, while employees’ contribution rate was 3.6 percent. In 2016, the single social contribution rate for employers was reduced to 22 percent, and the contribution from workers was abolished.
The main laws concerning the contribution rates are:
• the Law on “Collection and registration of the single contribution for mandatory State social insurance (8 July 2010),” No. 2464-VI (last edition from 7 January 2016);
• the Decree of the Cabinet of Ministers of Ukraine “On approval of the distribution proportions of single contribution for mandatory state social insurance,” No. 675 (last edition from 25 February 2016); and
• the Decree of the Cabinet of Ministers of Ukraine on “Some issues of the distribution of single contributions for mandatory state social insurance,” No. 48 (30 January 2015).
Table 5. Changes in single social contribu� on rates in 2016
Categories 2011–2015 2016
Employers 36.76% to 49.7%, depending on assessed
class of risks of occupational accidents and diseases
22%
Entrepreneurs working on civil contracts and self-employed persons 34.7% 22%
Budgetary institutions 36.3% 22%
Employees 3.6% 0%
Physical persons working under civil contracts 2.6% 0%
Civil servants 6.1% 0%
Notes: The total employers’ contribution rate in 2010 consisted of pension insurance (33.2 percent), unemployment insurance (1.6 percent), insurance against temporary incapacity for work (1.4 percent), and employment injury insurance (0.56 percent to 13.5 percent, depending on 67 occupational risks).
The single social contribution rate remained unchanged from 2011 to 2015. However, the distribution of revenue from single contributions to different social insurance funds changed every year. As Table 6 shows, a larger share of contributions was allocated to the Pension Fund.
Table 6. Alloca� on of single social contribu� ons to social insurance funds, 2013–2016
FundsProportions of contribution in %
2013 2014 2015 2016
Pension Fund 85.5330 88.2900 88.2900 78.5576
Unemployment Benefit Fund 5.0906 2.5843 3.1997 7.1767
Temporary Incapacity Benefit Fund 5.7410 5.2397 4.6243 7.7260
Employment Injury Benefit Fund 3.6354 3.8860 3.8860 6.5397
Total 100.0 100.0 100.0 100.0
Source: Law on “Collection and registration of the single contribution for mandatory State social insurance,” with amendments in 2013, 2014, 2015 and 2016.
13
CHAP TER 2 • RECENT CHANGES IN THE UKR AINIAN SOCIAL SECURIT Y SYSTEM
At the beginning of 2015, motivated by fi scal diffi culties and hoping to reduce the informal employment and the evasion of social security contributions, the Ukrainian Government announced the possibility that employers’ single social contributions would be reduced by up to 40 percent if the following three conditions are met:
• there is a 20 percent increase in the contributory wages per worker compared to 2014;
• the overall level of contributions paid is at least maintained compared to 2014 levels; and
• the number of employees does not exceed 200 percent of the 2014 levels.
These requirements aimed to secure an aggregate amount of contribution revenue through extending the tax base without lowering the net salaries of workers. The Government planned to expand this reduction by up to 60 percent.
However, at the end of 2015, an even more drastic change was approved by the Verkhovna Rada. Starting in 2016, the rate of the single social contribution was lowered to the uniform rate of 22 percent, without reference to occupational risks. The same rate applies to self-employed persons and individual entrepreneurs. The allocation of revenue from single contributions to the Pension Fund was reduced drastically, from 88 percent to 79 percent, while the allocation for each of the other three funds increased.
At the same time, the maximum (ceiling) of the contributory salary was raised from 17 times to 25 times the subsistence minimum for able-bodied persons. Employees’ contributions (as well as contributions by those employed under civil law contracts) were abolished. One can expect that the employees’ contributions will be re-introduced if and when the mandatory funded pensions are introduced.
The reduction in the single social security contribution rate was complemented by a reform of the personal income tax. The progressive income tax, with two rates (15 percent and 20 percent), was replaced by a uniform tax rate of 18 percent. The special tax for military purposes (1.5 percent) was maintained. Although pensions were not taxed before 2014, a 15 percent tax rate was applied in 2015 for pensions between three and ten times the minimum wage (the threshold was increased to ten times the minimum wage in 2016).
Preliminary evidence based on the State Fiscal Service data10 indicates that the single social contribution revenues in January and February 2016 dropped by 23.3 percent (6 billion UAH) compared to the same period in 2015. These revenues were 3.8 percent higher than the value estimated by the Government.
This evidence challenges the underlying assumption that reducing the contribution rate can create positive fi scal effects through the formalization of employment and undeclared work. As mentioned above, the allocation of single social contributions to the Pension Fund has signifi cantly decreased. Therefore, the State budget will need to cover the emerging fi nancial gaps, which will result in pressure to cut benefi ts further. Depending on the magnitude of the defi cit, the reduction of the expenditure of the social insurance funds foreseen by the IMF may be even deeper in the future.
10. State Fiscal Service of Ukraine (2016).
14
SOCIAL SECURIT Y SYSTEM OF UKR AINE IN 2014�15 AND BE YOND
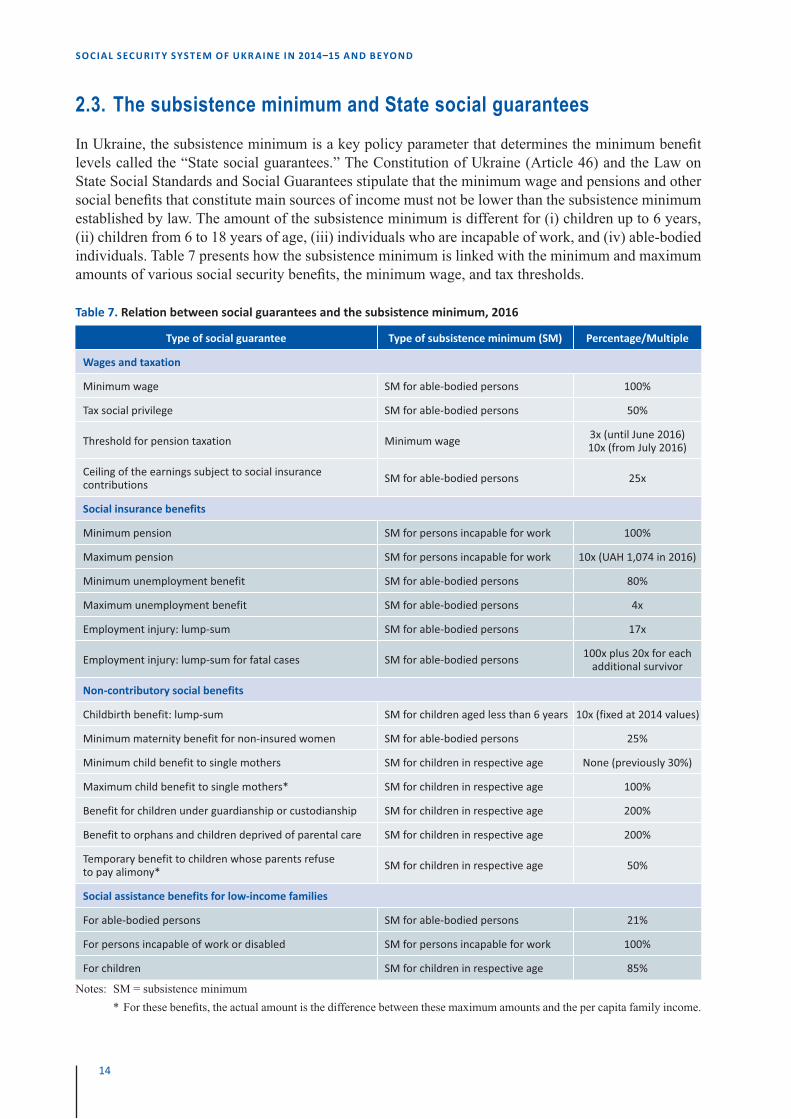
2.3. The subsistence minimum and State social guaranteesIn Ukraine, the subsistence minimum is a key policy parameter that determines the minimum benefi t levels called the “State social guarantees.” The Constitution of Ukraine (Article 46) and the Law on State Social Standards and Social Guarantees stipulate that the minimum wage and pensions and other social benefi ts that constitute main sources of income must not be lower than the subsistence minimum established by law. The amount of the subsistence minimum is different for (i) children up to 6 years, (ii) children from 6 to 18 years of age, (iii) individuals who are incapable of work, and (iv) able-bodied individuals. Table 7 presents how the subsistence minimum is linked with the minimum and maximum amounts of various social security benefi ts, the minimum wage, and tax thresholds.
Table 7. Rela� on between social guarantees and the subsistence minimum, 2016
Type of social guarantee Type of subsistence minimum (SM) Percentage/Multiple
Wages and taxation
Minimum wage SM for able-bodied persons 100%
Tax social privilege SM for able-bodied persons 50%
Threshold for pension taxation Minimum wage 3x (until June 2016)10x (from July 2016)
Ceiling of the earnings subject to social insurance contributions SM for able-bodied persons 25x
Social insurance benefits
Minimum pension SM for persons incapable for work 100%
Maximum pension SM for persons incapable for work 10x (UAH 1,074 in 2016)
Minimum unemployment benefit SM for able-bodied persons 80%
Maximum unemployment benefit SM for able-bodied persons 4x
Employment injury: lump-sum SM for able-bodied persons 17x
Employment injury: lump-sum for fatal cases SM for able-bodied persons 100x plus 20x for each additional survivor
Non-contributory social benefits
Childbirth benefit: lump-sum SM for children aged less than 6 years 10x (fixed at 2014 values)
Minimum maternity benefit for non-insured women SM for able-bodied persons 25%
Minimum child benefit to single mothers SM for children in respective age None (previously 30%)
Maximum child benefit to single mothers* SM for children in respective age 100%
Benefit for children under guardianship or custodianship SM for children in respective age 200%
Benefit to orphans and children deprived of parental care SM for children in respective age 200%
Temporary benefit to children whose parents refuse to pay alimony* SM for children in respective age 50%
Social assistance benefits for low-income families
For able-bodied persons SM for able-bodied persons 21%
For persons incapable of work or disabled SM for persons incapable for work 100%
For children SM for children in respective age 85%
Notes: SM = subsistence minimum * For these benefi ts, the actual amount is the difference between these maximum amounts and the per capita family income.
15
CHAP TER 2 • RECENT CHANGES IN THE UKR AINIAN SOCIAL SECURIT Y SYSTEM
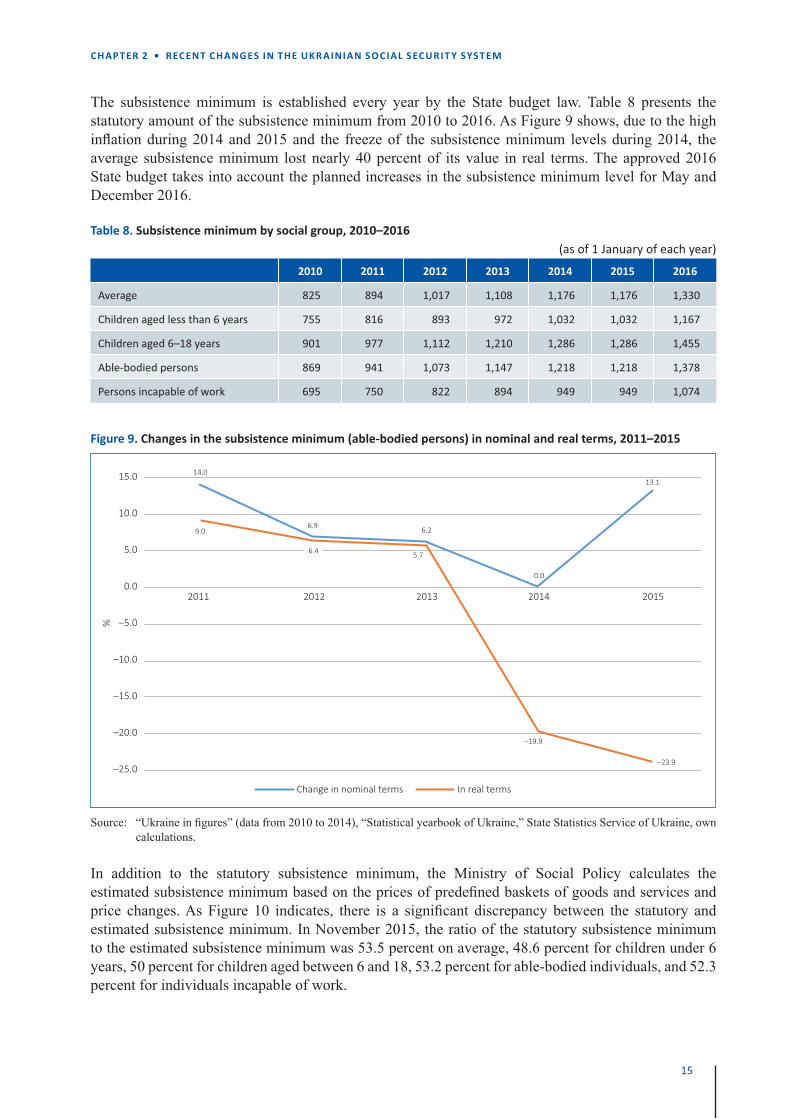
The subsistence minimum is established every year by the State budget law. Table 8 presents the statutory amount of the subsistence minimum from 2010 to 2016. As Figure 9 shows, due to the high infl ation during 2014 and 2015 and the freeze of the subsistence minimum levels during 2014, the average subsistence minimum lost nearly 40 percent of its value in real terms. The approved 2016 State budget takes into account the planned increases in the subsistence minimum level for May and December 2016.
Table 8. Subsistence minimum by social group, 2010–2016 (as of 1 January of each year)
2010 2011 2012 2013 2014 2015 2016
Average 825 894 1,017 1,108 1,176 1,176 1,330
Children aged less than 6 years 755 816 893 972 1,032 1,032 1,167
Children aged 6–18 years 901 977 1,112 1,210 1,286 1,286 1,455
Able-bodied persons 869 941 1,073 1,147 1,218 1,218 1,378
Persons incapable of work 695 750 822 894 949 949 1,074
Figure 9. Changes in the subsistence minimum (able-bodied persons) in nominal and real terms, 2011–2015
2011 2012 2013 2014 2015
15.0
10.0
5.0
0.0
–5.0
–10.0
–15.0
–20.0
–25.0
Change in nominal terms In real terms
%
9.0
14.0
6.9
5.7
6.2
13.1
0.0
–23.9
–19.9
6.4
Source: “Ukraine in fi gures” (data from 2010 to 2014), “Statistical yearbook of Ukraine,” State Statistics Service of Ukraine, own calculations.
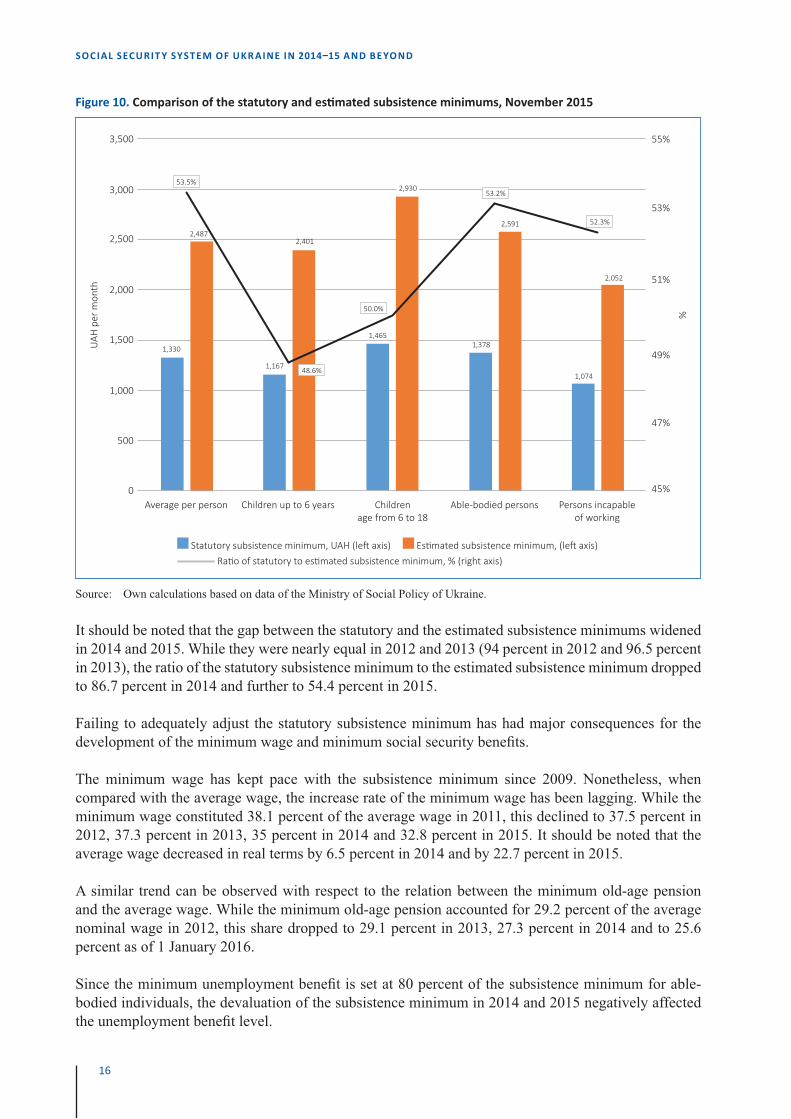
In addition to the statutory subsistence minimum, the Ministry of Social Policy calculates the estimated subsistence minimum based on the prices of predefi ned baskets of goods and services and price changes. As Figure 10 indicates, there is a signifi cant discrepancy between the statutory and estimated subsistence minimum. In November 2015, the ratio of the statutory subsistence minimum to the estimated subsistence minimum was 53.5 percent on average, 48.6 percent for children under 6 years, 50 percent for children aged between 6 and 18, 53.2 percent for able-bodied individuals, and 52.3 percent for individuals incapable of work.
16
SOCIAL SECURIT Y SYSTEM OF UKR AINE IN 2014�15 AND BE YOND
Figure 10. Comparison of the statutory and es� mated subsistence minimums, November 2015
3,500
3,000
2,500
2,000
1,500
1,000
500
0
UAH
per
mon
th%
55%
53%
51%
49%
47%
45%Average per person Children up to 6 years Children
age from 6 to 18Able-bodied persons Persons incapable
of working
Statutory subsistence minimum, UAH (le� axis) Es� mated subsistence minimum, (le� axis) Ra� o of statutory to es� mated subsistence minimum, % (right axis)
1,330
1,167
1,4651,378
1,074
2,4872,401
2,930
2,591
2,052
53.5%
50.0%
53.2%
52.3%
48.6%
Source: Own calculations based on data of the Ministry of Social Policy of Ukraine.
It should be noted that the gap between the statutory and the estimated subsistence minimums widened in 2014 and 2015. While they were nearly equal in 2012 and 2013 (94 percent in 2012 and 96.5 percent in 2013), the ratio of the statutory subsistence minimum to the estimated subsistence minimum dropped to 86.7 percent in 2014 and further to 54.4 percent in 2015.
Failing to adequately adjust the statutory subsistence minimum has had major consequences for the development of the minimum wage and minimum social security benefi ts.
The minimum wage has kept pace with the subsistence minimum since 2009. Nonetheless, when compared with the average wage, the increase rate of the minimum wage has been lagging. While the minimum wage constituted 38.1 percent of the average wage in 2011, this declined to 37.5 percent in 2012, 37.3 percent in 2013, 35 percent in 2014 and 32.8 percent in 2015. It should be noted that the average wage decreased in real terms by 6.5 percent in 2014 and by 22.7 percent in 2015.
A similar trend can be observed with respect to the relation between the minimum old-age pension and the average wage. While the minimum old-age pension accounted for 29.2 percent of the average nominal wage in 2012, this share dropped to 29.1 percent in 2013, 27.3 percent in 2014 and to 25.6 percent as of 1 January 2016.
Since the minimum unemployment benefi t is set at 80 percent of the subsistence minimum for able-bodied individuals, the devaluation of the subsistence minimum in 2014 and 2015 negatively affected the unemployment benefi t level.
17
CHAP TER 2 • RECENT CHANGES IN THE UKR AINIAN SOCIAL SECURIT Y SYSTEM
2.4. Organizational changes in social insurance fundsBetween 2014 and 2015, there were debates on how to restructure the social security organizations. The debates focused on the merger of the existing social insurance funds to reduce administrative costs and enhance coordination in expenditure planning. Debates also related to the removal of various auxiliary benefi ts, which were not considered as social insurance benefi ts covered by contributions.
Since the passage of the Law on “Amendments to some legislative acts of Ukraine on the reform of mandatory social insurance and legalization of payroll (No. 77-VIII of 28 December 2014),” which came into force on 1 January 2015, the Temporary Incapacity Benefi ts Fund and the Employment Injury Benefi t Fund have been merged into a single fund, named the Social Insurance Fund of Ukraine. Some argue that this merger can bring about savings of 300 to 500 million UAH yearly.
In May 2015, the Cabinet of Ministers developed a draft Law on “Amendments to the Law on Mandatory State Social Insurance (No. 2775 of 5 June 2015),” to ensure the activity of the new fund during the reorganization. However, as of the beginning of 2016, the merger had not yet been completed, and all operations of the newly-created fund were performed by the older separate funds.
According to the aforementioned Law, the new Social Insurance Fund has a tripartite governance structure. Representatives of the State, workers, and employers are members of the Board of the Fund. The State representatives are nominated by the Cabinet of Ministers, and the workers’ and employers’ representatives are nominated by their respective national confederations. One important change in the governance of the Fund concerns the budget approval process. While previously the budgets were approved through the autonomous decision of the Board, all changes with respect to expenditure now require the approval of the Cabinet of Ministers as well. The social partners believe this will weaken the autonomy of the Fund.
In addition to these organizational changes, some of the Fund’s expenditure items have been removed so that only the benefi ts funded by dedicated contributions are kept within its scope. Consequently, the Fund is no longer responsible for fi nancing sport schools, New Year’s gifts for children, preventive sanatorium treatment or health facilities for children.
2.5. Changes in the pension systemThe Ukrainian pension system has undergone signifi cant changes in the recent years. The fi rst wave of major reforms started in 2011 when a decision was taken to increase the retirement age for women from 55 to 60 years, in six-month increments from 2011 to 2021. The retirement age of male civil servants, diplomats and scientists also increased from 60 to 62 years, in six-month increments from 2013 to 2017. The reform increased the number of contribution years required for the minimum pension, from 20 to 30 years for women and from 25 to 35 years for men. Moreover, a maximum pension worth ten times the minimum pension was introduced for newly-granted pensions. Since 1 January 2012, the period for calculating the reference salary for pensions was extended from one year preceding the retirement to three years. Finally, for women the age limit of social assistance for those who are not entitled to a contributory pension was increased from 58 years to 63 years.
The reform measures implemented in 2014 and 2015 continued the reduction of favourable provisions for special groups, so that their benefi ts would be in line with those of the regular worker (whose average replacement rate is approximately 45–50 percent of their previous earnings).
18
SOCIAL SECURIT Y SYSTEM OF UKR AINE IN 2014�15 AND BE YOND
First, for the so-called “special groups” (including judges, prosecutors, deputies of Verkhovna Rada and civil servants), the level of newly-awarded pensions was reduced to 60 percent of the average salary. Before this change, the pension levels for these groups were 80 percent of the previous salaries for prosecutors, civil servants and deputies. These groups were also awarded 1 percent increments per year in excess of the required contribution period but the resulting pension should not be higher than 90 percent of their previous salary.
Second, for women working in “preferential (or privileged) conditions” (employees under hazardous and strenuous working conditions), their retirement age was increased in April 2015 from 45 years to 50 years. Their qualifying contribution period was kept at 7 years and 6 months.
Third, the possibility of combining work and old-age pension benefi ts was suspended between April and December 2015 for the aforementioned categories of workers. When they ceased working, their pensions were reinstated. Since 2016, combining work and receiving a pension is allowed without preferential treatment. As before, the termination of employment results in the reinstatement of a preferential pension. Furthermore, if a person receiving a special pension works in a different workplace (without preferential conditions), 15 percent of their calculated pension is suspended.
Fourth, the reduction of pension benefi t was introduced for all the other groups of working pensioners who receive pensions higher than 150 percent of the subsistence minimum for pensioners. In this case, their pension is reduced by 15 percent. However, the reduced pension cannot be less than the threshold of 150 percent of the subsistence minimum.11 Exempt groups include disabled individuals (degrees I and II), participants of military operations and their families, anti-terrorist operation participants, and other individuals and civil servants involved in those operations.
Finally, pensions above certain thresholds were taxed starting in 2015. Income from old-age pensions between three and ten times the minimum wage were subject to a 15 percent personal income tax and a 1.5 percent military duties tax. On the other hand, a uniform 18 percent personal income tax rate is applied to earnings from employment. In July 2016, the minimum threshold for the pension taxation was increased to ten times the minimum wage.
The Government’s plans of further pension reform were summarized in the Memorandum of Economic and Financial Policies, presented to the IMF in July 2015 (see Box 1).12
11. This means that the reduction affects pensions higher than 176.5 percent of the subsistence minimum.
12. See the Memorandum of economic and fi nancial policies, attached to Ukraine’s Letter of Intent to IMF’s Managing Director Christine Lagarde, 21 July 2015 (attached to IMF Staff Report of August 2015).
19
CHAP TER 2 • RECENT CHANGES IN THE UKR AINIAN SOCIAL SECURIT Y SYSTEM
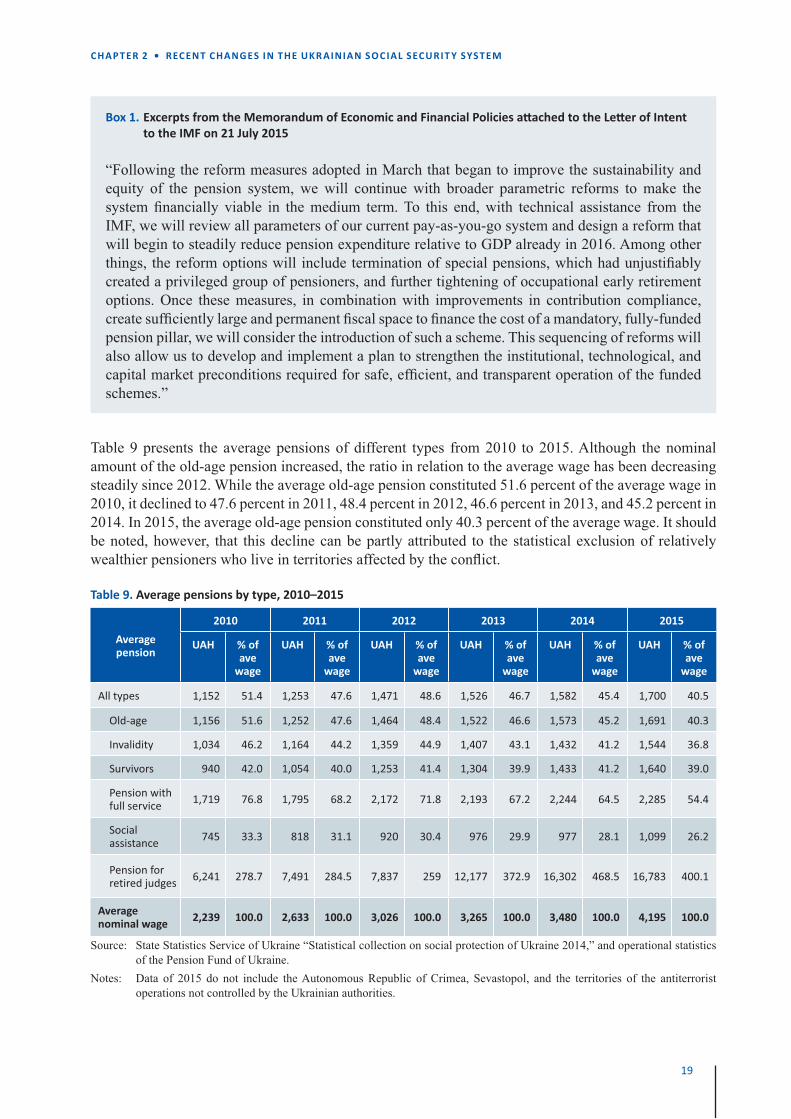
Box 1. Excerpts from the Memorandum of Economic and Financial Policies a� ached to the Le� er of Intent to the IMF on 21 July 2015
“Following the reform measures adopted in March that began to improve the sustainability and equity of the pension system, we will continue with broader parametric reforms to make the system fi nancially viable in the medium term. To this end, with technical assistance from the IMF, we will review all parameters of our current pay-as-you-go system and design a reform that will begin to steadily reduce pension expenditure relative to GDP already in 2016. Among other things, the reform options will include termination of special pensions, which had unjustifi ably created a privileged group of pensioners, and further tightening of occupational early retirement options. Once these measures, in combination with improvements in contribution compliance, create suffi ciently large and permanent fi scal space to fi nance the cost of a mandatory, fully-funded pension pillar, we will consider the introduction of such a scheme. This sequencing of reforms will also allow us to develop and implement a plan to strengthen the institutional, technological, and capital market preconditions required for safe, effi cient, and transparent operation of the funded schemes.”
Table 9 presents the average pensions of different types from 2010 to 2015. Although the nominal amount of the old-age pension increased, the ratio in relation to the average wage has been decreasing steadily since 2012. While the average old-age pension constituted 51.6 percent of the average wage in 2010, it declined to 47.6 percent in 2011, 48.4 percent in 2012, 46.6 percent in 2013, and 45.2 percent in 2014. In 2015, the average old-age pension constituted only 40.3 percent of the average wage. It should be noted, however, that this decline can be partly attributed to the statistical exclusion of relatively wealthier pensioners who live in territories affected by the confl ict.
Table 9. Average pensions by type, 2010–2015
Average pension
2010 2011 2012 2013 2014 2015
UAH % of ave
wage
UAH % of ave
wage
UAH % of ave
wage
UAH % of ave
wage
UAH % of ave
wage
UAH % of ave
wage
All types 1,152 51.4 1,253 47.6 1,471 48.6 1,526 46.7 1,582 45.4 1,700 40.5
Old-age 1,156 51.6 1,252 47.6 1,464 48.4 1,522 46.6 1,573 45.2 1,691 40.3
Invalidity 1,034 46.2 1,164 44.2 1,359 44.9 1,407 43.1 1,432 41.2 1,544 36.8
Survivors 940 42.0 1,054 40.0 1,253 41.4 1,304 39.9 1,433 41.2 1,640 39.0
Pension with full service 1,719 76.8 1,795 68.2 2,172 71.8 2,193 67.2 2,244 64.5 2,285 54.4
Social assistance 745 33.3 818 31.1 920 30.4 976 29.9 977 28.1 1,099 26.2
Pension for retired judges 6,241 278.7 7,491 284.5 7,837 259 12,177 372.9 16,302 468.5 16,783 400.1
Average nominal wage 2,239 100.0 2,633 100.0 3,026 100.0 3,265 100.0 3,480 100.0 4,195 100.0
Source: State Statistics Service of Ukraine “Statistical collection on social protection of Ukraine 2014,” and operational statistics of the Pension Fund of Ukraine.
Notes: Data of 2015 do not include the Autonomous Republic of Crimea, Sevastopol, and the territories of the antiterrorist operations not controlled by the Ukrainian authorities.
20
SOCIAL SECURIT Y SYSTEM OF UKR AINE IN 2014�15 AND BE YOND
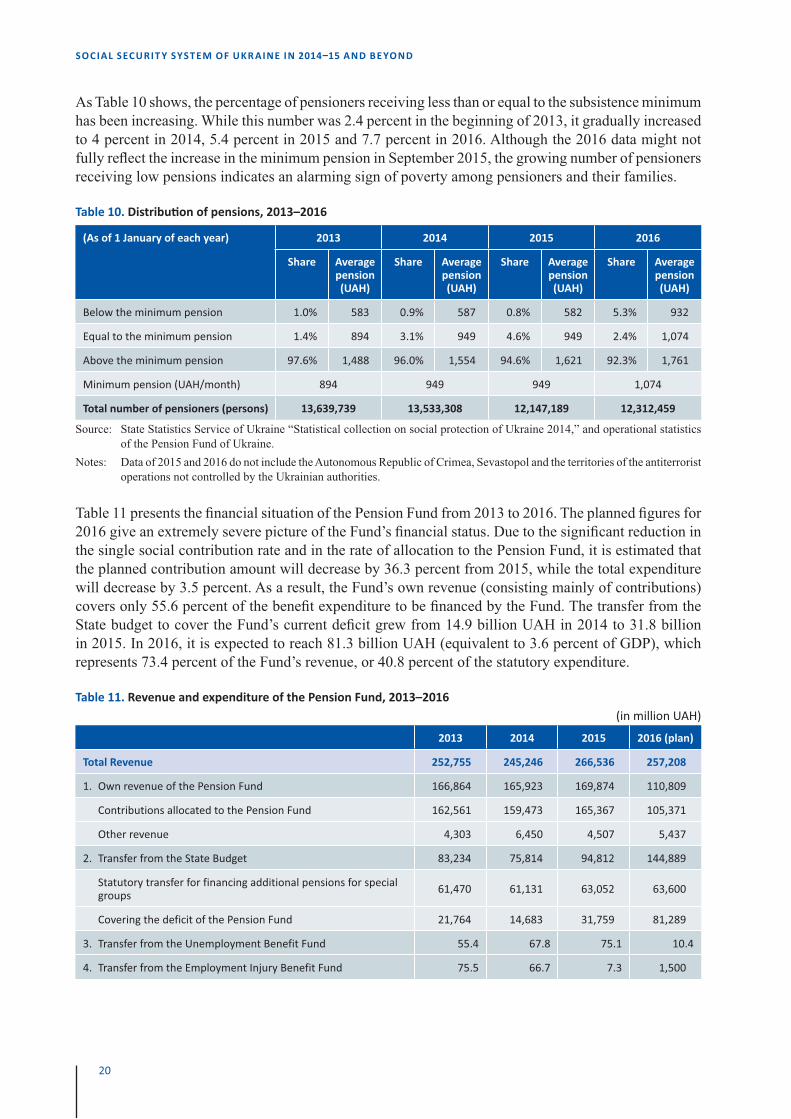
As Table 10 shows, the percentage of pensioners receiving less than or equal to the subsistence minimum has been increasing. While this number was 2.4 percent in the beginning of 2013, it gradually increased to 4 percent in 2014, 5.4 percent in 2015 and 7.7 percent in 2016. Although the 2016 data might not fully refl ect the increase in the minimum pension in September 2015, the growing number of pensioners receiving low pensions indicates an alarming sign of poverty among pensioners and their families.
Table 10. Distribu� on of pensions, 2013–2016
(As of 1 January of each year) 2013 2014 2015 2016
Share Average pension (UAH)
Share Average pension (UAH)
Share Average pension (UAH)
Share Average pension (UAH)
Below the minimum pension 1.0% 583 0.9% 587 0.8% 582 5.3% 932
Equal to the minimum pension 1.4% 894 3.1% 949 4.6% 949 2.4% 1,074
Above the minimum pension 97.6% 1,488 96.0% 1,554 94.6% 1,621 92.3% 1,761
Minimum pension (UAH/month) 894 949 949 1,074
Total number of pensioners (persons) 13,639,739 13,533,308 12,147,189 12,312,459
Source: State Statistics Service of Ukraine “Statistical collection on social protection of Ukraine 2014,” and operational statistics of the Pension Fund of Ukraine.
Notes: Data of 2015 and 2016 do not include the Autonomous Republic of Crimea, Sevastopol and the territories of the antiterrorist operations not controlled by the Ukrainian authorities.
Table 11 presents the fi nancial situation of the Pension Fund from 2013 to 2016. The planned fi gures for 2016 give an extremely severe picture of the Fund’s fi nancial status. Due to the signifi cant reduction in the single social contribution rate and in the rate of allocation to the Pension Fund, it is estimated that the planned contribution amount will decrease by 36.3 percent from 2015, while the total expenditure will decrease by 3.5 percent. As a result, the Fund’s own revenue (consisting mainly of contributions) covers only 55.6 percent of the benefi t expenditure to be fi nanced by the Fund. The transfer from the State budget to cover the Fund’s current defi cit grew from 14.9 billion UAH in 2014 to 31.8 billion in 2015. In 2016, it is expected to reach 81.3 billion UAH (equivalent to 3.6 percent of GDP), which represents 73.4 percent of the Fund’s revenue, or 40.8 percent of the statutory expenditure.
Table 11. Revenue and expenditure of the Pension Fund, 2013–2016 (in million UAH)
2013 2014 2015 2016 (plan)
Total Revenue 252,755 245,246 266,536 257,208
1. Own revenue of the Pension Fund 166,864 165,923 169,874 110,809
Contributions allocated to the Pension Fund 162,561 159,473 165,367 105,371
Other revenue 4,303 6,450 4,507 5,437
2. Transfer from the State Budget 83,234 75,814 94,812 144,889
Statutory transfer for financing additional pensions for special groups 61,470 61,131 63,052 63,600
Covering the deficit of the Pension Fund 21,764 14,683 31,759 81,289
3. Transfer from the Unemployment Benefit Fund 55.4 67.8 75.1 10.4
4. Transfer from the Employment Injury Benefit Fund 75.5 66.7 7.3 1,500
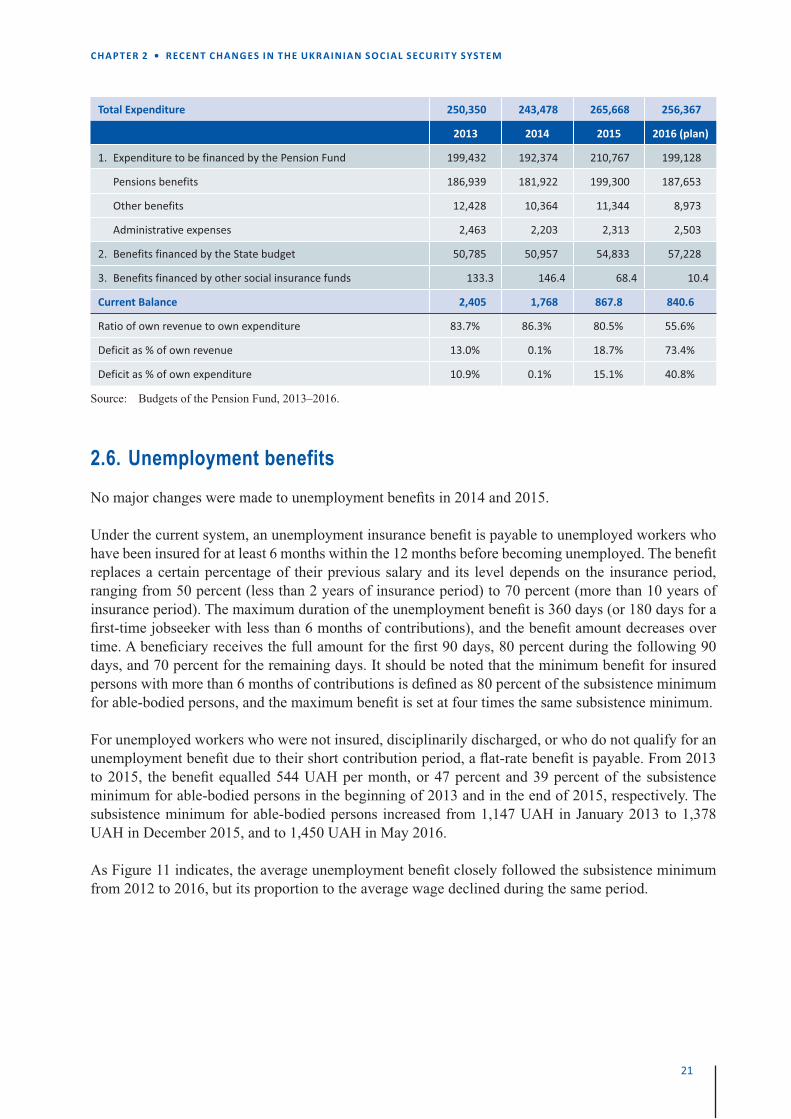
21
CHAP TER 2 • RECENT CHANGES IN THE UKR AINIAN SOCIAL SECURIT Y SYSTEM
Total Expenditure 250,350 243,478 265,668 256,367
2013 2014 2015 2016 (plan)
1. Expenditure to be financed by the Pension Fund 199,432 192,374 210,767 199,128
Pensions benefits 186,939 181,922 199,300 187,653
Other benefits 12,428 10,364 11,344 8,973
Administrative expenses 2,463 2,203 2,313 2,503
2. Benefits financed by the State budget 50,785 50,957 54,833 57,228
3. Benefits financed by other social insurance funds 133.3 146.4 68.4 10.4
Current Balance 2,405 1,768 867.8 840.6
Ratio of own revenue to own expenditure 83.7% 86.3% 80.5% 55.6%
Deficit as % of own revenue 13.0% 0.1% 18.7% 73.4%
Deficit as % of own expenditure 10.9% 0.1% 15.1% 40.8%
Source: Budgets of the Pension Fund, 2013–2016.
2.6. Unemployment benefitsNo major changes were made to unemployment benefi ts in 2014 and 2015.
Under the current system, an unemployment insurance benefi t is payable to unemployed workers who have been insured for at least 6 months within the 12 months before becoming unemployed. The benefi t replaces a certain percentage of their previous salary and its level depends on the insurance period, ranging from 50 percent (less than 2 years of insurance period) to 70 percent (more than 10 years of insurance period). The maximum duration of the unemployment benefi t is 360 days (or 180 days for a fi rst-time jobseeker with less than 6 months of contributions), and the benefi t amount decreases over time. A benefi ciary receives the full amount for the fi rst 90 days, 80 percent during the following 90 days, and 70 percent for the remaining days. It should be noted that the minimum benefi t for insured persons with more than 6 months of contributions is defi ned as 80 percent of the subsistence minimum for able-bodied persons, and the maximum benefi t is set at four times the same subsistence minimum.
For unemployed workers who were not insured, disciplinarily discharged, or who do not qualify for an unemployment benefi t due to their short contribution period, a fl at-rate benefi t is payable. From 2013 to 2015, the benefi t equalled 544 UAH per month, or 47 percent and 39 percent of the subsistence minimum for able-bodied persons in the beginning of 2013 and in the end of 2015, respectively. The subsistence minimum for able-bodied persons increased from 1,147 UAH in January 2013 to 1,378 UAH in December 2015, and to 1,450 UAH in May 2016.
As Figure 11 indicates, the average unemployment benefi t closely followed the subsistence minimum from 2012 to 2016, but its proportion to the average wage declined during the same period.
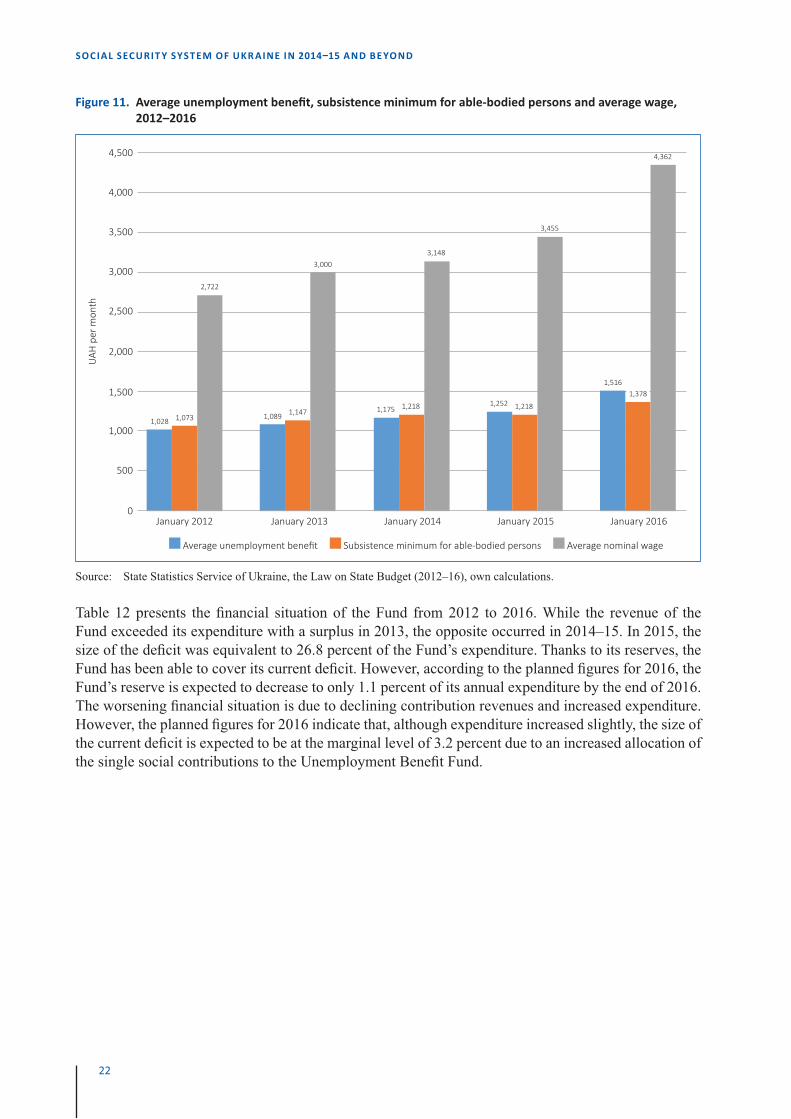
22
SOCIAL SECURIT Y SYSTEM OF UKR AINE IN 2014�15 AND BE YOND
Figure 11. Average unemployment benefi t, subsistence minimum for able-bodied persons and average wage, 2012–2016
Average unemployment benefi t Subsistence minimum for able-bodied persons Average nominal wage
3,500
4,000
4,500
3,000
2,500
2,000
1,500
1,000
500
0
UAH
per
mon
th
1,0281,089
1,1751,252
1,516
1,0731,147
1,218 1,218
1,378
2,722
3,0003,148
3,455
4,362
January 2012 January 2013 January 2014 January 2015 January 2016
Source: State Statistics Service of Ukraine, the Law on State Budget (2012–16), own calculations.
Table 12 presents the fi nancial situation of the Fund from 2012 to 2016. While the revenue of the Fund exceeded its expenditure with a surplus in 2013, the opposite occurred in 2014–15. In 2015, the size of the defi cit was equivalent to 26.8 percent of the Fund’s expenditure. Thanks to its reserves, the Fund has been able to cover its current defi cit. However, according to the planned fi gures for 2016, the Fund’s reserve is expected to decrease to only 1.1 percent of its annual expenditure by the end of 2016. The worsening fi nancial situation is due to declining contribution revenues and increased expenditure. However, the planned fi gures for 2016 indicate that, although expenditure increased slightly, the size of the current defi cit is expected to be at the marginal level of 3.2 percent due to an increased allocation of the single social contributions to the Unemployment Benefi t Fund.
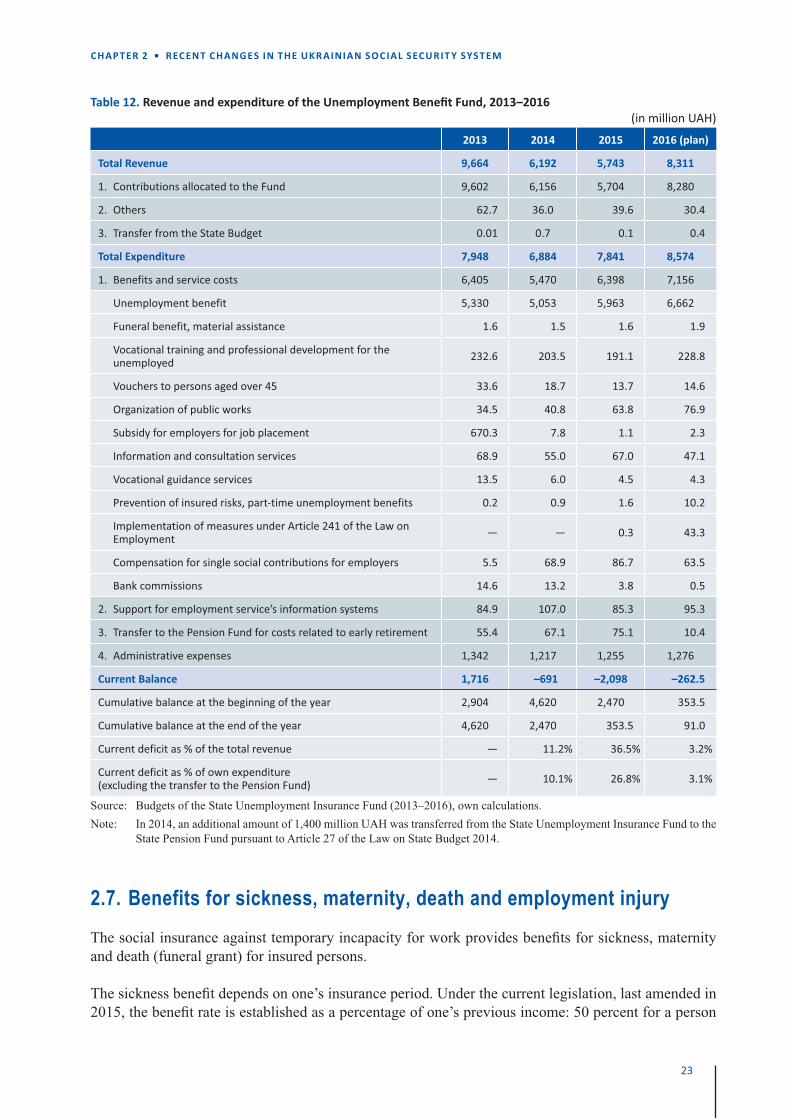
23
CHAP TER 2 • RECENT CHANGES IN THE UKR AINIAN SOCIAL SECURIT Y SYSTEM
Table 12. Revenue and expenditure of the Unemployment Benefi t Fund, 2013–2016 (in million UAH)
2013 2014 2015 2016 (plan)
Total Revenue 9,664 6,192 5,743 8,311
1. Contributions allocated to the Fund 9,602 6,156 5,704 8,280
2. Others 62.7 36.0 39.6 30.4
3. Transfer from the State Budget 0.01 0.7 0.1 0.4
Total Expenditure 7,948 6,884 7,841 8,574
1. Benefits and service costs 6,405 5,470 6,398 7,156
Unemployment benefit 5,330 5,053 5,963 6,662
Funeral benefit, material assistance 1.6 1.5 1.6 1.9
Vocational training and professional development for the unemployed 232.6 203.5 191.1 228.8
Vouchers to persons aged over 45 33.6 18.7 13.7 14.6
Organization of public works 34.5 40.8 63.8 76.9
Subsidy for employers for job placement 670.3 7.8 1.1 2.3
Information and consultation services 68.9 55.0 67.0 47.1
Vocational guidance services 13.5 6.0 4.5 4.3
Prevention of insured risks, part-time unemployment benefits 0.2 0.9 1.6 10.2
Implementation of measures under Article 241 of the Law on Employment — — 0.3 43.3
Compensation for single social contributions for employers 5.5 68.9 86.7 63.5
Bank commissions 14.6 13.2 3.8 0.5
2. Support for employment service’s information systems 84.9 107.0 85.3 95.3
3. Transfer to the Pension Fund for costs related to early retirement 55.4 67.1 75.1 10.4
4. Administrative expenses 1,342 1,217 1,255 1,276
Current Balance 1,716 –691 –2,098 –262.5
Cumulative balance at the beginning of the year 2,904 4,620 2,470 353.5
Cumulative balance at the end of the year 4,620 2,470 353.5 91.0
Current deficit as % of the total revenue — 11.2% 36.5% 3.2%
Current deficit as % of own expenditure (excluding the transfer to the Pension Fund) — 10.1% 26.8% 3.1%
Source: Budgets of the State Unemployment Insurance Fund (2013–2016), own calculations.Note: In 2014, an additional amount of 1,400 million UAH was transferred from the State Unemployment Insurance Fund to the
State Pension Fund pursuant to Article 27 of the Law on State Budget 2014.
2.7. Benefits for sickness, maternity, death and employment injuryThe social insurance against temporary incapacity for work provides benefi ts for sickness, maternity and death (funeral grant) for insured persons.
The sickness benefi t depends on one’s insurance period. Under the current legislation, last amended in 2015, the benefi t rate is established as a percentage of one’s previous income: 50 percent for a person
24
SOCIAL SECURIT Y SYSTEM OF UKR AINE IN 2014�15 AND BE YOND
insured for less than 3 years, 60 percent for persons insured from 3 to 5 years, 70 percent for persons insured from 5 to 8 years, and 100 percent for persons with insurance periods of 8 years and more. A 100 percent benefi t rate is applied for selected categories of individuals, such as Chernobyl disaster victims and war veterans. Prior to 2015, the sickness benefi t was 60 percent of one’s previous income for persons with insurance periods of less than 5 years, 80 percent for persons with 5 to 8 years of insurance, and 100 percent for persons with 8 years and more. The sickness benefi t is payable from the sixth day of sickness until recovery. The costs of the fi rst fi ve days of sick leave are covered by the employers.
The maternity benefi t provides 100 percent of one’s previous income, and not less than the minimum wage. The benefi t is paid for 126 days, 70 days of which should be paid before birth. In Ukraine, the maternity benefi t is a universal benefi t for all women. For non-insured persons, the maternity benefi t is paid as a non-contributory social benefi t fi nanced by the State budget. The maternity benefi t for non-insured persons is 100 percent of their previous income (including scholarships and unemployment benefi ts), and not less than 25 percent of the subsistence minimum.
The funeral benefi t is a lump-sum benefi t. Its amount is defi ned by the Board of the Fund, but it cannot be lower than the subsistence minimum.
In addition to the aforementioned reductions made to the sickness benefi t, further limitations were introduced to sickness and maternity benefi ts for workers with short contribution periods. Since 2015, for workers with a contribution period of less than 6 months, the sickness benefi ts cannot exceed the minimum wage, and the maternity benefi ts cannot exceed twice the minimum wage but not less than the minimum wage.
Employment injury benefi ts include benefi ts for temporary incapacity for work, benefi ts for total loss of earning capacity, survivors’ benefi ts, medical care and rehabilitation.
Due to the fi nancial shortages of the Fund, periodical cash employment injury benefi ts (pensions) were not indexed in 2014 and in 2015. The lump-sum payment benefi ts to victims of work accidents have also been reduced since 2015. For persons with permanent disability, the lump-sum payment has been changed from a multiple of the average wage by degree of disability (in percentage terms), but not higher than 4 times the maximum taxable income, to 17 times the subsistence minimum for able-bodied individuals. For fatalities, the lump-sum payment under the previous legislation was equivalent to 5 years’ salary plus 1 year’s salary per dependent. After the change, the payment equals 100 times the subsistence minimum for able-bodied individuals plus 20 times the subsistence minimum for each dependent family member. In both cases, a lump-sum payment has been changed from an earnings-related amount to a fi xed-rate amount.
Tables 13 and 14 indicate the fi nancial situation of the Temporary Incapacity Benefi ts Fund and the Employment Injury Benefi t Fund from 2013 to 2015. As already mentioned, these two Funds are expected to be merged, but are currently operated separately. For the Temporary Incapacity Benefi ts Fund, the decline in revenues was matched by cuts on health promotion programmes. The Employment Injury Benefi t Fund had a current defi cit of 426 million UAH in 2015, despite the implementation of measures to cut administrative costs.
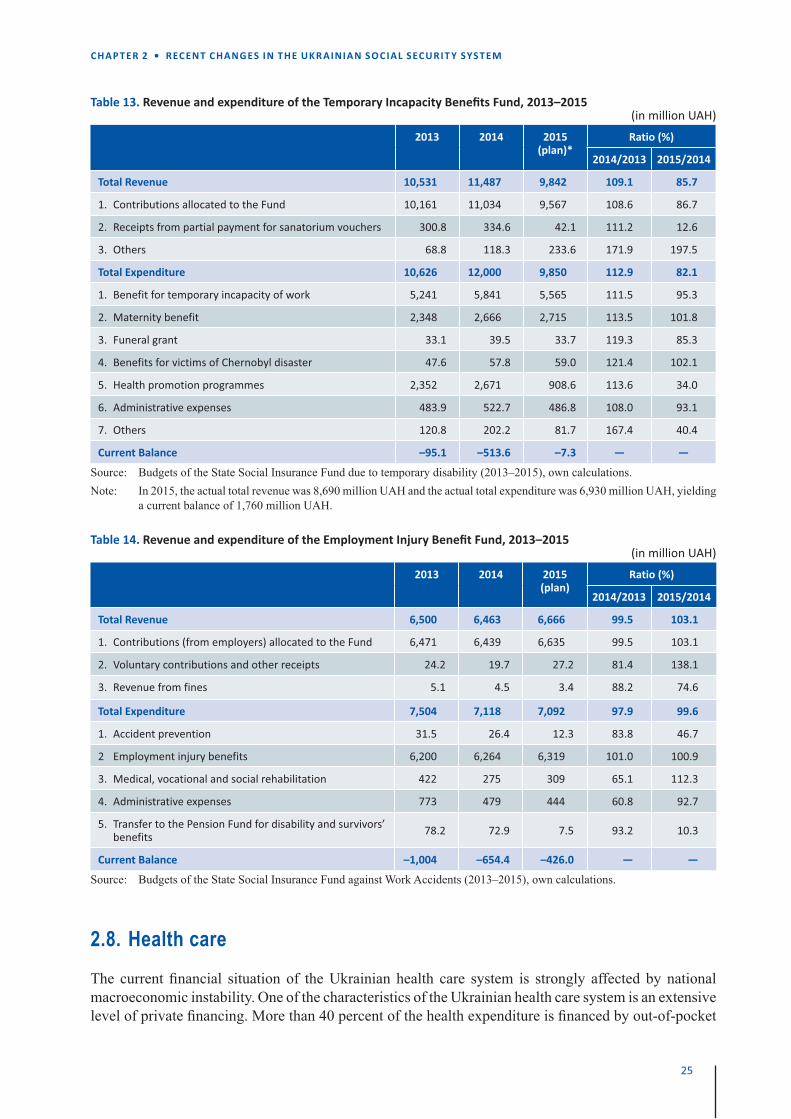
25
CHAP TER 2 • RECENT CHANGES IN THE UKR AINIAN SOCIAL SECURIT Y SYSTEM
Table 13. Revenue and expenditure of the Temporary Incapacity Benefi ts Fund, 2013–2015 (in million UAH)
2013 2014 2015 (plan)*
Ratio (%)
2014/2013 2015/2014
Total Revenue 10,531 11,487 9,842 109.1 85.7
1. Contributions allocated to the Fund 10,161 11,034 9,567 108.6 86.7
2. Receipts from partial payment for sanatorium vouchers 300.8 334.6 42.1 111.2 12.6
3. Others 68.8 118.3 233.6 171.9 197.5
Total Expenditure 10,626 12,000 9,850 112.9 82.1
1. Benefit for temporary incapacity of work 5,241 5,841 5,565 111.5 95.3
2. Maternity benefit 2,348 2,666 2,715 113.5 101.8
3. Funeral grant 33.1 39.5 33.7 119.3 85.3
4. Benefits for victims of Chernobyl disaster 47.6 57.8 59.0 121.4 102.1
5. Health promotion programmes 2,352 2,671 908.6 113.6 34.0
6. Administrative expenses 483.9 522.7 486.8 108.0 93.1
7. Others 120.8 202.2 81.7 167.4 40.4
Current Balance –95.1 –513.6 –7.3 — —
Source: Budgets of the State Social Insurance Fund due to temporary disability (2013–2015), own calculations. Note: In 2015, the actual total revenue was 8,690 million UAH and the actual total expenditure was 6,930 million UAH, yielding a current balance of 1,760 million UAH.
Table 14. Revenue and expenditure of the Employment Injury Benefi t Fund, 2013–2015 (in million UAH)
2013 2014 2015 (plan)
Ratio (%)
2014/2013 2015/2014
Total Revenue 6,500 6,463 6,666 99.5 103.1
1. Contributions (from employers) allocated to the Fund 6,471 6,439 6,635 99.5 103.1
2. Voluntary contributions and other receipts 24.2 19.7 27.2 81.4 138.1
3. Revenue from fines 5.1 4.5 3.4 88.2 74.6
Total Expenditure 7,504 7,118 7,092 97.9 99.6
1. Accident prevention 31.5 26.4 12.3 83.8 46.7
2 Employment injury benefits 6,200 6,264 6,319 101.0 100.9
3. Medical, vocational and social rehabilitation 422 275 309 65.1 112.3
4. Administrative expenses 773 479 444 60.8 92.7
5. Transfer to the Pension Fund for disability and survivors’ benefits 78.2 72.9 7.5 93.2 10.3
Current Balance –1,004 –654.4 –426.0 — —
Source: Budgets of the State Social Insurance Fund against Work Accidents (2013–2015), own calculations.
2.8. Health careThe current fi nancial situation of the Ukrainian health care system is strongly affected by national macroeconomic instability. One of the characteristics of the Ukrainian health care system is an extensive level of private fi nancing. More than 40 percent of the health expenditure is fi nanced by out-of-pocket
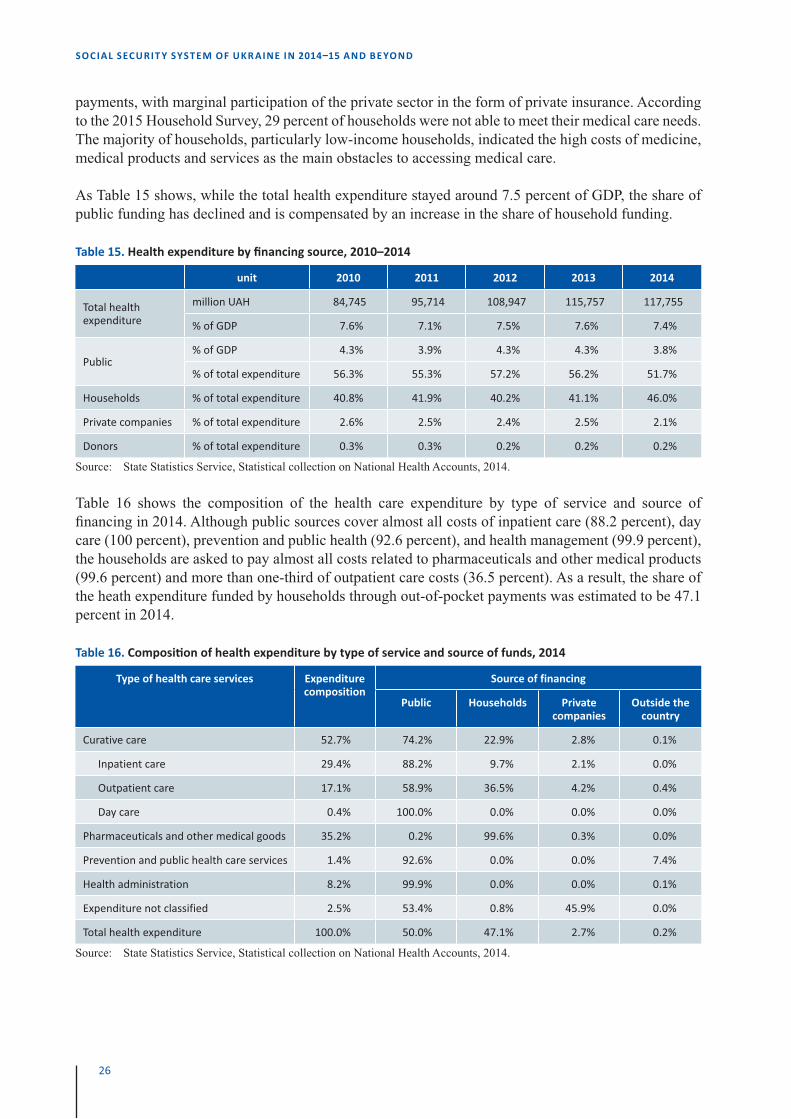
26
SOCIAL SECURIT Y SYSTEM OF UKR AINE IN 2014�15 AND BE YOND
payments, with marginal participation of the private sector in the form of private insurance. According to the 2015 Household Survey, 29 percent of households were not able to meet their medical care needs. The majority of households, particularly low-income households, indicated the high costs of medicine, medical products and services as the main obstacles to accessing medical care.
As Table 15 shows, while the total health expenditure stayed around 7.5 percent of GDP, the share of public funding has declined and is compensated by an increase in the share of household funding.
Table 15. Health expenditure by fi nancing source, 2010–2014
unit 2010 2011 2012 2013 2014
Total health expenditure
million UAH 84,745 95,714 108,947 115,757 117,755
% of GDP 7.6% 7.1% 7.5% 7.6% 7.4%
Public% of GDP 4.3% 3.9% 4.3% 4.3% 3.8%
% of total expenditure 56.3% 55.3% 57.2% 56.2% 51.7%
Households % of total expenditure 40.8% 41.9% 40.2% 41.1% 46.0%
Private companies % of total expenditure 2.6% 2.5% 2.4% 2.5% 2.1%
Donors % of total expenditure 0.3% 0.3% 0.2% 0.2% 0.2%
Source: State Statistics Service, Statistical collection on National Health Accounts, 2014.
Table 16 shows the composition of the health care expenditure by type of service and source of fi nancing in 2014. Although public sources cover almost all costs of inpatient care (88.2 percent), day care (100 percent), prevention and public health (92.6 percent), and health management (99.9 percent), the households are asked to pay almost all costs related to pharmaceuticals and other medical products (99.6 percent) and more than one-third of outpatient care costs (36.5 percent). As a result, the share of the heath expenditure funded by households through out-of-pocket payments was estimated to be 47.1 percent in 2014.
Table 16. Composi� on of health expenditure by type of service and source of funds, 2014
Type of health care services Expenditure composition
Source of financing
Public Households Private companies
Outside the country
Curative care 52.7% 74.2% 22.9% 2.8% 0.1%
Inpatient care 29.4% 88.2% 9.7% 2.1% 0.0%
Outpatient care 17.1% 58.9% 36.5% 4.2% 0.4%
Day care 0.4% 100.0% 0.0% 0.0% 0.0%
Pharmaceuticals and other medical goods 35.2% 0.2% 99.6% 0.3% 0.0%
Prevention and public health care services 1.4% 92.6% 0.0% 0.0% 7.4%
Health administration 8.2% 99.9% 0.0% 0.0% 0.1%
Expenditure not classified 2.5% 53.4% 0.8% 45.9% 0.0%
Total health expenditure 100.0% 50.0% 47.1% 2.7% 0.2%
Source: State Statistics Service, Statistical collection on National Health Accounts, 2014.
27
CHAP TER 2 • RECENT CHANGES IN THE UKR AINIAN SOCIAL SECURIT Y SYSTEM
A large share (71–74 percent) of the health care system costs consists of the remuneration of medical personnel. The limitation of the budget for medical procedures and medicines costs results in the payments by patients to cover part of these costs. In addition, the budget of the health organizations is based on the planned number of beds and doctors, not the volume of medical procedures. As a result, the budgeting involves very detailed and rigid rules for spending that cannot be altered throughout the fi scal year. This diffi cult fi nancial condition results in the decreasing availability of medical services to the population. There is also a decline in the number of beds, doctors and nurses per population.
The National Strategy for Health Care Reform in Ukraine, adopted in 2015, outlines the directions for health sector reform. It deals with the organization, funding, and delivery of healthcare. However, it contains no detailed picture of the planned reforms, and no political consensus has been reached on this issue. The Letter of Intent to the IMF of July 2015 states that “another legislation package changing the basis of public fi nancing for healthcare will shortly be submitted to parliament.” It is not clear whether this legislation refers to the introduction of social health insurance or not.
2.9. Non-contributory cash social benefits In Ukraine, non-contributory social benefi ts play a major role in poverty reduction. Approximately 60 percent of households are receiving some kind of social transfer. More than 70 percent of households in the lowest income group receive these benefi ts.13 This section focuses on cash social benefi ts. The housing subsidies and the so-called “privileges” (reductions in various public service charges) are described in the following sections.
Many of the non-contributory cash social benefi ts in Ukraine are of a categorical nature, mainly directed to families with children. Some of them are dependent on the income of the recipients and their family members. As spelled out in the Poverty Reduction Strategy adopted at the beginning of 2016, the Government is aiming to expand the role of targeted social assistance for low-income families. Starting in 2014, the World Bank provided the Government with a loan of 300 million US$, which was aimed at the expansion and modernization of the targeted social assistance for low-income families (called the Guaranteed Minimum Income programme), regulated by the Law on State Social Aid to Indigent Families.
The existing cash social benefi ts include maternity benefi ts, benefi ts for children under guardianship or custodianship, child benefi ts to single mothers, benefi ts for disabled children or individuals disabled since childhood, alimony, benefi ts for orphans, benefi ts for low-income families with members who suffer from mental disorders, and benefi ts for individuals who do not qualify for old-age or disability pensions (called the social pension). Table 17 presents the amounts of these benefi ts from 2014 to 2016, including the planned increases in May and December 2016.
13. World Bank (2014); Figure 3 in Annex 6.
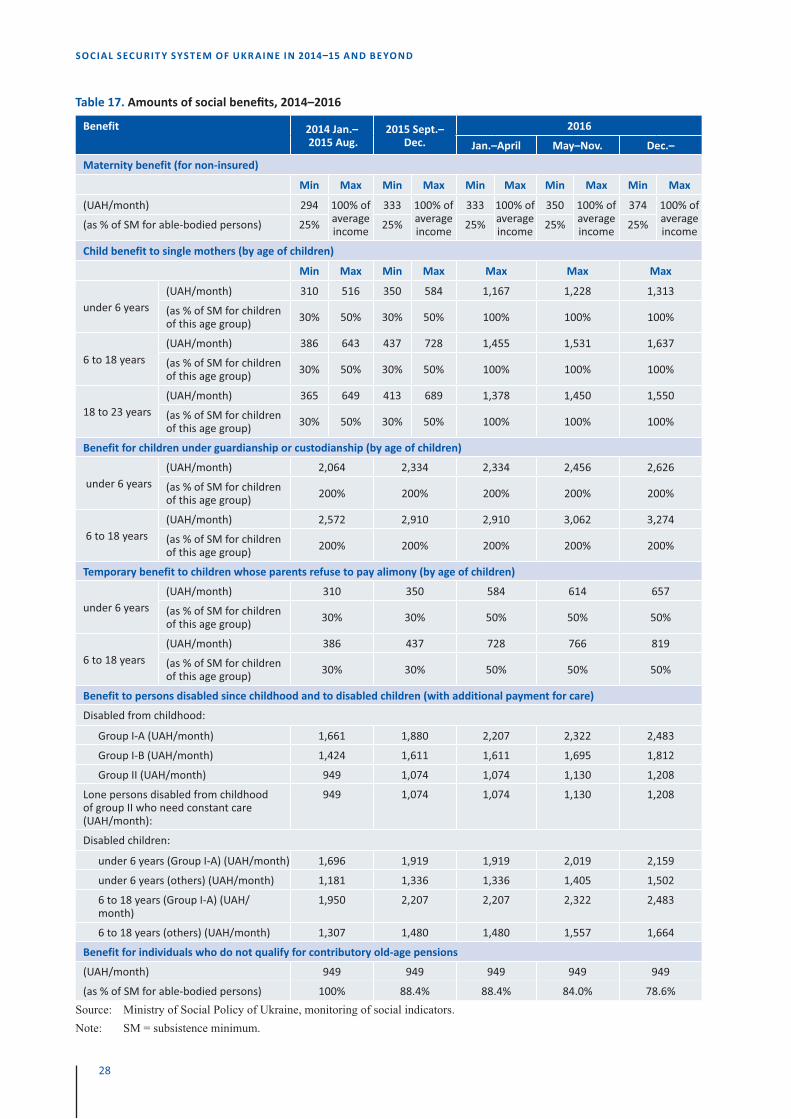
28
SOCIAL SECURIT Y SYSTEM OF UKR AINE IN 2014�15 AND BE YOND
Table 17. Amounts of social benefi ts, 2014–2016
Benefit 2014 Jan.– 2015 Aug.
2015 Sept.–Dec.
2016
Jan.–April May–Nov. Dec.–
Maternity benefit (for non-insured)
Min Max Min Max Min Max Min Max Min Max
(UAH/month) 294 100% of average income
333 100% of average income
333 100% of average income
350 100% of average income
374 100% of average income(as % of SM for able-bodied persons) 25% 25% 25% 25% 25%
Child benefit to single mothers (by age of children)
Min Max Min Max Max Max Max
under 6 years(UAH/month) 310 516 350 584 1,167 1,228 1,313
(as % of SM for children of this age group) 30% 50% 30% 50% 100% 100% 100%
6 to 18 years(UAH/month) 386 643 437 728 1,455 1,531 1,637
(as % of SM for children of this age group) 30% 50% 30% 50% 100% 100% 100%
18 to 23 years(UAH/month) 365 649 413 689 1,378 1,450 1,550
(as % of SM for children of this age group) 30% 50% 30% 50% 100% 100% 100%
Benefit for children under guardianship or custodianship (by age of children)
under 6 years(UAH/month) 2,064 2,334 2,334 2,456 2,626
(as % of SM for children of this age group) 200% 200% 200% 200% 200%
6 to 18 years(UAH/month) 2,572 2,910 2,910 3,062 3,274
(as % of SM for children of this age group) 200% 200% 200% 200% 200%
Temporary benefit to children whose parents refuse to pay alimony (by age of children)
under 6 years(UAH/month) 310 350 584 614 657
(as % of SM for children of this age group) 30% 30% 50% 50% 50%
6 to 18 years(UAH/month) 386 437 728 766 819
(as % of SM for children of this age group) 30% 30% 50% 50% 50%
Benefit to persons disabled since childhood and to disabled children (with additional payment for care)
Disabled from childhood:
Group I-A (UAH/month) 1,661 1,880 2,207 2,322 2,483
Group I-B (UAH/month) 1,424 1,611 1,611 1,695 1,812
Group II (UAH/month) 949 1,074 1,074 1,130 1,208
Lone persons disabled from childhood of group II who need constant care (UAH/month):
949 1,074 1,074 1,130 1,208
Disabled children:
under 6 years (Group I-A) (UAH/month) 1,696 1,919 1,919 2,019 2,159
under 6 years (others) (UAH/month) 1,181 1,336 1,336 1,405 1,502
6 to 18 years (Group I-A) (UAH/month)
1,950 2,207 2,207 2,322 2,483
6 to 18 years (others) (UAH/month) 1,307 1,480 1,480 1,557 1,664
Benefit for individuals who do not qualify for contributory old-age pensions
(UAH/month) 949 949 949 949 949
(as % of SM for able-bodied persons) 100% 88.4% 88.4% 84.0% 78.6%Source: Ministry of Social Policy of Ukraine, monitoring of social indicators. Note: SM = subsistence minimum.
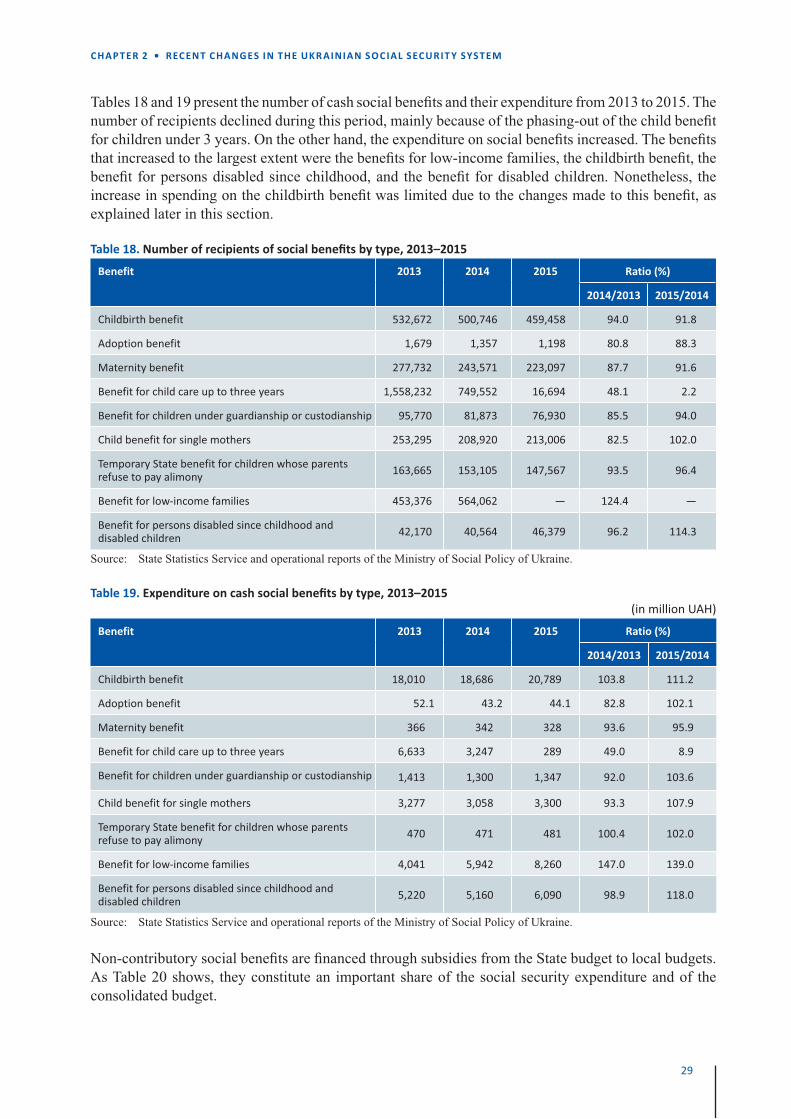
29
CHAP TER 2 • RECENT CHANGES IN THE UKR AINIAN SOCIAL SECURIT Y SYSTEM
Tables 18 and 19 present the number of cash social benefi ts and their expenditure from 2013 to 2015. The number of recipients declined during this period, mainly because of the phasing-out of the child benefi t for children under 3 years. On the other hand, the expenditure on social benefi ts increased. The benefi ts that increased to the largest extent were the benefi ts for low-income families, the childbirth benefi t, the benefi t for persons disabled since childhood, and the benefi t for disabled children. Nonetheless, the increase in spending on the childbirth benefi t was limited due to the changes made to this benefi t, as explained later in this section.
Table 18. Number of recipients of social benefi ts by type, 2013–2015
Benefit 2013 2014 2015 Ratio (%)
2014/2013 2015/2014
Childbirth benefit 532,672 500,746 459,458 94.0 91.8
Adoption benefit 1,679 1,357 1,198 80.8 88.3
Maternity benefit 277,732 243,571 223,097 87.7 91.6
Benefit for child care up to three years 1,558,232 749,552 16,694 48.1 2.2
Benefit for children under guardianship or custodianship 95,770 81,873 76,930 85.5 94.0
Child benefit for single mothers 253,295 208,920 213,006 82.5 102.0
Temporary State benefit for children whose parents refuse to pay alimony 163,665 153,105 147,567 93.5 96.4
Benefit for low-income families 453,376 564,062 — 124.4 —
Benefit for persons disabled since childhood and disabled children 42,170 40,564 46,379 96.2 114.3
Source: State Statistics Service and operational reports of the Ministry of Social Policy of Ukraine.
Table 19. Expenditure on cash social benefi ts by type, 2013–2015 (in million UAH)
Benefit 2013 2014 2015 Ratio (%)
2014/2013 2015/2014
Childbirth benefit 18,010 18,686 20,789 103.8 111.2
Adoption benefit 52.1 43.2 44.1 82.8 102.1
Maternity benefit 366 342 328 93.6 95.9
Benefit for child care up to three years 6,633 3,247 289 49.0 8.9
Benefit for children under guardianship or custodianship 1,413 1,300 1,347 92.0 103.6
Child benefit for single mothers 3,277 3,058 3,300 93.3 107.9
Temporary State benefit for children whose parents refuse to pay alimony 470 471 481 100.4 102.0
Benefit for low-income families 4,041 5,942 8,260 147.0 139.0
Benefit for persons disabled since childhood and disabled children 5,220 5,160 6,090 98.9 118.0
Source: State Statistics Service and operational reports of the Ministry of Social Policy of Ukraine.
Non-contributory social benefi ts are fi nanced through subsidies from the State budget to local budgets. As Table 20 shows, they constitute an important share of the social security expenditure and of the consolidated budget.
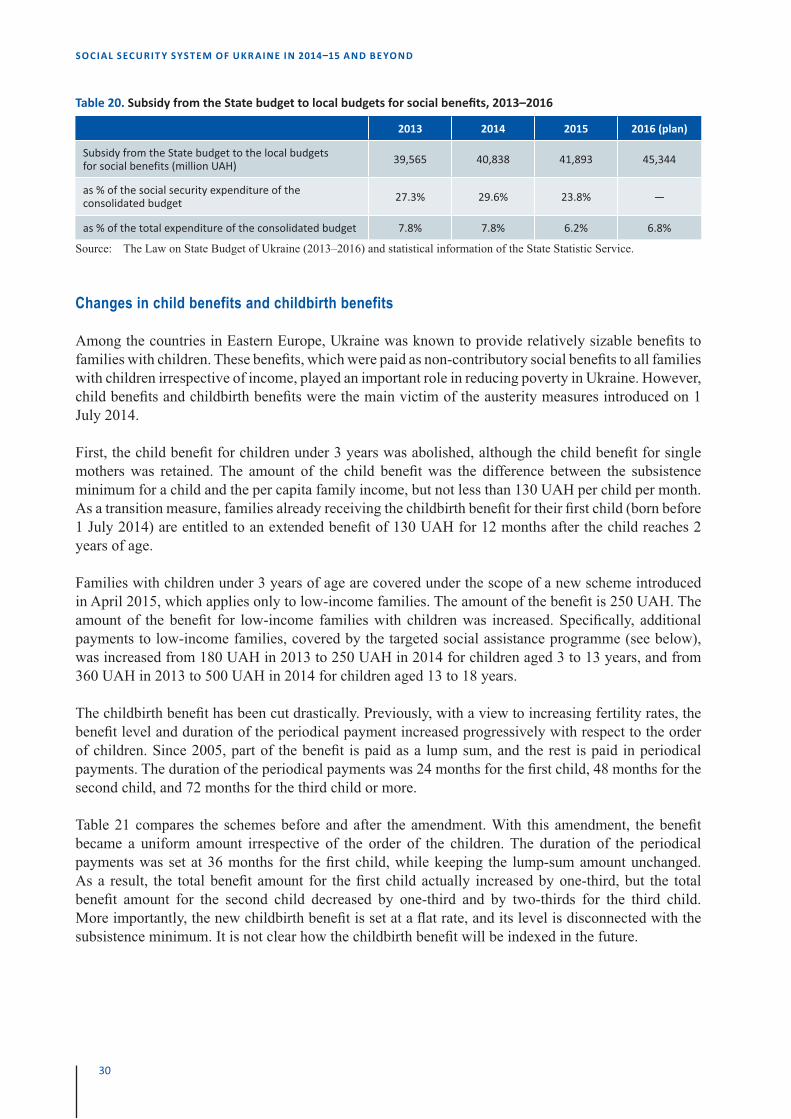
30
SOCIAL SECURIT Y SYSTEM OF UKR AINE IN 2014�15 AND BE YOND
Table 20. Subsidy from the State budget to local budgets for social benefi ts, 2013–2016
2013 2014 2015 2016 (plan)
Subsidy from the State budget to the local budgets for social benefits (million UAH) 39,565 40,838 41,893 45,344
as % of the social security expenditure of the consolidated budget 27.3% 29.6% 23.8% —
as % of the total expenditure of the consolidated budget 7.8% 7.8% 6.2% 6.8%
Source: The Law on State Budget of Ukraine (2013–2016) and statistical information of the State Statistic Service.
Changes in child benefits and childbirth benefits
Among the countries in Eastern Europe, Ukraine was known to provide relatively sizable benefi ts to families with children. These benefi ts, which were paid as non-contributory social benefi ts to all families with children irrespective of income, played an important role in reducing poverty in Ukraine. However, child benefi ts and childbirth benefi ts were the main victim of the austerity measures introduced on 1 July 2014.
First, the child benefi t for children under 3 years was abolished, although the child benefi t for single mothers was retained. The amount of the child benefi t was the difference between the subsistence minimum for a child and the per capita family income, but not less than 130 UAH per child per month. As a transition measure, families already receiving the childbirth benefi t for their fi rst child (born before 1 July 2014) are entitled to an extended benefi t of 130 UAH for 12 months after the child reaches 2 years of age.
Families with children under 3 years of age are covered under the scope of a new scheme introduced in April 2015, which applies only to low-income families. The amount of the benefi t is 250 UAH. The amount of the benefi t for low-income families with children was increased. Specifi cally, additional payments to low-income families, covered by the targeted social assistance programme (see below), was increased from 180 UAH in 2013 to 250 UAH in 2014 for children aged 3 to 13 years, and from 360 UAH in 2013 to 500 UAH in 2014 for children aged 13 to 18 years.
The childbirth benefi t has been cut drastically. Previously, with a view to increasing fertility rates, the benefi t level and duration of the periodical payment increased progressively with respect to the order of children. Since 2005, part of the benefi t is paid as a lump sum, and the rest is paid in periodical payments. The duration of the periodical payments was 24 months for the fi rst child, 48 months for the second child, and 72 months for the third child or more.
Table 21 compares the schemes before and after the amendment. With this amendment, the benefi t became a uniform amount irrespective of the order of the children. The duration of the periodical payments was set at 36 months for the fi rst child, while keeping the lump-sum amount unchanged. As a result, the total benefi t amount for the fi rst child actually increased by one-third, but the total benefi t amount for the second child decreased by one-third and by two-thirds for the third child. More importantly, the new childbirth benefi t is set at a fl at rate, and its level is disconnected with the subsistence minimum. It is not clear how the childbirth benefi t will be indexed in the future.
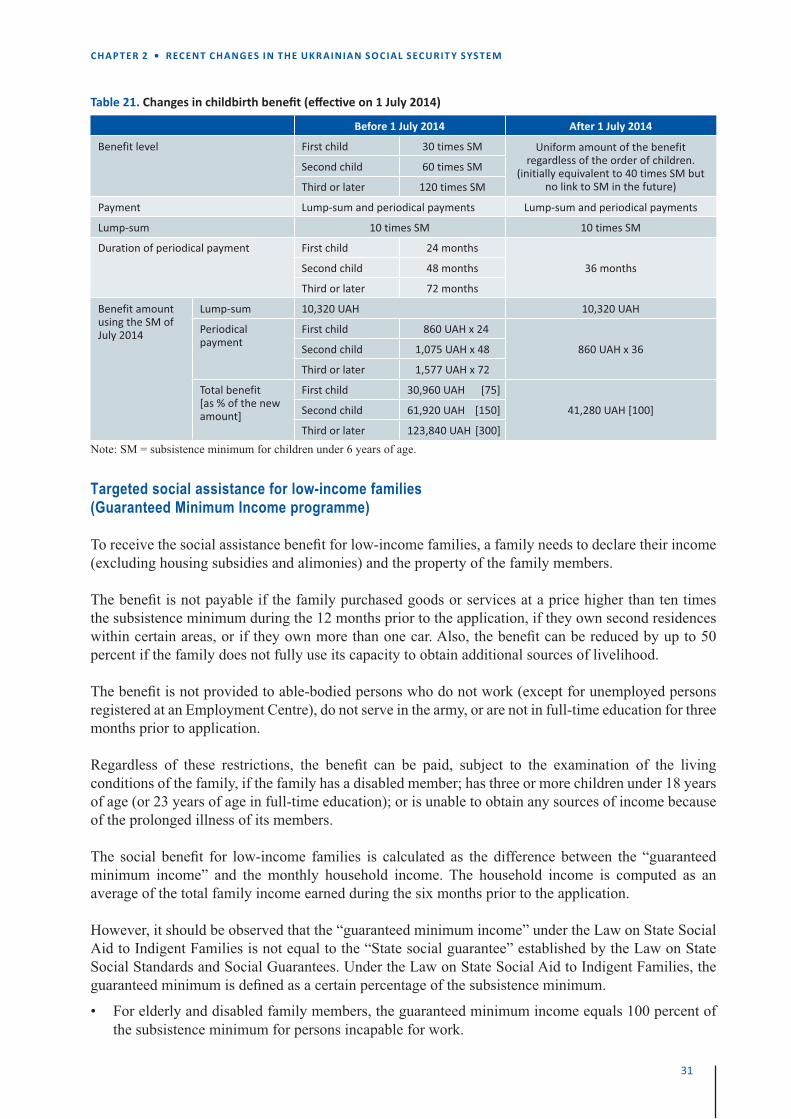
31
CHAP TER 2 • RECENT CHANGES IN THE UKR AINIAN SOCIAL SECURIT Y SYSTEM
Table 21. Changes in childbirth benefi t (eff ec� ve on 1 July 2014)
Before 1 July 2014 After 1 July 2014
Benefit level First child 30 times SM Uniform amount of the benefit regardless of the order of children.
(initially equivalent to 40 times SM but no link to SM in the future)
Second child 60 times SM
Third or later 120 times SM
Payment Lump-sum and periodical payments Lump-sum and periodical payments
Lump-sum 10 times SM 10 times SM
Duration of periodical payment First child 24 months
36 monthsSecond child 48 months
Third or later 72 months
Benefit amount using the SM of July 2014
Lump-sum 10,320 UAH 10,320 UAH
Periodical payment
First child 860 UAH x 24
860 UAH x 36Second child 1,075 UAH x 48
Third or later 1,577 UAH x 72
Total benefit[as % of the new amount]
First child 30,960 UAH [75]
41,280 UAH [100]Second child 61,920 UAH [150]
Third or later 123,840 UAH [300]Note: SM = subsistence minimum for children under 6 years of age.
Targeted social assistance for low-income families (Guaranteed Minimum Income programme)
To receive the social assistance benefi t for low-income families, a family needs to declare their income (excluding housing subsidies and alimonies) and the property of the family members.
The benefi t is not payable if the family purchased goods or services at a price higher than ten times the subsistence minimum during the 12 months prior to the application, if they own second residences within certain areas, or if they own more than one car. Also, the benefi t can be reduced by up to 50 percent if the family does not fully use its capacity to obtain additional sources of livelihood.
The benefi t is not provided to able-bodied persons who do not work (except for unemployed persons registered at an Employment Centre), do not serve in the army, or are not in full-time education for three months prior to application.
Regardless of these restrictions, the benefi t can be paid, subject to the examination of the living conditions of the family, if the family has a disabled member; has three or more children under 18 years of age (or 23 years of age in full-time education); or is unable to obtain any sources of income because of the prolonged illness of its members.
The social benefi t for low-income families is calculated as the difference between the “guaranteed minimum income” and the monthly household income. The household income is computed as an average of the total family income earned during the six months prior to the application.
However, it should be observed that the “guaranteed minimum income” under the Law on State Social Aid to Indigent Families is not equal to the “State social guarantee” established by the Law on State Social Standards and Social Guarantees. Under the Law on State Social Aid to Indigent Families, the guaranteed minimum is defi ned as a certain percentage of the subsistence minimum.
• For elderly and disabled family members, the guaranteed minimum income equals 100 percent of the subsistence minimum for persons incapable for work.
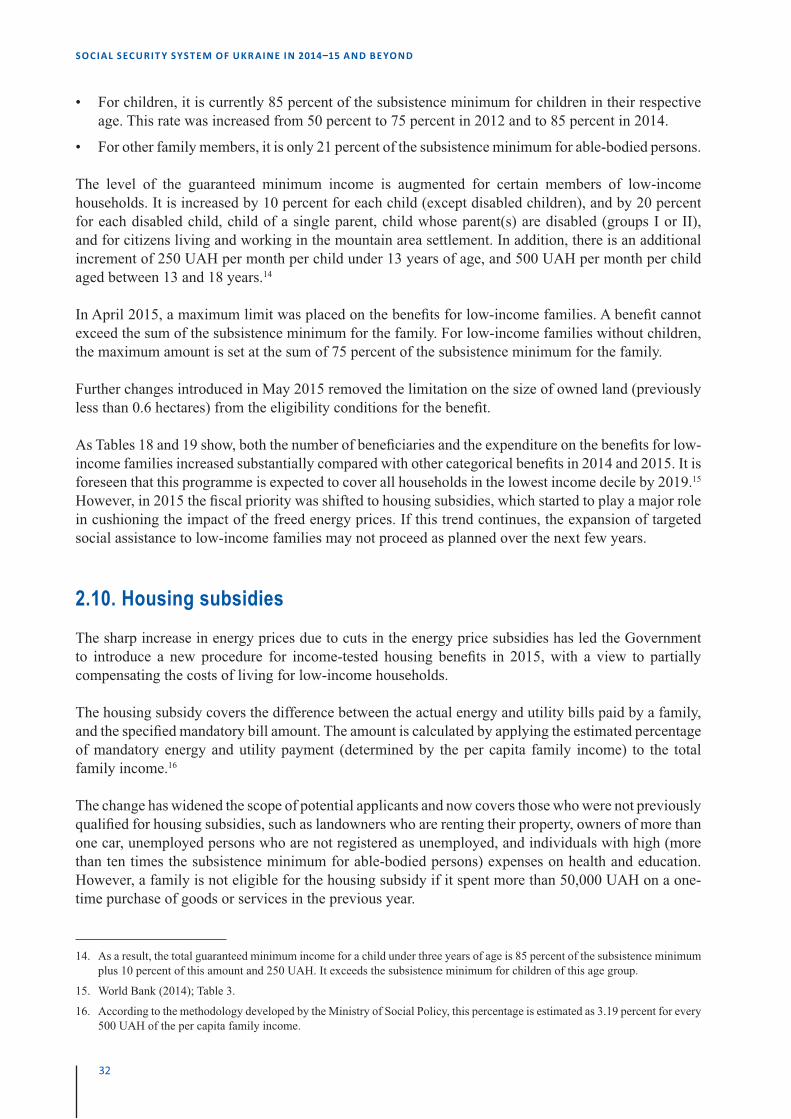
32
SOCIAL SECURIT Y SYSTEM OF UKR AINE IN 2014�15 AND BE YOND
• For children, it is currently 85 percent of the subsistence minimum for children in their respective age. This rate was increased from 50 percent to 75 percent in 2012 and to 85 percent in 2014.
• For other family members, it is only 21 percent of the subsistence minimum for able-bodied persons.
The level of the guaranteed minimum income is augmented for certain members of low-income households. It is increased by 10 percent for each child (except disabled children), and by 20 percent for each disabled child, child of a single parent, child whose parent(s) are disabled (groups I or II), and for citizens living and working in the mountain area settlement. In addition, there is an additional increment of 250 UAH per month per child under 13 years of age, and 500 UAH per month per child aged between 13 and 18 years.14
In April 2015, a maximum limit was placed on the benefi ts for low-income families. A benefi t cannot exceed the sum of the subsistence minimum for the family. For low-income families without children, the maximum amount is set at the sum of 75 percent of the subsistence minimum for the family.
Further changes introduced in May 2015 removed the limitation on the size of owned land (previously less than 0.6 hectares) from the eligibility conditions for the benefi t.
As Tables 18 and 19 show, both the number of benefi ciaries and the expenditure on the benefi ts for low-income families increased substantially compared with other categorical benefi ts in 2014 and 2015. It is foreseen that this programme is expected to cover all households in the lowest income decile by 2019.15 However, in 2015 the fi scal priority was shifted to housing subsidies, which started to play a major role in cushioning the impact of the freed energy prices. If this trend continues, the expansion of targeted social assistance to low-income families may not proceed as planned over the next few years.
2.10. Housing subsidiesThe sharp increase in energy prices due to cuts in the energy price subsidies has led the Government to introduce a new procedure for income-tested housing benefi ts in 2015, with a view to partially compensating the costs of living for low-income households.
The housing subsidy covers the difference between the actual energy and utility bills paid by a family, and the specifi ed mandatory bill amount. The amount is calculated by applying the estimated percentage of mandatory energy and utility payment (determined by the per capita family income) to the total family income.16
The change has widened the scope of potential applicants and now covers those who were not previously qualifi ed for housing subsidies, such as landowners who are renting their property, owners of more than one car, unemployed persons who are not registered as unemployed, and individuals with high (more than ten times the subsistence minimum for able-bodied persons) expenses on health and education. However, a family is not eligible for the housing subsidy if it spent more than 50,000 UAH on a one-time purchase of goods or services in the previous year.
14. As a result, the total guaranteed minimum income for a child under three years of age is 85 percent of the subsistence minimum plus 10 percent of this amount and 250 UAH. It exceeds the subsistence minimum for children of this age group.
15. World Bank (2014); Table 3.
16. According to the methodology developed by the Ministry of Social Policy, this percentage is estimated as 3.19 percent for every 500 UAH of the per capita family income.
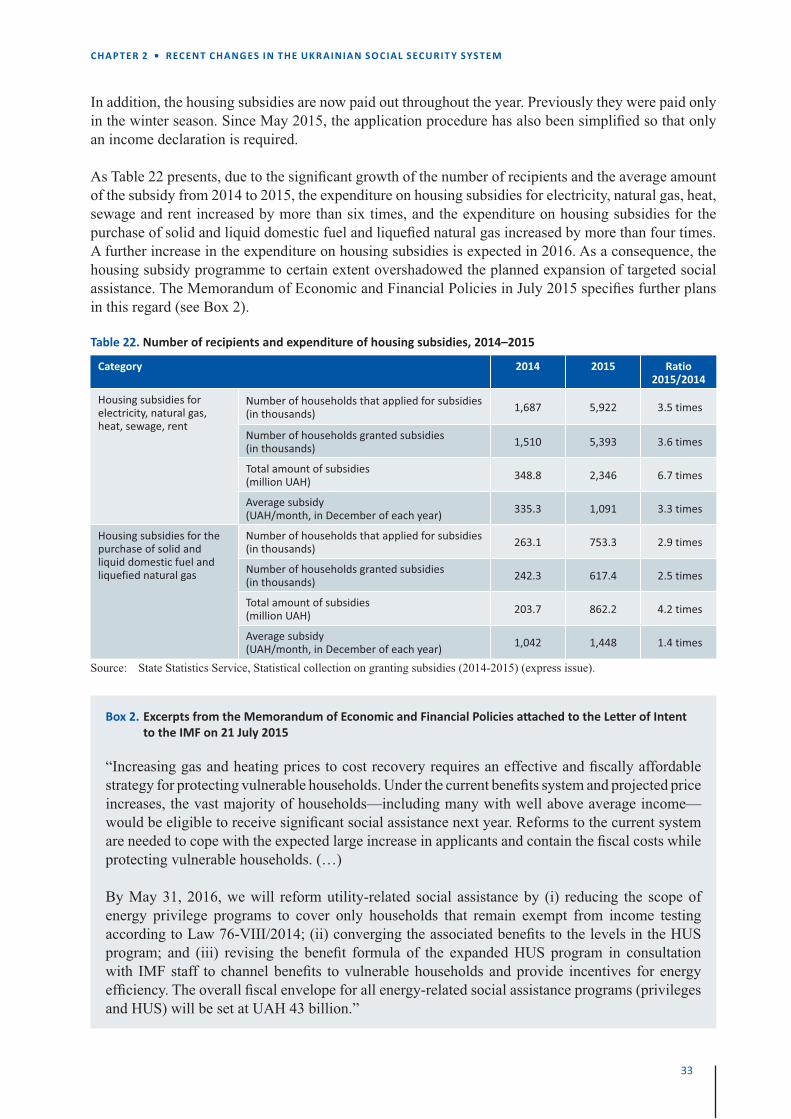
33
CHAP TER 2 • RECENT CHANGES IN THE UKR AINIAN SOCIAL SECURIT Y SYSTEM
In addition, the housing subsidies are now paid out throughout the year. Previously they were paid only in the winter season. Since May 2015, the application procedure has also been simplifi ed so that only an income declaration is required.
As Table 22 presents, due to the signifi cant growth of the number of recipients and the average amount of the subsidy from 2014 to 2015, the expenditure on housing subsidies for electricity, natural gas, heat, sewage and rent increased by more than six times, and the expenditure on housing subsidies for the purchase of solid and liquid domestic fuel and liquefi ed natural gas increased by more than four times. A further increase in the expenditure on housing subsidies is expected in 2016. As a consequence, the housing subsidy programme to certain extent overshadowed the planned expansion of targeted social assistance. The Memorandum of Economic and Financial Policies in July 2015 specifi es further plans in this regard (see Box 2).
Table 22. Number of recipients and expenditure of housing subsidies, 2014–2015
Category 2014 2015 Ratio2015/2014
Housing subsidies for electricity, natural gas, heat, sewage, rent
Number of households that applied for subsidies (in thousands) 1,687 5,922 3.5 times
Number of households granted subsidies (in thousands) 1,510 5,393 3.6 times
Total amount of subsidies (million UAH) 348.8 2,346 6.7 times
Average subsidy (UAH/month, in December of each year) 335.3 1,091 3.3 times
Housing subsidies for the purchase of solid and liquid domestic fuel and liquefied natural gas
Number of households that applied for subsidies (in thousands) 263.1 753.3 2.9 times
Number of households granted subsidies (in thousands) 242.3 617.4 2.5 times
Total amount of subsidies (million UAH) 203.7 862.2 4.2 times
Average subsidy (UAH/month, in December of each year) 1,042 1,448 1.4 times
Source: State Statistics Service, Statistical collection on granting subsidies (2014-2015) (express issue).
Box 2. Excerpts from the Memorandum of Economic and Financial Policies a� ached to the Le� er of Intent to the IMF on 21 July 2015
“Increasing gas and heating prices to cost recovery requires an effective and fi scally affordable strategy for protecting vulnerable households. Under the current benefi ts system and projected price increases, the vast majority of households—including many with well above average income—would be eligible to receive signifi cant social assistance next year. Reforms to the current system are needed to cope with the expected large increase in applicants and contain the fi scal costs while protecting vulnerable households. (…)
By May 31, 2016, we will reform utility-related social assistance by (i) reducing the scope of energy privilege programs to cover only households that remain exempt from income testing according to Law 76-VIII/2014; (ii) converging the associated benefi ts to the levels in the HUS program; and (iii) revising the benefi t formula of the expanded HUS program in consultation with IMF staff to channel benefi ts to vulnerable households and provide incentives for energy effi ciency. The overall fi scal envelope for all energy-related social assistance programs (privileges and HUS) will be set at UAH 43 billion.”
34
SOCIAL SECURIT Y SYSTEM OF UKR AINE IN 2014�15 AND BE YOND
2.11. Subsidies facilitating access to goods and servicesAn important and complex element of income support in Ukraine, inherited from the Soviet Union, is a system of subsidised access to certain goods and services with discounted prices. This benefi t is called “пільги” in Ukrainian, which is somewhat misleadingly translated as “privileges.” The system is regulated by about 45 legislations and normative acts. Typical examples of “privileges” include housing and utilities, fuel for domestic purposes, communication, transport, cultural services and others. Almost half of Ukrainian households benefi t from some types of “privileges.”
These benefi ts were available to 116 categories of people on the grounds of their social status (45 categories), professions (57 categories) and merits (14 categories). Table 23 presents the distribution of the funding of “privileges” among different socio-demographic groups in 2012. Old-age pensioners received more than one-third of these benefi ts (35.5 percent of the total spending) followed by children of war (19.97 percent).
Table 23. Composi� on of the funding of “privileges” by group, 2012
Categories of privileged beneficiaries Share of funding
Veterans of War 7.94%
Veterans of Labour 17.20%
Children of war 19.97%
Persons injured by the Chernobyl disaster 6.94%
Veterans of military service internal affairs bodies 0.86%
Rehabilitated 0.04%
Handicapped disease 6.57%
Victims of Nazi persecution 0.02%
Retired firefighters, soldiers, policemen 0.45%
Rural teachers, librarians, growers, retired doctors, retired judges, investigators, retired miners 0.82%
Old-age pensioners 35.50%
Families with many children 0.94%
Children from a large family 2.76%
Source: Centre of Prospective Social Research (2014).
In 2014 and 2015, a series of measures were implemented which aimed at targeting these benefi ts to low-income groups. Under the new legislation, the categories of people who are entitled to privilege benefi ts include war veterans, children of war, victims of Nazi persecution, persons with special work merits, large families, pensioners with police service, teachers, health workers, and cultural workers in rural areas. Furthermore, an income test has been introduced. Since June 2015, the entitlement of “privileges” has been restricted to households whose income does not exceed the income allowing for tax deductions in the previous six months.
It is estimated that the new system of “privileges” covers approximately 4.7 million of Ukrainians. Of these, 3.7 million of the old benefi ciaries retain their “privileges,” but approximately 960 thousand of them may lose them in the future.
At the same time, new special benefi ts were introduced for participants in the anti-terrorist operation. As of May 2015, participants in the anti-terrorist operation have the same status as military personnel,
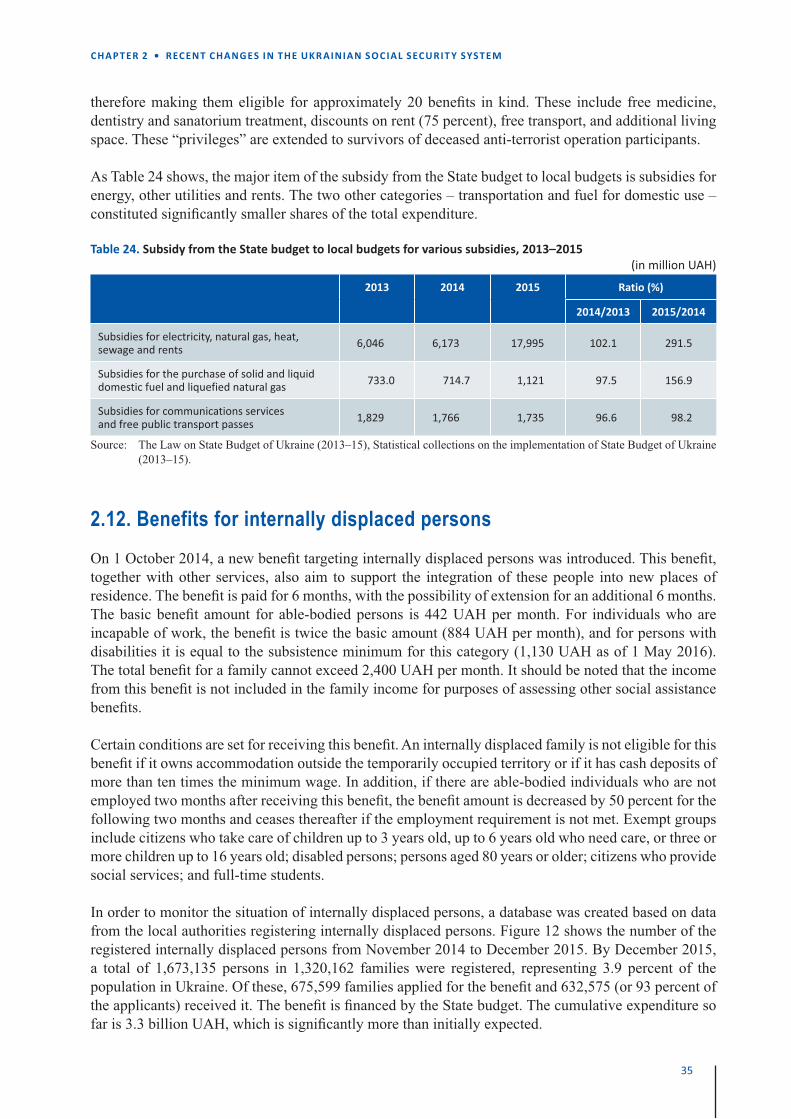
35
CHAP TER 2 • RECENT CHANGES IN THE UKR AINIAN SOCIAL SECURIT Y SYSTEM
therefore making them eligible for approximately 20 benefi ts in kind. These include free medicine, dentistry and sanatorium treatment, discounts on rent (75 percent), free transport, and additional living space. These “privileges” are extended to survivors of deceased anti-terrorist operation participants.
As Table 24 shows, the major item of the subsidy from the State budget to local budgets is subsidies for energy, other utilities and rents. The two other categories – transportation and fuel for domestic use – constituted signifi cantly smaller shares of the total expenditure.
Table 24. Subsidy from the State budget to local budgets for various subsidies, 2013–2015 (in million UAH)
2013 2014 2015 Ratio (%)
2014/2013 2015/2014
Subsidies for electricity, natural gas, heat, sewage and rents 6,046 6,173 17,995 102.1 291.5
Subsidies for the purchase of solid and liquid domestic fuel and liquefied natural gas 733.0 714.7 1,121 97.5 156.9
Subsidies for communications services and free public transport passes 1,829 1,766 1,735 96.6 98.2
Source: The Law on State Budget of Ukraine (2013–15), Statistical collections on the implementation of State Budget of Ukraine (2013–15).
2.12. Benefits for internally displaced personsOn 1 October 2014, a new benefi t targeting internally displaced persons was introduced. This benefi t, together with other services, also aim to support the integration of these people into new places of residence. The benefi t is paid for 6 months, with the possibility of extension for an additional 6 months. The basic benefi t amount for able-bodied persons is 442 UAH per month. For individuals who are incapable of work, the benefi t is twice the basic amount (884 UAH per month), and for persons with disabilities it is equal to the subsistence minimum for this category (1,130 UAH as of 1 May 2016). The total benefi t for a family cannot exceed 2,400 UAH per month. It should be noted that the income from this benefi t is not included in the family income for purposes of assessing other social assistance benefi ts.
Certain conditions are set for receiving this benefi t. An internally displaced family is not eligible for this benefi t if it owns accommodation outside the temporarily occupied territory or if it has cash deposits of more than ten times the minimum wage. In addition, if there are able-bodied individuals who are not employed two months after receiving this benefi t, the benefi t amount is decreased by 50 percent for the following two months and ceases thereafter if the employment requirement is not met. Exempt groups include citizens who take care of children up to 3 years old, up to 6 years old who need care, or three or more children up to 16 years old; disabled persons; persons aged 80 years or older; citizens who provide social services; and full-time students.
In order to monitor the situation of internally displaced persons, a database was created based on data from the local authorities registering internally displaced persons. Figure 12 shows the number of the registered internally displaced persons from November 2014 to December 2015. By December 2015, a total of 1,673,135 persons in 1,320,162 families were registered, representing 3.9 percent of the population in Ukraine. Of these, 675,599 families applied for the benefi t and 632,575 (or 93 percent of the applicants) received it. The benefi t is fi nanced by the State budget. The cumulative expenditure so far is 3.3 billion UAH, which is signifi cantly more than initially expected.
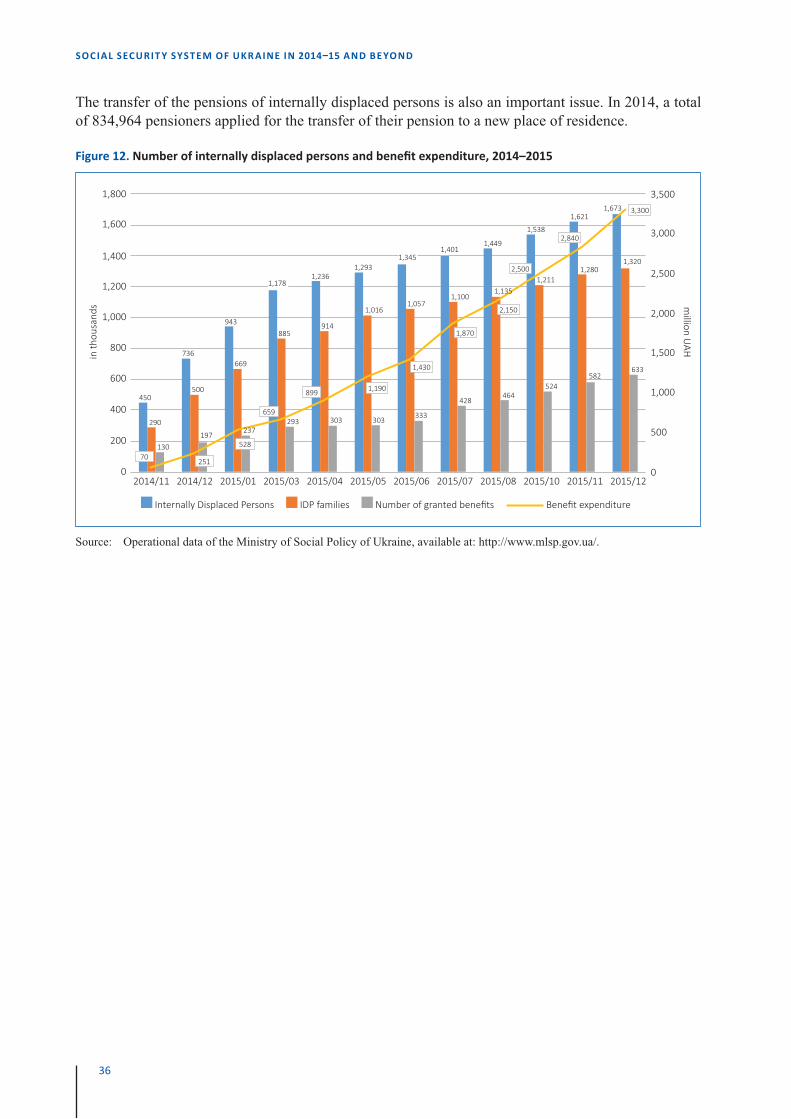
36
SOCIAL SECURIT Y SYSTEM OF UKR AINE IN 2014�15 AND BE YOND
The transfer of the pensions of internally displaced persons is also an important issue. In 2014, a total of 834,964 pensioners applied for the transfer of their pension to a new place of residence.
Figure 12. Number of internally displaced persons and benefi t expenditure, 2014–2015
1,400
1,600
1,800
1,200
1,000
800
600
400
200
0
in th
ousa
nds
2014/11 2014/12 2015/01 2015/03 2015/04 2015/05 2015/06 2015/07 2015/08 2015/10 2015/11 2015/12
Internally Displaced Persons IDP families Number of granted benefi ts Benefi t expenditure
million U
AH
2,500
3,000
3,500
2,000
1,500
1,000
500
0
450
290
130
736
500
197
943
669
1,178
885
293
3,300
303 303333
914
1,2361,293
1,0161,057
1,3451,401
1,449
1,538
1,100
1,6211,673
1,3201,280
1,211
582633
428464
524
70 251
528
659
899 1,190
2,500
2,150
1,430
1,870
2,840
1,135
237
Source: Operational data of the Ministry of Social Policy of Ukraine, available at: http://www.mlsp.gov.ua/.
37
CHAP TER 3 • CONCLUSIONS
3. Conclusions
3.1. The ILO assessment of the recent changes to the Ukrainian social security systemUnder the severe austerity measures introduced as a result of the economic downturn and the conditions imposed by international fi nancial organizations,17 the Government has implemented a number of reforms affecting the social security system.
From the ILO’s perspective, we review the major elements of the changes and their implications.
First, freezing the value of the subsistence minimum (and suspending the indexation of social security benefi ts) in the high infl ation period has had major negative consequences for all households. It has particularly hit low-income households who earn minimum wages or who rely on social benefi ts as their main source of income. Statistical evidence indicates that income inequality has increased, although poverty indicators did not capture the full impact due to the devaluation of poverty thresholds in real terms. As of November 2015, the average statutory subsistence minimum represents 53.5 percent of the estimated subsistence minimum. It is strongly recommended that this signifi cant discrepancy is rectifi ed by adopting a mechanism to adequately adjust the subsistence minimum and re-establish the social security benefi ts levels.
Second, the organizational restructuring through the merger of the two funds could save administrative expenses in the long run. However, one year after the decision was taken the merger still has not been completed yet, which indicates a lack of preparedness as observed by the social partners. The downside of this restructuring is related to the change in the governance structure, which diminishes the role of the social partners in the management and decision-making of the social insurance funds, hence reducing the autonomy of the funds.
Third, the single social contribution rate has been reduced signifi cantly (by almost 60 percent). This measure would make sense only if the reduced contribution rate widens the tax base and results in positive fi scal effects. Based on preliminary observations, however, it is likely that the total contribution revenue will decrease, specifi cally affecting the pension system through the signifi cantly reduced allocation rate. The additional fi scal pressure on the State budget to cover the widening fi nancial defi cit will likely lead to additional cuts in benefi t entitlements.
17. The IMF statement on the 2016 Ukrainian budget states: “Approval of a budget consistent with the program objective of re-ducing the general government defi cit to 3.7 percent of GDP is a key condition for the completion of the second review under the EFF-supported program. (…) Approval of a budget that deviates from program objectives for 2016 and the medium-term will interrupt the program and inevitably disrupt the associated international fi nancing” (IMF Press Release No. 15/572, 18 December 2015). It should be noted that the expected defi cit of the Pension Fund in 2016 is estimated to be 3.6 percent of GDP.
38
SOCIAL SECURIT Y SYSTEM OF UKR AINE IN 2014�15 AND BE YOND
Fourth, various benefi t cuts have been implemented. For pensions, the eligibility conditions have been tightened, and benefi t payments have been further restricted. Specifi cally, these measures include the reduction of pensions for special groups, the elimination of preferential pension provisions for special occupational groups, the reduction of pensions for working pensioners, and the taxation of pensions above a certain threshold (although the Government increased signifi cantly the minimum threshold for the pension taxation in 2016). In addition, signifi cant cuts have been made to childbirth benefi ts for second and third children. Various auxiliary benefi ts paid by the Temporary Incapacity Benefi ts Fund have also been removed from the list of benefi ts fi nanced by social security contributions. Although not all of these measures are unreasonable, they were implemented without the appropriate impact assessment, and many feel that they are fi scally motivated.
Fifth, the Government is contemplating the introduction of a mandatory funded pension tier as the next step of pension reform (see the Letter of Intent to the IMF cited in Box 1). An alarming remark should be made to this pension reform approach. It is important to note that this pension reform approach, which was very infl uential in the mid-1990s in the transition countries in Central and Eastern Europe, has yielded disappointing outcomes. There is ample evidence that the introduction of mandatory private pension systems in Central and Eastern Europe and in Latin America has not resulted in the intended macroeconomic impacts and has failed to expand coverage to the population outside the formal employment sector. Moreover, as anticipated, the signifi cant transition costs associated with the introduction of these systems were added to the fi scal defi cits of those countries, which went in the opposite direction from the defi cit reduction in the short and medium-term.
Sixth, the Government aims to expand the role of social benefi ts targeted to low-income families. Generally, supporters of targeting assert that it can achieve a more effi cient resource allocation for poverty reduction, especially when resource constraints are tight. Opponents who give preference to a universal approach argue that targeting is not effective in addressing issues of poverty. They point out that targeted social assistance systems typically exclude many low-paid working families and thus cannot effectively lift them out of poverty, involve extremely high administrative costs in identifying the poor, and undermine incentives to work. It is likely that this global debate will continue. In the context of Ukraine, the policy and its implementation strategy aimed at poverty reduction need to be carefully designed in view of the country’s specifi c circumstances (see Section 3.3).
Last but not least, it should be observed that cutting energy price subsidies has necessitated the Government to fi nance an unexpected expansion of housing subsidies to compensate huge energy price increases for low-income households. Such an ad hoc change not only undermines the expected cost savings, but also brings about more negative consequences by shifting the fi nancial burden onto other areas.
These analyses suggest that it would be sensible for Ukraine to consider a different approach. Under such an approach, key stakeholders should fi rst agree on the benefi t levels and mechanisms to safeguard them, and discuss measures to make the system sustainable in the long-term. This process should be based on a well-informed and participatory policy dialogue and a further in-depth fi nancial and social impact assessment of the recent and proposed reforms of the Ukrainian social security system. For this purpose, international social security instruments such as the ILO Social Security Minimum Standards Convention No. 102 (1952), which Ukraine has recently engaged in ratifying, the ILO Social Protection Floors Recommendation No. 202 (2012), as well as the European Code of Social Security (1964) will serve as a framework of reference.
39
CHAP TER 3 • CONCLUSIONS
3.2. Views of social partnersThe Ukrainian social partners have expressed great concerns that the recent reforms have negatively affected the social protection system and diminished its crucial function: to ensure basic protections in adverse situations. Both employers’ organizations and trade unions have expressed their discontent with the very limited involvement of the social partners in the policy discussions. While they all understand the seriousness of the Ukrainian situation and appreciate the need for reforms and changes, they claim that many of these reforms and changes were decided without suffi cient consultation with the social partners.
Social partners did have a say in various issues, including the merger of the Temporary Incapacity Benefi ts Fund and the Employment Injury Benefi t Fund, the changed nature of the Unemployment Fund (namely the separation of the administrative operations, public employment services and the unemployment benefi t payments), as well as the reduction of the single social contribution rate.
Trade union representatives have emphasized that the recent reforms are strongly driven by the austerity measures, which reduce the social rights of workers, especially the right to an old-age pension. The trade union representatives emphasized that the reform agenda lacks a clear vision, and that information provided by the Government was scarce even for major legal acts such as the budgetary bills. This situation is exacerbated by the diminished role of the National Tripartite Social and Economic Council.
Trade unions’ central interest is the issue of unemployment. In their view, the Government is postponing its fi ght against unemployment, and is trying to retain control of the Unemployment Insurance Fund. At the same time, representatives of the unions raised the issue of the working poor, an emerging concern which has gained importance due to the decrease of the minimum wage in real terms in recent years.
Trade unions have also a critical view of the housing subsidies. In their view, this benefi t weakens the bargaining power of workers. As an alternative, they believe that the Government should pay more attention to the quality of employment and make sure that the wages are increased suffi ciently to compensate for energy price increases. Another important issue is the moratorium on labour inspection, which is seen as a way of weakening tax compliance.
Employers’ representatives share the concern for the decreasing role of social dialogue in Ukraine at the State, enterprise and sectoral levels. The creation of the Social Insurance Fund, aimed at taking over the responsibilities of two funds, was done without consultation with the social partners. Employers also argue that the payment of the fi rst fi ve days of sick leave should be covered by the Social Insurance Fund.
Employers propose a reform of the Public Employment Service, which would allow them to outsource some tasks (such as training) to private agencies. They also propose an introduction of a social health insurance system to replace the current national health system funded by the State and local budgets.
3.3. Comments on the Poverty Reduction Strategy of UkraineThe Poverty Reduction Strategy, adopted by the Government at the beginning of 2016, outlines its means and goals to be achieved by the year 2020. The Strategy is to be implemented through biennial Action Plans. The funding of the Strategy is to be secured through social security and other State resources.
40
SOCIAL SECURIT Y SYSTEM OF UKR AINE IN 2014�15 AND BE YOND
The Strategy says the deteriorating labour market situation in Ukraine has been the major factor leading to an increase in poverty in recent years. The problems with the labour market include a large infl ow of internally displaced persons, the widespread presence of the working poor and informality, and the weakness of the entrepreneurial sector. At the same time, the Strategy argues that poverty among some specifi c groups may be linked to low levels of social benefi ts. The risk of poverty is greatest in the rural areas and particularly affects children.
The Strategy concludes that the existing social benefi ts do not effectively reach the poor, and recommends the introduction of stricter targeting of social protection benefi ts. According to the 2014 data, only 30 percent of all social benefi ts reached poor individuals and 40 percent of the poor received no support, while only 25 percent of recipients could be classifi ed as poor. The Strategy also argues that the outreach of social benefi ts to the poor improved in 2014 and 2015, thanks to a stronger emphasis on targeting and the scaling down of some categorical benefi ts.
The Strategy defi nes four strategic goals. The fi rst goal is to increase access to employment and decent income from work, and to enhance social insurance coverage. This can be achieved through administrative reforms, as well as by subsidizing employment and creating preferential employment conditions for disadvantaged groups, particularly youths and persons with disabilities. The second goal is to ensure equal access to social services and benefi ts for all across the country. This is to be achieved by enhancing the effectiveness and the effi ciency of the administration of benefi ts and services at the local level, and by making improvements to infrastructure such as transportation.
The third goal involves combating poverty and the social exclusion of vulnerable groups. Here, the Strategy focuses on the better delivery of services and benefi ts to the neediest and the poorest, but also on the more effi cient administration of such policy instruments and on providing incentives for enhanced self-help. The vulnerable groups include persons with disabilities, orphans, children deprived of parental care, and persons of similar backgrounds, large families with young children, persons affected by HIV/AIDS, patients with AIDS and tuberculosis, as well as ethnic minorities.
The fourth goal is devoted to responding to the challenges facing internally displaced persons. The social security administration and relevant authorities should make adjustments to meet their specifi c needs. The problems range from the registration of internally displaced persons to the provision of housing, counselling and other services.
While the Strategy sets out an important agenda, its consequences seem ambiguous. With respect to the social benefi t policy, the main line of the strategy is to increase the targeting of social assistance benefi ts and to decentralize social assistance fi nancing. Although it sets the goal to enhance the coverage of contributory social insurance coverage through more employment opportunities, it does not suffi ciently recognize the positive aspects of universal social benefi ts in preventing poverty and the high coverage achieved.
Although the Strategy places an emphasis on employment, if a limited fi scal space inhibits proper labour market interventions, such a push to “any employment” could result in further deteriorations in job quality and the informalization of the labour market, which could in turn lead to the deprivation of social rights by limiting the access to social benefi ts.
The Strategy also assumes a major overhaul of the organization of the system, under which only a fraction would be fi nanced through donor resources. Given the fi scal conditions, such an organizational change could put an additional burden on the State budget, crowding out mainstream social benefi ts.
41
CHAP TER 3 • CONCLUSIONS
It is recommended that the policies and strategies for poverty reduction should form part of a national strategy for achieving and maintaining a comprehensive social security system in compliance with international social security standards, notably the ILO Social Security Minimum Standards Convention No. 102 (1952) and the ILO Social Protection Floors Recommendation No. 202 (2012). Such a comprehensive social security system should play a crucial role in preventing and reducing poverty.
3.4. Concluding remarks – towards effective social protection floors in UkraineTo protect the minimum benefi t levels under severe austerity measures and to fulfi l the goals of the EU Association Agreement,18 the Ukrainian Government has recently taken crucial steps forward with the strong support of both trade unions and employers’ organizations.
In 2015, the validation of the national study on the compliance of the Ukrainian social security law with ILO Convention No. 102 and the European Code of Social Security was carried out with the ILO’s technical support. In February 2016, the President of Ukraine offi cially initiated the parliamentary process to ratify all the parts of ILO Convention No. 102. The Verkhovna Rada adopted the Law on the ratifi cation of Convention No. 102 on 16 March 2016.19 The Government is also considering ratifying the European Code of Social Security. All of these actions will contribute to strengthening the Ukrainian social protection system in compliance with the ILO Recommendation No. 202 (see Box 3).
Ukraine’s ratifi cation of ILO Convention No. 102 is a major milestone in its effort to maintain a well-functioning social protection system that ensures effective access to basic health care and adequate income security for all. The ILO, together with the UN System in Ukraine, stand ready to provide further assistance in translating these standards into reality.
Box 3. Key features of the ILO Social Protec� on Floors Recommenda� on No. 202 (2012)
The ILO Social Protection Floors Recommendation No. 202 (2012) calls for ILO member states and social partners to establish as quickly as possible and maintain their social protection fl oors comprising basic social security guarantees. The guarantees should ensure at a minimum that, over the life cycle, all in need have access to essential health care and to basic income security, which together secure effective access to goods and services defi ned as necessary at the national level.
The social protection fl oors should comprise at least the following basic social security guarantees:
(a) access to a nationally defi ned set of goods and services, constituting essential health care, including maternity care, that meets the criteria of availability, accessibility, acceptability and quality;
(b) basic income security for children, at least at a nationally defi ned minimum level, providing access to nutrition, education, care and any other necessary goods and services;
18. The EU-Ukraine Association Agreement, signed on 21 March 2014, requires the Ukrainian Government to pursue the goals of “enhancing the level of social protection and modernising social protection systems, in terms of quality, accessibility, and fi nancial sustainability” (Chap 21, Art. 420 (j)).
19. The ratifi cation will enter into force 12 months following the date of registration of the formal act of ratifi cation by the ILO Director-General.
42
SOCIAL SECURIT Y SYSTEM OF UKR AINE IN 2014�15 AND BE YOND
Box 3. (con� nued)
(c) basic income security, at least at a nationally defi ned minimum level, for persons in active age who are unable to earn suffi cient income, in particular in cases of sickness, unemployment, maternity and disability; and
(d) basic income security, at least at a nationally defi ned minimum level, for older persons.
Recommendation No. 202 also requires that member states formulate and implement national social security extension strategies, based on national consultations through effective social dialogue and social participation. Such national strategies should:
(a) prioritize the implementation of social protection fl oors;
(b) seek to provide higher levels of protection to as many people as possible, refl ecting economic and fi scal capacities, and as soon as possible; and
(c) progressively build and maintain comprehensive and adequate social security systems coherent with national policy objectives and seek to coordinate social security policies with other public policies.
When formulating and implementing national social security extension strategies, countries should:
(a) set objectives refl ecting national priorities;
(b) identify gaps in, and barriers to, protection;
(c) seek to close gaps in protection through appropriate and effectively coordinated schemes, whether contributory or non-contributory, or both, including through the extension of existing contributory schemes to all concerned persons with contributory capacity;
(d) complement social security with active labour market policies, including vocational training or other measures, as appropriate;
(e) specify fi nancial requirements and resources as well as the time frame and sequencing for the progressive achievement of the objectives; and
(f) raise awareness about their social protection fl oors and their extension strategies, and undertake information programmes, including through social dialogue.
Recommendation No. 202 attaches particular importance to the role of social dialogue and to participative monitoring of social protection systems. Countries should monitor their progress in implementing social protection fl oors and achieving other objectives of national social security extension strategies through appropriate nationally defi ned mechanisms, including tripartite participation with representative organizations of employers and workers, as well as consultation with other relevant and representative organizations of persons concerned. They should regularly convene national consultations to assess progress and discuss policies for the further horizontal and vertical extension of social security.
43
REFERENCES
References
Association agreement between the European Union and its Member States, of the one part, and Ukraine, of the other part. 2014. Available at: http://eeas.europa.eu/ukraine/docs/association_agreement_ukraine_2014_en.pdf.
Baranova, N.; Hirose, K. 2010. Assessment of the social security system in Ukraine 2008–09; Crisis response and future reforms (Budapest, ILO).
Centre of Prospective Social Research of the Ministry of Social Policy of Ukraine and National Academy of Ukraine. 2014. The impact of increasing the subsistence minimum on social benefi ts (Kyiv).
Government of Ukraine. 2015. Letter of intent, memorandum of economic and fi nancial policies, and technical memorandum of understanding (attached to IMF Staff Report of August 2015).
International Labour Organization (ILO). 1951. “Social Security Minimum Standards Convention No. 102” (Geneva, ILO).
———. 2012a. “Social Protection Floors Recommendation No. 202” (Geneva, ILO).
———. 2012b. “Social Security for All” (Geneva, ILO).
———. 2012c. Ensuring social security benefi ts for Ukrainian migrant workers: Policy development and future challenges (Budapest, ILO).
———. 2015. Social security minimum standards: Proceedings of the tripartite seminar on Ukraine’s ratifi cation of the ILO Social Security Minimum Standards Convention No. 102 and the European Code of Social Security (30 June 2015) (mimeographed notes).
———. 2015. Proceedings of the tripartite workshop on the validation of the legal study on the Ukrainian social security legislation in conformity with ILO Convention No. 102 (21–22 July 2015) (mimeographed notes).
ILO, Kyiv International Institute of Sociology. 2015. Employment needs assessment and employability of internally displaced persons in Ukraine: Summary of survey fi ndings and recommendations (Kyiv).
International Monetary Fund (IMF). 2016. “Technical assistance report—Reducing social security contributions and improving the corporate and small business tax system”, IMF Country Report No. 16/25 (Washington, D.C.).
———. 2015. “Ukraine – IMF statement on the 2016 budget,” IMF Press Release No. 15/572 (18 Dec. 2015).
———. 2016. “Technical assistance report—Reducing social security contributions and improving the corporate and small business tax system”, Report No. 16/25. Available at: https://www.imf.org/external/pubs/cat/longres.aspx?sk=43648.0.
Memorandum of economic and fi nancial policies (attached to Ukraine’s Letter of intent to IMF’s Managing Director Christine Lagarde), 2015. Available at: https://www.imf.org/external/np/loi/2015/ukr/072115.pdf.
44
SOCIAL SECURIT Y SYSTEM OF UKR AINE IN 2014�15 AND BE YOND
State Statistics Service of Ukraine. 2013–2014. National social protection accounts in Ukraine (Kyiv).
———. 2013–2014. National health protection accounts in Ukraine (Kyiv).
———. 2010–2014. Ukraine in fi gures (Kyiv).
The National Strategy for Health Care Reform in Ukraine in 2015–2020. Available at: http://healthsag.org.ua/wp-content/uploads/2014/11/Strategiya_UKR.pdf.
World Bank. 2014. Ukraine – Social Security Nets Modernization Project (Washington, D.C., World Bank Group). Available at: http://www-wds.worldbank.org/external/default/WDSContentServer/WDSP/IB/2014/06/17/000470435_20140617114711/Rendered/PDF/846720PAD0P128010Box385226B00OUO090.pdf.
LegislationConstitution of Ukraine, No. 254к/96-вр of 28 June 1996 (last edition on 15 Mar. 2016). Available at: http://zakon5.rada.gov.ua/laws/show/254%D0%BA/96-%D0%B2%D1%80.
The Law of Ukraine, No. 2017-III of 5 Oct. 2000 (last edition on 7 Apr. 2012), “On State social standards and social guarantees”. Available at: http://zakon4.rada.gov.ua/laws/show/2017-14 .
The Law of Ukraine, No. 77-VIII of 28 Dec. 2014 (last edition of 1 Jan. 2015), “On amendments to some legislative acts of Ukraine on the reform of mandatory social insurance and legalization of payroll”. Available at: http://zakon4.rada.gov.ua/laws/show/77-19.
The Law of Ukraine, No. 4282-VI of 22 Dec. 2011 (last edition on 04 Dec. 2012), “On State budget in 2012”. Available at: http://zakon4.rada.gov.ua/laws/show/4282-17.
The Law of Ukraine, No. 5515-VI of 6 Dec. 2012 (last edition on 19 Dec. 2013), “On State budget in 2013”. Available at: http://zakon4.rada.gov.ua/laws/show/5515-17.
The Law of Ukraine, No. 719-VII of 16 Jan. 2014 (last edition on 31 Mar. 2016), “On State budget in 2014”. Available at: http://zakon4.rada.gov.ua/laws/show/719-18.
The Law of Ukraine, No. 80-VIII of 28 Dec. 2014 (last edition on 24 Dec. 2015), “On State budget in 2015”. Available at: http://zakon4.rada.gov.ua/laws/show/80-19.
The Law of Ukraine, No. 928-VIII of 25 Dec. 2015 (last edition on 31 Mar. 2016), “On State budget in 2016”. Available at: http://zakon4.rada.gov.ua/laws/show/928-19.
The Law of Ukraine, No. 2464-VI of 8 July 2010 (last edition on 24 Dec. 2015), “On collection and registration of the single contribution for mandatory State social insurance”. Available at: http://zakon2.rada.gov.ua/laws/show/48-2015-%D0%BF.
The Decree of the Cabinet of Ministers of Ukraine, No. 675 of 26 Nov. 2014 (last edition on 18 Feb. 2016), “On approval of the distribution proportions of single contribution for mandatory state social insurance”. Available at: http://zakon4.rada.gov.ua/laws/show/675-2014-%D0%BF.
The Decree of the Cabinet of Ministers of Ukraine, No. 48 of 30 Jan. 2015, “Some issues of distribution of single contributions for mandatory state social insurance”. Available at: http://www.profi wins.com.ua/uk/letters-and-orders/cmu/5421-48.html.
The Decree of the Cabinet of Ministers of Ukraine, No. 161-p of 16 Mar. 2016, “On poverty reduction strategy of Ukraine”. Available at: http://zakon4.rada.gov.ua/laws/show/161-2016-%D1%80.
Cabinet of Ministers of Ukraine, Draft Law No. 2775 of 5 May 2015, “On amendments to the Law of Ukraine on mandatory State social insurance”. Available at: http://w1.c1.rada.gov.ua/pls/zweb2/webproc4_1?pf3511=55015.
45
REFERENCES
Statistical databaseEUROSTAT database. Available at: http://ec.europa.eu/eurostat/statistics-explained/index.php/Main_Page.
Macroeconomic indicators of the National Bank of Ukraine. Available at: http://www.bank.gov.ua/control/en/publish/article?art_id=24038763&cat_id=47389.
Operational statistics of the Pension Fund of Ukraine in 2013-2015. Available at: http://www.pfu.gov.ua.
Operational statistics of the State Social Insurance Fund of Ukraine due to temporary disability in 2013–2015. Available at: http://www.fse.gov.ua.
Operational statistics of State Social Insurance Fund against Industrial Accident of Ukraine in 2013–2015. Available at: http://www.social.org.ua.
State Statistics Service of Ukraine. Statistical collection on social protection of Ukraine, 2014 (Kyiv). Available at: http://www.ukrstat.gov.ua.
State Statistics Service of Ukraine. Statistical collection on national health accounts 2014 (Kyiv). Available at: http://database.ukrcensus.gov.ua.
State Statistics Service of Ukraine. Statistical yearbook of Ukraine, Ukraine in fi gures, 2010 to 2014 (Kyiv). Available at: https://ukrstat.org/uk/druk/publicat/Arhiv_u/01/Arch_ukr_zb.htm.
State Statistics Service of Ukraine. Statistical collection on granting subsidies, 2014 (Express issue) (Kyiv). Available at: http://www.ukrstat.gov.ua.
State Fiscal Service of Ukraine. 2016. Data on single contributions (Kyiv). Available at: http://sfs.gov.ua/media-tsentr/novini/241445.html.