Embed Size (px)
Citation preview

SOCIAL SECURITYSOCIAL SECURITY
Lindsay Nolan
Marcus Smith
Amy Huff
Soheil Zamanianpour
Erik Sordahl

History of Social SecurityHistory of Social Security
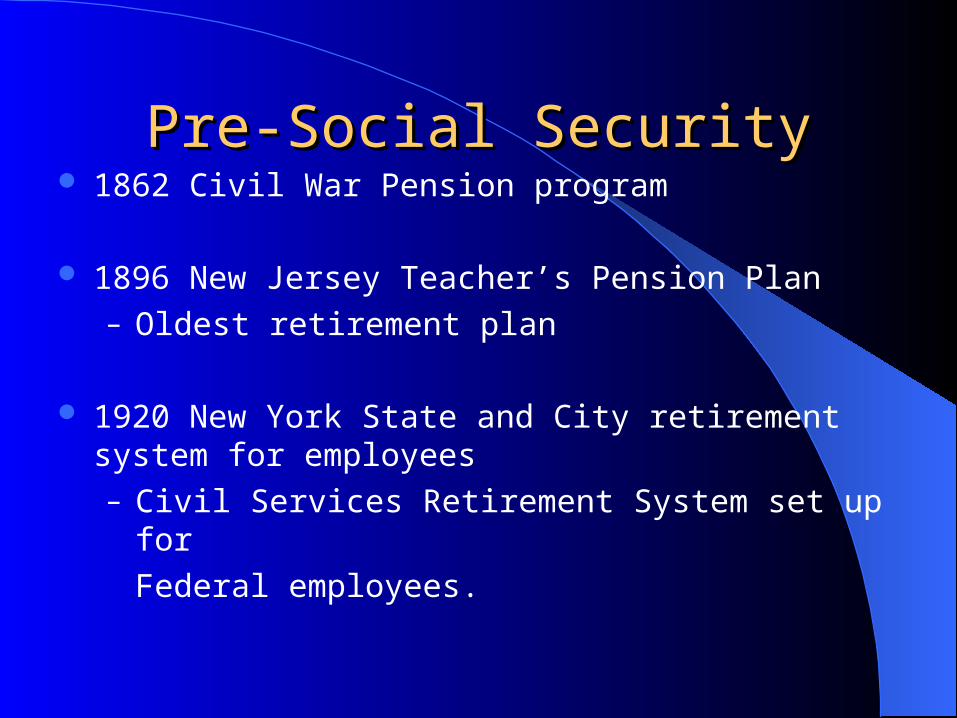
Pre-Social SecurityPre-Social Security 1862 Civil War Pension program
1896 New Jersey Teacher’s Pension Plan– Oldest retirement plan
1920 New York State and City retirement system for employees– Civil Services Retirement System set up for
Federal employees.
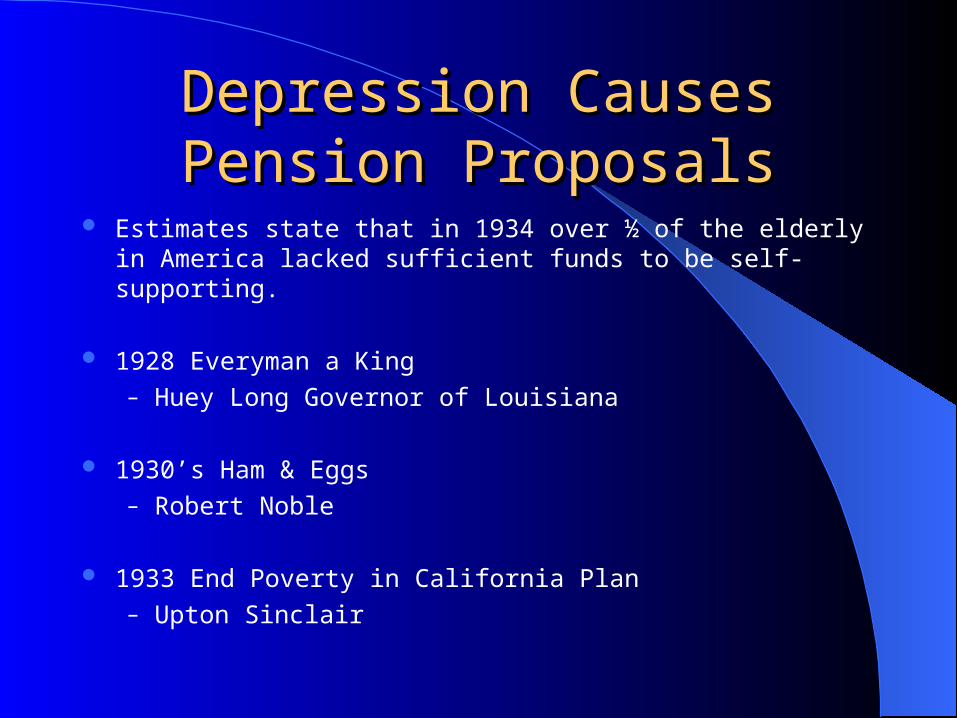
Depression Causes Pension Depression Causes Pension ProposalsProposals
Estimates state that in 1934 over ½ of the elderly in America lacked sufficient funds to be self-supporting.
1928 Everyman a King– Huey Long Governor of Louisiana
1930’s Ham & Eggs– Robert Noble
1933 End Poverty in California Plan– Upton Sinclair
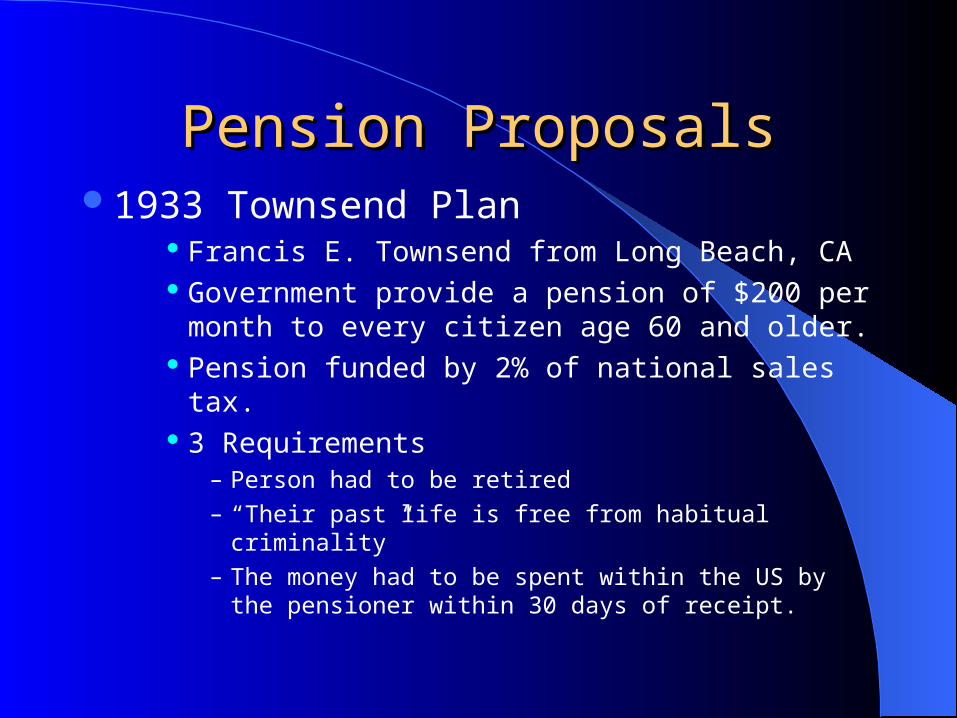
Pension ProposalsPension Proposals1933 Townsend Plan
Francis E. Townsend from Long Beach, CA Government provide a pension of $200 per month to
every citizen age 60 and older. Pension funded by 2% of national sales tax. 3 Requirements
– Person had to be retired
– “Their past life is free from habitual criminality”
– The money had to be spent within the US by the pensioner within 30 days of receipt.
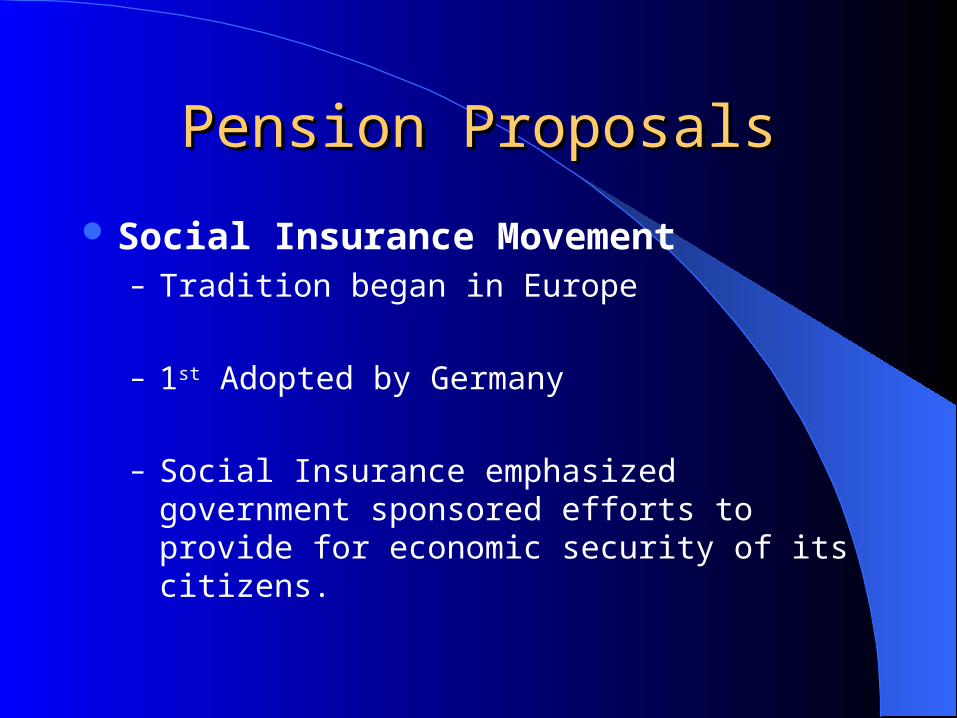
Pension ProposalsPension Proposals
Social Insurance Movement– Tradition began in Europe
– 1st Adopted by Germany
– Social Insurance emphasized government sponsored efforts to provide for economic security of its citizens.
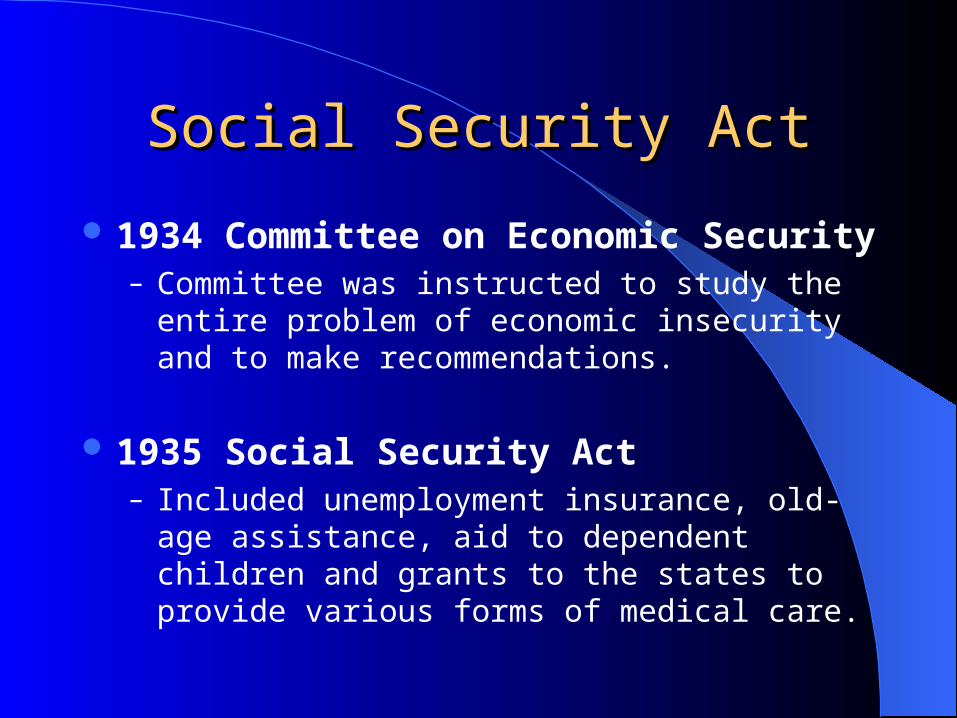
Social Security ActSocial Security Act
1934 Committee on Economic Security– Committee was instructed to study the entire problem
of economic insecurity and to make recommendations.
1935 Social Security Act– Included unemployment insurance, old-age assistance,
aid to dependent children and grants to the states to provide various forms of medical care.
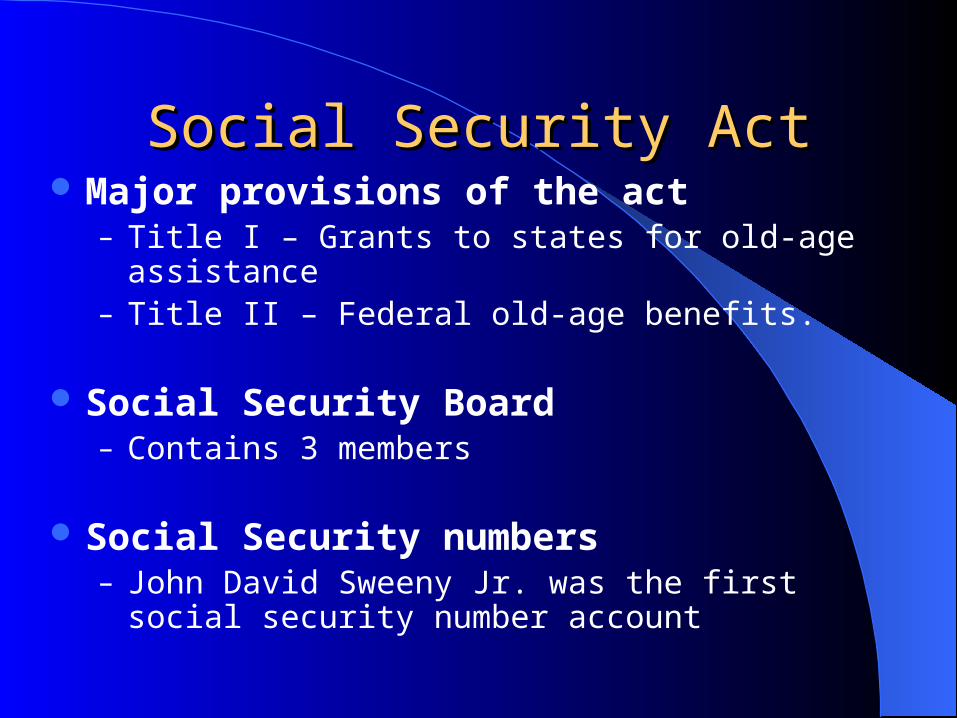
Social Security ActSocial Security Act Major provisions of the act
– Title I – Grants to states for old-age assistance– Title II – Federal old-age benefits.
Social Security Board– Contains 3 members
Social Security numbers– John David Sweeny Jr. was the first social security number
account
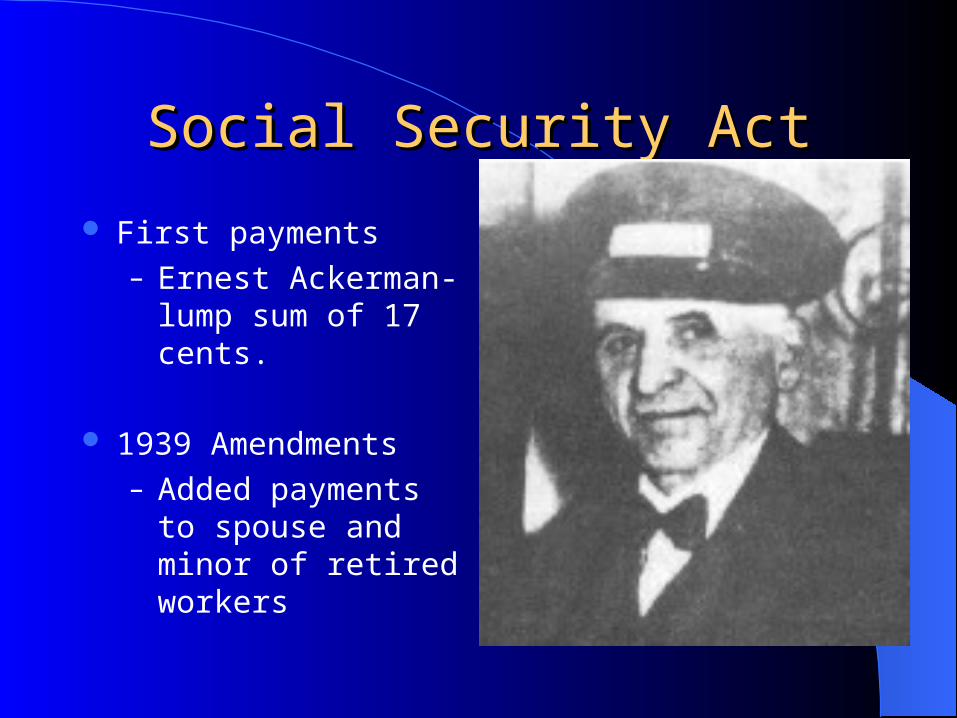
Social Security ActSocial Security Act
First payments– Ernest Ackerman-lump
sum of 17 cents.
1939 Amendments– Added payments to
spouse and minor of retired workers
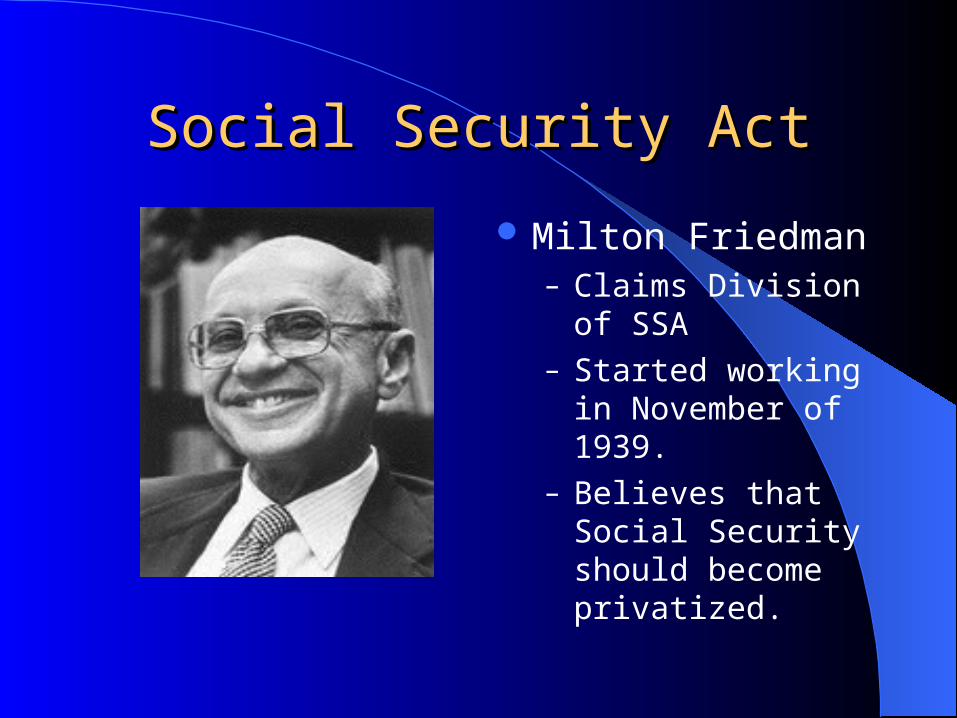
Social Security ActSocial Security Act
Milton Friedman– Claims Division of
SSA– Started working in
November of 1939.– Believes that Social
Security should become privatized.
Social Security ActSocial Security Act
1950 Amendments– Increased benefits for existing beneficiaries– COLA’s-cost of living allowances– Disability-1954 President Eisenhower
Medicare and other changes– Amendments of 1961 lowered the age at which men are
first eligible for old-age insurance– Medicare bill signed on July 30th, 1965 by President
Lyndon Johnson
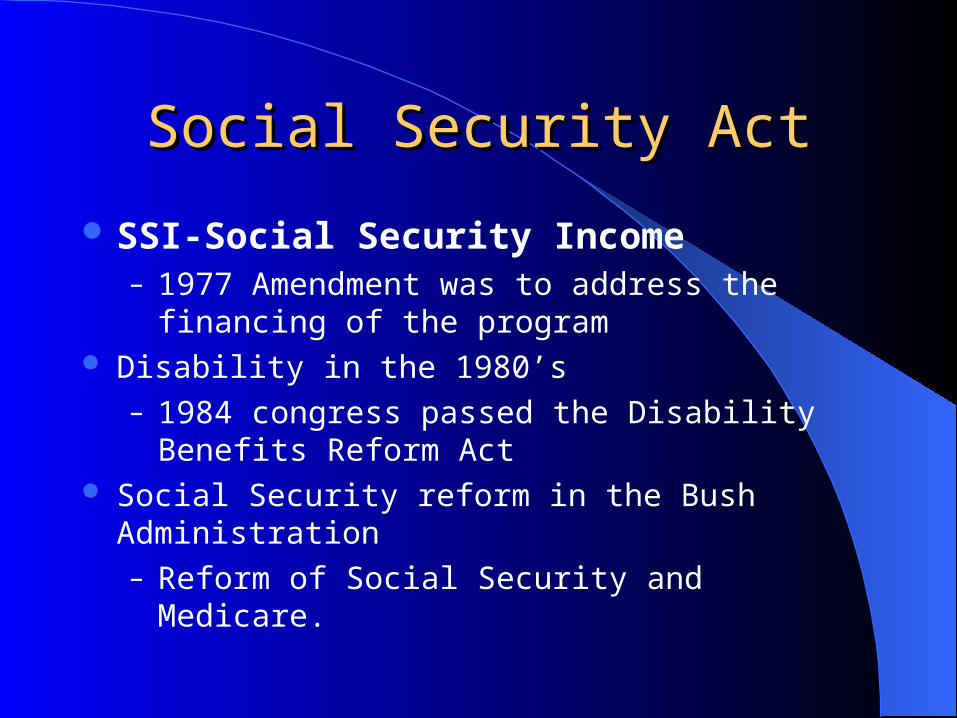
Social Security ActSocial Security Act
SSI-Social Security Income– 1977 Amendment was to address the financing of the
program Disability in the 1980’s
– 1984 congress passed the Disability Benefits Reform Act
Social Security reform in the Bush Administration– Reform of Social Security and Medicare.

Benefits and AdministrationBenefits and Administration
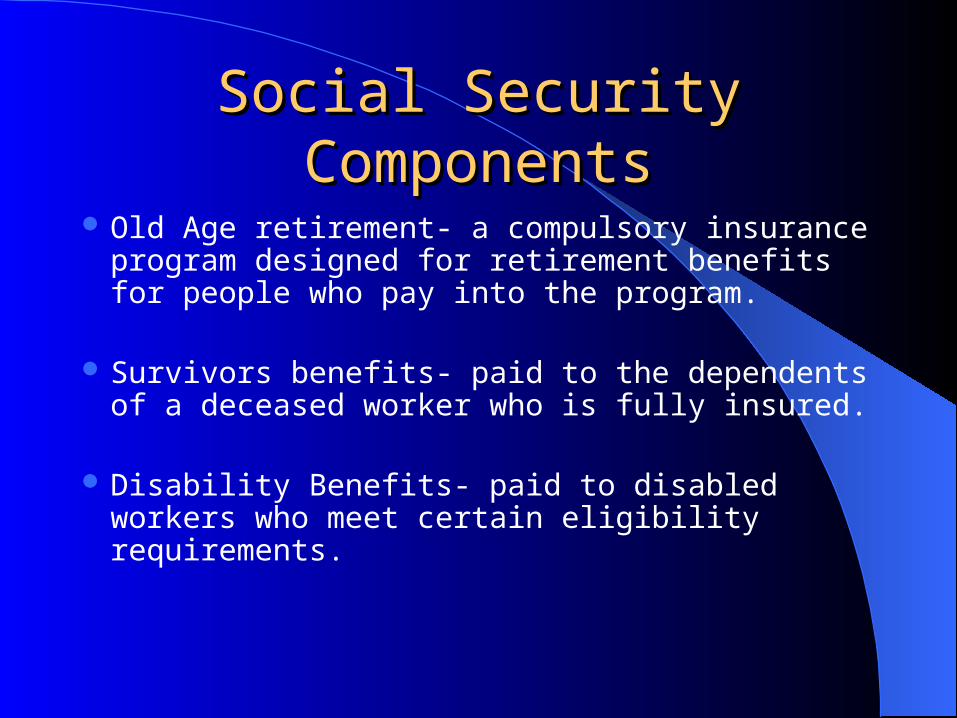
Social Security ComponentsSocial Security Components
Old Age retirement- a compulsory insurance program designed for retirement benefits for people who pay into the program.
Survivors benefits- paid to the dependents of a deceased worker who is fully insured.
Disability Benefits- paid to disabled workers who meet certain eligibility requirements.
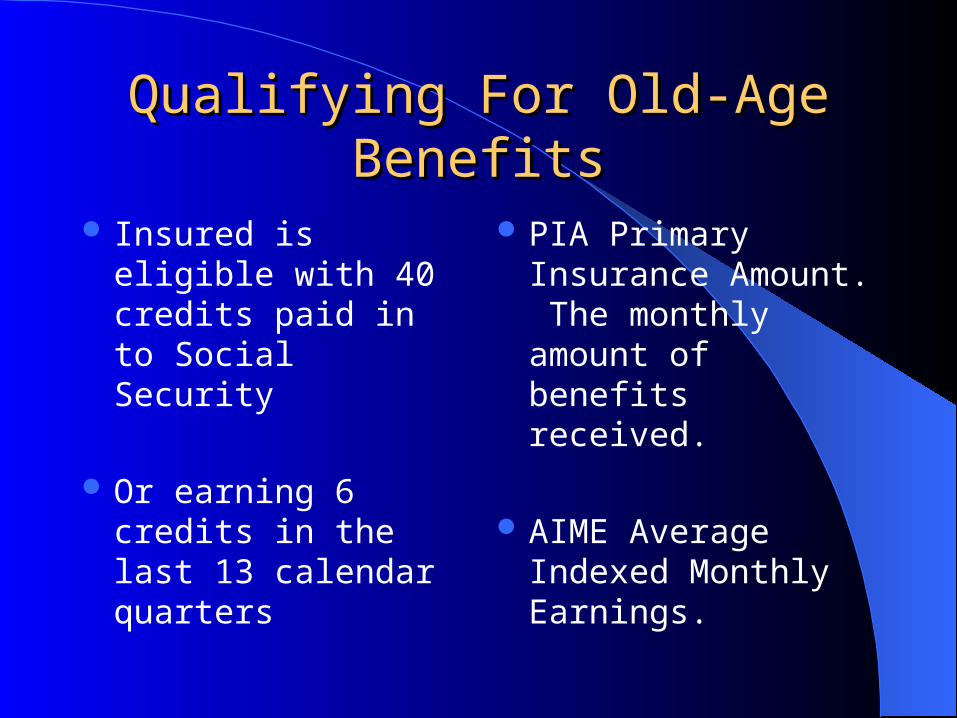
Qualifying For Old-Age BenefitsQualifying For Old-Age Benefits
Insured is eligible with 40 credits paid in to Social Security
Or earning 6 credits in the last 13 calendar quarters
PIA Primary Insurance Amount. The monthly amount of benefits received.
AIME Average Indexed Monthly Earnings.
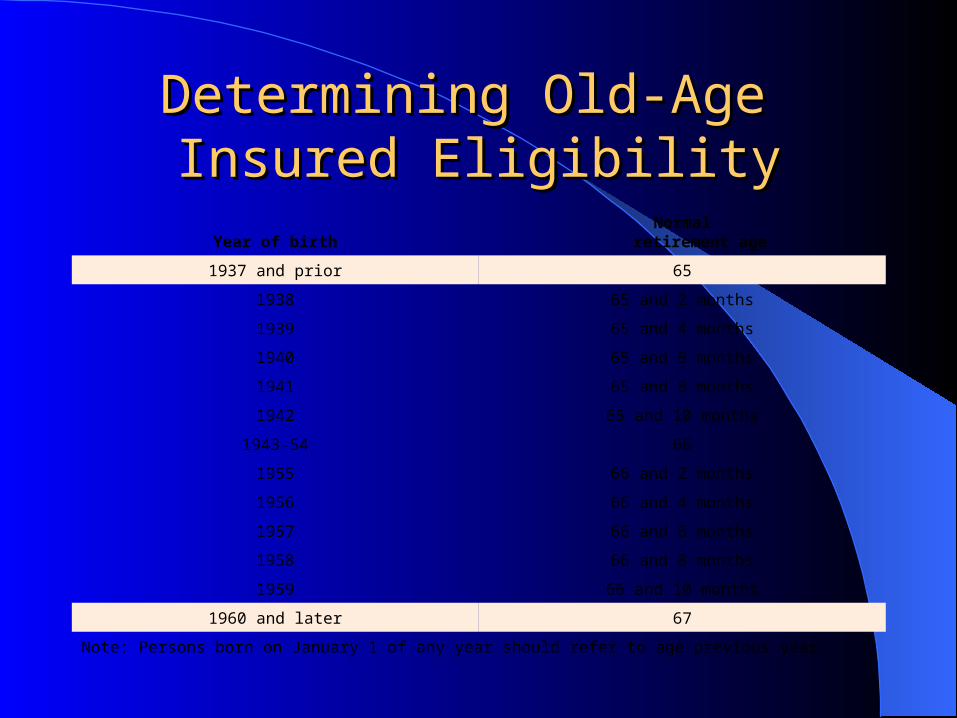
Determining Old-Age Determining Old-Age Insured EligibilityInsured Eligibility
Year of birthNormal
retirement age
1937 and prior 65
1938 65 and 2 months
1939 65 and 4 months
1940 65 and 6 months
1941 65 and 8 months
1942 65 and 10 months
1943-54 66
1955 66 and 2 months
1956 66 and 4 months
1957 66 and 6 months
1958 66 and 8 months
1959 66 and 10 months
1960 and later 67
Note: Persons born on January 1 of any year should refer to age previous year.
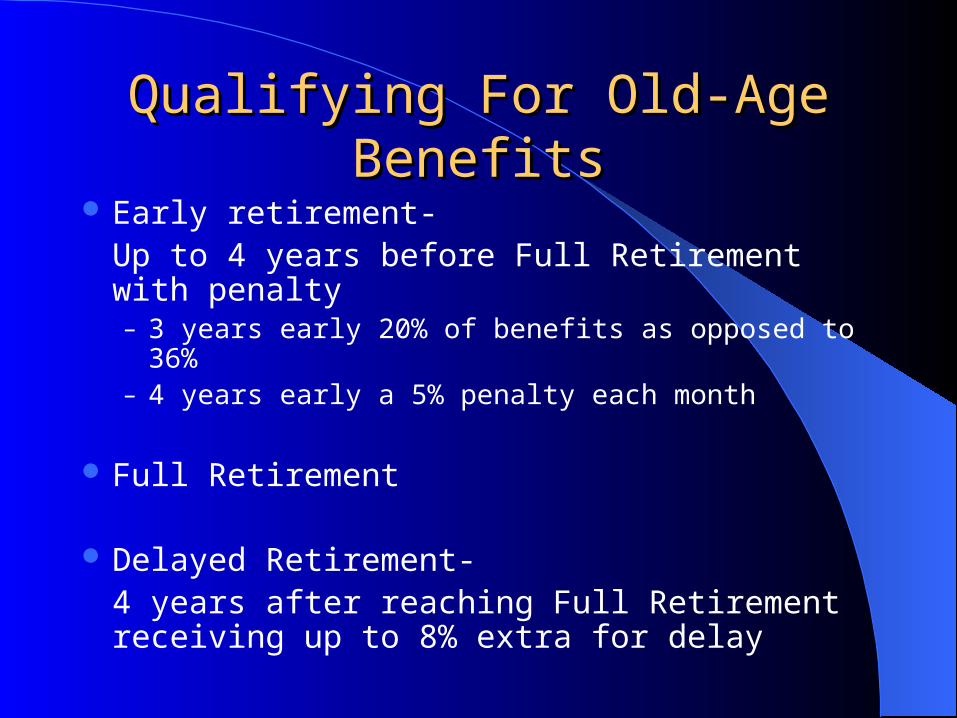
Qualifying For Old-Age BenefitsQualifying For Old-Age Benefits
Early retirement- Up to 4 years before Full Retirement with penalty – 3 years early 20% of benefits as opposed to 36%– 4 years early a 5% penalty each month
Full Retirement
Delayed Retirement- 4 years after reaching Full Retirement receiving up to 8% extra for delay

www.ssa.govwww.ssa.gov
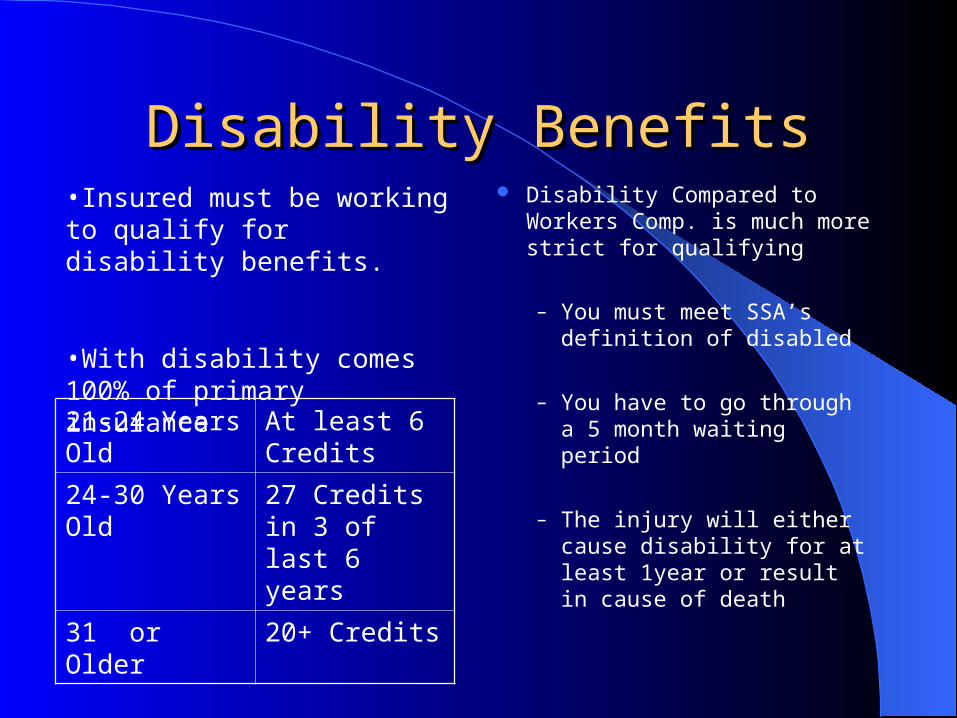
Disability BenefitsDisability Benefits Disability Compared to
Workers Comp. is much more strict for qualifying
– You must meet SSA’s definition of disabled
– You have to go through a 5 month waiting period
– The injury will either cause disability for at least 1year or result in cause of death
21-24 Years Old At least 6 Credits
24-30 Years Old 27 Credits in 3 of last 6 years
31 or Older 20+ Credits
•Insured must be working to qualify for disability benefits.
•With disability comes 100% of primary insurance
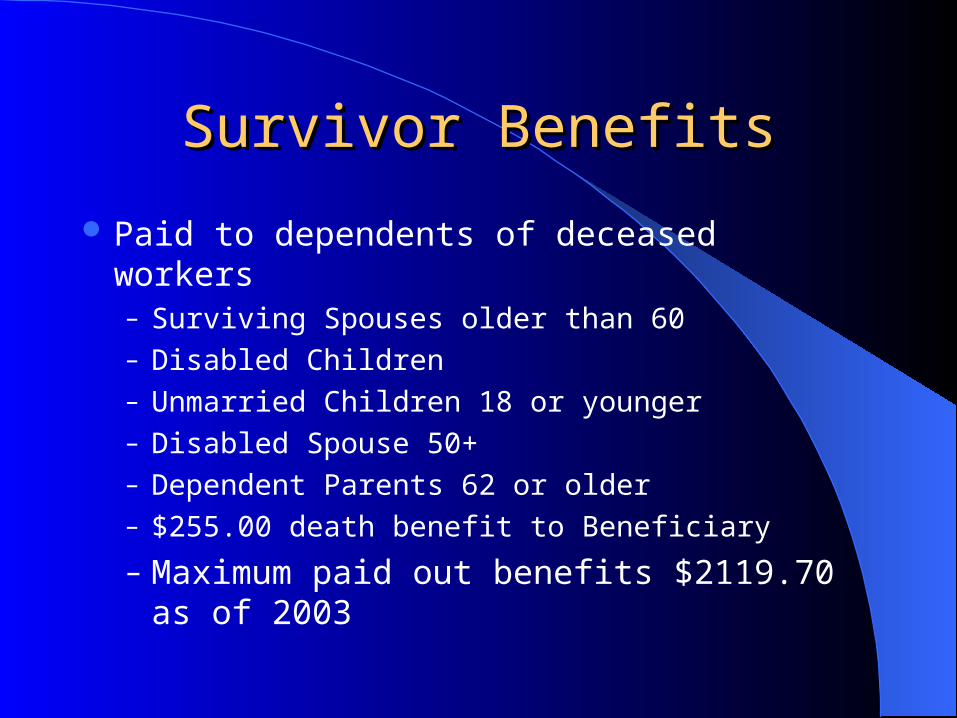
Survivor BenefitsSurvivor Benefits
Paid to dependents of deceased workers– Surviving Spouses older than 60– Disabled Children– Unmarried Children 18 or younger– Disabled Spouse 50+– Dependent Parents 62 or older– $255.00 death benefit to Beneficiary
– Maximum paid out benefits $2119.70 as of 2003
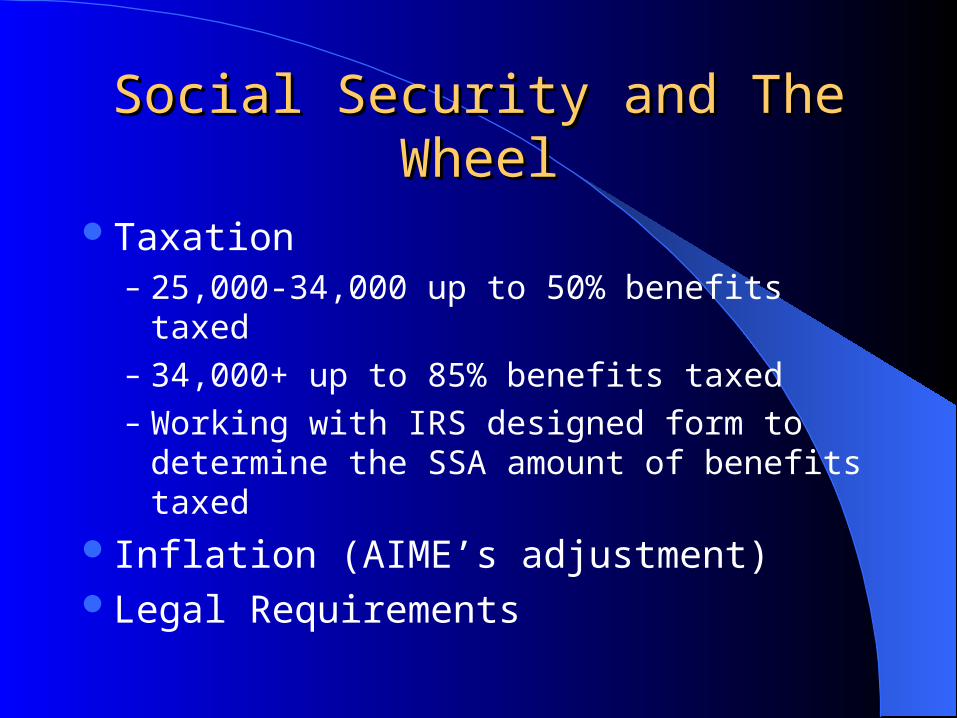
Social Security and The WheelSocial Security and The Wheel
Taxation– 25,000-34,000 up to 50% benefits taxed– 34,000+ up to 85% benefits taxed– Working with IRS designed form to determine
the SSA amount of benefits taxed
Inflation (AIME’s adjustment)Legal Requirements

Social Security TodaySocial Security Today
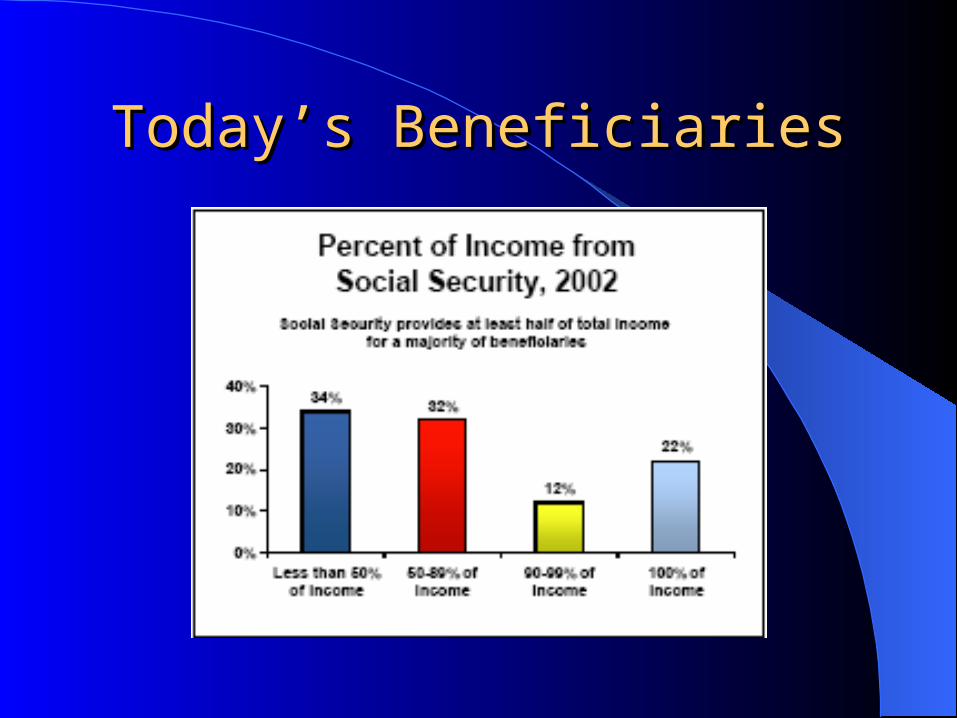
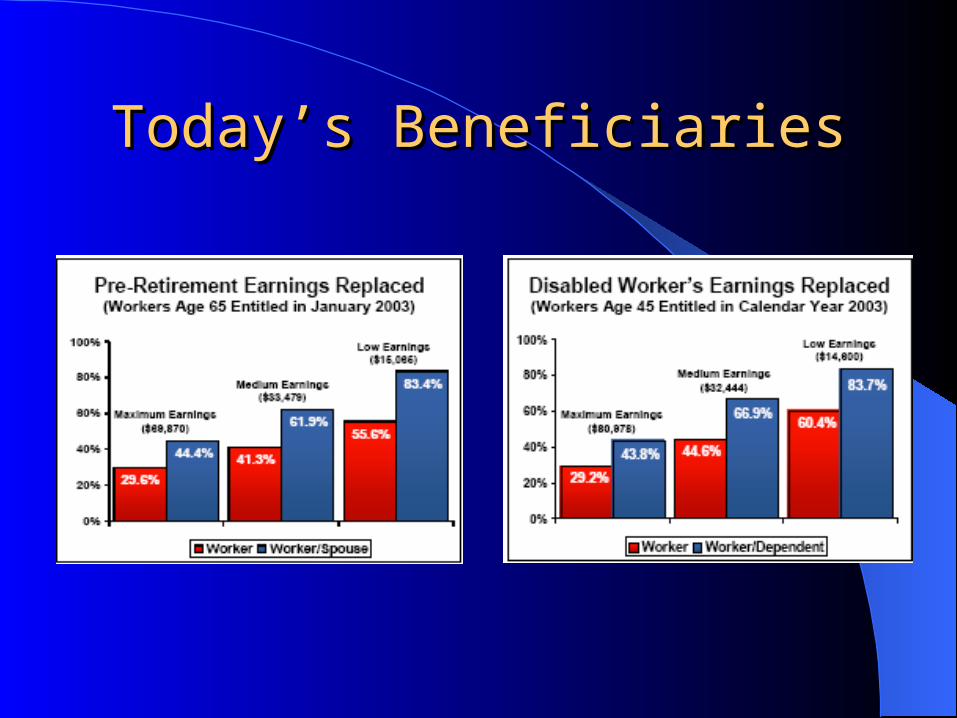
Today’s BeneficiariesToday’s Beneficiaries
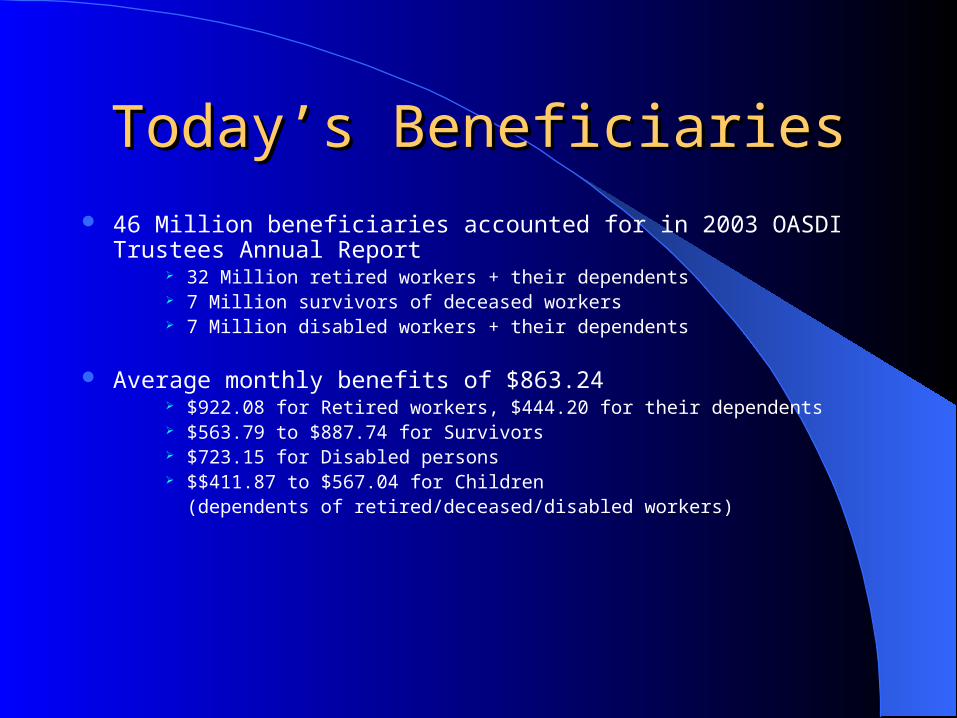
46 Million beneficiaries accounted for in 2003 OASDI Trustees Annual Report
32 Million retired workers + their dependents 7 Million survivors of deceased workers 7 Million disabled workers + their dependents
Average monthly benefits of $863.24 $922.08 for Retired workers, $444.20 for their dependents $563.79 to $887.74 for Survivors $723.15 for Disabled persons $$411.87 to $567.04 for Children
(dependents of retired/deceased/disabled workers)
Today’s BeneficiariesToday’s Beneficiaries
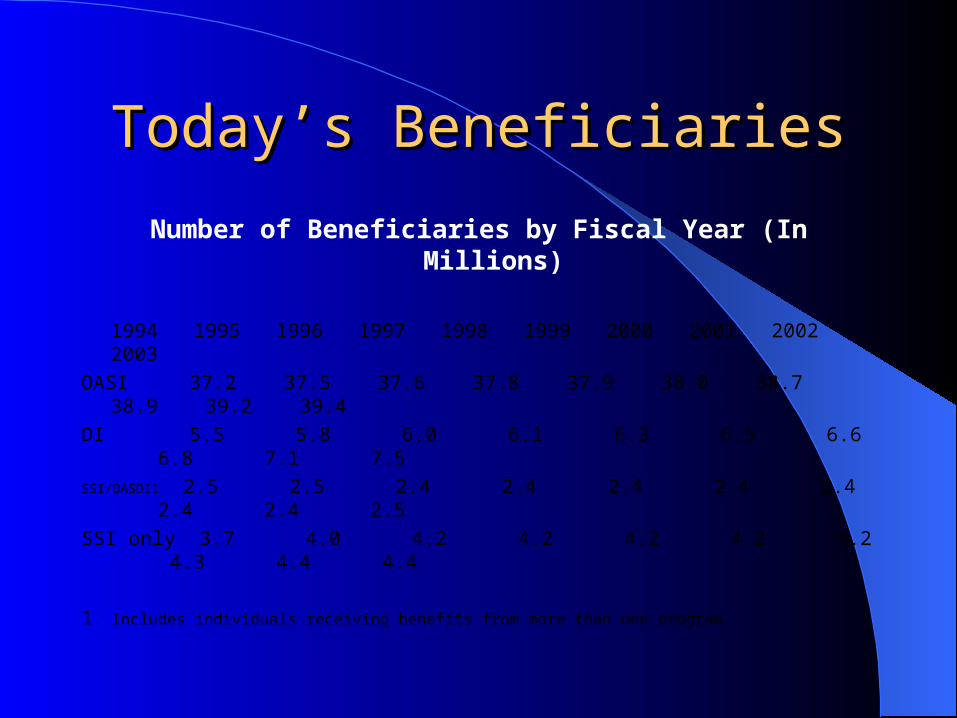
Number of Beneficiaries by Fiscal Year (In Millions)
1994 1995 1996 1997 1998 1999 2000 2001 2002 2003
OASI 37.2 37.5 37.6 37.8 37.9 38.0 38.7 38.9 39.2 39.4
DI 5.5 5.8 6.0 6.1 6.3 6.5 6.6 6.8 7.1 7.5
SSI/OASDI1 2.5 2.5 2.4 2.4 2.4 2.4 2.4 2.4 2.4 2.5
SSI only 3.7 4.0 4.2 4.2 4.2 4.2 4.2 4.3 4.4 4.4
1. Includes individuals receiving benefits from more than one program.
Today’s BeneficiariesToday’s Beneficiaries
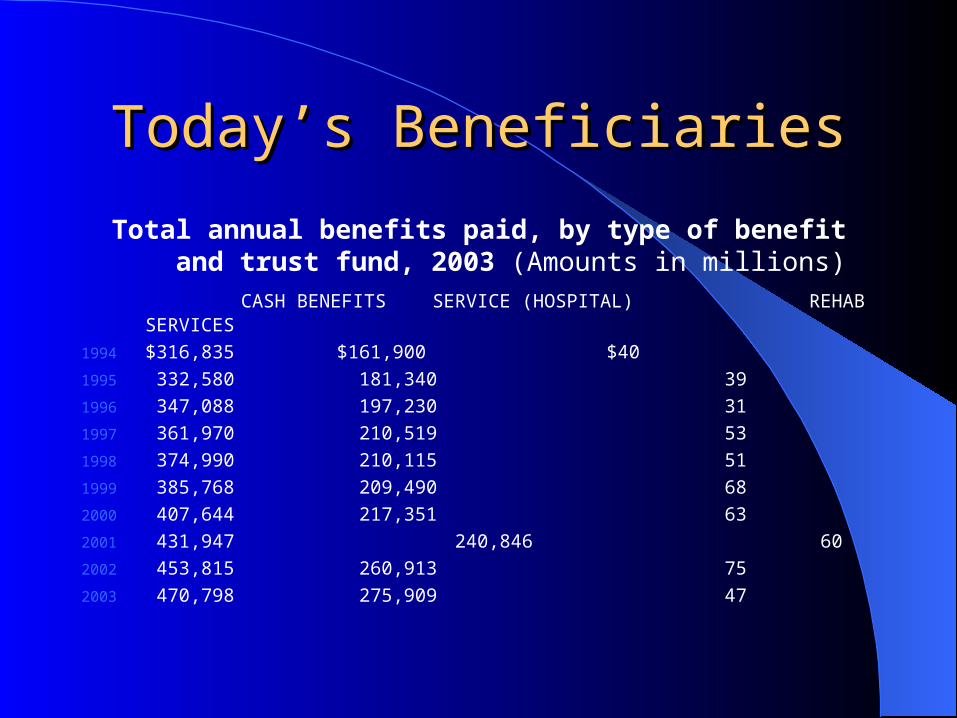
Total annual benefits paid, by type of benefit and trust fund, 2003 (Amounts in millions)
CASH BENEFITS SERVICE (HOSPITAL) REHAB SERVICES
1994 $316,835 $161,900 $40
1995 332,580 181,340 39
1996 347,088 197,230 31
1997 361,970 210,519 53
1998 374,990 210,115 51
1999 385,768 209,490 68
2000 407,644 217,351 63
2001 431,947 240,846 60
2002 453,815 260,913 75
2003 470,798 275,909 47
Today’s BeneficiariesToday’s Beneficiaries
Today’s beneficiaries treat Social Security as a sort of Financial Safety Net
Workers rely solely on these benefits for their
future financial needs
Social Security treated as most important form of savings
and most valuable financial asset
Today’s BeneficiariesToday’s Beneficiaries
Today’s BeneficiariesToday’s Beneficiaries
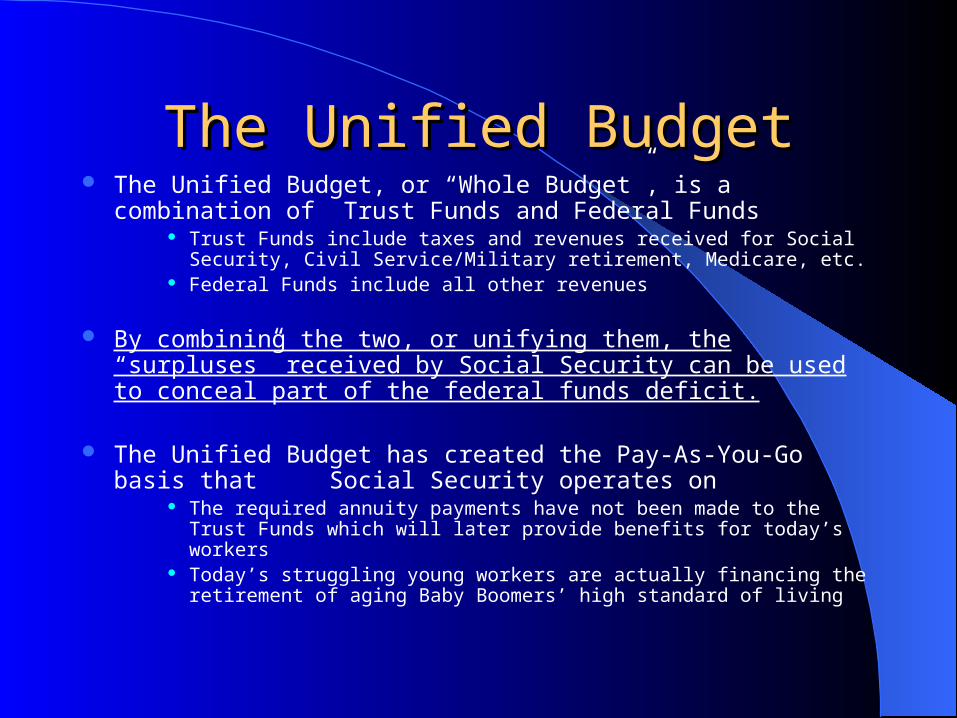
The Unified BudgetThe Unified Budget The Unified Budget, or “Whole Budget”, is a combination of Trust
Funds and Federal Funds Trust Funds include taxes and revenues received for Social Security, Civil
Service/Military retirement, Medicare, etc. Federal Funds include all other revenues
By combining the two, or unifying them, the “surpluses” received by Social Security can be used to conceal part of the federal funds deficit.
The Unified Budget has created the Pay-As-You-Go basis that Social Security operates on
The required annuity payments have not been made to the Trust Funds which will later provide benefits for today’s workers
Today’s struggling young workers are actually financing the retirement of aging Baby Boomers’ high standard of living

Strategic Plan of the Strategic Plan of the Social Security AdministrationSocial Security Administration
“Advance the economic security of the nation’s people through compassionate and vigilant
leadership in shaping and managing America’s social security programs.”

Strategic Plan of theStrategic Plan of theSocial Security AdministrationSocial Security Administration
GOALS:1) Deliver high-quality, citizen-centered service
2) Ensure superior stewardship of Social Security programs and resources
3) Achieve sustainable solvency and ensure Social Security programs meet the needs of current and future generations
4) Manage and align staff to support the Administration’s mission.
Problems With The Social Security System
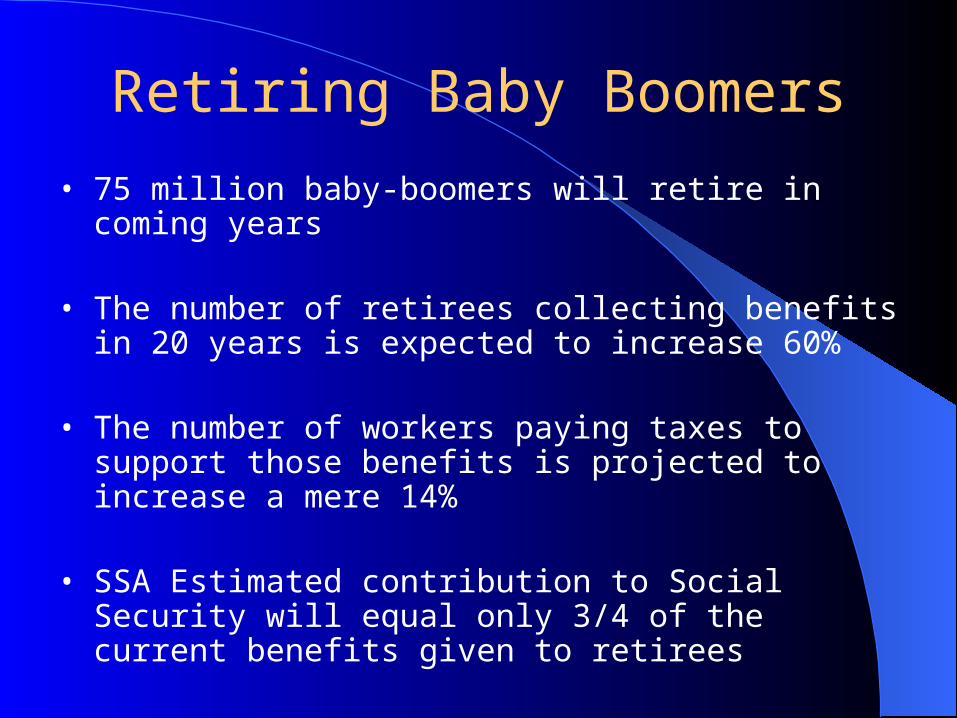
Retiring Baby Boomers
• 75 million baby-boomers will retire in coming years
• The number of retirees collecting benefits in 20 years is expected to increase 60%
• The number of workers paying taxes to support those benefits is projected to increase a mere 14%
• SSA Estimated contribution to Social Security will equal only 3/4 of the current benefits given to retirees
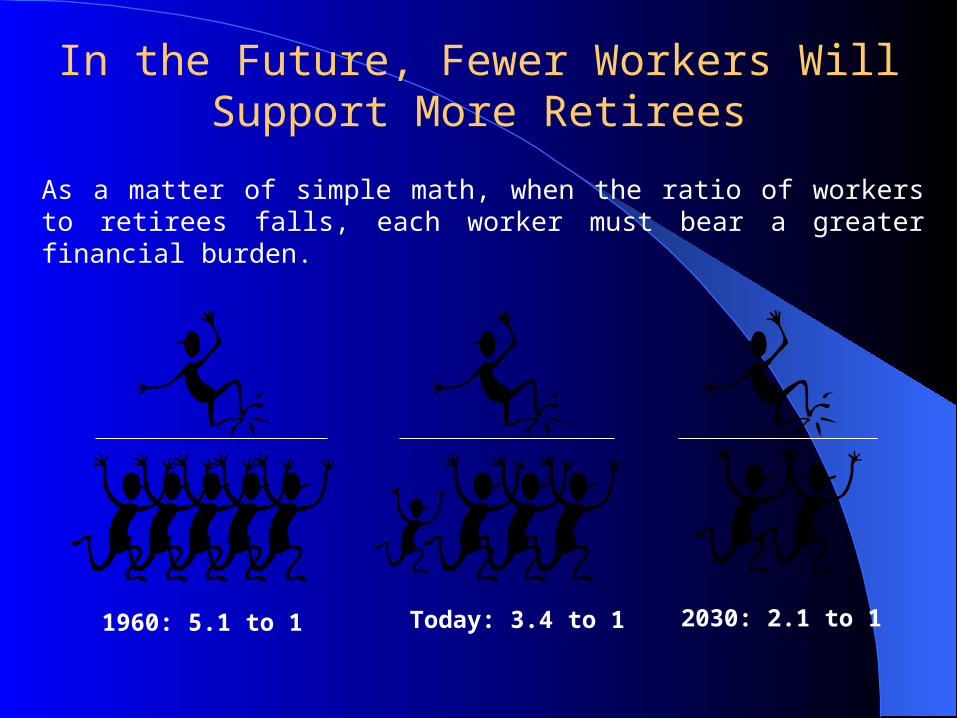
In the Future, Fewer Workers Will Support More Retirees
1960: 5.1 to 1 Today: 3.4 to 1 2030: 2.1 to 1
As a matter of simple math, when the ratio of workers to retirees falls, each worker must bear a greater financial burden.
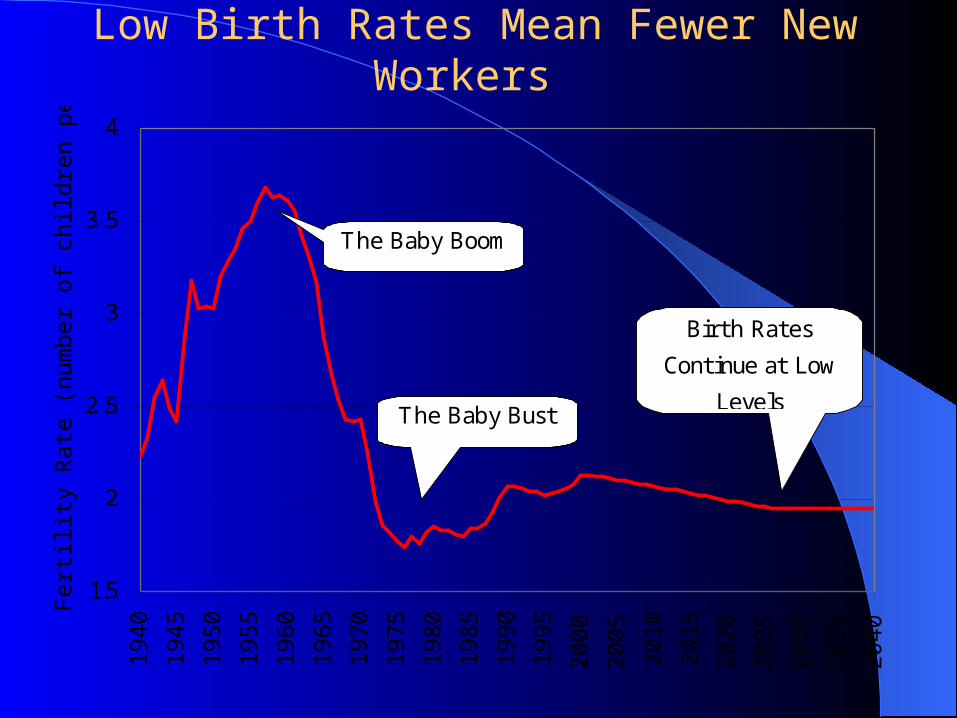
Low Birth Rates Mean Fewer New Workers
1.5
2
2.5
3
3.5
41940
1945
1950
1955
1960
1965
1970
1975
1980
1985
1990
1995
2000
2005
2010
2015
2020
2025
2030
2035
2040
Fert
ilit
y R
ate
(num
ber
of
childre
n p
er
wom
an)
The Baby Boom
The Baby Bust
Birth Rates
Continue at Low
Levels
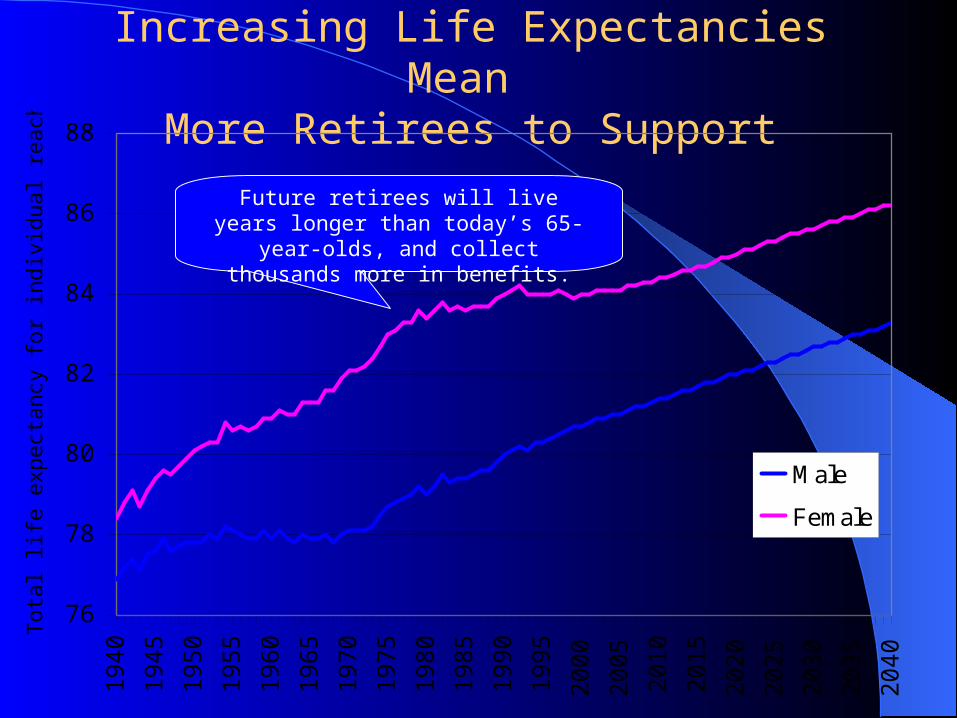
Increasing Life Expectancies Mean More Retirees to Support
76
78
80
82
84
86
881940
1945
1950
1955
1960
1965
1970
1975
1980
1985
1990
1995
2000
2005
2010
2015
2020
2025
2030
2035
2040
Tota
l life
expect
ancy
for
indiv
idual re
ach
ing a
ge 6
5
Male
Female
Future retirees will live years longer than today’s 65-year-olds, and
collect thousands more in benefits.
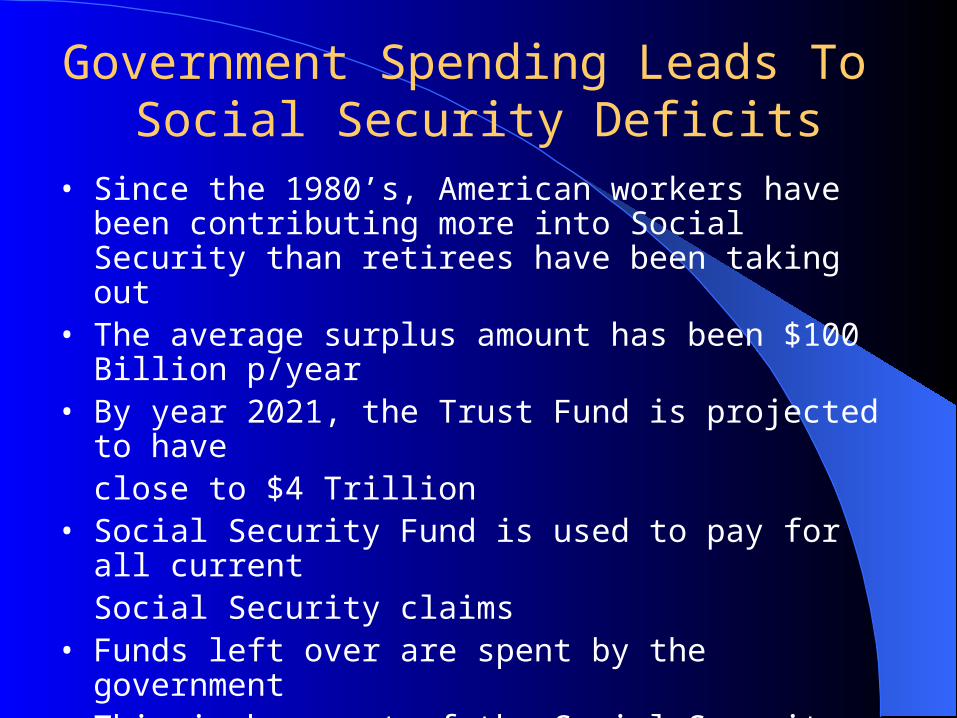
Government Spending Leads To Social Security Deficits
• Since the 1980’s, American workers have been contributing more into Social Security than retirees have been taking out
• The average surplus amount has been $100 Billion p/year
• By year 2021, the Trust Fund is projected to have close to $4 Trillion
• Social Security Fund is used to pay for all current Social Security claims
• Funds left over are spent by the government• This is how part of the Social Security deficit is formed
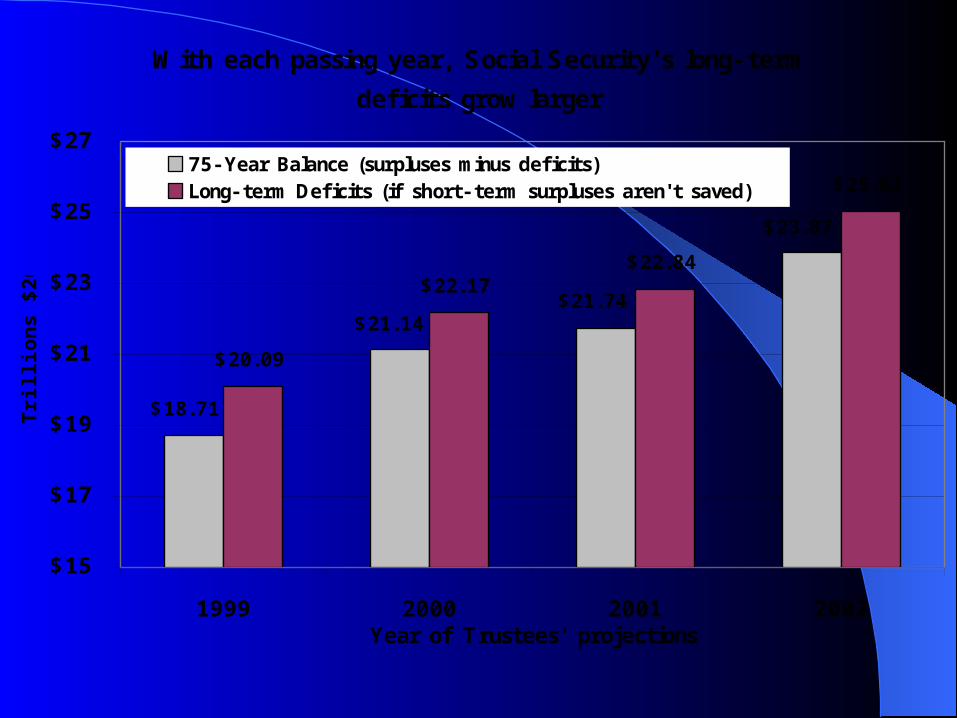
With each passing year, Social Security's long- term
deficits grow larger
$20.09
$22.17$22.84
$25.03
$23.87
$21.74$21.14
$18.71
$15
$17
$19
$21
$23
$25
$27
1999 2000 2001 2002Year of Trustees' projections
Trillion
s $
20
02
75- Year Balance (surpluses minus deficits)Long- term Deficits (if short- term surpluses aren't saved)
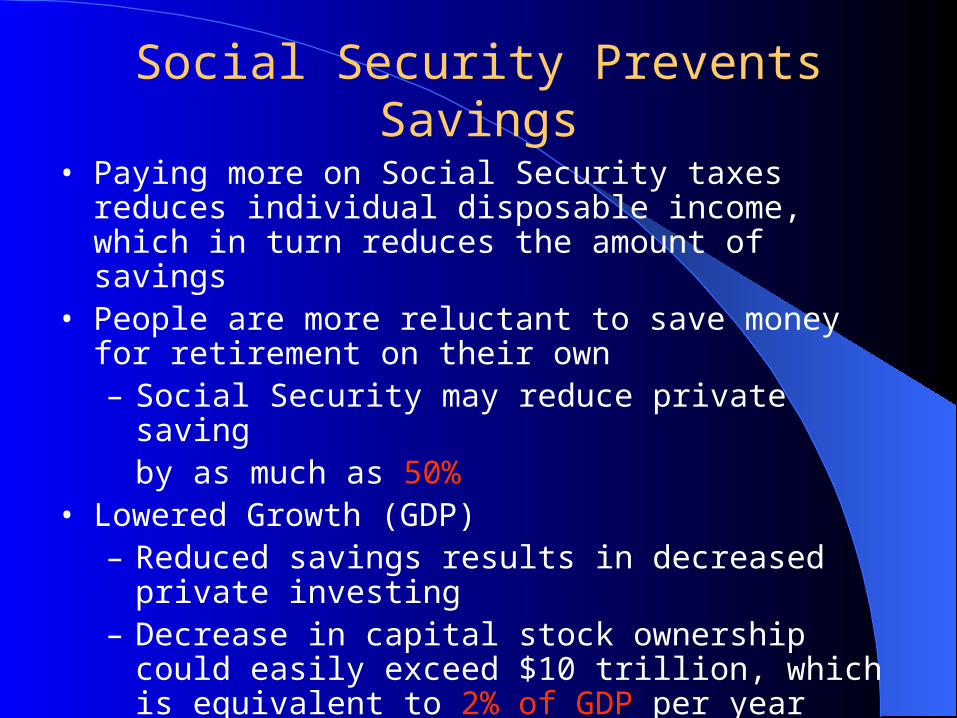
Social Security Prevents Savings
• Paying more on Social Security taxes reduces individual disposable income, which in turn reduces the amount of savings
• People are more reluctant to save money for retirement on their own– Social Security may reduce private saving
by as much as 50% • Lowered Growth (GDP)
– Reduced savings results in decreased private investing
– Decrease in capital stock ownership could easily exceed $10 trillion, which is equivalent to 2% of GDP per year
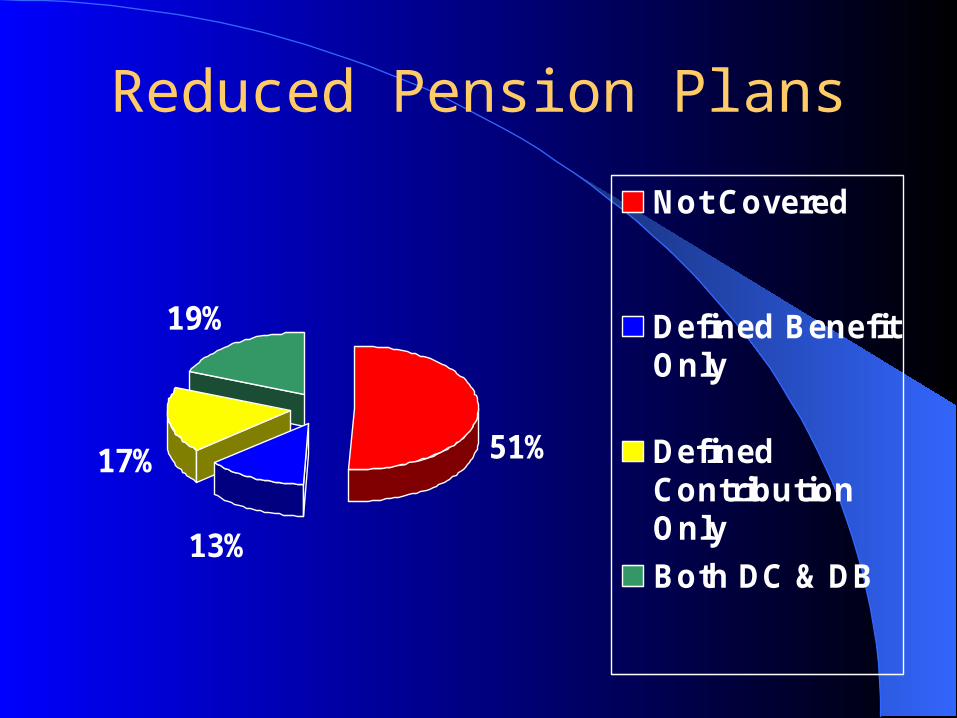
Reduced Pension Plans
51%
13%
17%
19%
Not Covered
Defined BenefitOnly
DefinedContributionOnly
Both DC & DB
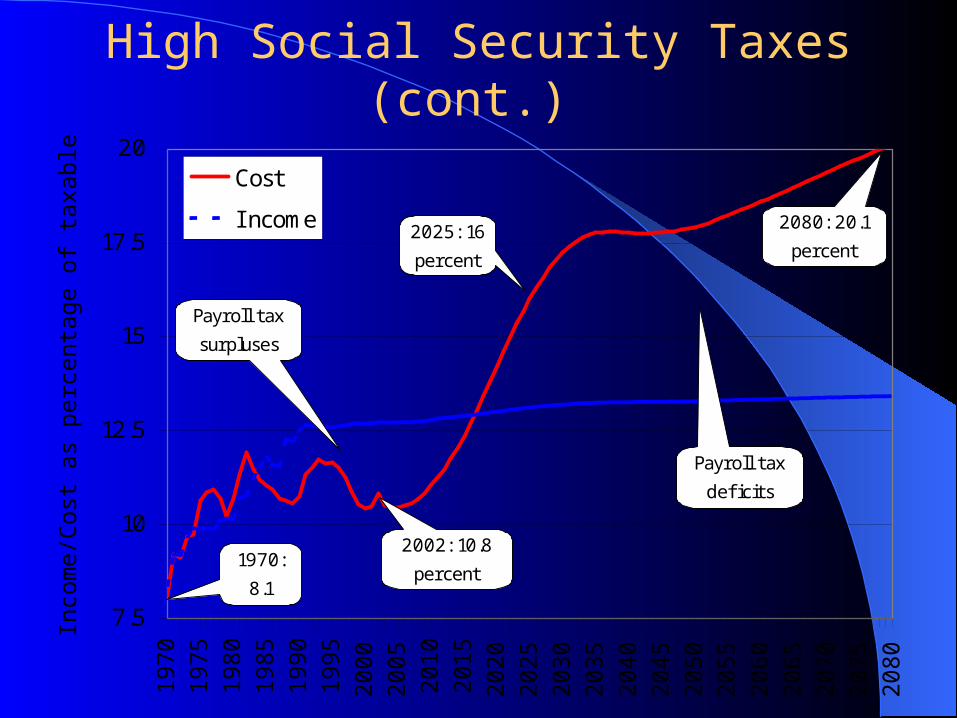
High Social Security Taxes (cont.)
7.5
10
12.5
15
17.5
201970
1975
1980
1985
1990
1995
2000
2005
2010
2015
2020
2025
2030
2035
2040
2045
2050
2055
2060
2065
2070
2075
2080
Inco
me/C
ost
as
perc
enta
ge o
f ta
xable
payro
ll
Cost
I ncome
1970:
8.1
2002: 10.8
percent
2025: 16
percent
2080: 20.1
percent
Payroll tax
surpluses
Payroll tax
deficits
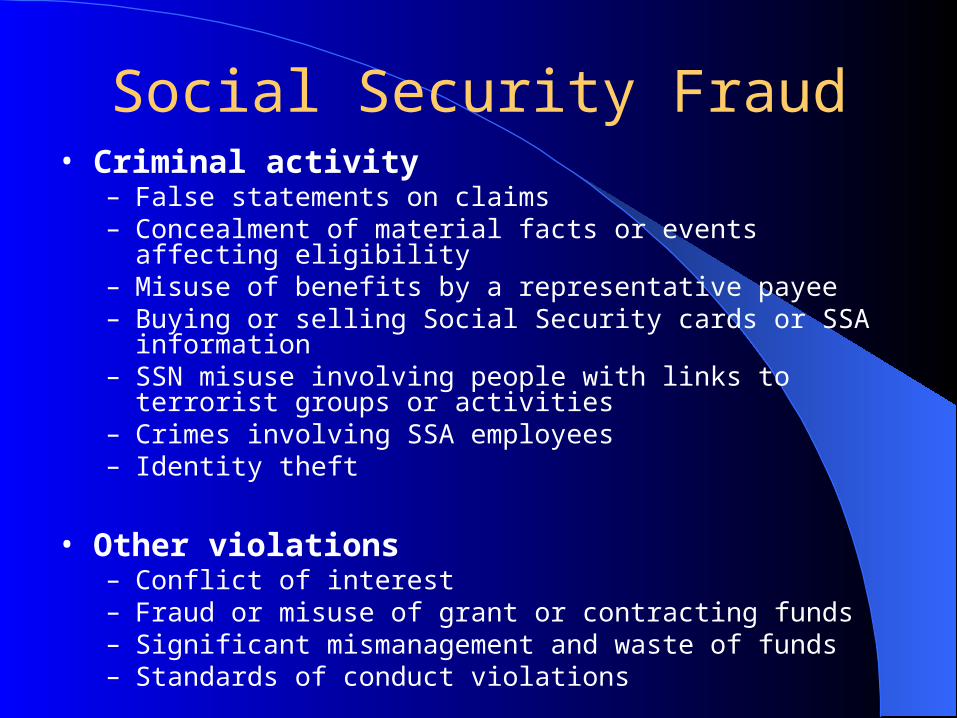
Social Security Fraud• Criminal activity
– False statements on claims– Concealment of material facts or events affecting eligibility– Misuse of benefits by a representative payee– Buying or selling Social Security cards or SSA information– SSN misuse involving people with links to terrorist groups or
activities– Crimes involving SSA employees– Identity theft
• Other violations– Conflict of interest– Fraud or misuse of grant or contracting funds– Significant mismanagement and waste of funds– Standards of conduct violations
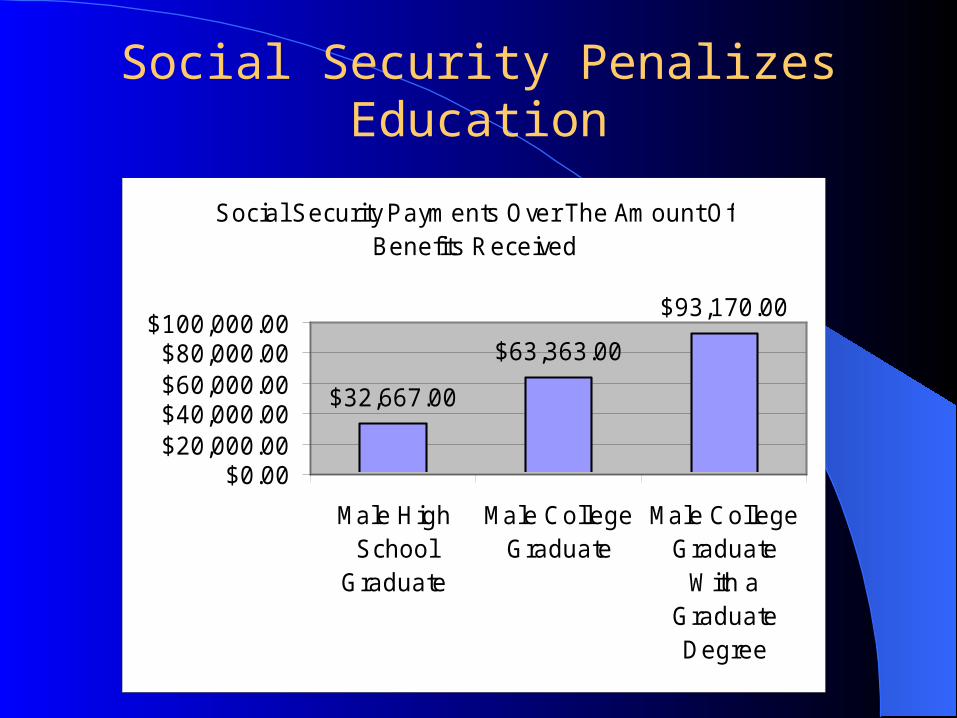
Social Security Penalizes Education
Social Security Paym ents Over The Am ount Of Benefits Received
$32,667.00
$63,363.00
$93,170.00
$0.00$20,000.00$40,000.00$60,000.00$80,000.00
$100,000.00
Male HighSchool
Graduate
Male CollegeGraduate
Male CollegeGraduate
With aGraduateDegree
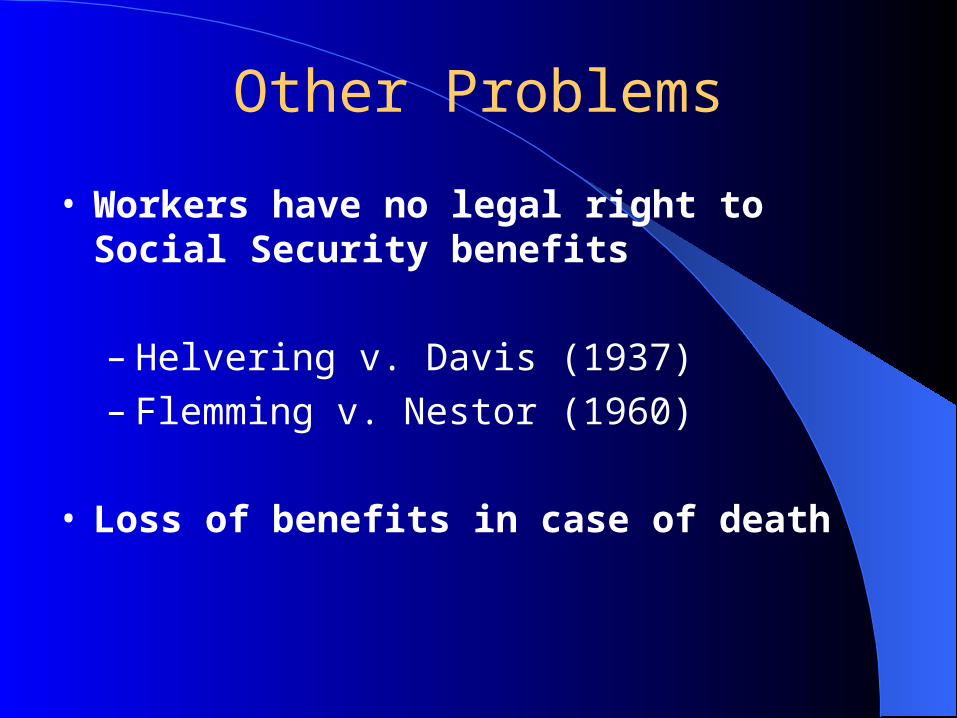
Other Problems
• Workers have no legal right to Social Security benefits
– Helvering v. Davis (1937)– Flemming v. Nestor (1960)
• Loss of benefits in case of death
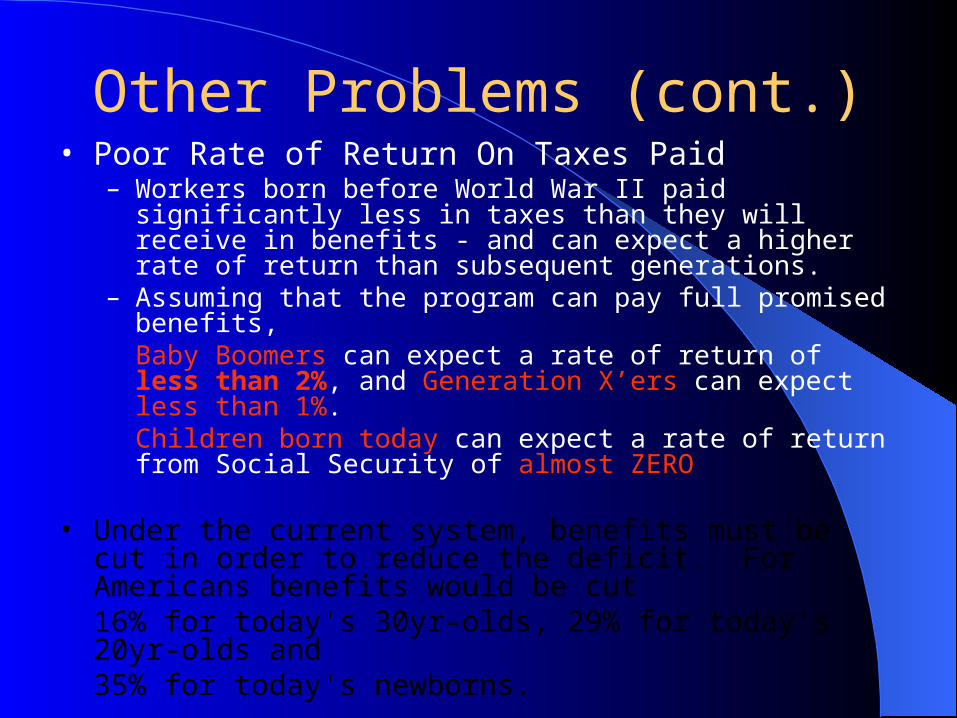
Other Problems (cont.)• Poor Rate of Return On Taxes Paid
– Workers born before World War II paid significantly less in taxes than they will receive in benefits - and can expect a higher rate of return than subsequent generations.
– Assuming that the program can pay full promised benefits, Baby Boomers can expect a rate of return of less than 2%, and Generation X’ers can expect less than 1%. Children born today can expect a rate of return from Social Security of almost ZERO
• Under the current system, benefits must be cut in order to reduce the deficit. For Americans benefits would be cut 16% for today's 30yr-olds, 29% for today's 20yr-olds and 35% for today's newborns.
• The only other options under the current system is to raise taxes or the retirement age even more
Social Security ReformSocial Security Reform
Why Pay into a Fund We May Never See?

Solution: PrivatizationSolution: Privatization
The ability to choose your investment portfolio instead of putting money into Social
Security
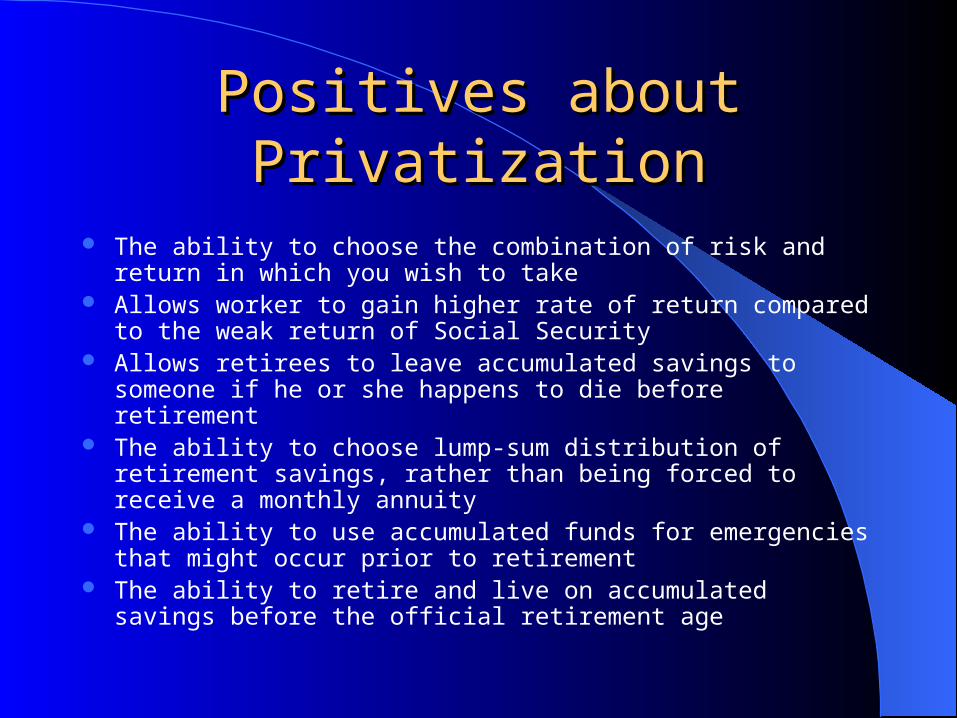
Positives about PrivatizationPositives about Privatization
The ability to choose the combination of risk and return in which you wish to take
Allows worker to gain higher rate of return compared to the weak return of Social Security
Allows retirees to leave accumulated savings to someone if he or she happens to die before retirement
The ability to choose lump-sum distribution of retirement savings, rather than being forced to receive a monthly annuity
The ability to use accumulated funds for emergencies that might occur prior to retirement
The ability to retire and live on accumulated savings before the official retirement age
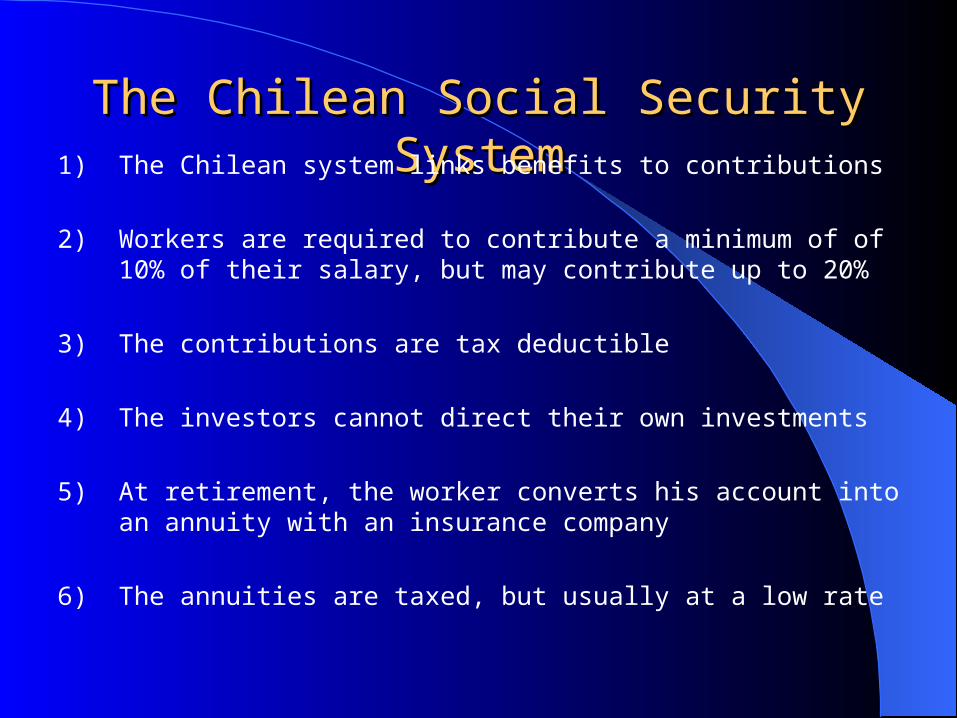
The Chilean Social Security SystemThe Chilean Social Security System1) The Chilean system links benefits to contributions
2) Workers are required to contribute a minimum of of 10% of their salary, but may contribute up to 20%
3) The contributions are tax deductible
4) The investors cannot direct their own investments
5) At retirement, the worker converts his account into an annuity with an insurance company
6) The annuities are taxed, but usually at a low rate
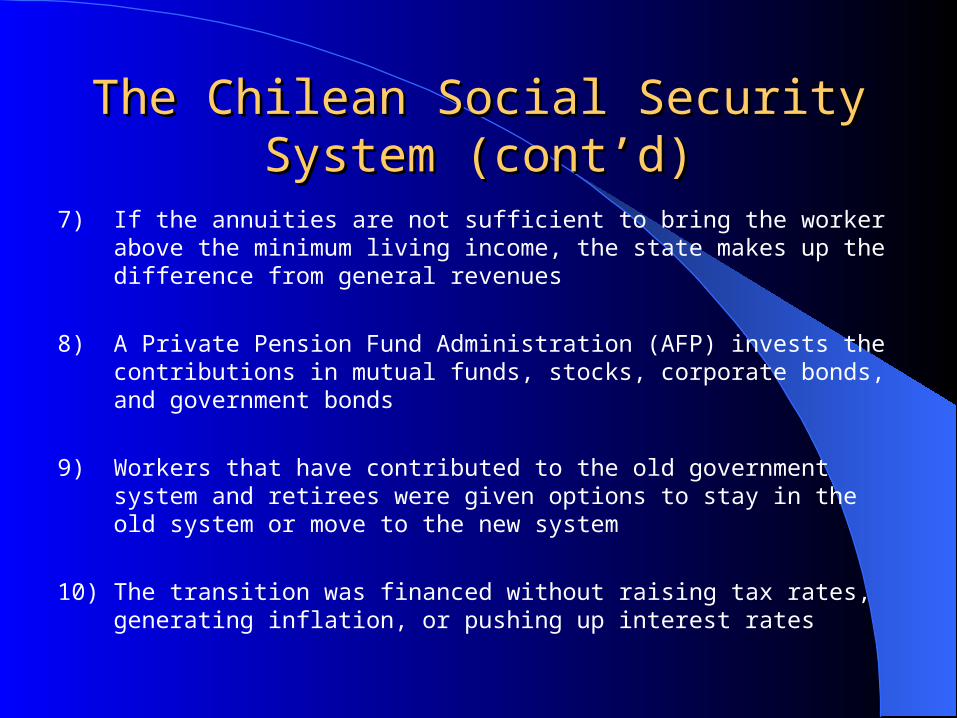
The Chilean Social Security System The Chilean Social Security System (cont’d)(cont’d)
7) If the annuities are not sufficient to bring the worker above the minimum living income, the state makes up the difference from general revenues
8) A Private Pension Fund Administration (AFP) invests the contributions in mutual funds, stocks, corporate bonds, and government bonds
9) Workers that have contributed to the old government system and retirees were given options to stay in the old system or move to the new system
10) The transition was financed without raising tax rates, generating inflation, or pushing up interest rates
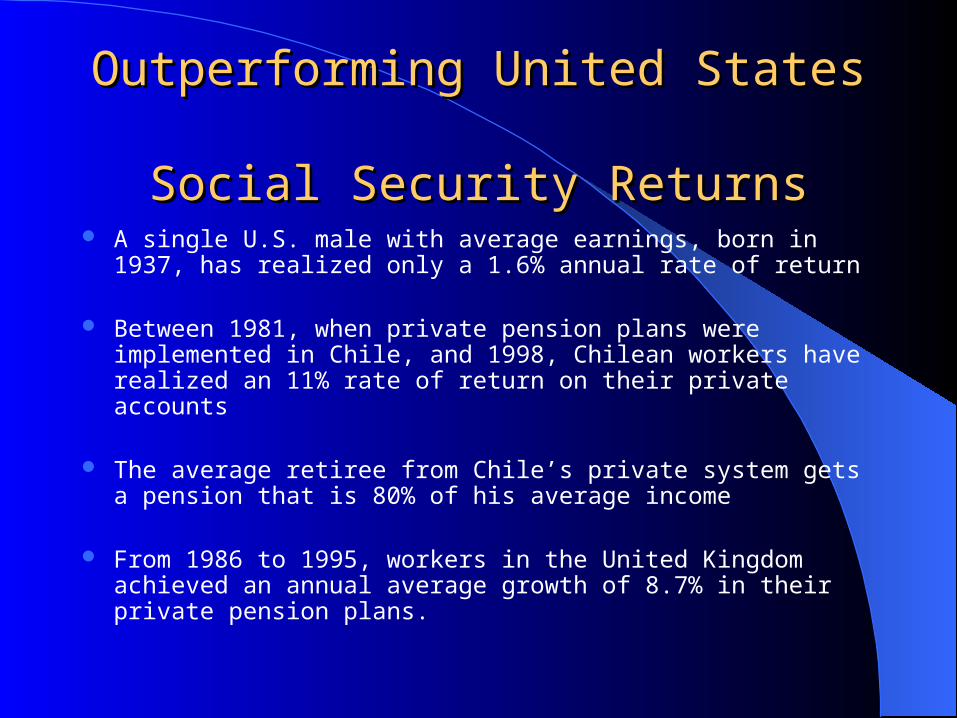
Outperforming United States Outperforming United States Social Security ReturnsSocial Security Returns
A single U.S. male with average earnings, born in 1937, has realized only a 1.6% annual rate of return
Between 1981, when private pension plans were implemented in Chile, and 1998, Chilean workers have realized an 11% rate of return on their private accounts
The average retiree from Chile’s private system gets a pension that is 80% of his average income
From 1986 to 1995, workers in the United Kingdom achieved an annual average growth of 8.7% in their private pension plans.
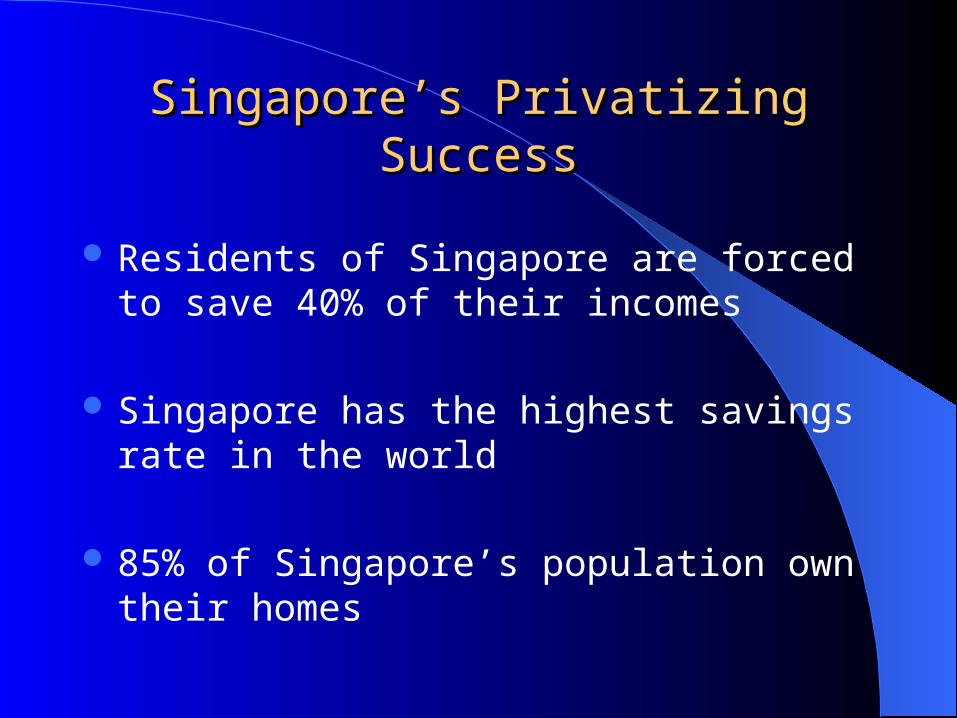
Singapore’s Privatizing SuccessSingapore’s Privatizing Success
Residents of Singapore are forced to save 40% of their incomes
Singapore has the highest savings rate in the world
85% of Singapore’s population own their homes
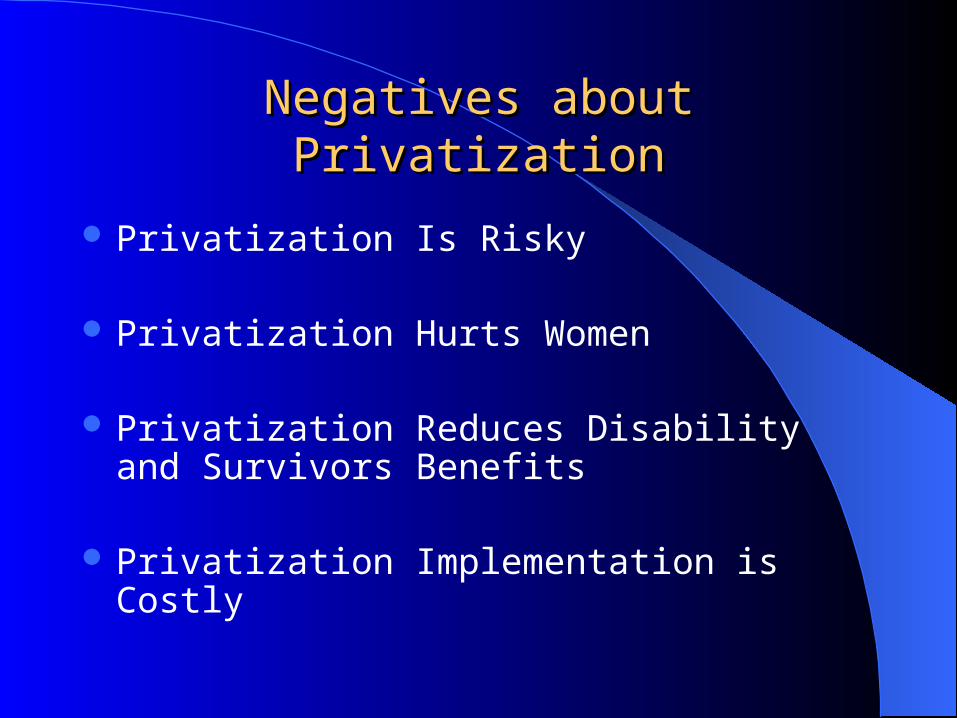
Negatives about PrivatizationNegatives about Privatization
Privatization Is Risky
Privatization Hurts Women
Privatization Reduces Disability and Survivors Benefits
Privatization Implementation is Costly
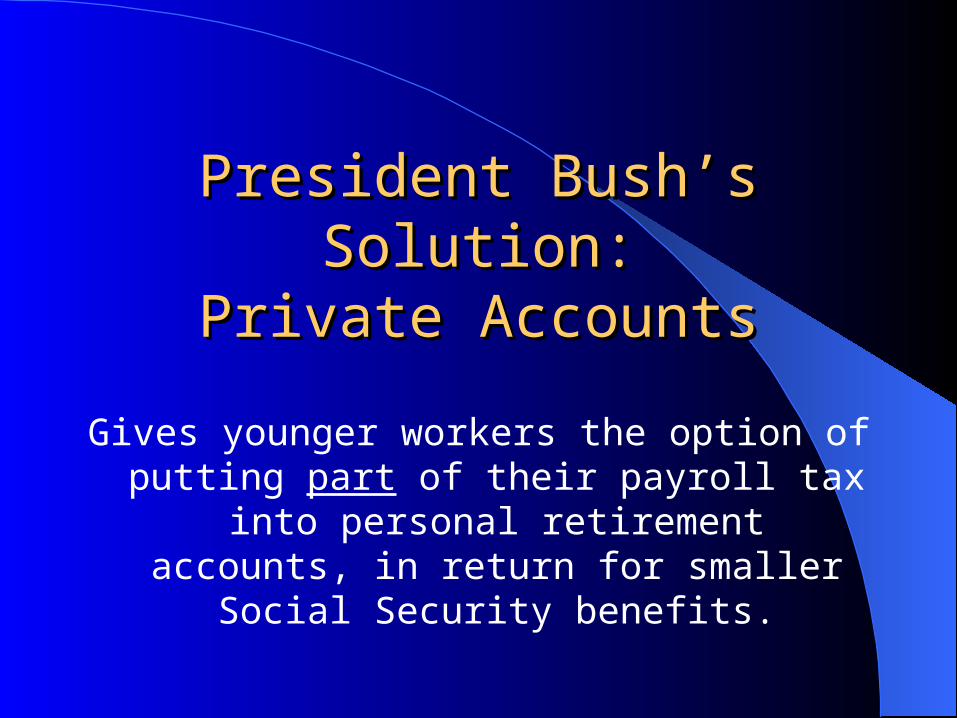
President Bush’s Solution:President Bush’s Solution:Private AccountsPrivate Accounts
Gives younger workers the option of putting part of their payroll tax into personal retirement accounts,
in return for smaller Social Security benefits.
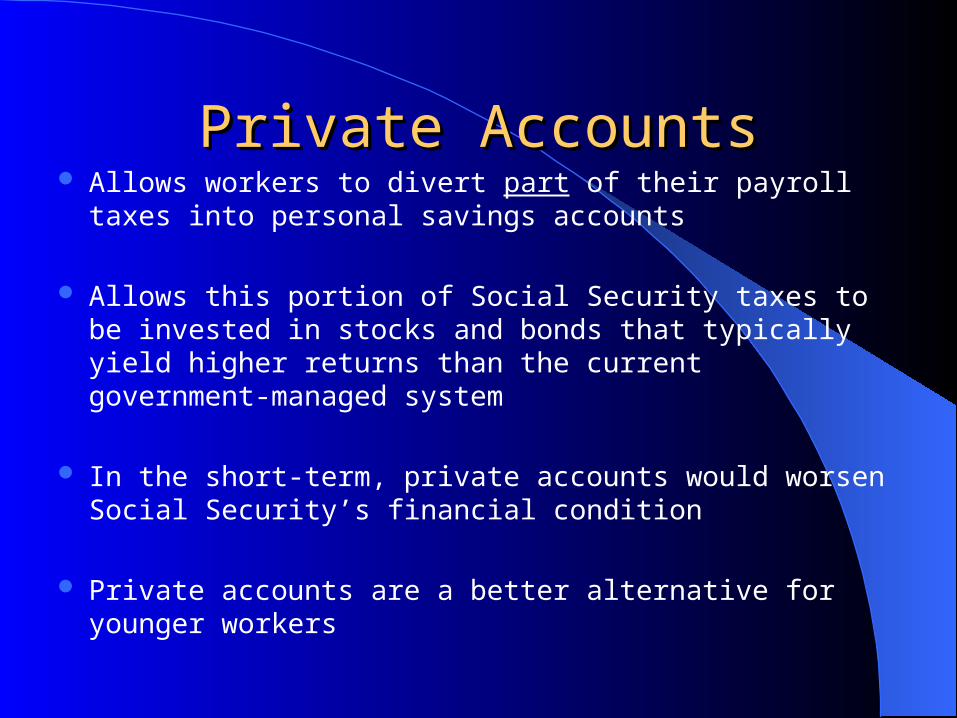
Private AccountsPrivate Accounts Allows workers to divert part of their payroll taxes into
personal savings accounts
Allows this portion of Social Security taxes to be invested in stocks and bonds that typically yield higher returns than the current government-managed system
In the short-term, private accounts would worsen Social Security’s financial condition
Private accounts are a better alternative for younger workers
Website ResourcesWebsite Resources
www.actuary.org/socialsecurity
www.cato.org
www.mysocialsecurity.org
www.ssa.gov