Embed Size (px)
Citation preview
World Bank Reprint Series: Number 144
Parthasarathi Shome and Katrine W. nato
The Impact of Contractual Savingson Resource Mobilization and Allocation:The Experience of Malaysia
Social Security Fundsin Singapore and the Philippines:Ramifications of Investment Policies
Investments of Social Security Fundsin India and Sri Lanka:Legislation and Experience
Reprinted with permission from The Malaaian Economic Review, vol. 23, no. 1(April 1978), pp. 54-72; Labour and Society, vol. 5, no. 1 (January 1980), pp. 19-30;and Th7e Indian Journal of Economnics, vol. 60, part 3, no. 238 (January 1980), pp.349-60.
Pub
lic D
iscl
osur
e A
utho
rized
Pub
lic D
iscl
osur
e A
utho
rized
Pub
lic D
iscl
osur
e A
utho
rized
Pub
lic D
iscl
osur
e A
utho
rized
Pub
lic D
iscl
osur
e A
utho
rized
Pub
lic D
iscl
osur
e A
utho
rized
Pub
lic D
iscl
osur
e A
utho
rized
Pub
lic D
iscl
osur
e A
utho
rized
THE IMPACT OF CONTRACTUAL SAVINGS ON RESOURCEMOBILIZATION AND ALLOCATION: THE, EXPERIENCE OFMALAYSIA
PARTHASARATIII SHCME and KATRINE W. SAITO*
I. INTRXIZZ-ODUCTION
Contractual savings schemes, such as pension and provident funds, socialsecurity schemes, and life insurance, serve a significant economic as well associal objective in many developed and developing countries. These schemesprovide security to individuals in a variety of risk-ridden situations, and alsoserve as an important source of resources which can be used to finance econo-mic development. The experience of developed countries such as the U.S. andU.K. bear witness to the significant contribution which these schemes canmake, at a critical development stage, to the industrial and financial develop-ment of the country. 1 In both these countries, pension flinds and insurancecompanies exerted a stabilizing influence on the long-run development of thefinancial markets, and also acted as an innovative investor, being a majorsource of industrial finance. 2 Although in many developing countries contrac-tual savings schemes are still limited in operation and coverage, in somecountries they have already developed into significant financial institutions3
Malaysia is such a country, and the objective of this study is to assess the rolewhich the Malaysian contractual savings institutions have played in the mobili-zation of savings, and the extent to which the savings of these institutions havecontributed to the financial and economic development of the country.
The layout of the paper is as follows. The existing contractual savingsinstitutions in Malaysia are reviewed, and their scope and coverage examined.Their success in mobilizing funds is then assessed, and finally the allocation ofthese funds is examined, paying particular attention to the contribution madeto the socio-economic development of the country.
* We arc extrerncly grateful to Dr. V.V. Bhatt, Chief of Division of Public ano PrivatcFinancc, I)cveloprnent Economics Dcpnrtrmcnt. the World Bank, for long conversationsand subsLantial suiggestions on the paper, and the general educative impilc' we have hadfroni them.
1. OECI) emphasised this point: "The efficiency of certain markets, in particular thosc in thzUnited States, and the United Kingdom, the Netherlands and in Switzcrland seems tostem to a r.nsidcrable extent from the part played in these markets by intermediaries thatcollect funds on1 a contractual basis and invest them priniipally in long-term forms."OECtl), Committee for Invisible Transactions, Cpiteal Markets Study, General Report,Paris 1967, p. 12.
2. In both these countries nnsion funds and insurance companies held substantial amountsof industrial securitics, both equitics and long-tcrm loans, in their portfolios; see identChapter II and D.K. Sheppard, The Growvth and Role of U.K. Finantcial Inistitutions,London: Metlinen & Co., 1971.
3. This was emphasised in a survey paper by P. Shome, "Contractual Savings and theMohilization of Resources: A Preliminary Strvey" Studies in JJomestic Finance, No. 29,World Bank, November 1976,
RESOURCE MOBILIZATION AND ALLOCATION 55
11. COVERAGE AND SCOPE OF CONTRACTUAL S'AVINGSINSTITUTIONS
The contractual savings institutions covered in this paper includ.: both thelife insurance business as well as other formws of contracts such as the pro% iLlentfund, social security schemes etc. There is a reasonable nicalUre of douhtregarding the definition of and any disaggrcgatcd taxononoy oIn contractualsavings due to the wide nature and forms of tliecs institUtioln. Some schemesmay be voluntary, while others mandatory, depending on, inconle scale oroccupation factors. This sometimes may lead to a definition of Contractualsavings cxcludinig mandatory schemes. Hlowever, voluntary schenie' mav akobe considered 'compulsory' by the ccntributors. onee the insurance conyract isentered into. It is for this reason all forms of coilracts, voluntary and m11anda-tory, are included in this study.
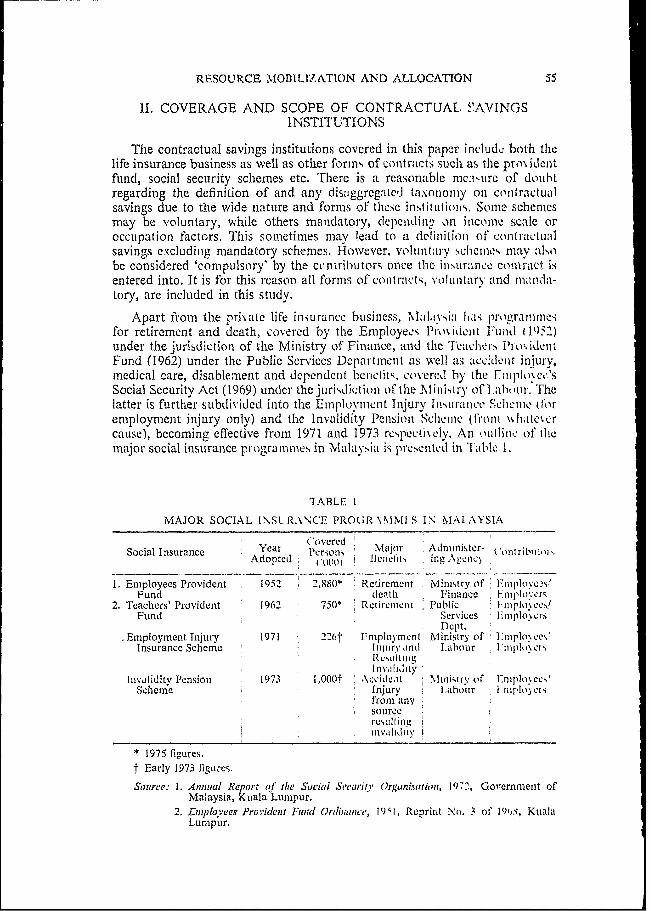
Apart from the prijate life insurance business, rNial yia has 1rogral1rn1mesfor retirement and death, covered by the Emnployees Pi idenit F und (1052)under the jurisdiction of the Ministry of Finance, and the TeachersN Pro' iLidlntFund (1962) under the Public Services Departneint as well as acec ient injtury,medical care, disablement and dependenIt bemnelii<, covered hy the rinploek-e'.SSocial Security Act (1969) under the juridiction of the Ministry of 1.11h1olir. Thelatter is further subdivided into the ElnpEoyllient Injury Tlmislrancie Slchlelme (toremployment injury only) and the Invalidity IPensioni ScIlelme (h'Ioni0 \Nhiate%er
cause), becoming effective from 1971 and 1973 respectikely. Ani oullilm of iliemajor social insurance programnmies in M11alaysia is prresenited in Tiible 1.
TABLE I
MAJOR SOCIAL I\SL RA%NCE PRO(iR \NINi S IN MALAYSIA
CoveredSocial Insurance Year Person Nli 1or Administer -'onrribEuu
Adoptedl In m3 in1gA \1 "Cn
1. Employees Provident 1952 ,880* Retirement .Ministry of FnimZlo e2s!Fund death I .itiance 1:nlvtr cr5
2. Teachers' Provident 1962 750* RetirenLnt L Public I lniplo%esFund .Services I mptlo%rs
.Employment Injury 1971 226t Fniployrnent Ministry of i niplo\ceYInsurance Scheme , Iniusa-,.nd Iahour I'nipl,.w;o
Invalidity Pension 1973 1,000t \ccideat Mizuniiry, of Enirploeci'Scheme Injury Labour I rniplo",ers
from anysource
* 1975 figures.
t Early 1973 figures.
Source: 1. Annual Report of the Sociail Seruritv Orgunistutim, 1972, Government ofMalaysia, Kuala Lumpur.
2. Exiployees Provident Fund Ortianie&', 19 ;I, Reprint No. 3 of 19,)s, ItKalaLumpur.
56 RESOURCE MOBILIZATION AND ALLOCATION
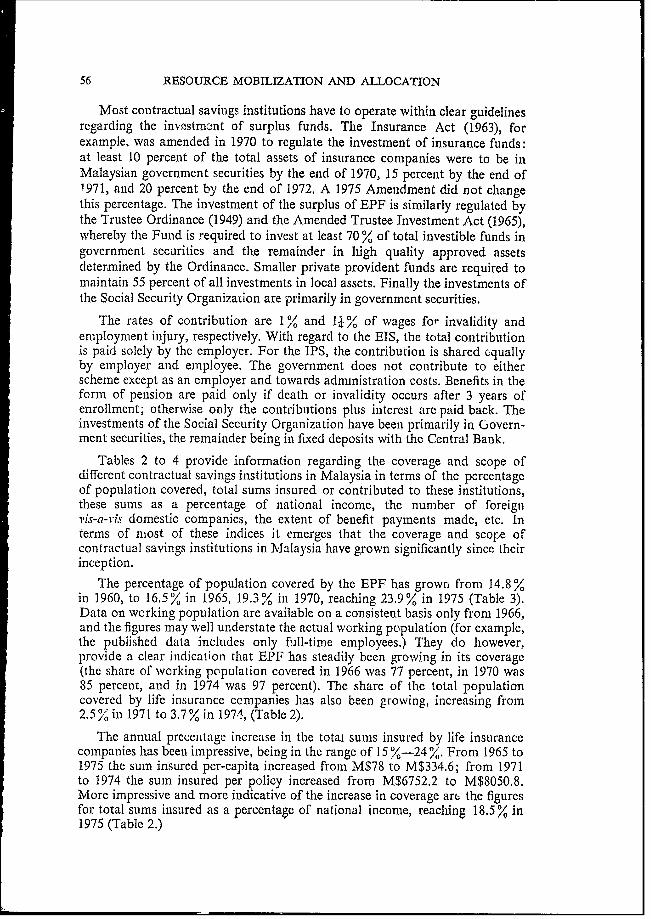
Most contractual savings institutions have to operate within clear guidelinesregarding the inv,,stmnnnt of surplus funds. The Insurance Act (1963), forexample. was amended in 1970 to regulate the investment of insurance funds:at least 10 percent of the total assets of insurance companies were to be inMalaysian government securities by the end of 1970, 15 percent by the end of1971, and 20 percent by the end of 1972. A 1975 Amendment did not changethis percentage. The investment of the surplus of EPF is similarly regulated bythe Trustee Ordinance (1949) and the Amended Trustee Investment Act (1965),whereby the Fund is required to invest at least 70 % of total investible funds ingovernment securities and the remainder in high quality approved assetsdetermined by the Ordinance. Smaller private provident funds are required tomaintain 55 percent of all investments in local assets. Finally the investments ofthe Social Security Organization are primarily in government securities.
The rates of contribution are 1 and 1I % of wages for invalidity andemployment injury, respectively. With regard to the EIS, the total contributionis paid solely by the employer. For the IPS, the contribution is shared cquallyby employer and employee. The government does not contribute to eitherscheme except as an employer and towards administration costs. Benefits in theform of pension are paid only if death or invalidity occurs after 3 years ofenrollment; otherwise only the contributions plus interest are paid back. Theinvestments of the Social Security Organization have been primarily in Govern-ment securities, the remainder being in fixed deposits with the Central Bank.
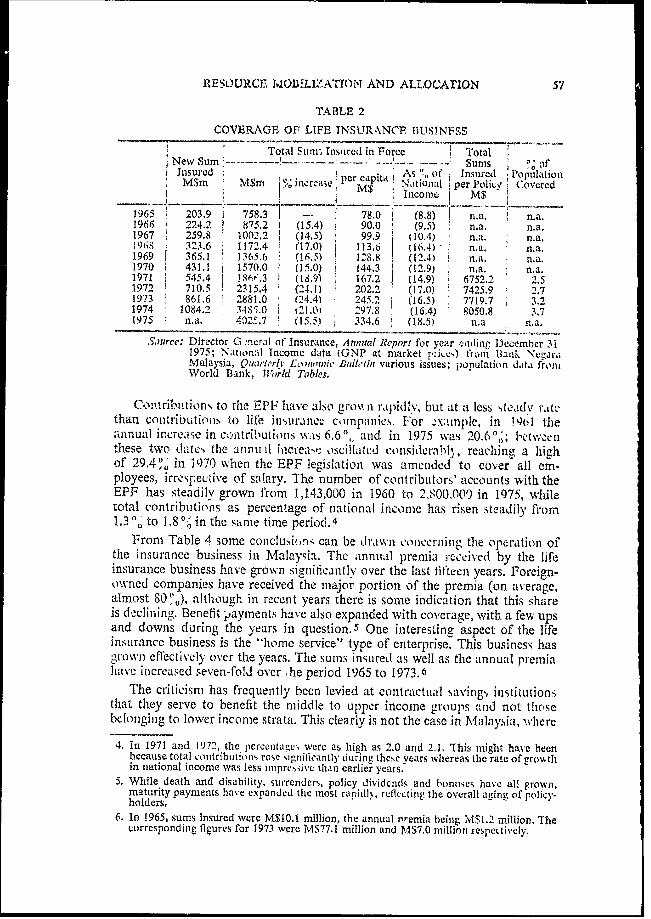
Tables 2 to 4 provide information regarding the coverage and scope ofdifferent contractual savings institutions in Malaysia in terms of the percentageof population covered, total sums insured or contributed to these institutions,these sums as a percentage of national income, the number of foreignvis-a-ris domestic companies, the extent of benefit payments made, etc. Interms of most of these indices it emerges that the coverage and scope ofcontractual savings institutions in Malaysia have grown significantly since theirinception.
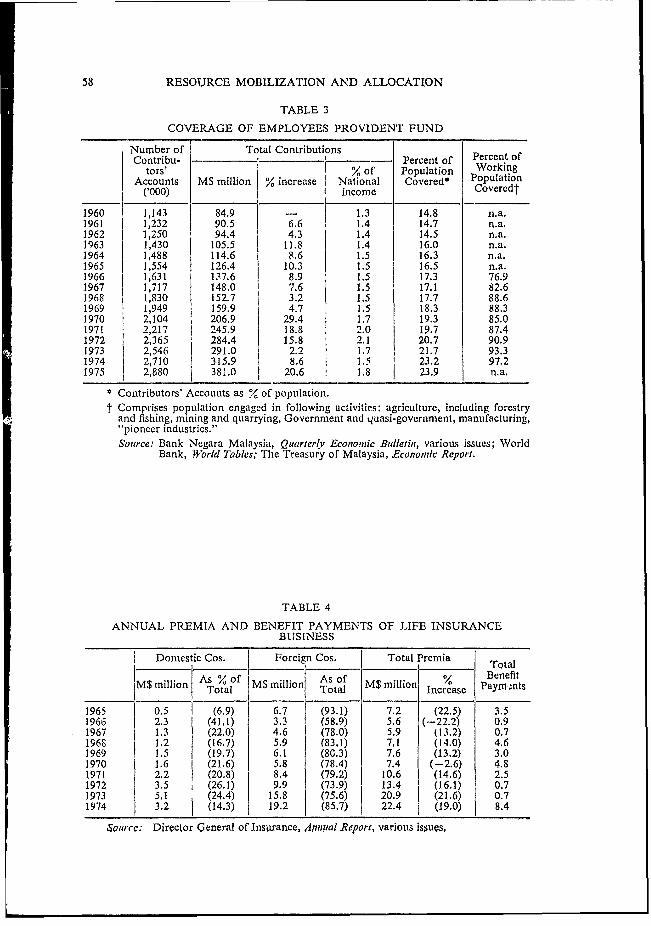
The percentage of population covered by the EPF has grown from 14.8 %in 1960, to 16.5% in 1965, 19.3% in 1970, reaching 23.9% in 1975 (Table 3).Data on working population are available on a consistent basis only from 1966,and the figures may well understate the actual working population (for example,the published data includes only full-time employees.) They do however,provide a clear indication that IEPF has steadily been grow.ing in its coverage(the share of working population covered in 1966 was 77 percent, in 1970 was85 percent, and in 1974 was 97 percent). The share of the total populationcovered by life insurance companies has also been growving, increasing from2.5% in 1971 to 3.7% in 1974, (Table 2).
The annual precenitage increase in the total sums insured by life insurancecompanies has been impressive, being in the range of 15 %-24 %. From 1965 to1975 the sum insured per-capita increased from M$78 to M$334.6; from 1971to 1974 the sum insured per policy increased from M$6752.2 to M$8050.8.More impressive and more indicative of the increase in coverage are the figuresfor total sums insured as a percentage of national income, reaching 18.5% in1975 (Table 2.)
RES-OURCE, MOBILIZATION AND ALLOCAtION 57
TABLE 2
COVERAGE OF LIFE TNSUR\NCF, LTS!JNFSS
Total Sumn'- Insuireci in Force TotalNewSum 'Sums % fInsured j As% ci'f Insured Population
M$m M$m Q inl,nrcase perM$p National i per 1(olicLy Coveredi Incomte I M$
1965 203-9 I 758.3 - 78.0 (8.8) n.a. n.a.1966 224.2 875.2 1 (15.4) 90.0 (9.5) n.a. n.a.1967 259.8 1002.2 (14.5) 99.9 i 0.4) n.a. n.a,19fs ' 23.6 1172.4 ( 17.0) 113.6 (16.4)' n.a. n.a.1969 365.1 1365.6 (16.5) 1I5.8 (12.4) n,a. n.a.1970 431.1 i 1570.0 i (15.0) 144.3 (12.9) n.a n,a,1971 545.4 i16"'.3 1(l.9) 167.2 (14.9) 6752' 2.51972 710.5 21315.4 i (24.1) 0' 02- (17.0) 7425.9 9 .71973 861.6 2881.0 (24.4) 245.2 (16.5) 7719.7 3.21974 1084.2 3 485. 0 Z 21.O 297.8 (16.4) 8050.8 3.71975 n.a. 402, 7 (I5.5) 334.6 (18.5) n.a n.a.
Source: Director G ,neral of Insurance, Anrual Report for year rndinr, December 311975; National Income data (GNP at market fruiii) irvin 'ank Nega'raMalaysia, (uartrrly L.'0h,rnii BDidilen various issues; )OidPlation d.lta froniWorld Bank, WfAvrld rables.
C0..oitributions to the EPF have also gro% n rapidhl , but at a less 'Ateadv r.tcthan contributions to life in'lurance conipanies. For x,xatnplc, in ol') theannual increase in contrilUltions was 6.60 and in 1975 was 20.6 '; 1etwcenthese two dates the annual increase oscillated considerably-, reaching a highof 29.4o in 1970 wN-hen the EPF legislationi was amenided to cover all em-ployees. irresfeLtive of salary. The number of contributors' accounts with theEPF has steadilv grown from 1,143,000 in 1960 to 2,800.000 in 1975, whiletotal contributi(ons as percentage of national inconmc has risen steadily from1.30 to 1.8o- in the sarne time period.4
From Table 4 some conclusion-i can be drawn conecerninlg the operation ofthe insurance business in Malaysia. Thc annual premia rc-ceivei by the lifeinsurance business have grown sienificantly over the last fifteen years. Foreign-OWned companies have received the major portion of the premia (on average,almost 80('o), although in recenit years there is some indication that this shareis declining. Benefit payvnents have also expanded with coverage, with a few upsand downs during the vears in question.5 One interesting aspect of the lifeinsurance business is the "ihome service" type of enterprise. This business hasgrownM1 effectively over the years. The sumns insured as well as the annual prerniahave inicreased seven-fold over he period 1965 to 1973.6
The criticisml has frequlently been levied at conitri-actulii saving,' institutionithat they serve to benefit the nmiddle to upper income groups and not thosebeloITginig to lower inconme strata. This clearly is not the case in Mvalaysia, wlherc
4. In 1971 and 1972, the perceniaees were as high as .20 and 2.1. 'This inight have beenbecause total contributions rosc %ignilfieantl dulring thcse years whereas the rate of rro%thin national income was less inipreviive than earlier years.
5. While death and disability, surrcnders, policy dividcnds and lonuses have all grown,maturity payments have expanded itie most r.apidl'y, reflc.ting the overall aging of polic-holders,
6. In 1965, sums insured were MSlO.1 million, the annual nremia being IvIS1.2 million, Thecorresponding fipures for 1973 were MS77.1 million and MS7.0 millinn resPecLti%ly.
58 RESOURCE MOBILIZATION AND ALLOCATION
TABLE 3
COVERAGE OF EMPLOYEES PROVIDENT FUND
Number of Total ContributionsContribu- Percent of Percent of
tors' % of Population WorkingAccounts M$ million % increase National Covered* Population
('000) i ncome Covercdt
1960 1,143 84.9 - 1.3 14.8 n.a.1961 1,232 90.5 6.6 1.4 14.7 n.a.1962 1,250 94.4 4.3 1.4 14.5 n.a.1963 1,430 105.5 11.8 1.4 16.0 n.a.1964 1,488 114.6 8.6 1.5 16.3 n.a.1965 1,554 126.4 10.3 1.5 16.5 nma.1966 1,631 137.6 l 8.9 1.5 17.3 76.91967 1,717 1.48.0 7.6 1.5 17.1 82.61968 1,830 152.7 3.2 1.5 17.7 88.61969 1,949 159.9 4.7 1.5 18.3 88.31970 2,104 206.9 29.4 1.7 19.3 85.0197! 2,217 245.9 18.8 2.0 19.7 87.41972 2,365 284.4 15.8 2.1 20.7 90.91973 2,546 291.0 2.2 1.7 21.7 93.31974 2,710 315.9 8.6 1.5 23.2 97.21975 2,880 381.0 20.6 1.8 23.9 n.a.
* Contributors' Accounts as ° of population.* Comprises population engaged in following activities: agriculture, including forestry
and fishing, mining and quarrying, Government and quasi-government, manufacturing,"pioneer industries."Source: Bank Negara Malaysia, Quarterly Economic Bulletin, various issues; World
Bank, 'World Tables; The Treasury of Malaysia, Economic Report.
TABLE 4
ANNUAL PREMIA AND BENEFIT PAYMENTS OF LIFE INSURANCEBUlSINESS
Domestic Cos. Foreign Cos. TotalA-smllio otal ot f Benefit
M$ million As of M$ million Totas M$ million Increase Paym.nts
1965 0.5 I (6.9) 6.7 (93.1) 7.2 (22.5) 3.51966 2.3 (41.1) 3.3 (58.9) 5.6 (-22.2) 0.91967 1.3 (22.0) 4.6 (78.0) 5.9 (13.2) 0.71968 1.2 (16.7) 5.9 (83.1) 7.1 (14.0) 4.61969 1.5 (19.7) 6.1 (80.3) 7.6 (13.2) 3.01970 1.6 (21.6) 5.8 (78.4) 7.4 (-2.6) 4.81971 2.2 (20.8) 8.4 (79.2) 10.6 (14.6) 2.51972 3.5 i (26.1) 9.9 (73-9) 13 4 (16.1) 0.71973 5.1 (24.4) 15.8 (75.6) 20:9 1 (21.6) 0.71974 3.2 (14.3) 19.2 (85.7) 22.4 (19.0) 8.4
SQurrec: Director G;eneral of Insurance, A1iny!al Report, various issues,
RESO)URCEh MOBIIl AATVION ANI) .WINl.L()C'U Ic
both the EPF and the life insurance comnparnies have attempItedL to include inthose they serve the lower income icginents of the population. The homne servicescheme of life insurance, for e. iple, was d0sig'ned to pro. ile a life in-suir iniceservice specifically for thoSCwith ies>, inconni, apilpawetlv witlh c I1%hlLr.le sucicess.7 The EIPF fronm its very inception was aimed at hm.cri-.conLe inil1oxee.l.It covered employees whose salary was M$400l per month or less jincre.tawseto M$500 in 1963, and the salary ceiling was abolklied entirely in 1 '70). and theinitial constraint that the establishmiienit should cmploy at least 5 workers wasabLandioned in 1964. By 1970 all enmployees, with few excepinus. cre .Sered
by the Fund. Such mlepsJures cleairly inidicate a e-e;ii tt) inciltude thosev ith ilo l%enincomes in the coverage of these schemes, and in the case of the LPI i until P')70).
of excluding those who%e incomiie exceeded a cer.tain limit. Furthermcie, jnThingbv the extremely high percentage of the working popultion co%ercd, at leastby the EPF, these measures appear to have been successfuil in this obhjcci%,
IIT. RESOURCE MOBILIZATION TIIHROUG(JH 0C' FP. CJTt .SAVINGS INSTITUTIONS
Saving in contractual ftrm. suchi as through pros id.nt funds or penionischlemes, or through the purcliase of life insurance, h1.i^ the adhan,nta., e ofregularity which helps to stabilize the savings rate. Sa%ini.l thus becom"ies a1cornmi rnent on the part of the lhousehold and is Ino lon&!or ain err1atic resihiualof ince-nme less consumption.
While all contractual savings institutions haive this stahiliiina infl0lencc On
aggregate sa\ings. their potential for -ener,tting sa'ingtai can titker depzndin
upon the type of institution. Life insurance contracts ha.,ve consideraible ptlten-tial for mobilising savings, since they cover not only the risk of iuture cointin--ency, but also have an annuity element for the insurledi o.en allnd above the ri.sk
Loverage. 8 By contrast, the savings potential of social insuraiic progranmies,such as provident or pension scheme,. depend-s eN:,entiallv on the principle offunding on which they are based. In Nalayiyia both the EP Eand TPF are based
on the "funded" principle of benefit payment herleca the EIS and the IPS
follow the "pay-as-you-go" principle. In the fill funding (or general a%.eiatte
premium) system denmarcated funds are set a.ide for contributors, creatinat a
reserve and earning investment income (intere,t antd apprecidtion of value).
These fuLnids are then used at retirement etc., to pay the clainmed benefits. In the
pay-as-you-go (or annual assessmnenit) systen. henulits ire paid from the allnual
re'venuc usually with no prior reserve formnation except may be a precautionary
fund. Short-term progranimes are usually COVercL by thle pav-as-v-gi system.
but lonig-termiii progranmmes may be coxcieed by eithler. 'I'lh fully-flunded 111ethid
is generally asISUmed to have a gtreatter c;pacity to generate h.urpluses beL ause of
7. In terms of sums insMred, the honme -e,r ice business has l rown at a faster rate than thetotal life insurance business (26 percent compared to I') percent compound rate of gro%% Lihover the the years 1965 to 1973).
8. In this sense, group property and term inmurance do not mnobilize persoxial ~.'s ir1g.. I orfurther elaboration, see K. Saitw, "An Estiinationi of 11uiusehold Savigrm in N;ri l anka",$tudies in Domestic Fintance, No. 27, World Bank, Atisiist 1976,
60 RESOURCE MOBILIZATION AND ALLOCATION
the creation of reserves. A programme based on the pay-as-you-gD principlemay also generate savings through contingency reserves, 9 though this is likelyto be to a lesser extent than the fully-funded principle.
WN'hile plans are newly established, deferred benefits and broader or expandedcoverage may bring in added revenues. As the economy grows, if the benefitsare controlled and the retiremiient age is not early, then the period of savingsgeneration can be extended. If claims are illiquid in the sense that it is difficultfor employees to borrow on the basis of their contributions, or that employersdo not get back their contrib'.tions if an enterprise is liquidated, then againthe savings potential is high. Household sector savings may also increase throughpensions if the poorer employees would not save except through compulsion.Workers may increase other forms of savings after becoming participants in theplans since now they are more aware of the need to save and believe that acomfortable retired life is not impossible to achieve. Also if contributions areilliquid, people may feel the need to save in more liquid forms. Cash contribu-tions and benefits payments of social insurance plans are, by and large, regulatedand, therefore, predictable. Thus there is a greater freedom in mobilizing thesesavings on a long-term basis. IO
The extension of social security schemes has been actively encouraged inmany LDC's on the argument that this would increase aggregate savings. It isquite true that such an extension would increase the total contractual savingswhich would have the beneficial effect of reducing the erratic element in aggre-gate saving as N_ell as, under certain conditions, stimulating the deve opment ofthe capital market. It is not all clear, however, that contractual savings schemesdo have a positive effect on the average savings rate. To conclude that aggregatesavings will increase by the total amount of savings generation through thesecontractual schemes ignores the reactions of the subscriber to the scheme andalso in the case of pension or provident funds, of the employer.
The reaction of the saver to his participation in contractual savings schemesis extremely difficult to gauge. A rational response would be to fully recognizethat his contributions, as well as those of his employer, comprised a part of histotal sai ings and if he was motivated by some notion of target wealth, he mayregard saving in contractual form as a substitute for holdings of other financialassets and reduce his savings by an equivalent amount. It should be recognized,however, that substitutability is limited by the attributes possessed by contrac-tual savings whirlh, in manyrespects, are quite distinct from other financial assetsheld by households. He may also be encouraged to save less in non-contractualform since his contractual saving guarantees certain future benefits and soweakens the nrecautionary motive for saving. On the other hand, saving may
-. 1
9. For a more detailed analysis on the two principles, refer to Franco Reviglio, "SocialSecurity: A Mcans of Savings MNobili?ation for) Economic Development", IMP SmJfN-Pers, July 1967.
10. It can also be argued that these schcmes may have a negative impact on savings, both inother forms ailv other sectors. For sorme lower income grouips it may be that their consump-tion cannot be 'urlher reduced, and their participation in contractual savings schemes mayforce them to decrease their savings in otlher forms. 'Tlhere may also be a negative impacton business savings unless prices or productivity increase. Pension deductions allowablein income tax rates may lower government savings. A detailed analysis of the pros and consof savings generation by pension funds may be found in M.A. Olde, Pcnzsioni FuinSds inLabour Sturpltus Economics, Institute for Social and Economic Research, Univcrsity ofWest Indies, 1974,
RESOURCE MOBILIZATION AND ALrLOCATION 61
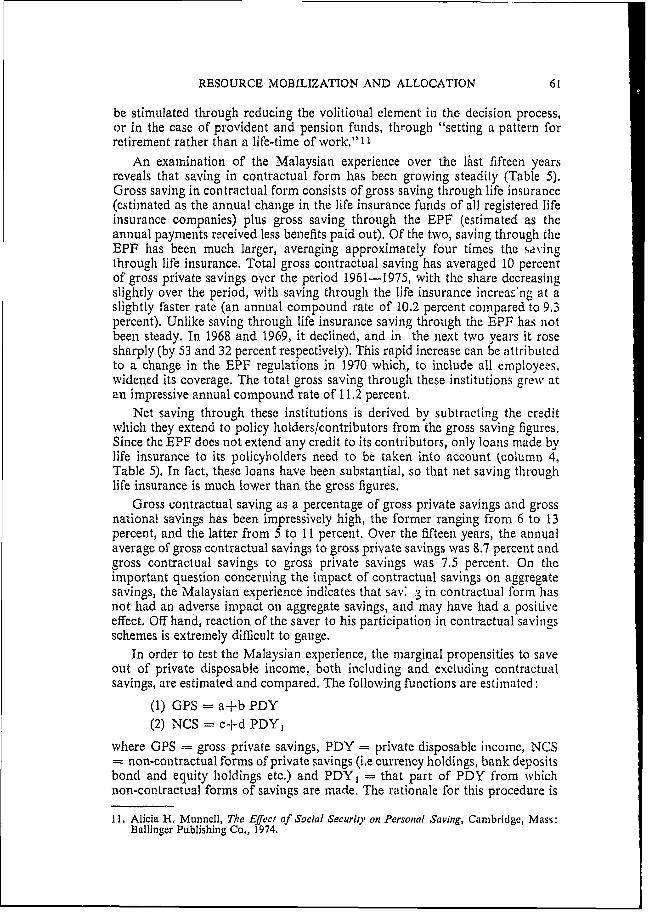
be stimulated through reducing the volitional element in the decision process,or in the case of provident and pension funds, through "setting a pattern forretirement rather than a life-time of work," I 1
An examination of the Malaysian experience over the last fifteen yearsreveals that saving in contractual form has been growing steadily (Table 5).Gross saving in contractual form consists of gross saving through life insurance(estimated as the annual change in the life insurance funds of all registered lifeinsurance companies) plus gross saving through the EPF (estimated as theannual payments received less beniefits paid out). Of the two, saving through theEPF has been much larger, averaging approximately four times the savingthrough life insurance. Total gross contractual saving has averaged 10 percentof gross private savings over the period 1961-1975, with the share decreasingslightly over the period, with saving through the life insurance increa-ng at aslightly faster rate (an annual compound rate of 10.2 percent compared to 9.3percent). Unlike saving through life insurance saving through the EPE has notbeen steady. In 1968 and 1969, it declined, and in the next two years it rosesharply (by 53 and 32 percent respectively). This rapid increase can be attributedto a change in the EPF regulations in 1970 which, to include all employees,widened its coverage. The total gross saving through these institutions grew atan impressive annual compound rate of 11.2 percent.
Net saving through these institutions is derived by subtracting the creditwhich they extend to policy holders/contributors from the gross saving figures.Since the EPF does not extend any credit to its contributors, only loans made bylife insurance to its policyholders need to be taken into account (colutnn 4,Table 5). In fact, these loans have been substantial, so that net saving throughlife insurance is much lower than the gross figures.
Gross contractual saving as a percentage of gross private savings and grossnational savings has been impressively high, the former ranging from 6 to 13percent, and the latter from 5 to 11 percent. Over the fifteen years, the annualaverage of gross contractual savings to gross private savings was 8.7 percent andgross contractual savings to gross private savings was 7.5 percent. On theimportant question concerning the impact of contractual savings on aggregatesavings, the Malaysian experience indicates that sav., in contractual form hasnot had an adverse impact on aggregate savings, and may have had a positiveeffect. Offhand, reaction of the saver to his participation in contractual savingsschemes is extremely difficult to gauge.
In order to test the Malaysian experience, the marginal propensities to saveout of private disposable income, both including and excluding contractualsavings, are estimated and compared. The following functions are estimated:
(1) GPS a+b PDY(2) NCS c+d PDYl
where GPS- gross private savings, PDY private disposable income, NCS- non-contractual forms of private savings (i.e currency holdings, bank depositsbond and equity holdings etc.) and PDY =that part of PDY from Nvhichnon-contractual forms of savings are made, The rationale for this procedure is
11, Alicia H. Munnell, The E]fect of Social Security on Personal Saving, Cambridge, Mass:Ballinger Publishing Co., 1974.
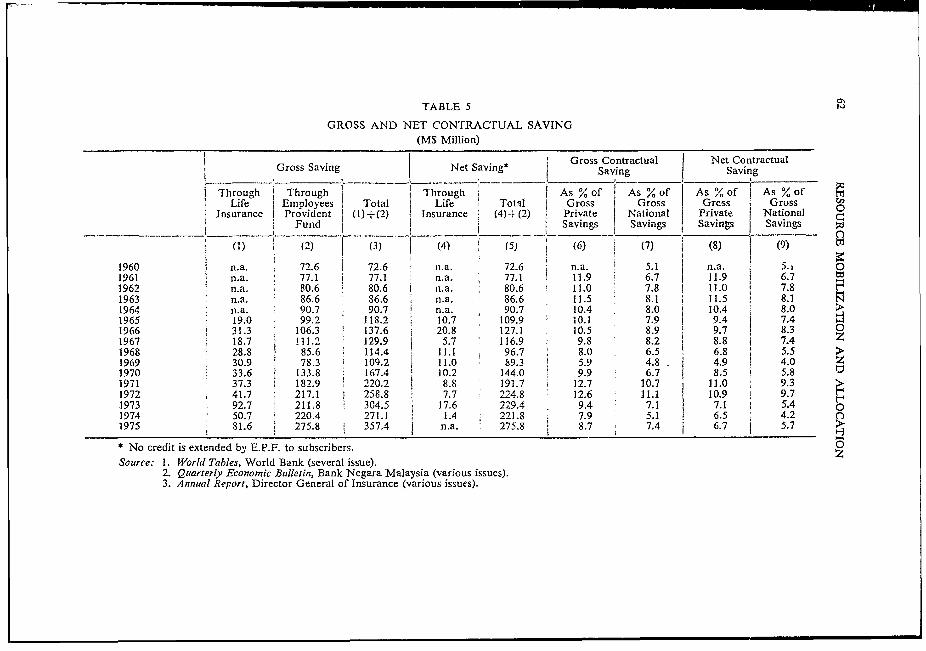
TABLE 5
GROSS AND NET CONTRACTUAL SAVING
(M$ Million)
Gross Contractual Net ContractualI Gross Saving Net Saving* GoSaving Saving
Through Through Through As % of I As Y. of As % of j As % of MLife Employees Total Life Total Gross Gross Grcss Gross
Insurance Provident (1)+(2) Insurance (4)-+ (2) Private National Private National 0- Fund i Savings Savings Savings Savings >
(1) (2) (3) (4) (5) (6) (7) (8) (9)
1960 n.a. 72.6 72.6 n.a. 72.6 n.a. 5.1 n.a. 5.i O1961 n.a. 77.1 i 77.1 n.a. 77.1 1 11.9 6.7.1962 n.a. 80.6 80.6 J n.a. 80.6 11.0 7.8 11.0 7.81963 n.a. 86.6 86.6 n.a. 86.6 11.5 8.1 11.5 8.11964 n.a. 90.7 90.7 n.a. 90.7 10.4 8.0 10.4 8.0 >1965 19.0 99.2 118.2 10.7 109.9 10.1 7.9 9,4 7.41966 ' 31.3 106.3 137.6 20.8 127.1 10.5 8.9 9.7 8.3 01967 18.7 111.2 129.9 5.7 116.9 9.8 8.2 8.8 7.4 Z1968 28.8 85.6 114.4 11.1 96.7 8.0 6.5 6.8 5.51969 30.9 78.3 109.2 11.0 89.3 5.9 4.8 4.9 4.0 Z1970 1 33.6 133.8 167.4 1 10.2 144.0 9.9 6.7 8.5 5.81971 37.3 I 182.9 220.2 8.8 191.7 12.7 10.7 11.0 9.31972 41.7 217.1 258.8 7.7 224.8 12.6 11.1 10.9 9.71973 92.7 211.8 304.5 17.6 229.4 9.4 7. 7.1 5.4 01974 50.7 220.4 271 1 1.4 221.8 7.9 5.1 6.5 4.2 C1975 81.6 275.8 357.4 | n.a. 275.8 I 8.7 7A 6.7 5.7 >
* No credit is extended by E.P.F. to subscribers. 0Source: 1. World Tables, World Bank (several issue).
2. Quarterly Economic Bulletin, Bank Negara Malaysia (various issues).3. Annual Report, Director General of Insurance (various issues).
RESOURCE MTOBILIZATION AND ALLOCATION 63
based on the hypothesis that households regard CS as a tax, i.e. as a reductionin their disposable income, and not as a substitute for NCS. Under such circum-stances, CS will not be expected to have an adverse impact on GPS. It is assumedthat households regard CS as a reduction in their disposable income by anamount PDY2, where PDYj+PDY2=PDY, Since households regard CS as atax, then the marginal propensity to save in the form of CS from PDY 2 will beequal to one. In other words, CS=PDY2. It follows that the coefficient b,which is a weighted average of the propensities to save in contractual form plusin non-contractual forms, would be greater than or equal to d, 12 if householdsdlo regard CS as a tax.
Rewriting equation (2) as follows:
(GPS-CS) = c+d (PDY-PDY2) or
(GPS-CS) = c+d (PDY-CS) (2)
and comparing (1) and (2), it can be stated that if b ,d, households regardcontractual savings as a tax. The marginal propensity to save in non-contractualforms will not, therefore, be adversely affected by the presence of contractualsavings institutions.
This analysis can be carried further in as much as it is possible to test therelative tax elements in savings through the Employees Provident Fund (EPF)vis-a-vis savings through life insurance companies (LIC). This is done byestimating:
(GPS-EPF) e+f (PDY-EPF) (3)
and (GPS -LIC) g+h (PDY-LIC) (4)
Following the above argument, if households perceive a greater tax element intheir savings through EPF than through LIC, the tax element in CS (which is aweighted average of the tax elements of EPF and LIC) will be between these two,with the result: f4< d Sh. 1 3
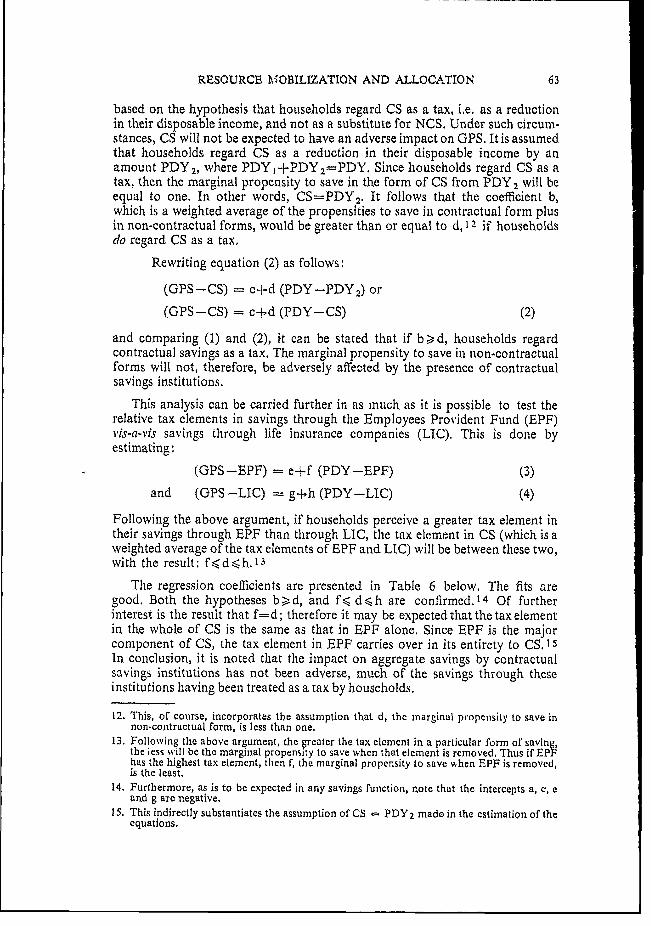
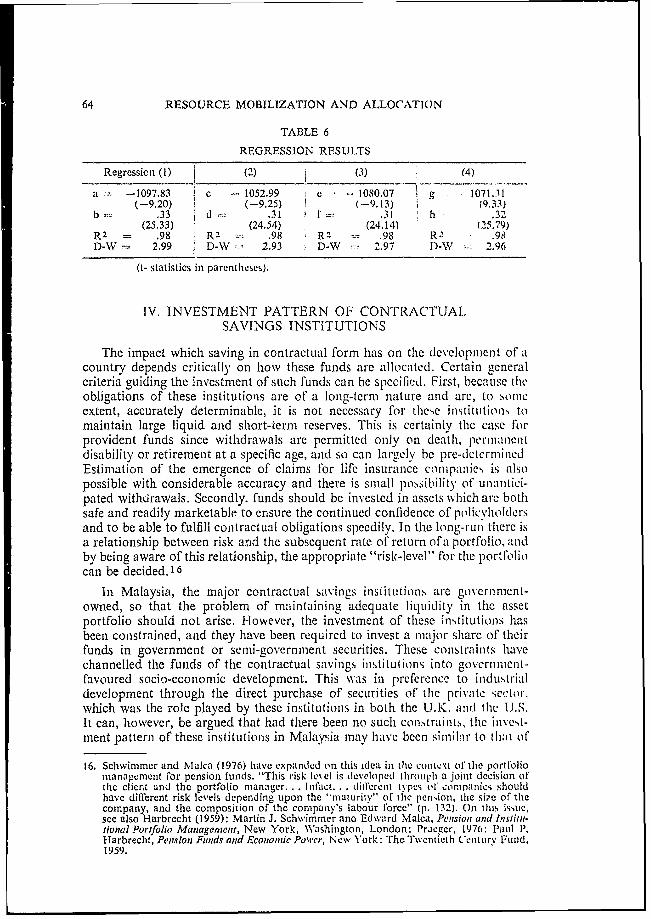
The regression coefficients are presented in Table 6 below. The fits aregood. Both the hypotheses b d, and f( d < h are confirmed. 14 Of furtherinterest is the result that f=d; therefore it may be expected that the tax elementin the whole of CS is the same as that in EPF alone. Since EPF is the majorcomponent of CS, the tax element in EPF carries over in its entirety to CS. 15In conclusion, it is noted that the impact on aggregate savings by contractualsavings institutions has not been adverse, much of the savings through theseinstitutions having been treated as a tax by households.
12. This, of course, incorporates the assumption that d, thc mnarginal propcnsity to save innon-contractual form, is less than one.
13. Following the above argument, the greater the tax element in a particular form of saving,the ess will be the marginal propensitv to save when that element is removed, Thus if EPFhas the highest tax element, tlhen r, the marginal propensity to save when EPF is removed,is the least.
14. Furthermore, as is to be expected in any savings function, note that the intercepts a, c, eand g are negative.
15. This indirectly substantiates the assumption of CS PDY2 made in the estimation of theequations.
64 RESOURCE MOBILIZATION AND ALLOCATION
TABLE 6
REGRESSION RESULTS
Regressien (1) (2) (3) (4)
a -1097.83 c 1052.99 c 1080.07 g 1071.31(-9.20) (-9.25) (--9. 1 3) (9,33)
b .33 d1*-2 .31 f- .31 IIh .32(25.33) (24.54) (24.14) (25.59)
R2 .98 IR - .98 R2 .98 R 2 .98D-W 2.99 D-W - 2.93 D-W 2.97 D)-W 2.96
(t- statistics in parcnthescs).
IV. INVESTMENT PATTERN OF CONTRACTUAILSAVINGS INSTITUTIONS
The impact which saving in contractual form has on the development of acountry depends critically on how these funds are allocated. Certain generalcriteria guiding the investment of such funds can be specified. First, because Ilteobligations of these institutions are of a long-termll nature and are, to sonicextent, accurately determinable, it is not necessary for tlic,e institutions tomaintain large liquid and short-term reserves. This is certainly the case forprovident funds since withdrawals are permitted only on deaith, peltl1lahentdisability or retirement at a specific age, and so can largely be pre-LCtIcrniinedEstimation of the emergence of claims for life insurance companies is alsopossible with considerable accuracy and there is small possibility of unantici-pated withirawals. Secondly. funds should be invested in assets wvhich are botlsafe and readily marketable to ensure the continued confidence of policylloldersand to be able to fulfill contractual obligations specdily. In the long-ruln there isa relationship between risk anid the subsequent rate of return of a portfolio, andby being aware of this relationship, the appropriate "risk-level" for the portfoliocan be decided. 16
In Malaysia, the major contractual savintzs institutions are government-owned, so that the problem of maintaining adequate liquidity in the assetportfolio should not arise. However, the investment of these institutiolns hasbeen conistrained, and they have been required to invest a major share of theirfunds in government or scmi-governnment securities. These constraints havechannelled the funds of the contractual savings inistitutions into government-favouredl socio-econonmic development. This was in preference to industrialdevelopment through the direct purchase of securities of iec private sector,which was the role played by these institutionis in both the U.K. and tlic UJ.S.It can, however, be argued that had there been no such con.straints, the invest-ment pattern of these institLutions in Malaysia may lhave beeni siniilhr to thlat. of
16. Schwimmer and Mlalca (1976) have expanded oni this idSea in ihc context ol the portl'oliomanagement for pension funds. "This risk le\ el is developied throulih a joint decision ofthe client and the portfolio manager. . . Ihfact. . . dilTerent types o companiies shouldhave different risk levels dependinig upon the "maturitv" of ihe pen,ion, the Si7e of thecompany, and the composition of the company's la'oour force' (p. 132). On thiis isste,see also Harbrecht (1959): Martin J. Schwimmer ann Edward Malca, Pensiorl citic n tIstitu-tionalPortfolio Management, New York, Washington, London: Praeger, 1976: Paul P.flarbrecht, Penision Fituzds and Econotmtie Power, New Y ork: The Twentieth Centwry Fund.1959.
'RESOURCE MOBILIZATION AND ALLOCATION 65
the commercial banks in that cotuntry. In view of the fact that the Malaysiancommercial banks invested hea-vi!- abroad, a strong case could be mfade thatthe existence of these constraint . iifketively, channel these funds into usesahicliT stirmulated domestic development.
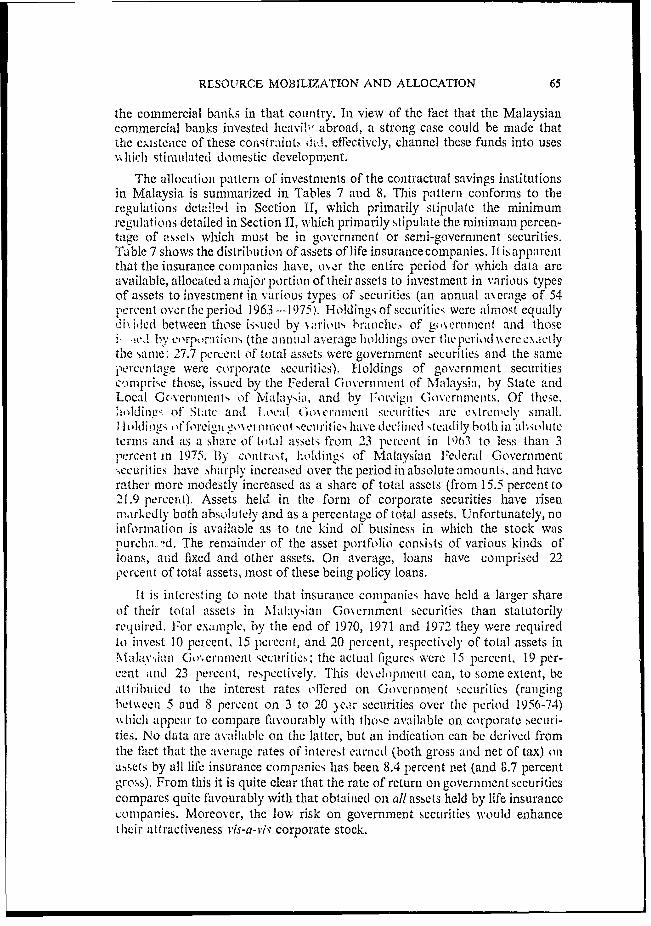
The allocation patterni of investments of the contractual savinlgs institutionsin Malaysia is summarized in Tables 7 and 8. This pattern conforms to theregulations detai!e' in Section II, which primarily stipulate the minimumreg.ulations detailed in Section II, which primarily stipulate the minimum percen-tage of assets which must be in government or semi-government securities.Table 7 shows the distribui tioni of assets of life insurancecompanies. It isapparentthat the insurance companies have, o)er the entire period for which data areavailable, allocated amaJor portion of their assets to investment in variOus typesof assets to investment in various types of bCcurities (an annual aN erage of 54percent over tle period 1963-- 1975). Holdings of securities were alniost equally,]i.bl,eld between tho-se ikiied by N,!rioLS h[brnche.s of g(,%ernnment and those
i by corporaftions (the annual average hol(dings over ihepriod (lN erec.sactlIythe same; 27.7 percent of total assets were government securities and the sameviercentave were corporate securities). Holdings of gvernmment secutritiescmnprise those, issued by the F ederal Government of Mfalaysia, bv State andLocal Gervcumnenlt' of &Ialaysyia. and by I r.eign, Gov'ernmiemt.s. Of tliese,"'ldinpc: of State and ILocal Go\eminient secrijil ics are e\ treiinelv small.1- oldi n 1 1s .t forieo n nn-xci mjen t securit ic, have decliim(l' steadfily bothlini absolutetermils and as a share of taLl aXssets fromii 23 pelcent in 1003 to less thaln 3percent in 1975. By contrast, holdings of Mahlysiain Fedleral Governnment-ccurities lhave hliarply increased over the period in absolute amounts., and haverather more modestly increased as a share of total assets (from 15.5 percent to21.9 perent'). Assets held in the form of corporate securities have risenmarlkedly both absolutely and as a percentage of total assets. Unfortunately, noinformation is availaole as to tnc kind of business in which. the stock waspurcha.. 'd. The remainder of the asset porrtfolio consists of various kinds ofloans, and fixed and other assets. On average, loans have comprised 22percelnt of total assets, most of these being policy loans.
It is initeresting to note that insurance companies have held a larger shareof their total assets in Mvlalav:lian ioxemrinient securities than statutorilyreuilc%d. For examnlple, by the end of 1970, 1971 and 1972 they were requiredto inivest 10 percent, 15 percent, and 20 percenit, respectively of total assets inMalav1ian Go CrI11ent securities; the actual figures were 15 percent, 19 per-cent andl 23 percent, respectively. This dexelopmient can, to some extent, beaittributed to the interest rates olffcred oni Government securities (rancgingbet%%een 5 and 8 pericenit on 3 to 20 year securities over the period 1956-74)xx idic appear to compare ravouirably with thosc available on corporate secuiri-ties. No data are available oin the latter, but an indication can be deriv(el fromthe fact that the average rates of intere.t earncd (both gross antd net of tax) oni;assets by all life insurance companies has been 8.4 percent net (and 8.7 percentgross). From this it is quite clear that the rate of return on government securitiescompares quite favourably with that obtained on all assets held by life insuranceLo0nlpanies. Moreover, the low risk on government sectirities would enhancetheir attractiveness vis-a-vis corporate stock.
DISTRIBUTION OF ASSETS OF LIFE INSURANCE COMPANIES(MS million)
1963 1964 1965 1966 1967 1968 1969 1970 1971 1972 1973 1974 1975 mI In
01. Investments 71.6 73.6 87.1 t 90.9 i 104.3 125.6 146.4 174.1 20S.6 268.8 323.1 34 1, 385.0 cs
(%increase) (n.a.) (2.8) (18.3) (4.4) (14.7) (20.4) (16.6 (18.9) (18.1) (30.7) (2(.2) (6.5) (I1.9) 0(a) Goi'ernment
Sec4rities: 48.0 47.3 55.8 42.4 47.2 50.4 51.6 72.2 91.4 I25.9 144.7 h16.9 179.7 g(i) Federal Gov. 19.4 19.4 18.8 19.1 22.1 23.5 25.9 48.4 69.2 104.4 123.3 135.9 151.5 0
(ii) Foreign Gov. 28.6 27.9 35.2 22.1 24.0 25.8 24.6 . .5 21.7 21.2 21.1 '03 20.2(iii) State & Local
Gover.ment .mentt See:uritis 1.8 1'2 1.1 1.1 1.1 V.3 1 0 0 ' 0 >
(b) C'orporate ¢Securities 23.6 26.3 31.3 4 .: 57.1 75 I Ui 14.2 142.9 178.4 7. 3 V.
L.oans 23.7 26.2 2 4 53.3 64 8 9.2 93 IP) .y26 Z
' ,increasoe in.a.) 415) 443.1 (11 H4i 2 - 2.32 ;(a) Land and T ; 1 17. . >
Loans n.a. 5.2 ; 7 '". K 22.0 24.2 ,- 9.3bj foh :iann- n. 19.4 245 - l- 44* 4')2 5I n Ca.
(cc Other na. 1.6 1 . 0.., 1.3 r1 f 1 l ' t l:.5 I8. . . ..-..
3. Fi7xed & (rf; Nr e .Pt. 2. 4 .4 47.5 5 6. 5 51.1 63, .4 ,,r.I -:23. ..-(" increae) n.a. 14J (13 A.4) (:*. i. 91 111 1, 9) ' 41 208) (-. 4 20.8) i.i ( 1 )
Totili Assets 12:. I 141.7 172i. 192.4 21.7 2S I - 75/),* 321' - 448.0(0 nincr.,c) 1n.a.J (13.3) (I Ui.3i t13,7) I !1 . 1. (2'.61 03 Ii7., t .-2)
.S'nmru - RJ2r:r) ! In-'rj::. - .4n.atru Ru * r, uarios is%;ii;. rtan- Qer Ic 'rci '-:. b.' . -tri. . uis.
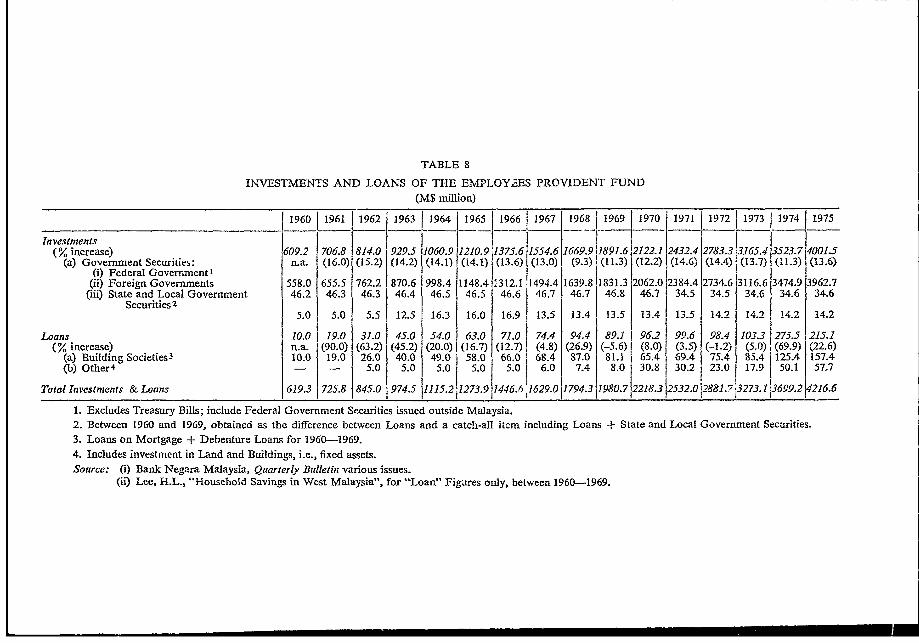
TABLE 8
INVESTMENTS AND LOANS OF THE EMPLOY2ES PROVIDENsT FUND
(M$ million)
1960 1 1961 1962 1963 11964 1965 1966 11967 11968 11969 11970 11971 1972 11973 11974 1975
In vestments 9(% increase) 609.2 706.8 814.0 929.5 i10.9 1375.6 1554.6 1669.9 1891.6 (122.1 2432.4 2783.3 65.41352317 400 15
(a) Government SecuriLies: n.a. (16.0) (15.2) (14.2) (14.1) (14.1) (13.6) (13.0) (9.3) (11.3) (12.2 (14.6) (14.4) j3. |(11.3) (13.1.j(i) Federal Government1 I(ii) Foreign Governments 558.0 655.5 762.2 870.6 998.4 1148.4 I 312.1 1494.4 1639.8 1831.3 2062.0 2384.4 2734.6 3116.6 3474.9 3962.7
(iii) State and Local Government 46.2 46.3 46.3 46.4 46.5 46.5 46.6 46.7 46.7 46.8 46.7 34.5 34.5 34.6 34.6 34.6Securities2
5.0 5.0 5.5 12.5 16.3 16.0 16.9 13.5 13.4 13.5 13.4 13.5 14.2 14.2 14.2 14.2
Loans 10.0 19.0 31.0 45.0 54.0 63.0 7I.0 74.4 94.4 89.1 96.2 99.6 98.4 103.3 1275.5 215.1(% increase) n.a. (90.0) (63.2) (45.2) (20.0) (16.7) (12.7) (4.8) (26.9) (-5.6) (8.0) (3.5) (-1.2) (5.0) (69.9) (22.6)
(a) Building Societies3 10.0 19.0 26.0 40.0 49.0 58.0 66,0 68.4 87.0 81.1 65.4 69.4 75.4 85.4 j125.4 157.4(b) Other4
- - 5.0 5.0 5.0 5.0 5.0 J 6.0 7.4 8.0 30.8 30.2 23.0 17.9 50.1 57.7
Total Investments & Loans 619.3 725.8 845.0 974.5 1115.2 1273.9 1446.6 j1629.0 1794.3 1980.712218.3 2532.0 12881.7 3273.1 3699.2 14216.6
1. Excludes Treasury Bills; include Federal Government Securities issued outside Malaysia.2. Between 1960 and 1969, obtained as the difference between Loans and a catch-all item including Loans -F State and Local Government Securities.
3. Loans on Mortgage + Debenture Loans for 1960-1969.
4. Includes investment in Land and Buildings, i.e., fixed assets.Source: (i) Bank Negara Malaysia, Quarterly Bulletin various issues.
(ii) Lee, H.L., "Household Savings in West Malaysia", for "Loan" Figures only, between 1960-1969.
68 RESOURCE MOBILIZATION AND ALLOCATION
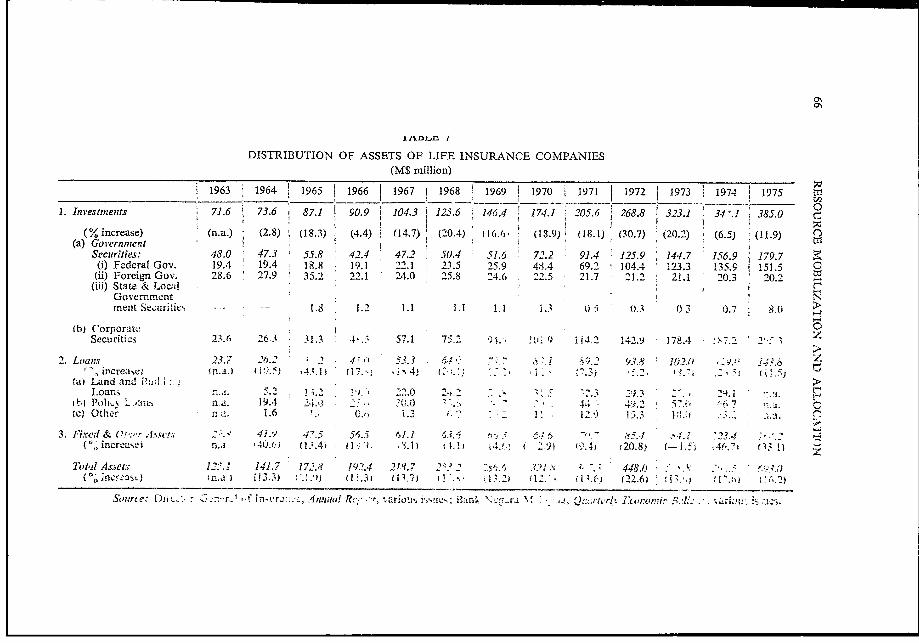
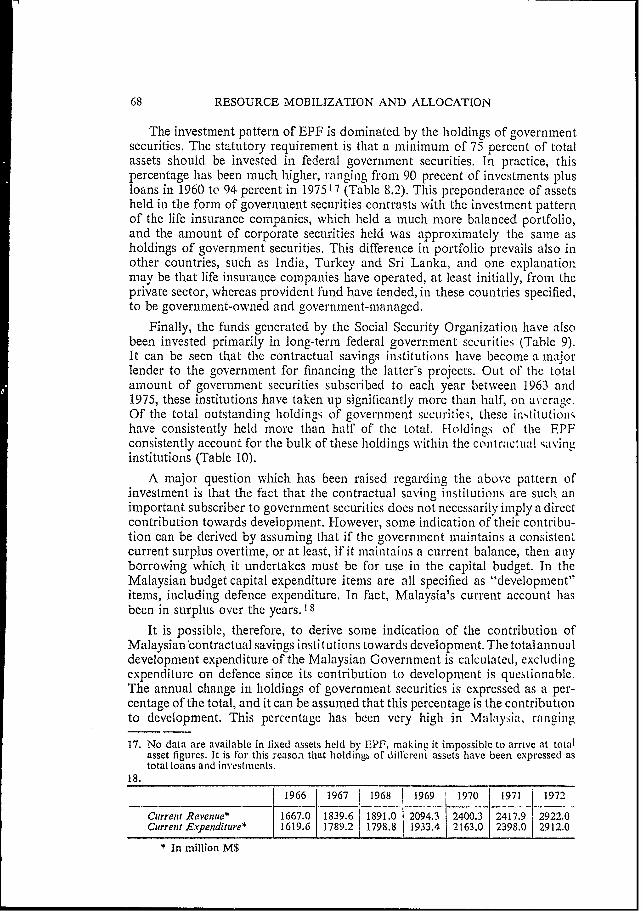
The investment pattern of EPF is dominated by the holdings of governmentsecurities. The statutory requirement is that a minimum of 75 percent of totalassets should be invested in federal government securities. In practice, thispercentage has been much higher, ranging from 90 precent of investments plusloans in 1960 to 94 percent in 197517 (Table 8.2). This preponderance of assetsheld in the form of government securities contrasts with the investment patternof the life insurance companies, which held a much more balanced portfolio,and the amount of corporate securities held was approximately the same asholdings of government securities. This difference in portfolio prevails also inother countries, such as India, Turkey and Sri Lanka, and one explanlationmay be that life insurance companies have operated, at least initially, from theprivate sector, whereas provident fund have tended, in these countries specified,to be government-owned and government-managed.
Finally, the funds generated by the Social Security Organization have alsobeen invested primarily in long-term federal government securities (Table 9).It can be seen that the contractual savings inistitutions have become a majorlender to the government for financing the latter's projects. Out of the totalamount of government securities subscribed to each year between 1963 and1975, these institutions have taken up significantly more than half, on average.Of the total outstanding holdings of government sccurities, these institutionshave consistently held more than half of the total. H-loldings of the EPFconsistently account for the bulk of these holdings witlhin the contraCtUlal avinginstitutions (Table 10).
A major question which has been raised regarding the above pattern ofinvestment is that the fact that the contractual saving institutionis are such animportant subscriber to government securities does not necessarily imply a directcontribution towards development. However, some indication of their contribu-tion can be derived by assuming that if the government maintains a consistentcurrent surplus overtime, or at least, if it maintains a current balance, then anyborrowing which it undertakes must be for use in the capital budget. In theMalaysian budget capital expenditure items are all specified as "development"items, including defence expenditure. In fact, Malaysia's current account hasbeen in surplus over the years. 1 8
It is possible, therefore, to derive some indication of the contribution ofMalaysian contractual savings institutions towards development. The totalannualdevelopment expenditure of the Malaysian Government is calculated, excludingexpenditure on defence since its contribution to developmenit is questionable.The annual ciange in holdings of government securities is expressed as a per-centage of the total, and it can be assumed that this percentage is the contributionto development. This percentage has been very hiigh in Malay:;ia, ranging
17. No data are available in fixed assets held by EP3F, making it impossible to arrive at totalasset figures. It is for this reasozi that holdiings of dillcreniL assets have been expressed astotalloans and investments.
18.
1966 1967 1968 1969 1970 1971 1972
Current Revenue* 1667.0 1839.6 1891.0 2094.3 2400.3 2417.9 2922.0Current Ex.penditure* 1619.6 1789.2 1798.8 1933.4 2163.0 2398.0 2912.0
* In million M$
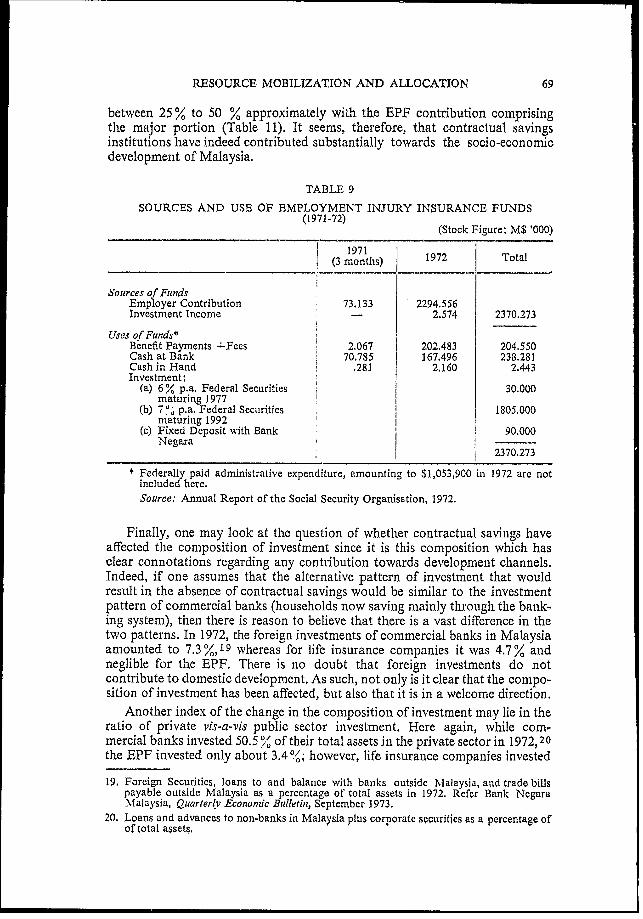
RESOURCE MOBILIZATION AND ALLOCATION 69
between 25 % to 50 % approximately with the EPF contribution comprisingthe major portion (Table 11). It seems, therefore, that contractual savingsinstitutions have indeed contributed substantially towards the socio-economicdevelopment of Malaysia.
TABLE 9
SOURCES AND USE OF EMPLOYMENT INJURY INSURANCE FUNDS(1971-72)
(Stock Figure: M$ '000)
I 1971 17 oa(3 months) 1972 Total
Sources of FundsEmployer Contribution 73.133 2294,556Investment Income - 2.574 2370.273
Uses of Funds?Benefit Payments +Fees 2.067 202.483 204.550Cash at Bank 70.785 167.496 238.281Cash in Hand .281 2.160 2.443Investment:
(a) 6 % p.a. Federal Securities 30.000maturing 1977
(b) 7 ", p.a. Federal Securities 1805Q000maturing 1992
(c) Fixed Deposit with Bank 90.000Negara
2370.273
* Federally paid administrative expenditure, amounting to $1,053,900 in 1972 are notincluded here.Source: Annual Report of the Social Security Organisation, 1972.
Finally, one may look at the question of whether contractual savings haveaffected the composition of investment since it is this composition which hasclear connotations regarding any contribution towards development channels.Indeed, if one assumes that the alternative pattern of investment that wouldresult in the absence of contractual savings would be similar to the investmentpattern of commercial banks (households now saving mainly through the bank-ing system), then there is reason to believe that there is a vast difference in thetwo patterns. In 1972, the foreign investments of commercial banks in Malaysiaamounted to 7.3 %,19 whereas for life insurance companies it was 4.7% andneglible for the EPF. There is no doubt that foreign investments do notcontribute to domestic development. As such, not only is it clear that the compo-sition of investment has been affected, but also that it is in a welcome direction.
Another index of the change in the composition of investment may lie in theratio of private vis-a-vis public sector investment. Here again, while com-mercial banks invested 50.5 of their total assets in the private sector in 1972, 20the EPF invested only about 3.4%/; however, life insurance companies invested
19. Foreign Securities, loans to and balance with banks outside Nfalaysia, and trade billspayable outside Malaysia as a percentage of total assets in 1972. Refer Bank NegaraNalaysia, Quarterlv Economic Bulletin, September 1973.
20. Loans and advances to non-banks in Malaysia plus corporate securities as a percentage ofof total assets,
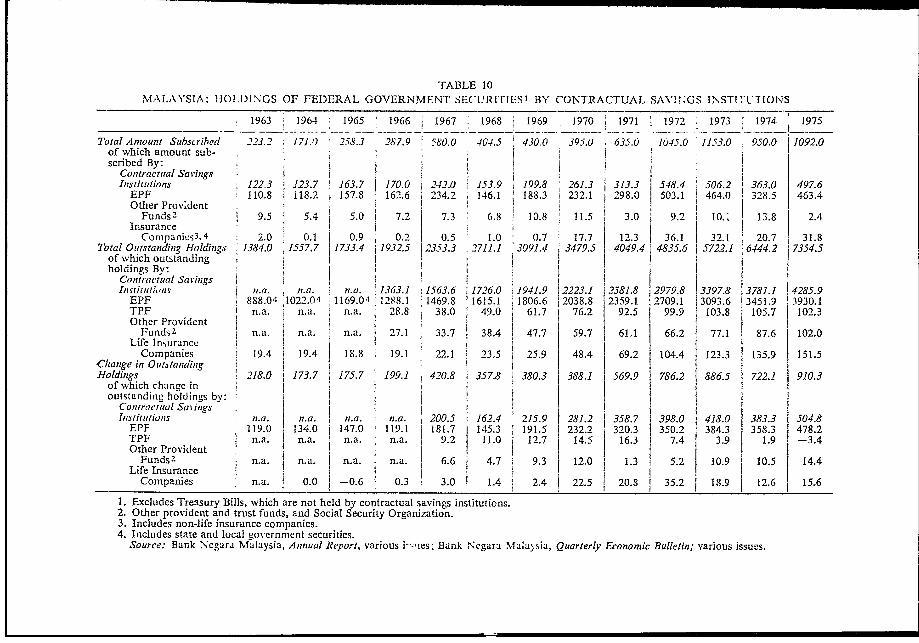
TABLE 10
AMA LAkYSIA: HO 1)DI NGS OF FEDERAL GOVERNMENT SECU RIT IES' B3Y CONTRACTUAL SA\'1 -GS INSTI TU1T IONS
1963 1964 1965 1966 j1967 1968 1969 1970 1971 1972~ 1973 I1974 1975
Total Amount Suibscribed 223.2 1711.0 258.3 287.9 58'0.0 404.5 430.0 395.0 635.0 1045.0 11.53.0 950.0 11092.0of which amount sub-scribed By:
C'ontractual Sav-ings IInistituitions 122.3 123.7 163.7 170.0 1242.0 153.9 199.8 261.3 313.3 548.4 506.2 363.0 497.6
EPF 110.8 1 118.2 157.8 162.6 234.2 146.1 188.3 232.1 298.3 503.1 464:0 328.5 463.4Other Provdent
FundS2 9.5 5.4 I 5.0 7.2 7.3 6.8 10.8 11.5 3.0 11 9.2 10.' 13.8 2.4Insurance
Cornpanies33.4 2.0 0.1 0.9 0.2) 0.5 1.0 0.7 17.7 12.3 36.1 32.1 20.7 31.8Total Ouitstaniding Holdings 1384.0 1-557.7 1733.4 1932.5 2353.3 2711.1 3091.4 3479.5 4049.4 4835.6 5722.1 6444.21755
of which outstandingholdings By:
Contractual Savings IIInrtitiunaii na. nz.a. n a. 1363.1 I 1563.6 1726.0 11941.9 2223.1 25,81.8 29719.8 3397.8 I3781.1 4285.9
EPF 888.04 'Il022.0 4 1169.04 1288.1 1469.8 1615.1 11806,6 i 038.8 2359.1 2 7 09. 1 3093.6 3451,9 3930.1TPF In.a. n.a. 2.. -8.8 38.0 49.0 61.7 76.2 92.5 99.9 103.8 I105.7 102.3Other Provident
FundS2 nna n.a n.a 27.1 33.7 38.4 47.7 59.7 61.1 66.2 77.1 87.6 102.0Life InsuranceI
Companies 19.4 j19.4 18.8 19.1 22.1 223. 5 25.9 48.4 69.2 104.4 123.3 I135.9 151.5('lhange in OutstandingHT-oldings 218.0 173.7 175 7 199.1 420.8 357.8 380.3 388.1 569.9 786.2 886.5 722.1 910.3of which change inoutstanding lhoidin-s by:I
Co,uia u nS z.a. n.a. ii.a. n.a. 200.5 162.4 259 812 3.7 9.0 418.0 383. 0.EPF 119.0 134.0 147.0 119.1 181.7 145.3 191.5 232.2 320.3 350.2 383 353 472TPF n.a. n.a. n.a n.a. 9.2 11.0 12.7 14.5 16.3 7.4 3.9 1.9 -3.4Other ProvidentI52
Funds 2 n.a. In.a. n.a n.a. 6.6 4.7 9.3 12.0 1.3 52 10.9 10.5 14.4CompIsuanies . . 4 2 2 0 5 8 2 5
Lifompuance n.a. I 0.0 0.6 0. . . 24 2 2. 5 2.. . 1. 26 1
1. Excludes Treasury Bills, which are not held by contractual savings institutions.2. Other provident and trust funds, and Social Security Organization.3. Includes non-life insurance companies.4. Includes state and local g-overnmient securities.
Source: Bank Negara Mfalay,sia, Aninual Report, various i-'ies; Bank Negara NMala)sia, Qutarterly Economiic Bulletin; various issues.
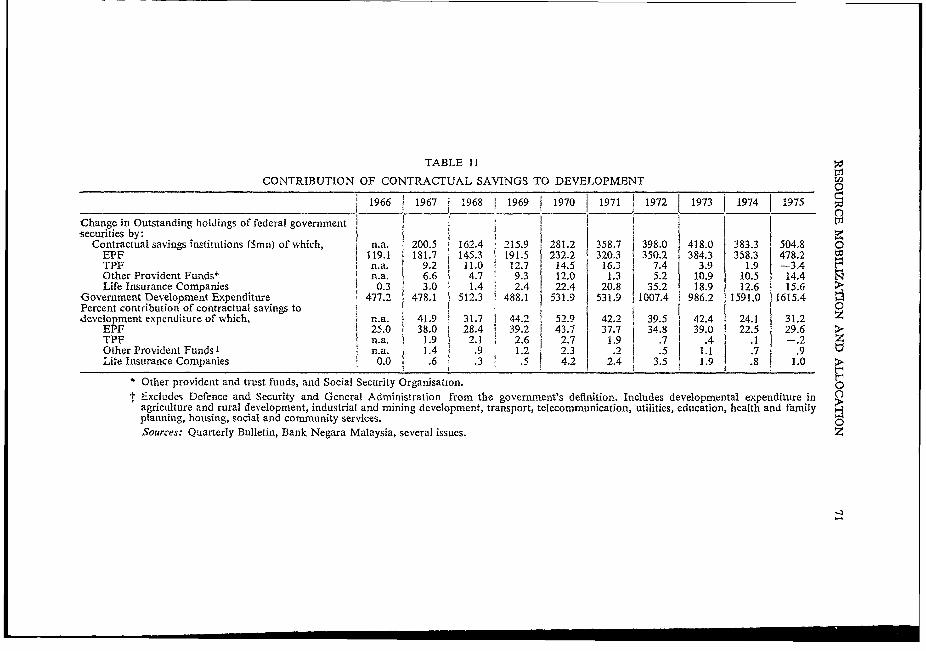
TABLE 11t3l
CONTRIBUTION OF CONTRACTUAL SAVINGS TO DEVELOPMENT -
1966 1967 1 3968 1969 1970 1971 _ 1972 1973 1 1974 1975
Change in Outstanding holdings of federal government I I isecurities by: I
Contractual savings institutions (Smn) of which, n.a. 200.5 162.4 215.9 281.2 358.7 398.0 418.0 383.3 504.8 0
EPF 119.1 181.7 145.3 191.5 232.2 320.3 350.2 384.3 358.3 478,2 a
TPF i n.a. 9.2 11.0 12.7 14.5 16.3 I 7.4 3.9 1.9 -3.4Other Provident Funds* n.a. 6.6 4.7 9.3 12.0 1.3 5.2 10.9 10.5 14.4 ELife Insurance Companies 0.3 3.0 1.4 2.4 22.4 20.8 35.2 1 18.9 12.6 15.6 >
Government Development Expenditure 477.2 478,1 512. 3 488.1 531.9 531.9 1007.4 1 986.2 1591.0 1615.4 5Percent contribution of contractual savings to I . l-development expenditure of which, n.a. 41.9 31.7 44.2 52.9 42.2 39.5 42.4 24.1 31.2 Z
EPF 1 25.0 38.0 28.4 39.2 43.7 37.7 34.8 39.0 22.5 29.6 >TPF n.a. 1.9 2.1 2.6 2.7 1.9 7 1.4 .1 9 2Other Provident Funds I n.a. 14 9 .2 2.3 .2 7 .5 1.1 ,7 .9Life Insurance Companies 0.0 .6 .3 T 5 4.2 2.4 3.5 1.9 .8 1.0
$ Other provident and trust funds, and Social Security Organisation. ot Excludes Defence and Security and General Administration from the government's definition. Includes developmental expenditure in g
agriculture and rural development, industrial and mining development, transport, telecormnunication, utilities, education, health and family >planning, housing, social and community services. o
Sources: Quarterly Bulletin, Bank Negara Malaysia, several issues. Z
72 RESOURCE MOBILIZATION AND ALLOCATION
52.8 % of theirs. Since the EPF comprises the major portion of contractualsavings, we may conclude that c-, tractual savings instit-tions have altered thecomposition of investment betwe- the private and puolic sector.
V. CONCLUSIONS
Contractual savings institutions have not affected aggregate savings adverselyand, indeed, may have a positive impact on them. If that is true, i.e. the totalassets in the economy have increased, and since the additional asset form isprimarily available to middle and lower income groups, then the wealthdistribution in the economy must have improved,
On the allocation side, it is quite clear that the composition of investment hasbeen affected. First, these institutions have purchased a major bulk of newissues and have continued to hold a substantial share of all outstanding govern-ment securities. From our analysis, it seems clear that much of these borrowingsby the government went to the Development Budget since the current accounthas run a siirplus on a trend basis. Since we find, further, that the government'sallocation in the development budget conforms more towards socio-economicdevelopment than that of the banking institutions, we concluide that contractualsavings institutions have contributed more towards development than wouldhave occured in their absence. Since an investment pattern geared toward socio-economic development should lead eventually to better income distribution,we can carry the poirnt further to say that these institutions have contributed tobetter income distribution. The phrase "pension fund socialism", therefore, iswell justified in the Malaysian case.
American University, Washington, D.C., andThe World Bank, Washington, D.C.
Lab-wrndio ot'il, Vol.5, No. 1, January 1980
,L11 ;d . w. iitxids in Singapore and
1sw I'.arthal.lsarahi Shome}zl.Assoceiate F rotfrssor of 'Feo.anoics. A mericran Un;ivrersity,and Nnsulltant, Wrildrr Bank, 'tWa,sh ilwt nn
02^.'q 141!ULl 5 ri'. s: i.. 'is a basic nit'ii- '. in huiman affairs. The developmentof socia*l /.t wr'rou ur'li.;u ''; 1 >ti'l7t pr;;Nitlenlt funds and pension scheme.sreik.-.s this nmotive in) the7iir !' dulCrit'u! of the financial insecurity associated wvithIn-t'. old itcc, and ir;lv&iti;v. i1 fe (mergenceM of such institutions, howtever,
*\' n ;i5, i.s as a b1- itrtae the acctumulalrtion of financial resources, since thes'tr;* gtiC- .,ai..l;w Tsrls .ced heir p)avmn ets. In econlomies
'vne;lt^t laboutr force an,d ill&ncoms are rapidily growingt, the surpluses of suchirns il^ 'i:ns typAically peiL rmn an1 important role in the inobilisation and,'idl .v lion of r5e'.our'LtC . I-ht . y:ftr iS prnma rily concerned with the latter effect,n.nm. iv' the f4 lc8''.;A'I tOt5 nit .estrueent pBolicies of social security institutions on
Jao..*ur and ocet;JI ';l'Ct ace f man .Tl d elovNA 1 untri es bears witness to the significant
conIrI!tut!an whra h cotrctln, tU sehenies such as pension funds and other socialAssociate ssroft-is crn make, at a crucial devaelopmnt stage. by innovativelylIt c:' :ag the '.plus hindsi. 1 Although in many developing countries socialofe sIr al ,n1 are Ni ii liniit&h in opweraltion and coverage, in sme o ef them
tl,: havelt itieid tdevelope into maojr tluasi-iinancial institu tions. We have
.t% co.d two such cndnt%Jzs'. S.ini-e:Iotlre and the Phsiuclpinest ith u igniawevenrM
1 .1 security ins:til ut ios.^ in h' rmn . of both} the working population covered1 as\%l eis volumes of resoura n zlioijised , ntIn( yet providing in1teresting contrastsin heir FC%)uitU as llion tlicie'c 11uiu lprimnary s.ocial securits schemne in
ofiorc iS; _h. C entral Provident ondn (cPU, blegun in 1955, while theos in
theiipprinesi are the Goserumnit Seice Insutranc System (GS atSi begun in
. - .:1!o I nternational Labour ()rganisation iln: oernati edw Institute tfor Labur Studies) 1980
20 Laboutr atzlh Societv
1936, and the Social Security System (S5S), begun in 1954. Our analysis in thispaper ref,crs to these systemis.
In Singapore. 100 per cent of the working population was covered by CPFprovisions by 1976, atnd savings through CPF comprised an average of 32 percent of total housenold savings between 1961 and 1976. In the Philippines thesefigures were 48 per cent (in 1975) and 21 per cent (1951-1974 average)respectively. The impact which these substantial volumes of funds can make on
the over-all economnic and social development of the country depends criticallyoIn how they are invested.
Before examiniing the allocation patterns of social security surpluses, certaingvnieral criteria guiding the inivestment need to be specified. This is done in thenext section. The actual experiences of Singapore and the Philippines areinalvscd in the last section, followed by concluding remarks.
Inestnment criteria for social security finds
It is generally true that the obligations of social security institutions are of al'ilt ermn nature and are, to some extent, actuarily determinable. It may not be
n ree ,> iherefore. for these institutionis to maintain large liquid reserves. Forcxai.ple, in the case of provident funds, withdrawals are permitted only ondeath, permanent disability or retirement at a specified age, so that expectedpayments can be actuarily determined. This makes these funds suited tofinancing social projects with relatively long gestation lags.
At the same time, genuine security and optimum yield on these investmentsare also iml-pcortant from the point of view of the contributors who have
entrusted the social security institutions with the proper care of and return ontheir savings through some form of social contract. Thus the funds should beinvested in assets which are both safe and easily marketable to ensure thecontinued confidence of contributors and to be able to fuifil contractualoblig,ations speed ily.2
Obtaining an optimal rate of return for policy holders may not be consistentwith the government's perception of the investment pattern most conducive toecononmic development. The government may be sensitive to social and politicaldnemands for uses of what are often termed as "public funds". When social~ecurity institutiions are subject to constraints on their pattern of investment,then this does curtail their administrative freedom with an adverse effect oncash mnanagement. In most cases, however, there are restrictions on inivestnment
policies, and possibly with their own beneficial effects. Such restrictions shouldbe acconmpanied with responsibility, however, as we explain below,
utate influence on the funds
A suir,ey of the use of social secuLritv fundls in some developing nationsclearlv reveals the extent of State influence over these funds.3 Penision and
Provident funds. hiistorically having been tinder the government's wing, are
Social secuittfunds in Sin pauporw and the Philippines 21
subject to an array of stringent restrictions in terms of their investment policies.In Sin; t.pore. State influence on the allocation pattern of the funds has beenvery sit"n.itficant for the >tare, through a requirement that the entire CPF fundbe investeet in g(g wernnikct stock, has enmbarked on an ambitious programme ofmass housing, already cOveliiog 50 per cent of the population. In thePhilippines, there is no xuch requirement, with investment in a fairly widevariety of a,ssets hav1ng be en auth(orised.
If the State does, however exert this much influence ovqer the investment ofsurpluses, then it shouilld be obliged to a positive rate of returm, comparable tothose from alternative investment possibilities. The State should bear thecapital loss, if any, of social investmernts. Tbus State responsibility mustaccompany State control and regulation of the investment of the accunmulatedsurpluses.
The ih3 rptlve carf,MFct lue5ion1ij
Any attemipt towards the appraisal of the portfolio of social securityinistitutions has to be looked at in terms of the investment opportunities whichare available. This is particularly true when debating the allocation of funds tothe public vis-;l-vi the prii .tt -t ei t. In developing countries, it is pertinent toask wvhether or not; the :'.. siuctor offers viable long-term securities whichwoulld be appiroprinte pen, i5 nn fiund assets. If the private sector offers primarilyshort-term securilties. tlen it Abviously cannot take advantage of the long-termhorizon during which social security funds may be invested. The whole questionof the limited absorptivc eapacity of the private securities market in developingeconomies needs to be assessed. It may, therefore, be unrealistic to criticisethose social security schemes which have invested predominantly in governmentsecurities without properly assessing alternative investment opportunities.
It may be possible, sometimes, to combine social aims with the financialimperatives in allocating the funds. In the long run, failure to adhere to soundfinancial principles benefits few. As in Singapore, social objectives may besuccessfully achieved subject to a minimum profitability constraint. In thissenise, it is profitable to invest funds in specific projects rather than put theminto a general budget sinice the latter's profitability is not so easily reckoned. Inanother developing country, India for example, the share of governmentsecuirities in the total portfolio of social security funds, to be used for non-specific purpouses. lias been falling on a trend basis and direct, approved,investnments in water supply. electricity and other forms of social infrastructureh ave been rising.
Impact on wealti and incoijie distkiliution
Social securitv institutidoos can have a decisive impact on wealth and incomedistribution. Inasniuch as eLmnployers are contributing to social security funds,the m1aniagers of these funds are being entrusted with the function ofdistributing, -within society, the wealth which these employers, together withtheir employees. crezite. To quote Harbrecht :4
22/ /h?&'adStit
financial i I'. ivii-s i ni ai fiIn&i'. iniS raiIbt'e . iiI' i-"i . prtnision trvPti' standready to take the' . ,! i;r I in 'ot w u tl-n !htC'iisVNtil1 In iil xiu'1t ;aj 5L'.I'. ji>^ w:' ;1/df. ¢W E3^i ti!lw^ ( it; E I,investmcx i a 't, '' 'bto riscapital are TItIW r )tae "avo ra iv, ,f .' 4 t ris k "u isintrign:rw to v tti,5nt if 1I ''. . . s '' iv ,ii'. , aflflthe inutual i]i '- i t na .-. iltnip us'apiiallisrii, th .
In thie eou ''! . . i *hconclusion mc'' * 1 nt114 f IT'coIII
distritilbtioi , .4 iIs ai if'bio. is we shallsee below
Peop)l'. i; 'tl bx ' '''- ' 'i t 'i: tt . t r 'on prod1 t iigjwealth, and hi t 'ra pt ' be to trliot'iituc thiskind . t . ' Isir's Iicorporatitins, PI *, r ii ,- .5 h a :iLMfliCt icili'triinltgassets, jtil ti" , 'I ;. i Yt .'In ... llt ii h 5 shlar e in theitie20fliC-''s4,'iXj0'" * h ;e as r ''r' "' -i>'3 3 3 l t'u''\hi; int 1t;'right dir: t'i' in ' .1 r .' s'1itV !idi'.
I1aVT|!le 1v4lool , . *'; 'i ? ;'.,2i'f 4; X atAl4}{r;ti!\ I'ti 1i riOiIS,
the 'liilir -M.-
The te`tUa' ' 1)1. 1 . i1 1 er '.d i ini ;i)ei andthe Phlfipr"pine: - 1 : t u' holir aire theseinvestnment p t.? ic 'eli e. . - 'I 'iid! 1k il.'tlar'e'id'iS f thle
investment di. '" . ' ,wr 10 '' 1 ix' slineiitioi of theinvestment poi.o i-e hI . i iWud!'d il theinvestmer poflv- How ' aw . ii . erl.C'ir thesocial criteria . if v thie 1 cc .o,o' th e;'' i r, :rlJxt'i cr ft this
section.
Social securht; l,tliiciir4 4t74cO
.Viigizpt're' f; c'IJr. "e :i' (, .,r' r - X , t ; Ct P F ( Pn iip.il t t'mj'eli r ofboth corporatoe anf'l sc';vm ni_ e , .;, rli. to Contribute: in
tact. "any whom alleniplowve' is '' t . litii tlh p1.imeatoll of
Wxages to aii igm 1'. i u i: i .! ' '' " 'd 'I 'Ii'^ ' lo 1ye (aI'11np1i'twO t'pay 15C.2 I L . 4 Ull tt .% ix'I. i, I I . o i>uth.;n, th e rate hIs i liigexpanded grail iml V.i * . iT 'S CP1F i, admniiai;.tredby a hoard., eno'r' 'i0'' i V 'e' ' . 'F, .a. fi' governmilent, an'.l sixother mienmbers,. Of thie ''itAw'' *il .t rI e.'oi Ailc'Ir5,. two repr,eliternployers. andl two is ipr'r"ril en'pl' "o' I hi'!e dud is entrusted %;itlh policingthe actual in;'c-swim f. ( Cl*Fi ' . 'tL .:rovp'rnnent supui,a;nrr.
Social securityfunds in Singapore atnd the Philippines 23
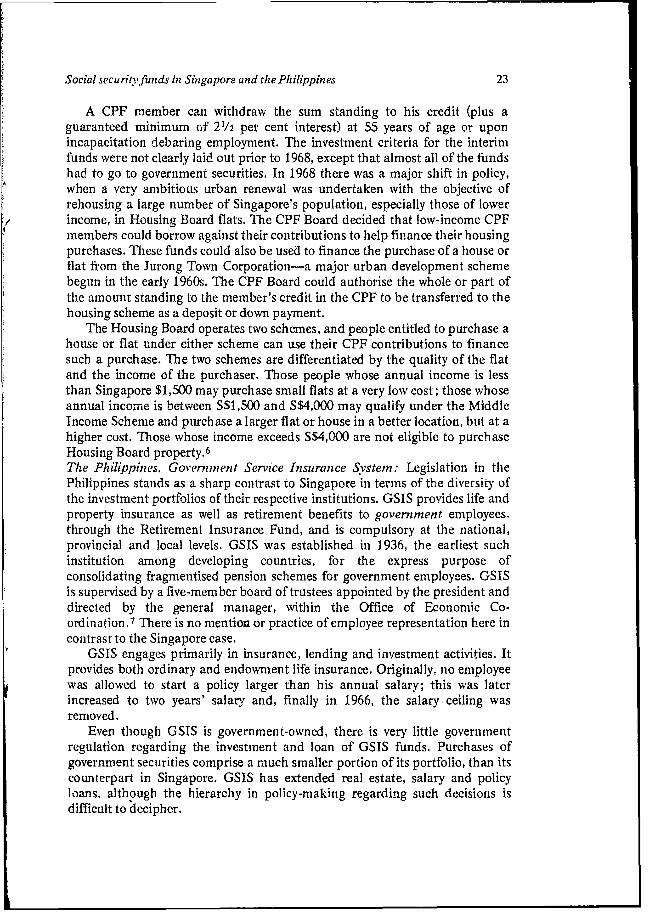
A CPF member can withdraw the sum standing to his credit (plus aguaranteed minimum of 21/2 per cent interest) at 55 years of age or uponincapacitation debaring employment. The investment criteria for the interimfunds were not clearly laid out prior to 1968, except that almost all of the fundshad to go to government securities. In 1968 there was a major shift in policy,when a very ambitious urban renewal was undertaken with the objective ofrehousing a large number of Singapore's population, especially those of lowerincome, in Housing Board flats. The CPF Board decided that low-income CPFmembers could borrow against their contributions to help finance their housingpurchases. These funds could also be used to finance the purchase of a house orflat fiom the Jurong Town Corporation-a major urban development schemebegun in the early 1960s. The CPF Board could authorise the whole or part ofthe amount standing to the member's credit in the CPF to be transferred to thehousing scheme as a deposit or down payment.
The Housing Board operates two schemes, and people entitled to purchase ahouse or flat under either scheme can use their CPF contributions to financesuch a purchase. The two schemes are differentiated by the quality of the flatand the income of the purchaser. Those people whose annual income is lessthan Singapore $1,500 may purchase small flats at a very low cost; those whoseannual income is between S$1,500 and S$4,000 may qualify- under the M'viddleIncome Scheme and purchase a larger flat or house in a better location, but at ahigher cost. Those whose income exceeds S$4,000 are not eligible to purchaseHousing Board property. 6
The Philippines. Governznent Service Insurance Svstem: Legislation in thePhilippines stands as a sharp contrast to Singapore in terms of the diversit ofthe investment portfolios of their respective institutions. GSIS provides life andproperty insurance as well as retirement benefits to government employees.through the Retirement Insurance Fund, and is compulsory at the national,provincial and local levels. GSIS was established in 1936, the earliest suchinstitution among developing countries, for the express purpose ofconsolidating fragmentised pension schemes for government employees. GSISis supervised by a five-member board of trustees appointed by the president anddirected by the general manager, within the Office of Economic Co-ordination.7 There is no mention or practice of employee representation here incontrast to the Singapore case.
GSIS engages primarily in insurance, lending and investment activities. Itprovides both ordinary and endowment life insurance. Originally, no employeewas allowed to start a policy larger than his annual salary; this was laterincreased to two years' salary and, finally in 1966, the salary ceiling wasremoved.
Even though GSIS is government-owned, there is very little governmentregulation regarding the investment and loan of GSIS funds. Purchases ofgovernment securities comprise a much smaller portion of its portfolio, than itscounterpart in Singapore. GSIS has extended real estate, salary and policyloans, although the hierarchy in policy-making regarding such decisions isdifficult to decipher.
24 Laibozur (itd Societ.y
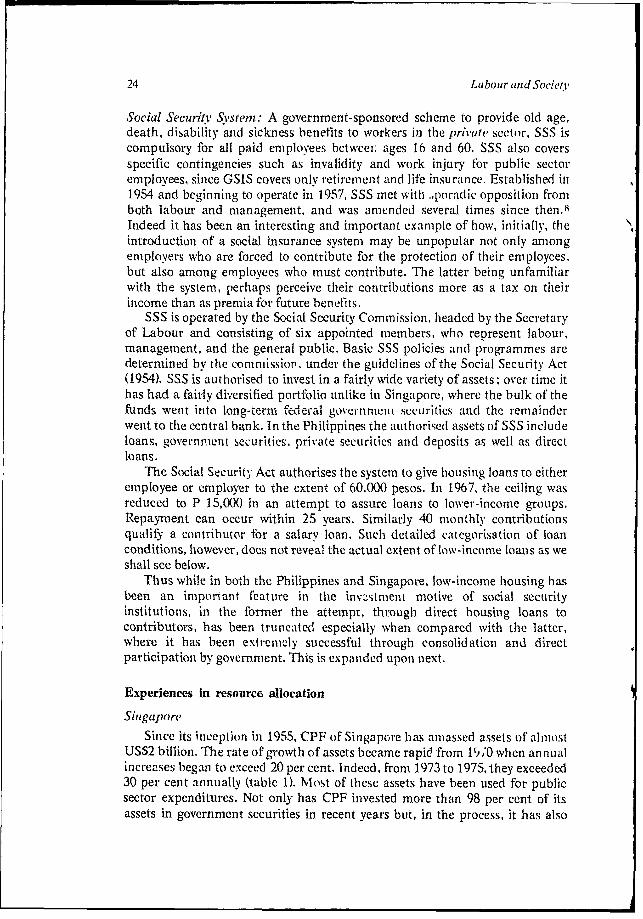
Social Security Syvstem: A government-sponsored scheme to provide old age,death, disability and sickness benefits to workers in the priaute sector, SSS iscompulsory for all paid employees betweer. ages 16 and 60. SSS also coversspecific contingencies such as invalidity and work injury for public sectoremployees, since GSIS covers only retirenment and life insurance. Established in1954 and beginninig to operate in 1957, SSS met witlh ..poradic opposition fromboth labour and management, and was anmended several times since then.8
Indeed it has been an interesting and important exanple of how, initially, theintroduction of a social insurance system may be unpopular not only amongemployers who are forced to contribute for the protection of their employees,but also among employees who must contribute. The latter being unfamiliarwith the systenm, perlhaps perceive their contributions more as a tax on theirincome than as premia for future benetits.
SSS is operated by the Social Security Commission. headed by the Secretaryof Labour and consisting of six appointed members, who represent labour,management, and the general public. Basic SSS policies iin(d programmes aredetermined bv the comnmissior. under the guidelines of the Social Security Act(1954). SSS is authorised to invest in a fairly wide variety of assets, over time ithas had a fairly diversified portfolio unlike in Singapore, where the bulk of thefunds went into long-term, federal gok-erlnmLnt securities and the remainderwent to the central ban k. In the Philippines the authlorised assets of SSS inelLideloans, government securities. private securities and deposits as well as directloans.
The Social Security Act authorises the system to give housing loans to eitheremployee or employer to the extent of 60,00 pesos. In 1967. the ceiling wasreduced to P 15,000 in an attempt to assure loans to lower-income groups.Repayment can occur within 25 years. Similarly 40 nmonthly contributionsqualifV a contributor for a salary loan. Such detailed categorisation of loanconditions, however, does not reveal the actual extent of low-income loans as weshall see below.
Thus while in both the Philippines and Singapore, low-income housing hasbeen an inmportant feature in the invzstment motive of social securityinstitutionis, in the former the attempt, through direct housing loans tocontributors, has been truncated especially when compared with the latter,where it has been extremely successful through consolidation and directparticipation by government. This is expanded upon next.
Experiences in resoiarce allocation
Singapore
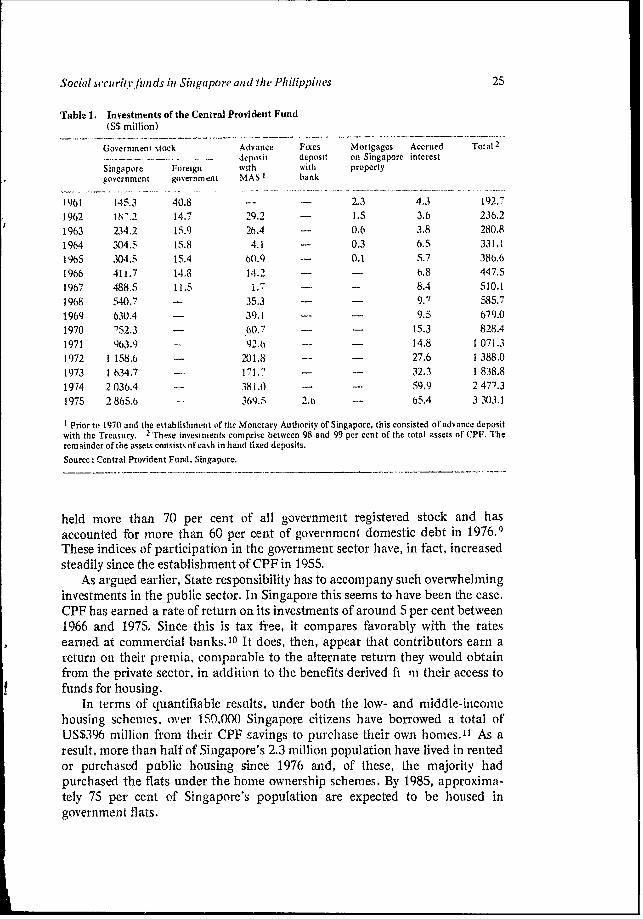
Since its inception in 1955, CPF of Singapore has anmassed assets of almliostUS$2 billioti. The rate of growth of assets became rapic from 19 0 when an nuialincreases began to exceed 20 per cent. Indeed, from 19 73 to 1975, they exceeded30 per cent annually (table 1). hlost of' these assets have been used for publicsector expenditures. Not only has CPF invested more than 98 per cent of itsassets in government securities in recent years but, in the process, it has also
Socia acc fii inds in Sinigapore, and the Philippines 2
Table 1. Investments of the Central Provident Fund(S$ million)
Government stock Advance Fixes Mortgages Accrued Total 2deposit deposit on Singapore interest
Singapore Foreigni with with propertygovernment government M AS t bank
1961 145.3 40.8 .-- - 2.3 4. 3 192.7
1962 1 .2 14.7 29.2 - 1.5 3.6 236.21963 234.2 15.9 26.4 0.6 3.8 280.81964 304.5 15.8 4.1 - 0.3 6.5 331,11965 304.5 15.4 601.9 - 0.1 527 386.61966 41j.7 14.8 14.2 - - 6.8 447.51967, 488.5 11.5 1. - - 8.4 510.11968 5,40.-7 35.3 - - 9.7 .585.7
1969 630.4 - 39.1 - - 9.5 679.01970 752.3 -. 60.7 - - 15.3 828.4
19711 963,9 92.6 - 14.8 1 071.31972 1 158.6 201.8 - - 27.6 1 388.0
1973 1 634.7 -*171.7 -- 32.3 1 838.8
1974 2 036.4 381.0 - -59.9 2 477.31975 2 865.6 369.5 2.o 65.4 3 303.1
Prior to 1970 and the establishment oif thie Monetary Authority of Singapore. this consisted of advance depositwith the Treasury. 2 These investments comprise between 98 and 99 per cent of the total assets of CPF. Theremainder of the assets consists of cash in hand fixed deposits.Source: Central Provident Fuind, Singapore.
held more than 70 per cent of all government registered stock and hasaccounted for more than 60 per cent of government domestic debt in 1976.9These indices of participation in the governiment sector have, in fact, increasedsteadily since the establishment of CPF in 1955.
As argued earlier, State responsibility has to accompany such overwhelminginvestments in the public sector. In Singapore this seems to have been the case.CPF has earned a rate of return on its investments of around 5 per cent between1966 and 1975. Since this is tax free, it compares favorably with the ratesearned at commercial banks.10 It does, then, appear that contributors earn areturn on their pr-ehiia, comparable to the alternate return they would obtainfrom the private sector, in addition to the benefits derived ft in their access tofunds for housing.
In termis of quantifiable results, under both the low- and middle-inicomnehousing schemies, over 150.000 Singapore citizens have borrowed a total ofUS$396 miillion fr-om their CPF savings to purchlase thieir own homnes. 1 ' As aresult, more than., half of Sinigapore's 2.3 mlillion population have lived in rentedor purchased public housing since 1976 and, of these, the majority hadpurchased the flats under the home ownership schemes. By 1985, approxima-tely 75 per cent of Singapore's population are expected to be housed ingovernmenit flats.
26 Labour anid Society
Table 2. Investments and loans of the Government Service Insurance System(P million)
Stocks and bonds Real estate & Salary Policy Devel- Other Totalmortgage loans loans opment
Government Other loans banksecurities
1954 39.6 16.0 19.7 12.1 40.7 8.7 136.81955 71.1 37.3 32.7 16.8 17.6 9.8 185.31956 9(.8 75.9 35.8 20.4 2.7 16.0 241.61957 30.0 37.0 135.8 40.0) 23.9 16.9 11.2 294.81958 28.0 26.6 1 75.4 43.5 27.6 32.2 1.4 334.71959 57.0 40.1 1'8.7 57.8 31.8 34.0 1.0 400.41960 95.0 37.5 197.4 82.3 36.4 35.8 1.1 485.51961 89.0 62.5 223.4 98.8 40.3 37.6 3.7 555.31962 101.0 81.1 241.0 100.6 44.5 39.9 5.1 622.21963 144.0 74.3 269.3 125.9 50.5 42.5 21.8 728.31964 1S0.(0 92.5 359.8 146.9 58.9 44.7 38.8 891.61965 153.0 116.1 495.0 164.8 69.9 - 32.1 1 030.91966 130.0 148.1 b68.3 203.0 83.6 - 22.5 1195.51967 110.0 172.2 707.6 246.1 99.9 21.1 1 356.91968 127.0 201.4 808.9 264.1 119.9 22.9 1 544.21969 135.0 229.6 932.6 284.4 143.9 - 22.7 1 748.21970 94.0 258.3 1 041.1 346.1 167.1 - 23.1 1 929.71971 78.0 262.1 1 210.1 380.7 190.2 - 58.1 2 179.51972 122.0 220.1 1 430.3 357.1 215.8 - 114.9 2 460.51973 1 104.0 309.0 1 839A 382.8 255.3 -- 159.1 3 049.61974 169.0 213.2 2 38 1.3 n.a. 280.9 - 526.92 3 5'3.3
1 1973 and 1974. Figures are frorn Insurance Commissioner Annual Reports. 2 Includes salary loans.Sources: GSIS Annual Reports and Insurance Commissioner Annual Reports (1973.74, 1974-'.S).
Clearly, CPF, acting as the financing agent for these public housingschemes, has successfully utilised its funds to house Singapore's low-incomepopulation. In this way, CPF has played a major role in the development ofSingapore's social infrastructure and has made possible a general sharing ofcapital wealth created in the economy.
The Philippines
Unlike in Singapore where the investment pattern of CPF has beenconstrained into purchasing government securities, the portfolio choices ofGSIS and SSS in the Philippines has taken a more diverse pattern, with aconcentration on direct policy, mortgage, housing and educational loans topG'icy holders. Recently, however, the investment policies of the Philippinessocial security institutions have been shrouded with lack of clarity and stand asa sharp contrast to Singapore.
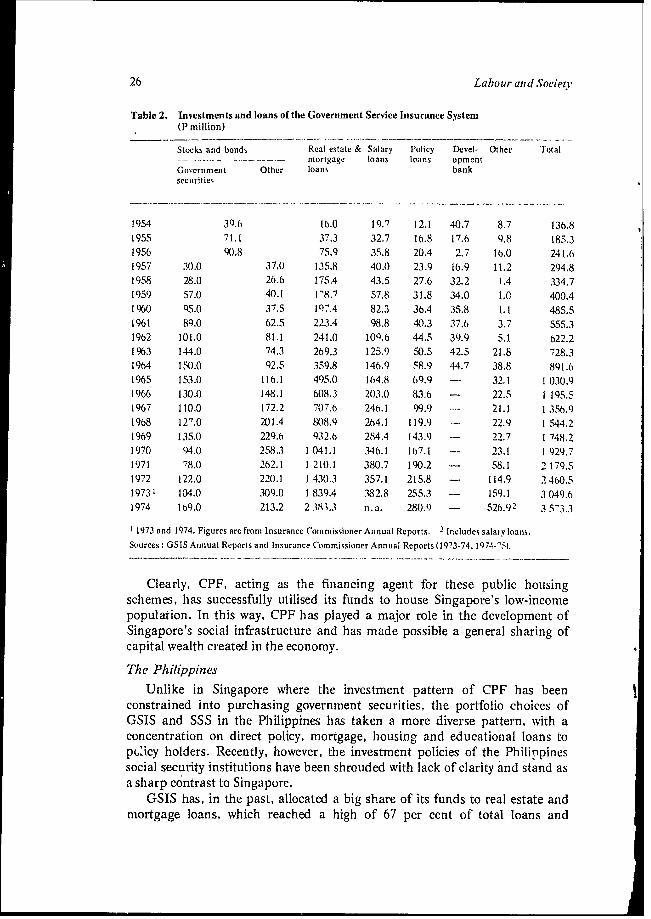
GSIS has, in the past, allocated a big share of its funds to real estate andmortgage loans, which reached a high of 67 per cent of total loans and
Social securit fuinds in Singapore and the Philippines 27
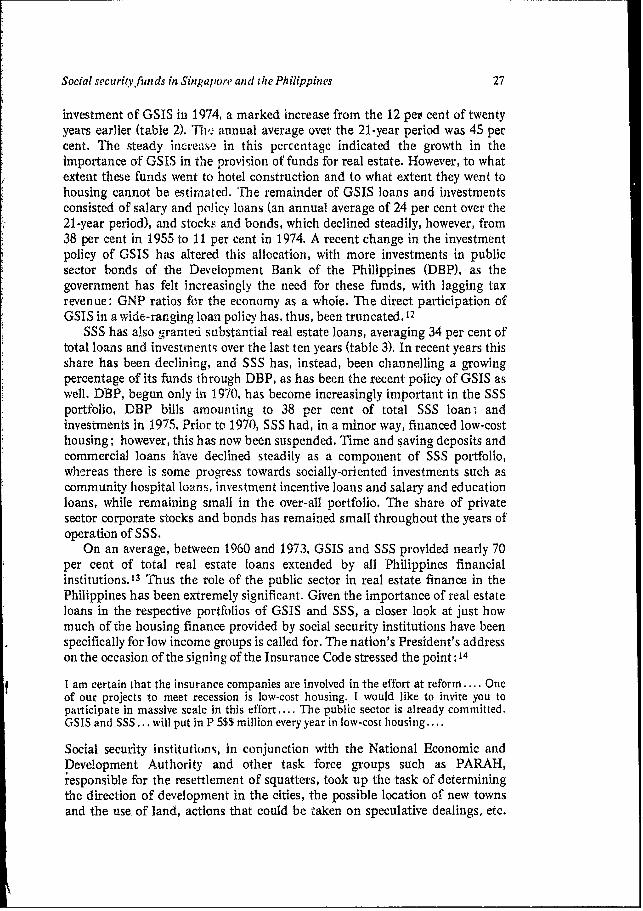
investment of GSIS in 1974, a marked increase from the 12 per cent of twentyyears earlier (table 2). Ml, annual average over the 21-year period was 45 percent. The steadv increase in this percentage indicated the growth in theimportance of GSIS in the provision of funds for real estate, However, to whatextent these funds went to hotel construction and to what extent they went tohousing cannot be estimated. Te remainder of GSIS loans and investmentsconsisted of salary and police loans (an annual average of 24 per cent over the21-year period), and stocks and bonds, which declined steadily, however, from38 per cent in 1955 to l1 per cent in 1974. A recent change in the investmentpolicy of GSIS has altered this allocation, with more investments in publicsector bonds of the Development Bank of the Philippines (DBP), as thegovernment has felt increasingly the need for these funds, with lagging taxrevenue: GNP ratios for the economy as a whole. The direct participation ofGSIS in a wide-ranging loan policy has, thus, been truncated. 12
SSS has also granted substantial real estate loans, averaging 34 per cent oftotal loans and investments over the last ten years (table 3). In recent years thisshare has been declining, and SSS has, instead, been channelling a growingpercentage of its funds through DBP, as has been the recent policy of GSIS aswell. DBP, begun only in 1970, has become increasingly important in the SSSportfolio, DBP bills amrnounting to 38 per cent of total SSS loan- andinvestments in 1975. Prior to 1970, SSS had, in a minor way, financed low-costhousing; however, this has now been suspended. Time and saving deposits andcommercial loans have declined steadily as a component of SSS portfolio,whereas there is some progress towards socially-oriented investments such ascommunity hospital loans, investment incentive loans and salary and educationloans, while remaining small in the over-all portfolio. The share of privatesector corporate stocks and bonds has remained small throughout the years ofoperation of SSS.
On an average, between 1960 and 1973, GSIS and SSS provided nearly 70per cent of total real estate loans extended by all Philippines financialinstitutions.13 Thus the role of the public sector in real estate finance in thePhilippines has been extremely significant. Given the importance of real estateloans in the respective portfolios of GSIS and SSS, a closer look at just howmuch of the housing finance provided by social security institutions have beenspecifically for low income groups is called for. The nation's President's addresson the occasion of the signinig of the Insurance Code stressed the point: 14
I am certain that the insurance companies are involved in the effort at reform.... Oneof our projects to meet recession is low-cost housing. I would like to invite you toparticipate in massive scale in this effort.... The public sector is already committed.GSIS and SSS.,. will put in P 5$$ million every year in low-cost housing....
Social security institutions, in conjuniiction with the National Economic andDevelopment Authority and other task force groups such as PARAH,responsible for the resettlement of squatters, took up the task of determiningthe direction of development in the cities, the possible location of new townsand the use, of land, actions that could be taken on speculative dealings, etc.
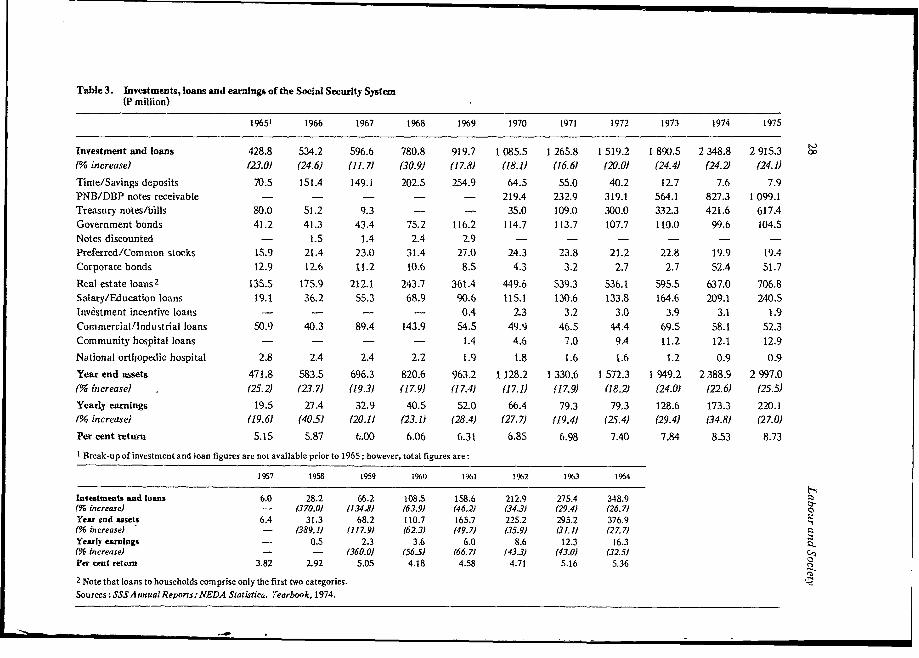
Table 3. Investments, loans and earnings of the Social Security System(P million)
19651 1966 1967 1968 1969 1970 1971 1972 1973 1974 1975
Investznent and loans 428.8 534.2 596.6 780.8 919.7 1 085.5 1 265.8 1 519.2 1 890.5 2 348.8 2 915.3 G
(%o increase) (23.0) (24.6) (11.7) (30.9) (17.8) (18.1) (16.6) (20.0) (24.4) (24.2) (24.1)
Time/Savings deposits 70.5 151.4 149.1 202.5 254.9 64.5 55.0 40.2 12.7 7.6 7.9
PNB/DBP notes receivable - - - - - 219.4 232.9 319.1 564.1 827.3 1 099.1
Treasury notes/bills 80.0 51.2 9.3 - - 35.0 109.0 300.0 332.3 421.6 617.4
Government bonds 41.2 41.3 43.4 75.2 116.2 114.7 113.7 107.7 110.0 99.6 104.5
Notes discounted - 1.5 1.4 2.4 2.9 - - - - - -
Preferred/Common stocks 15.9 21.4 23.0 31.4 27.0 24.3 23.8 21.2 22.8 19.9 19.4
Corporate bonds 12.9 12.6 11.2 10.6 8.5 4.3 3.2 2.7 2.7 52.4 51.7
Real estate loans2 135.5 175.9 212.1 243.7 361.4 449.6 539.3 536.1 595.5 637.0 706.8
Salary/Education loans 19.1 36.2 55.3 68.9 90.6 115.1 130.6 133.8 164.6 209.1 240.5
Investment incentive loans - - - - 0.4 2.3 3.2 3.0 3.9 3.1 1.9
Commercial/Industrial loans 50.9 40.3 89.4 143.9 54.5 49.9 46.5 44.4 69.5 58.1 52.3
Community hospital loans - - - - t.4 4.6 7.0 9.4 11.2 12.1 12.9
National orthopedic hospital 2.8 2.4 2.4 2.2 1.9 1.8 1.6 1.6 1.2 0.9 0.9
Year end assets 471.8 583.5 696.3 820.6 963.2 1 128.2 1 330.6 1 572.3 1 949.2 2388.9 2 997.0
(f5 increase) . (25.2) (23.7) (19.3) (17.9) (17.4) (17.1) (17.9) (18.2) (24.0) (22.6) (25.5)
Yearly earnings 19.5 27.4 32.9 40.5 52.0 66.4 79.3 79.3 128.6 173.3 220.1
(% increasei (19.6) (40.5) (20.1) (23.1) (28.4) (27.7) (19.4) (25.4) (29.4) f34.8) (27.0)
Per cent return 5.15 5.87 6.00 6.06 6.31 6.85 6.98 7.40 7.84 8.53 8.73
t Break-up of investment and loan figures are not available prior to 1965; however, total figures are:
1957 1958 1959 1960 1961 1962 1963 1964
Investments and loans 6.0 28.2 66.2 108.S 158.6 212.9 275.4 348.9(% increase) - (370.0) (134.8) (63.9) (46.2) (34.3) (29.4) (26.7) o
Year end assets 6.4 31.3 68.2 110.7 165.7 225.2 295.2 376.9
(% increase) - (389.1) (117.91 (62.3) (49.7) (35.9) (31.1) (27.7) 0
Yearly earnIngs - 0.5 2.3 3.6 6.0 8.6 12.3 16.3
(% increase) - - (360.0) (56.5) (66.7) (43.3) (43.0) (32.5)
Per "ent retuan 3.82 2.92 5.05 4.18 4.58 4.71 5.16 5.36 C°
2 Note that loans to households comprise only the first two categories.
Sources: SSSAnnualReports. NEDA Statistica., Yearbook, 1974.
Social security funds in Sinlougre 'and the Philippines 29
GSIS was supposed to be a source of finance for this over-all housingprogrammine from 1968. Hovever, this direct participation in the provision ofhiolusinig was not sustainod, W.th more of the funds being appropriated by theDBP, as explained earliur. The result of this change in policy, however, has notindicated any d ireet or better results.
Conclusion
The relative merits of contrasting allocative patterns of the social securityinstitutions in Singapore and the Philippines in terms of their impact on thefinancial, economic and social development of the country can be cited asfollows. In terms of financial development, it is clear that, in the case ofSingapore, the channelling of huge volumes of social security funds throughgovernment securities must have had a developmental influence on thesecurities market and Singapore has, after all, become the financial capital ofthe East. In the Philippines. however, the emphasis in the portfolio of socialsecurity institutions, in the early years, may have limited this effect, whilehaving its own merits.
In terms of economnic and social development, the results are, again, moreobvious in the case of Singapore. State responsibility has accompanied Statecontrol in Singapoze. While direct loans to participants have their own merit,they may also increase bureauic-acy and show less concrete results in terms ofbenefits to a wide section of society, as seems to have been the case in thePhilippines. In Singapore. the investment policies may have come more underobvious State supervision, but the positive results thereof have been moreapparent.
In the Philippines, while community projects, hospitals and education ofparticipants' family members have been funded, they have remained quitesmall in terms of the total assets of social security institutions. The maininvestment has been in real estate finance. While, in the beginning, GSIS andSSS co-operated with other State institutions in low-cost housing, frompublished data, it is unclear as to what extent such participation has occurredand, to what extent, they have financed luxury housing and the hotel industry,all of which incorporate real estate finance. It is difficult to ascertain whetherthe President's coninmitinent to earmark substantial GSIS and SSS funds forlow-cost housing has, in fact, been realised. Finally, these decisions have notbeen especially influenced by the participating public for all members of theboard, of GSIS as well as SSS, are appointed by the President even though, twomembers of the latter are sUJpploseL t'-1 represent labour, and two, the generalpublic.
By contrast. thc CPF Authority in Singapore has centralised decision-making channels while incorporating a minimal emnployee representation. Inpractice, it is probably as constrained in this regard as the Philippine example.However, while the State has exerted extensive control, it has also acted withconsiderable responsibility. The result has been that CPF has been a majorimpact on the development of low-cost housing in Singapore. By acting as the
30 Labouir anid SocietY
financing agent for public housing schemes, CPF has successfully utilised its
funds to house Singapore's low-income population. In the process, a general
sharing of the city-state's wealth, generated by corporations, public and private,
seems to have taken place.
Notes
I To quote, "the efficiency of certain rnarkets, in particular those in the United States, the
United Kingdom, the Netherlands and in Switzerland seems to stem to a considerable extent from
the part played in these markets by intermediaries that collect funds on a contractual basis and
invest them principally in long-term forms." OECD Committee for Invisible Transactions: Capital
markets study, General Report (Paris 1967), p. 12. For an early review of this role in developing
countries, see F. Reviglio: "Social security: A means of savings mobilisation for economic
development", in International Monetat Fund Staft Pa pers, July 1967, pp. 324-365.
2 For greater detail, see C. Mouton: Social securitv in Alriica (Gerneva, International Labour
Organisation, 1975).3 In Argentina. Ghana and Togo. surpluses from insurance and pension funds cover large
percentages of government current expenditures. Colombia requires insurance companies and
mutual funds to invest in securities of the national government and several government
organisations. In Brazil, too. the government has attempted to influence production and investment
decisiors by channelling savings through intermediaries and controlling their allocation of credit. In
Malaysia, 75 per cent of the fund's surpluses are required to be allocated in government securities;
in Sri Lanka it is exclusihelh in government securities. See P. Shome: "The role of contractual
savings institutions: A preliminary survey", in Studies itt Domestic Finance, No. 29 (Washington
D.C., The World Bank, November 1976), and P. Shome and K.A. Saito: "The impact of
contractual savings on resource mobilisation and allocation: The experience of Malaysia", in
Malavan Economic Review. pp. 54-72.
4 See P. P. Harbrecht: Pension funds and economic power (New York, The Twentieth Century
Fund, 1959), pp. 280-281.5 See CentralProvident Futnd, CPF Board (Singapore, 1978).
6 This information was obtained from the Housing and Development Board, Singapore, while
on a World Bank mission in 1978. Actual figures on the numiiber of flats constructed, etc., are not
being presented here due to shortage of space.
7 See R.F. Emery: The financial institutions of South East Asia (New York, Praeger, 1970),
pp. 463-466, and GSIS AnnualReports, for details.
8 Originally passed through the Republic Act No. 1161 in 1954, it was amended in 1957, 1960,
1963, 1965. 1966, and 1969. due to the fear of both employer and employee regarding possible
declines in respective financial positions. See Emery. op. cit., pp. 467-470. and SSSAnnuial Reports.
for details.9 The time series on these are not being presented here to conserve space.
10 Comparable rates of return, at three-year intervats, were:
1969 1'92 IT97
CPF 5.1 5.1 4.8 5.1
12-month fixed deposit 6.0 6.0 5.75 5.79
Savings deposit 3.5 3.5 3.5 3.5
Source: Monc.,rY Auth.mit, {,t %ingap.re.
l See Asian Wt'aill Street Journal, 7 December, 1977.
12 This was indicated during a World Bank research mission by the authorities,
13 The sources of total real estate loans, as derived from different financial institutions, have
been calculated but do not appear in the text due to space considerations.
14 SeeAtinnalReport ol'the Insurance C170111nissioner. 1973-1974, p. 1.
INVESTMENTS Of SOCIAL SECURITY FUNDSIN INDIA AND SRI LANKA: LEGISLATION
AND EXPERIENCE
PARTHASARATHI SHOME & KATRINE A. SAITO*
I. IntroductiolA
Social security institutions such as pension and provident fundsserve the function of providing funds in the case of specialized contin-gencies, such as death, old age or retirement. These operationsare usually accompanied by the accumiulation of large volumes offunds. As contributions exceed benefit payments, the surplusesgenerated by these sclhemes constitute a major financial instrumentwith the potential of exerting a suibstantial impact on the allocationof financial resources. In many developing countries social securityschemes are still in their infancy, but in India and Sri Lanka, theirrespective Employee Provident Funds (IEPF for India, SEPF for SriLanka) have become major institutions in terms of financial resourcesmobilized, comprising 22 percent and 43 percent of total householdfinancial savings respectively.' Hence a study of the investmentpatterns of the surplus funds of these institutions is of major interest.2
In most Asian countries the investment of social secuirity insti-tutions is strictly regulated by the central government, but the extentof government influence varies widely.3 In Sri Lanka, for example,all SEPF funds are appropriated by government in the form of
* Parthasaratli Shome is Associate Professor of Economics, American University,Washington. D. C., Consultant, World I ank, Wasitington, D. C. and Katrine A. Saitois Economist, world Bank, Washingt-n, I). C.
1 Refer Shome and Saito (I 97Pb).
2 While the fiiancing mechanisms and savings generation aspects of social securityinstitutions in developing countries have been studied in the past [Rtcviglio (1967a,1967b)], the investment aspects of s& cial security funds are only beginning to be studied.
8 In Malaysia, 75 percent of the ftunds have to be in goverament securities[Shome and Saitb (1978a)]. In Singal)ore all of tie funds lhave to go into governmcntsecuritics, which are then channeled into a massive governmcnt housing project coveringmore than 50 percent of the population, while iai the Philippines iavestment policies areflexible [Shome and Saito (1980)].
349
350 INDIAN JOURNAL oF ECONOMICS
government securities, In India, on the other hanid, stipulationsreg,arding investments in governmcnt securities have varied over
time, -and invevstments in alternative channels have also taken place.
In Section- II, we summarize the legislation governing such invest-
ments.
If government does exert control over the way social security
are itnvested, it muist be accompanied by government rresponsibilityin, at least, two channi-Lels. First, government must see that contri-
butors get a reasorlalble ratc of return on their inpayments, com-
parable to those that they would have received had they alternately
deposited their savings ii a cormmercial hank, bought slhares, etc.
Second, the government becomes responsibleh for using the funds in
tlhe l.est possible way for the couni-try's dcvelopmenit. For exanmple,
xvhetlevr the appropriated funds are uised for development purposes,
tliroutg.l either current or capital expendituires, or wlhetlher they are
used simply for cotisunmption or defenice puiposes, is of tultimliate
importance. Otlhrwise, tlhc issule arises as to wlhy tlhese fuinds shotldl
nlot be iiivested according to the vill of the contrihbutors themsel\ es.
'T'hc olnly way to cm'iiIer;rt this a,rguiment is to slhow that govern-
mnelt lhas acted responsibly in its invcLt1r stnut dccisions. Section III
takes up these issues by sttudyin-g the actual investments of the
social security funds of India and Sri Lanka. This is followed by
a concllusion.
II. Legislation Regarding Coverage and
Investment of Provident Funds
India
The IEPF was formed in 1952 under the general supervision
of the Nlitnist.r\ of Labour. The IEPF covers all employees in firms
with 10 or more workers, after 240 days of employment. Another
major provident ftund is the Coal Mine Provident Fund Scheme
(CMPF), ni,der which cvery coal miner, bclow a certaini wage, is
coveireCd. Ind..,ed the sticcess of' CMPF, establislhed in 1948, encou-
raged tlhe government to enunciate formation of IEPF.
For IEIPF, the insuired person contributes 6 25%" of earnings,
8 .', in factorieis with 50 or more workers, with matchlinig funds by
employers (who also pay towards an administration cost amounting
between 37',} to 2A4% of payroll). Government contributes 1-16%o
of payroll, plus cost of administration for survivor benefits. The
mininium earning for contribution purposes is Rs. 3 a day. IEPF
SHOME AND SAITO: SOCIAL SECuRTY FUNDS 351
benefits are paid at 55 (miners 50), or at retirement, or permanentemigration.
Gratuity Fund benefits is a lumpsum equal to 15 days' wagesfor each year of continuous service, with a maximum equivalent to20 months' wages. For invalidity, a lumpsum of all contributionsplus 7-5 /a interest are paid. Survivors, at the employees' death, getthe benefit if nominated the beneficiary.
Factories may be exempted from the statutory scheme andallowed to run their own provident futnds provided the total quantumof benefits, including gratuity, is not lets than under the statutoryschemes and provided that they iinvest all providend fund surpluses,as prescribed for the statutory funds. The legislation governingthe investible resources has undergone changes from time to time, witha declining stress on investment in government securities.4 Accordingto the provisions of the Indian Trusts Act, fund monies are requiredto be invested in government securities or securities guaranteed bythe central or state governments with regard to both payment ofinterest and repayment of principal. Certain discretionary invest-ments in first mortgages of immovable property and other authorizedsecurities are allowed for certain categories of funds; in general prac-tice, however, trustees have preferred to invest primarily in govern-ment securities and certain other public sector investments,
A provident fund formed by a company for its employees(1956 Act) is required to deposit in a post office savings bank orinvest in specified securities. The Employees Provident Fund (1952Act) is required to deposit in the Reserve Bank of India, State Bankof India or in any scheduled bank approved by the Central govern-ment, orin specified securities. They cannot beinvested inimmovableproperty unlike providend funds of companies. The power of invest-ment is vested in government, or in the governing body of the insti-tution. In general, the funds are invested in Trustee securities. Inactual practice, therefore, investments by all provident funds areguided by statutory restrictions or directed by government authorities.Ouir analysis refers to the investmelnts of all provident funds.
Sri Lanka
Before the establishment of the SEPF in 1958, a few big firmsprovided provident fund benefits for their employees. The SEPF, on
4 The c,rmplicated rules and regtulations regarding provident ftund investments arenot amenable to be presented here in an adeqaute fashion. HoA ever, they are availableand the source is the Employees Provident Fund, rombay, India. Here we present con-cise irformation, just sufficient for our purpose.
352 INDLAN JOURNAL OF ECONOMICS
the other hand, covered all establishments with three or more emplo-yees, thereby bringing in its folds an additional million workers durin gits first year of operation (1959 to 1960). By an amendment in1970, all employees were covered. Firms which already had provi-dent fund schemes were given the option of joining the SEPF or tooperate separately after obtaining approval of tlhe Commissioner ofLabor.
The employer contributes 9 X of the gross wage, and theemployee (between ages 14 and 55) contributes 6OO Contributorsare guaranteed a minimum of 2-1/2 ,. interest. Benefits are paid atretiremenit (55 for males, 50 for feniales) or for permanent invalidityor deathl. Every member receives an annual statement of hisaCcomilt, anid rcceives a lumpstuni aimouInt pltis at least 3-1/2 x, com-
pounid rate of interest as b;iieflits.
The fund is available lor investment in goverlnment loans andother securities approved by the Monetary Board, The SEPF has,in praz -tiCe, inlested, solcly ill g )vernml ent securities.
III. Inivestment Patterns of SocialSecurity Fund Surpluses
India
Indian provident funds, including IEPF, started xith a majorshare of the:r invlstments in governmilenit securities (Table 1). How-ever, over the years, the. share of government securiti(es has steadilydeclinie(i fromn a high of 90 'i in 1960-61 to a low of 44 ,, in 1972-73,except for the var-year 1965 to 1966, when tlle ratio actually increa-sed by 6 'o. Indeed, cross-cotuntry data indicate that the purchaseof government sce.uritic s has invariably increased during war-years bycontracttual sax' ings itstittitio is (social securities and life insurance).5The rise in the sliare of small savings, on the other hand, has becnphenomenal over the years, stai-tirng fror 1 91O in 1960 to 1961 andreaching 47 ,b y 1972 to 1973. It must be remembered, however,that most of these small savings comprise postal ccrtificatcs issued bythe governmenit. ThUs putting government securities and smallsavings togecher, one may conclude tlhat the providenit funds haveinvested prim.-rily in thle pnbl1 ic sc(.tor.
Indeed, on tlle lasis of data uip to 1965 to 1966, a ResearchProgramnmcs Comnmittec of thie l'lailninig CoImmlission (1970) fou(ld :6
51 1is has happetied iin devel')ped 2s well as devcloping countries., Refer Mohsin(Il96).
0 Rcfer Si-hlt (197)), p. 82.
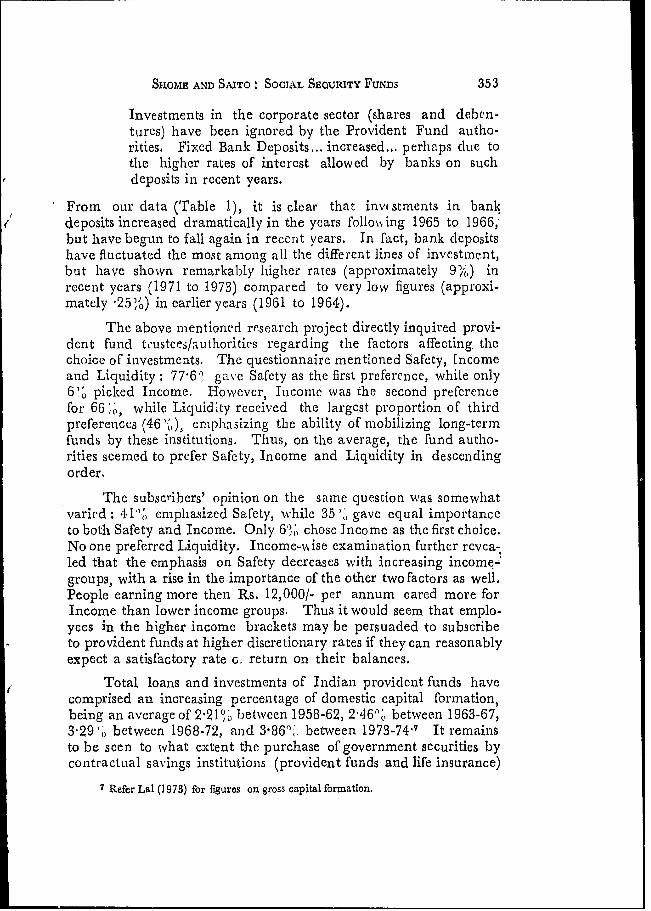
SHOME AND SAITO * SOCIAL SECURITY FUNDS 353
Investments in the corporate sector (shares and deben-tures) have been ignored by the Provident Fund autho-rities. Fixed Bank Deposits... increased... perhaps due tothe higher rates of interest allowed by banks on suchdeposits in recent years.
From our data (Table 1), it is clear that inve stments in ban}deposits increased dramatically in the ycars following 1965 to 1966;but have begun to fall again in recent years. In fact, bank dcpositslhave fluctuated the most among all the different lines of investment,but have shown remarkably hiiglher rates (approximately 9%,) inrecent years (1971 to 1973) compared to very low figures (approxi-mately 25%') in earlier years (1961 to 1964).
The above mentioned research project directly inquired provi-dent fund teustees/authorities regarding the factors affecting thechoice of investments. The questionnaire mentioned Safety, Incomeand Liquidity: 77 6;', gav e Safety as the first preference, while only6', picked Income. However, Iincomc wvas the second prefcrencefor 66' ., while Liquidity received the largest proportion of thirdpreferences (46' ,), emphasizing the ability of mobilizing long-termfunds by these institutions, Thus, on the average, the fund autho-rities seemed to prefer Safety, Income and Liquidity in descendingorder.
The subscribers' opinion on the same question was somewhatvaried: 41"' emplhasized Safety, while 35 "j gave equal importanccto both Safety and Income. Only 6'%0 chose Income as the first choice.No one preferred Liquidity. Income-" ise examination further revea-,led that the emphasis on Safety decreases with increasing income-'groups, with a rise in the importance of the other two factors as well.People earning more then Rs. 12,000/- per annum cared more forIncome than lower income groups. Thus it would seem that emplo-yees in the higher income brackets may be persuaded to subscribeto provident funds at higher discretionary rates if they can reasonablyexpect a satisfactory rate G return on their balances.
Total loans and investments of Indian provident funds havecomprised an increasing percentage of domestic capital formation,being an average of 2'21°o b)etween 1958-62, 2 46%M between 1963-67,3 29 ' between 1968-72, and 3 86"',, between 1973-74- It remainsto be seen to what extent the purchase of government securities bycontractual savings institutions (provident funds and life insurance)
7 Refer Lal (1973) for figures on gross capital formation,
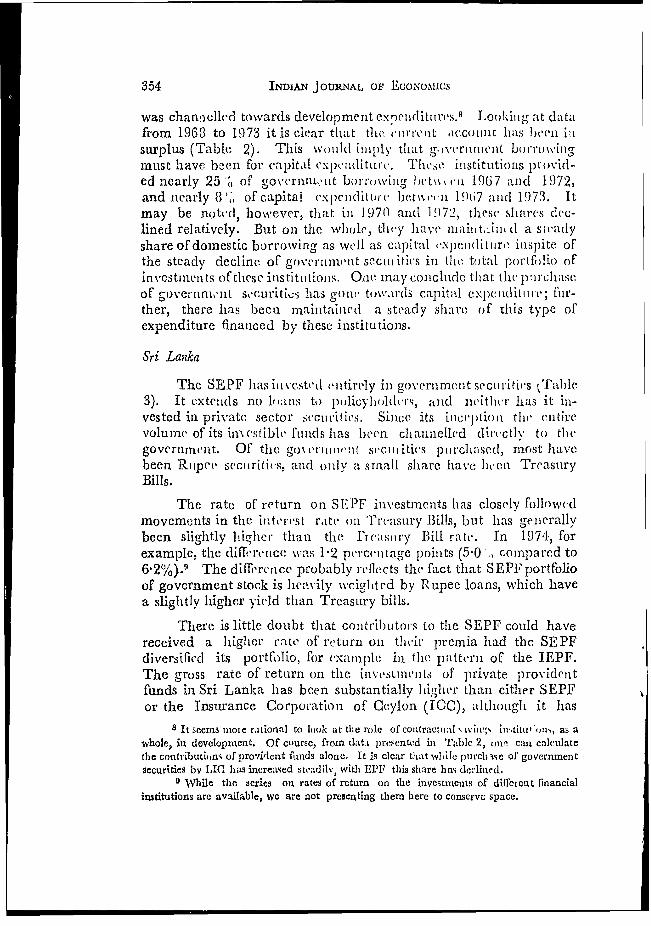
354 INDIAN J OURNAL OF EcoxNomics
was chan!elled towards developmenit exp-en1(littli-res.8 Lookinq at datafrom 1968 to 1973 it is clear that the * unreit account has lbee insurplus (Table 2). This would iuuuply that g.vernuneit breOwinlgmust have been for capitail e.xp)endlitutr. Thwse institutions prt)id-ed nearly 25 , tof goe le rnwiuug let eti 1967 and 1 972,and iearly 8', of capital (.X)ciiClitire betxx ee 1 9ti7 and 1973. Itmay be noted, however, that itt 1970 anI(t 1972, thesc shares dec-lined relatively. B1ut on the whole, they havre Inalitt,LiJz,d a steadyshare of domestic borrowing as well as capital expenditiiro inlspite ofthe steady decline of govcrnenvnt S(eCttie iCS itli t1i ) totil portfolio ofinvestiiei lts oftlhese inistittitiouus. On1e inay conclide tlhat tlle p!) uclhaseof goveriinionLt SCUVitiCi lias goii" twar(ls capital cxpemtditi tie; fuir-ther, there has been mainitaiiied a steady slare of this typc ofexpenditure finianiced by these inistitutions.
Sri Lanka
The SEPF hasi1ltveste(d enitirely in government sectirities jTable3). It extend(Is no loans to policylholdeRi-4, and neitheir has it in-vested in private sector Secut'ities. Silnce its i1ic 'ptioil thie entirevolumre of its iti\stible fuinids has been ciannelled (iel ctlv to thegoverninclet. Of the go% et'iuiiuent sccillities pnirchlased, most havebeen Rupee securities, anid only a small shiare have hecli TreasuiryBills.
The rate of return oni SPF investments has closely followedmovements in the illte'rest rate on Treasury Bills, l)ut lias generallybeen slightly higher than the 'Freitsitry B3ill rate. In 1974, forexample, the difernenrcc N%elas 1w 2 percentage poinits (5.0 rx comipared to6 2%).9 The difference probably rflefcts the fact that SEPFportfolioof government stock is heavily weighted by Rupee loans, which havea sliglitly higher yield than Treasury bills.
There is little doubt that con1trib)tors to the SEPF could liavereceived a higher rate of return on thliir prernia liad the SEPFdiversified its portfolio, for at.XiIlI)i ill thle patternl of thle IEPF.The gross rate of return on thle invesLitents of private p)rovidelntfunds in Sri Lanka lias been substantially highler thlain eithier SEPFor the Insurance Corporation of Ccylon (ICC), al;thLlo;gh it lias
8 It Seenms n1oIC rtLjional to look at the role of contractoal % iiig7 il1,tititi'olh, ag awhole, in development. Of coursc, from data p)resented in Ttble 2, oun can calculatethe contributionns of provirlent funds alorne. It is clear thlat while purcli lse of governmeAtsecurities bv LIC ihas increased st. adilv, with EPP this slhare has declined.
9 While the series on rates of return on the investmcnts of different financialiastitutions arc avilaable, we are not presenting them here to conserve space.
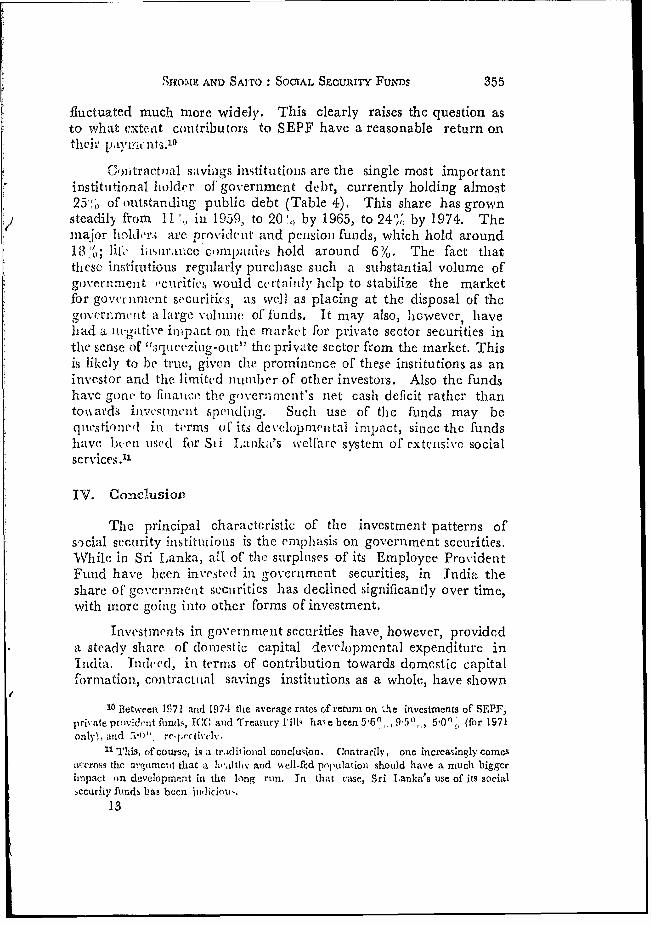
SIO0tIF AND SAIro: SOCIAL SECURITY FUNDS 355
fluctuated much more widely. This clearly raises the question asto what exto it contributors to SEPF have a reasonable return ontlheirz pyinY1 lIts.10
Conlitractual savuigs institutions are the single most importantinstituitional l110llr of governiment debt, cuirrently holding almost25'! - of (outstanding public debt (Table 4). This share has grownsteadily from 11 in 1959, to 20,) by 1965, to 24%, by 1974. Theniajor h1oldr ; are provident and penisioni funds, which hold around183 :, lih islralice cGm1pallivs hold around 6!/{,. The fact thattllese instictutions reguilarly purobiase sulch a substantial volume ofgovernmenit -'tcritics would ccrtainly help to stabilize the marketfor gover nient securities, as well as placing at the disposal of thego,ver merit a large volumie of funds. It may also, however, haveliad a ii-egative imiipa-(ct on the mnarket for private sector securities inthe sense of 'squleezing-out" the private sector from the market. Thisis likely to be true, given the prominence of these institutions as aninvestor and thc limited number of other investors. Also the fundshave gone to fiiiaic, the gmvernment's net cash deficit rather thantowsards investenciit spendinig. Suclh use of the fuinds may bequestionerl in terms of its developmental inmpIact, since the fundshiave beecn used for Sii allanka's welFare system of extensive socialservices."l
IV. Conclusion
The prinicipal characteristic of the investment patterns ofs,.cial secturity iiistittitioi1s is the emphasis on govecrnment secturities.While in Sri Lanka, all of the surplinses of its Employee ProvidentFund have been invested in governmcnt securities, in India theshlare of govern ent secuirities has declined sigrnificantly over time,with riore going inito other forms of investment.
Investments in government securities have, however, provideda steady sliare of (Iomi1estic capital developmental expenditure inIndia. TwIced, in termys of contribution towards domestic capitalformationi, conitractuial savings institutions as a whole, have shown
10 letween 1971 anid 1974 the average rates of return on .he investments of SEPF,private prov:;clnt fuin(ds, ITC anc1 Treasury l'ill hax e been 5.6",0,, 5-0,', (for 1971only), and 5H re'iw'c tivc1'. .
11Thiis, (if course, is a trid iioiial conclusion. Contrarily, one increasingly comesawcross the arre,im1etLt that a IlW,ltliN and well-fed population should have a rmuch biggeriinpact on development in the long ruin. Tn that case, Sri Lank-a's use of its socialiecurity fuids has been ju'liciou'.
13
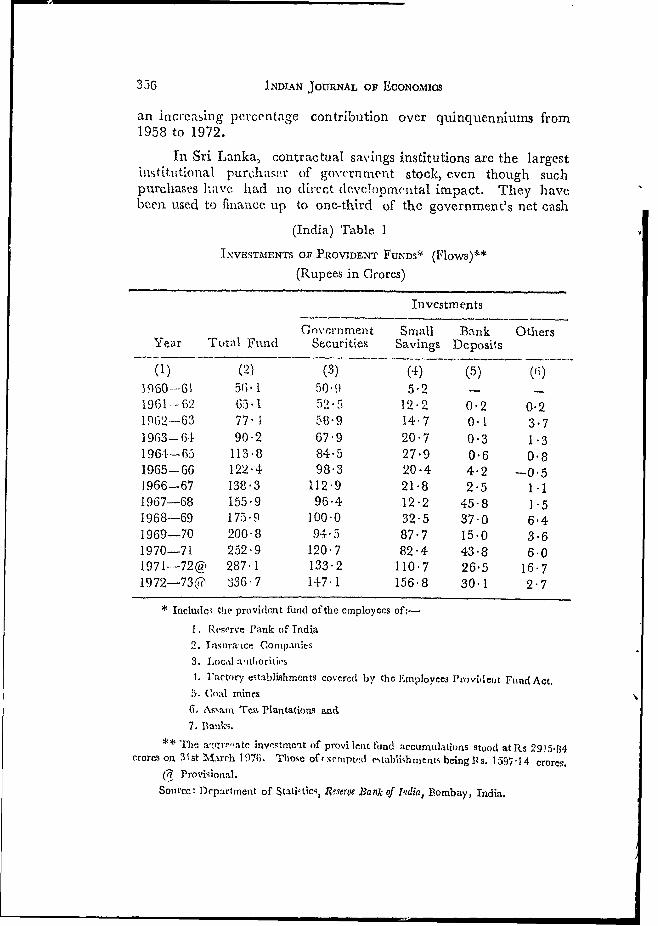
356 INDIAN JOURNAL OF ECONOMICS
an increasing percentage contribution over quinquenniuins from
1958 to 1972.
In Sri Lanka, contractual savings inistitutions are the largest
instituitioIIal purlihsatr of government stock, even though such
purchases have. l had no dIirect (levclop-nental impact. They have
been used to finanice uip to one-third of the government's net cash
(India) Table 1
INVESTMENTS OF PROVIDENT FUNDS* (Flows)**
(Rupees in Crores)
Investments
CGovcnn-nmen t S-mall Bank OthersYear Tttal Fund Securities Savings Deposits
(1) (2) (3) (4) (5) (13)
3960---61 56- 1 50 !) 5-2 - -
1961 - 2 65.5I 52- .5 12 -2 0 * 2 0.21962-63 77-] 58,-9 14- 7 0.1 3- 7
1963- 64 90 -2 67 -9 20 - 7 0*3 1-3
1964-65 113-8 84-5 27 -9 0- 6 0-8
1965- 66 122 -4 98-3 20-4 4-2 -0.51966-67 138 -3 112-9 21-8 2-5 1.1
1967-68 155-9 96-4 12-2 45- 8 1]5
1968-69 175 -9 100-0 32-5 37- 0 6-4
1969-70 200 8 94-5 87 -7 15*0 3-6
1970-71 252-9 120 -7 82-4 43 -8 6 0
1971-72@w 287- 1 133-2 110 7 26-5 16-7
1972- 7 3 w 336 -7 147 1 156-8 30-1 2-7
* Include tVie provi(dent fund of the employees of,-
1. [Ze. erve P'anlk of Tndia
2. Tnsuiraice Companies
3. Local aitllioriLirs1. I'actory establishments covered by the Emiployces Provioleut FIundAct.
5, Coal mines
6. Assam Tea Plantations and
7. llanks
** Tflie aw-r-re'aLe investmeit of provi lent fund accumulations stood at Rs 2915-84crores on 31 st M.irch 1976. Those of x-enipti1 cstalWihnienti being iP s. 1597 14 crorcs.
Su rovi:onartol.Souirce: I)c partnient of Stati,.ticq, neserve.RanA; of 1I*dia, B?ombay, Irtndia,
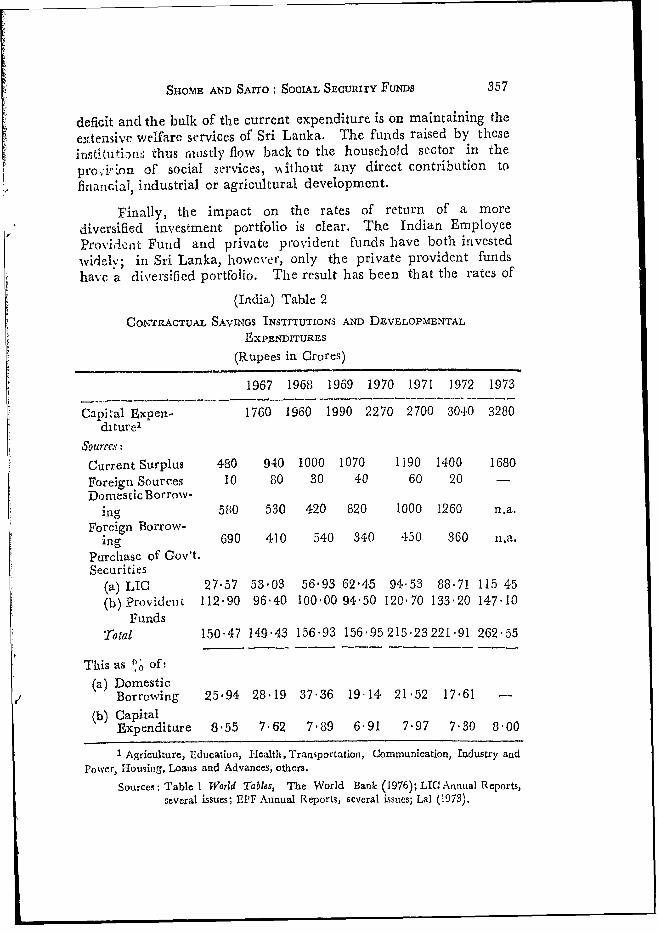
SHOME AND SAITO: SOCIAL SECURITY FUNDS 357
deficit and the bulk of the current expenditure is on maintaining theextensive welfare services of Sri Lanka. The funds raised by theseinrstituti,w.; thus [nostly flow back to the household sector in thepro..irion of social services, ilihout any direct contribution tofinancial, industrial or agricultural development.
Finally, the impact on the rates of return of a morediversified investment portfolio is clear. The Indian EmployeeProvident Fund and private provident funds have both investedwidelv; in Sri Lanka, howexver, only the private provident fundshave a diversified portfolio. The result has been that the rates of
(India) Table 2
COmrRACTUAL SAVINGS INSTITUTIONS AND DEVELOPMENTAL
EXPENDITURES
(Rupees in Crores)
1967 1968 1969 1970 1971 1972 1973
Capital Expen- 1760 1960 1990 2270 2700 3040 3280diturel
Sources:
Current Surplus 480 940 1000 1070 1190 1400 1680Foreign Sources 10 80 30 40 60 20 -Domestic Borro%v-
ing 580 530 420 820 1000 1260 n.a.Foreign Borrow-
ing 690 410 540 340 450 360 ii.a.Parchase of Gov't,Secu ri ties
(a) LIC 27'57 53 03 56'93 62-45 94 53 88.71 115 45(b) Provideult 112-90 96A40 100 00 94 50 120 70 133 20 147410
Funds
Total 150'47 149 43 156 93 156 95215-23221.91 262 55
This as ((, of:(a) Domestic
Borrowing 25'94 28 19 37 36 19 14 21'52 ]7 61 -
(b) CapitalExpenditure 8 55 7 62 7 89 6 91 7.97 7 30 8 00
1 Agriculture, :d ucation, HIcalth,l Transportation, Comrnmunication, Industry andPower, Housing, Loans and Advances, others.
Sources: Table l World Tables, The World Bank (1976); LICI Annual Reports,several issues; EI'F Ann1ual Reports, several issues; Lal (1973).
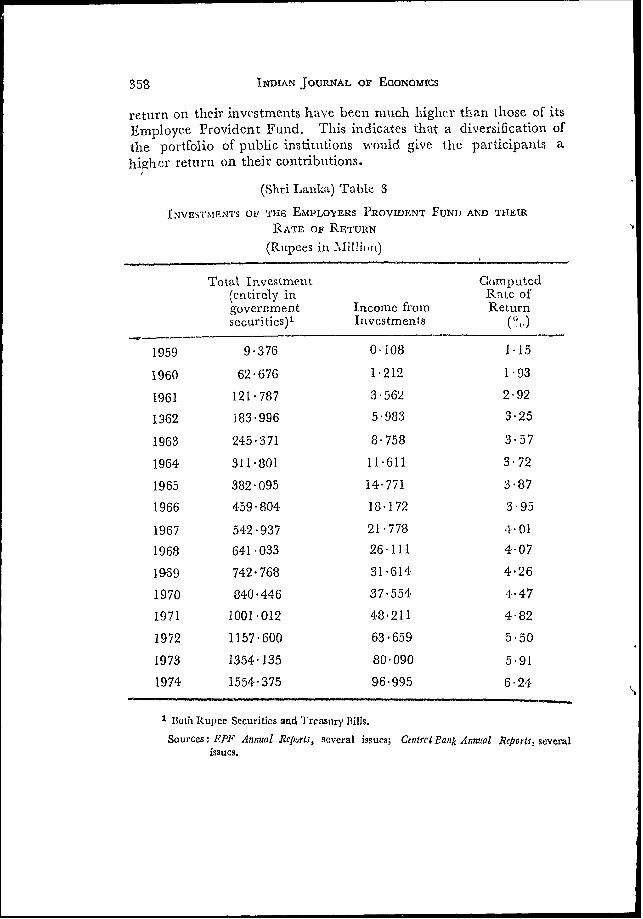
358 INDIAN JOURNAL OF ECONOMICS
return on their investments have been much higher than those of itsEmployee Provident Fund. This indicates that a diversification of
the portfolio of public institLutions would, givc the participaints a
hiaher returin on their contributions.
(Shri Lanka) Table 3
INVESTNMENTS OF TEIi EMPLOYERS PROVIDENT FUND AND THEIR
RATE OF RETURN
(Rupees in Alilliutt)
Total Investmeint Computed(entirely in Rate ofgovernment Income -from Returnsecurities)' Investments
1959 9-376 0 108 1.15
1960 62!676 1 212 1 93
1961 121h787 3 562 2 92
1362 183*996 5 983 3!25
1963 245 371 8*758 3*57
1964 311*801 11-611 3 72
1965 382*095 14 771 3'87
1966 459-804 18$172 3 95
1967 542*937 21 778 4 01
1968 641-033 26111 4 07
1969 742'768 31 614 4-26
1970 840-446 37-554 4.47
1971 1001 012 48-211 4*82
1972 1157-600 63 659 5.50
1973 1354 135 80'090 5-91
1974 1554'375 96 995 6-24
1 3oth Rupee Securities and Treasury 3i1is.
Sources: EPF Annual Reports, several issues; Centrcl Rank Anntal Reports, severalissues.
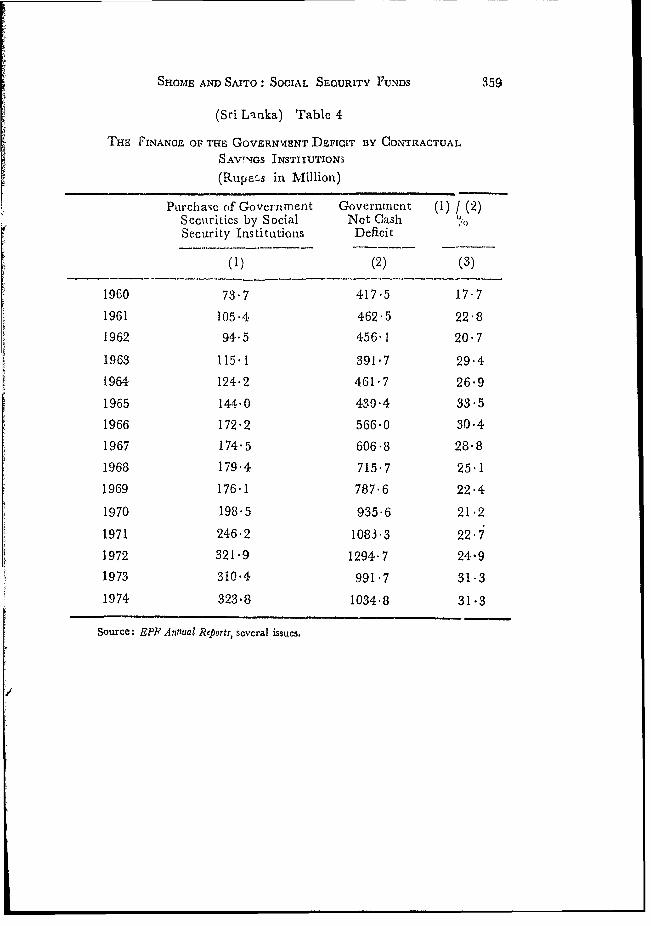
SHOME AND SAITO: SOCIAL SECURITY FUNDS 359
(Sri Lanka) Table 4
THE FINANCE OF THE GOVERN\SENT DEFICIT BY CONTRACTUAL
SAVTNGS INSTIIUTIONS
(Rups s in Million)
Purchase of Government Governricit (1) / (2)Secuirities by Social Net CashSecurity Institutions Defcit
(1) (2) (3)
1960 73*7 417-5 17 7
1961 105 4 462 5 22 8
1962 94.5 456-1 20 7
1963 115-1 391*7 29A4
1964 124*2 4617 26 9
1965 144-0 430 4 33.5
1966 172*2 566 0 30 4
1967 174 5 606'8 28 8
1968 179 4 715 7 25 1
1969 176-1 787-6 22 4
1970 198-5 935'6 21 2
1971 246 2 1083 3 22 7
1972 321*9 1294 7 24-9
1973 310Q4 991*7 31*3
1974 323 8 1034*8 31*3
Source: EPF Annual Reports, several issues.
360 INDIAN JOURNAL 07 EooNOMIas
References
[1] Lal, D., Capital Formation in India, Ph. D. Thesis, University of
DIelhi, 19 73.
[2] Molisini, M., Investment of L-fe Insurance C(orjoration's Fund, Ali-
garli Muslimii University Press, India, 1966.
[3] NCAER, Contractual Saviig ian Urban J.dia, New Delhi, July 1963.
[41 Reviglio, F., "Tlhe Social Security Sector and Its Financing in
Developing Counitries," IMIlP'Staff Papers, November 1967 (a).
[5] Reviglio, F., "Social Security: A Means ofSavings Mobilisation
forEconomic Dt-velopmniti," AIMF Staff Papers, July 1967 (b).
[61 Shome, P., "The Role of ConItractual Savings Institutions: A
Preliminary Survey," Studies in Domestic Finance No. '9, The
World Bank, Washington, DC, November 1976.
[7] Shome, P., -Social Security as a Mobiliser of Savings," Inter-
national Social Se-curit, Review, 11.0, No, 1, 1978.
[8] Shome, P. aiid K. A. Saito, "The Imptct of Contractual Savings
on Resouirce Mobilisation and Allocation: The Experience of
Malaysia," Malayan Economic Review, April 1978 (a).
[9] SlhOmP. P. anid K. A. Saito, "The Impact of Social Security
Institutions on Household Savings: The Asian Experience,,'
presented at tlle Anniual Amterican Economic Association
Conference, Chicago, August 1978 (b).
[10] Shame, P. anid K. A. Saito, ,Social Sccurity Funds in Singapore
and the Philippines: RainificaLiolis of Investment Policies,
Labor and Society, International Institute of Labor Studies,
Geneva, January 1980.
11] Singh, D., "Ain Inquiry into the Resource Potential and Invest-
ment Policy of Provident Funds," Findings of the Project, Planning
Commission, New Delhi, 1970.
THE WORLD BANKHeadquarters:1818 H Street, N.W. UWashington, D.C. 20433, U.S.A.
European Office:66, avenue d'Iena75116 Paris, France
Tokyo Office:Kokusai Building,1-1 Marunouchi 3-chomeChiyoda-ku, Tokyo 100, Japan
The full range of World Bank publications, both free and for sale, isdescribed in the World Bank Catalog of Publications, and of the continuingresearch program of the World Bank, in World Bank Research Program:Abstracts of Cuirrent Studies. The most recent edition of each is availablewithout charge from:
PUBLICATIONS UNIT
THE WORLD BANK
1818 H STREET, N.W.WASHINGTON, D.C. 20433
U.S.A.