Embed Size (px)
Citation preview

8/14/2019 Social Security: 99md&a2
http://slidepdf.com/reader/full/social-security-99mda2 1/13
SSA’s 1997 strategic plan created an improved setof five strategic goals that cut across all programs,encompass all of the Agency’s administrativeactivities and address the universe of competingneeds of the wide variety of SSA stakeholders. Theperformance indicators included in SSA’s FY 1999Government Performance and Results Act (GPRA)Annual Performance Report included onpages 56 through 79 provide a critical link toaccomplishment of those long-term strategic goals.
The GPRA performance indicators track theperformance of our programs using various
traditional and new outcome measures to help usand others assess whether the Social Securityprograms and SSI are achieving their intendedoutcomes. The key performance indicators whichfollow were selected from the 59 traditional output,outcome and milestone performance indicatorsincluded in the GPRA Annual Performance Report(pages 56 through 79). They ensure that wecontinue to make progress towards the Agency’sstrategic objectives and are aligned under theirrespective strategic goals.
The milestone indicators discussed under thefirst goal and charts 1, 2, 3, 4, 7, and 9provide progress against intermediate GPRAgoals for long term performance objectives.Charts 5, 6, and 8 display our progress inmeeting GPRA goals for traditional workloadmeasures.
This goal summarizes the Agency’s strategyto ensure that our programs provide a base of economic security for workers, the aged anddisabled, now and in the future. Providingcritical analysis, research and evaluation isintegral to the Agency’s role in shaping theprograms so that they evolve to take accountof future demographic and economic trends.The analysis, research and evaluationconducted by the Agency providesdecisionmakers with information on thechallenges the programs may face and theimpact of options for strengthening the
programs to meet the current and future needsof beneficiaries and workers.
In the FY 2000 APP, the Agency redefinedthe objectives under this goal to make themmore outcome-oriented and so that they willconcretely express the results the Agency isworking to achieve. While the impact of Social Security programs on the economicwell being of millions of Americans is of primary concern for the Agency, SSA doesnot exclusively use program outcomeobjectives to measure the performance of
policy development, research, and programevaluation. Instead, this strategic goal uses amix of program outcomes and performancegoals that measure the extent to which criticalinformation is available for use bydecisionmakers. The mix of goals reflects thefact that the effects of policy development,research, and program evaluation are difficultto quantify and measure, since many factorsaffect program outcomes related to a changein policy.
GOAL: To promote valued, strong
and responsive social security
programs and conduct effective
policy development, research, and
program evaluation
SSA’s Strategic Goals
O
To promote valued, strong and responsive social security programs and conduct effective policy development, research,
and program evaluation.
O To deliver customer-responsive,
world - class service.
O To make SSA program management the best in business, with zero tolerance
for fraud and abuse.
O To be an employer that values and invests in each employee.
O To strengthen publicunderstanding of the social
security programs.
Performance Goals and Results
SSA's FY 1999 Accountability Report 15
8/14/2019 Social Security: 99md&a2
http://slidepdf.com/reader/full/social-security-99mda2 2/13
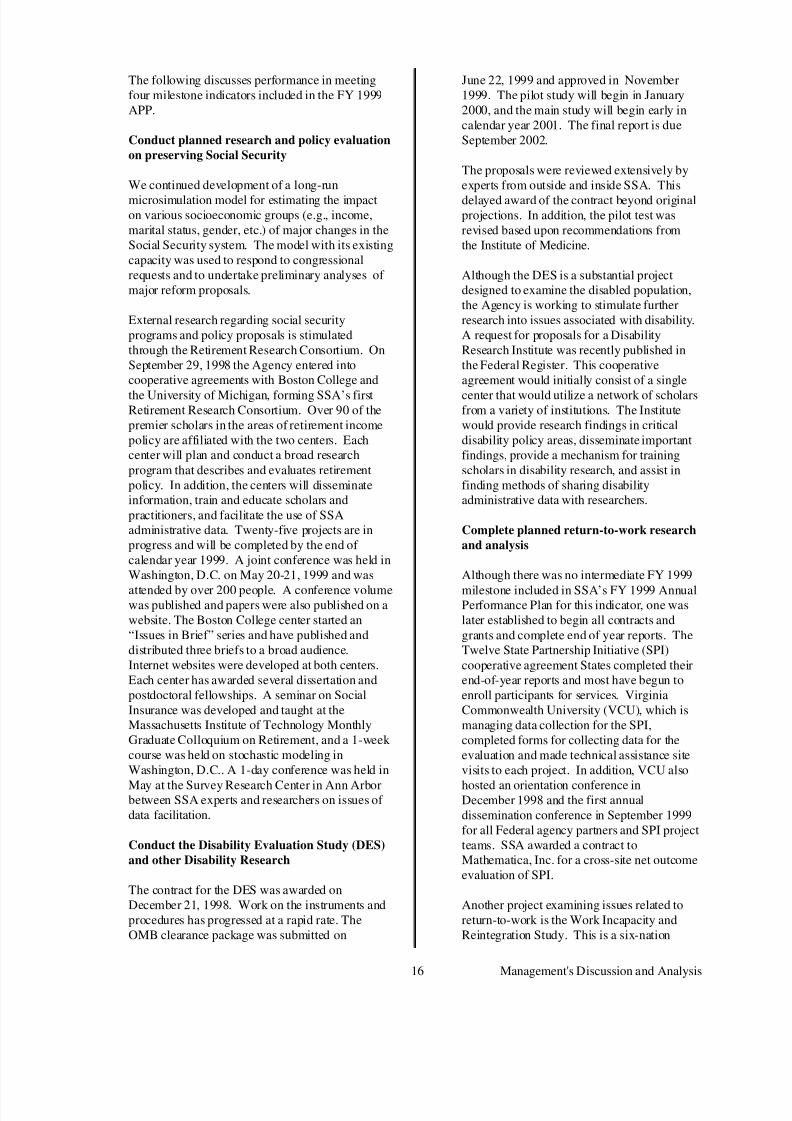
The following discusses performance in meetingfour milestone indicators included in the FY 1999APP.
Conduct planned research and policy evaluation
on preserving Social Security
We continued development of a long-run
microsimulation model for estimating the impacton various socioeconomic groups (e.g., income,marital status, gender, etc.) of major changes in theSocial Security system. The model with its existingcapacity was used to respond to congressionalrequests and to undertake preliminary analyses of major reform proposals.
External research regarding social securityprograms and policy proposals is stimulatedthrough the Retirement Research Consortium. OnSeptember 29, 1998 the Agency entered intocooperative agreements with Boston College and
the University of Michigan, forming SSA’s firstRetirement Research Consortium. Over 90 of thepremier scholars in the areas of retirement incomepolicy are affiliated with the two centers. Eachcenter will plan and conduct a broad researchprogram that describes and evaluates retirementpolicy. In addition, the centers will disseminateinformation, train and educate scholars andpractitioners, and facilitate the use of SSAadministrative data. Twenty-five projects are inprogress and will be completed by the end of calendar year 1999. A joint conference was held inWashington, D.C. on May 20-21, 1999 and was
attended by over 200 people. A conference volumewas published and papers were also published on awebsite. The Boston College center started an“Issues in Brief” series and have published anddistributed three briefs to a broad audience.Internet websites were developed at both centers.Each center has awarded several dissertation andpostdoctoral fellowships. A seminar on SocialInsurance was developed and taught at theMassachusetts Institute of Technology MonthlyGraduate Colloquium on Retirement, and a 1-week course was held on stochastic modeling inWashington, D.C.. A 1-day conference was held in
May at the Survey Research Center in Ann Arborbetween SSA experts and researchers on issues of data facilitation.
Conduct the Disability Evaluation Study (DES)
and other Disability Research
The contract for the DES was awarded onDecember 21, 1998. Work on the instruments andprocedures has progressed at a rapid rate. TheOMB clearance package was submitted on
June 22, 1999 and approved in November1999. The pilot study will begin in January2000, and the main study will begin early incalendar year 2001. The final report is dueSeptember 2002.
The proposals were reviewed extensively byexperts from outside and inside SSA. This
delayed award of the contract beyond originalprojections. In addition, the pilot test wasrevised based upon recommendations fromthe Institute of Medicine.
Although the DES is a substantial projectdesigned to examine the disabled population,the Agency is working to stimulate furtherresearch into issues associated with disability.A request for proposals for a DisabilityResearch Institute was recently published inthe Federal Register. This cooperativeagreement would initially consist of a single
center that would utilize a network of scholarsfrom a variety of institutions. The Institutewould provide research findings in criticaldisability policy areas, disseminate importantfindings, provide a mechanism for trainingscholars in disability research, and assist infinding methods of sharing disabilityadministrative data with researchers.
Complete planned return-to-work research
and analysis
Although there was no intermediate FY 1999
milestone included in SSA’s FY 1999 AnnualPerformance Plan for this indicator, one waslater established to begin all contracts andgrants and complete end of year reports. TheTwelve State Partnership Initiative (SPI)cooperative agreement States completed theirend-of-year reports and most have begun toenroll participants for services. VirginiaCommonwealth University (VCU), which ismanaging data collection for the SPI,completed forms for collecting data for theevaluation and made technical assistance sitevisits to each project. In addition, VCU also
hosted an orientation conference inDecember 1998 and the first annualdissemination conference in September 1999for all Federal agency partners and SPI projectteams. SSA awarded a contract toMathematica, Inc. for a cross-site net outcomeevaluation of SPI.
Another project examining issues related toreturn-to-work is the Work Incapacity andReintegration Study. This is a six-nation
16 Management's Discussion and Analysis

8/14/2019 Social Security: 99md&a2
http://slidepdf.com/reader/full/social-security-99mda2 3/13
comparative study focusing on workers who wereout of work for at least 90 days, some of whomreturned to work. Medical and non-medicalinterventions are being assessed for those whoreturned to work and also for those who apply andare awarded long-term disability benefits. Thestudy is to be published in book form in lateFY 2000.
Return-to-Work Legislation
The Agency is developing implementationstrategies for the Work Incentives ImprovementAct in anticipation of enactment of this bill.Similar versions of this legislation were passed inboth the House and Senate. This bill supports theAgency’s comprehensive strategy to increase thenumber of disabled beneficiaries who return towork, despite their impairment, and thereby lessentheir dependence on public benefits. Key featuresof this legislation are expanded eligibility for health
care services, the establishment of a ticket to work and self-sufficiency program that would allowconsumers choice of public or private employmentservice providers, and authorization to conductdemonstration projects.
This is our traditional goal, the one that explicitly
or implicitly has guided the actions of most SSAand Disability Determination Services (DDS)employees throughout our history. It reflects themillions of actions taken throughout the Agencythat have made SSA “the government” to millionsof individuals.
This goal is directed specifically toward the waywe convey service to the people who conductbusiness with SSA. Through this goal we are not just focusing on our customers but beingresponsive to the needs and desires of ourcustomers. Historically, SSA learns about
customer needs and satisfaction through a programof focus groups and surveys.
SSA has a long-standing reputation as the premiergovernment agency when it comes to providingcustomer service. As we look to the future, SSAaims to provide not just the kind of service thatcustomers expect from government, or even thebest service that government has to offer, but thekind of service that every organization - public orprivate - would hope to emulate.
As shown by the following chart, SSA ismaking rapid progress in our efforts to deliverWorld-Class Service. Not only didsatisfaction with overall service rise to88 percent in FY 1999, but 44 percent of customers gave the highest rating, very closeto SSA’s goal of 50 percent, rating overallservice “excellent." The results for
FY 1999 were taken from SSA’s AnnualCustomer Satisfaction Survey, which will bereplaced next year with interaction trackingsurveys under SSA’s Market MeasurementProgram.
In FY 1999, ten DDSs began preparation forimplementation of the Disability Prototypeprocess. This resulted in significant trainingefforts in those States that hamperedproductivity and led to increased initial caseprocessing times, higher initial pendings and
fewer initial dispositions.
These factors led to FY 1999 processing timesfor DI claims increasing 4.2 days overFY 1998, resulting in SSA falling short of meeting its FY 1999 goal of processing53 percent of DI claims within 6 months afteronset or within 60 days of filing as shownbelow.
Percent of Initial DI ClaimsProcessed Within 6 Months After
Onset or Within 60 Days of Filing
0%
20%
40%
60%
80%
Actual 57.5% 52.4% 51.3% 49.2%
GPRA Goal 55% 40% 50% 53%
FY 96 FY 97 FY 98 FY 99
Chart 2
Percent of Public Rating SSA Serviceas “Good or Very Good”
60%
70%
80%
90%
100%
Actual 79.0% 85.0% 82.0% 88.0%
GPRAGoal NA NA 85% 87%
FY 96 FY 97 FY 98 FY 99
Chart 1For FY 1998 and FY 1999 , data r epresents rating of“Excellent,” “Good” or “Very Good”.
GOAL: To deliver customer-
responsive, world-class service
SSA's FY 1999 Accountability Report 17

8/14/2019 Social Security: 99md&a2
http://slidepdf.com/reader/full/social-security-99mda2 4/13
Additionally, SSI disability claims FY 1999processing times increased 5.2 days overFY 1998, resulting in SSA failing to meet itsFY 1999 goal of 26 percent of SSI disability claimspaid or denied within 60 days of filing as shown inthe following chart.
In an effort to improve our service to disabilityapplicants, over the past few years, SSA has testedvarious process improvements to determine whatchanges would meet our goal of providing bettercustomer service. After analyzing the results of these extensive tests, we are now focusing on themost promising approaches. SSA anticipates thatthese changes will improve the disabilityadjudication process by creating a decision-makingprocess that reduces fragmentation and duplication,produces greater consistency and coordination at all
adjudicative levels and takes better advantage of new technology.
By taking these steps, SSA is striving to ensure thatthe correct disability decision is made and thatbenefits are awarded as early in the process aspossible. We plan to prototype a series of changes,which will improve the initial disabilitydetermination process by:
> Providing greater decisional authority to thedisability examiner and more effective use of the expertise of the medical consultant in the
disability determination process;
> Ensuring appropriate development andexplanations in initial cases;
> Increasing opportunities for claimantinteraction with the decisionmaker; and
> Simplifying the appeals process by eliminatingthe reconsideration step.
These changes will allow us to process asmany cases with a greater degree of accuracyin a single adjudicative step as we formerlyprocessed in two steps. Because of betterquality, more claimants will get paid sooner,at the initial level, reducing the number of cases needing a hearing.
The actual percent of hearings cases decidedand notices sent within 120 days was14.2 percent for September 1999 as shownbelow. Prior to September, a month in whichhigh-processing time Medicare casesconstituted more than twice the usualproportion of monthly dispositions, SSA metthe goal of 15 percent in May, June, July andAugust. We expect a downward trend inmonthly processing times to continue throughFY 2000.
This program management goal reflectsSSA’s responsibility, from both a service anda business perspective, to pay benefitsaccurately and otherwise be a good steward of the money entrusted to our care. We aresetting our standards very high to reflect our
view that the public deserves the highestpossible level of performance consistent withfiscal responsibility.
Our assertion of zero tolerance for fraud andabuse means that we will increase ourattention on deterring fraudulent activities andon bringing to justice those who practicethem, whether members of the public or of our own employee population. (See pages11and 53 for FY 1999 fraud preventioninitiatives and activities.)
Percent of 120-Day HearingsDispositions by OHA
0%
5%
10%
15%
20%
Actual 10.1% 10.0% 14.0% 14.2%
GPRA Goal 14% 13% 13% 15%
FY 96 FY 97 FY 98 FY 99
Chart 4
Percent of Initial SSI Disability ClaimsPaid or Denied Within 60 Days of Filing
0%
10%
20%
30%
40%
50%
Actual 29.5% 25.0% 24.4% 22.3%
GPRA Goal 30% 20% 23% 26%
FY 96 FY 97 FY 98 FY 99
Chart 3
GOAL: To make SSA program management the best in business,
with zero tolerance for fraud and
abuse
18 Management's Discussion and Analysis

8/14/2019 Social Security: 99md&a2
http://slidepdf.com/reader/full/social-security-99mda2 5/13
In FY 1999, as part of our fraud detection andprevention program for safeguarding SSA assets,we worked with our Office of the InspectorGeneral, the U.S. Attorney and other State andlocal agencies on cases involving fraud and abuse.
The following chart shows that SSA exceeded thegoal for the number of criminal convictions related
to SSA’s programs.
An increase in the number of investigations openedcan be attributed to the increase in OIG Hotlinestaff in FY 1999 from 12 telephone operators toover 50. Throughout the year, as the new operatorsbecame proficient in handling allegations, thenumber of cases opened continued to grow innumbers well above what was initially anticipated.
OIG’s efforts in attacking fraud within the SSI
program, which had been identified by the GeneralAccounting Office as a high-risk program, resultedin the reporting of large sum monetaryachievements. Two investigative projects thatresults in huge savings for SSA were theCooperative Disability Investigations teams andSSI eligibility fraud projects..
In the program management and stewardship area,SSA conducts periodic reviews, called continuingdisability reviews (CDRs), to determine whetherindividuals receiving disability benefits havemedically improved so that they are no longer
considered disabled and no longer eligible forbenefits.
The CDR process allows SSA to ensure theintegrity of payments to individuals in the DI andSSI programs by monitoring the disability status of beneficiaries. As shown in the following chart,during FY 1999, SSA was able to perform1,703,414 periodic reviews and 18,752 medicalreviews related to work issues. SSA expects toperform 1.8 million CDRs in FY 2000.
SSA has developed a 7-year plan forconducting CDRs and expects to conductapproximately 5.8 and 3.6 million CDRs forDI (including DI/SSI concurrent) and SSIbeneficiaries, respectively, over the life of theplan.
Program savings for the Old-Age, Survivorsand Disability Insurance (OASDI) and SSIprograms in FY 1996 through 2002 resultingfrom CDRs processed in those years will beapproximately $7.7 billion. This includes anestimated program savings of $3.8 billion forOASDI and $3.9 billion for SSI. The CDRbacklog will be eliminated by the end of FY 2000 for the DI program and by the end of FY 2002 for the SSI program.
During the 1990’s SSA focused on expandingits use of aggressive debt collection tools. As
a result of its efforts, the Agency has hadmany noteworthy successes. The Tax RefundOffset (TRO) program which SSAimplemented in 1992 has yielded almost$250 million in debt collections since itsinception.
The Treasury Offset Program (TOP) whichbegan in 1998 assimilated the former TROprogram and added the capability of usingadministrative offset, or collection of a debtfrom a Federal payment other than a taxrefund collection. In FY 1999, SSA collected
over $51.1 million in delinquent debt viaTOP.
Although SSA did not implement any newdebt collection provisions this FY, as shownin the following chart, we were able to surpassour FY 1999 goal of $1.2 billion. This is aresult of the Agency focus on aggressivelypursuing delinquent debtors using allavailable debt collection tools. See pages 54and 55 for additional debt management data.
Periodic CDRs Processed
0
500,000
1,000,000
1,500,000
2,000,000
Actual 498 ,445 690 ,478 1 ,391 ,889 1 ,703 ,414
GPRA Goal 500 ,000 603 ,000 1 ,245 ,000 1 ,637 ,000
FY 96 FY 97 FY 98 FY 99
Chart 6
Number of Criminal Convictions
0
1,000
2,000
3,000
4,000
Actual 570 2,507 2,762 3,139
GPRA Goal NA NA 1,800 1,800
FY 96 FY 97 FY 98 FY 99
Chart 5
*
* Includes 593 Illegal Alien Apprehensions and 1,586 Fugitive Felons
SSA's FY 1999 Accountability Report 19
8/14/2019 Social Security: 99md&a2
http://slidepdf.com/reader/full/social-security-99mda2 6/13
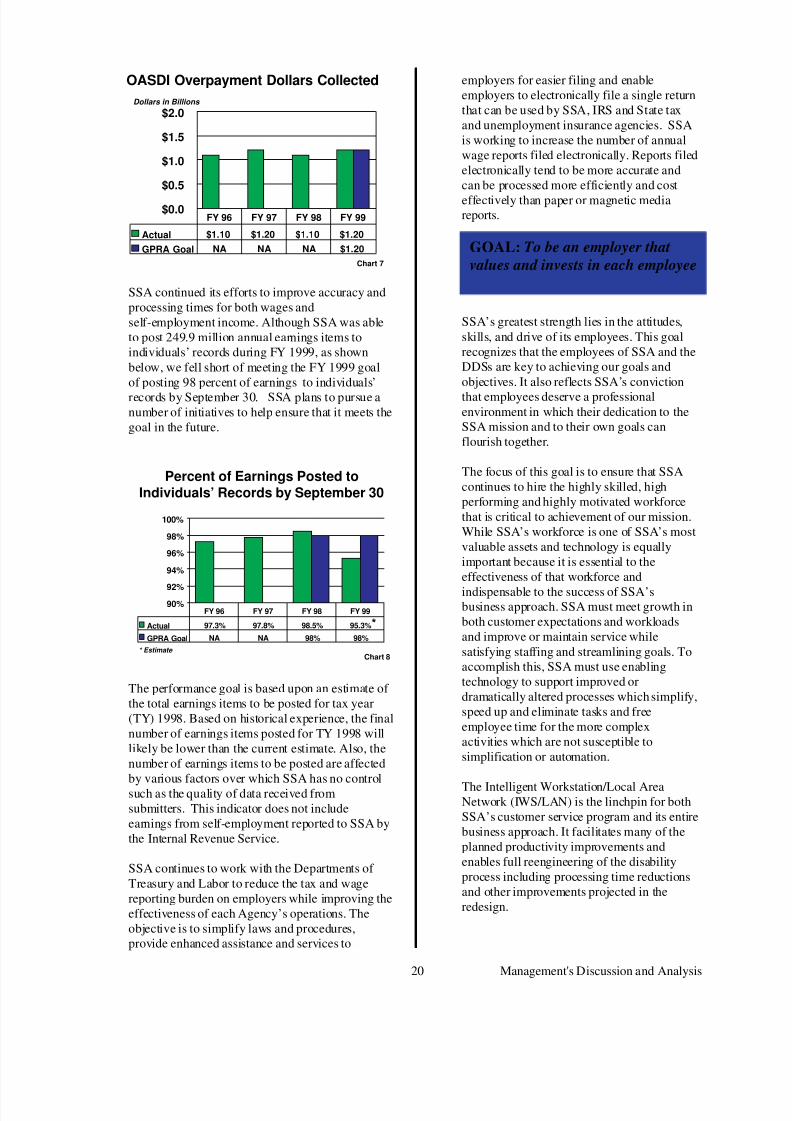
SSA continued its efforts to improve accuracy andprocessing times for both wages andself-employment income. Although SSA was ableto post 249.9 million annual earnings items toindividuals’ records during FY 1999, as shownbelow, we fell short of meeting the FY 1999 goalof posting 98 percent of earnings to individuals’
records by September 30. SSA plans to pursue anumber of initiatives to help ensure that it meets thegoal in the future.
The performance goal is based upon an estimate of the total earnings items to be posted for tax year(TY) 1998. Based on historical experience, the finalnumber of earnings items posted for TY 1998 willlikely be lower than the current estimate. Also, thenumber of earnings items to be posted are affectedby various factors over which SSA has no controlsuch as the quality of data received fromsubmitters. This indicator does not includeearnings from self-employment reported to SSA bythe Internal Revenue Service.
SSA continues to work with the Departments of Treasury and Labor to reduce the tax and wagereporting burden on employers while improving theeffectiveness of each Agency’s operations. Theobjective is to simplify laws and procedures,provide enhanced assistance and services to
employers for easier filing and enableemployers to electronically file a single returnthat can be used by SSA, IRS and State taxand unemployment insurance agencies. SSAis working to increase the number of annualwage reports filed electronically. Reports filedelectronically tend to be more accurate andcan be processed more efficiently and cost
effectively than paper or magnetic mediareports.
SSA’s greatest strength lies in the attitudes,skills, and drive of its employees. This goalrecognizes that the employees of SSA and theDDSs are key to achieving our goals andobjectives. It also reflects SSA’s conviction
that employees deserve a professionalenvironment in which their dedication to theSSA mission and to their own goals canflourish together.
The focus of this goal is to ensure that SSAcontinues to hire the highly skilled, highperforming and highly motivated workforcethat is critical to achievement of our mission.While SSA’s workforce is one of SSA’s mostvaluable assets and technology is equallyimportant because it is essential to theeffectiveness of that workforce and
indispensable to the success of SSA’sbusiness approach. SSA must meet growth inboth customer expectations and workloadsand improve or maintain service whilesatisfying staffing and streamlining goals. Toaccomplish this, SSA must use enablingtechnology to support improved ordramatically altered processes which simplify,speed up and eliminate tasks and freeemployee time for the more complexactivities which are not susceptible tosimplification or automation.
The Intelligent Workstation/Local AreaNetwork (IWS/LAN) is the linchpin for bothSSA’s customer service program and its entirebusiness approach. It facilitates many of theplanned productivity improvements andenables full reengineering of the disabilityprocess including processing time reductionsand other improvements projected in theredesign.
GOAL: To be an employer that
values and invests in each employee
Percent of Earnings Posted toIndividuals’ Records by September 30
90%
92%
94%
96%
98%
100%
Actual 97.3% 97.8% 98.5% 95.3%
GPRA Goal NA NA 98% 98%
FY 96 FY 97 FY 98 FY 99
Chart 8
*
* Estimate
$0.0
$0.5
$1.0
$1.5
$2.0
Actual $1.10 $1.20 $1.10 $1.20
GPRA Goal NA NA NA $1.20
FY 96 FY 97 FY 98 FY 99
OASDI Overpayment Dollars Collected
Dollars in Billions
Chart 7
20 Management's Discussion and Analysis
8/14/2019 Social Security: 99md&a2
http://slidepdf.com/reader/full/social-security-99mda2 7/13
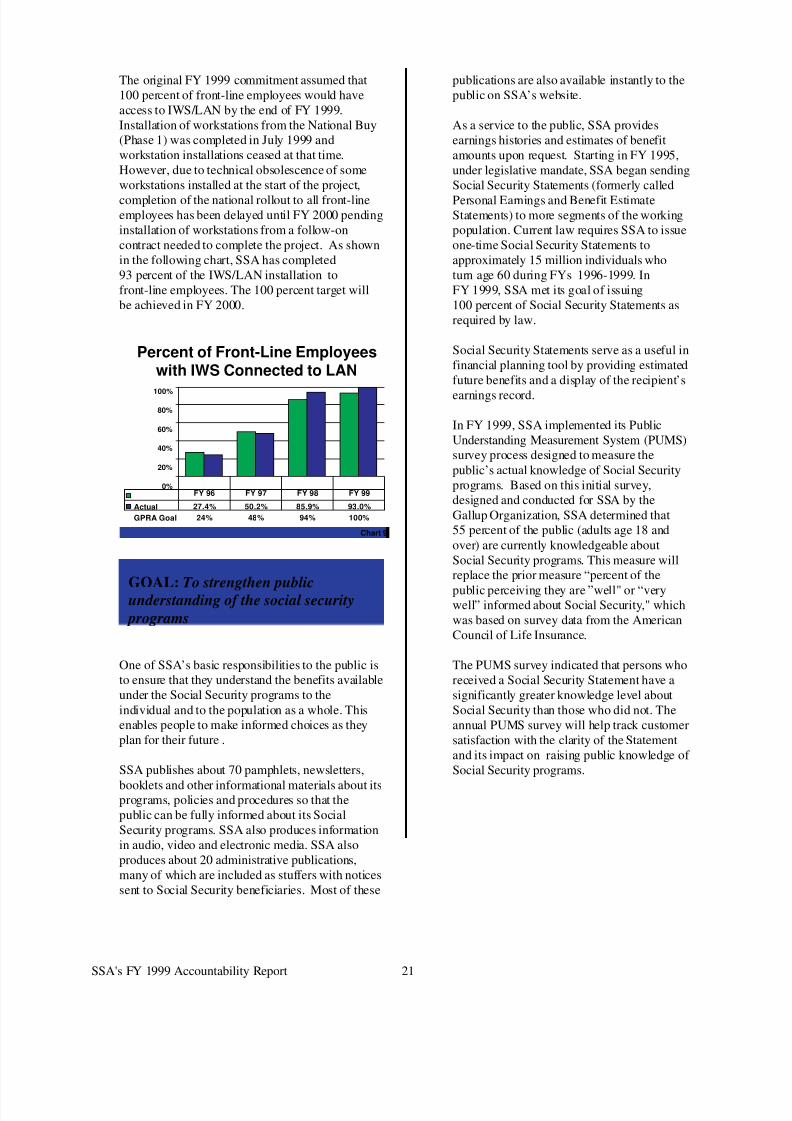
The original FY 1999 commitment assumed that100 percent of front-line employees would haveaccess to IWS/LAN by the end of FY 1999.Installation of workstations from the National Buy(Phase 1) was completed in July 1999 andworkstation installations ceased at that time.However, due to technical obsolescence of someworkstations installed at the start of the project,
completion of the national rollout to all front-lineemployees has been delayed until FY 2000 pendinginstallation of workstations from a follow-oncontract needed to complete the project. As shownin the following chart, SSA has completed93 percent of the IWS/LAN installation tofront-line employees. The 100 percent target willbe achieved in FY 2000.
One of SSA’s basic responsibilities to the public isto ensure that they understand the benefits availableunder the Social Security programs to theindividual and to the population as a whole. Thisenables people to make informed choices as theyplan for their future .
SSA publishes about 70 pamphlets, newsletters,
booklets and other informational materials about itsprograms, policies and procedures so that thepublic can be fully informed about its SocialSecurity programs. SSA also produces informationin audio, video and electronic media. SSA alsoproduces about 20 administrative publications,many of which are included as stuffers with noticessent to Social Security beneficiaries. Most of these
publications are also available instantly to thepublic on SSA’s website.
As a service to the public, SSA providesearnings histories and estimates of benefitamounts upon request. Starting in FY 1995,under legislative mandate, SSA began sendingSocial Security Statements (formerly called
Personal Earnings and Benefit EstimateStatements) to more segments of the workingpopulation. Current law requires SSA to issueone-time Social Security Statements toapproximately 15 million individuals whoturn age 60 during FYs 1996-1999. InFY 1999, SSA met its goal of issuing100 percent of Social Security Statements asrequired by law.
Social Security Statements serve as a useful infinancial planning tool by providing estimatedfuture benefits and a display of the recipient’s
earnings record.
In FY 1999, SSA implemented its PublicUnderstanding Measurement System (PUMS)survey process designed to measure thepublic’s actual knowledge of Social Securityprograms. Based on this initial survey,designed and conducted for SSA by theGallup Organization, SSA determined that55 percent of the public (adults age 18 andover) are currently knowledgeable aboutSocial Security programs. This measure willreplace the prior measure “percent of the
public perceiving they are ”well" or “verywell” informed about Social Security," whichwas based on survey data from the AmericanCouncil of Life Insurance.
The PUMS survey indicated that persons whoreceived a Social Security Statement have asignificantly greater knowledge level aboutSocial Security than those who did not. Theannual PUMS survey will help track customersatisfaction with the clarity of the Statementand its impact on raising public knowledge of Social Security programs.
GOAL: To strengthen publicunderstanding of the social security
programs
Percent of Front-Line Employeeswith IWS Connected to LAN
0%
20%
40%
60%
80%
100%
Actual 27.4% 50.2% 85.9% 93.0%
GPRA Goal 24% 48% 94% 100%
FY 96 FY 97 FY 98 FY 99
Chart 9
SSA's FY 1999 Accountability Report 21

8/14/2019 Social Security: 99md&a2
http://slidepdf.com/reader/full/social-security-99mda2 8/13
Overview of Financial Data
SSA’s financial statements and footnotes, appearing onpages 29 through 41, received an unqualified auditopinion for the sixth consecutive year. The balancesheet displayed on page 30 reflects total assets of $875.1 billion, a 17 percent increase over the previousyear. This increase is attributable to the steady growth of the OASDI Trust Fund reserves which were invested togenerate $53.7 billion of interest income, an increase of almost $6 billion compared to FY 1998. Of these$875.1 billion in assets, almost 98 percent areinvestments. These investments are commonly known asthe Social Security trust funds. By statute, we investthose funds not needed to pay current benefits in interestbearing Treasury securities. The majority of ourliabilities, almost 83 percent, consist of benefits that haveaccrued as of the end of the fiscal year but have not beenpaid. By statute, OASI and DI program benefits for the
month of September are not paid until October 3.
The charts below summarize the activity on SSA’sStatement of Net Cost and Statement of Changes in NetPosition by showing the funds that SSA was provided inFY 1999 and how these funds were used. Most resourcesavailable to SSA were used to finance current OASDIbenefits and to accumulate reserves to pay future benefits.When funds are needed to pay administrative expenses orbenefit entitlements, investments are redeemed to supplycash to cover the outlays. Less than 1.26 percent of theresources available to SSA are used to pay administrativeexpenses.
The Social Security trust funds are deemed to beadequately financed on a pay-as-you-go basis if the assetlevel at the end of a fiscal year is sufficient to cover atleast 1 year’s worth of benefit payments in the absence of other income such as payroll taxes. The following tableshows that the number of months of benefits thatcombined yearend OASDI assets can pay has grownfrom 16 months at the end of FY 1995 to 25 months at theend of FY 1999, a 56 percent increase.
SSA’s Share of Federal Operations
The programs administered by SSA constitute a large
share of the total receipts and disbursements of theFederal Government as shown in the following chart.Our programs accounted for 25.2 percent of the$1.7 trillion FY 1999 Federal disbursements and29.7 percent of the $1.8 trillion Federal receipts. Infact, our disbursements accounted for 4.8 percent of thenation’s estimated FY 1999 $8.8 trillion total grossdomestic product.
Number of Months of BenefitsYearend Assets Can Pay
0
10
20
30
OASI 17.6 18 .8 20.6 23 .1 26.1
DI 9.5 12.9 15.4 17.8 20
Combined 16.6 18.1 20 22.4 25.3
1995 1996 1997 1998 1999End of Fiscal Year
SSA’s Share of Federal Receiptsand Disbursements
FY 1999
(Dollars in Billions)
Total Federal Receipts$1,827
Total Federal Disbursements$1,705
SSA Receipts$542(29.7%)
SSA Disbursements$429(25.2%)
Where It Comes From...
General Fund Appropriations $34.3
Interest & Other $50.4
Tax Revenues $462.7
OASDI Trust Fund Net PositionBeginning of Year $705.6
Highlights of SSA’s Financial Position
...Where It GoesAdministrative and
Other Expenses $10.8SSI Federal Benefits $28.1DI Benefits $50.0
OASI Benefits $332.3
OASDI Trust Fund NetPosition End of Year $831.8
Dollars in Billions
22 Management's Discussion and Analysis
8/14/2019 Social Security: 99md&a2
http://slidepdf.com/reader/full/social-security-99mda2 9/13
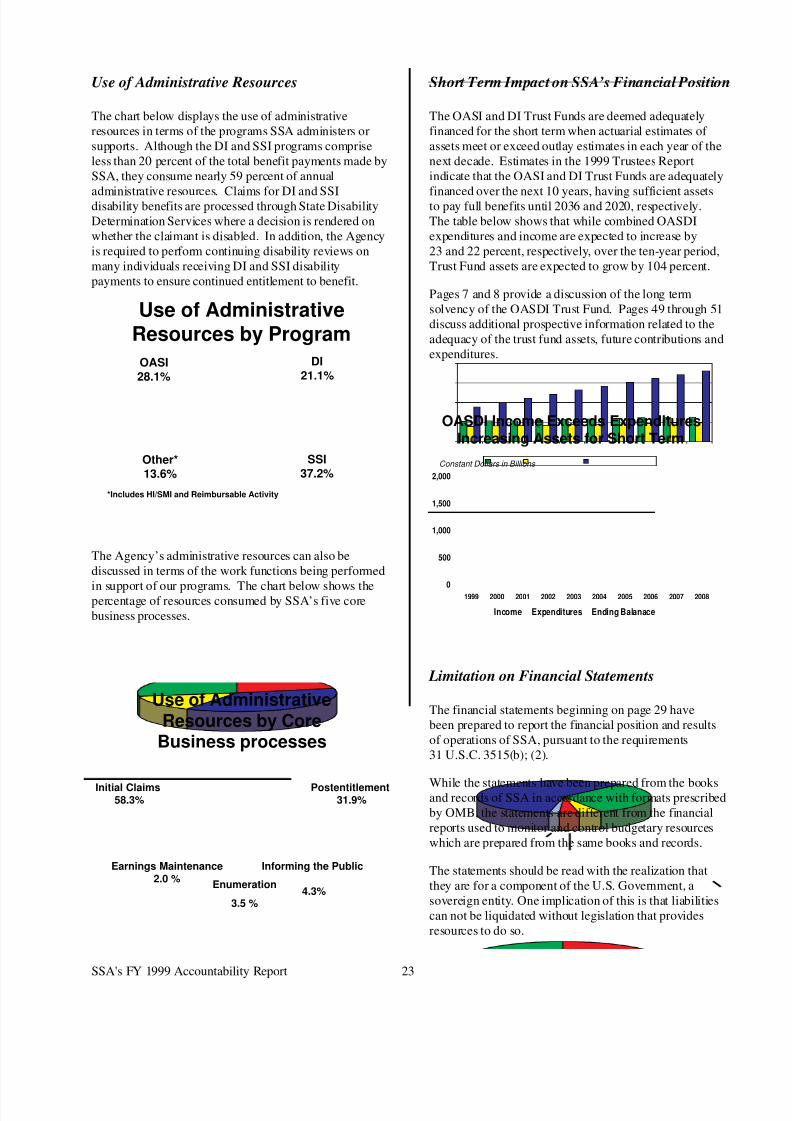
Use of Administrative Resources
The chart below displays the use of administrativeresources in terms of the programs SSA administers orsupports. Although the DI and SSI programs compriseless than 20 percent of the total benefit payments made bySSA, they consume nearly 59 percent of annual
administrative resources. Claims for DI and SSIdisability benefits are processed through State DisabilityDetermination Services where a decision is rendered onwhether the claimant is disabled. In addition, the Agencyis required to perform continuing disability reviews onmany individuals receiving DI and SSI disabilitypayments to ensure continued entitlement to benefit.
The Agency’s administrative resources can also bediscussed in terms of the work functions being performed
in support of our programs. The chart below shows thepercentage of resources consumed by SSA’s five corebusiness processes.
Short Term Impact on SSA’s Financial Position
The OASI and DI Trust Funds are deemed adequatelyfinanced for the short term when actuarial estimates of assets meet or exceed outlay estimates in each year of thenext decade. Estimates in the 1999 Trustees Reportindicate that the OASI and DI Trust Funds are adequately
financed over the next 10 years, having sufficient assetsto pay full benefits until 2036 and 2020, respectively.The table below shows that while combined OASDIexpenditures and income are expected to increase by23 and 22 percent, respectively, over the ten-year period,Trust Fund assets are expected to grow by 104 percent.
Pages 7 and 8 provide a discussion of the long termsolvency of the OASDI Trust Fund. Pages 49 through 51discuss additional prospective information related to theadequacy of the trust fund assets, future contributions andexpenditures.
Limitation on Financial Statements
The financial statements beginning on page 29 havebeen prepared to report the financial position and resultsof operations of SSA, pursuant to the requirements31 U.S.C. 3515(b); (2).
While the statements have been prepared from the booksand records of SSA in accordance with formats prescribedby OMB, the statements are different from the financialreports used to monitor and control budgetary resourceswhich are prepared from the same books and records.
The statements should be read with the realization thatthey are for a component of the U.S. Government, asovereign entity. One implication of this is that liabilitiescan not be liquidated without legislation that providesresources to do so.
OASDI Income Exceeds ExpendituresIncreasing Assets for Short Term
0
500
1,000
1,500
2,000
1999 2000 2001 2002 2003 2004 2005 2006 2007 2008
Income Expenditures Ending Balanace
Constant Dollars in Billions
Use of AdministrativeResources by Program
DI21.1%
SSI37.2%
Other*13.6%
OASI28.1%
*Includes HI/SMI and Reimbursable Activity
Use of AdministrativeResources by Core
Business processes
Initial Claims58.3%
Earnings Maintenance2.0 %
Enumeration
3.5 %
Informing the Public
4.3%
Postentitlement31.9%
SSA's FY 1999 Accountability Report 23

8/14/2019 Social Security: 99md&a2
http://slidepdf.com/reader/full/social-security-99mda2 10/13
The Social Security Administration (SSA) has an
agencywide management control and financialmanagement systems review program as required by theFederal Managers’ Financial Integrity Act (FMFIA). TheAgency accomplishes the objectives of the program byintegrating management controls in its business processesand financial systems at all organizational levels. TheAgency’s Executive Internal Control Committee providesexecutive oversight of the program and addressesmanagement control issues that have a substantial impactupon the Agency mission. The committee also meetsperiodically to review the status of actions to correctweaknesses.
Management control issues and weaknesses are identifiedthrough audits, reviews, studies and observation of dailyoperations. SSA conducts internal reviews of management and systems security controls in itsadministrative and programmatic processes and financialmanagement systems. The reviews are conducted toevaluate the adequacy and efficiency of the Agency’soperations and systems to provide an overall assurancethat the Agency’s business processes are functioning asintended. The reviews also ensure that management
controls and financial management systems comply withthe standards established by FMFIA, Federal FinancialManagement Improvement Act, Paperwork ReductionAct, Computer Security Act and Office of Managementand Budget (OMB) Circulars A-123, A-127 and A-130.
The reviews include evaluation of business processessuch as enumeration, earnings, claims, postentitlementevents, debt management and SSA’s financialmanagement systems.
SSA develops and implements corrective action plans forweaknesses found through its management controlreviews and financial management systems reviews andtracks the corrective actions until the weaknesses arecorrected. Regional Security Office staffs monitor thestatus of corrective actions resulting from managementcontrol reviews of field activities and the Office of Finance, Assessment and Management monitors the
status of corrective actions resulting from financialmanagement systems reviews. The status of correctiveactions is periodically updated and reported to SSAexecutives as appropriate.
Management Control ReviewsSSA has an agencywide review program for managementcontrols in its administrative and programmatic processes.The Agency requires that a minimum of 10 percent of field offices (FO) be reviewed each FY. The FOs areselected for review by considering performance measuresin selected critical processes and by using the experienceand judgement of the regional security personnel. During
FY 1999, SSA’s managers and contractors conductedreviews of 1,437 management control areas in 183 FOsand staff components.
SSA contracted with an independent public accountingfirm to review the Agency’s management controlprogram using generally accepted audit standards toevaluate the effectiveness of the Agency managementcontrol program and to make recommendations forimprovement. During the first year, the contractorreviewed operations at the central office, processingcenters, 5 Regional Offices (RO) and 40 FOs. In June1999, the contractor issued a report stating that the
aspects of the management control program tested appearto be effective in meeting management’s expectations forcompliance with Federal requirements. The reportdisclosed no significant weaknesses indicatingnoncompliance with laws and regulations. During thesecond year of the contract, the contractor will visit thedisability processing center, the remaining 5 ROs and30 FOs.
Systems and Controls
FMFIA Assurance Statement
Fiscal Year 1999
On the basis of SSA’s comprehensive
management control program, I am
pleased to certify, with reasonable
assurance, that SSA’s systems of
accounting and internal controls are in
compliance with the internal control
objectives in OMB’s Bulletin Number
98-08, as amended. I also believe these
same systems of accounting and internal
controls provide reasonable assurance that the Agency is in compliance with the
provisions of the Federal Managers’
Financial Integrity Act.
Commissioner of Social Security
24 Management's Discussion and Analysis
8/14/2019 Social Security: 99md&a2
http://slidepdf.com/reader/full/social-security-99mda2 11/13
Financial Management Systems ReviewsThe Agency prepares and annually updates a 5-yearreview plan for its financial management systems. Withina 5-year period, both the SSA system manager and acontractor review each financial management system. Thesystem manager conducts a limited review and thecontractor conducts a detailed review, includingtransaction testing, of the system. During FY 1999, theSSA system manager conducted a limited review of theCost Accounting System and the contractor conducted adetailed review of the Modernized Claims System.Beginning in July 1998, the contractor was required toadhere to audit standards. This enables the Office of theInspector General (OIG) and the contractor who auditsSSA’s financial statements to use the review results moreextensively.
Audit of Financial StatementsFor the last 3 years, OIG contracted for the audit of SSA’sfinancial statements. Each year the auditor found that theprincipal financial statements were fairly stated in allmaterial respects. The auditor also found management’sassertion that SSA’s systems of accounting and internalcontrols were in compliance with OMB’s internal controlobjectives to be fairly stated in all material respects.However the auditor, using OMB’s audit standards,identified reportable conditions involving internalcontrols.
In the audit report for the FY 1997 financial statementsand internal controls, the auditor identified five reportableconditions. In the audit report for FY 1998, the auditorremoved two of the five reportable conditions from theprevious year. In the audit report for FY 1999, the auditor
did not identify any new reportable conditions andremoved the reportable condition for segregation of dutiesfrom the FY 1998 audit report. The auditor also reportednoteworthy progress toward correcting the two remainingconditions previously reported in FY 1998. The FY 1999report concluded that SSA continued to show significantprogress in correcting the weaknesses identified in theaudit reports.
SSA closed or completed corrective actions on themajority of the auditor’s recommendations made in theFY 1997 audit report and addressed almost half of theFY 1998 recommendations. SSA continues to work on
the remainder. SSA is also developing corrective actionplans for the findings and recommendations in theFY 1999 audit report. A synopsis of the current status onthe reportable conditions in the FY 1998 and FY 1999reports follows:
Finding 1, SSA Needs to Further Strengthen Controls toProtect Its Information: In the audit report for FY 1998,the contractor noted that SSA made significant progressin strengthening controls to protect its information in theautomated mainframe environment and recommendedadditional attention to the distributive environment. SSAcompletely or partially addressed 15 of the 26recommendations in this finding and continues work on
the remainder.
In the audit report for FY 1999, the auditor stated thatSSA continued to make “notable” progress in addressingthe information protection issues raised in prior years, butthe information control structure needs improvement.Since many of the recommendations in the FY 1999report are variations of recommendations in the auditor’sprevious audit reports, SSA has been addressing thoseissues on an ongoing basis and will continue to work onthem until completed.
Finding 2, SSA Needs to Complete and Fully Test Its
Plan for Maintaining Continuity of Operations: Theauditor recommended that SSA complete a businessimpact analysis and use the results to validate all criticalworkloads; finalize and test the draft cold siteimplementation plan; expedite the current schedule forsuccessful testing of all critical workloads; and, continueto periodically test all contingency planning proceduresand update the associated documentation. In the auditreport for FY 1998, the auditor stated that SSA hadshown “noteworthy” progress in this area and recognizedSSA’s plans to improve its plans for continuity of operations.
Since then, the Agency completed a new business impactanalysis that included identification and validation of thecritical workloads; decided to eliminate plans forconverting to a cold site after a period and to extend thetime at the hot site instead; and, successfully tested all of its critical systems over the last 3 years. As a result, thecontractor stated in its audit report for FY 1999, SSAmade “notable” progress during the past year inimplementing improvements recommended in previousaudits. The auditor stated that SSA remains focused onthe systems aspect of contingency planning, but alsoneeds to ensure it addresses contingency planning foroperations as well as systems. SSA will continue to work
on improving the systems support to our contingencyplans and give emphasis to ensuring that the operationsaspect is addressed.
SSA's FY 1999 Accountability Report 25

8/14/2019 Social Security: 99md&a2
http://slidepdf.com/reader/full/social-security-99mda2 12/13
Finding 3, SSA Can Improve Controls Over Separationof Duties: In the FY 1998 audit report, the auditorreported inadequate separation of duties in field offices,systems operations and security administration. SSAgenerally agreed that improvements could be made in theareas of systems operations and security administrationand addressed most of those recommendations. Theauditors emphasized the use of performance measures to
identify high-risk transactions in the field offices foranalysis and recommended, when warranted, additionalpreventive controls. Working with the auditors, SSAidentified existing and potential controls for severalhigh-risk transactions and continues to improve controlsin those areas.
In the FY 1999 audit report, the contractor removed thisfinding as a reportable condition. SSA had demonstratedsufficient progress in improving the controls involvingseparation of duties to justify its removal. Although it isno longer considered a reportable condition, SSA willcontinue to correct weaknesses previously identified until
all are completed.
FMFIA Material Weakness
During FY 1999, SSA did not declare any new materialweaknesses under FMFIA. SSA made good progress inits efforts to correct the one remaining FMFIA materialweakness relating to the accuracy of the accountingrecords for Supplemental Security Income for the Aged,Blind, and Disabled (title XVI of the Social Security Act)overpayments and underpayments. SSA expects tocomplete its corrective actions for this weakness bySeptember 30, 2000. During FY 1999, to help ensure that
outstanding debts are pursued for recovery, the Agencyimplemented a process to automatically transfer existingdebts on closed records to new Supplemental Securityrecords. SSA also continued efforts to develop a newaccounting system to account for and report debtdetection and clearances. This accounting system willinclude new data input screens and transaction-basedprocessing.
26 Management's Discussion and Analysis
8/14/2019 Social Security: 99md&a2
http://slidepdf.com/reader/full/social-security-99mda2 13/13
SSA's FY 1999 Accountability Report 27