Embed Size (px)
Citation preview
Social screening and mutual fund performance: international evidence
Joana Pena a, Maria Céu Cortez b*
a School of Economics and Management, University of Minho, Gualtar, 4710-057 Braga, Portugal
Email: [email protected]
b NIPE – School of Economics and Management, University of Minho, Gualtar, 4710-057 Braga, Portugal
Email: [email protected]
* Corresponding author

2
Social screening and mutual fund performance: international evidence
Abstract
This paper investigates the relationship between the risk-adjusted performance and the
screening strategies of 330 US and European equity socially responsible mutual funds over the
period 2003-2014. On aggregate, the results support the argument that investors can pursue
their ethical investment policies without sacrificing financial returns. For US and Scandinavian
funds, we find a curvilinear relationship between screening intensity and performance: US
funds exhibit an inverted U-shaped effect, while Scandinavian funds, consistent with Barnett
and Salomon (2006), show a U-shaped effect. Differently, for UK funds, there is a negative
linear relationship between the number of screens and returns. For the other countries, there is
no significant relationship between screening and fund performance. Furthermore, the results
show that the type of the screening activities of US and UK socially responsible funds have a
significant impact on risk-adjusted returns. For US funds, environment and products screens
negatively impact performance, whilst corporate governance contributes to performance. In
turn, UK funds that screen on the basis of products have relatively stronger performance.
Finally, positive screening yields lower performance the global sample and for US funds.
Keywords: Socially responsible investments, screening, financial performance, risk-adjusted
performance, mutual funds,
EFM Codes: 380, 750
1. Introduction
The increasing growth of Socially Responsible Investments (SRI) around the world has
led to an intense debate among academics and investors on whether there is a premium or
penalty for holding socially responsible funds. Investing with ethical concerns has clearly gone
from margin to mainstream, but there is yet some reluctance in embracing SRI principles,
mainly because some literature does not exclude a price for ethics.
What makes a fund socially responsible? There is no single and universal definition of
what criteria a mutual fund should follow to be an ethical or socially responsible fund (Dunfee,

3
2003). SRI funds can use different screening strategies (positive, negative, or “best-in-class”)
and a wide variety of criteria to filter for socially responsible companies. Ultimately, the degree
of heterogeneity in the screens used by SRI funds reflects the diversity of investors’ values.
Despite the heterogeneity of SRI funds, many papers treat them as a homogenous group
(Ferruz et al., 2012). According to Galema et al. (2008) and Derwall et al. (2011), among
others, one of the reasons why the empirical literature yields scarce significant relations
between SRI and returns is the aggregation of different social dimensions that may have
confounding effects in financial performance. In fact, Schlegelmilch (1997) metaphorically
defines ethical investment as an “umbrella term for a wide variety of products”. Since socially
responsible investors typically consider a multitude of criteria that can be contradictory or even
mutually exclusive (Dunfee, 2003; Kempf and Osthoff, 2007), we should focus on the
heterogeneity within SRI funds.
In the academic literature, there are still few studies that investigate the impact of
different screens on SRI performance. This type of studies can provide further insights on
previous research that suggests that SRI funds exhibit no significant performance differences
from conventional funds. According to Kinder and Domini (1997), screening is the expression
of the investors’ values and societal concerns in a way that allows its application in the
decision-making process. Through screening, SRI funds restrict their investments to firms that
are engaged in social practices in specific stakeholder-oriented issues, or to those that are not
involved in socially irresponsible activities or products. The latter approach may involve the
exclusion of not merely certain firms, but entire industries and even economic sectors. The
selection process can thus have significant implications in the financial performance of an
investment portfolio (Barnett and Salomon, 2006).
Since the screening strategies applied to SRI portfolios impose constraints to the
investment universe, the risk-adjusted returns of a socially screened portfolio can be lower
relatively to an unrestricted one. Nevertheless, the use of specific social screens may allow
portfolio managers to identify companies with sustainable competitive advantages, reflected in
improved future performance. Thus, the issue of the types of screens must be taken into account
to understand whether SRI funds outperform their conventional peers, that is, if investors are
“doing well while doing good” (Hamilton et al., 1993).
The analysis of the relationship between the features of the non-financial screening
process and the financial performance of SRI funds will shed some light on the financial
advantage (or disadvantage) of selecting socially constrained funds. This study comprises data
from socially responsible mutual funds domiciled in European countries and in the US, so we

4
can assess geographically if there is a “don’t mix money and morality” philosophy (Goldreyer
et al., 1999), or if ethical and social values are financially rewarded.
In this context, the central aim of this paper is to investigate how the screening process,
i.e., the number of screens and qualitative differences in the screens used, affects risk-adjusted
performance, and also if the impact of the screening processes differs worldwide. The analysis
of whether there are geographical differences in the impact of the screening process on SRI
fund performance is relevant, considering the different patterns of SRI development around the
world. In fact, several studies recognize the contextual nature of SRI and confirm regional and
cultural idiosyncrasies in socially responsible investing (e.g., Louche and Lydenberg, 2006;
Bengtsson, 2008; Neher and Hebb, 2016). Thus, different social concerns may vary
considerably in geographic terms, especially in terms of screening strategies. As Sandberg et
al. (2009) suggest, cultural differences might be one explanation for heterogeneity in the field
of SRI.
We contribute to the mutual fund literature in several ways. To the best of our
knowledge, we are the first to study to analyze the effects of the screening process in Europe
and in the US. Although there are some papers in the SRI literature that explore this issue, with
the exception of Renneboog et al. (2008b), extant evidence is geographically limited. For
example, Barnett and Salomon (2006) and Lee et al. (2010) focus on US funds, Laurel (2011)
analyze European funds, and Capelle-Blancard and Monjon (2014) restrict their investigation
to French funds. And although Renneboog et al. (2008b) evaluate SRI fund performance for
different countries worldwide, the analysis of the relation between screening and performance
is performed at the aggregate level and not by region or country. Furthermore, our analysis
considers the multiple dimensions of the social screening process. Previous studies include one
or a few of these dimensions such as screening intensity and type of screens, screening signal
(positive vs. negative), or sectoral and transversal screens. We capture all these dimensions, as
well as social label certification, as part of the screening process. As far we are aware of, we
are the first to integrate SRI labels as a determinant of the financial performance of SRI funds.
For US funds, our analysis shows that the number of screens has a statistically
significant impact on performance, specifically an inverted U-shaped effect: funds than screen
more strictly have better risk-adjusted returns until a certain extent of screens; then, the returns
start to decline. On the other hand, the U-shape effect is the opposite for Scandinavia: financial
performance decreases at first as the number of screens increases, but then raises continuously
until it achieves the maximum screening intensity. The UK exhibits a linear negative
relationship between screens and returns. In relation to our global sample, or other European
5
countries, we find no conclusive evidence on the impact of the number of screens on SRI fund
performance.
We also find some evidence that the type of screens used impact performance of US
and UK SRI funds. In particular, environment- and products-oriented US SRI funds appear to
have lower returns, whereas governance-oriented US SRI funds are financially rewarded.
Unlike the US, products-oriented UK SRI funds benefit from a superior financial performance.
In terms of the screening strategy, considering the global sample and the sub-sample of
US funds, we find that funds which impose positive screens have worse performance. This
conclusion is in line with Auer (2016) who argues that only negative screens (with low cut-off
rates) allow SRI investors to be consistent with their personal values and beliefs without being
forced to sacrifice performance.
Our results are relevant for several reasons. First, we obtain statistically significant
empirical evidence for the US, the biggest SRI player in the world, not only concerning the
screening intensity, but also the qualitative differences in the screens (types of screens and
screening strategy – positive vs. negative). Second, our main findings reveal a negative linear
relationship between screening intensity and financial performance for the UK, and a
curvilinear (U-shaped) relationship between screening intensity and financial performance for
Scandinavian countries. To our knowledge, we are the first to document conclusive results in
respect to important SRI markets1 such as the UK - a country with early roots on SRI, and
Scandinavian countries, who were among the first in the world to introduce regulatory
frameworks and standards to promote social responsibility activities in financial management
(Sandberg et al., 2009). Finally, our study shows that the imposition of positive screens reduces
funds’ financial performance, when considering European and US funds as a whole, and US
funds individually.
The remainder of the paper is organized as follows. Section 2 surveys the empirical
literature. Section 3 proposes a set of testable hypotheses and section 4 describes the data used
in the study. The methodology is outlined in section 5. The empirical results are presented and
discussed in section 6. Section 7 summarizes the main results and presents some concluding
remarks.
1 Biehl and Hoepner (2010) also find a negative relationship between social and financial performance for UK funds, but the
authors employ a social rating as screening criteria.

6
2. Literature review
2.1. Introduction
During the last decades, the SRI industry has experienced a high growth and became
very fashionable. This trend was further supported by investors’ reactions to well-known
corporate and environmental scandals that became public in the beginning of the millennium,
and their increased sensitivity to issues such as emissions control, global warming, human
rights, labour and community relations.
Nevertheless, despite the increasing popularity of SRI, some academic studies are
cautious about the claims made on its behalf. For example, Watson (2011) indicates that there
appears to be a marketing strategy in the SRI sector exploiting the currently high positive
sentiment amongst investors. Utz and Wimmer (2014) also question the social level of SRI
labelled funds given that SRI mutual funds, on average, do not hold socially responsible firms
to a greater extent than conventional funds do.
Even though there are many arguments pointed out in favour of a positive or negative
relationship between financial performance and Corporate Social Responsibility (CSR), there
is still an ongoing debate over whether adding an ethical dimension to the stock selection
process generates value. On the empirical side, an overwhelming body of research has tested
these different predictions. Some evidence points out that socially controversial stocks earn
abnormal positive returns, but other evidence suggests that stocks of companies with high
scores on environmental and social responsibility issues outperform companies with poor
social records on these issues. Also, most studies conclude that socially responsible funds
neither outperform or underperform their conventional peers.
For instance, on the one hand, Diltz (1995) finds that employing environmental and
military screens leads to a significantly positive performance, and Renneboog et al. (2008b)
conclude that funds adopting a community involvement policy have better returns. On the other
hand, Chong et al. (2006) find that the risk-adjusted performance of stocks in the Vice Fund
(the antithesis of SRI) is superior to both the Domini Social and the Standard & Poor’s 500,
and Fabozzi et al. (2008) and Hong and Kacperczyk (2009) show that “sin” stocks (alcohol,
tobacco, gaming) outperform the market.
SRI investors are a heterogeneous group, and so there is a great diversity of funds in

7
terms of the intensity and the variety of types of screens used. Considering such heterogeneity,
it seems unreasonable to assume that different types of social criteria have the same effect on
investment portfolios’ returns. Thus, not all dimensions of social responsibility may be
rewarded similarly and thus treated alike (Renneboog et al., 2011; Areal et al., 2013).
Although each SRI fund is practically unique in the way it offers a specific combination
of investments personalized to the social needs of a particular group of investors, Renneboog
et al. (2008a) identify four generation of screening processes. The first generation of screens
is characterized by the enforcement of negative screens, by specifying stocks or industries that
should be excluded from SRI portfolios on the basis of social, environmental and ethical
criteria. Alcohol, tobacco, and gambling typically represent the most common restrictions used
in negative screening strategies. Positive screens constitute the second generation of screens,
and involve selecting stocks of companies that accomplish superior standards of CSR in
specific dimensions such as community involvement, environment, diversity, employee
relations, among others. Positive screening strategies are often combined with a “best-in-class”
approach, according to which firms are ranked within each industry or market sector based on
social criteria. Renneboog et al. (2008a) highlight that US and UK markets are more focused
on negative screens, while positive screens and the “best-in-class” strategy are more popular
in Continental Europe. The third generation of screens refers to an integrated approach of
selecting companies based on the economic, environmental and social criteria comprised by
both negative and positive screens (“triple bottom line”), and the fourth generation combines
the third generation with shareholder activism (attempt to influence the companies’ actions
through direct dialogue with the management, or by the use of voting rights).
2.2. Theoretical approaches
Theoretically, two opposing views emerge as crucial to the discussion on the financial
merits of considering socially responsible criteria in the investment process. These two
approaches have been competing with each other to provide plausible explanations to the
impact of social screening on portfolios’ performance - this is known in the literature as the
debate between Markowitz (1952) and Moskowitz (1972) (Kurtz, 1998).
The first approach is supported by modern portfolio theory and claims that including
socially responsible criteria implies in a financial penalty. According to Markowitz (1952),
social screens constrain the portfolio mean-variance optimization framework and the
limitations imposed by screening reduce the potential diversification of SRI portfolios. The

8
exclusion of specific companies, and perhaps entire sectors, can be reflected in higher levels
of risk (Barnett and Salomon, 2006). Additionally, if we assume markets are efficient,
securities’ prices would have already incorporated all relevant factors (including the financial
consequences from CSR), whereby none selection criteria (from social nature or not) can
provide a consistently superior performance (Moskowitz, 1972). Finally, the implementation
of social screens involves increased costs of obtaining and monitoring information (Barnett
and Salomon, 2006; Areal et al., 2013).
Alternatively, another viewpoint suggests that the information associated with CSR
may not be properly incorporated in the prices of securities, allowing portfolios constructed on
the basis of this information to provide superior returns, as in Moskowitz (1972). A key
assumption underlying this hypothesis is that stock markets misplace information on CSR in
the short run such that SRI funds may outperform conventional funds in the long run
(Renneboog et al., 2008b). Advocates of SRI argue that screening practices allow fund
managers to generate value-relevant non-public information on issues such as managerial
competence and superior corporate governance (Renneboog et al. 2008a). Accordingly, social
criteria are useful tools to identify companies with higher management quality (Bollen, 2007).
As a consequence, the potential loss of efficiency as a result of the use of a restricted universe
of securities can be more than offset by the inclusion of companies representing better
investment opportunities (Barnett and Salomon, 2006). This viewpoint, supported by
stakeholder theory (Freeman, 1984), is consistent with the argument that social investors have
a multi-attribute utility function that does not just include risk-reward optimization, but also
incorporates personal and societal values (Bollen, 2007).
In sum, modern portfolio theory holds that social responsibility will damage financial
performance. However, consistent with stakeholder theory, proponents of SRI argue that some
firms can be consistently better financial performers than others because of their social oriented
characteristics (Barnett and Salomon, 2006). It is clearly a debate between two paradigms,
namely the traditional and still dominant paradigm, and the new paradigm of behavioural
finance, which advocates that investors incorporate variables as happiness and non-financial
profits in their investment decisions. However, it can be argued, as in Barnett and Salomon
(2006), that both perspectives, instead of being competitors, are in fact complementary, and
the relationship between social and financial performance may be curvilinear, and not strictly
monotonic.

9
2.3. Empirical studies
Most academic studies find that the performance of SRI funds is not statistically
different from the performance of conventional funds. Among others, Hamilton et al. (1993),
Goldreyer et al. (1999), Statman (2000) and Bello (2005), for US funds, Luther et al. (1992),
Mallin et al. (1995) and Gregory et al. (1997) for UK funds find similar results in the sense
that SRI fund performance is no better or worse than that of non-SRI funds and benchmark
indexes. Studies focusing on other individual markets, including Scholtens (2005) on Dutch
funds, Bauer et al. (2006, 2007) on Canadian funds and Australian funds, respectively, and
Fernandez-Isquierdo and Matallin-Saez (2008) on Spanish funds, find similar results. Other
studies, such as Schröder (2004), Bauer et al. (2005), Kreander et al. (2005) and Cortez et al.
(2009, 2012) focus on multiple markets and also find that the performance of SRI funds is not
statistically different from that of their conventional peers.2
It is important to note, however, that these studies analyse SRI fund performance
disregarding the fact different funds might use different screening strategies, which may impact
performance in a different way. Recently, several papers move away from the simplistic search
of answers for the performance of SRI as a whole, and focus on the question of “when does it
pay to be good” (Capelle-Blancard and Monjon, 2014).
The analysis of the distinct screening characteristics used by SRI funds may play an
important role in clarifying this issue. Barnett and Salomon (2006) and Renneboog et al.
(2008b) are two seminal studies that find that screening intensity and some dimensions of social
responsibility are intrinsically related to a higher financial performance.
Barnett and Salomon (2006) find a curvilinear relationship between screening intensity
and financial performance for US funds. In particular, when the number of social screens used
by a SRI fund increases, financial returns decline at first, but then rebounds as the number of
screens reaches a maximum. This suggests the two long-competing viewpoints (modern
portfolio and stakeholder theories) may be both valid. These results are consistent with a trade-
off between the effects of diversification and selective choice of socially responsible companies,
2 There are a few exceptions to this type of results. For instance, Gil-Bazo et al. (2010) show that US SRI funds outperform
conventional funds. In contrast, Renneboog et al. (2008b) find that SRI funds in France, Ireland, Sweden and Japan, perform
worse than their conventional peers. For a more detailed analysis, see the meta-analysis of SRI portfolio performance studies
of Revelli and Viviani (2015), who conclude that SRI funds do not perform differently than conventional funds.

10
and so “middle” funds may be the most penalized, since they may not be able to effectively
eliminate unsystematic risk, or keep away from their portfolios companies with worst
performance.
To determine if investors pay (or not) a price of ethics, Renneboog et al. (2008b)
investigate the under- and outperformance hypotheses for US, UK and European and Asia-
Pacific SRI funds. The authors find that high screening intensity constrains the risk-return
optimization and fund returns decrease with screening intensity on social and corporate
governance criteria, but not on ethical or environmental criteria.
Focusing on UK SRI funds, Biehl and Hoepner (2010) use a slightly different approach
from other studies, namely a rating of SRI funds as screening criteria. The authors conclude
that the portfolios with the highest social ratings underperform significantly, and propose two
theoretical explanations for the results of Barnett and Salomon (2006): first, funds which apply
few screening criteria do not limit their universe in a way that it would affect their
diversification, i.e. the elimination of specific risk; and second, if funds apply several screens
it is likely that they select companies which achieve superior long-term results.
Lee et al. (2010), for US SRI funds, and Capelle-Blancard and Monjon (2014), for
French SRI funds, observe that a high number of screens negatively impacts performance,
while Humphrey and Lee (2011) find weak evidence that screening intensity increases risk-
adjusted performance of Australian funds. Lee et al. (2010) also suggest that screened
portfolios are able to obtain adequate levels of diversification (they find no relation between
idiosyncratic risk and screening intensity), whilst Capelle-Blancard and Monjon (2014)
highlight that only sectoral screens (such as avoiding “sin” stocks) decrease financial
performance; transversal screens have no impact. Like Barnett and Salomon (2006), they also
find that the initial negative effect is partly offset as the number of screens increases.
With respect to the return/risk binomial, and for a dataset of European socially
responsible funds, Laurel (2011) finds that screening intensity has no effect on returns but has
a curvilinear effect on risk. This means that funds with the least amount of screens have lower
risk; this risk increases with the number of screens but then again decreases at high screening
intensity (inverted U-shaped effect).
Additionally, Barnett and Salomon (2006) find that financial performance varies with
the types of social screens used: community relations screening increases financial
performance, whereas environmental and labour relations screening decrease financial
performance. With a different categorization, Renneboog et al. (2008b) show, for a dataset
including worldwide funds, that the number of corporate governance and social screens
11
significantly reduces financial performance, while the number of ethical screens, “sin” screens,
or environmental screens do not have significant impact on performance.
In line with these group of studies, Renneboog et al. (2011) show that the flow-
performance relationship for SRI investors depends on the types of screens used and on
screening intensity.
Table 1 summarizes the main features and contributions of the papers that have
addressed the relationship between the intensity and social dimensions of screens used by SRI
funds and financial performance.
[INSERT TABLE 1]
Besides evidence that the type of social screens used can influence SRI performance,
there are also some studies at the corporate level that show a relationship between specific
dimensions of CSR and financial performance, and studies which focus on subsets of SRI funds
(mainly green and religious funds).
Concerning CSR, some authors show that firms that have good labour relations will
benefit in terms of improved performance. For example, based on KLD ratings, Kempf and
Osthoff (2007), and Statman and Glushkov (2009) report significant outperformance of
portfolios of companies that perform well on the employee relations dimension. Based on the
performance of America’s 100 Best Corporate Citizens, Brammer et al. (2009) support this
type of findings. Additionally, Edmans (2011) demonstrates that an annually rebalanced
portfolio of companies included in Fortune magazine’s “100 Best Companies to Work For in
America” list outperforms the benchmarks.
A growing body of empirical literature also reports a positive relation between
corporate environmental performance and firm value. Klassen and McLaughlin (1996) study
the effect of published reports of events and awards on firm valuation and find that the
marketplace rewards firms which minimize their adverse environmental impact, or improve
their environmental programmes. In turn, Konar and Cohen (1997) show that polluting firms
lose market value in a one-day window following the release of Toxic Release Inventory
information, and Russo and Fouts (1997) complement previous work suggesting “it pays to be
green”. According to Dowell et al. (2000), firms adopting a stringent global environmental
standard have much higher market values than firms with less stringent, or poorly enforced
standards. King and Lenox (2001) also find evidence of an association between lower pollution
and higher financial valuation, while Konar and Cohen (2001) suggest that firms that are

12
disposing of relatively smaller amounts of toxic chemicals, and those that are confronted with
few or no environmental lawsuits, tend to have higher market value. Derwall et al. (2005) show
that a portfolio of companies labelled the most eco-efficient significantly outperform their least
eco-efficient counterparts, and Salama (2005) points out that it appears that investors who
target environmentally admirable companies do not incur a financial penalty. Following the
same line of reasoning of Derwall et al. (2005), Guenster et al. (2011) report that corporate
environmental performance relates positively to operating performance and market value.
In contrast, other studies – e.g., Cordeiro and Sarkis, 1997; Filbeck and Gorman, 2004;
de Haan et al., 2012 – support a negative relationship between environmental and financial
performance. Cordeiro and Sarkis (1997) show a significant negative relationship between
corporate environmental activism and earnings per share performance forecasts, whilst Filbeck
and Gorman (2004) demonstrate a negative relationship between financial return and a pro-
active measure of environmental performance in electric utilities. Employing the Carhart (1997)
four-factor model plus a fifth factor that captures risks associated with corporate environmental
performance, de Haan et al. (2012) also find a negative relationship between environmental
performance and stock returns.
Considering different dimensions of CSR, other studies document a positive impact in
the financial performance of firms with good community relations (Waddock and Graves, 2000;
Simpson and Kohers, 2002; Rodgers et al., 2013) and customer relations (Rodgers et al., 2013).
Waddock and Graves (2000) show that companies that invest in stakeholder relations have
above-average values of accounting performance measures, while Simpson and Kohers (2002),
using the Community Reinvestment Act as a measure of social performance, support a positive
link between social and financial performance. Additionally, the study of Rodgers et al. (2013)
on the top corporate citizens provides evidence that two dimensions of CSR - customer and
community relations - have a positive effect on both financial health and market value of firms.
At the mutual fund level, academic research that focus on a particular criterion is still
emerging, but there are already some studies that focus on the performance of funds that use
specific screens like green or religious funds. In what concerns green investments, most
empirical studies show that environmental mutual funds do not perform differently (e.g., White,
1995; Mallett and Michelson, 2010; Climent and Soriano, 2011; Muñoz et al., 2014), or
underperform their conventional counterparts and/or the market (e.g., Climent and Soriano,
2011; Chang et al., 2012; Ibikunle and Steffen, 2015; Silva and Cortez, 2016).
White (1995) shows a similar (inferior) performance of German (US) green funds in
relation to market. Later, Mallett and Michelson (2010) conclude that there is no real difference

13
in terms of performance between green funds and SRI and index funds, whilst Climent and
Soriano (2011) find that green funds have lower performance (or similar if we consider a
shorter sample period) than conventional funds with similar characteristics. Chang et al. (2012)
also show that US green mutual funds generate lower returns and similar risks relatively to US
conventional mutual funds. Muñoz et al. (2014) show a similar performance between green
and other SRI funds, regardless of the market cycle (crisis or non-crisis). Ibikunle and Steffen
(2015) show that green funds significantly underperform their conventional peers, while there
are no statistical differences between green and black (fossil energy and natural resource) funds.
More recently, Silva and Cortez (2016) show that US and European global green funds tend to
underperform the benchmark, particularly in non-crisis periods.
Besides green funds, another subset of SRI funds that has been somewhat explored is
faith-based funds. Although Hayat and Kraeussl (2011) and Ferruz et al. (2012) show religious
mutual funds underperform conventional ones, other studies find a neutral performance of
religious funds in relation to the market (Boasson et al., 2006; Hoepner et al., 2011) and to
other types of socially responsible mutual funds (Areal et al., 2013). On the contrary, Lyn and
Zychowicz (2010) show that faith-based funds mostly outperform the market, and this kind of
screened mutual funds exceeds the financial performance achieved by other types of US SRI
funds. In turn, Abdullah et al. (2007) find that Islamic mutual funds perform better than
conventional mutual funds during bearish economic trends, whereas conventional mutual funds
show better performance for bullish economic conditions.
Several papers in this field focus on the impact of the screening features on SRI fund
performance in different economic cycles. The central issue here is the one formulated by
Nofsinger and Varma (2014): “would investors be willing to give up some return in non-crisis
market periods to gain some higher returns during crisis periods?”. Areal et al. (2013) assess
whether socially responsible or irresponsible investments perform better in “good times” or
“bad times”, and conclude that the use of different screens might impact mutual fund
performance across different market regimes: the Vice Fund, which invests in unethical firms,
outperforms in low-volatility regimes and underperforms in high-volatility regimes. For
European and US funds, Muñoz et al. (2014) point out that green funds do not perform worse
than other forms of socially responsible mutual funds, and this conclusion holds after
controlling for crisis market periods. The results of Silva and Cortez (2016) suggest that the
performance of green funds is higher in crisis periods in comparison to non-crisis periods.
Nofsinger and Varma (2014) observe that SRI attributes drive an asymmetric return
pattern in which SRI funds outperform conventional funds in market crisis periods but

14
underperform in non-crisis periods (SRI act like a protective shield in negative market cycles).
The authors suggest that the positive socially responsible features of companies result in lower
risk in market crisis periods, and this is a factor that can explain SRI popularity. Nevertheless,
this behaviour – outperformance in crisis periods – is driven by funds that screen based on
shareholder advocacy and ESG issues; SRI funds that focus on “sin” stocks or other product
screens, and faith or religious funds, do not outperform in crisis periods.
For French socially responsible funds investing in European markets, Leite and Cortez
(2015) show that SRI funds significantly underperform their conventional peers during non-
crisis periods. The authors also conclude that this result is driven by funds that employ negative
screens (SRI funds that use only positive screens exhibit similar performance to conventional
funds across different market states). Gangi and Trotta (2015) focus on the performance of
European socially responsible funds during the international financial crashes of 2008 and 2011,
and their empirical findings prove that investments that consider ethical issues are able to
contain the negative effects during the “bear” phases of the market (CSR is able to compensate
the “ethical sacrifice” supported by investors). Becchetti et al. (2015) support this type of
results and show that SRI funds played an “insurance role” outperforming conventional funds
during the global financial crisis. In relation to the Japanese market, Nakai et al. (2016)
document that SRI funds resisted better to the bankruptcy of the Lehman Brothers (the
momentous event that triggered the financial crisis) in comparison to conventional funds.
For SRI bond funds, Henke (2016) identifies a strong outperformance during crisis
periods, reinforcing the idea that SRI funds are attractive investment opportunities that
accumulate abnormal returns during recessions or bear market periods. The results of Leite and
Cortez (2016) illustrate that, during expansions, European SRI bond funds outperform their
conventional peers, whereas during recessions they seem capable to perform similarly to
conventional funds.
Overall, the purpose of this investigation is to extend earlier research on the relationship
between the financial performance of SRI funds and the characteristics of the non-financial
screening process. Specifically, and since the evidence remains fragmented, we intend to
investigate and enlighten the impact of the heterogeneity in the SRI funds’ industry for a dataset
of US and European funds, some of which belonging to the most developed SRI markets in the
world.
3. Research hypotheses

15
This paper investigates whether screening intensity (the number of screens employed)
and the type of criteria used (i.e. Environmental, Social and Governance - ESG - screens)
influence funds’ financial performance. Accordingly, we develop a set of hypotheses on the
relationship between portfolio financial performance and screening intensity and type of social
screens used.
Modern portfolio theory advocates a negative relationship between the number of
screens used and portfolio performance (hypothesis 1a) since the exclusion of companies based
on SRI screens may constrain the investment opportunities, thereby affecting the risk-return
optimization process. For instance, SRI funds typically do not invest in “sin” stocks, although
these stocks have historically outperformed the market (Renneboog et al., 2008b). Thus,
investors who base their decisions on social and personal values and derive non-financial utility
from investing in companies meeting high social standards may be willing to explicitly deviate
from the economically rational goal of wealth-maximization and accept a lower rate of return
- the underperformance hypothesis.
Conversely, stakeholder theory argues that socially responsible behaviour of companies
and managers allows companies to integrate the interests of all stakeholders, thus contributing
to an improved performance of funds including these companies (hypothesis 1b). Also, SRI
screens can be viewed as filters to identify managerial competence and superior corporate
governance (value-relevant information not completely embedded in the share prices), or to
avoid/reduce the potential costs of corporate social crises and environmental disasters
(Renneboog et al., 2008b), which supports the outperformance hypothesis.
Thereby, we set up the following mutual exclusive hypotheses:
Hypothesis 1a: A higher screening intensity reduces the performance of SRI funds
(underperformance hypothesis).
Hypothesis 1b: A higher screening intensity enhances the performance of SRI funds
(outperformance hypothesis).
Following Barnett and Salomon (2006), we also hypothesize a curvilinear relationship
between screening intensity and financial performance (consistent with both modern portfolio
theory and stakeholder theory). The intuition of this research hypothesis is that the financial
loss carried by a SRI fund when it imposes social restrictions is, after a certain level of

16
screening intensifies, offset by the financial benefits of including better-managed and more
solid firms into the portfolio (Barnett and Salomon, 2006).
Hypothesis 2: The relationship between the intensity of social screening and financial
performance for SRI funds is curvilinear.
Like previous papers, we also integrate in the analysis the type of screens used, defined
as the specific ESG factors the fund focuses on. A number of empirical studies argues that SRI
funds may be oriented towards specific ESG criteria which impact performance differently.3
To account for different types of screens, Barnett and Salomon (2006) employ five dummies,
namely for environment, labour relations, equal employment, community investment, and
community relations screens. In turn, Renneboog et al. (2008b) define four types of screens,
specifically “sin”, ethical, environmental, and social and corporate governance, whereas
Capelle-Blancard and Monjon (2014) and Nofsinger and Varma (2014) emphasize labour
relations, community relations and environment.
We follow the categorization employed by US SIF – The Forum for Sustainable and
Responsible Investment4, namely environment, social, governance, products and shareholder
engagement. Although this study is not restricted to American funds, the US SIF is a reference
in the SRI research field, and establishes a relatively wide classification of screens
(encompassing 16 positive and negative screens)5 that can also be applied to European funds.
Thus, we hypothesize that:
Hypothesis 3a: SRI funds that select firms based on environmental screening criteria
(climate/clean tech, pollution/toxics, environment/other) obtain higher returns than those that
do not screen on these criteria.
Hypothesis 3b: SRI funds that select firms based on social screening criteria (community
development, diversity and equal employment opportunity policies, human rights, labour
relations, Sudan) obtain higher returns than those that do not screen on these criteria.
3 Furthermore, there is also evidence (discussed in section 2.3.) that investing in companies that focus on specific dimensions
of social responsibility (e.g. labour relations, environment, community relations) provides positive abnormal returns.
4 The US SIF is an organization that promotes the integration of socially responsible behaviour in the investment practices in
the United States.
5 For example, combining the information from a variety of data sources, Renneboog et al. (2008b) identified a total of 21
screens used by SRI funds around the world.

17
Hypothesis 3c: SRI funds that select firms based on governance screening criteria (board issues,
executive pay) obtain higher returns than those that do not screen on these criteria.
Hypothesis 3d: SRI funds that select firms based on products screening criteria (alcohol, animal
welfare, defense/weapons, gambling, tobacco) obtain higher returns than those that do not
screen on these criteria.
Hypothesis 3e: SRI funds that select firms based on shareholder engagement screening criteria
obtain higher returns than those that do not screen on these criteria.
In line with Capelle-Blancard and Monjon (2014), another relevant distinction is
between sectoral and transversal criteria: sectoral criteria refer to the exclusion of entire sectors
(i.e. “sin” screens and environmental screens), while transversal criteria apply to all firms (i.e.
commitment to international conventions - United Nations Global Compact, International
Labour Organization Rights at Work, etc.). The authors defend it is likely that portfolio
diversification is more impacted by sectoral screens (which target specific sectors) than by
transversal screens. Hoepner and Schopohl (2016) also address the exclusionary screening of
two leading Nordic investors from a dual perspective, namely the sector-based exclusion
(company’s business model), and the norm-based exclusion (company’s violation of
international norms). The results indicate initial evidence that the performance effect differs
between these two exclusion decisions.
So, we establish the following hypothesis:
Hypothesis 4: Only sectoral screens affect financial performance; transversal screens do not
have any impact.
Additionally, we will focus on the screening strategy signal: positive (seeking out
stocks with good ESG performance) versus negative (weeding out poor ESG performing
stocks), since is reasonable to assume that both strategies will lead to different financial
performance results (Ferruz et al., 2012). Goldreyer et al. (1999) find that SRI funds which
impose positive screens outperform funds that do not have positive screens. Humphrey and
Lee (2011) conclude that positive screening significantly reduces risk, while Nofsinger and
Varma (2014) demonstrate that the asymmetric return pattern in ESG funds is especially
18
pronounced in those that use positive screening techniques. Leite and Cortez (2015) also find
that SRI performance across different market conditions is related to positive/negative
screening strategies. The findings of Trinks and Scholtens (2015) further suggest that there are
opportunity costs to negative screening.
Therefore, concerning the impact of positive and negative screening, we formulate the
next hypothesis:
Hypothesis 5: SRI funds that use positive screening techniques obtain higher returns than those
that use negative screening techniques.
Finally, we will distinguish funds that have received at least one sustainability label.
SRI labels are certifications attributed to socially responsible funds, which have emerged with
the purpose of providing investors with quality standards and more transparency on socially
responsible investment products.6 For the US market, we will identify the funds with the
Diamond Standard7 label. For European funds, we will also distinguish the funds awarded with
the following certifications: Ethibel Pioneer 8 , European SRI Transparency Code 9 ,
Luxembourg Fund Labelling Agency (LuxFLAG)10, Novethic SRI Label11, Novethic Green
Fund Label12, Austrian Eco Label13, and United Nations Principles for Responsible Investment
6 Considering concerns that the socially responsible denomination of mutual funds might be more of a marketing tool (Utz and
Wimmer, 2014), the purpose of SRI labels is to ensure investors that the fund actually complies with the stated social screens.
7 Diamond Standard is a guarantee of quality assigned by website yourSRI, a database which provides the search, comparison
and rating of several companies and investment products through their investment profile and SRI classification. The
sustainability performance of a fund is constructed on the basis of more than 70 indicators, offering an overview of the fund’s
strengths and weaknesses in comparison to its peers in terms of research quality, portfolio quality, engagement and
transparency (yourSRI, 2016).
8 Ethibel Pioneer is a quality label applied by Forum Ethibel to investment funds which exclusively invest in shares or bonds
included in the Investment Register and with an A or B rating (usually industry leaders in terms of CSR) (Forum Ethibel,
2016).
9 The European SRI Transparency Code was launched to increase the accountability and clarity of SRI practices for European
investors. It focuses on SRI funds in Europe and has been designed to cover a range of asset classes, such as equity and fixed
income (EUROSIF, 2016).
10 The objective of the Luxembourg Fund Labelling Agency is to assure investors that the investment fund invests their assets,
directly or indirectly, in the responsible investment sector – e.g., the LuxFLAG Environment Label, which primarily invests
in environmental-related sectors (LuxFLAG, 2016).
11 The Novethic SRI Label is the first European certification granted to SRI funds managed strictly on the basis of ESG criteria,
and that ensures a high degree of transparency in the SRI management processes used (Novethic, 2016).
12 The Novethic Green Fund Label is awarded to funds that select companies on the basis of environmental standards. The
certified funds must also meet transparency, social and governance criteria (Novethic, 2016).
13 The Austrian Eco Label was created by government initiative and certifies environmentally friendly products and services,
as well as projects and companies within the financial services sector which achieve long term positive returns linked to ethical,
sustainable and socially responsible activities (Umweltzeichen, 2016).
19
(UNPRI)14.
The evidence of Silva and Cortez (2016) suggests a tendency for green funds that are
certified with a label to perform better than uncertified green funds. We believe that SRI labels
are a guarantee of compliance with ESG principles awarded by associations recognized as
experts, and not merely a marketing artefact. So, we postulate the following:
Hypothesis 6: SRI funds that operate under at least one SRI label obtain higher returns than
those that do not.
4. Data
Much of the research on SRI funds has focused on the US and UK markets, two world
leaders in sustainable and responsible finance, and with long traditions in this area. The US
SIF 2016 Report identifies 8,72 trillion of dollars of total assets under management using SRI
strategies at the beginning of 2016, an increase of 33% since 2014, and a 14-fold increase since
1995, when the US SIF Foundation first measured the size of the US SRI market. In relation
to the UK, it is worth mentioning that it is the first country that regulated the disclosure of
social investment policies of pension funds and charities (Renneboog et al., 2008a), and one
of Europe’s most significant SRI markets.
Although the US is still the SRI world leading market, Europe is growing substantially
in terms of assets and number of funds considering ESG criteria. According to the 2014 Review
from Vigeo15, the total of assets under management in Europe amounts to 127 billions of euros
(108 billion in the previous year), with France having the leading role in terms of assets under
management (46 billions of euros), number of funds (263) and new openings (25). It should be
also noted that the 2014 market share of SRI funds increased in all markets, with remarkable
increases in the Netherlands (17,8% of the national assets under management), Belgium (7,5%),
France (4%), Switzerland (3,8%) and Germany (3,1%).
This study investigates US and European socially responsible mutual funds. With
regard to European funds, we will focus on the countries covered by the reports and surveys of
14 The United Nations Principles for Responsible Investment Initiative is a network of investors which believe that ESG issues
can affect the performance of investment portfolios and also acknowledge that applying the six principles may better align
investors with broader objectives of society (UNPRI, 2016). 15 Vigeo is a rating agency specialized in the review of European companies and organizations that comply with ESG principles.
20
Vigeo, a benchmark in terms of European SRI, namely Austria, Belgium, Denmark, France,
Germany, Italy, Luxembourg, Netherlands, Norway, Sweden, Switzerland, and United
Kingdom 16 . Our dataset includes SRI equity funds from these countries. To avoid data
duplication, in the case of funds with different classes, only one class of each fund is considered.
As first criterion, we select the oldest class; if the inception date is the same, we chose the class
with more assets under management. Finally, in order to be included in our sample, the SRI
funds must disclose at least one screen as part of their investment policies.
4.1. US funds
Our subsample of US funds consists of 80 socially responsible mutual funds over the
period January 2000 to December 2014. The information on the funds is mainly extracted from
two US SIF data sources: the Mutual Fund Performance Chart17 on 31st December 2014 and
the SRI Trends Reports18. The Mutual Fund Performance Chart provides information on the
social screening strategies (number and type of social screens employed) of a set of surviving
funds at the end of 2014. For the other funds of the sample, we manually collected the
information on social screens through the funds prospectuses and websites, as well as from US
Securities and Exchange Commission (SEC) files.
Considering the problems that may be raised by survivorship bias (Brown et al. 1992),
we included not only surviving funds but also funds that disappeared during the period under
evaluation. Although we use the 2001 to 2012 SIF SRI Trends Reports to identify funds that
got liquidated or merged during the sample period, we cannot ensure we were able to identify
all dead funds.
Information on the screening criteria used by funds is not available historically, so we
recognize the inherent assumption that the screening strategy of the mutual funds did not
change over time. Given that the funds in the sample can be considered quite young (with a
mean age of 14 years), it is reasonable to assume that the screening strategies did not change
dramatically over time. Humphrey and Lee (2011) also mention this assumption. The authors
note that none of the funds with completed survey information changed their screening
16 We excluded Spain due to insufficient data.
17 The US SIF Mutual Fund Performance Chart contains the socially responsible mutual funds offered by US SIF’s institutional
member firms.
18 Although US SIF publishes reports since 1995, the list of SRI funds is included in the report only since 2001. Thus, our
analysis includes the years 2001, 2003, 2005, 2007, 2010 and 2012. We exclude 5 categories from the US SIF listings, namely
Other pooled products, Annuity funds, Exchange-traded funds, Closed-end funds and Alternative investment funds.

21
practices over the sample period.
4.2. European funds
To identify SRI funds domiciled in Europe, we followed Renneboog et al. (2008b) and
Nofsinger and Varma (2014) and first searched on Datastream for certain keywords that are
common in SRI fund names, such as “Social”, “Socially”, “Ecology”, “Environment”, “Green”,
“Sustainability”, “Sustainable”, “Ethics”, “Ethical”, “Faith”, “Religion”, “Christian”, “Islam”,
“Baptist”, and “Lutheran”. We then intersected the information obtained from Datastream with
the funds’ fact sheets (concerning the European countries covered by Vigeo) available on the
website yourSRI19. The fact sheets provide information about the investment objective, SRI
classification (screens and SRI labels), and investment profile (investment category, regional
focus, asset status, domicile, inception date, benchmarks), among other data, for SRI funds
around the world. Although this procedure for identifying SRI funds has allowed us to detect
dead funds, we acknowledge that our European SRI sample may not be survivorship bias free.
Since Luxembourg is chosen as domicile for many funds mainly because of its
favourable tax laws, we will distribute the funds based on the countries of origin of the fund
management companies, as in Renneboog et al. (2008b). Thereby, the resultant sample consists
of 250 funds domiciled in 12 European countries, from January 2000 to December 2014. The
majority of the funds are from Switzerland (26%), France (22%), and United Kingdom (13%).
Similar to US funds, we assume static screening strategies during the sample period (on
average, our European funds live 12 years).
The final sample results in an unbalanced panel20 of 330 US and European funds over
the period 2000 to 2014. Figure 1 shows the distribution of funds per country.
[INSERT FIGURE 1]
4.3. Risk Factors
The risk factors considered are the Fama and French (1993) three factors (market, size,
and book-to-market) and the fourth factor suggested by Carhart (1997), momentum, which are
19 yourSRI is a database and research platform for socially responsible products and services (yoursri.com).
20 Some of the Size and Total Expense Ratio data are missing.
22
collected from the Professor Kenneth French Data Library.
For domestic US funds, we employ the Fama/French North American 3 factors plus the
momentum factor. Similarly, for European funds that invest only in Europe, we use the
Fama/French European 3 factors plus the momentum factor. For funds investing internationally,
we use the Kenneth French global factors. All the factors are in US dollars, and the risk-free
rate is the US one-month Treasury-bill rate, (as in Renneboog et al., 2008b; Nofsinger and
Varma, 2014).
4.4. Financial performance
In line with previous studies (e.g. Barnett and Salomon, 2006; Renneboog et al., 2008b;
Capelle-Blancard and Monjon, 2014), the dependent variable is the risk-adjusted performance,
computed on the basis of the monthly returns of SRI funds denominated in US dollars. For
both US and European funds, we use Datastream to collect each fund’s end of month Return
Index (from January 2000 through December 2014). Discrete returns are calculated on a
monthly basis. A minimum of 36 months of return data across the sample period is required.
Figure 2 presents the average monthly returns over the sample period.
[INSERT FIGURE 2]
The figure shows that, at the beginning of the period in analysis (2000 to 2002), the
average returns of US funds are higher than the average returns of European funds. The
situation was reversed during the years 2003 to 2007, and then again recovered in 2009.
Additionally, it seems clear the peak of the global financial crisis of 2008, with highly negative
average returns, and very similar for US and European funds.
The procedure to estimate monthly risk-adjusted returns is based on Ferreira et al.
(2013), i.e. we estimate regressions of 36 months on a rolling monthly basis. First, every month,
we regress the previous 36 months of fund excess returns on the market excess returns and the
size, value/growth and momentum factors, as in Carhart (1997). From each of these regressions,
we obtain the monthly estimates from the beta coefficients. We then use these estimates along
with the value of the respective factors to calculate the expected return of each fund in each
month. Monthly alphas (i.e. the abnormal performance measure) are calculated by subtracting
these values to the effective return of each fund. Since this process requires 36 months of prior
information and the analysis begins in January 2000, we get the first performance estimates in

23
January 2003. This performance measure is the dependent variable of our model.
Table 2 reports the descriptive statistics of the risk-adjusted performance by country.
[INSERT TABLE 2]
The average risk-adjusted performance is negative in all countries. France enjoys by far
the highest and lowest values during the period, followed by the United States.
4.5. Social variables
Although the definition of the social variables differs among studies, generally they
emerge in the form of two groups: by screening intensity and by type.
Screening intensity is a quantitative variable constructed to measure the strength of the
requirements imposed by fund managers to filter firms, the lack of diversification of SRI funds
and, to some extent, the quality of the process (Capelle-Blancard and Monjon, 2014).
Differently, the second group of variables of interest is of a qualitative nature. Their aim is to
emphasize the “best practices” among the SRI funds.
In this study, screening intensity is proxied by the number of screens applied by each
fund. As mentioned previously, we will apply the US SIF’s screening categorization to all (US
and European) funds. The US SIF defines 16 types of screens that SRI funds may use to filter
firms from their investment portfolios, namely climate/clean tech 21 , pollution/toxics 22 ,
environment/other23, community development24, diversity & equal employment opportunity
21 These screens focus on risk and opportunities related to climate change and greenhouse gas emissions, or on businesses
dedicated to environmentally sustainable technologies, efficient use of natural resources, or mitigating negative ecological
impacts; includes clean energy generation, infrastructure and storage (US SIF, 2016).
22 These screens consider the toxicity of products and operations and/or pollution management and mitigation, including
recycling, waste management and water purification (US SIF, 2016).
23 This category of screens focuses on residual environmental issues (other than climate/clean tech or pollution/toxics) (US
SIF, 2016).
24 These screens focus in provision of affordable housing, fair consumer lending, small and medium business support and other
services and support to low- and medium-income communities (US SIF, 2016).
24
policies25, human rights26, labour relations27, Sudan28, board issues29, executive pay30, alcohol31,
animal welfare32, defense/weapons33, gambling34, tobacco35 and shareholder engagement36. If
a fund’s screening intensity is given a value of 16, this indicates that the fund employs all 16
of the listed screens, whereas a value of 1 indicates that the fund uses only 1 of the 16 available
screens. Figure 3 illustrates the screening intensity of all funds in the sample.
[INSERT FIGURE 3]
The screening intensity of the SRI funds of our sample varies widely. More than 50%
of the funds apply between 1 and 4 screens, while only about 10% apply a number of screens
higher than 10. There are 11 funds (3,3% of the total sample) with the maximum screening
intensity (16 screens), and 57 funds (17,3%) with the minimum screening intensity (1 screen).
To test hypothesis 4, we consider the number of sectoral screens and the number of
transversal screens used by SRI funds. In the nomenclature of US SIF, we define as sectoral
screens climate/clean tech, pollution/toxics, environment/others, alcohol, animal welfare,
defense/weapons, gambling and tobacco, and as transversal screens diversity & equal
employment opportunity policies, human rights, labour relations and Sudan. Sectoral screens
25 These screens relate to diversity and equal employment opportunity policies and practices relating to employees, company
ownership or contractors (US SIF, 2016).
26 This category of screens considers risks associated with human rights and companies’ respect for human rights within their
internal operations and the countries in which they do business, often with particular emphasis on relations with indigenous
peoples, supply-chain management and conflict zones (US SIF, 2016).
27 This category of screens considers companies’ labour or employee relations programs, employee involvement, health and
safety, employment and retirement benefits, union relations or workforce reductions (US SIF, 2016).
28 This type of screens involves the exclusion or partial exclusion of companies that conduct business in Sudan because of its
human rights abuses or support of terrorism (US SIF, 2016).
29 These screens consider the directors’ independence, diversity, pay and responsiveness to shareholders (US SIF, 2016).
30 These screens consider companies’ executive pay practices, especially whether pay policies are reasonable and aligned with
shareholders’ or other stakeholders’ long-term interests (US SIF, 2016).
31 This type of screens involves the exclusion or partial exclusion of companies involved in the production, licensing and/or
retailing of alcohol products, or in the manufacturing of products necessary for production of alcoholic beverages, as well as
ownership by an alcohol company (US SIF, 2016).
32 These screens consider companies’ policies and practices toward animals in consumer product testing, where such testing
is not legally required, particularly where such tests inflict pain or suffering on the test animals, and on the treatment of animals
raised or used for food and other goods and services (US SIF, 2016).
33This category of screens involves the exclusion or partial exclusion of companies that derive a significant portion of their
revenues from the manufacture or retailing of firearms or ammunition for civilian use, or from military weapons (US SIF,
2016).
34 This type of screens involves the exclusion or partial exclusion of companies involved in licensing, manufacturing, owning
or operating gambling interests (US SIF, 2016).
35 These screens involve the exclusion or partial exclusion of companies involved in the production, licensing, and/or retailing
of tobacco products, or in the manufacturing of products necessary for production of tobacco products (US SIF, 2016).
36 These screens relate to filing or co-filing shareholder resolution and/or engaging in private dialogue on environmental, social
or governance issues with companies in this investment strategy portfolio (US SIF, 2016).

25
vary from 1 to 8, and transversal screens from 1 to 4.
The type of screen is measured using a dichotomous variable for each of the screening
strategies employed by US SIF, namely environment (screens related to climate, clean
technology, pollution, toxics and other environmental issues), social (screens associated with
community development, diversity and equal employment, human rights, labour relations and
Sudan), governance (screens that account for board and executive pay issues), products
(screens that exclude companies involved in alcohol, animal welfare, defense/weapons,
gambling and tobacco products) and shareholder engagement. For instance, in order to test
hypothesis 3a, we will assign a value of 1 to the variable environment if a fund screened out
firms based on at least one environmental factor, and zero otherwise.
Similarly, to assess hypothesis 5, we establish a dummy variable for positive screening.
Since most funds of our sample employ a combination of positive and negative screens (the
third screening generation mentioned by Renneboog et al., 2008a), we decided to assign the
value of 1 if the fund employs a higher number of positive screens (in relation to negative
screens), and zero otherwise.
Finally, we will differentiate funds that have been awarded with at least one SRI label.
Although there are more sophisticated methodologies to establish a ranking for mutual funds
based on non-financial criteria (e.g. Petrillo et al., 2016), we will use a dummy variable for
funds that have been certified by sustainability labels. The purpose of these labels is to provide
investors with a quality standard (beyond the self-named label of socially responsible funds)
by assuring the systematic integration of ESG criteria into mutual funds’ management.
Table 3 provides some descriptive statistics on the screening characteristics of the SRI
funds included in this study.
[INSERT TABLE 3]
Most SRI funds of our sample put the emphasis on products (73%), environment (56%)
and social concerns (50%). The percentage is higher for US funds (in relation to European
funds) for the five types of nature of the screening process (environment, social, governance,
products, and shareholder engagement), with the largest differences occurring on corporate
governance and shareholder engagement topics.
In our sample, almost all funds exclude entire sectors that do not comply with ESG
principles (96%), and about 50% exclude firms, regardless of the industry, that do not subscribe
fundamental international conventions, or connect with firms that have business relations in

26
Sudan. Moreover, nearly 51% of the funds employ the positive screening approach (42,50% of
US funds, and 53,60% of European funds), and approximately two thirds are certified by SRI
labels (with stronger focus on European funds – 76,40%).
4.6. Control variables
Since the main goal of this paper is to determine if the SRI positioning is compatible
with profitability, it is necessary to control for factors that could systematically affect SRI
performance. We therefore include a variety of variables previously recognized as likely to
influence the financial performance of mutual funds, namely funds’ characteristics (age, size,
and total expense ratio) and investment style (domestic or global funds).
To address the “catching-up phase” in SRI funds identified by Bauer et al. (2005)37,
and following Barnett and Salomon (2006), Humphrey and Lee (2011) and Nofsinger and
Varma (2014), among others, we include the variable Age, defined as the number of months
since the fund’s inception. For surviving funds in late December 2014, the variable is computed
with reference to 31 December 2014; for missing funds, is calculated up to the liquidation or
merger date.
In line with Barnett and Salomon (2006), Lee et al. (2010) and Capelle-Blancard and
Monjon (2014), and in order to control for any potential size effect, we include the variable
Size, measured by the fund total net assets (in million US dollars)38. Indro et al. (1999) and
Chen et al. (2004) show that larger funds are subject to decreasing returns to scale. Ferreira et
al. (2013) find a negative relation between fund size and performance only for US funds; for
non-US funds, fund size is positively related to performance. In relation to SRI funds, Gregory
et al. (1997) find that the fund size does not seem to affect performance results.
The Total Expense Ratio is a measure of the total costs associated with managing and
operating an investment fund (management fees, trading fees, legal fees, auditor fees and other
operational expenses)39. Empirical evidence on the impact of fees in performance is mixed.
Chen et al. (2004) and Ferreira et al. (2013) do not find evidence of a relationship between fees
and fund performance for US funds. Other authors find a negative relation between fees and
fund performance (e.g. Carhart, 1997, Gil-Bazo and Ruiz-Verdú, 2009 in relation to US funds
37 Bauer et al. (2005) investigate the returns of ethical mutual funds (relative to those of their conventional counterparts)
through time and document that ethical mutual funds went through a so-called catching-up phase, possible due to a learning
effect.
38 Monthly data on total net assets of US and European funds are a courtesy of Thomson Reuters.
39 This monthly variable is obtained from Datastream for both US and European funds.

27
and Dahlquist et al., 2000 and Otten and Bams, 2002 in relation to European funds). Chang
and Witte (2010) suggest that the costs of socially responsible investing are not homogeneous.
Thus, the expense ratio may have impact on financial returns of SRI funds.
The following table reports the average values (from 2003-2014) by country of the 330
funds selected in this study concerning Age (in months), Size (in million US dollars), and Total
Expense Ratio (in percentage).
[INSERT TABLE 4]
In our sample, the average fund Age varies from 108 (Switzerland) to 249 (Norway)
months, while Size ranges from 22,97 (Austria) to 1392,90 (Norway) million dollars40. The
Total Expense Ratio is between 1,23% (United States) and 2,02% (Italy).
Global and regional economic cycles may also affect financial performance and thus,
funds with only domestic holdings may perform differently from those with international
holdings. To monitor for performance differentials across funds with domestic and
international holdings, and following several studies (e.g. Barnett and Salomon, 2006;
Renneboog et al., 2008b; Capelle-Blancard and Monjon, 2014), we incorporate a dummy
variable Global. For US (European) funds, this variable takes the value of 1 if the fund invests
outside US (Europe), and zero otherwise. With regard to the funds’ regional objective, 72,5%
of the US funds are domestic, and about 64% of the European funds diversify their assets
outside Europe.
5. Methodology
The main research objective of this paper is to explore the relationship between the SRI
filtering mechanisms and the performance of a dataset of US and European funds. This section
presents the methodology for testing the effects of the intensity and type of investment screens
applied on SRI funds’ financial performance.
As mentioned in the previous section, we use the Carhart (1997) four-factor model (as
in Renneboog et al., 2008b, Lee et al., 2010 and Nofsinger and Varma, 2014, among others)
to compute the risk-adjusted returns of the funds of our sample. Although a few papers apply
40 The high average values of the Size variable for Norway and Sweden are related to the fact that these countries have few funds in the sample
(5 and 13 funds, respectively), but very significant in terms of assets under management.

28
the CAPM based single factor alpha (e.g. Barnett and Salomon, 2006; Renneboog et al., 2008b;
Capelle-Blancard and Monjon, 2014), the limitations associated to the latter, namely the fact
that it does not capture all relevant sources of systematic risk, motivates the use of multi-factor
models. The Carhart (1997) model is one of the most commonly used models in the
performance evaluation literature, and is an extension of the Fama and French (1993) three-
factor model (that considers the market, size and value factors) including a momentum factor,41
as follows:
𝑟𝑖𝑡 − 𝑟𝑓,𝑡 = α𝑖 + β𝑖𝑀𝐾𝑇(𝑟𝑚𝑡 − 𝑟𝑓,𝑡) + β𝑖𝑆𝑀𝐵𝑆𝑀𝐵𝑡 + β𝑖𝐻𝑀𝐿𝐻𝑀𝐿𝑡 + β𝑖𝑈𝑀𝐷𝑈𝑀𝐷𝑡 + ε𝑖𝑡 (1)
where
rit is the return of fund i in month t;
rf,t is the risk-free rate in month t;
rmt is the market return in month t;
SMBt, HMLt, and UMDt are the Small Minus Big (i.e. return spread between a small cap
portfolio and a large cap portfolio at time t), High Minus Low (i.e. return difference between a
value stock portfolio and a growth stock portfolio at time t), and Momentum (i.e. difference in
return between a portfolio of past winners and a portfolio of past losers at time t) factors;
α is the intercept;
βMKT, βSMB, βHML, βUMD are the factor loadings on the four factors (market, size, book-to-market,
and momentum); and
εit stands for the error term.
The risk-adjusted performance of the SRI funds is the dependent variable of our study.
We then examine whether it is related with the magnitude and type of the screening process,
controlling for variables related to funds’ characteristics and investment style.
In model (2), we postulate risk-adjusted performance as a linear function of screening
intensity, to test whether including more social screens is positively or negatively related to
fund financial performance, and estimate the following model:
41 Although prior research has recognized the dynamic nature of the state of the economy, and that funds do not have constant betas (the funds’
risk exposures change in response to public information on the economy, such as the level of interest rates and dividend yields), we will not
employ a conditional model due to the problem which could be generated from the existence of a large number of betas to estimate by the
model. Also, the fact that we are considering a rolling window somewhat accounts for time-varying risk exposures.

29
𝑅𝐴𝑃𝑖𝑡 = 𝛾0 + 𝛾1𝑆𝐼𝑖 + 𝛾2𝐿_𝐴𝐺𝐸𝑖 + 𝛾3𝐿_𝑆𝐼𝑍𝐸𝑖𝑡 + 𝛾4𝑇𝐸𝑅𝑖𝑡 + 𝛾5𝐺𝐿𝑖 + μ𝑖𝑡 (2)
where
RAPit is the risk-adjusted performance of fund i in month t;
SIi is the screening intensity of fund i;
L_AGEi is the logarithm of the number of months since the fund’s inception;
L_SIZEit is the logarithm of the fund size (total net assets in million US dollars);
TERit is the Total Expense Ratio of the fund i;
GLi is a dummy variable equal to 1 if the fund i invests outside US (US funds) or Europe
(European funds), and 0 otherwise; and
µit stands for the error term.
To assess hypothesis 2 and capture a potential curvilinear relationship between social
screening and financial performance, we also include the square of the screening intensity
(SIi)2.
𝑅𝐴𝑃𝑖𝑡 = 𝜓0 + 𝜓1𝑆𝐼𝑖 + 𝜓2𝑆𝐼𝑖2 + 𝜓3𝐿_𝐴𝐺𝐸𝑖 + 𝜓4𝐿_𝑆𝐼𝑍𝐸𝑖𝑡 + 𝜓5𝑇𝐸𝑅𝑖𝑡 + 𝜓6𝐺𝐿𝑖 + μ𝑖𝑡 (3)
Models (4) screening intensity only and (5) screening intensity and its squared term
add the types of social screens, as well as two other social variables – positive screening and
labels – to assess whether screening strategies have influence on mutual fund performance.
𝑅𝐴𝑃𝑖𝑡 = 𝜔0 + 𝜔1𝑆𝐼𝑖 + 𝜔2𝐸𝑁𝑉𝑖 + 𝜔3𝑆𝑂𝐶𝑖 + 𝜔4𝐺𝑂𝑉𝑖 + 𝜔5𝑃𝑅𝑂𝐷𝑖 + 𝜔6𝑆𝐻𝐸𝑁𝐺𝑖 + 𝜔7𝑃𝑆𝐶𝑅𝑖 +
𝜔8𝐿𝐴𝐵𝑖 + 𝜔9𝐿_𝐴𝐺𝐸𝑖 + 𝜔10𝐿_𝑆𝐼𝑍𝐸𝑖𝑡 + 𝜔11𝑇𝐸𝑅𝑖𝑡 + 𝜔12𝐺𝐿𝑖 + μ𝑖𝑡 (4)
𝑅𝐴𝑃𝑖𝑡 = 𝜃0 + 𝜃1𝑆𝐼𝑖 + 𝜃2𝑆𝐼𝑖2 + 𝜃3𝐸𝑁𝑉𝑖 + 𝜃4𝑆𝑂𝐶𝑖 + 𝜃5𝐺𝑂𝑉𝑖 + 𝜃6𝑃𝑅𝑂𝐷𝑖 + 𝜃7𝑆𝐻𝐸𝑁𝐺𝑖 +
𝜃8𝑃𝑆𝐶𝑅𝑖 + 𝜃9𝐿𝐴𝐵𝑖 + 𝜃10𝐿_𝐴𝐺𝐸𝑖 + 𝜃11𝐿_𝑆𝐼𝑍𝐸𝑖𝑡 + 𝜃12𝑇𝐸𝑅𝑖𝑡 + 𝜃13𝐺𝐿𝑖 + μ𝑖𝑡 (5)
where
ENVi is a dummy variable equal to 1 if the fund i focuses on environmental issues, and 0

30
otherwise;
SOCi is a dummy variable equal to 1 if the fund i focuses on social issues, and 0 otherwise;
GOVi is a dummy variable equal to 1 if the fund i focuses on governance issues, and 0 otherwise;
PRODi is a dummy variable equal to 1 if the fund i focuses on products’ issues, and 0 otherwise;
SHENGi is a dummy variable equal to 1 if the fund i focuses on shareholder engagement issues,
and 0 otherwise;
PSCRi is a dummy variable equal to 1 if the fund i employs a positive screening strategy, and
0 otherwise;
LABi is a dummy variable equal to 1 if the fund i has received at least one SRI label, and 0
otherwise.
Alternatively, to test hypothesis 4 introduced in section 3, we estimate the regressions
replacing the variable SI by the number of sectoral screens (SECT), and the number of
transversal screens (TRNV).
𝑅𝐴𝑃𝑖𝑡 = 𝛿0 + 𝛿1𝑆𝐸𝐶𝑇𝑖 + 𝛿2𝐸𝑁𝑉𝑖 + 𝛿3𝑆𝑂𝐶𝑖 + 𝛿4𝐺𝑂𝑉𝑖 + 𝛿5𝑃𝑅𝑂𝐷𝑖 + 𝛿6𝑆𝐻𝐸𝑁𝐺𝑖 + 𝛿7𝑃𝑆𝐶𝑅𝑖 +
𝛿8𝐿𝐴𝐵𝑖 + 𝛿9𝐿_𝐴𝐺𝐸𝑖 + 𝛿10𝐿𝑆𝐼𝑍𝐸𝑖𝑡+ 𝛿11𝑇𝐸𝑅𝑖𝑡 + 𝛿12𝐺𝐿𝑖 + μ𝑖𝑡 (6a)
𝑅𝐴𝑃𝑖𝑡 = 𝜑0 + 𝜑1𝑇𝑅𝑁𝑉𝑖 + 𝜑2𝐸𝑁𝑉𝑖 + 𝜑3𝑆𝑂𝐶𝑖 + 𝜑4𝐺𝑂𝑉𝑖 + 𝜑5𝑃𝑅𝑂𝐷𝑖 + 𝜑6𝑆𝐻𝐸𝑁𝐺𝑖 + 𝜑7𝑃𝑆𝐶𝑅𝑖 +
𝜑8𝐿𝐴𝐵𝑖 + 𝜑9𝐿_𝐴𝐺𝐸𝑖 + 𝜑10𝐿_𝑆𝐼𝑍𝐸𝑖𝑡 + 𝜑11𝑇𝐸𝑅𝑖𝑡 + 𝜑12𝐺𝐿𝑖 + μ𝑖𝑡 (6b)
𝑅𝐴𝑃𝑖𝑡 = 𝜙0 + 𝜙1𝑆𝐸𝐶𝑇𝑖 + 𝜙2𝑆𝐸𝐶𝑇𝑖2 + 𝜙3𝐸𝑁𝑉𝑖 + 𝜙4𝑆𝑂𝐶𝑖 + 𝜙5𝐺𝑂𝑉𝑖 + 𝜙6𝑃𝑅𝑂𝐷𝑖 + 𝜙7𝑆𝐻𝐸𝑁𝐺𝑖 +
𝜙8𝑃𝑆𝐶𝑅𝑖 + 𝜙9𝐿𝐴𝐵𝑖 + 𝜙10𝐿_𝐴𝐺𝐸𝑖 + 𝜙11𝐿_𝑆𝐼𝑍𝐸𝑖𝑡 + 𝜙12𝑇𝐸𝑅𝑖𝑡 + 𝜙13𝐺𝐿𝑖 + μ𝑖𝑡 (7a)
𝑅𝐴𝑃𝑖𝑡 = 𝜆0 + 𝜆1𝑇𝑅𝐴𝑁𝑆𝑉𝑖 + 𝜆2𝑇𝑅𝐴𝑁𝑆𝑉𝑖2 + 𝜆3𝐸𝑁𝑉𝑖 + 𝜆4𝑆𝑂𝐶𝑖 + 𝜆5𝐺𝑂𝑉𝑖 + 𝜆6𝑃𝑅𝑂𝐷𝑖 +
𝜆7𝑆𝐻𝐸𝑁𝐺𝑖 + 𝜆8𝑃𝑆𝐶𝑅𝑖 + 𝜆9𝐿𝐴𝐵𝑖 + 𝜆10𝐿_𝐴𝐺𝐸𝑖 + 𝜆11𝐿_𝑆𝐼𝑍𝐸𝑖𝑡 + 𝜆12𝑇𝐸𝑅𝑖𝑡 + 𝜆13𝐺𝐿𝑖 + μ𝑖𝑡 (7b)
Given the structure of our data (panel data) and similarly to Barnett and Salomon (2006),
we include a fixed year effect (by introducing year dummies) and a random fund effect to
control for factors that might correlate with the dependent variable, and that are not captured
by our other variables. These effects allow us to model the individual units (funds) over time

31
(years) controlling for unobserved heterogeneity.
6. Empirical results
Table 5 shows some descriptive statistics and the correlation matrix concerning the
main variables of our study.
[INSERT TABLE 5]
Interestingly, there is a negative correlation between the two main variables of the
model (SI,RAP = -0,0406). With the exception of shareholder engagement and governance
screens (SHENG,GOV = 0,7815), and differently than expected, there is also a low correlation
between many of the social screens42. Furthermore, there is a negative relation between the
screens related with products and the environment (PROD,ENV = -0,2949).
Figures 4 and 5 illustrate the evolution of the average monthly risk-adjusted
performance and the average screening intensity, respectively, for all funds included in our
sample.
[INSERT FIGURES 4 AND 5]
Figure 4 shows a strong decline in the performance of SRI funds over the period 2003-
2006. After 2006, performance increases, displaying positive values since 2011. Figure 5
exhibits a decrease in funds’ screening intensity since 2006 up until 2011. After that, it becomes
more stable.
Empirically, models 2 and 4 estimate a potential linear association between risk-
adjusted performance and screening intensity, while models 3 and 5 evaluate the presence of a
curvilinear effect. Models 3 and 5 add the social dummies (screens’ type, positive screening,
and labels) to the models 2 and 4, respectively.
Given the substantial heterogeneity between countries and regions, we will differentiate
the analysis according to the following groups/individual countries: Global (US and European
countries), Europe, US, United Kingdom, Austria, Belgium, France, Germany, Luxembourg,
42 Since high correlations between the variables may induce multicollinearity, this problem is somewhat mitigated.

32
Switzerland, and Scandinavia 43 (Denmark, Norway, and Sweden).We exclude Italy and
Netherlands due to their small representativeness on the sample.
When we consider the whole sample (table 6), we find different signs for the hypothesis
of linear relationship between financial performance and screening intensity, namely a positive
sign in model 2 and a negative sign in model 4. After the introduction of the squared screening
intensity term, the coefficient for screening intensity becomes positive in both models. With
respect to the square of the screening intensity, we obtain neutral coefficients in models 3 and
5. Nevertheless, the results are not statistically significant. In terms of screening types, the
results are mixed, and without statistical significance. For example, governance-screened funds
have a positive coefficient, while screening on the basis of products shows a negative
coefficient. Differently, we find a negative and statistically significant coefficient for the
positive screening strategy, i.e. positive screens weaken financial performance. Regarding the
differentiation through SRI labels, we find a positive but not statistically significant coefficient.
[INSERT TABLE 6]
Focusing the analysis on the European countries as a whole (table 7), when we estimate
a linear relationship between the number of screens and returns, the coefficients are positive
and without statistical significance. When the screening intensity squared term is introduced,
the coefficients for the screening intensity show a negative sign, the coefficients for the squared
term are positive, and neither of them is statistically significant. Furthermore, we find no
evidence of specific screens, positive screens, or SRI labels systematically affecting
performance. These results are in line with Laurel (2011), who find no relationship between
screening intensity and financial performance for a European context, neither linear nor
curvilinear.
[INSERT TABLE 7]
Table 8 shows the regression results for US funds. Interestingly, the results show that
most of the variables considered have a significant impact on the financial performance of SRI
funds. We find evidence that the performance an US SRI fund investor can expect is dependent
on the number and type of screens employed by the funds. For a significance level of 1%, the
43 The strong similarities between Scandinavian countries justifies its aggregation into one group.

33
findings in model 5 suggest there is a positive relationship between screening intensity and
risk-adjusted returns, and a negative relationship between squared screening intensity and risk-
adjusted returns. This means that the financial performance increases at first as the number of
screens increases, but then declines continuously until it reaches the maximum screening
intensity. Still, at the maximum of 16 screens, performance is superior to the level of funds
with one screen. Therefore, unlike Barnett and Salomon (2006), who find that the risk-adjusted
performance starts to decrease as the number of screens increases, and then recovers, we
conclude for an inverted curvilinear (U-shaped) effect. From table 8, it is also evident that some
screening strategies significantly influence the financial performance of US SRI funds. Similar
to Barnett and Salomon (2006), funds that screen on the basis of environmental criteria have a
relatively lower performance. Products-oriented screens also have a negative effect on
performance, while screening on governance, in contrast with Renneboog et al. (2008b),
generates a relatively stronger financial performance. Additionally, the use of positive
screening strategies seems to penalize funds.
[INSERT TABLE 8]
Table 9 presents the regression results for UK funds only. There is a negative linear
relationship between screening intensity and performance for a significance level of 5%, i.e.
the financial performance of UK funds decreases as the number of screens increases. Both
ESG-type and screening strategies tend to exhibit positive and not significant coefficients.
However, in model 4, the dummy Products is positive and statistically significant at the 10%
level, meaning that non-sinful investing does not detract performance.
[INSERT TABLE 9]
In order to derive a more comprehensive picture of the relationship between screens and
performance, we examine the determinants of SRI fund performance in Austria, Belgium,
France, Germany, Luxembourg, and Switzerland individually (tables 10 to 15). The results
show no evidence to suggest that the screening processes of SRI funds have a linear or
curvilinear effect on performance. The empirical results are mixed and not statistically
significant.
[INSERT TABLES 10 TO 15]
34
Finally, for Scandinavia, the findings show a U-shaped curvilinear relationship – there
is a negative (positive) and statistically significant coefficient associated with the screening
intensity (squared screening intensity). The financial performance initially decreases as the
number of screens increases but then starts to rise until it reaches the maximum screening
intensity. The social dummies exhibit mixed signals, but none of them are significant.
[INSERT TABLE 16]
In relation to the control variables, some results provide interesting insights, namely
concerning the variables Size and Total Expense Ratio. For the global sample, as well as for
the European and United Kingdom subsamples, the Size and the Total Expense Ratio variables
exhibit positive and statistically significant coefficients. This means that larger SRI funds may
benefit from better financial returns, and also that the total costs involved annually for SRI
funds do not seem to decrease SRI funds’ financial performance.
The geographic dummy variable has a negative coefficient and is statistically
significant for the global sample and for the US, meaning that international mutual funds
perform worse than funds with a purely domestic investment orientation. For US and Swiss
funds, and similar to Renneboog et al. (2008b), our results also show that fund age negatively
affects performance.
In order to test hypothesis 4, as in Capelle-Blancard and Monjon (2014), we proceed to
the replacement of the total screening intensity by the number of sectoral and transversal
screens. Overall, the coefficients preserve the same trend of signal and statistical significance.
To ensure the robustness of our results, we performed several sensitivity analyses. Like
Barnett and Salomon (2006), we added each social variable (ENV, SOC, GOV, PROD,
SHENG, PSCR, and LAB) in different orders and separately into the regressions. The results
did not change substantially. Since extreme values of the observed variables can distort
estimates of the regressions’ coefficients, we proceed to the detection of outliers graphically.
Only one point whose value differed substantively from the other observations was excluded
– September 2011 from the French fund LBPAM Responsible Actions Europe (ISIN
FR0010940882). The main results persist for the samples affected.
We also dropped those funds that reported extreme screening intensity values (fewer
than 4 and greater than 12) to test for other influential points. Some results concerning the
global sample, Scandinavia, and the UK differ from those previously obtained. For UK and

35
Scandinavian funds, the coefficients for Screening Intensity (UK and Scandinavia) and squared
Screening Intensity (Scandinavia) lose significance. Regarding the global sample, the
coefficient of the variable Screening Intensity is now positive and statistically significant at
1%, and some social variables (SOC, GOV, PROD and SHENG) become significant.
Finally, like Barnett and Salomon (2006), we split the sample into low (1-4 screens),
medium (5-12 screens), and high (13-16 screens) screening intensity subsets to decompose the
screening patterns of the funds. The results remain unchanged except for the global sample,
US, UK, and Belgium. The results for US funds hold for the medium sub-sample, while the
results for the UK funds hold for the low sample. Belgium also exhibits differences for the low
screening level: Belgian SRI funds show, for a significance level of 1%, a negative coefficient
for the extent of screening. With regard to the global sample, the differences are manifested at
the medium level, and explained in the previous paragraph.
7. Conclusions
Researchers often claim that evidence on the impact of aligning social and financial
objectives in the performance of investment portfolios is unclear, questionable, or inconsistent.
This study contributes to the literature by investigating the relationship between the risk-
adjusted performance and the screening activities of a dataset of 330 US and European SRI
mutual funds for the period 2003-2014.
In general, our results are consistent with the SRI literature in the sense that there does
not seem to be a financial sacrifice for investors in highly screened funds. In particular, our
study extends previous academic research that investigates the heterogeneity within socially
screened funds by exploring the impact of the number and type of the SRI screens on financial
returns, the effects of using positive screening techniques as well as sectoral/transversal screens
and the potential of SRI labels to generate distinct patterns of risk-adjusted returns.
Considering the global sample, and European countries as a group and individually
(except the UK), our findings suggest that there is no relationship between the number of
screens and financial performance. For US SRI funds, we find an inverted U-shaped pattern
between SRI financial performance and screening intensity. Conversely, Scandinavian funds
support the shape of the curvilinear relationship illustrated by Barnett and Salomon (2006). We
interpret these findings as indicative that portfolio theory and stakeholder theory are actually
complementary, instead of conflicting. Differently, for UK SRI funds, there is a linear negative
relationship between screening intensity and financial performance.

36
When we incorporate qualitative differences on screening policies, we find some
relationship between returns and particular screen for the US and UK. For the US, we find that
screening for governance has a positive effect on performance, while excluding firms with
excessive negative environmental impact has a negative effect on performance. Interestingly,
the results also show that screening for products (alcohol, gambling, tobacco, among others)
impacts returns negatively. This conclusion is in line with the empirical literature that finds
that “sin” stocks have higher expected returns than otherwise comparable stocks. Differently,
the results for UK SRI funds show that the higher the number of screens on products, the higher
the positive impact on returns.
For the global sample and the US, our main results also indicate that when funds meet
superior ESG standards, the financial perspective is affected – positive screens provide lower
performance than a negative screening strategy. While most studies offer results favorable to
positive screening techniques (e.g. Goldreyer et al., 1999; Humphrey and Lee, 2011; Trinks
and Scholtens, 2015), this evidence is consistent with Auer (2016), who shows that portfolios
formed on the basis of negative screens significantly outperform a passive benchmark strategy.
In this sense, our results concerning positive vs. negative screens are mixed, namely for US
funds: the exclusion of “sin” stocks has a negative impact on performance, but the
consideration of positive screens has the same effect.
Finally, our evidence indicates that, for the global sample and the US, investing in
international funds, does not pay financially: investing domestically seems to have a financial
advantage. We also document that the funds’ size and costs do not erode financial performance,
whilst the age has the opposite effect for US and Swiss funds – older funds have lower financial
returns.
There are several reasons why we should expect contrasts in the way responsible
investment affects performance in different countries/regions. Sandberg et al. (2009) suggest
that are three kind of explanations for the heterogeneity in the SRI funds, namely: a) cultural
and ideological differences between regions and countries; b) differences in values, norms and
ideology between different actors involved in the SRI process (SRI stakeholders); and c) the
market setting in which SRI actors operate. We illustrate this statement: the empirical evidence
for the 13 countries in our sample is mixed, and the results are not geographically homogeneous.
Each country/region (e.g., Scandinavia) has a unique social, political, legal, institutional
context that determines the degree of development of the SRI market and, consequently, the
outline of the relationship between social screening and financial returns.

37
In fact, there is no clear trend in the literature about the existence and nature of the
relationship between social screens and financial performance in a given country.
Geographically, evidence to date is quite limited: Barnett and Salomon (2006) and Lee et al.
(2010) focus on US funds, Biehl and Hoepner (2010) study UK funds, Humphrey and Lee
(2011) examine Australian funds, Laurel (2011) analyzes European funds, Capelle-Blancard
and Monjon (2014) evaluate French funds and, finally, Renneboog et al. (2008) consider funds
from Europe, North America and Asia-Pacific (although on an aggregate level only). Clearly,
additional research is needed in order to get a more complete picture on this subject.
Another relevant issue concerns the consequences of the global financial crisis of 2008
on SRI. This event might have changed investors’ perception and awareness concerning SRI
practices, but most studies on the relationship between screening and performance do not
consider 2008 and subsequent years. For example, Barnett and Salomon (2006) and Lee et al.
(2010), that show a curvilinear (U-shaped) and negative relationship between screening and
returns for US funds, respectively, look at periods prior to this event. Differently, we find an
inverted U-shaped effect but considering the period from 2003 to 2014. The effects of the
international financial crisis may contribute to explain the different results of this study.
It is worth mentioning that the methodology used to assess fund performance and
investment styles is crucial in analyzing whether and how screening effects SRI fund
performance. By way of example, Barnett and Salomon (2006) employ the CAPM- based one
factor model to estimate the performance of stock and bond funds. The model used – CAPM –
to compute risk-adjusted performance does not capture time-varying risks. Besides that, the
authors did not include specific risk factors for bond funds, and estimate the risk-adjusted
performance of all funds using the S&P 500 as benchmark. In this paper, we focus on equity
funds, and the risk-adjusted returns are computed on the basis of the Carhart (1997) four-factor
model in a 36 months rolling basis, thereby considering time-varying risk.
In light of the differences concerning the time period under analysis, methodologies
used for assessing risk-adjusted performance and geographic regions of focus analysed,
research on the relationship between the screening characteristics and the financial
performance is still a work in progress. Yet, our paper contributes to the ongoing research
providing relevant findings concerning two world leaders in terms of socially responsible
finance and investing (US and UK), as well as other European countries, including one of the
first regions to introduce regulatory requirements and standards regarding ESG issues
(Scandinavia).
38
References
Abdullah, F., Hassan, T., & Mohamad, S. (2007). Investigation of Performance of Malaysian
Islamic Unit Trust Funds: Comparison with Conventional Unit Trust Funds. Managerial
Finance, 33(2), 142-153.
Areal, N., Cortez, M., & Silva, F. (2013). The Conditional Performance of US Mutual Funds
over Different Market Regimes: Do Different Types of Ethical Screens Matter? Financial
Markets and Portfolio Management, 27(4), 397-429.
Auer, B. (2016). Do Socially Responsible Investment Policies Add or Destroy European Stock
Portfolio Value? Journal of Business Ethics, 135, 381-397.
Barnett, M., & Salomon, M. (2006). Beyond Dichotomy: The Curvilinear Relationship
Between Social Responsibility and Financial Performance. Strategic Management Journal,
27(11), 1101-1122.
Bauer, R., Koedijk, K., & Otten, R. (2005). International Evidence on Ethical Mutual Fund
Performance and Investment Style. Journal of Banking and Finance, 29(7), 1751-1767.
Bauer, R., Otten, R., & Rad, A. (2006). Ethical Investing in Australia: Is There a Financial
Penalty? Pacific-Basin Finance Journal, 14, 33-48.
Bauer, R., Derwall, J., & Otten, R. (2007). The Ethical Mutual Fund Performance Debate: New
Evidence from Canada. Journal of Business Ethics, 70, 111-124.
Becchetti, L., Ciciretti, R., Dalò, A., & Herzel, S. (2015). Socially Responsible and
Conventional Investment Funds: Performance Comparison and the Global Financial Crisis.
Applied Economics, 47(25), 2541-2562.
Bello, Z. (2005). Socially Responsible Investing and Portfolio Diversification. Journal of
Financial Research, 28(1), 41-57.
Bengtsson, E. (2008). A History of Scandinavian Socially Responsible Investing. Journal of
Business Ethics, 82(4), 969-983.
Biehl, C., & Hoepner, A. (2010). SRI Funds: Does More Social Mean Less Financial
Performance? [Working paper]. SSRN eLibrary.
Boasson, E., Boasson, V., & Cheng, J. (2006). Investment Principles and Strategies of Faith-
Based Funds. Managerial Finance, 32(10), 837-845.
Bollen, N. (2007). Mutual Fund Attributes and Investor Behaviour. Journal of Financial and
Quantitative Analysis, 42(3), 683-708.
Brammer, S., Brooks, C., & Pavelin, S. (2009). The Stock Performance of America’s 100 Best
Corporate Citizens. Quarterly Review of Economics and Finance, 49(3), 1065-1080.
Brown, S., Goetzmann, W., Ibbotson, R., & Ross, S. (1992). Survivorship Bias in Performance
39
Studies. Review of Financial Studies, 5(4), 553-580.
Capelle-Blancard, G., & Monjon, S. (2014). The Performance of Socially Responsible Funds:
Does the Screening Process Matter? European Financial Management, 20(3), 494-520.
Carhart, M. (1997). On Persistence in Mutual Fund Performance. Journal of Finance, 52(1),
57-82.
Chang, C., Nelson, W., & White, H. (2012). Do Green Mutual Funds Perform Well?
Management Research Review, 35(8), 693-708.
Chang, E., & Witte, D. (2010). Performance Evaluation of US Socially Responsible Mutual
Funds: Revisiting Doing Good and Doing Well. American Journal of Business, 25(1), 9-21.
Chen, J., Hong, H., Huang, M., & Kubik, J. (2004). Does Fund Size Erode Mutual Fund
Performance? The Role of Liquidity and Organization. American Economic Review, 94(5),
1276-1302.
Chong, J., Her, M., & Phillips, G. (2006). To Sin or Not to Sin? Now That’s the Question.
Journal of Asset Management, 6(6), 406-417.
Climent, F., & Soriano, P. (2011). Green and Good? The Investment Performance of US
Environmental Mutual Funds. Journal of Business Ethics, 103(2), 275-287.
Cordeiro, J., & Sarkis, J. (1997). Environmental Proactivism and Firm Performance: Evidence
from Security Analyst Earnings Forecasts. Business Strategy and the Environment, 6, 104-114.
Cortez, M., Silva, F., & Areal, N. (2009). The Performance of European Socially Responsible
Funds. Journal of Business Ethics, 87(4), 573-588.
Cortez, M., Silva, F., & Areal, N. (2012). Socially Responsible Investing in the Global Market:
The Performance of US and European Funds. International Journal of Finance and Economics,
17, 254-271.
Dahlquist, M., Engström, S., & Söderlind, P. (2000). Performance and Characteristics of
Swedish Mutual Funds. Journal of Financial and Quantitative Analysis, 35(3), 409-423.
de Haan, M., Dam, L., & Scholtens, B. (2012). The Drivers of the Relationship Between
Corporate Environmental Performance and Stock Market Returns. Journal of Sustainable
Finance and Investment, 2(3-4), 338-375.
Derwall, J., Guenster, N., Bauer, R., & Koedijk, K. (2005). The Eco-Efficiency Premium
Puzzle. Financial Analysts Journal, 61(2), 51-63.
Derwall, J., Koedijk, K., & Horst, J. (2011). A Tale of Values-Driven and Profit-Seeking Social
Investors. Journal of Banking and Finance, 35(8), 2137-2147.
Diltz, J. (1995). Does Social Screening Affect Portfolio Performance? Journal of Investing,
4(1), 64-69.

40
Dowell, G., Hart, S., & Yeung, B. (2000). Do Corporate Global Environmental Standards
Create or Destroy Market Value? Management Science, 46(8), 1059-1074.
Dunfee, T. (2003). Social Investing: Mainstream or Backwater? Journal of Business Ethics,
43(3), 247-252.
Edmans, A. (2011). Does the Stock Market Fully Value Intangibles? Employee Satisfaction
and Equity Prices. Journal of Financial Economics, 101(3), 621-640.
European Sustainable Investment Forum - EUROSIF (2016). European SRI Transparency
Code. Retrieved December 20, 2016, from http://www.eurosif.org.
Fabozzi, F., Ma, K., & Oliphant, B. (2008). Sin Stock Returns. Journal of Portfolio
Management, 35(1), 82-94.
Fama, E., & French, K. (1993). Common Risk Factors in the Returns on Stocks and Bonds.
Journal of Financial Economics, 33(1), 3-56.
Fernandez-Izquierdo, A., & Matallin-Saez, J. (2008). Performance of Ethical Mutual Funds in
Spain: Sacrifice or Premium? Journal of Business Ethics, 81(2), 247-260.
Ferreira, M., Keswani, A., Miguel, A., & Ramos, S. (2012). The Flow-Performance
Relationship around the World. Journal of Banking and Finance, 36, 1759-1780.
Ferreira, M., Keswani, A., Miguel, A., & Ramos, S. (2013). The Determinants of Mutual Fund
Performance: A Cross-Country Study. Review of Finance, 17, 483-525.
Ferruz, L., Muñoz, F., & Vargas, M. (2012). Managerial Abilities: Evidence from Religious
Mutual Fund Managers. Journal of Business Ethics, 105(4), 503-517.
Filbeck, G., & Gorman, R. (2004). The Relationship Between the Environmental and Financial
Performance of Public Utilities. Environmental and Resource Economics, 29, 137-157.
Forum Ethibel (2016). Ethibel PIONEER Label. Retrieved December 20, 2016, from
http://www.forumethibel.org.
Freeman, R. (1984). Strategic Management: A Stakeholder Approach. Boston: Pitman.
Galema, R., Plantiga, A., & Scholtens, B. (2008). The Stocks at Stake: Return and Risk in
Socially Responsible Investment. Journal of Banking and Finance, 32(12), 2646-2654.
Gangi, F., & Trotta, C. (2015). The Ethical Finance as a Response to the Financial Crises: An
Empirical Survey of European SRFs Performance. Journal of Management and Governance,
19(2), 371-394.
Gil-Bazo, J., & Ruiz-Verdú, P. (2009). Yet Another Puzzle? The Relation Between Price and
Performance in the Mutual Fund Industry. Journal of Finance, 64(5), 2153-2183.
Gil-Bazo, J., Ruiz-Verdú, P., & Santos, A. (2010). The Performance of Socially Responsible
Mutual Funds: The Role of Fees and Management Companies. Journal of Business Ethics, 94,

41
243-263.
Goldreyer, E., Ahmed, P., & Diltz, J. (1999). The Performance of Socially Responsible Mutual
Funds: Incorporating Sociopolitical Information in Portfolio Selection. Managerial Finance,
25(1), 23-36.
Gregory, A., Matatko, J., & Luther, R. (1997). Ethical Unit Trust Financial Performance: Small
Company Effects and Fund Size Effects. Journal of Business Finance and Accounting, 24(5),
705-725.
Guenster, N., Bauer, R., Derwall, J., & Koedijk, K. (2011). The Economic Value of Corporate
Eco-Efficiency. European Financial Management, 17(4), 679-704.
Hamilton, S., Jo, H., & Statman, M. (1993). Doing Well While Doing Good? The Investment
Performance of Socially Responsible Mutual Funds. Financial Analysts Journal, 49(6), 62-66.
Hayat, R., & Kraeussl, R. (2011). Risk and Return Characteristics of Islamic Equity Funds.
Emerging Markets Review, 12(2), 189-203.
Henke, H. (2016). The Effect of Social Screening on Bond Mutual Fund Performance. Journal
of Banking and Finance, 67, 69-84.
Hoepner, A., Rammal, H., & Rezec, M. (2011). Islamic Mutual Funds’ Financial Performance
and International Investment Style: Evidence from 20 Countries. European Journal of Finance,
17(9-10), 829-850.
Hoepner, A., & Schopohl, L. (2016). On the Price of Morals in Markets: An Empirical Study
of the Swedish AP-Funds and the Norwegian Government Pension Fund. Journal of Business
Ethics, doi:10.1007/s10551-016-3261-0.
Hong, H., & Kacperczyk, M. (2009). The Price of Sin: The Effects of Social Norms on Markets.
Journal of Financial Economics, 93(1), 15-36.
Humphrey, J., & Lee, D. (2011). Australian Socially Responsible Funds: Performance, Risk
and Screening Intensity. Journal of Business Ethics, 102(4), 519-535.
Ibikunle, G., & Steffen, T. (2015). European Green Mutual Fund Performance: A Comparative
Analysis with their Conventional and Black Peers. Journal of Business Ethics,
doi:10.1007/s10551-015-2850-7.
Indro, D., Jiang, C., Hu, M., & Lee, W. (1999). Mutual Fund Performance: Does Fund Size
Matter? Financial Analysts Journal, 55(3), 74-87.
Kempf, A., & Osthoff, P. (2007). The Effect of Socially Responsible Investing on Portfolio
Performance. European Financial Management, 13(5), 908-922.
Kinder, P., & Domini, A. (1997). Social Screening: Paradigms Old and New. Journal of
Investing, 6(4), 12-19.
King, A., & Lenox, M. (2001). Does it Really Pay to Be Green? An Empirical Study of Firm
42
Environmental and Financial Performance. Journal of Industrial Ecology, 5(1), 105-116.
Klassen, R., & McLaughlin, C. (1996). The Impact of Environmental Management on Firm
Performance. Management Science, 42(8), 1199-1214.
Konar, S., & Cohen, M. (1997). Information as Regulation: The Effect of Community Right to
Know Laws on Toxic Emissions. Journal of Environmental Economics and Management,
32(1), 109-124.
Konar, S., & Cohen, M. (2001). Does the Market Value Environmental Performance? Review
of Economics and Statistics, 83(2), 281-289.
Kreander, N., Gray, R., Power, D., & Sinclair, C. (2005). Evaluating the Performance of Ethical
and Non-Ethical Funds: A Matched Pair Analysis. Journal of Business Finance and
Accounting, 32(7-8), 1465-1493.
Kurtz, L. (1998). “Mr. Markowitz, meet Mr. Moskowitz” - A Review of Studies on Socially
Responsible Investing. In The Investment Research Guide to Socially Responsible Investing,
The Colloquium on Socially Responsible Investing.
Laurel, D. (2011). Socially Responsible Investments in Europe: The Effects of Screening on
Risk and the Clusters in the Fund Space [Working paper]. Politecnico di Milano, Italy.
Lee, D., Humphrey, J., Benson, K., & Ahn, J. (2010). Socially Responsible Investment Fund
Performance: The Impact of Screening Activity. Accounting and Finance, 50(2), 351-370.
Leite, P., & Cortez, M. (2015). Performance of European Socially Responsible Funds During
Market Crises: Evidence from France. International Review of Financial Analysis, 40, 132-
141.
Leite, P., & Cortez, M. (2016). The Performance of European Socially Responsible Fixed-
Income Funds. [Working paper]. SSRN eLibrary.
Louche, C., & Lydenberg, S. (2006). Socially Responsible Investment: Differences Between
Europe and United States. [Working paper]. Vlerick Leuven Gent Working Paper Series 22.
Luther, R., Matatko, J., & Corner, D. (1992). The Investment Performance of UK “Ethical”
Unit Trusts. Accounting, Auditing and Accountability Journal, 5(4), 57-70.
Luxembourg Finance Labelling Agency - LuxFLAG (2016). Environment Label. Retrieved
December 20, 2016, from http://www.luxflag.org.
Lyn, E., & Zychowicz, E. (2010). The Impact of Faith-Based Screens on Investment
Performance. Journal of Investing, 19(3), 136-143.
Mallett, J., & Michelson, S. (2010). Green Investing: Is it Different from Socially Responsible
Investing? International Journal of Business, 15(4), 395-410.
Mallin, C., Saadouni, B., & Briston, R. (1995). The Financial Performance of Ethical
Investment Funds. Journal of Business Finance and Accounting, 22(4), 483-496.

43
Markowitz, H. (1952). Portfolio Selection. Journal of Finance, 7(1), 77-91.
Moskowitz, M. (1972). Choosing Socially Responsible Stocks. Business and Society Review,
1, 71-75.
Muñoz, F., Vargas, M., & Marco, I. (2014). Environmental Mutual Funds: Financial
Performance and Managerial Abilities. Journal of Business Ethics, 124(4), 551-569.
Nakai, M., Yamaguchi, K., & Takeuchi, K. (2016). Can SRI Funds Better Resist Global
Financial Crisis? Evidence from Japan. International Review of Financial Analysis,
doi:10.1016/j.irfa.2016.09.002.
Neher, A., & Hebb, T. (2016). The Responsible Investment Atlas – An Introduction. In T. Hebb
et al. (Eds.). The Routledge Handbook of Responsible Investment: 53-57. New York: Routledge.
Nofsinger, J., & Varma, A. (2014). Socially Responsible Funds and Market Crises. Journal of
Banking and Finance, 48, 180-193.
Novethic (2016). Labels. Retrieved December 22, 2016, from http://www.novethic.com.
Otten, R., & Bams, D. (2002). European Mutual Fund Performance. European Financial
Management, 8(1), 75-101.
Petrillo, A., Felice, F., García-Melón, M., & Pérez-Gladish, B. (2016). Investing in Socially
Responsible Mutual Funds: Proposal of Non-Financial Ranking in Italian Market. Research in
International Business and Finance, 37, 541-555.
Renneboog, L., Horst, J., & Zhang, C. (2008a). Socially Responsible Investments: Institutional
Aspects, Performance, and Investor Behaviour. Journal of Banking and Finance, 32(9), 1723-
1742.
Renneboog, L., Horst, J., & Zhang, C. (2008b). The Price of Ethics and Stakeholder
Governance: The Performance of Socially Responsible Mutual Funds. Journal of Corporate
Finance, 14(3), 302-322.
Renneboog, L., Horst, J., & Zhang, C. (2011). Is Ethical Money Financially Smart?
Nonfinancial Attributes and Money Flows of Socially Responsible Investment Funds. Journal
of Financial Intermediation, 20(4), 562-588.
Revelli, C., & Viviani, J. (2015). Financial Performance of Socially Responsible Investing
(SRI): What Have We Learned? A Meta-Analysis. Business Ethics: A European Review, 24(2),
158-185.
Rodgers, W., Choy, H., & Guiral, A. (2013). Do Investors Value a Firm’s Commitment to
Social Activities? Journal of Business Ethics, 114(4), 607-623.
Russo, M., & Fouts, P. (1997). A Resource-Based Perspective on Corporate Environmental
Performance and Profitability. Academy of Management Journal, 40(3), 534-559.
44
Salama, A. (2005). A Note on the Impact of Environmental Performance on Financial
Performance. Structural Change and Economic Dynamics, 16(3), 413-421.
Sandberg, J., Juravle, C., Hedesström, T., & Hamilton, I. (2009). The Heterogeneity of Socially
Responsible Investment. Journal of Business Ethics, 87, 519-533.
Schlegelmilch, B. (1997). The Relative Importance of Ethical and Environmental Screening:
Implications for the Marketing of Ethical Investment Funds. International Journal of Bank
Marketing, 15(2), 48-53.
Scholtens, B. (2005). What Drives Socially Responsible Investment? The Case of the
Netherlands. Sustainable Development, 13(2), 129-137.
Schröder, M. (2004). The Performance of Socially Responsible Investments: Investment Funds
and Indices. Financial Markets and Portfolio Management, 18(2), 122-142.
Silva, F., & Cortez, M. (2016). The Performance of US and European Green Funds in Different
Market Conditions. Journal of Cleaner Production, 135, 558-566.
Simpson, W., & Kohers, T. (2002). The Link Between Corporate Social and Financial
Performance: Evidence from the Banking Industry. Journal of Business Ethics, 35(2), 97-109.
Social Investment Forum - SIF (2001). Report on Socially Responsible Investing Trends in the
United States 2001. Retrieved June 10, 2015, from http://www.ussif.org.
Social Investment Forum - SIF (2003). Report on Socially Responsible Investing Trends in the
United States 2003. Retrieved June 10, 2015, from http://www.ussif.org.
Social Investment Forum - SIF (2005). Report on Socially Responsible Investing Trends in the
United States 2005. Retrieved June 10, 2015, from http://www.ussif.org.
Social Investment Forum - SIF (2007). Report on Socially Responsible Investing Trends in the
United States 2007. Retrieved June 10, 2015, from http://www.ussif.org.
Social Investment Forum - SIF (2010). Report on Socially Responsible Investing Trends in the
United States 2010. Retrieved June 10, 2015, from http://www.ussif.org.
Statman, M. (2000). Socially Responsible Mutual Funds. Financial Analysts Journal, 56(3),
30-39.
Statman, M., & Glushkov, D. (2009). The Wages of Social Responsibility. Financial Analysts
Journal, 65(4), 33-46.
The Forum for Sustainable and Responsible Investment - US SIF (2012). Report on Sustainable
and Responsible Investing Trends in the United States 2012. Retrieved June 10, 2015, from
http://www.ussif.org.
The Forum for Sustainable and Responsible Investment - US SIF (2014). Report on US
Sustainable, Responsible and Impact Investing Trends 2014. Retrieved June 10, 2015, from
http://www.ussif.org.

45
The Forum for Sustainable and Responsible Investment - US SIF (2016). Report on US
Sustainable, Responsible and Impact Investing Trends 2016. Retrieved January 10, 2017, from
http://www.ussif.org.
The Forum for Sustainable and Responsible Investment - US SIF (2016). Sustainable &
Responsible Mutual Fund Chart. Retrieved December 22, 2016, from http://www.ussif.org.
Trinks, P., & Scholtens, B. (2015). The Opportunity Cost of Negative Screening in Socially
Responsible Investing. Journal of Business Ethics, 30, 1-16.
Umweltzeichen (2016). The Austrian Ecolabel. Retrieved December 22, 2016, from
http://www.umweltzeichen.at.
United Nations Principles for Responsible Investment - UNPRI (2016). About the PRI.
Retrieved December 22, 2016, from http://www.unpri.org.
Utz, S., & Wimmer, M. (2014). Are They Any Good at All? A Financial and Ethical Analysis
of Socially Responsible Mutual Funds. Journal of Asset Management, 15(1), 72-82.
Vigeo (2014). Green, Social and Ethical Funds in Europe - The Retail Market - 2014 Review.
Retrieved June 10, 2015, from http://www.vigeo.com.
Waddock, S., & Graves, S. (2000). Performance Characteristics of Social and Traditional
Investments. Journal of Investing, 9(2), 27-38.
Watson, R. (2011). Ethical and Socially Responsible Investment Funds: Are They Ethically
and Responsibly Marketed? Journal of Financial Regulation and Compliance, 19(2), 100-110.
White, M. (1995). The Performance of Environmental Mutual Funds in the United States and
Germany: Is There Economic Hope for “Green” Investors? Research in Corporate Social
Performance and Policy, Supplement 1, 323-344.
yourSRI (2016). Fund Assessments & Label. Retrieved December 20, 2016, from
http://www.yoursri.com.

46
Table 1 - Studies on the impact of screening on financial performance This table briefly summarizes data information, methodology, and empirical results of the main studies on the relationship
between screening and SRI fund performance.
Number of
SRI funds
Geographic
Focus Period
Methodology for
evaluating
performance
Main results/conclusions
Barnett and
Salomon (2006) 61 US 1972-2000 CAPM
Curvilinear relationship
between social screens and
financial performance; some
types of social screens are
linked to a higher financial
performance.
Renneboog et al.
(2008b) 440
Europe, North
America,
Asia-Pacific
(17 countries)
1991-2003
CAPM; Fama
and French
(1993); Carhart
(1997)
High screening intensity
constrains the risk-return
optimization; the SRI
screening activities matter.
Biehl and
Hoepner (2010) 50 UK 1998-2010
CAPM; Fama
and French
(1993); Carhart
(1997)
Portfolios with the highest
social rating underperform;
no systematic relationship
between ethical and financial
performance.
Lee et al. (2010) 61 US 1989-2006 Carhart (1997)
Negative (curvilinear)
relationship between
performance (systematic
risk) and screening intensity.
Humphrey and
Lee (2011) 24 Australia 1996-2008
Fama and
French (1993);
Carhart (1997)
Weak evidence that more
highly screened portfolios
offer higher risk-adjusted
returns; positive (negative)
screening reduces (increases)
funds’ risk.
Laurel (2011) 177 Europe (14
countries) 1980-2010 CAPM
Screening intensity has no
effect on returns but has a
curvilinear effect on risk.
Capelle-Blancard
and Monjon
(2014)
116 France 2004-2007 CAPM
Screening intensity reduces
financial performance; only
sectoral screens decrease
financial performance.

47
Table 2 - Descriptive statistics of risk-adjusted returns by country This table presents mean, standard deviation, minimum and maximum values, and number of observations (N) for each country
of our sample from 2003 to 2014.
Mean Std. Dev. Min Max N
Austria -0,085271 0,154737 -1,050832 2,165533 2106
Belgium -0,109174 0,155434 -0,710921 0,216396 1706
Denmark -0,066106 0,138376 -0,662019 0,157612 263
France -0,093226 0,399567 -19,482880 10,179470 5895
Germany -0,077443 0,173879 -1,250198 3,555045 1810
Italy -0,116044 0,153365 -0,487271 0,142134 144
Luxembourg -0,747712 0,142145 -0,742347 0,270124 1744
Netherlands -0,093092 0,147459 -0,486076 0,191983 994
Norway -0,074701 0,151730 -0,513114 0,257642 426
Sweden -0,045755 0,163660 -2,938844 0,265552 916
Switzerland -0,075192 0,188964 -6,916366 1,535203 6156
United Kingdom -0,946396 0,203831 -5,049177 3,370219 3610
United States of America -0,901901 0,225693 -7,463277 4,277121 8972
Table 3 - Screening features of US and European SRI funds This table summarizes SRI funds (US, European and total) based on screening type (environment, social, governance, products
and shareholder engagement), nature (transversal and sectoral) and strategy (positive), and also by labels.
Percentage of funds
Characteristics US funds European funds Total sample
Environment 65,00% 53,20% 56%
Social 68,75% 44,00% 50%
Governance 35,00% 0,80% 9%
Products 82,50% 70,40% 73%
Shareholder engagement 40,00% 0,00% 10%
Transversal 68,75% 44,40% 50%
Sectoral 96,25% 96,00% 96%
Positive screening 42,50% 53,60% 51%
Labels 38,75% 76,40% 67%

48
Table 4 - Control variables of SRI mutual funds (by country) This table presents funds’ control variables averaged by country for the period 2003-2014. Control variables include: Age,
measured as the number of months since the fund’s inception; Size, measured by fund’s total net assets in million US dollars;
and Total Expense Ratio, in percentage.
Country Age (months) Size (million USD) Total Expense Ratio (%)
Austria 122 22,97 1,76
Belgium 168 690,72 1,60
Denmark 151 109,54 1,74
France 149 95,11 1,54
Germany 114 88,76 1,74
Italy 210 198,58 2,02
Luxembourg 142 72,29 1,93
Netherlands 146 120,01 1,67
Norway 249 1392,90 1,24
Sweden 198 1195,95 1,34
Switzerland 108 114,54 1,78
UK 185 156,13 1,56
US 163 1313,29 1,23
Table 5 - Descriptive statistics and correlation matrix This table reports the pairwise correlations and the descriptive statistics (mean, standard deviation, minimum and maximum)
of fund variables. The financial variable is the risk-adjusted performance (RAP), and the social variables include: screening
intensity (SI), types of screening – environment (ENV), social (SOC), governance (GOV), products (PROD), and shareholder
engagement (SHENG) –, positive screening strategy (PSCR), and labels (LAB). Control variables include: the logarithm of
the variable Age, measured as the number of months since the fund’s inception (L_AGE); the logarithm of the variable Size,
measured by fund’s total net assets in million US dollars (L_SIZE); and Total Expense Ratio, in percentage (TER).
RAP SI ENV SOC GOV PROD SHENG PSCR LAB L_AGE L_SIZE TER GL
RAP 1,0000
SI -0,0406 1,0000
ENV 0,0158 0,4839 1,0000
SOC -0,0324 0,6343 0,2469 1,0000
GOV -0,0327 0,6918 0,3005 0,2937 1,0000
PROD -0,0553 0,3880 -0,2949 0,2318 0,1486 1,0000
SHENG -0,0250 0,7051 0,3132 0,3223 0,7815 0,1560 1,0000
PSCR 0,0359 0,1668 0,6818 0,1274 0,1771 -0,5283 0,1036 1,0000
LAB -0,0218 -0,0522 -0,0707 0,0808 -0,0278 0,0403 -0,0741 0,0230 1,0000
L_AGE -0,1880 0,0924 -0,1226 0,0931 0,0890 0,1785 0,0664 -0,2013 0,0555 1,0000
L_SIZE -0,0461 0,0769 -0,0319 -0,0022 0,1557 0,0764 0,0612 -0,0284 0,0257 0,4201 1,0000
TER -0,0363 -0,0998 0,1658 -0,0465 -0,1634 -0,1253 -0,1274 0,1830 0,1127 -0,1721 -0,2211 1,0000
GL 0,0649 -0,0824 0,1983 -0,1249 -0,1775 -0,1486 -0,1719 0,1786 -0,0211 -0,3220 -0,1603 0,2653 1,0000
Mean -0,0863 5,0990 0,5436 0,5173 0,1065 0,7629 0,1068 0,4836 0,6946 4,9963 3,7724 1,5458 0,5003
Std. Dev. 0,2409 4,1364 0,4981 0,4997 0,3085 0,4253 0,3089 0,4997 0,4606 0,5241 2,0695 0,6538 0,5000
Min -19,4829 1 0 0 0 0 0 0 0 3,6109 -9,2103 0 0
Max 10,1795 16 1 1 1 1 1 1 1 6,2226 11,1987 9,8 1

49
Table 6 - Regression results for the global sample This table reports the results from regressions of financial performance on a number of social and control variables. The
dependent variable is the risk-adjusted performance (RAP) associated with SRI funds. Explanatory variables include Screening
Intensity, defined as the number of screens used, and its square (Squared Screening Intensity), and the following dummy
variables: Environment, Social, Governance, Products, Shareholder Engagement, which take a value of 1 if the fund focuses
on environmental, social, governance, products, shareholder engagement, respectively, and 0 otherwise; Positive Screening is
a dummy variable equal to 1 if the fund employs a positive screening strategy, and 0 otherwise; Labels is a dummy variable
equal to 1 if the fund has received at least one SRI label, and 0 otherwise. Control variables include: Size, measured by Log
fund’s total net assets (in millions of US dollars); Age, measured as the Log of the number of months since the fund’s inception;
Total Expense Ratio is a measure of the total costs associated with managing and operating an investment fund; Global is a
dummy variable that takes the value of 1 if the fund invests internationally, and 0 otherwise. The sample includes 330 SRI
equity mutual funds for the period 2003-2014. t-statistics are shown in parentheses.
* p-value < 0,10; ** p-value < 0,05; *** p-value < 0,01
Global
Model (2) Model (3) Model (4) Model (5)
Constant -0,0018 -0,0023 0,0028 0,0011
(-0,16) (-0,21) (0,25) (0,10)
Screening Intensity 0,0003 0,0007 -0,0001 0,0010
(1,24) (0,74) (-0,12) (0,73)
Squared Screening Intensity 0,0000 -0,0001
(-0,41) (-0,88)
Dummy_Environment 0,0004 -0,0006
(0,10) (-0,15)
Dummy_Social 0,0030 0,0020
(1,04) (0,67)
Dummy_Governance 0,0050 0,0068
(0,87) (1,12)
Dummy_Products -0,0013 -0,0021
(-0,36) (-0,56)
Dummy_Shareholder Engagement 0,0017 0,0039
(0,29) (0,63)
Dummy_Positive Screening -0,0060* -0,0055*
(-1,85) (-1,68)
Dummy_Labels 0,0026 0,0025
(1,17) (1,15)
Log Age -0,0007 -0,0008 -0,0016 -0,0015
(-0,33) (-0,34) (-0,70) (-0,65)
Log Size 0,0014*** 0,0014*** 0,0014*** 0,0014***
(2,67) (2,67) (2,74) (2,64)
Total Expense Ratio 0,0025* 0,0024* 0,0028** 0,0028*
(1,76) (1,72) (1,98) (1,93)
Dummy_Global -0,0038* -0,0040* -0,0025 -0,0026
(-1,74) (-1,77) (-1,10) (-1,15)
Fixed Effects Included
Random Effects Included
Number of observations 30960
Number of mutual funds 330
R-squared within 0,5019 0,5019 0,5019 0,5019
R-squared between 0,8779 0,8780 0,8833 0,8840
R-squared overall 0,5343 0,5343 0,5344 0,5344

50
Table 7 - Regression results for European funds This table reports the results from regressions of financial performance on a number of social and control variables. The
dependent variable is the risk-adjusted performance (RAP) associated with SRI funds. Explanatory variables include Screening
Intensity, defined as the number of screens used, and its square (Squared Screening Intensity), and the following dummy
variables: Environment, Social, Governance, Products, Shareholder Engagement, which take a value of 1 if the fund focuses
on environmental, social, governance, products, shareholder engagement, respectively, and 0 otherwise; Positive Screening is
a dummy variable equal to 1 if the fund employs a positive screening strategy, and 0 otherwise; Labels is a dummy variable
equal to 1 if the fund has received at least one SRI label, and 0 otherwise. Control variables include: Size, measured by Log
fund’s total net assets (in millions of US dollars); Age, measured as the Log of the number of months since the fund’s inception;
Total Expense Ratio is a measure of the total costs associated with managing and operating an investment fund; Global is a
dummy variable that takes the value of 1 if the fund invests internationally, and 0 otherwise. The subsample includes 250 SRI
equity mutual funds for the period 2003-2014. t-statistics are shown in parentheses.
* p-value < 0,10; ** p-value < 0,05; *** p-value < 0,01
Europe
Model (2) Model (3) Model (4) Model (5)
Constant -0,0121 -0,0110 -0,0130 -0,0095
(-1,13) (-1,00) (-1,11) (-0,78)
Screening Intensity 0,0001 -0,0006 0,0000 -0,0013
(0,25) (-0,45) (0,02) (-0,85)
Squared Screening Intensity 0,0001 0,0001
(0,54) (0,94)
Dummy_Environment -0,0020 -0,0014
(-0,51) (-0,36)
Dummy_Social 0,0005 0,0010
(0,17) (0,34)
Dummy_Governance -0,0008 -0,0004
(-0,09) (-0,04)
Dummy_Products 0,0020 0,0019
(0,57) (0,53)
Dummy_Shareholder Engagement (omitted) (omitted)
Dummy_Positive Screening 0,0004 -0,0009
(0,12) (-0,22)
Dummy_Labels 0,0016 0,0016
(0,68) (0,66)
Log Age 0,0010 0,0010 0,0006 0,0004
(0,47) (0,46) (0,28) (0,17)
Log Size 0,0016*** 0,0016*** 0,0016*** 0,0017***
(3,15) (3,17) (3,03) (3,11)
Total Expense Ratio 0,0026* 0,0027** 0,0029** 0,0030**
(1,93) (1,98) (2,08) (2,18)
Dummy_Global -0,0028 -0,0028 -0,0019 -0,0018
(-1,38) (-1,38) (-0,88) (-0,85)
Fixed Effects Included
Random Effects Included
Number of observations 22311
Number of mutual funds 250
R-squared within 0,4918 0,4918 0,4918 0,4918
R-squared between 0,9090 0,9091 0,9101 0,9106
R-squared overall 0,5287 0,5287 0,5287 0,5288

51
Table 8 - Regression results for US funds This table reports the results from regressions of financial performance on a number of social and control variables. The
dependent variable is the risk-adjusted performance (RAP) associated with SRI funds. Explanatory variables include Screening
Intensity, defined as the number of screens used, and its square (Squared Screening Intensity), and the following dummy
variables: Environment, Social, Governance, Products, Shareholder Engagement, which take a value of 1 if the fund focuses
on environmental, social, governance, products, shareholder engagement, respectively, and 0 otherwise; Positive Screening is
a dummy variable equal to 1 if the fund employs a positive screening strategy, and 0 otherwise; Labels is a dummy variable
equal to 1 if the fund has received at least one SRI label, and 0 otherwise. Control variables include: Size, measured by Log
fund’s total net assets (in millions of US dollars); Age, measured as the Log of the number of months since the fund’s inception;
Total Expense Ratio is a measure of the total costs associated with managing and operating an investment fund; Global is a
dummy variable that takes the value of 1 if the fund invests internationally, and 0 otherwise. The subsample includes 80 SRI
equity mutual funds for the period 2003-2014. t-statistics are shown in parentheses.
* p-value < 0,10; ** p-value < 0,05; *** p-value < 0,01
United States of America
Model (2) Model (3) Model (4) Model (5)
Constant 0,0345 0,0205 0,0852*** 0,0614**
(1,16) (0,64) (2,77) (2,08)
Screening Intensity 0,0004 0,0037 -0,0010 0,0127***
(0,84) (1,32) (-0,68) (2,90)
Squared Screening Intensity -0,0002 -0,0007***
(-1,19) (-3,28)
Dummy_Environment -0,0053 -0,0288***
(-0,59) (-2,61)
Dummy_Social -0,0004 -0,0117
(-0,05) (-1,44)
Dummy_Governance 0,0298** 0,0369***
(2,55) (3,31)
Dummy_Products -0,0220** -0,0466***
(-2,01) (-3,63)
Dummy_Shareholder Engagement 0,0084 0,0138
(0,89) (1,57)
Dummy_Positive Screening -0,0267*** -0,0264***
(-3,50) (-3,72)
Dummy_Labels 0,0078 0,0080
(1,25) (1,37)
Log Age -0,0054 -0,0044 -0,0099* -0,0058
(-0,88) (-0,70) (-1,70) (-1,04)
Log Size 0,0003 0,0003 0,0004 0,0001
(0,23) (0,24) (0,32) (0,11)
Total Expense Ratio -0,0011 -0,0012 -0,0017 -0,0021
(-0,21) (-0,22) (-0,32) (-0,41)
Dummy_Global -0,0068 -0,0054 -0,0111 -0,0119*
(-0,91) (-0,73) (-1,57) (-1,81)
Fixed Effects Included
Random Effects Included
Number of observations 8649
Number of mutual funds 80
R-squared within 0,5273 0,5273 0,5273 0,5273
R-squared between 0,8085 0,8137 0,8630 0,8907
R-squared overall 0,5493 0,5493 0,5502 0,5512

52
Table 9 - Regression results for UK funds This table reports the results from regressions of financial performance on a number of social and control variables. The
dependent variable is the risk-adjusted performance (RAP) associated with SRI funds. Explanatory variables include Screening
Intensity, defined as the number of screens used, and its square (Squared Screening Intensity), and the following dummy
variables: Environment, Social, Governance, Products, Shareholder Engagement, which take a value of 1 if the fund focuses
on environmental, social, governance, products, shareholder engagement, respectively, and 0 otherwise; Positive Screening is
a dummy variable equal to 1 if the fund employs a positive screening strategy, and 0 otherwise; Labels is a dummy variable
equal to 1 if the fund has received at least one SRI label, and 0 otherwise. Control variables include: Size, measured by Log
fund’s total net assets (in millions of US dollars); Age, measured as the Log of the number of months since the fund’s inception;
Total Expense Ratio is a measure of the total costs associated with managing and operating an investment fund; Global is a
dummy variable that takes the value of 1 if the fund invests internationally, and 0 otherwise. The subsample includes 33 SRI
equity mutual funds for the period 2003-2014. t-statistics are shown in parentheses.
* p-value < 0,10; ** p-value < 0,05; *** p-value < 0,01
United Kingdom
Model (2) Model (3) Model (4) Model (5)
Constant -0,0742 -0,0678 -0,0631 -0,0091
(-1,45) (-1,24) (-1,09) (-0,14)
Screening Intensity -0,0009 -0,0041 -0,0112** -0,0248**
(-0,39) (-0,53) (-2,15) (-2,53)
Squared Screening Intensity 0,0003 0,0013
(0,44) (1,63)
Dummy_Environment 0,0181 0,0167
(0,76) (0,75)
Dummy_Social 0,0173 0,0207
(0,95) (1,20)
Dummy_Governance (omitted) (omitted)
Dummy_Products 0,0785* 0,0623
(1,86) (1,53)
Dummy_Shareholder Engagement (omitted) (omitted)
Dummy_Positive Screening 0,0096 -0,0123
(0,33) (-0,41)
Dummy_Labels 0,0151 0,0233
(0,84) (1,30)
Log Age 0,0050 0,0049 -0,0073 -0,0096
(0,52) (0,49) (-0,62) (-0,85)
Log Size 0,0068** 0,0068*** 0,0074*** 0,0071***
(2,80) (2,76) (2,78) (2,77)
Total Expense Ratio 0,0101** 0,0103** 0,0129*** 0,0128***
(2,41) (2,43) (2,93) (2,94)
Dummy_Global -0,0096 -0,0101 -0,0027 -0,0070
(-0,74) (-0,76) (-0,19) (-0,51)
Fixed Effects Included
Random Effects Included
Number of observations 3225
Number of mutual funds 33
R-squared within 0,4059 0,4059 0,4060 0,4060
R-squared between 0,6035 0,6038 0,6977 0,7155
R-squared overall 0,4175 0,4177 0,4199 0,4214

53
Table 10 - Regression results for Austrian funds This table reports the results from regressions of financial performance on a number of social and control variables. The
dependent variable is the risk-adjusted performance (RAP) associated with SRI funds. Explanatory variables include
Screening Intensity, defined as the number of screens used, and its square (Squared Screening Intensity), and the following
dummy variables: Environment, Social, Governance, Products, Shareholder Engagement, which take a value of 1 if the
fund focuses on environmental, social, governance, products, shareholder engagement, respectively, and 0 otherwise;
Positive Screening is a dummy variable equal to 1 if the fund employs a positive screening strategy, and 0 otherwise; Labels
is a dummy variable equal to 1 if the fund has received at least one SRI label, and 0 otherwise. Control variables include:
Size, measured by Log fund’s total net assets (in millions of US dollars); Age, measured as the Log of the number of months
since the fund’s inception; Total Expense Ratio is a measure of the total costs associated with managing and operating an
investment fund; Global is a dummy variable that takes the value of 1 if the fund invests internationally, and 0 otherwise.
The subsample includes 19 SRI equity mutual funds for the period 2003-2014. t-statistics are shown in parentheses.
* p-value < 0,10; ** p-value < 0,05; *** p-value < 0,01
Austria
Model (2) Model (3) Model (4) Model (5)
Constant 0,0136 0,0130 0,0106 0,0159
(0,46) (0,43) (0,29) (0,40)
Screening Intensity 0,0006 0,0001 0,0009 0,0048
(0,89) (0,04) (0,37) (0,41)
Squared Screening Intensity 0,0001 -0,0004
(0,17) (-0,34)
Dummy_Environment -0,0001 0,0029
(-0,02) (0,24)
Dummy_Social 0,0116 0,0090
(0,67) (0,48)
Dummy_Governance (omitted) (omitted)
Dummy_Products -0,0104 -0,0133
(-0,81) (-0,87)
Dummy_Shareholder Engagement (omitted) (omitted)
Dummy_Positive Screening 0,0059 0,0031
(0,36) (0,17)
Dummy_Labels 0,0043 0,0058
(0,56) (0,65)
Log Age -0,0025 -0,0021 -0,0029 -0,0051
(-0,42) (-0,33) (-0,45) (-0,56)
Log Size -0,0002 -0,0003 -0,0008 -0,0007
(-0,25) (-0,30) (-0,65) (-0,51)
Total Expense Ratio 0,0003 0,0004 0,0005 -0,0002
(0,09) (0,09) (0,11) (-0,04)
Dummy_Global -0,0001 -0,0005 -0,0009 -0,0003
(-0,02) (-0,10) (-0,16) (-0,04)
Fixed Effects Included
Random Effects Included
Number of observations 1830
Number of mutual funds 19
R-squared within 0,7303 0,7303 0,7303 0,7303
R-squared between 0,9950 0,9949 0,9958 0,9960
R-squared overall 0,7644 0,7644 0,7645 0,7645
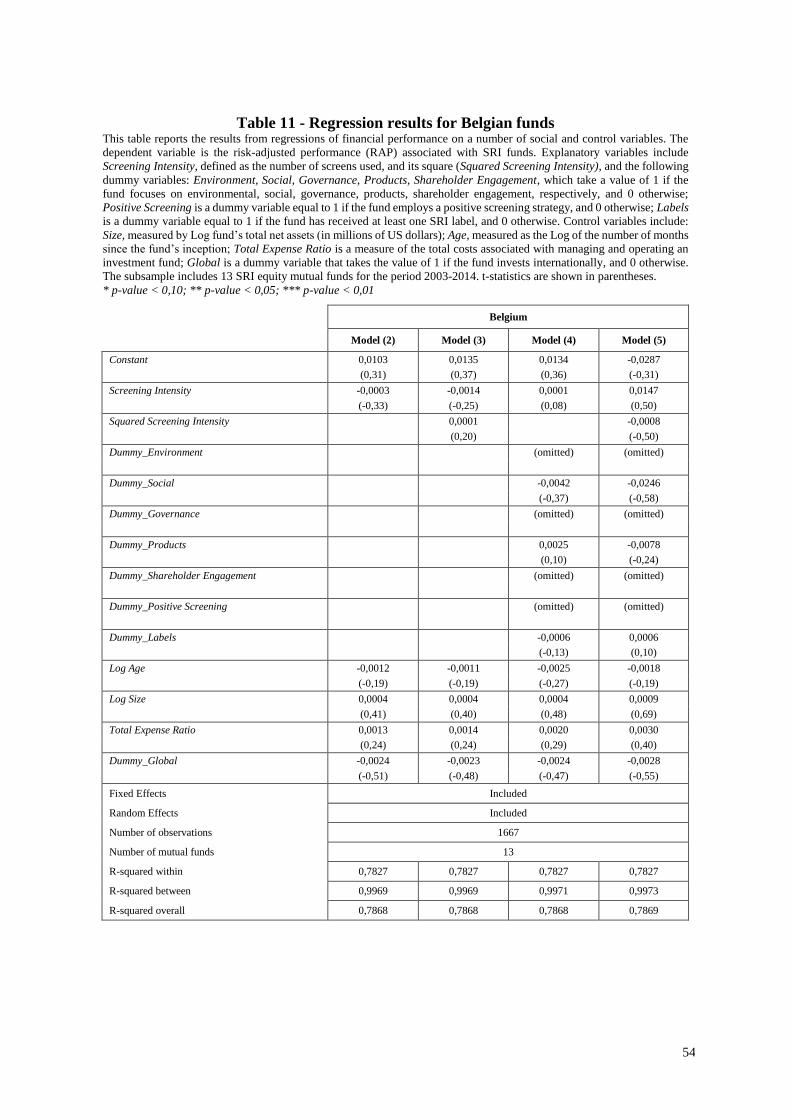
54
Table 11 - Regression results for Belgian funds This table reports the results from regressions of financial performance on a number of social and control variables. The
dependent variable is the risk-adjusted performance (RAP) associated with SRI funds. Explanatory variables include
Screening Intensity, defined as the number of screens used, and its square (Squared Screening Intensity), and the following
dummy variables: Environment, Social, Governance, Products, Shareholder Engagement, which take a value of 1 if the
fund focuses on environmental, social, governance, products, shareholder engagement, respectively, and 0 otherwise;
Positive Screening is a dummy variable equal to 1 if the fund employs a positive screening strategy, and 0 otherwise; Labels
is a dummy variable equal to 1 if the fund has received at least one SRI label, and 0 otherwise. Control variables include:
Size, measured by Log fund’s total net assets (in millions of US dollars); Age, measured as the Log of the number of months
since the fund’s inception; Total Expense Ratio is a measure of the total costs associated with managing and operating an
investment fund; Global is a dummy variable that takes the value of 1 if the fund invests internationally, and 0 otherwise.
The subsample includes 13 SRI equity mutual funds for the period 2003-2014. t-statistics are shown in parentheses.
* p-value < 0,10; ** p-value < 0,05; *** p-value < 0,01
Belgium
Model (2) Model (3) Model (4) Model (5)
Constant 0,0103 0,0135 0,0134 -0,0287
(0,31) (0,37) (0,36) (-0,31)
Screening Intensity -0,0003 -0,0014 0,0001 0,0147
(-0,33) (-0,25) (0,08) (0,50)
Squared Screening Intensity 0,0001 -0,0008
(0,20) (-0,50)
Dummy_Environment (omitted) (omitted)
Dummy_Social -0,0042 -0,0246
(-0,37) (-0,58)
Dummy_Governance (omitted) (omitted)
Dummy_Products 0,0025 -0,0078
(0,10) (-0,24)
Dummy_Shareholder Engagement (omitted) (omitted)
Dummy_Positive Screening (omitted) (omitted)
Dummy_Labels -0,0006 0,0006
(-0,13) (0,10)
Log Age -0,0012 -0,0011 -0,0025 -0,0018
(-0,19) (-0,19) (-0,27) (-0,19)
Log Size 0,0004 0,0004 0,0004 0,0009
(0,41) (0,40) (0,48) (0,69)
Total Expense Ratio 0,0013 0,0014 0,0020 0,0030
(0,24) (0,24) (0,29) (0,40)
Dummy_Global -0,0024 -0,0023 -0,0024 -0,0028
(-0,51) (-0,48) (-0,47) (-0,55)
Fixed Effects Included
Random Effects Included
Number of observations 1667
Number of mutual funds 13
R-squared within 0,7827 0,7827 0,7827 0,7827
R-squared between 0,9969 0,9969 0,9971 0,9973
R-squared overall 0,7868 0,7868 0,7868 0,7869

55
Table 12 - Regression results for French funds This table reports the results from regressions of financial performance on a number of social and control variables. The
dependent variable is the risk-adjusted performance (RAP) associated with SRI funds. Explanatory variables include Screening
Intensity, defined as the number of screens used, and its square (Squared Screening Intensity), and the following dummy
variables: Environment, Social, Governance, Products, Shareholder Engagement, which take a value of 1 if the fund focuses
on environmental, social, governance, products, shareholder engagement, respectively, and 0 otherwise; Positive Screening is
a dummy variable equal to 1 if the fund employs a positive screening strategy, and 0 otherwise; Labels is a dummy variable
equal to 1 if the fund has received at least one SRI label, and 0 otherwise. Control variables include: Size, measured by Log
fund’s total net assets (in millions of US dollars); Age, measured as the Log of the number of months since the fund’s inception;
Total Expense Ratio is a measure of the total costs associated with managing and operating an investment fund; Global is a
dummy variable that takes the value of 1 if the fund invests internationally, and 0 otherwise. The subsample includes 54 SRI
equity mutual funds for the period 2003-2014. t-statistics are shown in parentheses.
* p-value < 0,10; ** p-value < 0,05; *** p-value < 0,01
France
Model (2) Model (3) Model (4) Model (5)
Constant -0,0228 -0,0224 -0,0221 -0,0227
(-0,71) (-0,67) (-0,60) (-0,56)
Screening Intensity 0,0006 0,0004 0,0009 0,0011
(0,52) (0,09) (0,35) (0,18)
Squared Screening Intensity 0,0000 0,0000
(0,04) (-0,04)
Dummy_Environment -0,0018 -0,0019
(-0,17) (-0,17)
Dummy_Social -0,0008 -0,0009
(-0,08) (-0,09)
Dummy_Governance (omitted) (omitted)
Dummy_Products -0,0015 -0,0015
(-0,11) (-0,10)
Dummy_Shareholder Engagement (omitted) (omitted)
Dummy_Positive Screening 0,0010 0,0011
(0,09) (0,09)
Dummy_Labels -0,0003 -0,0002
(-0,02) (-0,01)
Log Age 0,0042 0,0042 0,0042 0,0043
(0,64) (0,62) (0,63) (0,63)
Log Size 0,0007 0,0006 0,0006 0,0006
(0,35) (0,34) (0,33) (0,33)
Total Expense Ratio 0,0004 0,0005 0,0005 0,0004
(0,13) (0,13) (0,13) (0,12)
Dummy_Global -0,0009 -0,0009 -0,0008 -0,0008
(-0,13) (-0,13) (-0,11) (-0,10)
Fixed Effects Included
Random Effects Included
Number of observations 4725
Number of mutual funds 54
R-squared within 0,3361 0,3361 0,3361 0,3361
R-squared between 0,9814 0,9814 0,9816 0,9816
R-squared overall 0,3626 0,3626 0,3626 0,3626

56
Table 13 - Regression results for German funds This table reports the results from regressions of financial performance on a number of social and control variables. The
dependent variable is the risk-adjusted performance (RAP) associated with SRI funds. Explanatory variables include Screening
Intensity, defined as the number of screens used, and its square (Squared Screening Intensity), and the following dummy
variables: Environment, Social, Governance, Products, Shareholder Engagement, which take a value of 1 if the fund focuses
on environmental, social, governance, products, shareholder engagement, respectively, and 0 otherwise; Positive Screening is
a dummy variable equal to 1 if the fund employs a positive screening strategy, and 0 otherwise; Labels is a dummy variable
equal to 1 if the fund has received at least one SRI label, and 0 otherwise. Control variables include: Size, measured by Log
fund’s total net assets (in millions of US dollars); Age, measured as the Log of the number of months since the fund’s inception;
Total Expense Ratio is a measure of the total costs associated with managing and operating an investment fund; Global is a
dummy variable that takes the value of 1 if the fund invests internationally, and 0 otherwise. The subsample includes 18 SRI
equity mutual funds for the period 2003-2014. t-statistics are shown in parentheses.
* p-value < 0,10; ** p-value < 0,05; *** p-value < 0,01
Germany
Model (2) Model (3) Model (4) Model (5)
Constant -0,0150 -0,0214 0,0037 0,0423
(-0,53) (-0,72) (0,07) (0,42)
Screening Intensity 0,0005 -0,0013 0,0007 -0,0018
(0,57) (-0,45) (0,34) (-0,31)
Squared Screening Intensity 0,0002 0,0004
(0,66) (0,46)
Dummy_Environment -0,0004 -0,0254
(-0,02) (-0,43)
Dummy_Social -0,0054 -0,0067
(-0,67) (-0,78)
Dummy_Governance (omitted) (omitted)
Dummy_Products 0,0129 -0,0138
(0,69) (-0,23)
Dummy_Shareholder Engagement (omitted) (omitted)
Dummy_Positive Screening 0,0001 -0,0002
(0,00) (-0,02)
Dummy_Labels -0,0081 -0,0078
(-1,33) (-1,27)
Log Age 0,0036 0,0058 -0,0036 -0,0015
(0,67) (0,92) (-0,39) (-0,14)
Log Size 0,0011 0,0014 0,0036 0,0039
(0,68) (0,82) (1,50) (1,57)
Total Expense Ratio -0,0006 -0,0007 0,0012 0,0035
(-0,13) (-0,17) (0,23) (0,49)
Dummy_Global -0,0013 -0,0036 0,0027 -0,0227
(-0,20) (-0,49) (0,16) (-0,40)
Fixed Effects Included
Random Effects Included
Number of observations 1702
Number of mutual funds 18
R-squared within 0,6950 0,6951 0,6956 0,6957
R-squared between 0,9956 0,9956 0,9953 0,9950
R-squared overall 0,7253 0,7254 0,7258 0,7258
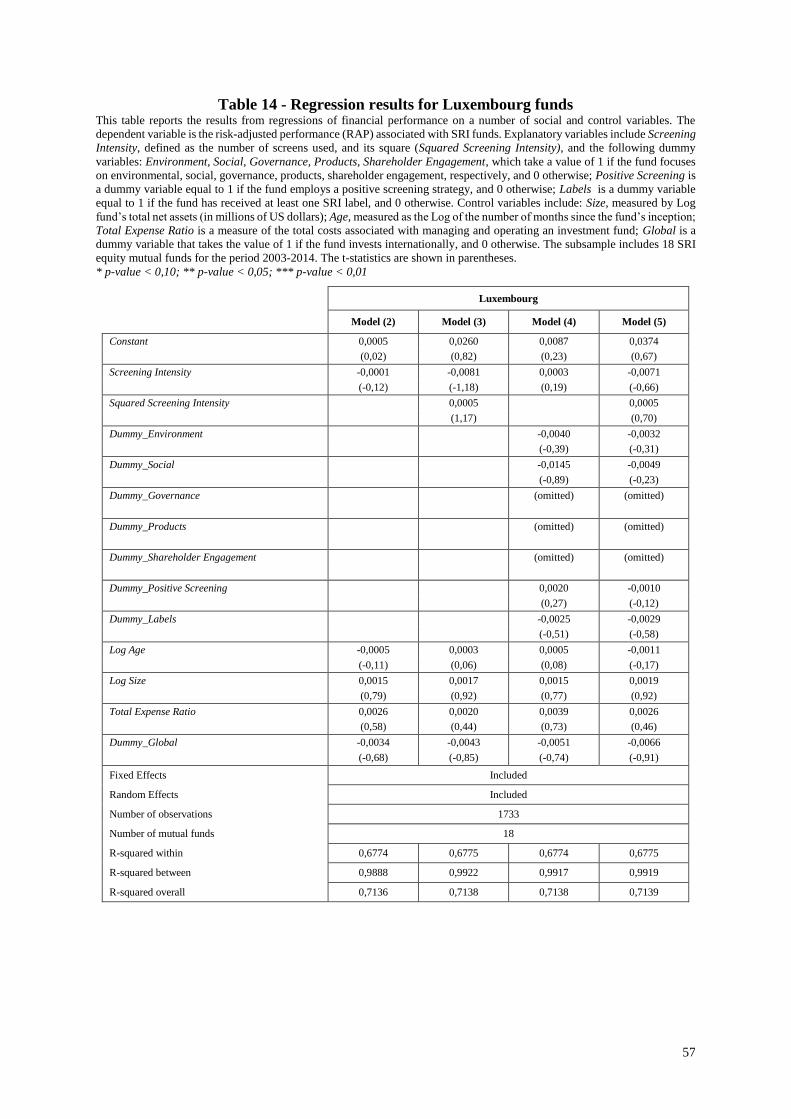
57
Table 14 - Regression results for Luxembourg funds This table reports the results from regressions of financial performance on a number of social and control variables. The
dependent variable is the risk-adjusted performance (RAP) associated with SRI funds. Explanatory variables include Screening
Intensity, defined as the number of screens used, and its square (Squared Screening Intensity), and the following dummy
variables: Environment, Social, Governance, Products, Shareholder Engagement, which take a value of 1 if the fund focuses
on environmental, social, governance, products, shareholder engagement, respectively, and 0 otherwise; Positive Screening is
a dummy variable equal to 1 if the fund employs a positive screening strategy, and 0 otherwise; Labels is a dummy variable
equal to 1 if the fund has received at least one SRI label, and 0 otherwise. Control variables include: Size, measured by Log
fund’s total net assets (in millions of US dollars); Age, measured as the Log of the number of months since the fund’s inception;
Total Expense Ratio is a measure of the total costs associated with managing and operating an investment fund; Global is a
dummy variable that takes the value of 1 if the fund invests internationally, and 0 otherwise. The subsample includes 18 SRI
equity mutual funds for the period 2003-2014. The t-statistics are shown in parentheses.
* p-value < 0,10; ** p-value < 0,05; *** p-value < 0,01
Luxembourg
Model (2) Model (3) Model (4) Model (5)
Constant 0,0005 0,0260 0,0087 0,0374
(0,02) (0,82) (0,23) (0,67)
Screening Intensity -0,0001 -0,0081 0,0003 -0,0071
(-0,12) (-1,18) (0,19) (-0,66)
Squared Screening Intensity 0,0005 0,0005
(1,17) (0,70)
Dummy_Environment -0,0040 -0,0032
(-0,39) (-0,31)
Dummy_Social -0,0145 -0,0049
(-0,89) (-0,23)
Dummy_Governance (omitted) (omitted)
Dummy_Products (omitted) (omitted)
Dummy_Shareholder Engagement (omitted) (omitted)
Dummy_Positive Screening 0,0020 -0,0010
(0,27) (-0,12)
Dummy_Labels -0,0025 -0,0029
(-0,51) (-0,58)
Log Age -0,0005 0,0003 0,0005 -0,0011
(-0,11) (0,06) (0,08) (-0,17)
Log Size 0,0015 0,0017 0,0015 0,0019
(0,79) (0,92) (0,77) (0,92)
Total Expense Ratio 0,0026 0,0020 0,0039 0,0026
(0,58) (0,44) (0,73) (0,46)
Dummy_Global -0,0034 -0,0043 -0,0051 -0,0066
(-0,68) (-0,85) (-0,74) (-0,91)
Fixed Effects Included
Random Effects Included
Number of observations 1733
Number of mutual funds 18
R-squared within 0,6774 0,6775 0,6774 0,6775
R-squared between 0,9888 0,9922 0,9917 0,9919
R-squared overall 0,7136 0,7138 0,7138 0,7139

58
Table 15 - Regression results for Swiss funds This table reports the results from regressions of financial performance on a number of social and control variables. The
dependent variable is the risk-adjusted performance (RAP) associated with SRI funds. Explanatory variables include Screening
Intensity, defined as the number of screens used, and its square (Squared Screening Intensity), and the following dummy
variables: Environment, Social, Governance, Products, Shareholder Engagement, which take a value of 1 if the fund focuses
on environmental, social, governance, products, shareholder engagement, respectively, and 0 otherwise; Positive Screening is
a dummy variable equal to 1 if the fund employs a positive screening strategy, and 0 otherwise; Labels is a dummy variable
equal to 1 if the fund has received at least one SRI label, and 0 otherwise. Control variables include: Size, measured by Log
fund’s total net assets (in millions of US dollars); Age, measured as the Log of the number of months since the fund’s inception;
Total Expense Ratio is a measure of the total costs associated with managing and operating an investment fund; Global is a
dummy variable that takes the value of 1 if the fund invests internationally, and 0 otherwise. The subsample includes 64 SRI
equity mutual funds for the period 2003-2014. The t-statistics are shown in parentheses.
* p-value < 0,10; ** p-value < 0,05; *** p-value < 0,01
Switzerland
Model (2) Model (3) Model (4) Model (5)
Constant 0,0441*** 0,0418** 0,0445** 0,0430**
(2,63) (2,46) (2,45) (2,35)
Screening Intensity 0,0001 0,0024 0,0003 0,0023
(0,13) (0,90) (0,23) (0,82)
Squared Screening Intensity -0,0003 -0,0003
(-0,90) (-0,80)
Dummy_Environment -0,0025 -0,0019
(-0,69) (-0,52)
Dummy_Social -0,0003 -0,0001
(-0,07) (-0,01)
Dummy_Governance -0,0042 -0,0043
(-0,72) (-0,75)
Dummy_Products -0,0019 -0,0017
(-0,57) (-0,49)
Dummy_Shareholder Engagement (omitted) (omitted)
Dummy_Positive Screening (omitted) (omitted)
Dummy_Labels 0,0005 0,0002
(0,12) (0,06)
Log Age -0,0072** -0,0074** -0,0072** -0,0075**
(-2,03) (-2,10) (-1,97) (-2,05)
Log Size 0,0008 0,0008 0,0010 0,0010
(1,00) (0,98) (1,14) (1,14)
Total Expense Ratio -0,0015 -0,0014 -0,0011 -0,0012
(-0,72) (-0,69) (-0,46) (-0,51)
Dummy_Global -0,0045 -0,0043 -0,0040 -0,0039
(-1,49) (-1,42) (-1,17) (-1,16)
Fixed Effects Included
Random Effects Included
Number of observations 5463
Number of mutual funds 64
R-squared within 0,6389 0,6389 0,6389 0,6389
R-squared between 0,9797 0,9802 0,9801 0,9804
R-squared overall 0,6840 0,6840 0,6841 0,6841

59
Table 16 - Regression results for Scandinavian funds This table reports the results from regressions of financial performance on a number of social and control variables. The
dependent variable is the risk-adjusted performance (RAP) associated with SRI funds. Explanatory variables include Screening
Intensity, defined as the number of screens used, and its square (Squared Screening Intensity), and the following dummy
variables: Environment, Social, Governance, Products, Shareholder Engagement, which take a value of 1 if the fund focuses
on environmental, social, governance, products, shareholder engagement, respectively, and 0 otherwise; Positive Screening is
a dummy variable equal to 1 if the fund employs a positive screening strategy, and 0 otherwise; Labels is a dummy variable
equal to 1 if the fund has received at least one SRI label, and 0 otherwise. Control variables include: Size, measured by Log
fund’s total net assets (in millions of US dollars); Age, measured as the Log of the number of months since the fund’s inception;
Total Expense Ratio is a measure of the total costs associated with managing and operating an investment fund; Global is a
dummy variable that takes the value of 1 if the fund invests internationally, and 0 otherwise. The subsample includes 21 SRI
equity mutual funds for the period 2003-2014. The t-statistics are shown in parentheses.
* p-value < 0,10; ** p-value < 0,05; *** p-value < 0,01
Scandinavia
Model (2) Model (3) Model (4) Model (5)
Constant -0,0042 0,0185 -0,0080 0,0324
(-0,13) (0,52) (-0,21) (0,76)
Screening Intensity -0,0007 -0,0110* -0,0039 -0,0136*
(-0,48) (-1,84) (-0,57) (-1,65)
Squared Screening Intensity 0,0009* 0,0012**
(1,78) (2,06)
Dummy_Environment 0,0192 -0,0030
(0,53) (-0,08)
Dummy_Social 0,0133 0,0058
(0,71) (0,30)
Dummy_Governance (omitted) (omitted)
Dummy_Products 0,0136 -0,0046
(0,46) (-0,15)
Dummy_Shareholder Engagement (omitted) (omitted)
Dummy_Positive Screening -0,0134 -0,0075
(-0,67) (-0,37)
Dummy_Labels 0,0015 -0,0025
(0,25) (-0,39)
Log Age 0,0017 -0,0004 0,0014 -0,0012
(0,25) (-0,06) (0,19) (-0,16)
Log Size 0,0011 0,0026 0,0013 0,0026
(0,77) (1,61) (0,58) (1,14)
Total Expense Ratio -0,0010 0,0017 0,0000 0,0036
(-0,27) (0,42) (0,01) (0,78)
Dummy_Global -0,0021 -0,0020 -0,0024 -0,0016
(-0,44) (-0,44) (-0,49) (-0,33)
Fixed Effects Included
Random Effects Included
Number of observations 1281
Number of mutual funds 21
R-squared within 0,6199 0,6202 0,6200 0,6203
R-squared between 0,9842 0,9885 0,9852 0,9940
R-squared overall 0,6836 0,6844 0,6839 0,6850

60
Figure 1 - Percentage of funds per country This figure illustrates the division of the funds by the 13 countries considered in the sample.
United States
24%
Switzerland
19%France
16%
United Kingdom
10%
Austria
6%
Germany
6%
Luxembourg
5%
Belgium
4%
Sweden
4%Netherlands
3%
Norway, Denmark,
Italy3%

61
Figure 2 - Average monthly returns This table presents monthly returns averaged for the period 2000-2014 considering the global sample and two sub-samples
(US funds and European funds).
Figure 3 - Screening intensity of SRI funds This figure presents the number of screens applied by the funds included in the sample.
-0.06
-0.05
-0.04
-0.03
-0.02
-0.01
0
0.01
0.02
0.03
0.04
0.05
2000 2001 2002 2003 2004 2005 2006 2007 2008 2009 2010 2011 2012 2013 2014
US funds European funds Total sample
0
10
20
30
40
50
60
70
0 2 4 6 8 10 12 14 16 18
NU
MB
ER
OF
FU
ND
S
NUMBER OF SCREENS BY FUND
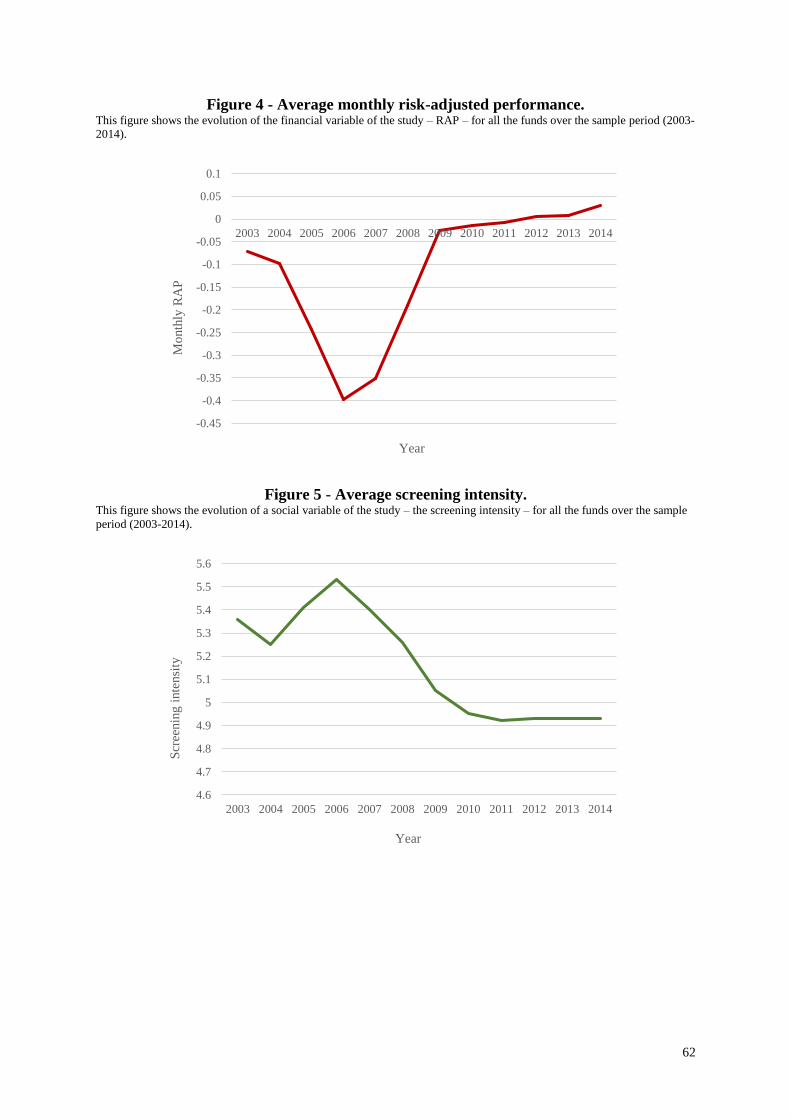
62
Figure 4 - Average monthly risk-adjusted performance. This figure shows the evolution of the financial variable of the study – RAP – for all the funds over the sample period (2003-
2014).
Figure 5 - Average screening intensity. This figure shows the evolution of a social variable of the study – the screening intensity – for all the funds over the sample
period (2003-2014).
-0.45
-0.4
-0.35
-0.3
-0.25
-0.2
-0.15
-0.1
-0.05
0
0.05
0.1
2003 2004 2005 2006 2007 2008 2009 2010 2011 2012 2013 2014
Mo
nth
ly R
AP
Year
4.6
4.7
4.8
4.9
5
5.1
5.2
5.3
5.4
5.5
5.6
2003 2004 2005 2006 2007 2008 2009 2010 2011 2012 2013 2014
Scr
eenin
g i
nte
nsi
ty
Year