Embed Size (px)
Citation preview
e-classroom 2017 www.e-classroom.co.za ©
1
GRADE 10 TERM 2 SOCIAL SCIENCES - GEOGRAPHYMID-YEAR MOCK EXAMINATION - MEMO
Time: 2 hours Marks: 140
Question 11. Answer this question on a new sheet of paper.
1.1. Define the following terms/concepts:
1.1.1. Atmosphere – layer of gases surrounding the Earth.
1.1.2. Volcanologist – a person who studies volcanoes.
1.1.3. Greenhouse effect – the heating of the Earth’s atmosphere.
1.1.4. Epicentre – the point on the Earth’s surface directly above the focus.
1.1.5. Albedo – the ability of a surface to reflect light.
1.1.6. Igneous rock – lava that has cooled and solidified.
1.1.7. Latent heat – stored heat.
1.1.8. Bedding plane – the smallest division of a formation in layered rocks; separates layers.
1.1.9. Weather – day-to-day atmospheric conditions.
1.1.10. Seismograph – instrument used to measure and record details of earthquakes. (10)
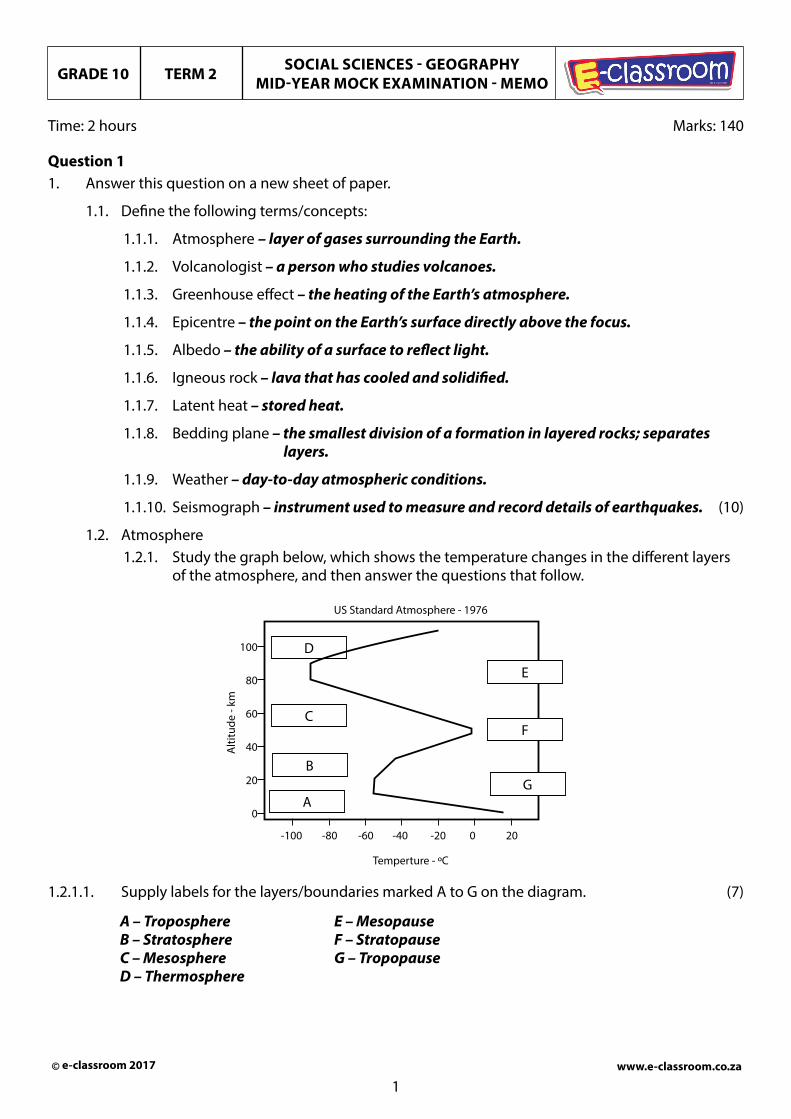
1.2. Atmosphere1.2.1. Study the graph below, which shows the temperature changes in the different layers
of the atmosphere, and then answer the questions that follow.
D
C
B
A
E
F
G
-100 -80 -60 -40 -20 0 20
US Standard Atmosphere - 1976
Temperture - ºC
Alti
tude
- km
100
80
60
40
20
0
1.2.1.1. Supply labels for the layers/boundaries marked A to G on the diagram. (7)
A – Troposphere B – Stratosphere C – Mesosphere D – Thermosphere
E – Mesopause F – Stratopause G – Tropopause

e-classroom 2017 www.e-classroom.co.za ©
2
GRADE 10 TERM 2 SOCIAL SCIENCES - GEOGRAPHYMID-YEAR MOCK EXAMINATION - MEMO
1.2.1.2. Explain the importance of layer A for the existence of life on Earth. (3) Layer A contains gases and weather essential for life.
1.2.1.3. Explain what is responsible for the increase in temperature in layers B and D. (2) B – the presence of ozone in the atmosphere. D – proximity to the Sun.
1.2.1.4. Name the four main gases that make up the atmosphere. (4) Oxygen, nitrogen, carbon dioxide, water vapour.
1.2.2. Refer to the figure below, showing the relation of pressure to altitude, and answer the questions that follow.
1100
1000
900
800
700
600
500
400
300
2000 2000 4000 6000 8000 10000 12000
Meters
mba
r
Atmosphere Pressure Vs Altitude
http://www.sensorsmag.com/files/sensor/nodes/2010/7896/Figure1.gif
1.2.2.1. What would the pressure reading be of Mount Everest (8 848 m)? (1) Approximately 350 hPa. Answer must be between 300 and 380 hPa.
1.2.2.2. Briefly explain what happens to air pressure as altitude increases. (2) Air pressure decreases, the air gets thinner – there are fewer particles.
1.2.2.3. Discuss why a sports team from Durban would need to arrive in Johannesburg a few days prior to playing their match. (2) The air is denser in Durban – more oxygen. In Johannesburg, the air is thinner – less oxygen. The teams first need to acclimatise.
e-classroom 2017 www.e-classroom.co.za ©
3
GRADE 10 TERM 2 SOCIAL SCIENCES - GEOGRAPHYMID-YEAR MOCK EXAMINATION - MEMO
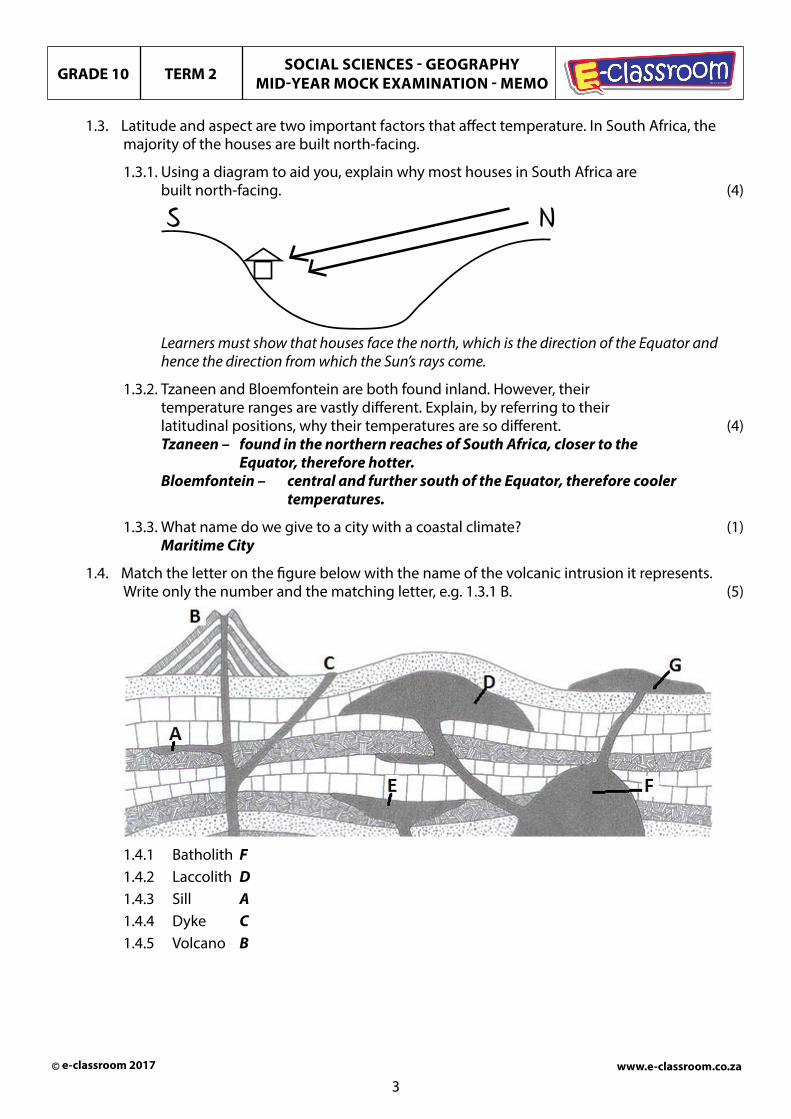
1.3. Latitude and aspect are two important factors that affect temperature. In South Africa, the majority of the houses are built north-facing.
1.3.1. Using a diagram to aid you, explain why most houses in South Africa are built north-facing. (4)
S N
Learners must show that houses face the north, which is the direction of the Equator and hence the direction from which the Sun’s rays come.
1.3.2. Tzaneen and Bloemfontein are both found inland. However, their temperature ranges are vastly different. Explain, by referring to their latitudinal positions, why their temperatures are so different. (4) Tzaneen – found in the northern reaches of South Africa, closer to the Equator, therefore hotter. Bloemfontein – central and further south of the Equator, therefore cooler temperatures.
1.3.3. What name do we give to a city with a coastal climate? (1) Maritime City
1.4. Match the letter on the figure below with the name of the volcanic intrusion it represents. Write only the number and the matching letter, e.g. 1.3.1 B. (5)
1.4.1 Batholith F1.4.2 Laccolith D1.4.3 Sill A1.4.4 Dyke C1.4.5 Volcano B

e-classroom 2017 www.e-classroom.co.za ©
4
GRADE 10 TERM 2 SOCIAL SCIENCES - GEOGRAPHYMID-YEAR MOCK EXAMINATION - MEMO
1.5. Refer to the source below and then answer the questions that follow.
Source 1: Syria’s geography
Syria is a nation in the Middle East, bordering the Mediterranean Sea, between Lebanon and Turkey. Its capital is Damascus. Its major environmental issues include deforestation, overgrazing, soil erosion, desertification, water pollution from raw sewage and petroleum refining wastes and inadequate potable water. Most people live in the Euphrates River Valley, along the coastal plain, and in a fertile strip between the coastal mountains and the desert. Volcanism: Syria’s two historically active volcanoes, Es Safa and an unnamed volcano near the
Turkish border, have not erupted in centuries. Es Safa is a cinder cone located 95 km SE of Damascus and is the northernmost volcano of the African Rift Valley. A lava lake was reported at the volcano sometime between 1840 and 1860.
Earthquakes: Syria experiences mild earthquakes every year. Syria is located at the northern end of the Great African Rift Valley. In 2004 a shallow 4-magnitude quake struck Yabrud at a depth of 10 km in the Rif Daashq region.
Terrain: Primarily semi-arid and desert plateau; narrow coastal plain; mountains in the west. The highest point is Mount Hermon (2 814 m) and the lowest point is an unnamed location near Lake Tiberias (-200 m). Approximately 24.8% of land is arable.
Climate: Mostly desert; hot, dry, sunny summers (June to August) and mild, rainy winters (December to February) along the coast. The most striking feature of the climate is the contrast. Between the humid Mediterranean coast and the arid desert regions lies a semi-arid zone extending across three-quarters of the country and bordered on the west by mountains. Rainfall in the mountainous western region is abundant with annual precipitation ranging between 750 mm and 1 000 mm. The Al Ghab depression, located east of these mountains, is in a relatively arid zone with warm, dry winds and scanty rainfall.
(Source: Collated from various internet sources)
1.5.1. Name the scale used to measure:1.5.1.1. The magnitude of the earthquake. (1)
Richter scale.1.5.1.2. The intensity of the earthquake. (1)
Mercalli scale.
1.5.2. Distinguish between magnitude and intensity when used in reference to an earthquake. (2) Magnitude – objective and observed (what is measured). Intensity – subjective and perceived (what is felt).
1.5.3. Describe where the focus of the 2004 earthquake was. (2) Yabrud – at a depth of 10 km.
1.5.4. State the name of the instrument used to record earthquakes. (1) Seismometer.
1.5.5. Es Safa volcano is classified as dormant. Account for this classification. (1) No recent eruptions.

e-classroom 2017 www.e-classroom.co.za ©
5
GRADE 10 TERM 2 SOCIAL SCIENCES - GEOGRAPHYMID-YEAR MOCK EXAMINATION - MEMO
1.5.6. The Es Safa volcano is found in the northern reaches of the African Rift Valley.
1.5.6.1. Draw an annotated diagram to explain how a rift valley forms. (8)
1.5.6.2. Label Lake Tiberias on your diagram and provide annotations to explain its altitude. (2) Must indicate it somewhere in the lower section Explain that land has slipped below sea level
1.5.7. Select the correct word to complete the sentences below. Write only the question number and the correct word.1.5.7.1. A rift valley is caused by compressional/tensional forces. (1)1.5.7.2. Tensional forces result in a reverse/normal fault. (1)
1.6. Draw and label a sketch of the internal layers of the Earth. (4)
Crust✓Mantle✓
Outer Core✓
Inner Core✓
1.6.1. Name the two metals that make up the core. (1) Nickel and iron
Sub-total: 70
Question 22. Start this question on a new sheet of paper.
2.1. State whether the following statements are true or false. Where false, correct the statement. (10)2.1.1. The ozone layer is a protective layer of gases made up of two oxygen atoms.
False, three oxygen atoms (ozone).2.1.2. Metamorphic rocks are easy to break.
False, very hard rocks, difficult to break.2.1.3. Convectional rainfall is most common over the interior of South Africa.
True

e-classroom 2017 www.e-classroom.co.za ©
6
GRADE 10 TERM 2 SOCIAL SCIENCES - GEOGRAPHYMID-YEAR MOCK EXAMINATION - MEMO
2.1.4. Sandstone is a sedimentary rock. True
2.1.5. Cape Town experiences frontal rainfall in the summer months. False, winter months
2.1.6. The closer you are to the Equator, the warmer it is. True
2.1.7. Durban has a maritime climate and Parys has a continental climate. True
2.2. Match Column A with the correct description in Column B. Write only the question number and correct letter on your answer sheet. (7)
Column A Column B
2.2.1 Terrestrial radiation A
This energy is released during condensation and used during evaporation. It is also known as ‘hidden heat’.
2.2.2 Latent heat B The layer of the atmosphere that lies furthest from the Earth
2.2.3 Temperature increases with height C Heat-holding gases
2.2.4 Water vapour, carbon dioxide and methane D The heat energy that Earth
radiates2.2.5 Thermosphere E Inversion
2.2.6 Troposphere FThe amount of energy necessary to raise the temperature of 1 g of a substance by 1 °C
2.2.7 Specific heat capacity G The layer of the atmosphere that contains oxygen and water vapour
2.3. Study the diagram below and then answer the questions that follow.

e-classroom 2017 www.e-classroom.co.za ©
7
GRADE 10 TERM 2 SOCIAL SCIENCES - GEOGRAPHYMID-YEAR MOCK EXAMINATION - MEMO
2.3.1. Only 47% of the Sun’s energy reaches the Earth’s surface. What happens to the other 53%? State three ways in which this energy is lost. (3) Reflected, scattered, absorbed.
2.3.2. Using an annotated diagram, fully explain the greenhouse effect. (3) Learners should give a similar diagram to the one given, but need to show a layer of ‘pollution’ that traps the heat.
2.3.3. Discuss the validity of the following statement. (3) “Rapid economic growth has led to the greenhouse effect accelerating and has also contributed to climate change.” Learners need to agree/disagree with the statement – 1 mark Must give valid reasons – 2 marks
Extract: Global warmingIncreasing global temperatures are causing a broad range of changes. Sea levels are rising due to thermal expansion of the ocean, in addition to melting of land ice. Amounts and patterns of precipitation are changing. The total annual power of hurricanes has already increased markedly since 1975 because their average intensity and average duration have increased (in addition, there has been a high correlation of hurricane power with tropical sea-surface temperature).
Changes in temperature and precipitation patterns increase the frequency, duration and intensity of other extreme weather events, such as floods, droughts, heat waves and tornadoes. Other effects of global warming include higher or lower agricultural yields, further glacial retreat, reduced summer stream flows and species extinctions. As a further effect of global warming, diseases such as malaria are returning into areas where they have been extinguished earlier.
Although global warming is affecting the number and magnitude of these events, it is difficult to connect specific events to global warming. Although most studies focus on the period up to 2100, warming is expected to continue past then because carbon dioxide (chemical symbol CO2) has an estimated atmospheric lifetime of 50 to 200 years.
Source: Adapted from http://timeforchange.org/cause-and-effect-for-global-warming
2.4 Read the case study about global warming and answer the questions that follow.
2.4.1. Explain the concept of global warming. (1) Increase in the average temperature of the Earth’s atmosphere.
2.4.2. List three greenhouse gases. (3) Water vapour, methane, carbon dioxide, sulphur dioxide.
2.4.3. Consequences of global warming include:• Rising sea levels• Rural–urban migration• Desertification
Briefly outline how each of the consequences listed above could affect humanity. (6) Learners’ answers must be realistic and logical. They must relate each concept to humanity.

e-classroom 2017 www.e-classroom.co.za ©
8
GRADE 10 TERM 2 SOCIAL SCIENCES - GEOGRAPHYMID-YEAR MOCK EXAMINATION - MEMO
2.5. Taking into account what you have learnt, write a brief report for a tourist pamphlet about South Africa’s weather and climate. (4) Weather – days are generally warm, nights are cooler. Climate – summer rainfall over the interior, high average temperatures, Cape Town receives winter rainfall.
2.6. Study the figures and fact files below before answering the following questions.
Puyehue-Cordón Caulle
Puyehue Volcano as seen from the south side of Puyehue Lake
Elevation 2 236 m (Puyehue)Location
Range AndesGeology
Type Complex volcanoLast eruption 2011 (ongoing)
FIGURE 1: Fact file
FIGURE 2: Position of Puyehue-Cordón Caulle

e-classroom 2017 www.e-classroom.co.za ©
9
GRADE 10 TERM 2 SOCIAL SCIENCES - GEOGRAPHYMID-YEAR MOCK EXAMINATION - MEMO
FIGURE 3: Topography of the region
Text 1 Background The 2011 Puyehue-Cordón Caulle eruption is a volcanic eruption that began in the Puyehue-Cordón Caulle volcanic complex in Chile on 4 June 2011. At least 3 500 people were evacuated from nearby areas, while the ash cloud reached cities all around the Southern Hemisphere within days, including Buenos Aires, Cape Town and Auckland, forcing airlines to cancel hundreds of international and domestic flights. Although the eruption is referred to as coming from Puyehue volcano, it actually came from a vent in the adjacent Cordón Caulle volcano located some few kilometres northwest of the Puyehue stratocone. Cordón Caulle is a volcanic fissure and has erupted many times in recorded history, most recently in 1960, whereas Puyehue has remained dormant. Cordón Caulle’s last eruption occurred in 1960 following the Valdivia earthquake days earlier.
Text 2 Eruption On 4 June 11:30 local time, a new round of eruption in the Puyehue volcano began. For a six-hour period on 4 June, seismic activity increased to an average of 230 earthquakes per hour, at depths of 1 to 4 km. About 12 events were magnitudes greater than 4 of Richter magnitude, and 50 events were magnitudes greater than 3. The alert level was raised to 5, red.
Text 3 Evacuation A ‘red alert’ was declared pre-emptively by the National Emergency Office (ONEMI) for regions near the volcano: Puyehue, Río Bueno, Futrono and Lago Ranco; initially 600 persons were evacuated. The red alert was later extended for a number of areas, increasing the number to at least 3 000 total evacuated people. It was reported that, at first, large land and farm owners in Chilean rural areas near the volcano did not allow workers to be evacuated. People also resisted evacuation mainly because they had to leave their livestock behind.
Text 4 Ash cloud The eruption was reported to have produced lightning and strong thunderstorms. On 5 June the ash rain in Bariloche ceased. There were reports that the ash had caused power outages and prompted the local airport to be closed. On 17 June 2011, OVDAS reported that the ash-and-gas plume reached 3 kilometres above sea level.
e-classroom 2017 www.e-classroom.co.za ©
10
GRADE 10 TERM 2 SOCIAL SCIENCES - GEOGRAPHYMID-YEAR MOCK EXAMINATION - MEMO
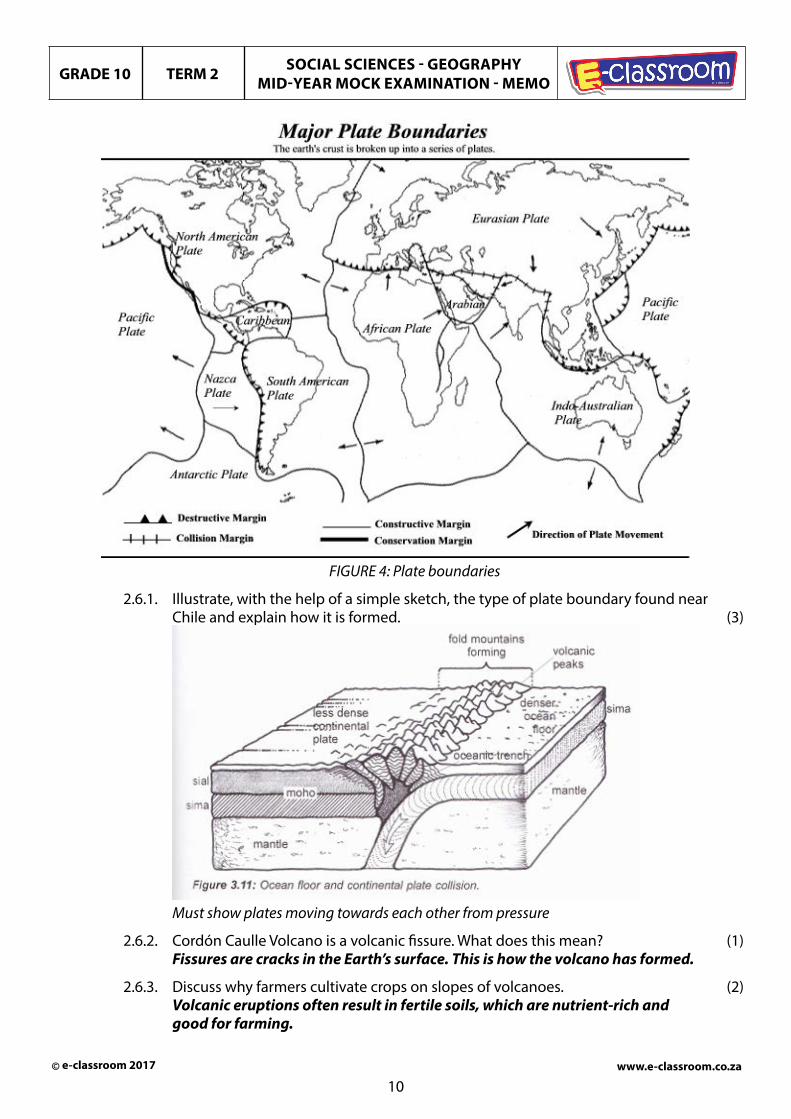
FIGURE 4: Plate boundaries
2.6.1. Illustrate, with the help of a simple sketch, the type of plate boundary found near Chile and explain how it is formed. (3)
Must show plates moving towards each other from pressure
2.6.2. Cordón Caulle Volcano is a volcanic fissure. What does this mean? (1) Fissures are cracks in the Earth’s surface. This is how the volcano has formed.
2.6.3. Discuss why farmers cultivate crops on slopes of volcanoes. (2) Volcanic eruptions often result in fertile soils, which are nutrient-rich and good for farming.

e-classroom 2017 www.e-classroom.co.za ©
11
GRADE 10 TERM 2 SOCIAL SCIENCES - GEOGRAPHYMID-YEAR MOCK EXAMINATION - MEMO
2.6.4. Explain what causes tectonic plates to move. (2) Tectonic plates move because of the movement of the mantle with the constant convection currents that keep the Earth in balance. The plates are forced to move to keep with this balance.
2.6.5. With reference to Figure 4, describe the process at:2.6.5.1. A destructive plate boundary (2)
land is destroyed/lost as the plates move towards each other.2.6.5.2. A constructive plate boundary (2)
land is created, the plates move away from each other, allowing magma to come up from the mantle.
2.6.6. Text 2 refers to seismic activity and Richter magnitude. Provide definitions for seismic activity and Richter magnitude. (4)
a) Seismic activity – a movement of the Earth’s crust caused by the release of stress accumulated along fault lines or volcanic activity.
b) Richter magnitude – this measures the size of seismic waves from a movement of the Earth’s surface.
2.7. Explain the meaning of the following terms:
2.7.1. Stratified rock – rock that has layers. (1)
2.7.2. Porous rock – rock that has air bubbles/holes. (1)
2.7.3. Massive rock – rock that has no structure. (1)
2.7.4. Igneous rock – formed from lava/magma, can be intrusive or extrusive. (1)
2.8. Study the figure below and then answer the questions that follow.
2.8.1. What is the epicentre of an earthquake? (1) The point on the surface of the Earth where the earthquake occurs.
2.8.2. What is the focus of an earthquake? (1) The point within the Earth where the earthquake occurs.
2.8.3. What are isoseismal lines? (1) Lines that join places that experience the same intensity of shockwaves during an earthquake.

e-classroom 2017 www.e-classroom.co.za ©
12
GRADE 10 TERM 2 SOCIAL SCIENCES - GEOGRAPHYMID-YEAR MOCK EXAMINATION - MEMO
2.8.4. Discuss what happens to isoseismal lines the further away they get from the epicentre of an earthquake. (2) The strength of the intensity decreases with increased distance from the epicentre.
2.8.5. Where would the greatest damage occur? Give a reason for your answer. (2) Greatest damage occurs at the epicentre, as this is the point of the actual earthquake.
2.8.6. List three ways in which people could protect themselves during an earthquake. (3) Get under a desk. Stand in a sturdy doorway. Move away from windows. Learners must give a logical answer.
Sub-total: 70