Embed Size (px)
Citation preview

Social Science Research 49 (2015) 53–69
Contents lists available at ScienceDirect
Social Science Research
journal homepage: www.elsevier .com/locate /ssresearch
Long-term health and socioeconomic consequences of early-lifeexposure to the 1959–1961 Chinese Famine
http://dx.doi.org/10.1016/j.ssresearch.2014.07.0070049-089X/� 2014 Elsevier Inc. All rights reserved.
⇑ Corresponding author. Address: Department of Sociology, University of Minnesota, 909 Social Sciences, 267 19th Ave. S., Minneapolis, MNUnited States.
E-mail address: [email protected] (W. Fan).
Wen Fan a,⇑, Yue Qian b
a Department of Sociology, University of Minnesota, United Statesb Department of Sociology, Ohio State University, United States
a r t i c l e i n f o
Article history:Received 27 April 2013Revised 6 June 2014Accepted 17 July 2014Available online 2 August 2014
Keywords:FamineSelf-perceived HealthSESDifference-in-differences estimatorChina
a b s t r a c t
This research investigates long-term consequences of early-life malnutrition by examiningeffects of the 1959–1961 Chinese Famine. Taking into account temporal and geographicvariations in famine severity, we construct a difference-in-differences estimator to identifyeffects of early-life exposure to famine on perceived health and socioeconomic outcomes inmidlife. Using a sample of 1716 adults born in 1955–1966 in rural China from a nationallyrepresentative survey—the 2005 Chinese General Social Survey—we find that the faminehad adverse effects on mid-life health for males born into families where at least oneparent was a Communist Party member and females regardless of parental party member-ship. Being born during the famine had no effects on years of education or income for eithergender. Quantile regressions suggest intense mortality selection among males who had noparty-affiliated parents. Our study highlights the importance of timing and contexts of lifeexperiences in shaping health.
� 2014 Elsevier Inc. All rights reserved.
1. Introduction
In recent years, health studies have begun using a life-course approach more and more often, emphasizing the long-termimpact of experiences during critical periods of growth on subsequent health and human capital (Kuh et al., 2003). In par-ticular, exposure to adverse environmental influences during critical developmental stages, such as prenatal and early-post-natal periods, is found to lead to permanent changes in gene expression as well as brain and body functions as early aschildhood, with increased disease risk in adulthood (Barker, 1995, 2007). From a policy perspective, it is important to under-stand the lasting effects of early-life malnutrition (Barker, 2003; Lumey et al., 2011; Victora et al., 2008), given that childunder-nutrition is a problem not only in many developing countries (Black et al., 2008; de Onis and Blössner, 2000;Pelletier et al., 2012), but in some developed countries as well. In the United States, for example, an estimated 16.7 millionchildren under the age of 18 lived in food insecure households in 2011 (Coleman-Jensen et al., 2012).
It is difficult, however, to measure nutritional intake during prenatal life, infancy, and early childhood. Thus, situations inwhich nutritional deprivation is created exogenously such as famines provide a unique opportunity to study the impact ofearly-life under-nutrition on subsequent health (Brown and Susser, 2008). While the 1944–1945 Dutch Famine is the mostextensively examined famine in the literature, the 1959–1961 Chinese Famine lasted much longer and had more severeconsequences resulting in an estimated 16.5–30 million excess deaths over the three-year period (Ashton et al., 1984;Banister, 1987; Coale, 1981; Peng, 1987; Yao, 1999). In this study we take advantage of this natural experiment to investigate
55455,

54 W. Fan, Y. Qian / Social Science Research 49 (2015) 53–69
the consequences of the Chinese Famine for perceived health and socioeconomic outcomes in midlife. Previous research onthe Chinese Famine mostly relied on samples with limited regional coverage and yielded mixed findings (Almond et al.,2007; Chen and Zhou, 2007; Gørgens et al., 2012; Huang et al., 2010, 2012; Luo et al., 2006; Meng and Qian, 2009; Muand Zhang, 2011; St Clair et al., 2005; Xu et al., 2009; Yang et al., 2008), and none of them examined perceived health, animportant predictor of mortality (Idler and Benyamini, 1997).
Drawing on the life course perspective, we use nationally representative data from the 2005 Chinese General Social Sur-vey (CGSS) to investigate the long-term health and socioeconomic consequences of early-life exposure to the 1959–1961Chinese Famine. We use a difference-in-differences method taking advantage of the temporal and regional variations in fam-ine intensity. Recognizing the importance of social contexts in shaping the linkage between early life experiences and laterlife chances (Elder et al., 2003), we examine famine effects separately among four subgroups at different risk levels of nutri-tional deprivation, classified by gender and family background. By doing so we extend prior studies that examined the pow-erful role of social forces in producing health inequalities (Link and Phelan, 1995). We also contribute to the literature bydemonstrating that, contrary to conventional wisdom, when combined with biological mechanisms (such as mortality selec-tion), advantageous family background does not necessarily serve as a buffer when mid-life health is the focal outcome. Ourstudy sheds light on the relationship between early-life nutritional deficiency and later health in China, a large, poor countryin the midst of famine (Ashton et al., 1984), and in recent decades as it has experienced dramatic increases in the overallhealth and economic standing of its citizenry (Chen et al., 2010). This study also serves as an important step in assessingthe healthcare needs of individuals born during the famine, who are now moving through retirement.
The paper is organized as follows. We first review empirical evidence from the Dutch and Leningrad famine studies. Next,we provide historical accounts and empirical findings of the 1959–1961 Chinese Famine. This is followed by a description ofthe data, sample, measures, and analytical strategies. Adopting a difference-in-differences approach, we estimate famineeffects on health and socioeconomic outcomes in midlife, first by gender and then by gender and family background. Weconclude with a discussion of key findings.
2. Background
2.1. Early life as a critical period: evidence from the Dutch and Leningrad famines
Inspired by the life course framework—timing of lives, in particular—the ‘‘critical period’’ model suggests that the samelife event may have different implications for individual development depending on when each experienced the event (Kuhet al., 2003). Under-nutrition in utero, for example, is hypothesized to be particularly devastating with lasting effects onhealth in later life (Barker, 1995, 1998, 2007).
The Dutch hunger winter (1944–1945) and the siege of Leningrad (1941–1944) are two extensively studied famines thatprovide key evidence for the ‘‘critical period’’ model, but with conflicting findings. Surviving adults prenatally exposed to theDutch famine had higher mortality up to age 50, worse self-rated health, higher coronary heart disease risk, reduced glucosetolerance, higher BMI, and increased risk of psychological disorders (Brown et al., 2000; Neugebauer et al., 1999; Ravelliet al., 1999; Roseboom et al., 2000a, 2000b, 2001a, 2001b, 2003). In contrast, the Leningrad famine did not see significantlong-term effects: intrauterine malnutrition was not associated with glucose intolerance, dyslipidaemia, hypertension, orcardiovascular disease in adulthood (Stanner et al., 1997; Stanner and Yudkin, 2001). The Leningrad famine not only lastedlonger than the Dutch famine, but was preceded and followed by relative shortages of food. Under the influence of mortalityselection, therefore, estimates of the impact of the Leningrad famine based on data of survivors may be biased toward zero(Roseboom et al., 2000a). These different findings indicate a complex interplay between historical events, social forces, andbiological mechanisms, and highlight the importance of examining the famine effects in the unique Chinese context.
2.2. The 1959–1961 Chinese Famine and its short- and long-term health consequences
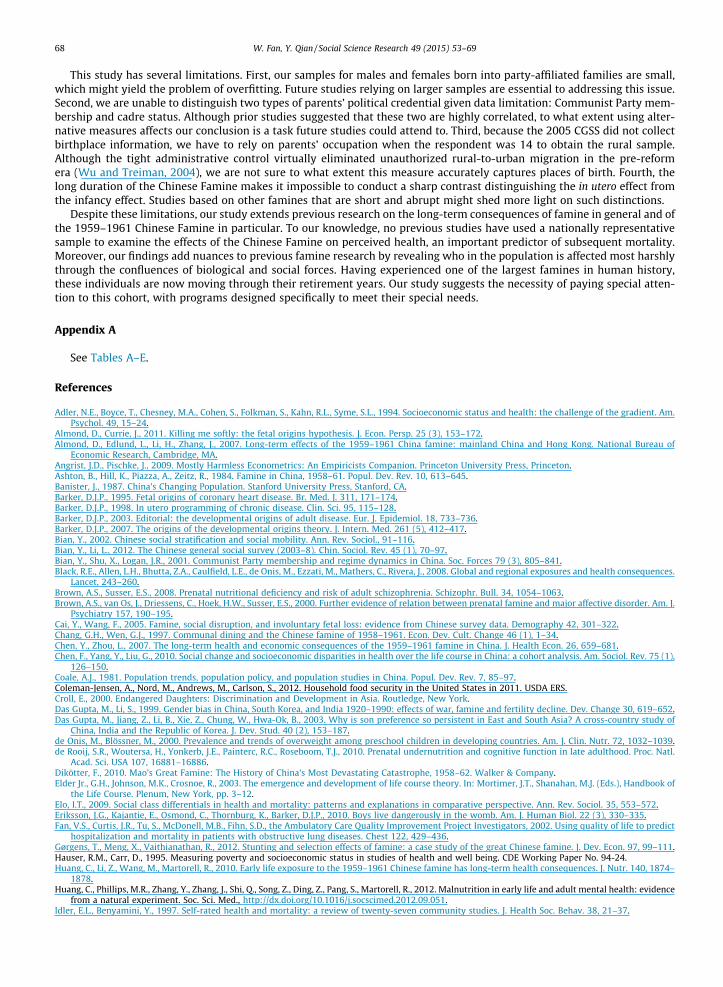
As one of the largest human catastrophes, the 1959–1961 Chinese Famine has received much scholarly attention. Lin andYang (2000) argued that the Chinese Famine was jointly determined by urban-biased policies and the decline in food avail-ability. To extract as much agricultural surplus as possible to facilitate the heavy industry-oriented development strategy,rural residents were forced to deliver quotas at prices set by the government, thus bearing most of the brunt of food supplyreduction (Coale, 1981; also see Fig. 1). Following previous studies (Chen and Zhou, 2007; Huang et al., 2012; Li et al., 2010;Meng and Qian, 2009; Mu and Zhang, 2011), we focus on the rural sample in our analysis. Key to our research, exposure tothe famine—determined by birth date and province of birth—is exogenous, enabling us to better identify the famine effect.
Earlier studies on the Chinese Famine revealed a sudden increase in mortality during the famine years (Fig. 1). The esti-mated total number of premature deaths during the famine ranged from 16.5 to 30 million (Ashton et al., 1984; Banister,1987; Coale, 1981; Peng, 1987; Yao, 1999). Retrospective data also revealed a sharp increase in miscarriages and stillbirthsduring that time (Cai and Wang, 2005).
In terms of long-term effects of the Chinese Famine, an analysis of the 1988 Chinese national fertility survey showed nodifferences in mortality up until the late 20s and early 30s among the 1954–1958 pre-famine cohort, the 1959–1962 faminecohort, and the 1963–1967 post-famine cohort (Song, 2009), which might be partially explained by mortality selection at

Fig. 1. Birth rates and death rates in rural and urban China; 1955–1966. (Source: Lin and Yang, 2000; Table 2, p. 145).
W. Fan, Y. Qian / Social Science Research 49 (2015) 53–69 55
earlier ages. Some studies found negative effects for other health outcomes. For example, drawing on data from the ChinaHealth and Nutrition Survey (CHNS) which covers selected provinces, Chen and Zhou’s (2007) difference-in-differences esti-mates showed that rural Chinese born in 1959 suffered most severely in terms of height reduction. Absent the famine, theywould have grown 3.03 cm taller. This effect did not go away even when mortality selection was explicitly controlled for(Gørgens et al., 2012). Similarly, Huang et al. (2010) found that famine exposure reduced the height of rural females bornin 1958 and 1959 by 1.7 and 1.3 cm, respectively, based on data collected from three provinces in China between 1993and 1996. Also using the difference-in-differences approach, Luo et al. (2006) reported that rural females born during thefamine years had a higher probability of being overweight. Meng and Qian (2009) adopted an instrumental variablesmethod; their two-stage-least-squares estimates revealed that exposure to famine at ages 1–3 reduced height by 1.3%(2.1 cm), weight by 4.4% (2.4 kg), and upper arm circumference by 3.4% (0.8 cm), but no effect was found for hypertension,BMI, or weight-for-height. In an ingenious design, Almond et al. (2007) reported that mothers born in 1961 on mainlandChina who later migrated to Hong Kong were 8% more likely to give birth to a child of low birth weight (<2500 g), whereasno significant effects were detected for their Hong Kong-born counterparts. To the extent that the emigrants are healthierand/or from more advantaged families, they might underestimate the true famine effect.
Although previous studies have examined a wide range of health outcomes including disability, obesity, height, weight,weight-for-height, hypertension, and mental health, the majority of them drew on samples collected from a few provinces,limiting generalizability. Further, few studies have examined perceived health (Lumey et al., 2011), despite the fact thatself-assessed health is a well-recognized predictor of subsequent mortality (Idler and Benyamini, 1997). To the best ofour knowledge, only one paper (Roseboom et al., 2003) has studied the effects of prenatal exposure to the Dutch famineon adults’ perceived health, finding those exposed to famine in early, but not mid or late, gestation more often rated theirhealth as poor, but no such study has been conducted in the context of China.
2.3. Gender differences in the famine effects on subsequent health
That males and females are affected by the famine differently is well established in previous studies. The long-term fam-ine effects appeared to be more pronounced among women than among men in China (Almond et al., 2007; Gørgens et al.,2012; Luo et al., 2006; Mu and Zhang, 2011; Ravelli et al., 1999; Yang et al., 2008). Significant famine effects were foundamong women but not among men on reduced height (Gørgens et al., 2012), higher incidence of disability (Mu andZhang, 2011), and higher odds of being overweight (Luo et al., 2006; Yang et al., 2008). Additionally, Huang et al. (2012)reported increased risk of mental disorders among female famine survivors, but either decreased or no risk of mental illnessamong male famine survivors. Early-life mortality selection and differential treatment offer two explanations for such gen-der differences (Mu and Zhang, 2011).
First, males biologically exhibit greater vulnerability to prenatal insult than females (Kline et al., 1989; Kraemer, 2000).Evidence of male’s higher excess mortality during natural disasters is well documented in China and elsewhere (seeMacintyre, 2002; Sen, 1981; Song, 2009). As a result, male survivors are more likely to come from the upper end of healthdistribution than female survivors, leading to a more attenuated long-term famine effect on men than on women.
Second, the differential treatment hypothesis suggests that hard times force parents to allocate limited resources to themore valued children (Das Gupta and Li, 1999). In traditional Chinese society this means the sons (Das Gupta et al., 2003), asonly sons can carry the family name, and sons instead of daughters are expected to provide support for elderly parents. Giventhe lack of a formal social security system in rural China, parents need to rear at least one son to care for them in their old age(Croll, 2000). Hence, boys may have received more food than their sisters, who then bore the brunt of malnutrition during

56 W. Fan, Y. Qian / Social Science Research 49 (2015) 53–69
the famine. In sum, despite pointing to different sources, both mortality selection and differential treatment lead us tohypothesize that rural women were more adversely affected by the Chinese Famine than rural men:
Hypothesis 1. Early-life exposure to the 1959–1961 Chinese Famine had more negative effects on perceived health inmidlife for rural females than for rural males.
2.4. Family background as a moderating context
Social disruptions such as famines, wars, and ethnic cleansing, and how the subsequent effects are distributed acrosssocial groups are the focus of many empirical studies. Strauss and Thomas (1998) showed that the heights of Vietnameseadult men and women increased very rapidly for those born between 1925 and 1955, but remained unchanged for the Viet-nam War cohort born from the mid 1950s to 1975. In particular, the stature of the poorest was hit hardest by the war. Thesefindings indicate that the identity of those who will suffer most from catastrophic events can be traced to an unequal dis-tribution of desirable resources, which follows a sociological logic (see also Link and Phelan, 1995). In the case of the ChineseFamine, the resource at stake is food. Who will suffer least from the famine can be determined by identifying who wasadvantaged in gaining access to food even when it was scarce.
Unlike Western society where education, income, and occupation loom large in access to a variety of resources (Elo,2009), the stratification system in rural China during the Maoist era was political in nature (Bian, 2002; Walder, 1989).Shortly after it came into power, the Chinese Communist Party destroyed the economy-based system and replaced it witha system of access to goods, jobs, and power based on political power, especially in rural areas.1 Political power took twoforms: membership in the Communist Party and employment in a cadre position. Party members were a select group, and dur-ing the Maoist era, were usually recruited from those who successfully demonstrated their loyalty to the party (Bian et al.,2001), for example, through a ‘‘good’’ family background as designated by the state and based on father’s or grandfather’s occu-pation (e.g., poor/lower-mid peasant or revolutionary military). A cadre position was one of political or administrative leader-ship, and these appointments were highly controlled by local party organizations even as recently as the late 1980s (Oi, 1989).Thus, cadres—especially those with real power—are usually party members (Morduch and Sicular, 2000; Wu and Treiman,2004).
Compared with ordinary peasants, those tightly connected with the Communist Party had preferential access to valuableresources and were in a much more strategic position to use the system for their own personal benefit. In other words, evensome born during the famine years escaped severe deprivation because the household belonged to a more powerful class andhad more access to food. For example, at the commune level, party cadres were awarded a higher ration of food than thosethey managed, and they were also permitted to exceed their shares (Thaxton, 2008). Further, anecdotal evidence suggeststhat during the famine, local party cadres often abused their power by illegally trading food with others in their politicalnetworks, inflating the amount of rations their district required and appropriating the surplus, distorting the transfer anddistribution of food to peasants by stealing. In essence, they saved themselves and their families at the expense of ordinarypeasants who had no political power (Dikötter, 2010; Thaxton, 2008).
Given this evidence, we hypothesize that the long-term famine effects are moderated by family background, especiallyamong male famine survivors, for two reasons. First of all, recent studies suggest that males are more susceptible to adversechildhood circumstances such as food shortage. Salonen et al. (2009) found that lower SES during childhood measuredthrough father’s occupation was associated with higher BMI only in men, and their explanation is that the nutrition of boysin utero is more dependent on mothers’ diet in pregnancy, whereas the nutrition of girls relies more on maternal proteinmetabolism (as reflected in mothers’ height) (Eriksson et al., 2010). Second, given the preference for sons in rural China, par-ents were less likely to allocate food, if they had any, to girls than to boys. In other words, girls were not likely to be well-fedregardless of family background, particularly during a famine with increased resource constraints, whereas access to foodmight differ by family circumstances, to some extent, among boys. Thus, we hypothesize that the buffering role of familybackground is more pronounced for males:
Hypothesis 2. Early-life exposure to the 1959–1961 Chinese Famine had more negative effects on perceived health inmidlife for those born into non-party-affiliated families than for those born into party-affiliated families, especially amongmales.
1 One reviewer raised the issue that, even in the era before China’s economic reform in 1978, family background was determined by multiple factors, such aswork sectors (state vs. non-state owned), occupation, education, and military experience. It is true that occupation and work sectors played a prominent role indetermining one’s life chances in urban China (see Lin and Bian, 1991), but these two indicators were not relevant in rural China until the rise of the townshipand village enterprises in the 1980s, before which off-farm employment was not an option for rural residents (Bian, 2002). Indeed, in the CGSS (data used forour analysis), no further questions were asked regarding respondents’ parents’ work unit if their parents’ occupation was ‘‘doing farm work.’’ Education was adubious resource during the Maoist era given the top leaders’ inherent skepticism toward intellectuals (Bian, 2002; Walder, 1989), as evidenced by their lastranking among all nine ‘‘black’’ (or ‘‘bad’’) officially-designated family background categories. Thus, the better educated were unlikely to have advantages infood access during the famine. Indeed, in Appendix Table A, we used parental education to measure family background, but no significant difference in famineeffects was found between those whose parents had more or less education. The Appendix shows junior high school as a cutoff point, but using primary schoolor senior high school yields the same pattern. (Results available upon request). This confirms that education was not the key dividing line in rural China’s socialstratification system during the Maoist era.

W. Fan, Y. Qian / Social Science Research 49 (2015) 53–69 57
2.5. Long-term socioeconomic consequences of early-life exposure to the famine
A nutritional shortage may have adverse effects on educational and economic outcomes. However, existing literature isscarce and yields inconsistent findings regarding the famine effect on adult SES. No systematic influence of the Dutch faminewas found on cognitive ability or income later in life (Stein, 1975; Scholte et al., 2012). Studies drawing on rural samplesreported that the 1959–1961 Chinese Famine had no effect on working hours (Meng and Qian, 2009; Shi, 2011), but ledto reduced educational attainment, labor force participation, and farming income (Almond et al., 2007; Chen and Zhou,2007; Meng and Qian, 2009). Given the mixed evidence, we tentatively develop our last hypothesis:
Hypothesis 3. Early-life exposure to the 1959–1961 Chinese Famine led to lower SES in adulthood for the rural population.
3. Data and methods
3.1. Data
We use data from the 2005 Chinese General Social Survey (CGSS). Initiated in 2003, the CGSS is an annual or biannualsurvey that provides rich information on Chinese people’s socioeconomic achievement and quality of life. The 2005 CGSSwas carried out jointly by the Hong Kong University of Science and Technology and Renmin University of China. It used mul-tistage stratified random sampling to generate a nationally representative sample of the adult population in both rural andurban China (Bian and Li, 2012). The sample consists of 10,372 individuals ages 18 to 69, with 6098 and 4274 individualsfrom urban and rural areas, respectively. The 2005 CGSS is ideal for our study because of its relatively large sample size,national coverage, and detailed information on socio-demographic characteristics and health measures.
3.2. Sample
The analytic sample for this study consists of 1716 individuals born in rural areas from 1955 to 1966. Because the 2005CGSS did not collect information on place of birth, largely following Qian and Hodson (2011), we use both father’s andmother’s occupation to determine whether respondents were born in rural or urban areas. If both parents were ‘‘doing farmwork’’ when the respondent was 14, we classify the respondent as born in a rural area, which is appropriate given the raresocial and geographic mobility before the late 1970s and the Chinese tradition of children living with their fathers.2
We define those born in 1955–1958 as the pre-famine cohort, those born in 1959–1962 as the famine cohort, and thoseborn in 1963–1966 as the post-famine cohort. People born in 1962 are included in the famine cohort because some of themwere in gestation during the famine that lasted through late 1961. Due to the lack of information on birth month, we cannotdistinguish who in the 1962 birth cohort had prenatal famine exposure and who did not. A similar problem exists for the1959 birth cohort. To the extent that the misclassified persons (i.e., persons born in 1959 or 1962) are more akin to thepre-famine (or post-famine) than to the famine cohort, we underestimate the true famine effect. Another problem is selec-tion at birth. The birth rate declined by nearly 50 percent during the famine compared with ‘‘normal’’ years (Ashton et al.,1984; also see Fig. 1). Were more advantaged or healthy couples more likely to delay childbearing, thereby confounding therelationship between early-life exposure to famine and later health? Almond et al. (2007) used census data reporting that the1959–1961 cohort were born to better educated mothers than adjacent cohorts, and healthier parents were more likely tosucceed in giving birth during the famine. The latter suggests an underestimate of the true famine effects. To test whetherour results were sensitive to education-based fertility selection, we controlled for parents’ education in Appendix Table B,but no substantive change was observed.
3.3. Measures
3.3.1. OutcomesThe 2005 CGSS surveyed eight health measures based on the SF-36 instrument. The SF-36 is a commonly used instrument
with 36 items measuring health-related quality of life across eight dimensions of health (Ware, 2000), which are powerfulpredictors of hospitalization, morbidity, and mortality (Fan et al., 2002; Lowrie et al., 2003; Rumsfeld et al., 1999). Further,the Chinese SF-36 has been validated as a reliable instrument for evaluating both physical and mental health status (Wanget al., 2008).
The original wordings for the eight health measures in the 2005 CGSS are: During the past month, (1) How would you rateyour health in general? (self-rated health) (2) Has your health limited your daily life, e.g., walking, or stair climbing?
2 As one reviewer pointed out, the Up to the Mountains and Down to the Countryside Movement initiated in 1968 lasted until the late 1970s and sent manyurban dwellers to the countryside. The majority were teenagers who finished senior high school (usually ages 15–18), but a small portion were intellectuals intheir 30s and 40s. Thus, we may have misclassified a handful of their urban-born children in our sample. Using both parents’ occupations alleviates this issue,but to the extent that urban-born individuals had briefer and less severe famine exposure than the rural-born, our estimates can be conceived as a lower boundof the true famine effect.

58 W. Fan, Y. Qian / Social Science Research 49 (2015) 53–69
(physical functioning) (3) Has your health limited your work, within or outside household? (role-physical) (4) Do you feelany pain in your body? (bodily pain) (5) How would you rate your energy in general? (vitality) (6) Have you been botheredby emotional problems such as feeling anxious, depressed, or irritable? (mental health) (7) Has your physical and emotionalhealth limited your social activities with family, friends, neighbors, or groups? (social functioning) and (8) Has youremotional health limited your usual activities related to work, study, or others? (role-emotional).
Factor analysis shows that the eight items reflect a single underlying concept, based on the Kaiser criterion of retainingthose factors with eigenvalues of at least 1 (Rust and Golombok, 2009). Therefore, we sum up the eight items to create onecomposite measure—general health, the health outcome used for the following analysis. When constructing the generalhealth measure, we reverse-coded the eight items so that higher scores indicate better health. We also rescaled the self-ratedhealth and bodily pain items from 1–6 to 1–5, so that each of the eight items contributed an equal share to the compositemeasure. The Cronbach’s alpha for this measure is 0.94, indicating high reliability.
Socioeconomic status in adulthood is measured through years of schooling and personal income in year 2004, two indicatorswidely used to capture individual SES (Adler et al., 1994; Hauser and Carr, 1995). We take the natural log of income to correctfor right skewness.
3.3.2. Explanatory variablesAs will be elaborated in Section 3.4. Analytical Strategy, we exploit both temporal and geographic variations in famine
intensity. Temporal variation is captured by birth cohort as described in Section 3.2. Sample. Geographic variation is cap-tured by the province-level excess death rate provided in Huang et al. (2012), and is calculated as the gap between the deathrate in famine years (1959–1961) and the average death rate in the three years before the famine (1956–1958). The severityof the famine varied considerably and idiosyncratically across the 26 provinces in our analytic sample (out of mainlandChina’s 29 provinces at the time),3 ranging from 0.13 per thousand in Shannxi to 28.63 per thousand in Sichuan. We also exper-imented with three other measures of famine intensity: excess death rate (Yang, 1998, mortality difference between 1960 andnon-famine years 1956–1958), cohort size shrinkage index (Huang et al., 2012), and fertility reduction index (Huang et al.,2012). These different indices were highly correlated at the provincial level (Huang et al., 2012); not surprisingly, our resultsdid not change substantively with alternative measures of famine intensity (see Appendix Table C). To confirm that the excessdeath rate is not capturing variations across provinces in other key determinants of health such as economic development orhealth infrastructure, we tested for changes in physicians per 10,000 population and hospital beds per 10,000 population from1956–1958 to 1959–1961.4 Neither was associated with province-level famine intensity (p = .75 and .16 from Spearman’s ranktest, respectively). We did not find a good economic indicator due to data limitation, but Meng and Qian (2009) reported thatthe grain procurement system caused the famine to be severer in regions that typically produced more grain (usually the moreeconomically developed areas).
3.3.3. ModeratorsWomen and men, as well as individuals from different family backgrounds, were affected by the Chinese Famine in dif-
ferent ways, given the strong preference for sons and the decisive role of political power in shaping life chances during theMaoist era (Dikötter, 2010; Thaxton, 2008; Walder, 1989). To reflect such contextual differences, we run separate models forthe following four groups: males born into party-affiliated families, males born into unaffiliated families, females born intoparty-affiliated families, and females born into unaffiliated families. If respondents had at least one parent who was a Com-munist Party member when they were 14 years old, these respondents are coded as born into party-affiliated families. Ifrespondents had no parent with Communist Party membership, they are coded as born into unaffiliated families (or non-party-affiliated families). Given our lack of knowledge regarding the exact year that parents became party members, it ispossible that some parents joined the party after respondents were born. But note that the key here is the connection tothe Communist Party apparatus and access to resources as a result of such ties. Thus our construction of party-affiliatedvs. unaffiliated families should not pose an issue; even those parents who joined the party after having children should stillbe more connected with the party than unaffiliated residents (see Bian et al., 2001 for a discussion on the persistent politicalscreening involved in becoming party members until the early 1990s). The 2005 CGSS does not allow us to distinguish cadresand party members as no information was collected on parents’ cadre status. However, given that rural cadres were usuallyselected from party members (Morduch and Sicular, 2000; Wu and Treiman, 2004), we expect a similar pattern when usingparental cadre status as the contextual factor. Lastly, given the small sample size for those born into party-affiliated families,we caution any over-interpretation of our findings.
3 The 2005 CGSS did not survey Ningxia, Qinghai, and Tibet, three western provinces that had low to average levels of famine intensity.4 Both measures come from the China Data Center at the University of Michigan (http://chinadatacenter.org), an international center that integrates Chinese
historical, social, and natural science data. In an email exchange, a staff member replied that these two measures were obtained from the National Bureau ofStatistics of China. As one reviewer pointed out, the reliability of the data, especially of those collected during the famine period, is open to question. But notethat the interest here is changes from pre-famine to famine periods across provinces; to the extent that bias resulted from data recording or reporting was stableeither over time or across provinces, our general findings should not be hampered.

W. Fan, Y. Qian / Social Science Research 49 (2015) 53–69 59
3.4. Analytical strategy
To identify the effects of early-life under-nutrition due to famine, one strategy is to take advantage of both the temporaland geographic variation in famine intensity (see Chen and Zhou, 2007; Huang et al., 2012; Luo et al., 2006). Specifically, onecould track health outcomes for individuals residing in less severely affected provinces born during/before and after the fam-ine, and then compare these differences with the corresponding differences for individuals residing in more severely affectedprovinces. This comparison produces the difference-in-differences estimator (DID) (Angrist and Pischke, 2009):
5 Wefaminethe famprovincprovinctherefowhethe
D2 ¼ ðYFAMINESevere � YPOST
SevereÞ � ðYFAMINELess Severe � YPOST
Less SevereÞ; ð1Þ
where the subscript ‘‘Severe’’ denotes residing in a province that was severely affected by the Chinese Famine (as measuredby excess death rate), and the superscript denotes born in the famine period or after the famine period. Y indicates the out-comes (i.e., general health, years of schooling, and logged income). The estimator in Eq. (1) assumes that, were it not for theChinese Famine, differences in adult health/SES between famine- and post-famine-cohort would have been similar acrossprovinces.
The DID estimates can be conveniently computed in the regression framework using a continuous measure of famineseverity level:
Yij ¼ b0 þ b1preij þ b2famij þ b3edrj þ c1ðedrj � preijÞ þ c2ðedrj � famijÞ þX26
k¼1
dkpj þ eij ð2Þ
where Yij denotes the health (Hypotheses 1 and 2) or SES (Hypothesis 3) outcomes for individual i born in province j. pre andfam are two dichotomous variables indexing pre-famine cohort and famine cohort, respectively (post-famine cohort as thereference group). We use excess death rate, edrj, to proximate province-level famine severity. To further ensure that ourresults are not driven by unobservable differences across provinces, we include province fixed effects (pj) whenever the sam-ple size is large enough (i.e., except when the samples are men or women from party-affiliated families).5 Key to the currentstudy is c2, the coefficient for the interaction term, which, in the DID setting, captures the effect of famine exposure in utero orinfancy on health/SES in adulthood.
We use ordinary least squares (OLS) regressions, and adjust for age in all models given the life course patterns of bothhealth and SES outcomes. The standard errors are clustered at the provincial level to account for correlation between obser-vations within the same province. Missing data (mostly income) do not exceed 6% for any variable, so we report modelswhere listwise deletion is used.
4. Results
4.1. Descriptive statistics
Table 1 reports descriptive statistics by cohorts and gender. Slightly more than half (54%) of the respondents are women.Respectively, 589 (34%), 413 (24%), and 714 (42%) individuals are from pre-famine, famine, and post-famine cohorts. Overall,men report significantly higher scores than women for all health indicators. When disaggregated by birth cohorts, pre- andpost-famine cohort men have significantly better health than women from the same cohort for all health measures, whereasin the famine cohort, self-rated health and mental health do not significantly differ by gender, suggesting attenuated genderdifferentials in health for this cohort. Additionally, men have higher adult SES than women, as measured by education andincome, while family background measured through parental party membership shows no significant gender difference.
4.2. Long-term famine effects on mid-life health
Models 1 and 2 in Table 2 present DID estimates for men and women, respectively. The 1959–1961 Chinese Famine didnot appear to affect men’s mid-life health (Model 1), but as expected in Hypothesis 1, famine had a significantly adverseeffect on mid-life health for women: each additional 1‰ increase in excess death rate due to the famine resulted in a loweredgeneral health by .193 point (p < .01, Model 2) among females born during the famine, compared with females born after thefamine. These estimates take into account time-invariant differences between provinces and any inherent cohort differences.To put this into perspective, consider two provinces—Sichuan (excess death rate 28.63‰), a severely affected province, andHeilongjiang, a less severely affected province (excess death rate 1.75‰). For no other reason than being born in Sichuan, the
thank a reviewer for this suggestion. Note that, when the province dummies are not added, the main effect of excess death rate can be interpreted as theeffects for those who were born after the famine, which should not be significant given that members from the post-famine cohort were not exposed toine, and this is indeed what we found (results available upon request). However, this interpretation no longer holds if we additionally control fore fixed effects because it requires one to think of a situation when excess death rate can change from one value to another while at the same time thee dummies are fixed at a given value, which does not make empirical sense given that excess death rate is a time-invariant province-level variable. Were do not present the main effects of excess death rate so as not to confuse readers. Our main findings, however, are substantively the same no matterr we include province fixed effects or not (results available upon request).

Table 1Descriptive statistics, by cohort and gender.
Total (N = 1716) Pre-famine cohort(N = 589)
Famine cohort (N = 413) Post-famine cohort(N = 714)
Men(N = 791)
Women(N = 925)
Men(N = 308)
Women(N = 281)
Men(N = 184)
Women(N = 229)
Men(N = 299)
Women(N = 415)
OutcomesHealth
General Health Scale (8–40)
33.16 31.28*** 32.65 29.96*** 32.78 31.23* 33.93 32.21***
(6.35) (6.75) (6.27) (7.00) (6.71) (6.59) (6.15) (6.53)Self-rated health (1–5) 3.64 3.39*** 3.61 3.21*** 3.54 3.43 3.73 3.49**
(1.09) (1.07) (1.07) (1.06) (1.09) (1.05) (1.10) (1.08)Physical functioning (1–5)
4.37 4.15*** 4.31 3.98*** 4.34 4.11* 4.45 4.29*
(0.90) (0.96) (0.90) (1.01) (0.96) (0.94) (0.86) (0.91)Role-physical (1–5) 4.35 4.14*** 4.26 3.94*** 4.32 4.11* 4.46 4.29*
(0.93) (0.99) (0.92) (1.06) (0.99) (0.94) (0.89) (0.93)Bodily pain (1–5) 4.21 4.00*** 4.14 3.86** 4.17 3.94* 4.32 4.12*
(1.05) (1.06) (1.07) (1.09) (1.10) (1.06) (0.99) (1.03)Vitality (1–5) 3.78 3.53*** 3.72 3.36*** 3.70 3.48* 3.90 3.66**
(1.05) (1.07) (1.04) (1.09) (1.11) (1.05) (1.01) (1.06)Mental health (1–5) 4.08 3.85*** 4.04 3.77** 4.00 3.86 4.18 3.89***
(0.97) (1.03) (0.96) (1.07) (0.99) (0.99) (0.97) (1.02)Social functioning (1–5) 4.37 4.12*** 4.31 3.93*** 4.35 4.16* 4.44 4.23**
(0.86) (0.94) (0.85) (0.98) (0.92) (0.93) (0.84) (0.91)Role-emotional (1–5) 4.35 4.11*** 4.27 3.92*** 4.35 4.14* 4.44 4.22**
(0.88) (0.96) (0.88) (1.01) (0.89) (0.90) (0.87) (0.94)
SESYears of schooling 8.35 6.11*** 7.95 5.22*** 9.00 6.03*** 8.35 6.77***
(3.64) (4.27) (3.66) (4.56) (3.45) (4.27) (3.70) (3.94)Logged personal incomein 2004
8.46 7.69*** 8.32 7.54*** 8.55 7.61*** 8.55 7.83***
(1.34) (1.88) (1.33) (2.09) (1.36) (1.80) (1.35) (1.78)
PredictorsExcess death rate (‰) 8.06 7.97 – – – – – –
(7.50) (7.68) – – – – – –Parent’s party membership 0.09 0.09 0.09 0.10 0.11 0.07 0.08 0.10
(0.29) (0.29) (0.29) (0.30) (0.32) (0.25) (0.28) (0.30)Age 44.62 43.93*** 48.71 48.67 44.28 44.07 40.62 40.64
(3.73) (3.60) (1.15) (1.12) (1.18) (1.13) (1.10) (1.12)
Notes: 1. For each variable, the first row shows means and the second row shows standard deviations.2. We test whether there is gender difference within each of the following samples: total sample, pre-famine-cohort, famine-cohort, and post-famine-cohort. Results are shown in columns denoting coefficients for "Women".*** p < 0.001.
** p < 0.01.* p < 0.05.
60 W. Fan, Y. Qian / Social Science Research 49 (2015) 53–69
reduction in general health score was on average 5.19 points (=.193 * [28.63 � 1.75]) higher for Sichuan-born females thanfor females born in Heilongjiang.
In Models 3–6 in Table 2, we disaggregate the sample into four groups based on gender and parental party membership. Apostestimation test (achieved via the ‘‘suest’’ command in Stata) indicates that the coefficients of the DID interaction termsfor the four groups are significantly different from one another (p = .0047). In particular, we find that the Chinese Famine hadsignificantly adverse effects on mid-life health for males born into party-affiliated families. Recall Model 1 showed thatmales as a whole were not affected by early-life exposure to the famine, but this null finding obscures heterogeneity alongthe dimension of family background. Among men whose parents were party members, each additional 1‰ difference inexcess death rate led to a lower general health of males born during the famine by .513 point (p < .001, Model 4), comparedwith males born after the famine, while no significance was found for males whose parents were not party members (Model3). Although insignificant, the famine effect on mid-life health appears to be positive among males born into non-party-affil-iated families (.007, not significant, Model 3), probably due to high mortality selection within this group (Huang et al., 2012).A postestimation test shows that the difference of the interaction terms in Models 3 and 4 is significant (p = .0013), suggest-ing that for males, the effects of early-life under-nutrition are contingent on family background. Mortality selection is onepotential explanation and we provide supportive evidence below.
A different pattern emerges for females. We find the famine effect is significant and negative only for those born into non-party-affiliated families; each additional 1‰ increase in excess death rate brought about by the famine widens the mid-lifehealth disadvantage of the famine cohort by .211 point (p < .05, Model 5) vis-à-vis those born after the famine. Unlike males,however, for females the difference in the interaction terms between Models 5 and 6 does not reach significance based on apostestimation test (p = .364). This indicates that early-life under-nutrition adversely affected women’s mid-life health,

Table 2Difference-in-differences estimates of famine effects on mid-life perceived health, based on OLS regressions.
Model1: men
Model 2:women
Model 3: men, non-party-affiliated families
Model 4: men, party-affiliated families
Model 5: women, non-party-affiliated families
Model 6: women, party-affiliated families
Cohort (Ref. = Post-famine cohort)
Pre-faminecohort
�2.084 �2.161 �1.627 �8.506* �2.586 �0.465
(1.571) (1.499) (1.490) (3.902) (1.655) (6.003)Famine cohort �1.327 0.562 �1.199 �4.159 0.649 �0.894
(1.113) (0.811) (1.180) (2.573) (0.912) (4.383)EDR *
Pre-faminecohort
�0.023 0.088 �0.037 �0.072 0.094 0.145
(0.058) (0.068) (0.050) (0.145) (0.085) (0.146)Famine cohort �0.031 �0.193** 0.007 �0.513*** �0.211* 0.031
(0.062) (0.066) (0.087) (0.116) (0.079) (0.221)Age 0.093 �0.079 0.059 0.838 �0.049 �0.233
(0.159) (0.181) (0.158) (0.542) (0.193) (0.675)Constant 23.383** 22.480** 24.622*** 2.114 21.616* 41.033
(6.372) (7.696) (6.394) (22.741) (8.131) (26.980)Observations 791 925 716 75 840 85
Notes: 1. We do not show estimates for the main effect of excess death rate (see footnote 5 in the text). Estimates for province fixed effects are not shown forModels 1–3 or Model 5 for simplicity. Robust standard errors clustered at the province level are shown in parentheses.2. Postestimation tests of the EDR * Famine-Cohort interaction terms across models: M3 = M4 = M5 = M6 (p = .0047); M3 �M4 = M5 �M6 (p = .0433);M3 = M4 (p = .0013); M5 = M6 (p = .3640).*** p < 0.001,
** p < 0.01.* p < 0.05.
W. Fan, Y. Qian / Social Science Research 49 (2015) 53–69 61
regardless of their family background, a pattern significantly different from what is observed in men (p = .043). Taken as awhole, we find both supportive and contradictory evidence of Hypothesis 2: there are gender differentials in the moderatingrole of parental party membership, but contrary to our hypothesis, advantageous family backgrounds either intensify thenegative famine effects (for males) or have no modifying role (for females).
In contrast to what has been found for the famine cohort, we observe neither statistically significant nor substantivelyimportant famine effects for the pre-famine cohort (the pre by edr interaction), despite their longer exposure to the famine.This lends support to the idea that it is the timing of exposure to adverse environments—in utero and/or early infancy—thatlargely determines health in later life.
Table 2 presents the adverse famine effects using a cohort categorization to capture the temporal variation in famineintensity. Is there a particular year of birth that made a single-year birth cohort particularly vulnerable? Replacing thetwo cohort indicators with birth year dummies (1955, 1956, . . ., 1962), in Appendix Table D we show that males born intoparty-affiliated families in 1959 (�1.943, p < .001) and 1960 (�.550, p < .01), and females born into non-party-affiliated fam-ilies in 1961 (�.401, p < .1) and 1962 (�.349, p < .01) were significantly and negatively affected by the famine. Further, asevidence suggests that the Chinese Famine began as early as 1958 (Ashton et al., 1984; Chang and Wen, 1997), we conducteda sensitivity analysis wherein the 1958 birth cohort is coded as in the famine cohort. Results do not change for males, but thefamine effect for females born into non-party-affiliated families is no longer significant (see Appendix Table E). We considerthe implication of these findings in Section 5.
4.3. Long-term famine effects on mid-life health: quantile regression
Famine effects may be different for survivors located in different areas in the health distribution (Chen and Zhou, 2007;Meng and Qian, 2009). To capture these differences, we estimate quantile regressions (from the 20th to the 80th percentile)via the ‘‘qreg’’ command in Stata. The estimation method is similar to OLS, but instead of minimizing sum of squared resid-uals it minimizes sum of absolute residuals; we use asymptotical standard errors. Note that in quantile regressions, ‘‘quan-tile’’ refers to those of the dependent variable, general health.
In general, famine effects on mid-life health as estimated from survivors are a function of two components: scarring effectand mortality selection. The former captures the long arm of early-life insults, while the latter is difficult to quantify withoutdetailed information on the famine-induced deaths. Quantile regressions can be helpful in at least assessing the extent ofmortality selection (Meng and Qian, 2009). Assuming that the strongest survive, mortality selection should be largest inlower quantiles, those who are the least healthy. As such, with heightened levels of mortality selection as typically occurredduring the famine, the estimated effects of the famine on mid-life health should be attenuated toward zero or even becomepositive in the lower quantiles because, in this area, we are comparing individuals in the ‘‘control’’ group (post-famine

62 W. Fan, Y. Qian / Social Science Research 49 (2015) 53–69
cohort) with those in the ‘‘treatment’’ group (famine cohort), who would be healthier on the distribution absent the famine-induced selection. In contrast, the mortality selection bias is smaller for individuals in the higher quantiles because thoseindividuals have more comparable ‘‘control’’ groups. Empirically, this means that higher mortality selection can be inferredif more attenuated (than the average) or even positive famine effects are observed in lower quantiles but not in higherquantiles.
For social groups constructed by gender and parental party membership, Fig. 2 plots estimates of their respective famineeffects (i.e., interaction terms between famine cohort and excess death rate) from quantile regressions, denoted by circlesand connected by a solid line, with the 95% point-wise confidence bands represented by the gray area around the solid line.The dashed horizontal lines represent the average famine effects derived from Table 2. We combine women from party-affiliated and the unaffiliated families, given that the famine effects do not differ between the two groups.
The contrast between men from the unaffiliated families and men from party-affiliated families is striking as shown inFig. 2. The quantile-specific famine effects track closely with the dotted average level for the former group. More impor-tantly, we observe a decline in famine effects from positive to negative in the lower quantiles (from 20th to 40th), lendingsome support to mortality selection. Males born into party-affiliated families, however, are adversely affected by early-lifeexposure to the famine across the board, with such effects particularly strong in the lower quantiles (below the dotted aver-age level) and gradually attenuated in the higher quantiles. This suggests that among males born into party-affiliated fam-ilies, the least strongest suffered greatly from the famine, but unlike their counterparts whose parents had no politicalpower, they managed to survive, possibly facilitated by their parents’ advantage in access to food. The pattern is less clearfor women, among whom the famine effects do not seem to vary much across quantiles, probably because of females’ bio-logical survival advantage. Taken as a whole, these quantile regression results provide suggestive evidence of mortalityselection for males from non-party-affiliated families, although the results should be interpreted with caution given smallsample sizes and wide confidence intervals at some quantiles.
Fig. 2. Quantile regression estimates of famine effects: by gender and family background.

W. Fan, Y. Qian / Social Science Research 49 (2015) 53–69 63
4.4. Long-term famine effects on schooling years and income
For both genders and regardless of parental party membership, being born during the 1959–1961 Chinese Famine had noeffects on schooling years or income (Table 3), except marginal evidence that women from non-party-affiliated families werenegatively affected in terms of their income (�.040, p < .1, Model 3 in Panel B). Therefore, Hypothesis 3 is rejected.
5. Discussion
This paper exploits temporal and geographic variations in the severity of the 1959–1961 Chinese Famine to estimate thelong-term health and socioeconomic consequences of early-life under-nutrition. We use a sample of 1716 individuals born inrural China from 1955 through 1966 from a nationally representative dataset, and examine a composite self-perceived gen-eral health measure composed of eight dimensions (self-reported health, physical functioning, role-physical, bodily pain,vitality, mental health, social functioning, and role-emotional). Employing the difference-in-differences technique, our find-ings indicate that exposure to acute under-nutrition early in life had negative effects on health in midlife, especially formales born into party-affiliated families and females regardless of their parents’ party membership. Our findings echo thekey principles of the life course perspective that emphasize the role of timing and contexts of life experiences in shapingsubsequent life chances (Elder et al., 2003; Umberson et al., 2010).
First of all, the timing of famine exposure matters for mid-life health. The Chinese Famine lasted three years, rendering itchallenging to conduct a sharp contrast distinguishing the in utero effect from the infancy effect (Almond and Currie, 2011).
Table 3Difference-in-differences estimates of famine effects on schooling years and income, based on OLS regressions.
Model 1: men, non-party-affiliated families
Model 2: men, party-affiliated families
Model 3: women, non-party-affiliated families
Model 4: women, party-affiliated families
Panel A: schooling yearsCohort (Ref. = Post-famine cohort)
Pre-famine cohort �0.148 4.927 �0.930 0.225(1.098) (3.306) (0.700) (4.033)
Famine cohort 0.393 5.428* �0.307 1.462(0.716) (2.061) (0.674) (2.660)
EDR *Pre-famine cohort �0.051 �0.038 �0.060+ �0.073
(0.053) (0.185) (0.030) (0.098)Famine cohort 0.004 �0.096 �0.059 �0.064
(0.069) (0.170) (0.035) (0.106)Age �0.010 �0.611 �0.036 �0.205
(0.110) (0.456) (0.112) (0.459)Constant 21.240*** 33.877+ 30.306*** 15.979
(4.378) (18.667) (4.902) (18.521)Observations 716 75 840 85R-squared 0.098 0.135 0.154 0.052
Panel B: income (logged)Cohort (Ref. = Post-famine cohort)
Pre-famine Cohort 0.259 �1.590+ �0.216 1.961(0.292) (0.913) (0.489) (1.746)
Famine cohort 0.169 �0.555 0.134 �0.754(0.217) (0.418) (0.245) (1.563)
EDR *Pre-famine cohort 0.010 0.049 �0.033 �0.045
(0.029) (0.045) (0.022) (0.028)Famine cohort 0.007 0.053 �0.040+ 0.062
(0.029) (0.035) (0.021) (0.065)Age �0.067+ 0.003 0.005 �0.195
(0.037) (0.085) (0.045) (0.176)Constant 13.640*** 9.518* 19.046*** 16.125*
(1.575) (3.418) (1.866) (6.913)Observations 685 74 776 78R-squared 0.141 0.187 0.173 0.099
Note: We do not show estimates for the main effect of excess death rate (see footnote 5 in the text). Estimates for province fixed effects are not shown forModels 1 and 3 for simplicity. Robust standard errors clustered at the province level are shown in parentheses.*** p < 0.001.** p < 0.01.
* p < 0.05.+ p < 0.1.

Table ADifference-in-differences estimates of famine effects on midlife perceived health across parental educational groups, based on OLS regressions, Junior HighSchool (JH) as the cutpoint.
Model 1: men, parents < JH Model 2: men, parents P JH Model 3: women, parents < JH Model 4: women, parents P JH
Cohort (Ref. = Post-famine cohort)Pre-famine cohort �1.008 �12.005* �2.564 3.928
(1.576) (4.384) (1.827) (5.016)Famine cohort �0.557 �6.778** 0.387 1.963
(1.166) (2.118) (0.951) (3.632)
EDR *Pre�faminecohort
�0.019 �0.074 0.113+ �0.628**
(0.058) (0.170) (0.056) (0.203)Famine cohort �0.032 �0.008 �0.198* �0.259
(0.067) (0.107) (0.074) (0.276)Age �0.015 1.229* �0.036 �0.281
(0.154) (0.483) (0.213) (0.645)Constant 27.639*** �14.496 20.288* 42.689
(6.152) (20.031) (8.945) (25.919)Observations 691 86 806 100
Notes: 1. We do not show estimates for the main effect of excess death rate (see footnote 5 in the text). Estimates for province fixed effects are not shown forModels 1 and 3 for simplicity. Robust standard errors clustered at the province level are shown in parentheses.2. Postestimation tests of the EDR * Famine-Cohort interaction terms across models: M3 = M4 = M5 = M6 (p = .4026); M3 �M4 = M5 �M6 (p = .7737);M3 = M4 (p = .8517); M5 = M6 (p = .8316).*** p < 0.001.
** p < 0.01.* p < 0.05.+ p < 0.1.
Table BDifference-in-differences estimates of famine effects on mid-life perceived health, based on OLS regressions, parents’ schooling years as an additional covariate.
Model 1:men
Model 2:women
Model 3: men, non-party-affiliated families
Model 4: men, party-affiliated families
Model 5: women, non-party-affiliated families
Model 6: women,party-affiliated families
Cohort (Ref. = Post-famine cohort)Pre-faminecohort
�2.080 �2.339 �1.609 �8.370* �2.745 �1.147(1.617) (1.507) (1.574) (3.949) (1.648) (6.127)
Faminecohort
�1.297 0.581 �1.135 �3.994 0.646 �1.159(1.122) (0.788) (1.200) (2.687) (0.884) (4.524)
EDR *Pre-famineCohort
�0.023 0.083 �0.037 �0.069 0.090 0.112(0.060) (0.068) (0.053) (0.148) (0.085) (0.133)
Faminecohort
�0.021 �0.208** 0.016 �0.522*** �0.223** 0.015(0.061) (0.067) (0.089) (0.128) (0.079) (0.218)
Age 0.113 �0.023 0.078 0.835 �0.001 �0.069(0.162) (0.183) (0.162) (0.557) (0.198) (0.696)
Schoolingyears ofparents
0.139* 0.154* 0.132 0.123 0.133* 0.198(0.065) (0.063) (0.082) (0.159) (0.056) (0.141)
Constant 22.034** 18.577* 23.332** 1.708 18.203* 33.194(6.486) (7.780) (6.508) (23.451) (8.381) (28.039)
Observations 777 906 702 75 822 84
Notes: 1. We do not show estimates for the main effect of excess death rate (see footnote 5 in the text). Estimates for province fixed effects are not shown forModels 1–3 or Model 5 for simplicity. Robust standard errors clustered at the province level are shown in parentheses.2. Postestimation tests of the EDR * Famine-Cohort interaction terms across models: M3 = M4 = M5 = M6 (p = .0107); M3 �M4 = M5 �M6 (p = .0435);M3 = M4 (p = .0021); M5 = M6 (p = .3601).+ p < 0.1.*** p < 0.001.
** p < 0.01.* p < 0.05.
64 W. Fan, Y. Qian / Social Science Research 49 (2015) 53–69
Nevertheless, we show that those born before the famine were not affected by the famine in any significant way in terms oftheir health, and among women, the lasting famine effects on health were concentrated in the 1961 and 1962 birth cohorts.The Chinese Famine peaked in 1960 and remained severe in 1961 (Peng, 1987), meaning that the 1961 and 1962 birthcohorts were mostly in utero during the harshest part of the famine, leaving markers on their health several decades later.Indeed, this finding is particularly remarkable if we take into account (1) mortality selection, that these two birth cohorts(especially the 1961 birth cohort) should be composed of the fittest babies, and (2) that some of the 1962 birth cohort were

Table CDifference-in-differences estimates of famine effects on mid-life perceived health, based on OLS regressions, using different famine severity measures.
Model 1:men
Model 2:women
Model 3: men, non-party-affiliated families
Model 4: men, party-affiliated families
Model 5: women, non-party-affiliated families
Model 6: women,party-affiliated families
Panel A: excess death rate (mortality difference between 1960 and non-famine years 1956–1958)Cohort (Ref. = Post-famine cohort)
Pre-faminecohort
�1.819 �1.693 �1.543 �8.259+ �2.122 0.237(1.472) (1.470) (1.425) (3.972) (1.623) (5.912)
Faminecohort
�1.439 0.726 �1.497 �4.973* 0.816 �1.579(1.139) (0.837) (1.277) (2.281) (0.968) (4.722)
EDR *Pre-faminecohort
�0.033 0.028 �0.031 �0.081 0.032 0.049(0.027) (0.040) (0.032) (0.124) (0.047) (0.101)
Faminecohort
�0.011 �0.106* 0.020 �0.192*** �0.116* 0.064(0.045) (0.048) (0.063) (0.038) (0.049) (0.133)
Age 0.101 �0.102 0.069 0.900 �0.071 �0.286(0.157) (0.183) (0.156) (0.531) (0.194) (0.691)
Constant 24.476*** 26.199** 25.758*** �0.384 25.272** 43.922(6.344) (7.747) (6.373) (22.299) (8.147) (27.765)
Observations 791 925 716 75 840 85
Panel B: cohort size shrinkage indexCohort (Ref. = Post-famine cohort)
Pre-faminecohort
�1.625 �1.822 �0.830 �7.671 �2.045 �3.653(1.913) (2.198) (1.619) (7.171) (2.637) (7.507)
Faminecohort
�1.189 4.119* �1.925 1.583 4.875* �3.529(2.237) (1.971) (2.744) (5.211) (2.193) (8.432)
Cohort size shrinkage index *Pre-faminecohort
�0.157 0.136 �0.268 �0.128 0.104 1.103(0.300) (0.588) (0.296) (1.486) (0.695) (0.853)
Faminecohort
�0.095 �1.216* 0.184 �2.180+ �1.407* 0.729(0.488) (0.532) (0.648) (1.127) (0.556) (1.656)
Age 0.095 �0.096 0.062 0.712 �0.067 �0.256(0.161) (0.183) (0.160) (0.562) (0.193) (0.683)
Constant 33.274*** 36.779*** 34.319*** 6.428 35.630*** 42.716(6.646) (8.055) (6.888) (23.750) (8.359) (27.033)
Observations 791 925 716 75 840 85
Panel C: fertility reduction indexCohort (Ref. = Post-famine cohort)
Pre-famineCohort
�1.775 �2.447 �1.319 �5.220 �3.116 �0.748(1.736) (2.114) (1.513) (7.772) (2.634) (6.661)
Faminecohort
�0.589 4.278+ �1.603 3.248 4.887+ �3.150(2.222) (2.288) (2.858) (4.037) (2.419) (9.719)
Fertility reduction index *Pre-faminecohort
�0.122 0.327 �0.158 �0.882 0.406 0.563(0.270) (0.611) (0.292) (1.911) (0.720) (1.067)
Faminecohort
�0.260 �1.373+ 0.125 �2.843** �1.551* 0.734(0.582) (0.708) (0.789) (0.802) (0.712) (2.051)
Age 0.089 �0.100 0.058 0.753 �0.068 �0.331(0.161) (0.185) (0.160) (0.558) (0.194) (0.689)
Constant 54.890*** 78.273*** 56.144*** 3.826 76.142*** 44.961(6.615) (7.417) (6.710) (23.168) (7.809) (27.125)
Observations 791 925 716 75 840 85
Note: We do not show estimates for the main effect of excess death rate (see footnote 5 in the text). Estimates for province fixed effects are not shown forModels 1–3 or Model 5 for simplicity. Robust standard errors clustered at the province level are shown in parentheses.*** p < 0.001.
** p < 0.01.* p < 0.05.+ p < 0.1.
W. Fan, Y. Qian / Social Science Research 49 (2015) 53–69 65
not exposed to the famine in utero. This finding lends support to the critical period notion that early life conditions havelong-lasting effects on or even ‘‘program’’ later health (Barker, 1995, 1998). That famine effects for females become non-significant once the 1958 cohort is added also fits well with the critical period model, given that the majority who were born

Table DDifference-in-differences estimates of famine effects on mid-life perceived health, based on OLS regressions, using individual birth years.
Model 1: men, non-party-affiliated families
Model 2: men, party-affiliated families
Model 3: women, non-party-affiliated families
Model 4: women, party-affiliated families
Birthyear 1955 2.787 �0.981 1.101 7.611(3.177) (5.886) (3.507) (10.203)
Birthyear 1956 �0.528 �6.056 �1.429 �3.893(2.872) (5.992) (3.021) (6.797)
Birthyear 1957 0.833 �9.841 �0.155 8.400(2.767) (6.461) (2.563) (8.050)
Birthyear 1958 1.420 �4.998 �2.574 2.358(2.521) (5.961) (2.374) (6.835)
Birthyear 1959 0.454 8.059* 1.527(2.253) (3.765) (2.089)
Birthyear 1960 �0.243 �2.712 0.328 8.040(2.285) (4.086) (2.374) (5.374)
Birthyear 1961 �1.684 �2.345 1.886 5.785(2.717) (3.235) (1.725) (3.487)
Birthyear 1962 0.161 �11.327+ 2.614+ �5.068(1.338) (5.988) (1.293) (5.135)
EDR * Birthyear1955
�0.053 �0.150+ 0.038 0.302(0.056) (0.080) (0.089) (0.824)
EDR * Birthyear1956
0.099 �0.001 0.148+ 0.660(0.103) (0.133) (0.083) (0.445)
EDR * Birthyear1957
�0.034 �0.048 0.051 �0.477(0.128) (0.262) (0.102) (0.912)
EDR * Birthyear1958
�0.219* 0.192 0.182 0.264(0.088) (0.521) (0.171) (0.195)
EDR * Birthyear1959
�0.088 �1.943*** �0.131 �0.305(0.092) (0.296) (0.082) (0.464)
EDR * Birthyear1960
0.201+ �0.550** �0.028 �0.256(0.113) (0.154) (0.090) (0.247)
EDR * Birthyear1961
0.254 �0.908 �0.401+
(0.263) (0.542) (0.211)EDR * Birthyear
1962�0.030 1.230 �0.349** 0.435(0.098) (0.858) (0.096) (0.322)
Age �0.292 0.504 �0.304 �0.945(0.311) (0.653) (0.344) (0.816)
Constant 39.020** 15.514 30.596* 69.943*
(12.982) (26.950) (14.744) (32.726)Observations 716 75 840 85
Note: We do not show estimates for the main effect of excess death rate (see footnote 5 in the text). Estimates for province fixed effects are not shown forModels 1 and 3 for simplicity. Robust standard errors clustered at the province level are shown in parentheses.*** p < 0.001.
** p < 0.01.* p < 0.05.+ p < 0.1.
66 W. Fan, Y. Qian / Social Science Research 49 (2015) 53–69
in 1958 should have spent most of their in utero period in 1957, thus diluting any long-term consequences of early-lifeinsults. A recent study by De Rooij et al. (2010) found that the most critical period of exposure for a fetus was during thefirst three months of a pregnancy, which explains why even a few months’ exposure (or non-exposure) to the famine hadmade such a large difference for later health for females in the 1962 (or 1958) birth cohort.
In addition, long-term famine effects are contingent on social contexts. In this study we uncover two important contexts:gender and family background. Consistent with previous studies, females seem to bear the brunt of negative famine conse-quences. Mortality selection and differential treatment are two potential explanations. Our data, a truncated sample onlyconsisting of individuals who were still alive in 2005, are not suitable to quantify the extent of selectivity, although the find-ing that famine effects vary little across quantiles among women but not among men hints the sex-specific mortality selec-tion pattern. Other studies also provide some insights. Mu and Zhang (2011) exploited heterogeneity in the culture of sonpreference across nineteen large ethnic groups and showed that mortality selection was the driving force for the observedgender difference in the impact of the Chinese Famine on disability rates. Differential treatment is also possible, especially inrural China, where sons were treated more favorably than daughters. Unfortunately, we cannot test this hypothesis directlygiven that the 2005 CGSS did not collect information that could proxy for family resource allocation (e.g., sibling composi-tions). Nevertheless, we want to mention that prenatal sex identification through ultrasound B machines was not possiblebefore the 1980s in China (Zeng et al., 1993), so females born during the Chinese Famine were protected from unfavorabletreatment at least in utero, and any gender differences resulting from differential treatment are most likely due to parentalneglect after birth rather than in utero. In practice, both mortality selection and differential treatment were probably at work,as evidenced by our finding that females but not males are sensitive to alternative cohort construction. Specifically, females

Table EDifference-in-differences estimates of famine effects on mid-life perceived health, based on OLS regressions, 1958 in the famine cohort.
Model 1:men
Model 2:women
Model 3: men, non-party-affiliated families
Model 4: men, party-affiliated families
Model 5: women, non-party-affiliated families
Model 6: women, party-affiliated families
Cohort (Ref. = Post-famine cohort)Pre-faminecohort
�1.043 �0.407 0.101 �13.829* �0.180 1.282(1.711) (1.487) (1.759) (6.623) (1.717) (5.847)
Faminecohort
�0.536 0.292 �0.140 �6.422+ 0.661 �2.083(1.090) (0.953) (1.210) (3.432) (1.081) (3.807)
EDR *Pre-faminecohort
0.027 0.059 0.013 �0.006 0.075 �0.322(0.067) (0.055) (0.052) (0.166) (0.071) (0.434)
Faminecohort
�0.074 �0.099 �0.042 �0.450** �0.126 0.141(0.059) (0.078) (0.079) (0.139) (0.093) (0.187)
Age �0.066 �0.241 �0.172 1.277+ �0.290 �0.089(0.195) (0.163) (0.210) (0.714) (0.182) (0.554)
Constant 29.818** 28.816*** 34.482** �15.506 31.264*** 35.185(8.755) (6.776) (9.418) (29.366) (7.456) (22.395)
Observations 791 925 716 75 840 85
Notes: 1. We do not show estimates for the main effect of excess death rate (see footnote 5 in the text). Estimates for province fixed effects are not shown forModels 1–3 or Model 5 for simplicity. Robust standard errors clustered at the province level are shown in parentheses.2. In this table, famine cohort includes respondents born between 1958–1962, pre-famine cohort includes people born 1955–1957, and post-famine cohortincludes those born between 1963 and 1966.3. Postestimation tests of the EDR*Famine-Cohort interaction terms across models: M3 = M4 = M5 = M6 (p = .0046); M3 �M4 = M5 �M6 (p = .0411);M3 = M4 (p = .0277); M5 = M6 (p = .2940).*** p < 0.001.
** p < 0.01.* p < 0.05.+ p < 0.1.
W. Fan, Y. Qian / Social Science Research 49 (2015) 53–69 67
born in 1958 were at a much higher risk of being neglected during the famine period than males of the same cohort, so add-ing females of the 1958 birth cohort who survived the famine should exacerbate the extent of mortality selection, attenu-ating the estimated famine effect toward zero.
Family background is another contextual factor shaping the long-term consequences of famine. A common theme emerg-ing from disaster studies is that social forces operate even in seemingly neutral natural disasters, with less advantagedgroups affected most severely (e.g., Strauss and Thomas, 1998). Thus, it is striking that virtually no previous famine researchincorporated family background into their analytic framework.
What have we gained by explicitly taking into account family background as an important contextual factor? Along withprior studies we found a null famine effect for men, but when disaggregated by parents’ political power, a noticeable adversefamine effect on mid-life health was identified among men from party-affiliated families, significantly greater than that formen from the unaffiliated families. Is it against the general pattern detected in previous literature? Not necessarily. Weresort to the complex interplay between biological and social forces to explain this seemingly counterintuitive finding: dif-ferential mortality selection by family background. During the famine period, families with tighter ties to the CommunistParty were more likely to mobilize resources to obtain more food. Given male’s greater biological vulnerability to prenatalinsult (Kline et al., 1989; Kraemer, 2000; Salonen et al., 2009), rural males from ordinary peasant families were subject toespecially severe mortality selection. Quantile regressions provide suggestive evidence supporting this argument: weobserve a declining trend of estimated famine effects from lower to higher quantiles for males born into non-party-affiliatedfamilies, suggesting high levels of mortality selection that yielded a very robust group of survivors in the lower quantiles (seethe first plot of Fig. 2). Males born into party-affiliated families were adversely affected across the board, but the effect wasparticularly severe in the lower quantiles (see the second plot of Fig. 2). This seems to indicate that many of the weakestwere able to survive, but their health was nevertheless permanently harmed. In contrast to males, we find no significant dif-ference in the negative famine effects between females born into party-affiliated and the unaffiliated families, possibly dueto less prenatal mortality selection among females and a widespread preference for sons regardless of family background.
Unlike several other studies, we did not find that the 1959–1961 Chinese Famine had any negative consequences for edu-cation or income. We propose possible reasons. Meng and Qian (2009) reported that in utero exposure to famine caused an8.6% (0.6 years) reduction in educational attainment, but this actually refers to the effects estimated on the 90th percentilethat they argue as a way to correct for mortality selection. We do not follow this strategy in our analysis. Chen and Zhou(2007) found that the 1959 and 1960 cohorts had lower annual working hours and lower farming income because of thefamine. Our results differ from theirs probably because we rely on a nationally representative sample instead of the eightprovinces they examined. In still another study, Almond et al. (2007) used census data, but the large sample size almostguaranteed significant findings. The effect sizes reported in their study were small.
68 W. Fan, Y. Qian / Social Science Research 49 (2015) 53–69
This study has several limitations. First, our samples for males and females born into party-affiliated families are small,which might yield the problem of overfitting. Future studies relying on larger samples are essential to addressing this issue.Second, we are unable to distinguish two types of parents’ political credential given data limitation: Communist Party mem-bership and cadre status. Although prior studies suggested that these two are highly correlated, to what extent using alter-native measures affects our conclusion is a task future studies could attend to. Third, because the 2005 CGSS did not collectbirthplace information, we have to rely on parents’ occupation when the respondent was 14 to obtain the rural sample.Although the tight administrative control virtually eliminated unauthorized rural-to-urban migration in the pre-reformera (Wu and Treiman, 2004), we are not sure to what extent this measure accurately captures places of birth. Fourth, thelong duration of the Chinese Famine makes it impossible to conduct a sharp contrast distinguishing the in utero effect fromthe infancy effect. Studies based on other famines that are short and abrupt might shed more light on such distinctions.
Despite these limitations, our study extends previous research on the long-term consequences of famine in general and ofthe 1959–1961 Chinese Famine in particular. To our knowledge, no previous studies have used a nationally representativesample to examine the effects of the Chinese Famine on perceived health, an important predictor of subsequent mortality.Moreover, our findings add nuances to previous famine research by revealing who in the population is affected most harshlythrough the confluences of biological and social forces. Having experienced one of the largest famines in human history,these individuals are now moving through their retirement years. Our study suggests the necessity of paying special atten-tion to this cohort, with programs designed specifically to meet their special needs.
Appendix A
See Tables A–E.
References
Adler, N.E., Boyce, T., Chesney, M.A., Cohen, S., Folkman, S., Kahn, R.L., Syme, S.L., 1994. Socioeconomic status and health: the challenge of the gradient. Am.Psychol. 49, 15–24.
Almond, D., Currie, J., 2011. Killing me softly: the fetal origins hypothesis. J. Econ. Persp. 25 (3), 153–172.Almond, D., Edlund, L., Li, H., Zhang, J., 2007. Long-term effects of the 1959–1961 China famine: mainland China and Hong Kong. National Bureau of
Economic Research, Cambridge, MA.Angrist, J.D., Pischke, J., 2009. Mostly Harmless Econometrics: An Empiricists Companion. Princeton University Press, Princeton.Ashton, B., Hill, K., Piazza, A., Zeitz, R., 1984. Famine in China, 1958–61. Popul. Dev. Rev. 10, 613–645.Banister, J., 1987. China’s Changing Population. Stanford University Press, Stanford, CA.Barker, D.J.P., 1995. Fetal origins of coronary heart disease. Br. Med. J. 311, 171–174.Barker, D.J.P., 1998. In utero programming of chronic disease. Clin. Sci. 95, 115–128.Barker, D.J.P., 2003. Editorial: the developmental origins of adult disease. Eur. J. Epidemiol. 18, 733–736.Barker, D.J.P., 2007. The origins of the developmental origins theory. J. Intern. Med. 261 (5), 412–417.Bian, Y., 2002. Chinese social stratification and social mobility. Ann. Rev. Sociol., 91–116.Bian, Y., Li, L., 2012. The Chinese general social survey (2003–8). Chin. Sociol. Rev. 45 (1), 70–97.Bian, Y., Shu, X., Logan, J.R., 2001. Communist Party membership and regime dynamics in China. Soc. Forces 79 (3), 805–841.Black, R.E., Allen, L.H., Bhutta, Z.A., Caulfield, L.E., de Onis, M., Ezzati, M., Mathers, C., Rivera, J., 2008. Global and regional exposures and health consequences.
Lancet, 243–260.Brown, A.S., Susser, E.S., 2008. Prenatal nutritional deficiency and risk of adult schizophrenia. Schizophr. Bull. 34, 1054–1063.Brown, A.S., van Os, J., Driessens, C., Hoek, H.W., Susser, E.S., 2000. Further evidence of relation between prenatal famine and major affective disorder. Am. J.
Psychiatry 157, 190–195.Cai, Y., Wang, F., 2005. Famine, social disruption, and involuntary fetal loss: evidence from Chinese survey data. Demography 42, 301–322.Chang, G.H., Wen, G.J., 1997. Communal dining and the Chinese famine of 1958–1961. Econ. Dev. Cult. Change 46 (1), 1–34.Chen, Y., Zhou, L., 2007. The long-term health and economic consequences of the 1959–1961 famine in China. J. Health Econ. 26, 659–681.Chen, F., Yang, Y., Liu, G., 2010. Social change and socioeconomic disparities in health over the life course in China: a cohort analysis. Am. Sociol. Rev. 75 (1),
126–150.Coale, A.J., 1981. Population trends, population policy, and population studies in China. Popul. Dev. Rev. 7, 85–97.Coleman-Jensen, A., Nord, M., Andrews, M., Carlson, S., 2012. Household food security in the United States in 2011. USDA ERS.Croll, E., 2000. Endangered Daughters: Discrimination and Development in Asia. Routledge, New York.Das Gupta, M., Li, S., 1999. Gender bias in China, South Korea, and India 1920–1990: effects of war, famine and fertility decline. Dev. Change 30, 619–652.Das Gupta, M., Jiang, Z., Li, B., Xie, Z., Chung, W., Hwa-Ok, B., 2003. Why is son preference so persistent in East and South Asia? A cross-country study of
China, India and the Republic of Korea. J. Dev. Stud. 40 (2), 153–187.de Onis, M., Blössner, M., 2000. Prevalence and trends of overweight among preschool children in developing countries. Am. J. Clin. Nutr. 72, 1032–1039.de Rooij, S.R., Woutersa, H., Yonkerb, J.E., Painterc, R.C., Roseboom, T.J., 2010. Prenatal undernutrition and cognitive function in late adulthood. Proc. Natl.
Acad. Sci. USA 107, 16881–16886.Dikötter, F., 2010. Mao’s Great Famine: The History of China’s Most Devastating Catastrophe, 1958–62. Walker & Company.Elder Jr., G.H., Johnson, M.K., Crosnoe, R., 2003. The emergence and development of life course theory. In: Mortimer, J.T., Shanahan, M.J. (Eds.), Handbook of
the Life Course. Plenum, New York, pp. 3–12.Elo, I.T., 2009. Social class differentials in health and mortality: patterns and explanations in comparative perspective. Ann. Rev. Sociol. 35, 553–572.Eriksson, J.G., Kajantie, E., Osmond, C., Thornburg, K., Barker, D.J.P., 2010. Boys live dangerously in the womb. Am. J. Human Biol. 22 (3), 330–335.Fan, V.S., Curtis, J.R., Tu, S., McDonell, M.B., Fihn, S.D., the Ambulatory Care Quality Improvement Project Investigators, 2002. Using quality of life to predict
hospitalization and mortality in patients with obstructive lung diseases. Chest 122, 429–436.Gørgens, T., Meng, X., Vaithianathan, R., 2012. Stunting and selection effects of famine: a case study of the great Chinese famine. J. Dev. Econ. 97, 99–111.Hauser, R.M., Carr, D., 1995. Measuring poverty and socioeconomic status in studies of health and well being. CDE Working Paper No. 94-24.Huang, C., Li, Z., Wang, M., Martorell, R., 2010. Early life exposure to the 1959–1961 Chinese famine has long-term health consequences. J. Nutr. 140, 1874–
1878.Huang, C., Phillips, M.R., Zhang, Y., Zhang, J., Shi, Q., Song, Z., Ding, Z., Pang, S., Martorell, R., 2012. Malnutrition in early life and adult mental health: evidence
from a natural experiment. Soc. Sci. Med., http://dx.doi.org/10.1016/j.socscimed.2012.09.051.Idler, E.L., Benyamini, Y., 1997. Self-rated health and mortality: a review of twenty-seven community studies. J. Health Soc. Behav. 38, 21–37.
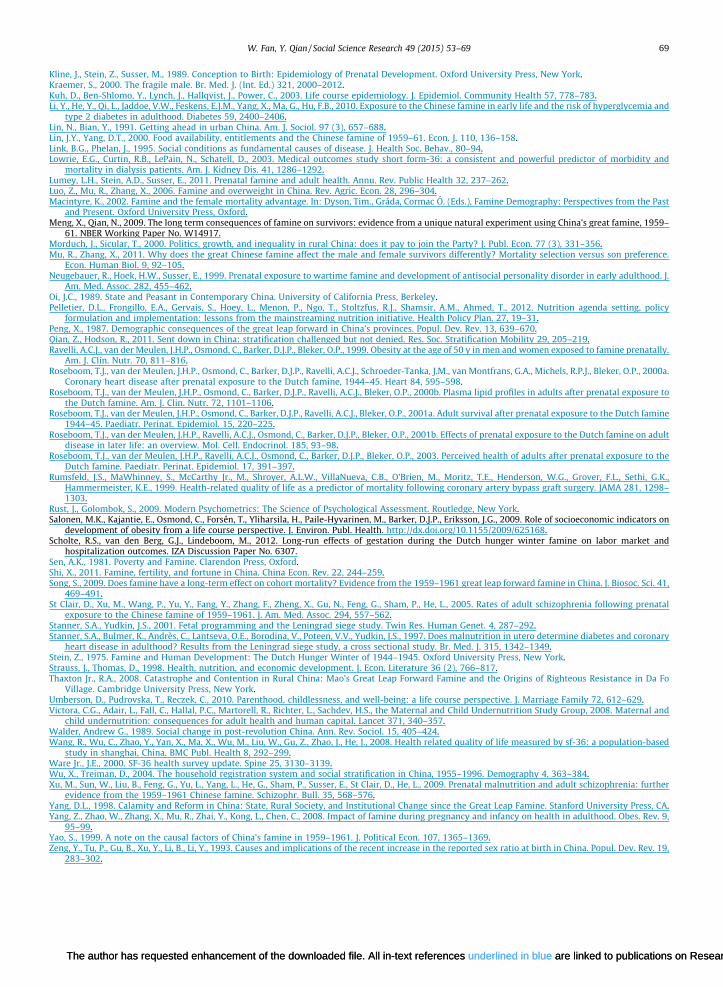
W. Fan, Y. Qian / Social Science Research 49 (2015) 53–69 69
Kline, J., Stein, Z., Susser, M., 1989. Conception to Birth: Epidemiology of Prenatal Development. Oxford University Press, New York.Kraemer, S., 2000. The fragile male. Br. Med. J. (Int. Ed.) 321, 2000–2012.Kuh, D., Ben-Shlomo, Y., Lynch, J., Hallqvist, J., Power, C., 2003. Life course epidemiology. J. Epidemiol. Community Health 57, 778–783.Li, Y., He, Y., Qi, L., Jaddoe, V.W., Feskens, E.J.M., Yang, X., Ma, G., Hu, F.B., 2010. Exposure to the Chinese famine in early life and the risk of hyperglycemia and
type 2 diabetes in adulthood. Diabetes 59, 2400–2406.Lin, N., Bian, Y., 1991. Getting ahead in urban China. Am. J. Sociol. 97 (3), 657–688.Lin, J.Y., Yang, D.T., 2000. Food availability, entitlements and the Chinese famine of 1959–61. Econ. J. 110, 136–158.Link, B.G., Phelan, J., 1995. Social conditions as fundamental causes of disease. J. Health Soc. Behav., 80–94.Lowrie, E.G., Curtin, R.B., LePain, N., Schatell, D., 2003. Medical outcomes study short form-36: a consistent and powerful predictor of morbidity and
mortality in dialysis patients. Am. J. Kidney Dis. 41, 1286–1292.Lumey, L.H., Stein, A.D., Susser, E., 2011. Prenatal famine and adult health. Annu. Rev. Public Health 32, 237–262.Luo, Z., Mu, R., Zhang, X., 2006. Famine and overweight in China. Rev. Agric. Econ. 28, 296–304.Macintyre, K., 2002. Famine and the female mortality advantage. In: Dyson, Tim., Grada, Cormac O. (Eds.), Famine Demography: Perspectives from the Past
and Present. Oxford University Press, Oxford.Meng, X., Qian, N., 2009. The long term consequences of famine on survivors: evidence from a unique natural experiment using China’s great famine, 1959–
61. NBER Working Paper No. W14917.Morduch, J., Sicular, T., 2000. Politics, growth, and inequality in rural China: does it pay to join the Party? J. Publ. Econ. 77 (3), 331–356.Mu, R., Zhang, X., 2011. Why does the great Chinese famine affect the male and female survivors differently? Mortality selection versus son preference.
Econ. Human Biol. 9, 92–105.Neugebauer, R., Hoek, H.W., Susser, E., 1999. Prenatal exposure to wartime famine and development of antisocial personality disorder in early adulthood. J.
Am. Med. Assoc. 282, 455–462.Oi, J.C., 1989. State and Peasant in Contemporary China. University of California Press, Berkeley.Pelletier, D.L., Frongillo, E.A., Gervais, S., Hoey, L., Menon, P., Ngo, T., Stoltzfus, R.J., Shamsir, A.M., Ahmed, T., 2012. Nutrition agenda setting, policy
formulation and implementation: lessons from the mainstreaming nutrition initiative. Health Policy Plan. 27, 19–31.Peng, X., 1987. Demographic consequences of the great leap forward in China’s provinces. Popul. Dev. Rev. 13, 639–670.Qian, Z., Hodson, R., 2011. Sent down in China: stratification challenged but not denied. Res. Soc. Stratification Mobility 29, 205–219.Ravelli, A.C.J., van der Meulen, J.H.P., Osmond, C., Barker, D.J.P., Bleker, O.P., 1999. Obesity at the age of 50 y in men and women exposed to famine prenatally.
Am. J. Clin. Nutr. 70, 811–816.Roseboom, T.J., van der Meulen, J.H.P., Osmond, C., Barker, D.J.P., Ravelli, A.C.J., Schroeder-Tanka, J.M., van Montfrans, G.A., Michels, R.P.J., Bleker, O.P., 2000a.
Coronary heart disease after prenatal exposure to the Dutch famine, 1944–45. Heart 84, 595–598.Roseboom, T.J., van der Meulen, J.H.P., Osmond, C., Barker, D.J.P., Ravelli, A.C.J., Bleker, O.P., 2000b. Plasma lipid profiles in adults after prenatal exposure to
the Dutch famine. Am. J. Clin. Nutr. 72, 1101–1106.Roseboom, T.J., van der Meulen, J.H.P., Osmond, C., Barker, D.J.P., Ravelli, A.C.J., Bleker, O.P., 2001a. Adult survival after prenatal exposure to the Dutch famine
1944–45. Paediatr. Perinat. Epidemiol. 15, 220–225.Roseboom, T.J., van der Meulen, J.H.P., Ravelli, A.C.J., Osmond, C., Barker, D.J.P., Bleker, O.P., 2001b. Effects of prenatal exposure to the Dutch famine on adult
disease in later life: an overview. Mol. Cell. Endocrinol. 185, 93–98.Roseboom, T.J., van der Meulen, J.H.P., Ravelli, A.C.J., Osmond, C., Barker, D.J.P., Bleker, O.P., 2003. Perceived health of adults after prenatal exposure to the
Dutch famine. Paediatr. Perinat. Epidemiol. 17, 391–397.Rumsfeld, J.S., MaWhinney, S., McCarthy Jr., M., Shroyer, A.L.W., VillaNueva, C.B., O’Brien, M., Moritz, T.E., Henderson, W.G., Grover, F.L., Sethi, G.K.,
Hammermeister, K.E., 1999. Health-related quality of life as a predictor of mortality following coronary artery bypass graft surgery. JAMA 281, 1298–1303.
Rust, J., Golombok, S., 2009. Modern Psychometrics: The Science of Psychological Assessment. Routledge, New York.Salonen, M.K., Kajantie, E., Osmond, C., Forsén, T., Yliharsila, H., Paile-Hyvarinen, M., Barker, D.J.P., Eriksson, J.G., 2009. Role of socioeconomic indicators on
development of obesity from a life course perspective. J. Environ. Publ. Health. http://dx.doi.org/10.1155/2009/625168.Scholte, R.S., van den Berg, G.J., Lindeboom, M., 2012. Long-run effects of gestation during the Dutch hunger winter famine on labor market and
hospitalization outcomes. IZA Discussion Paper No. 6307.Sen, A.K., 1981. Poverty and Famine. Clarendon Press, Oxford.Shi, X., 2011. Famine, fertility, and fortune in China. China Econ. Rev. 22, 244–259.Song, S., 2009. Does famine have a long-term effect on cohort mortality? Evidence from the 1959–1961 great leap forward famine in China. J. Biosoc. Sci. 41,
469–491.St Clair, D., Xu, M., Wang, P., Yu, Y., Fang, Y., Zhang, F., Zheng, X., Gu, N., Feng, G., Sham, P., He, L., 2005. Rates of adult schizophrenia following prenatal
exposure to the Chinese famine of 1959–1961. J. Am. Med. Assoc. 294, 557–562.Stanner, S.A., Yudkin, J.S., 2001. Fetal programming and the Leningrad siege study. Twin Res. Human Genet. 4, 287–292.Stanner, S.A., Bulmer, K., Andrès, C., Lantseva, O.E., Borodina, V., Poteen, V.V., Yudkin, J.S., 1997. Does malnutrition in utero determine diabetes and coronary
heart disease in adulthood? Results from the Leningrad siege study, a cross sectional study. Br. Med. J. 315, 1342–1349.Stein, Z., 1975. Famine and Human Development: The Dutch Hunger Winter of 1944–1945. Oxford University Press, New York.Strauss, J., Thomas, D., 1998. Health, nutrition, and economic development. J. Econ. Literature 36 (2), 766–817.Thaxton Jr., R.A., 2008. Catastrophe and Contention in Rural China: Mao’s Great Leap Forward Famine and the Origins of Righteous Resistance in Da Fo
Village. Cambridge University Press, New York.Umberson, D., Pudrovska, T., Reczek, C., 2010. Parenthood, childlessness, and well-being: a life course perspective. J. Marriage Family 72, 612–629.Victora, C.G., Adair, L., Fall, C., Hallal, P.C., Martorell, R., Richter, L., Sachdev, H.S., the Maternal and Child Undernutrition Study Group, 2008. Maternal and
child undernutrition: consequences for adult health and human capital. Lancet 371, 340–357.Walder, Andrew G., 1989. Social change in post-revolution China. Ann. Rev. Sociol. 15, 405–424.Wang, R., Wu, C., Zhao, Y., Yan, X., Ma, X., Wu, M., Liu, W., Gu, Z., Zhao, J., He, J., 2008. Health related quality of life measured by sf-36: a population-based
study in shanghai, China. BMC Publ. Health 8, 292–299.Ware Jr., J.E., 2000. SF-36 health survey update. Spine 25, 3130–3139.Wu, X., Treiman, D., 2004. The household registration system and social stratification in China, 1955–1996. Demography 4, 363–384.Xu, M., Sun, W., Liu, B., Feng, G., Yu, L., Yang, L., He, G., Sham, P., Susser, E., St Clair, D., He, L., 2009. Prenatal malnutrition and adult schizophrenia: further
evidence from the 1959–1961 Chinese famine. Schizophr. Bull. 35, 568–576.Yang, D.L., 1998. Calamity and Reform in China: State, Rural Society, and Institutional Change since the Great Leap Famine. Stanford University Press, CA.Yang, Z., Zhao, W., Zhang, X., Mu, R., Zhai, Y., Kong, L., Chen, C., 2008. Impact of famine during pregnancy and infancy on health in adulthood. Obes. Rev. 9,
95–99.Yao, S., 1999. A note on the causal factors of China’s famine in 1959–1961. J. Political Econ. 107, 1365–1369.Zeng, Y., Tu, P., Gu, B., Xu, Y., Li, B., Li, Y., 1993. Causes and implications of the recent increase in the reported sex ratio at birth in China. Popul. Dev. Rev. 19,
283–302.
The author has requested enhancement of the downloaded file. All in-text references underlined in blue are linked to publications on ResearchGate.The author has requested enhancement of the downloaded file. All in-text references underlined in blue are linked to publications on ResearchGate.


![[Wiki] Siege of Leningrad](https://img.pdfslide.us/doc/110x75/55cf8573550346484b8e2d27/wiki-siege-of-leningrad.jpg)


![Leningrad [FFM44] - Days of Wonder](https://img.pdfslide.us/doc/110x75/61570983a097e25c765067bd/leningrad-ffm44-days-of-wonder.jpg)


![Famines In History Powerpoint[1]](https://img.pdfslide.us/doc/110x75/549691f9b47959b8328b464c/famines-in-history-powerpoint1.jpg)