Embed Size (px)
Citation preview
Social Safety Nets in Bangladesh: An Assessment
Bangladesh Development Series – Paper No. 9 The World Bank Office, Dhaka January 2006 www.worldbank.org.bd/bds
Document of the World Bank
Disclaimer:
This volume is a product of the staff of the International Bank for Reconstruction and Development/ The World Bank. The findings, interpretations, and conclusions expressed in this paper do not necessarily reflect the views of the Executive Directors of The World Bank or the governments they represent. The World Bank does not guarantee the accuracy of the data included in this work. The boundaries, colors, denominations, and other information shown on any map in this work do not imply any judgment on the part of The World Bank concerning the legal status of any territory or the endorsement or acceptance of such boundaries.
Copyright Statement:
The material in this publication is copyrighted. Copying and/or transmitting portions or all of this work without permission may be a violation of applicable law. The International Bank for Reconstruction and Development/ The World Bank encourages dissemination of its work and will normally grant permission to reproduce portions of the work promptly.
For permission to photocopy or reprint any part of this work, please send a request with complete information to the Copyright Clearance Center, Inc., 222 Rosewood Drive, Danvers, MA 01923, USA, telephone 978-750-8400, fax 978-750-4470, http://www.copyright.com/.
All other queries on rights and licenses, including subsidiary rights, should be addressed to the Office of the Publisher, The World Bank, 1818 H Street NW, Washington, DC 20433, USA, fax 202-522-2422, e-mail [email protected].
GOVERNMENT FISCAL YEAR
July 1 – June 30
CURRENCY EQUIVALENTS Currency Unit = Taka
US$1 = Taka 65.82 (November 28, 2005)
ABBREVIATIONS AND ACRONYMS
ADB Asian Development Bank BDPUP BRAC Dropout Program for the Ultra-Poor BINP Bangladesh Integrated Nutrition Program BRAC Bangladesh Rural Advancement Committee CFW Cash-for-Works CIDA Canadian International Development Agency EC European Commission FFE Food-for-Education FFW Food-for-Works FSP Financial Support to the Poor FSSAP Female Secondary School Assistance Program GDP Gross Domestic Product GoB Government of Bangladesh GR Gratuitous Relief HIES Household Income and Expenditure Survey IGA Income Generation Activities I-PRSP Interim Poverty Reduction Strategy Paper LGED Local Government and Engineering Department MDG Millennium Development Goal NGO Non-Governmental Organization NORAD Norwegian Development Corporation PESP Primary Education Stipend Program PKSF Palli Karma Shahayok Foundation RIMP Rural Infrastructure Maintenance Program (also Test Relief) RMP Rural Maintenance Program SP Social Protection STUP Specially Targeted Ultra-Poor Program USAID United States Agency for International Development VGD Vulnerable Group Development VGF Vulnerable Group Feeding WFP World Food Program
Vice President : Praful Patel Country Director : Christine Wallich Sector Director : Julian Schweitzer Sector Manager : Mansoora Rashid Task Team Leader : Amit Dar

CONTENTS Executive Summary............................................................................................................................................ i 1. Introduction...............................................................................................................................................1 2. Growth and Poverty ..................................................................................................................................5 A. Poverty in Bangladesh.............................................................................................................................5 Poverty Profile.......................................................................................................................................7 B. Groups at Risk .........................................................................................................................................8
I. Life Cycle...........................................................................................................................................8 Infants and Children: Risk of Malnutrition and Low Human Capital Accumulation .....................8 Working Age Individuals: Risk of Poor Labor Market Outcomes .................................................9 The Elderly: Lack of Adequate Safety Nets .................................................................................10
II. General Population .........................................................................................................................11 Households affected by Natural Disasters ....................................................................................11 Other Disadvantaged Groups ........................................................................................................11
3. Safety Net Programs in Bangladesh .......................................................................................................13 A. Household Risk Coping Mechanisms ...................................................................................................13 B. Formal Safety Net Programs: Provision and Financing ........................................................................14 Provision..............................................................................................................................................12 Financing .............................................................................................................................................13 4. Evidence of Program Impacts.................................................................................................................15 5. Issues for Consideration..........................................................................................................................17 A. Program Design.....................................................................................................................................17
Financing and Fiscal Impacts ..............................................................................................................17 Coverage of Safety Net Programs .......................................................................................................18 Targeting and Leakage ........................................................................................................................19 The Role of Microcredit in Safety Net Programs................................................................................22 Responding to Natural Disasters .........................................................................................................24
B. Program Management ...........................................................................................................................25 Administering Social Protection..........................................................................................................25 Monitoring and Evaluation..................................................................................................................25
6. Suggested Solutions................................................................................................................................27 A. Program Design.....................................................................................................................................28
Coverage..............................................................................................................................................28 Targeting and Leakage ........................................................................................................................30 Microcredit Programs..........................................................................................................................32 Disaster Management ..........................................................................................................................33
B. Program Management ...........................................................................................................................34 Administration.....................................................................................................................................34 Monitoring and Evaluation..................................................................................................................36
Annexes ............................................................................................................................................................37 Annex I: The Scope of the Report..............................................................................................................38 Annex 2: The Poverty Profile for Bangladesh ...........................................................................................40 Annex 3: Summary of Key Safety Net Programs ......................................................................................43 Annex 4: VGD Delivery Mechanism: Duties and Responsibilities at a Glance ........................................47 References ........................................................................................................................................................48
List of Tables Table 1: Major Poverty and Social Goals..........................................................................................................5 Table 2: Social Indicators for Selected South Asian Countries.........................................................................6 Table 3: Trends in Consumption Poverty..........................................................................................................7 Table 4: Distribution of Public and Private Expenditures on Education...........................................................8 Table 5: Children aged 5-17 by Activity (‘000) ................................................................................................9 Table 6: Poverty Incidence and Labor Outcomes by Education of Household Head .....................................10 Table 7: Sector of Employment.......................................................................................................................10 Table 8: Poverty Incidence by Occupation of Household Head......................................................................10 Table 9: Population Structure ..........................................................................................................................11 Table 10: Expenditures on Safety Net Programs (US$ millions, 1996-2004).................................................15 Table 11: Summary of Expenditures on Safety Net Programs (US$ millions, 1996-2004)............................16 Table 12: Working Children 10-14 .................................................................................................................18 Table 13: Estimates of Leakage from the VGD, VGF and FFE......................................................................23 Table 14: Comparative Losses from Different Programs................................................................................23 Table 15: Poverty Indicators Comparisons......................................................................................................25 Table 16: Natural Disasters Affecting Bangladesh .........................................................................................26 Table 17: Effectiveness of Poverty Indicators.................................................................................................34
List of Boxes Box 1: Role of Safety Nets in Low-Income Developing Countries ..................................................................1 Box 2: Social Risk Management – Diversifying Instruments to Manage Risk ..................................................3 Box 3: What is Monga? ....................................................................................................................................21 Box 4: Strategies to Address Chronic Poverty ................................................................................................29 Box 5: Advantages of Conditional Cash Transfer Programs...........................................................................30 Box 6: Alternative Targeting Mechanisms......................................................................................................33 Box 7: Government Financing and Private Delivery: The Case of Food Subsidies........................................38
List of Figures
Figure 3.1: Distribution of Recipient and Non-Recipient Households by Quintile.........................................11 Figure 3.2: HH Index and Incomes .................................................................................................................11 Figure 3.3: Social Assistance Expenditures as % of GDP and Public Expenditures (1996-2004)..................14 Figure 5.1: International Expenditures on SP (as %of GDP) ..........................................................................17 Figure 5.2: PESP Targeting Performance........................................................................................................20 Figure 5.3: VGD Funds Flow..........................................................................................................................22
ACKNOWLEDGMENTS This report was prepared by a team led by Amit Dar (Senior Economist, SASHD). The team was comprised of Nilufar Ahmed (Senior Social Development Specialist), Venkatesh Sundararaman (Economist, SASHD), Alan Abrahart (Consultant), and Shaikh Shamsuddin Ahmed (Consultant). Gertrude Cooper (SASHD) assisted the team in editing the report while Nazma Sultana (SACBD) assisted with coordinating field level logistics. The report was prepared under the overall guidance of Julian Schweitzer (Sector Director, SASHD), Mansoora Rashid (Sector Manager, Social Protection, SASHD), and Christine Wallich (Country Director, Bangladesh). Valuable comments and suggestions were received from Emily Andrews, Qaiser Khan, Carlo del Ninno and Binayak Sen. We would also like to thank staff at the Ministry of Finance, Ministry of Social Welfare, Ministry of Women and Children’s Affairs, Ministry of Disaster Management, as well as staff in various NGOs for very useful discussions.
FOREWORD
Despite considerable progress in reducing poverty over the past 15 years, half of Bangladesh's population is still poor. With a combination of sound macro-economic policies, institutional reforms, and good governance, Bangladesh can achieve the MDG goal of halving the 1990 poverty rate by 2015. However, the extent of poverty and vulnerability would still be significant and, in absolute terms, the numbers would remain high. Recognizing this challenge, the Government has emphasized social protection as a pillar of the PRSP, and well-functioning safety nets as an important element of the social protection strategy to cope with poverty. Today Bangladesh spends less than 0.4% of GDP on safety nets - about half of the 1% of GDP spent in the late 1990s. The country has a patchwork of safety net programs (e.g., cash and in kind transfers, micro-credit schemes, and conditional cash transfers) for widows, the disabled, blind, orphans, the aged, to name just a few – each with its own large administrative overheads. But do they meet the needs? Coverage of these safety nets is very low and reaches a very small part of the target needy population. At the same time, despite the low coverage, multiple programs often serve the same beneficiary, and benefits go to those who do not need them. This paper assesses the current system of social safety nets in Bangladesh. It focuses attention on the poor, recommends revisions to existing programs and institutional arrangements, proposes new strategies to minimize poverty and vulnerability, and proposes how to improve the allocation of limited fiscal resources and the efficiency with which these resources are used. We hope that this paper can contribute to the debate on the development of an effective social safety net and social protection system in Bangladesh. Julian Schweitzer Christine Wallich Sector Director Country Director Human Development World Bank Office, Dhaka
i
EXECUTIVE SUMMARY 1. Bangladesh has made considerable progress in reducing income poverty, much of it due to the moderate to strong economic growth of the nineties. Poverty rates have gone down almost 10 points since the early 1990s and distributional measures of poverty such as Poverty Gap indices have improved. At independence in 1971, the headcount rate was 70 percent, while the headcount rate based on the most recent household survey now stands at a little over 50 percent. The Household Income and Expenditure Series suggests that much of the progress in poverty reduction occurred in the first half of the nineties, while an analysis of the National Accounts, seems to suggest a more uniform reduction in poverty through the nineties (Murgai and Zaidi, 2004). 2. Poverty remains pervasive in Bangladesh. Half the population is identified as poor. While urban poverty rates are lower, they remain substantial – over a third of those living in urban areas are poor. The poor and other groups are also vulnerable (in terms of variance in income or loss of human capital) as a result of life cycle events (e.g., seasonal employment, age) and/or more aggregate/climactic shocks affecting a community (e.g., floods).1 Even if Bangladesh, through a combination of sound macro-economic policies, institutional reforms, and good governance, achieves the MDG goal of halving the 1990 poverty rate by 2015, the extent of poverty/vulnerability would still be significant and, in absolute terms, the numbers would remain high. 3. Recognizing the challenges ahead, the Government has emphasized social protection as a pillar of the PRSP. As a complement to its policies to promote growth, invest in human and physical capital, and undertake institutional and governance reforms, the Government aims to develop effective social protection policies and program to address poverty/vulnerability of its population. These policies and programs aim to help the poor cope with shocks to their incomes by improving coverage, timeliness, scale and delivery of safety net programs; help workers retrenched during industrial restructuring, provide access to credit, and strengthen disaster prevention and mitigation strategies. These programs include safety nets, social insurance (e.g., pensions, unemployment) and labor market policies/programs. 4. Well-functioning safety nets are an important element of the social protection strategy. Bangladesh relies on a range of informal and formal instruments to mitigate the risk of falling into poverty, and to cope with poverty. The Government has initiated numerous safety net programs that have had some beneficial impact. However, consistent with Bangladesh’s level of income, the programs are limited in scale and coverage. This, together with inefficiencies within programs, means that these programs are not adequate for addressing poverty or for mitigating vulnerability to poverty. 5. This paper assesses the current system of social safety nets in Bangladesh. It focuses attention on the poor, recommends revisions to existing programs and institutional arrangements, proposes new strategies to minimize the poverty and vulnerability, and stresses the need to improve the allocation of limited fiscal resources and the efficiency with which these resources are used. This paper focuses on the largest programs in the country, acknowledging that some programs may be left out. 1 In risk/consumption smoothing literature (e.g., Townsend (1994) ) shocks affecting households are divided into those that are idiosyncratic (affecting individuals) and those that are aggregate (affecting an entire household or community)

ii
Key Risks and Risk Groups 6. As noted above, in Bangladesh, the majority of the population is either poor or vulnerable to (at risk of falling into) poverty. While data limitations do not allow measuring the extent of vulnerability, poverty and vulnerability are often closely linked, with the poor being the most vulnerable to falling into deeper poverty as a result of life cycle and aggregate climatic shocks. Poor households have limited human and physical assets, and shocks to individual members (e.g., illness, loss of job) or the community (e.g., floods) force them into ineffective risk coping strategies (child labor, sale of productive assets, informal lenders) that lead them deeper into poverty. Aside from the poor, those groups particularly vulnerable to risks include children, working age adults, elderly and other disadvantaged groups such as the disabled, widows and other marginalized groups. 7. Infants and children face the risk of poverty, malnutrition, low human capital accumulation, and exploitation in the labor force. Over 60 percent of households with multiple children in them are poor. Access to education is still inequitable with only 24 percent of expenditures at the secondary level, and only 17 percent of expenditures at the tertiary level accruing to the poor. About 20 percent of children aged 5 to 17 years are working and over four-fifths of these come from poor households. Malnutrition remains a serious concern, with nearly half of all children under 6 years of age being underweight or stunted. However, there are positive signs - Bangladesh has made tremendous improvements in access to primary and secondary education and in nutritional level of its children over the past three decades. 8. Working age adults face the risk of unemployment and low productivity. Owing, in part, to low levels of human capital accumulation in their formative years, 80 percent of the labor force is either unemployed or working in low-skilled informal sector or seasonal jobs. This makes them more likely to be poor or at increased risk of falling into poverty. Nearly half of the poor in rural areas and more than a third of those in urban areas reside in households where the main occupation of the head is casual wage employment. 9. Elderly adults lack adequate safety nets. Family networks have provided old-age care in Bangladesh. Poverty rates among the elderly are high (43 percent) but below that of the population as a whole (50 percent). However, the increasing proportion of the population that is elderly, compounded with changes in traditional household structures and declining fertility, suggest increased vulnerability of the elderly. 10. There are also special and excluded groups that need assistance. Special categories include the disabled, widowed women, and hill tribes, and other minorities and groups that are among the poorest and most marginalized in Bangladesh. Hill tribes, for example, constitute only about one percent of the population, but their needs are extreme. 11. Aggregate/Climatic Shocks. In addition, Bangladesh regularly faces natural disasters including floods, cyclones and storm surges, flash floods, drought, tornadoes, and landslides. Safety Net Programs in Bangladesh
12. A range of safety net programs is aimed at the different risk groups. Programs can be divided into cash- and food-based transfer programs. While the largest programs tend to be

iii
food-based, conditional cash transfers have become increasingly important, including for improved access to schooling for children, particularly girls.2
• Cash Transfers: Children receive transfers to enroll in school; and the working age population has access to a variety of work-based, cash transfer programs. A cash-transfer program is in place to support the elderly poor, though civil servants also have access to formal pension system. Smaller programs provide cash assistance to other marginalized groups.
• Food/in-kind Transfers: Food/in-kind transfer programs are typically aimed at the poor and are often combined with microcredit programs designed to enable individuals to start up small businesses. Various rapid response food programs help different groups to cope with the aftermaths of natural disasters.
13. Safety net programs are administered through a wide variety of line ministries. These include, among others, the Ministry of Social Welfare, the Ministry of Food and Disaster Management, and the Ministry of Women and Children’s Affairs. Many of the programs are implemented in collaboration with NGOs and are often co-financed by donors. 14. Studies present a mixed picture on the impact of programs. The manner in which some programs have been implemented makes it difficult to evaluate rigorously their impact against their stated objectives. The evidence tells a mixed story, some studies concluding that safety net programs have had a positive role in alleviating poverty in Bangladesh; others questioning whether the programs really do provide a strategy for poverty alleviation or only for consumption and income smoothing. It is also difficult to say whether program participation has increased household consumption and income levels or has had a beneficial impact on human capital accumulation and longer-term income generation. Some studies point to a lack of long-term asset creation and little impact on enhancing educational quality. They conclude that while the programs are valuable in smoothing consumption they do not aid in structural changes in poverty. The Macro and Fiscal Context 15. Reasonable growth rates have led to declines in percentage of poor but the number of poor has not declined, while at the same time expenditures on safety nets have fallen. With reasonable growth over the past decade, poverty levels have fallen to around 50 percent – however, with population growth, the number of poor has remained fairly constant at over 60 million. Yet, while safety net programs are an important component of the government’s social protection strategy, expenditure on the programs is fairly low and declining – and lower than what other countries at similar levels of development spend on these programs (see figure).
2 The importance of food security and malnutrition in the Bangladesh context cannot be overemphasized. However, this issue has been specifically excluded from this report, since it does not fall directly within the canvass of social protection issues. The reader is referred to World Bank’s National Nutrition Program and Karim et al. (2003) for information on nutrition interventions in Bangladesh.
iv
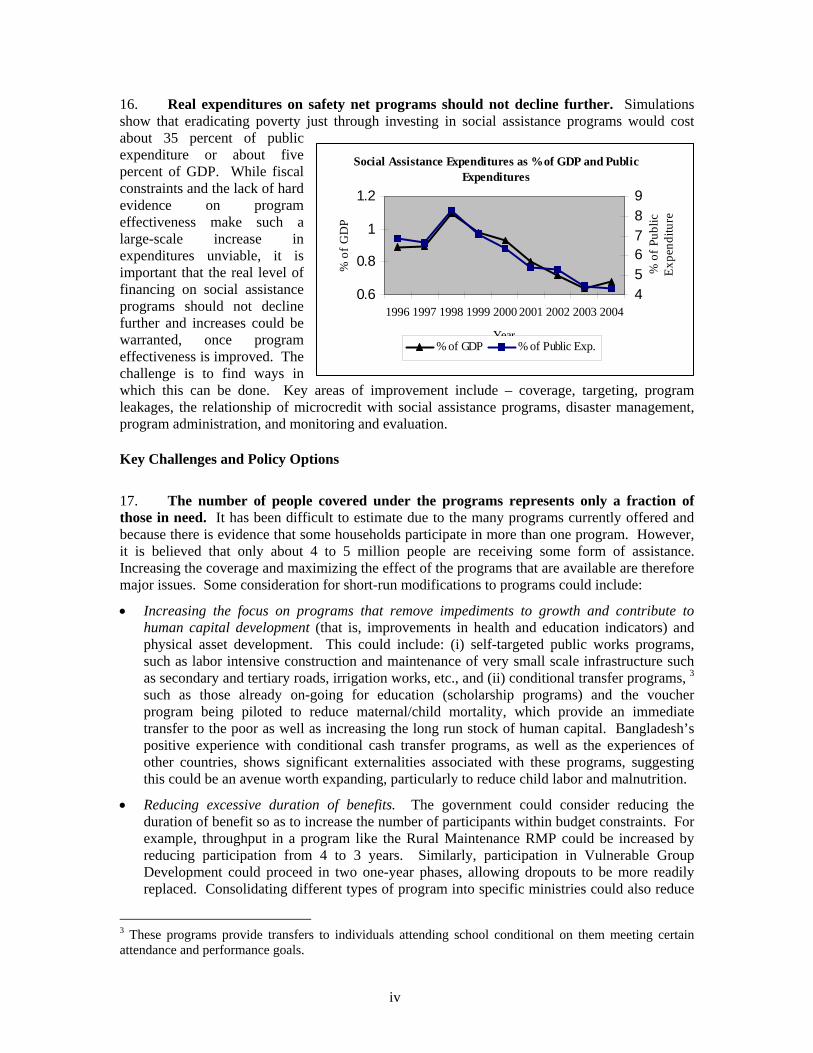
16. Real expenditures on safety net programs should not decline further. Simulations show that eradicating poverty just through investing in social assistance programs would cost about 35 percent of public expenditure or about five percent of GDP. While fiscal constraints and the lack of hard evidence on program effectiveness make such a large-scale increase in expenditures unviable, it is important that the real level of financing on social assistance programs should not decline further and increases could be warranted, once program effectiveness is improved. The challenge is to find ways in which this can be done. Key areas of improvement include – coverage, targeting, program leakages, the relationship of microcredit with social assistance programs, disaster management, program administration, and monitoring and evaluation. Key Challenges and Policy Options
17. The number of people covered under the programs represents only a fraction of those in need. It has been difficult to estimate due to the many programs currently offered and because there is evidence that some households participate in more than one program. However, it is believed that only about 4 to 5 million people are receiving some form of assistance. Increasing the coverage and maximizing the effect of the programs that are available are therefore major issues. Some consideration for short-run modifications to programs could include:
• Increasing the focus on programs that remove impediments to growth and contribute to human capital development (that is, improvements in health and education indicators) and physical asset development. This could include: (i) self-targeted public works programs, such as labor intensive construction and maintenance of very small scale infrastructure such as secondary and tertiary roads, irrigation works, etc., and (ii) conditional transfer programs, 3 such as those already on-going for education (scholarship programs) and the voucher program being piloted to reduce maternal/child mortality, which provide an immediate transfer to the poor as well as increasing the long run stock of human capital. Bangladesh’s positive experience with conditional cash transfer programs, as well as the experiences of other countries, shows significant externalities associated with these programs, suggesting this could be an avenue worth expanding, particularly to reduce child labor and malnutrition.
• Reducing excessive duration of benefits. The government could consider reducing the duration of benefit so as to increase the number of participants within budget constraints. For example, throughput in a program like the Rural Maintenance RMP could be increased by reducing participation from 4 to 3 years. Similarly, participation in Vulnerable Group Development could proceed in two one-year phases, allowing dropouts to be more readily replaced. Consolidating different types of program into specific ministries could also reduce
3 These programs provide transfers to individuals attending school conditional on them meeting certain attendance and performance goals.
Social Assistance Expenditures as % of GDP and Public Expenditures
0.6
0.8
1
1.2
1996 1997 1998 1999 2000 2001 2002 2003 2004
Year%
of G
DP
456789
% o
f Pub
lic
Expe
nditu
re
% of GDP % of Public Exp.
v
the impact of overlaps and allow programs to be monitored and evaluated, and hence developed more appropriately and consistently.
• Reducing the impact of seasonality in the availability of work. Annual recurring difficulties arise as a result of the climactic conditions in Bangladesh. Typical of these is the annual monga4 season – when employment opportunities drop sharply in rural areas. Providing programs to cover these seasons –e.g. through rolling out public works programs during such a season - would assist households to smooth their consumption spending, avoiding the losses in human capital that occur each year. Large shocks such as floods, typhoons also interrupt individuals/households ability to earn a living, and lead them deeper into poverty.
• Increasing the focus on the urban poor. Poverty in urban areas is not as great in absolute terms as in rural areas but it is rising in proportionate terms, a disturbing trend given the movement of people to cities and townships. Methodologies need to be developed for creating urban profiles that are similar to food insecurity maps in rural areas. Procedures could be developed for targeting urban areas based on the profiles and administrative arrangements could be developed for selecting program participants or infrastructure works once target areas are chosen. Furthermore, the government could support NGOs who have proven to be successful in delivering programs targeted to the poor in urban areas.
• Increasing focus on other disadvantaged groups. Mainstream programs need to be made more suitable for special groups (e.g., tribal groups, people with disabilities) taking into account political, cultural and geographical variations and sensitivities. However, not all mainstream programs may be suitable for special groups. Public works programs, for example, may not be appropriate for all disabled people. Hence, special programs may also be required for these groups. For example, programs could be designed for disabled people that include an element of cash transfer combined with demand-driven job-oriented training which will enhance employability and reduce their vulnerability.
18. Targeting. Current targeting criteria may not be appropriate. Land criteria, for example, are widely used to distinguish between the poor and the non-poor but evidence from the HIES suggests these criteria could lead to significant misallocation of resources (that is, to selecting those who are not in need). One criterion used to identify the very poor is to include only people with at most 5 decimals of land. In fact, 59 percent of the poor have less than 5 decimals of land, as do 36 percent of the non-poor. If rural households with less than 5 decimals of land were to be selected at random, over a third of them would be non-poor. Land ownership by itself, then, is not an especially useful criterion.5 Some options to improve targeting include:
• Changing targeting criteria. Households could be targeted using criteria that are most closely related to occupation and income rather than assets such as land. Potential misallocation could be reduced if criteria such as occupation and dwelling characteristics (e.g., access to electricity, toilets) of the household are used. If a random selection were to be made from households with less than 5 decimals of land and whose head is a casual wage earner, less than one fifth of the households would be non-poor. If a random selection were to be made from households with less than 5 decimals of land and with no toilet, only about on in eight of the households selected would be non-poor (see Table 14). Targeting criteria would need to be consistent across programs, which again argues for consolidation of
4 Monga season refers to the period between October and November. This period is a difficult period when there is a draw-down of food stocks and a lean labor market. This precedes the main crop harvest period. 5 An effort to compare the targeting efficiencies of different programs was not attempted here due to the inherent difficulties in comparisons across different programs, with different targets and objectives.
vi
programs. Ad hoc programs for special disadvantaged groups should still use targeting criteria or self-selection as a means of further refining the targets;
• Implementing self-targeting programs. Self-targeting is administratively simple although care has to be taken to appropriately set the level of wages in workfare programs or type of grain varieties in food-based programs, so that programs attract only the poorest and do not adversely affect autonomous employment creation.
19. Leakages. While studies report varying estimates on program leakage, it clearly remains an important issue. Studies point to leakages of the magnitude of 10-50 percent for food-based programs and 5-25 percent for cash-based programs. Some options to reduce these include:
• Monetizing benefits. Monetization could address some of the concerns regarding leakages from food transfer programs. However, it is not sufficient to overcome the problem entirely.
• Minimizing the number of intermediaries in program delivery and making the decisions of intermediaries transparent. Even when benefits have been monetized transfers that involve intermediaries making decisions about variable entitlements can lead to leakage if decisions are not transparent. PESP, by far the country’s largest cash transfer program, has, by one estimate, a loss to beneficiaries of 23 percent of entitlements. This is not really acceptable given the size of the program. Food transfers should also be based on transparent procedures that guarantee full delivery and are monitored to ensure that intermediaries are accountable.
• Adequate monitoring and evaluation. Leakage can go undetected for long periods, undermining a program, if there is little or no monitoring and evaluation (see below).
• Realigning the incentives for service delivery. This is also a critical step in reducing leakages. There are currently very few incentives to ensure service providers achieve the desired service, and very few disincentives against service provider who fail to do so. Linking payment of service providers to timely delivery of quality services – e.g., giving full payment and bonuses to distributors in food transfer programs if full delivery occurs on time and penalizing them if it does not – will reduce leakages.
20. The relationship between microcredit programs and safety net programs needs review. Microcredit programs can have a significant impact on reducing the vulnerability to poverty. However, social assistance programs that provide microcredit may not be targeting the poorest. Screening criteria used to select participants for microcredit programs mostly ensure that participants are capable of repaying loans. This may be difficult for the poor, who will therefore be excluded from the safety net programs. One review of the VGD program, an important safety net program that has embedded in it a major microcredit program, found that a significant minority of participants joined the VGD only to access the microcredit scheme. The women concerned held major assets prior to joining VGD, had a diversified income and were more likely to have husbands with an earned income. Options to redress this effect would be:
• Programs undertaken by ministries should focus on social assistance. Ministries do not have a comparative advantage in providing micro-credit as part of their social assistance programs. Given that there are a range of agencies (e.g., NGOs) providing effective microcredit programs, government agencies should focus on the provision of social assistance targeted to the poor.
• Use only criteria that select the poor. This could be done by ensuring that the poor are targeted using occupation and income criteria, combined with dwelling characteristics.
vii
• Offer flexible plans to the poor. Safety net participants may still take up microcredits. Those that do so should be under plans with features such as flexible repayment schedules, and a more flexible approach to prescribing the minimum on the level of savings participants are required to make.
21. Disaster Management and Social Protection. As noted above, Bangladesh is prone to natural disasters and the country’s disaster management strategy focuses on risk coping. While the strategy is fairly effective in dealing with short-term consequences, a longer term strategy is needed to avoid adverse consequences when household and community-based risk coping mechanisms fail in the face of covariate shocks. Such a strategy would include:
• Developing mechanisms for providing immediate and widespread relief in the event of a disaster. Wherever possible, the government should enlist the help of local community-based and non-governmental institutions to identify the people affected and to create an efficient distribution network.
• Incorporating measures to address the longer term needs of those affected. This includes providing them with assistance to rebuild their homes and their livelihoods. Assistance can include direct grants, subsidized loans, and skills training. Public works/workfare programs can provide an important coping mechanism for those who have lost their livelihood, while also helping to rebuild communities and destroyed infrastructure.
• Develop a multi-faceted approach to food-insecurity. This includes strategies of promotion of domestic markets, private imports, attempting to procure grains through local and international tenders, and targeting food and non-food interventions to food-insecure people.
• Using advances in information technology to track and predict weather as well as to target relief programs. This would induce readiness on the part of the vulnerable population and the public authorities to cope with disasters.
22. Administering Social Protection. Safety net programs in Bangladesh are administered through numerous agencies, non-governmental organizations, and international bi-lateral and multi-lateral partners.6 There is frequent overlap between programs and inadequate coordination across ministries. An integrated approach to social protection is needed. This would:
• Foster coordination between agencies administering social assistance programs. This might mean introducing inter-agency mechanisms such as forums for policy developments and program administration. Typical forums are Budget Committees, Audit Committees, and ad hoc Inter-Ministerial Committees. Particularly relevant examples are the Inter-Ministerial Committees that have been formed to provide input into the PRSP process. This offers the best scope for Government to be appraised of the full implications of policy development, and of the risk of failures and weaknesses in program delivery. Over time, as programs are monetized, the Government could consider using a single agency to administer safety net programs. At the least, a single agency could be responsible for making all cash payments.
• Outsource the delivery of social assistance programs at the local level. Agents would be competitively selected and provided with a management fee to cover the cost of their involvement. They would be responsible for selecting beneficiaries and, in the case of food assistance, for final food distribution. Agents would need contracts for a reasonable time period, with clear performance criteria and measuring procedures in place. Audit procedures
6 Isolating expenditures specifically on safety nets from total social sector spending. Furthermore, it has been impossible to decompose safety net spending by sub-categories, by government ministries and by public and private contributions.
viii
would be needed to monitor the outsourcing arrangements. When performance standards were not met, an agent could be penalized for failure, for example through reducing management fees or terminating contracts.7
23. Monitoring and Evaluation. Problems of leakage and misallocation may go undetected because of inadequate program monitoring. A lack of program evaluation and an inadequate understanding of the impact of programs can lead to uninformed decision-making. Some options include:
• Putting greater emphasis on external monitoring as well as monitoring by the line agencies. Given the low administrative capacity within ministries, program monitoring could be contracted out to independent and competitively selected agencies. While line ministries should enhance their capacity to monitor programs on a day-to-day basis, this could be complemented by monitoring carried out on a random basis by external agents that would visit sites to monitor how beneficiaries are targeted and selected, assess whether beneficiaries are receiving appropriate benefits in a timely manner, and assess whether the ministry is adequately monitoring its programs. Channels should be developed to ensure that these results feed back into the planning process and are used to make informed decisions on redesigning the programs if necessary.
• Attention should also be given to designing alternative qualitative/participatory beneficiary assessment using PRA tools. This can be done by randomly picking up program villages (perhaps a few covering all divisions). Consideration also needs to be given to the application of randomized evaluation techniques for a few programs which are still at their early stages of development.
7 This refers specifically to leakages in the supply and delivery of food based programs, which continue to be a key government instrument. The issue of leakages in food support programs was brought to the attention of the team during focus group meetings and field visits.
1
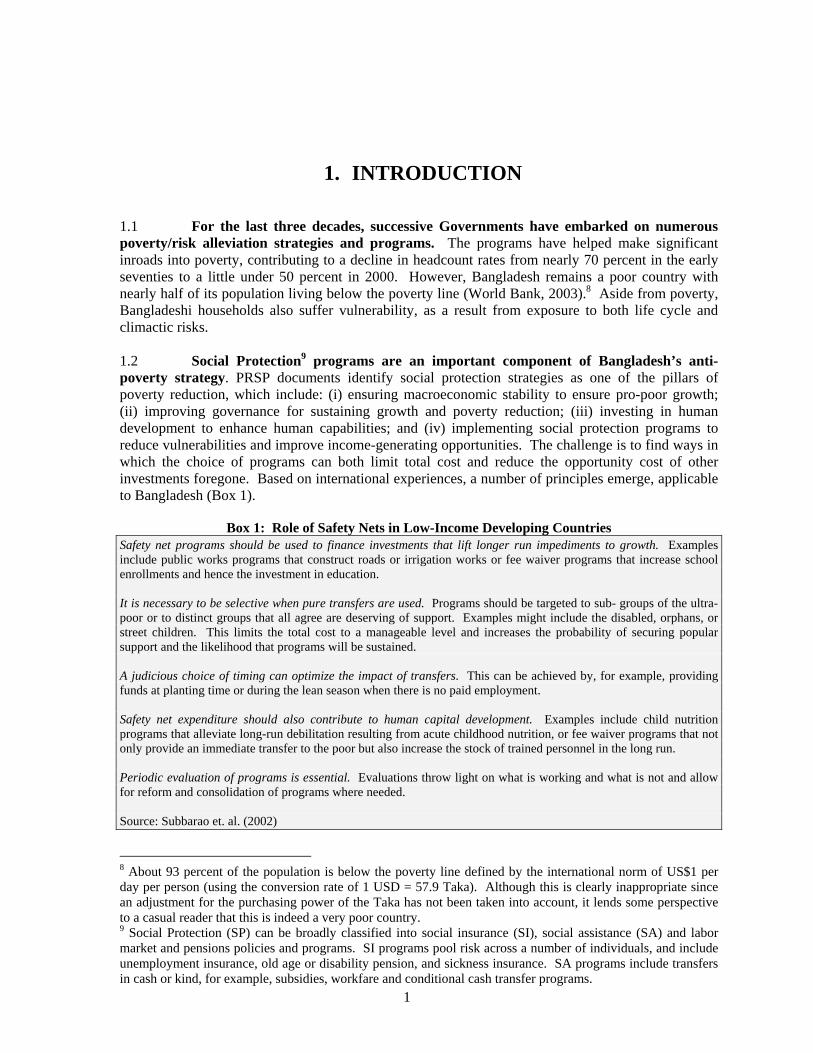
1. INTRODUCTION 1.1 For the last three decades, successive Governments have embarked on numerous poverty/risk alleviation strategies and programs. The programs have helped make significant inroads into poverty, contributing to a decline in headcount rates from nearly 70 percent in the early seventies to a little under 50 percent in 2000. However, Bangladesh remains a poor country with nearly half of its population living below the poverty line (World Bank, 2003).8 Aside from poverty, Bangladeshi households also suffer vulnerability, as a result from exposure to both life cycle and climactic risks. 1.2 Social Protection9 programs are an important component of Bangladesh’s anti-poverty strategy. PRSP documents identify social protection strategies as one of the pillars of poverty reduction, which include: (i) ensuring macroeconomic stability to ensure pro-poor growth; (ii) improving governance for sustaining growth and poverty reduction; (iii) investing in human development to enhance human capabilities; and (iv) implementing social protection programs to reduce vulnerabilities and improve income-generating opportunities. The challenge is to find ways in which the choice of programs can both limit total cost and reduce the opportunity cost of other investments foregone. Based on international experiences, a number of principles emerge, applicable to Bangladesh (Box 1).
Box 1: Role of Safety Nets in Low-Income Developing Countries Safety net programs should be used to finance investments that lift longer run impediments to growth. Examples include public works programs that construct roads or irrigation works or fee waiver programs that increase school enrollments and hence the investment in education. It is necessary to be selective when pure transfers are used. Programs should be targeted to sub- groups of the ultra-poor or to distinct groups that all agree are deserving of support. Examples might include the disabled, orphans, or street children. This limits the total cost to a manageable level and increases the probability of securing popular support and the likelihood that programs will be sustained. A judicious choice of timing can optimize the impact of transfers. This can be achieved by, for example, providing funds at planting time or during the lean season when there is no paid employment. Safety net expenditure should also contribute to human capital development. Examples include child nutrition programs that alleviate long-run debilitation resulting from acute childhood nutrition, or fee waiver programs that not only provide an immediate transfer to the poor but also increase the stock of trained personnel in the long run. Periodic evaluation of programs is essential. Evaluations throw light on what is working and what is not and allow for reform and consolidation of programs where needed. Source: Subbarao et. al. (2002)
8 About 93 percent of the population is below the poverty line defined by the international norm of US$1 per day per person (using the conversion rate of 1 USD = 57.9 Taka). Although this is clearly inappropriate since an adjustment for the purchasing power of the Taka has not been taken into account, it lends some perspective to a casual reader that this is indeed a very poor country. 9 Social Protection (SP) can be broadly classified into social insurance (SI), social assistance (SA) and labor market and pensions policies and programs. SI programs pool risk across a number of individuals, and include unemployment insurance, old age or disability pension, and sickness insurance. SA programs include transfers in cash or kind, for example, subsidies, workfare and conditional cash transfer programs.
2
1.3 Safety nets programs are the basis of the country’s social protection strategy and are the mainstay of the poverty alleviation strategy. Numerous safety net programs have been implemented, aimed at helping different groups within the population cope with adverse shocks that are either idiosyncratic or aggregate in nature. These programs are intended to (i) improve the living standards of the weakest segments of the population (as defined economically, socially, by gender, by location, and by religion), (ii) help in income and consumption smoothing for households that have been impacted with negative shocks, and (iii) prevent and mitigate the impact of economic and natural shocks. Successive governments have recognized the importance of well-functioning safety nets, both for groups that are chronically poor and for those at risk of falling into poverty. Well-functioning safety nets also provide the transient poor an opportunity to climb out of poverty. 1.4 However, fiscal constraints inhibit the use of safety net strategies to alleviate poverty. The government currently spends less than five percent of annual expenditures on safety net programs. Only 4-5 million or 10 percent of the poor are covered through such programs. Given the extent of leakages associated with the programs, the actual proportion of the poor covered is likely to be about 6-7 percent. However, simulations show that eradicating poverty would require 35 percent government expenditures, which is unaffordable. 1.5 This paper assesses the current social safety net programs in Bangladesh. There has been little critical evaluation of safety net programs in Bangladesh. This paper fills in some of the gaps in our understanding of existing safety net programs and presents evidence on the effectiveness of some the main programs, assessed through interviews with key players and the use of secondary data. We have included a discussion on microfinance programs, which are closely linked to many Bangladesh social assistance programs. However, the paper does not attempt to compare programs, since many of the stated objectives of many of these programs are quite varied from each other. Annex I discusses the scope of the report. 1.6 The issues that impinge on the effectiveness and efficiency of programs are also discussed. The paper does not present an exhaustive coverage of all safety net programs in Bangladesh. However, it does examine a wide range of program types. These include: Primary Education Stipend Program (PESP), Female Secondary Stipend Program (FSSAP), Vulnerable Group Development Program (VGD), Food for Work Program (FFW), Rural Maintenance Program (RMP), Vulnerable Group Feeding Program (VGF), Gratuitous Relief Program (GR), and Rural Infrastructure Maintenance Program (RIMP). These have been included because of their importance, size and coverage. 1.7 The report uses the social risk management framework as the basis for much of its analysis. Social risk management policies are aimed at reducing key risks, and breaking inter-generational cycles of poverty and vulnerability by choosing appropriate risk prevention, mitigation and coping strategies to minimize the adverse impact of social and economic shocks. Strategies may involve informal arrangements (i.e., community-based or family-based), market mechanisms (i.e., insurance, banking credit), or government-financed programs (Box 2). 1.8 Key data analyzed. The key primary data analyzed include the Bangladesh Household Income and Expenditure Surveys (1991 and 2000), the 2000 Labor Force Survey, and a representative survey of selected safety net programs which was undertaken in 2003.10
10 There are other data sources which can be used – e.g., the Poverty Monitoring Survey, CARE data, and IFPRI data on safety net programs. However, they have not been analyzed owing to lack of access to these data. Given this, the discussion in the note makes considerable use of background documents and papers that have used alternative data sources.
3
Box 2: Social Risk Management – Diversifying Instruments to Manage Risk
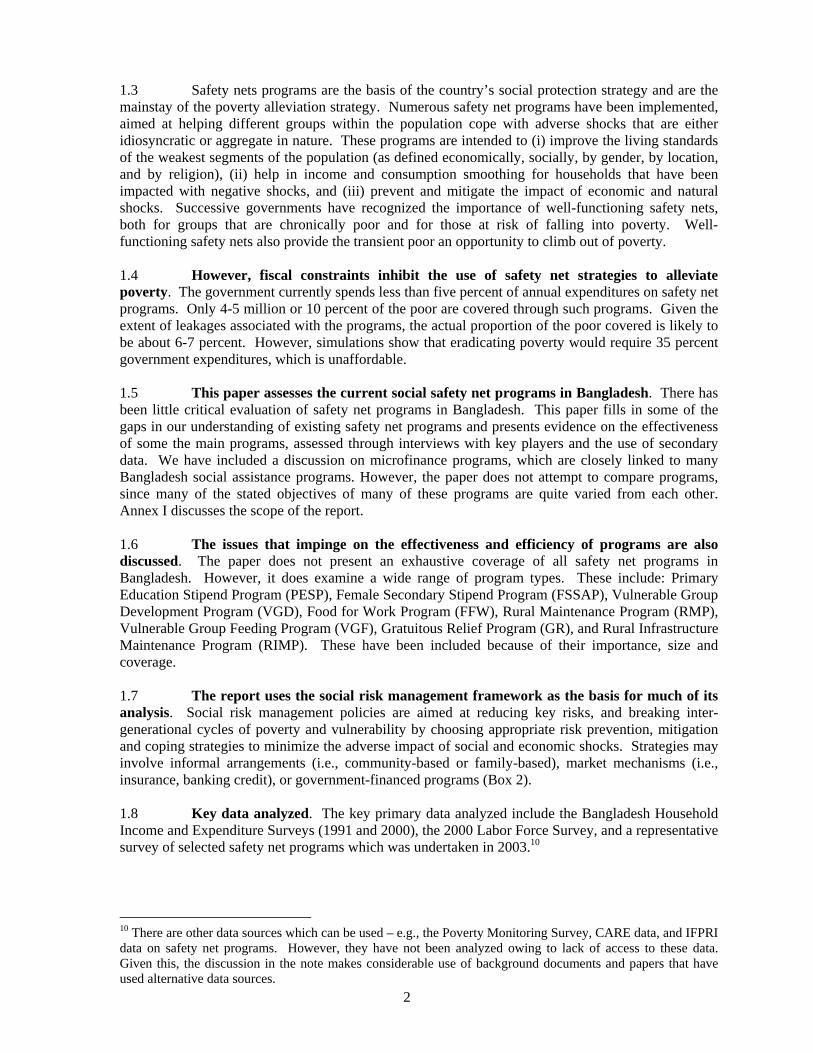
1.9 The paper is organized as follows. Chapter 2 reviews poverty and vulnerability in Bangladesh, and presents their dimensions and characteristics. It focuses on the operational definitions of poverty and vulnerability. Chapter 3 presents an overview of safety net programs in Bangladesh. Chapter 4, based on the evidence available and our analysis, assesses the impact of these programs. Chapter 5 examines issues such as program coverage, targeting, and the administration of programs. Chapter 6 provides options for further developing safety net strategies in Bangladesh.
The capacity of individuals, households and communities to manage risk and the choice of risk management instruments depends upon the characteristics of risk – their sources, correlation, frequency and intensity. Sources of risk may be the result of economic policy, or the result of natural phenomena (e.g., floods, earthquakes). Risks may be uncorrelated (idiosyncratic) or correlated across individuals (covariate), or over time (repeated). While informal or market based instruments may be successful in combating idiosyncratic shocks, they tend to be less effective when facing covariate or macro-type shocks (e.g., collapse in output, high regional unemployment). Hence a combination of strategies and interventions may be appropriate to combat different types of shocks. The range of social risk management instruments can be viewed schematically as a continuum of actions, covering informal family-based arrangements that help cope with the consequences of risk, to formal social insurance programs that mitigate risks associated with ageing and unemployment, and labor force regulations that help actually reduce certain risks. The objective over time is to diversify the social protection instruments in order to address adequately the range of risks faced by society. In the table below, this is represented by a movement to the right toward a diversified system, which includes both public and private risk coping, mitigation, and reduction strategies.
Social Protection Strategies and Selected Instruments
Basic Diversified Instruments Strategies
Reduction Property rights, labor standards, industrial relations policies, employment services
Mitigation Limited social insurance, some private insurance
Private and social insurance including pensions, unemployment benefits, disability, sickness, maternity
Coping Informal, family and community-based transfers and assistance
Informal assistance and limited public safety nets
Informal assistance and social safety nets including cash and in-kind transfers and public works
Social protection systems in many low-income countries are characterized by informal arrangements, with limited public instruments focused on risk coping – the lower left range in the table. As per capita income increases, with a growing formal sector labor force, deepening capital markets and insurance arrangements, and a more stable tax base generating government revenues, it becomes possible to move toward a more diversified social protection system that can more effectively handle a wider range of shocks.

4
5
2. GROWTH AND POVERTY
A. POVERTY IN BANGLADESH
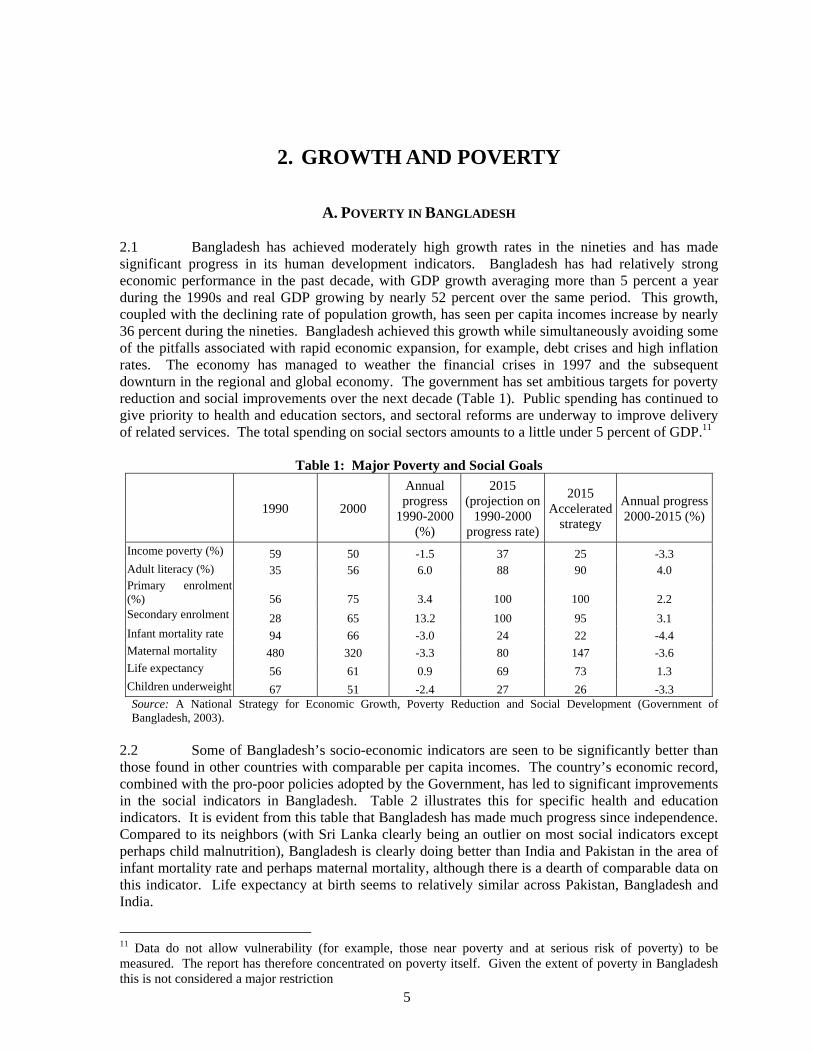
2.1 Bangladesh has achieved moderately high growth rates in the nineties and has made significant progress in its human development indicators. Bangladesh has had relatively strong economic performance in the past decade, with GDP growth averaging more than 5 percent a year during the 1990s and real GDP growing by nearly 52 percent over the same period. This growth, coupled with the declining rate of population growth, has seen per capita incomes increase by nearly 36 percent during the nineties. Bangladesh achieved this growth while simultaneously avoiding some of the pitfalls associated with rapid economic expansion, for example, debt crises and high inflation rates. The economy has managed to weather the financial crises in 1997 and the subsequent downturn in the regional and global economy. The government has set ambitious targets for poverty reduction and social improvements over the next decade (Table 1). Public spending has continued to give priority to health and education sectors, and sectoral reforms are underway to improve delivery of related services. The total spending on social sectors amounts to a little under 5 percent of GDP.11
Table 1: Major Poverty and Social Goals
1990 2000
Annual progress
1990-2000 (%)
2015 (projection on
1990-2000 progress rate)
2015 Accelerated
strategy
Annual progress 2000-2015 (%)
Income poverty (%) 59 50 -1.5 37 25 -3.3 Adult literacy (%) 35 56 6.0 88 90 4.0 Primary enrolment (%) 56 75 3.4 100 100 2.2 Secondary enrolment 28 65 13.2 100 95 3.1 Infant mortality rate 94 66 -3.0 24 22 -4.4 Maternal mortality 480 320 -3.3 80 147 -3.6 Life expectancy 56 61 0.9 69 73 1.3 Children underweight 67 51 -2.4 27 26 -3.3 Source: A National Strategy for Economic Growth, Poverty Reduction and Social Development (Government of Bangladesh, 2003).
2.2 Some of Bangladesh’s socio-economic indicators are seen to be significantly better than those found in other countries with comparable per capita incomes. The country’s economic record, combined with the pro-poor policies adopted by the Government, has led to significant improvements in the social indicators in Bangladesh. Table 2 illustrates this for specific health and education indicators. It is evident from this table that Bangladesh has made much progress since independence. Compared to its neighbors (with Sri Lanka clearly being an outlier on most social indicators except perhaps child malnutrition), Bangladesh is clearly doing better than India and Pakistan in the area of infant mortality rate and perhaps maternal mortality, although there is a dearth of comparable data on this indicator. Life expectancy at birth seems to relatively similar across Pakistan, Bangladesh and India.
11 Data do not allow vulnerability (for example, those near poverty and at serious risk of poverty) to be measured. The report has therefore concentrated on poverty itself. Given the extent of poverty in Bangladesh this is not considered a major restriction

6
Table 2: Social Indicators for Selected South Asian Countries
Infant Mortality Rate (per 1000
live births)
Maternal Mortality
Ratio Reported
(per 100,000 live births)
1985-2002 b,c
Net Primary Enrolment Rate
(%)d, e, f
Net Secondary Enrolment Rate
(%)d, e, f
Life Expectancy
at Birth (Years),
2002
Adult Literacy
Rate (% aged 15 and above),
2002a
Children under
weight for age
(% under 5 years of
age) 1995-2002b
Children under
height for age
(% under 5 years of
age) 1995-2002b
1970 2002 1990/91 2001/02 1990/91 2001/02Sri Lanka 72.5 92.1 29 14 65 17 92 90 105g - -
India 63.7 61.3h 47 46 127 67 540 - 83i - -
Bangladesh 61.1 41.1 48 45 145 51 380 71 87 19 44
Pakistan 60.8 41.5g,h 38 37 120 83 530 35 - - - Source: World Bank 2003(b) Notes: a. Data refer to estimates produced by UNESCO Institute for Statistics in July 2002, unless otherwise specified. Due to
differences in methodology and timing of underlying data, comparisons across countries and over time should be made with caution. b. Data refer to the most recent year available during the period specified. c. Annual number of deaths of women from pregnancy-related causes. The reported column shows figures reported by national authorities. The adjusted column shows results of adjusted figures based on reviews by the United Nations Children's Fund (UNICEF), World Health Organization (WHO) and United Nations Population Fund (UNFPA) to account for well-documented problems of under-reporting and misclassifications. d. The net enrolment ratio is the ratio of enrolled children of the official age for the education level indicated to the total population of that age. Net enrolment ratios exceeding 100% reflect discrepancies between these two data sets. e. Data on net enrolment ratios for 2001/02 refer to the school year, and data on children reaching grade 5 to the 2000/01 school year, unless otherwise specified. Data for some countries may refer to national or UNESCO Institute for Statistics estimates. Because data are from different sources, comparisons across countries should be made with caution. f. Enrolment ratios are based on the new International Standard Classification of Education (International Standard Classification of Education 1997, UNESCO) and may not be strictly comparable with those for earlier years. g. Preliminary UNESCO Institute for Statistics estimate, subject to further revision. h. Census data. i. Data refer to the 2000/01 school year.
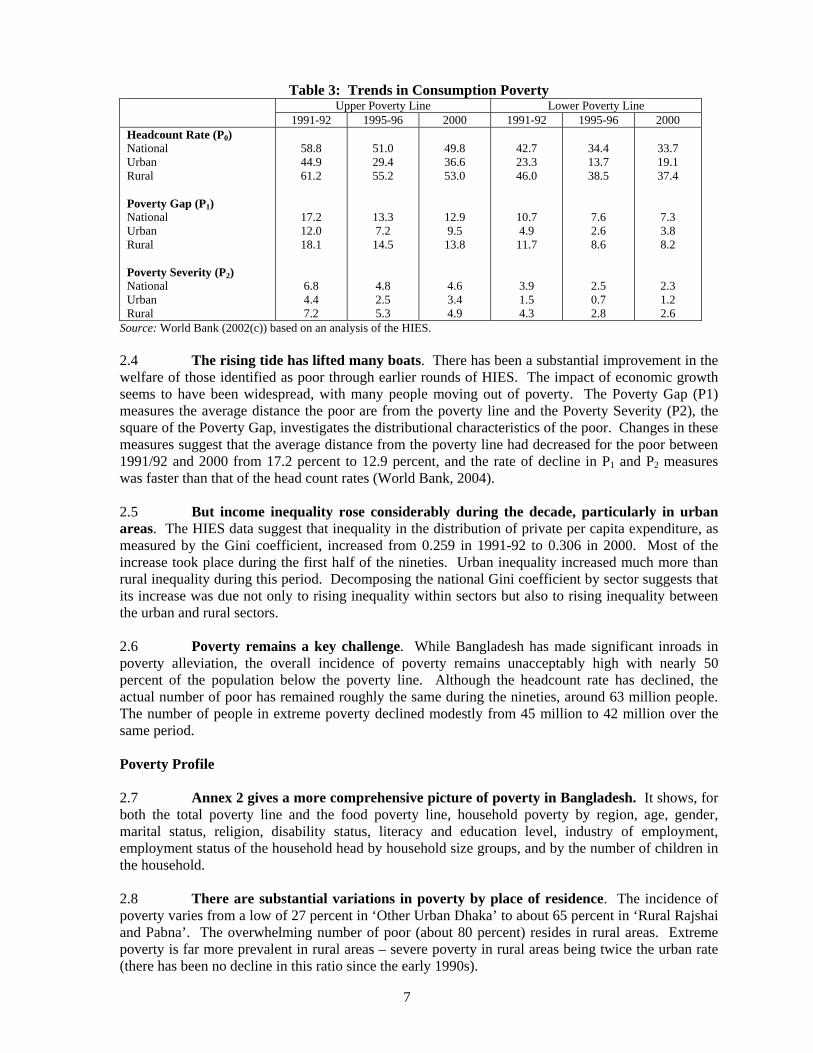
2.3 Poverty headcount rates declined significantly between 1991/92 and 2000.12 The percentage of the population living in poverty fell from over 70 percent in 1970 to about 50 percent in 2000. A decline of nearly 10 percentage points occurred in just the first half of the nineties. The rate of decline slowed between 1996 and 2000, corresponding to a slowdown in economic expansion.13 Table 3 illustrates the declining trends in poverty14 and extreme poverty15 from 58.8 percent to 49.8 percent, and from 42.7 percent to about 33.7 percent, during the nineties.
12 The cost of basic needs (CBN) method was used to derive poverty lines. These lines represented the level of per capita expenditures at which the members of a household can be expected to meet their basic needs, i.e., to meet their caloric requirement for food and to account for some non-food expenditures. It is important to ensure that poverty rate comparisons over time requires that the basic-needs bundles used to estimate poverty lines across time are in constant value in real terms. The base year was chosen to be 1991-1992, and then updated for 1995-1996 and 2000 to reflect changes in cost of living using a price index. Furthermore, regional price variation was taken into account by employing region specific poverty lines, this was achieved by dividing the country into 14 different geographic areas (9 urban and 5 rural). For more details, please refer to the Technical Appendix in World Bank (2002c). 13 However, when the National Income Accounts are used, the rate of decline in poverty is seen to be much more uniformly spread across the years (World Bank 2004). 14 This includes the food consumption expenditure and a non-food component 15 Those defined as food-poor, or those whose consumption expenditures were below the food-poverty line.
7
Table 3: Trends in Consumption Poverty
Upper Poverty Line Lower Poverty Line 1991-92 1995-96 2000 1991-92 1995-96 2000
Headcount Rate (P0) National Urban Rural Poverty Gap (P1) National Urban Rural Poverty Severity (P2) National Urban Rural
58.8 44.9 61.2
17.2 12.0 18.1
6.8 4.4 7.2
51.0 29.4 55.2
13.3 7.2
14.5
4.8 2.5 5.3
49.8 36.6 53.0
12.9 9.5
13.8
4.6 3.4 4.9
42.7 23.3 46.0
10.7 4.9
11.7
3.9 1.5 4.3
34.4 13.7 38.5
7.6 2.6 8.6
2.5 0.7 2.8
33.7 19.1 37.4
7.3 3.8 8.2
2.3 1.2 2.6
Source: World Bank (2002(c)) based on an analysis of the HIES. 2.4 The rising tide has lifted many boats. There has been a substantial improvement in the welfare of those identified as poor through earlier rounds of HIES. The impact of economic growth seems to have been widespread, with many people moving out of poverty. The Poverty Gap (P1) measures the average distance the poor are from the poverty line and the Poverty Severity (P2), the square of the Poverty Gap, investigates the distributional characteristics of the poor. Changes in these measures suggest that the average distance from the poverty line had decreased for the poor between 1991/92 and 2000 from 17.2 percent to 12.9 percent, and the rate of decline in P1 and P2 measures was faster than that of the head count rates (World Bank, 2004). 2.5 But income inequality rose considerably during the decade, particularly in urban areas. The HIES data suggest that inequality in the distribution of private per capita expenditure, as measured by the Gini coefficient, increased from 0.259 in 1991-92 to 0.306 in 2000. Most of the increase took place during the first half of the nineties. Urban inequality increased much more than rural inequality during this period. Decomposing the national Gini coefficient by sector suggests that its increase was due not only to rising inequality within sectors but also to rising inequality between the urban and rural sectors. 2.6 Poverty remains a key challenge. While Bangladesh has made significant inroads in poverty alleviation, the overall incidence of poverty remains unacceptably high with nearly 50 percent of the population below the poverty line. Although the headcount rate has declined, the actual number of poor has remained roughly the same during the nineties, around 63 million people. The number of people in extreme poverty declined modestly from 45 million to 42 million over the same period. Poverty Profile 2.7 Annex 2 gives a more comprehensive picture of poverty in Bangladesh. It shows, for both the total poverty line and the food poverty line, household poverty by region, age, gender, marital status, religion, disability status, literacy and education level, industry of employment, employment status of the household head by household size groups, and by the number of children in the household. 2.8 There are substantial variations in poverty by place of residence. The incidence of poverty varies from a low of 27 percent in ‘Other Urban Dhaka’ to about 65 percent in ‘Rural Rajshai and Pabna’. The overwhelming number of poor (about 80 percent) resides in rural areas. Extreme poverty is far more prevalent in rural areas – severe poverty in rural areas being twice the urban rate (there has been no decline in this ratio since the early 1990s).
8
2.9 Larger households tend to be poorer. While less than 30 percent of households with two or fewer individuals are poor, this proportion rises to 55 percent for households which have several or more members. Similarly, households with more children are more likely to be poor – poverty rates rise from 34 percent for households with no children to 65 percent for households with three or more children. 2.10 Education is a key determinant of poverty. Poverty rates rise from four percent for households where the head has a university degree, to over 60 percent for households where the head had no schooling. In households where the head is literate, poverty levels are 30 percentage points lower than households where the head is illiterate (30 percent versus 60 percent).
B. GROUPS AT RISK
2.11 Aside from poverty, Bangladeshi households are also at risk of falling into poverty. Aside from low income, many households in Bangladesh suffer from vulnerability in income/welfare, as a result of low human capital accumulation, illness, seasonal unemployment, or natural disasters. Additionally, Bangladesh is prone to natural disasters, and past experience suggests that these disasters are capable of affecting everyone in the country.16 I. Life Cycle Infants and Children: Risk of Malnutrition and Low Human Capital Accumulation 2.12 Bangladesh has made considerable progress towards universal access and enrollment. From 1990 to 2002, gross primary enrollment rates rose from 71 percent to 97 percent, and gross secondary enrollment rates rose from 19 percent to 40 percent. Progress has also been made towards gender parity in schooling, with girls’ enrollment now being almost at par with boys’ at the primary level, and with girls’ participation in secondary schooling rising from about 33 percent in early nineties to well over 50 percent currently. 2.13 However, there is considerable variation in school enrollments across economic quintiles. Poor children are less likely than non-poor children to be enrolled in school at any level, but especially at higher levels. While there are nearly as many poor children as non-poor children
Table 4: Distribution of Public and Private Expenditures on Education By quintile By poverty status
1 (lowest) 2 3 4 5 (highest) Poor Non-poor
Total
Per-capita expenditure 8 12 16 22 42 26 74 100% Private education spending 3 7 12 25 52 15 86 100%
Public education spending 12 15 17 23 32 35 65 100%
Primary education 22 23 22 19 14 56 44 100%
Secondary 6 11 16 28 40 24 76 100%
Tertiary 6 6 10 21 57 17 83 100% Source: World Bank (2002(b)).
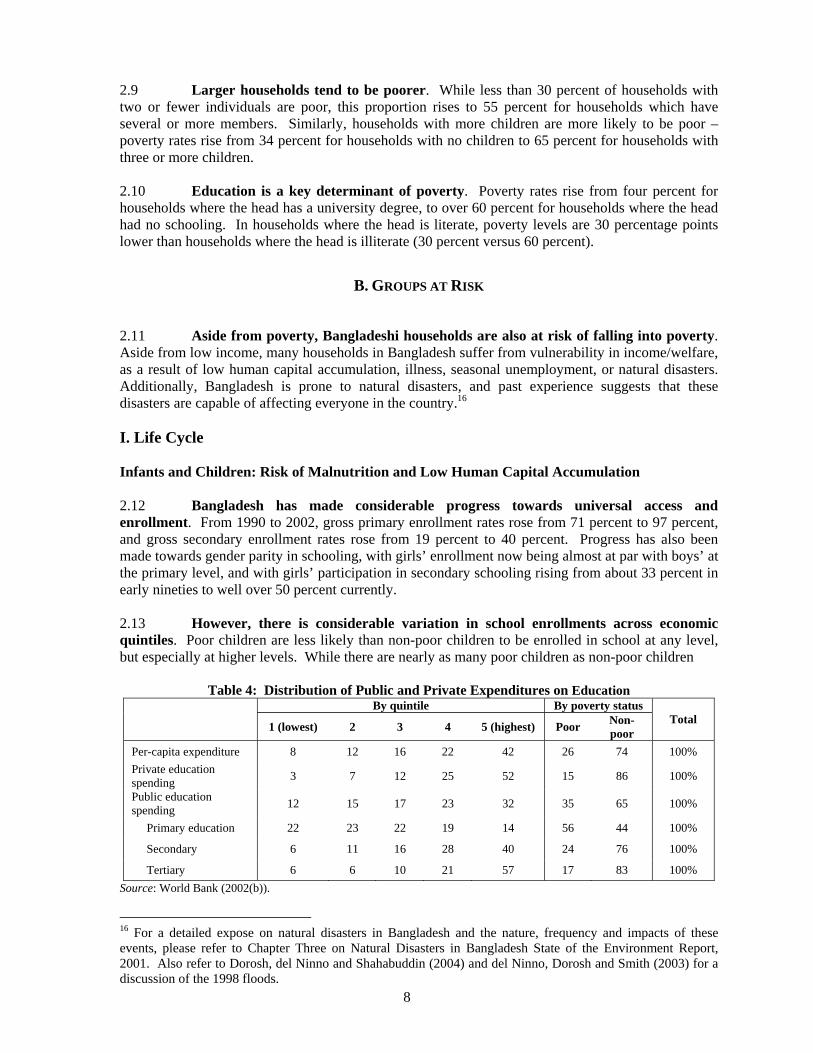
16 For a detailed expose on natural disasters in Bangladesh and the nature, frequency and impacts of these events, please refer to Chapter Three on Natural Disasters in Bangladesh State of the Environment Report, 2001. Also refer to Dorosh, del Ninno and Shahabuddin (2004) and del Ninno, Dorosh and Smith (2003) for a discussion of the 1998 floods.
9
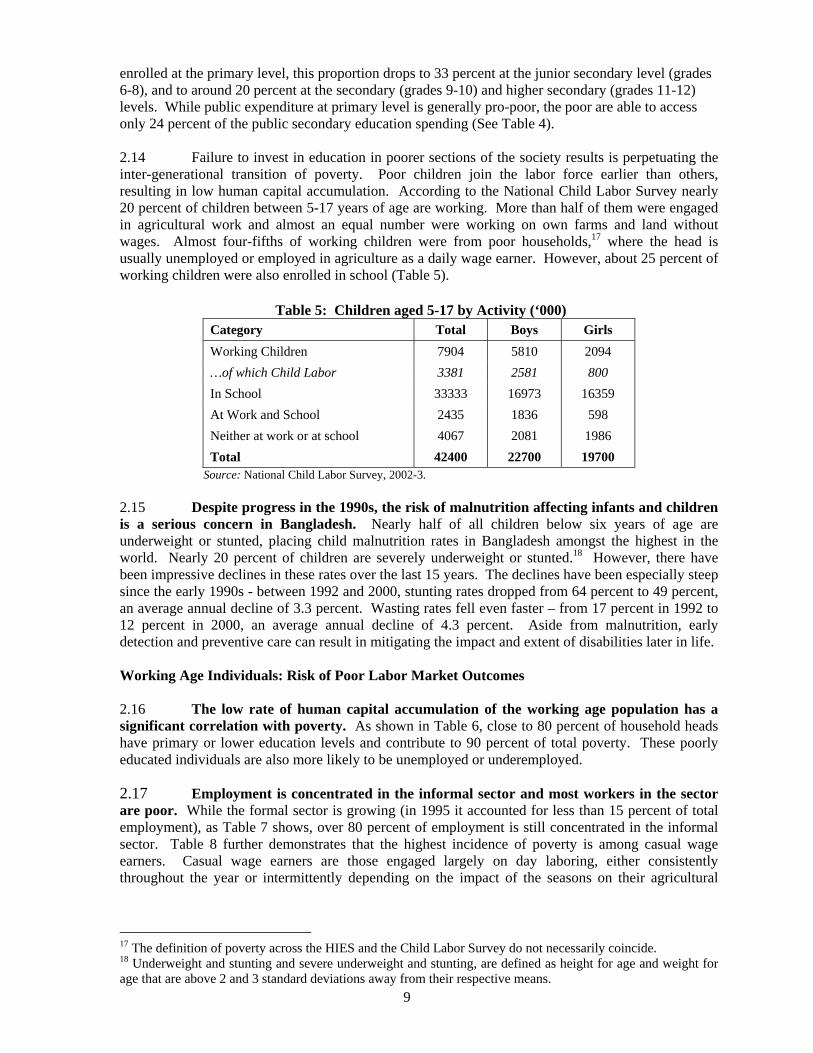
enrolled at the primary level, this proportion drops to 33 percent at the junior secondary level (grades 6-8), and to around 20 percent at the secondary (grades 9-10) and higher secondary (grades 11-12) levels. While public expenditure at primary level is generally pro-poor, the poor are able to access only 24 percent of the public secondary education spending (See Table 4). 2.14 Failure to invest in education in poorer sections of the society results is perpetuating the inter-generational transition of poverty. Poor children join the labor force earlier than others, resulting in low human capital accumulation. According to the National Child Labor Survey nearly 20 percent of children between 5-17 years of age are working. More than half of them were engaged in agricultural work and almost an equal number were working on own farms and land without wages. Almost four-fifths of working children were from poor households,17 where the head is usually unemployed or employed in agriculture as a daily wage earner. However, about 25 percent of working children were also enrolled in school (Table 5).
Table 5: Children aged 5-17 by Activity (‘000) Category Total Boys Girls Working Children 7904 5810 2094 …of which Child Labor 3381 2581 800 In School 33333 16973 16359 At Work and School 2435 1836 598 Neither at work or at school 4067 2081 1986 Total 42400 22700 19700
Source: National Child Labor Survey, 2002-3. 2.15 Despite progress in the 1990s, the risk of malnutrition affecting infants and children is a serious concern in Bangladesh. Nearly half of all children below six years of age are underweight or stunted, placing child malnutrition rates in Bangladesh amongst the highest in the world. Nearly 20 percent of children are severely underweight or stunted.18 However, there have been impressive declines in these rates over the last 15 years. The declines have been especially steep since the early 1990s - between 1992 and 2000, stunting rates dropped from 64 percent to 49 percent, an average annual decline of 3.3 percent. Wasting rates fell even faster – from 17 percent in 1992 to 12 percent in 2000, an average annual decline of 4.3 percent. Aside from malnutrition, early detection and preventive care can result in mitigating the impact and extent of disabilities later in life. Working Age Individuals: Risk of Poor Labor Market Outcomes 2.16 The low rate of human capital accumulation of the working age population has a significant correlation with poverty. As shown in Table 6, close to 80 percent of household heads have primary or lower education levels and contribute to 90 percent of total poverty. These poorly educated individuals are also more likely to be unemployed or underemployed.
2.17 Employment is concentrated in the informal sector and most workers in the sector are poor. While the formal sector is growing (in 1995 it accounted for less than 15 percent of total employment), as Table 7 shows, over 80 percent of employment is still concentrated in the informal sector. Table 8 further demonstrates that the highest incidence of poverty is among casual wage earners. Casual wage earners are those engaged largely on day laboring, either consistently throughout the year or intermittently depending on the impact of the seasons on their agricultural
17 The definition of poverty across the HIES and the Child Labor Survey do not necessarily coincide. 18 Underweight and stunting and severe underweight and stunting, are defined as height for age and weight for age that are above 2 and 3 standard deviations away from their respective means.
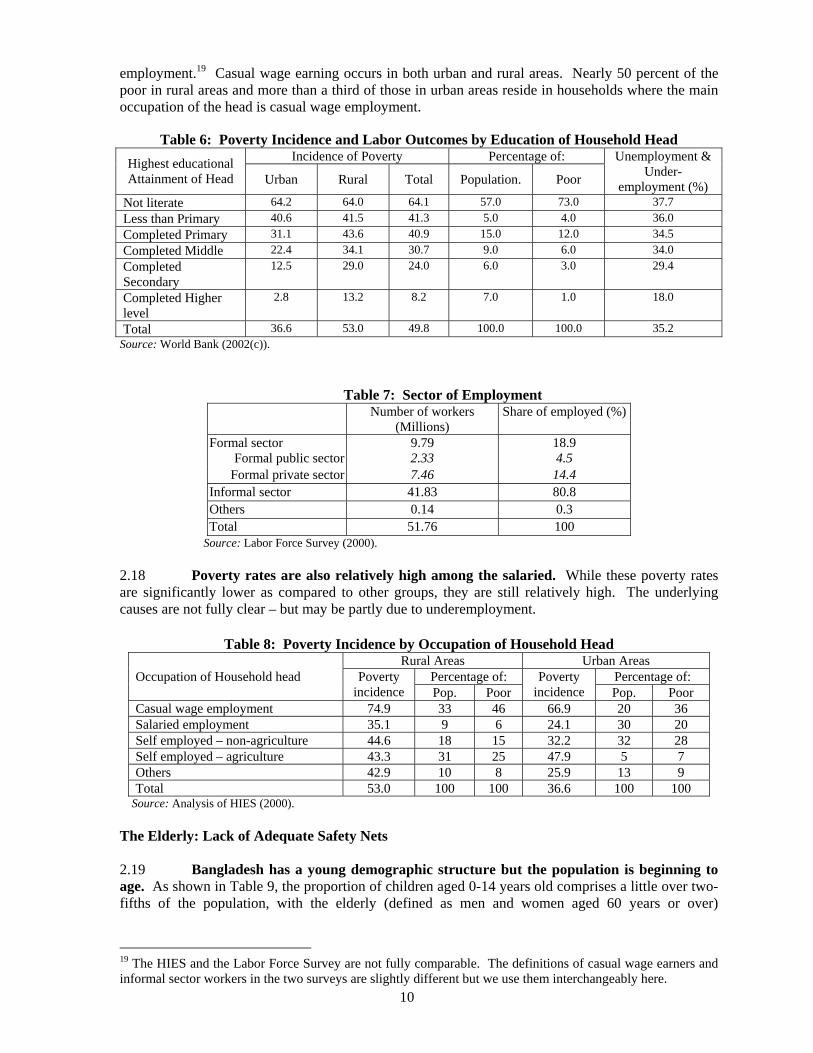
10
employment.19 Casual wage earning occurs in both urban and rural areas. Nearly 50 percent of the poor in rural areas and more than a third of those in urban areas reside in households where the main occupation of the head is casual wage employment.
Table 6: Poverty Incidence and Labor Outcomes by Education of Household Head Incidence of Poverty Percentage of: Highest educational
Attainment of Head Urban Rural Total Population. Poor
Unemployment & Under-
employment (%) Not literate 64.2 64.0 64.1 57.0 73.0 37.7 Less than Primary 40.6 41.5 41.3 5.0 4.0 36.0 Completed Primary 31.1 43.6 40.9 15.0 12.0 34.5 Completed Middle 22.4 34.1 30.7 9.0 6.0 34.0 Completed Secondary
12.5 29.0 24.0 6.0 3.0 29.4
Completed Higher level
2.8 13.2 8.2 7.0 1.0 18.0
Total 36.6 53.0 49.8 100.0 100.0 35.2 Source: World Bank (2002(c)).
Table 7: Sector of Employment Number of workers
(Millions) Share of employed (%)
Formal sector 9.79 18.9 Formal public sector 2.33 4.5
Formal private sector 7.46 14.4 Informal sector 41.83 80.8 Others 0.14 0.3 Total 51.76 100
Source: Labor Force Survey (2000). 2.18 Poverty rates are also relatively high among the salaried. While these poverty rates are significantly lower as compared to other groups, they are still relatively high. The underlying causes are not fully clear – but may be partly due to underemployment.
Table 8: Poverty Incidence by Occupation of Household Head Rural Areas Urban Areas
Percentage of: Percentage of: Occupation of Household head Poverty incidence Pop. Poor
Poverty incidence Pop. Poor
Casual wage employment 74.9 33 46 66.9 20 36 Salaried employment 35.1 9 6 24.1 30 20 Self employed – non-agriculture 44.6 18 15 32.2 32 28 Self employed – agriculture 43.3 31 25 47.9 5 7 Others 42.9 10 8 25.9 13 9 Total 53.0 100 100 36.6 100 100
Source: Analysis of HIES (2000). The Elderly: Lack of Adequate Safety Nets 2.19 Bangladesh has a young demographic structure but the population is beginning to age. As shown in Table 9, the proportion of children aged 0-14 years old comprises a little over two-fifths of the population, with the elderly (defined as men and women aged 60 years or over)
19 The HIES and the Labor Force Survey are not fully comparable. The definitions of casual wage earners and informal sector workers in the two surveys are slightly different but we use them interchangeably here.

11
representing about 6.4 percent of the population. The share of the population that is elderly is growing, a result of increased life expectancy and lower fertility. 2.20 The elderly are also vulnerable to poverty and to health risks related to aging. According to HIES 2000, 43 percent of the elderly belong to poor households. This number is likely to be biased due to mortality selection – the poor are less likely to live longer, and so the elderly are likely to be under-represented among the poor. Additionally, the elderly poor are also particularly vulnerable to health risks.
Table 9: Population Structure Age and Gender Proportion of
Population, 1991 Proportion of
Population, 2000 Children 0-14 years Males 15-59 years Females 15-59 years Males 60 years and over Females 60 years and over
45.4 25.7 23.6 3.0 2.4
41.1 26.9 25.6 3.4 3.0
Source: HIES (1991, 2000). II. General Population Households affected by Natural Disasters 2.21 Bangladesh regularly faces natural disasters such as, floods, cyclones and droughts. In the 1990s alone four major cyclones hit Bangladesh causing widespread damage. There have been two major floods during the past five years (1998, 2004). These regularly occurring events have a significantly adverse impact on the economy and the livelihood of the poor - impacting on agricultural production and, hence, agricultural incomes. Many schools and health centers in rural and urban areas are also affected, with an adverse impact on access to schooling and basic health services. To cope with such shocks, households adopted strategies that compromised their long-term well being. This included reducing food intake, selling productive assets, taking high interest loans, and contracting family members to hazardous labor elsewhere, including abroad. Other Disadvantaged Groups 2.22 These risks are likely to impose greater hardship for particular special/excluded groups: Tribal groups. Tribal groups constitute about one percent of the population, over a million people, mainly residing in Chittagong Hill Tracts. They are increasingly marginalized and economically deprived, have limited access to resources and their social indicators are dismal. Languages and cultural practices create barriers to public services. 2.23 People with Disabilities. A recent major study of disability in Bangladesh (Danish Bilharziasis Laboratory, 2004) accepts (but cannot verify) a widely quoted figure that 10 percent of the population is disabled. Among those aged less than 18 years it is estimated to be about 6 percent, about 3.4 million children and youth. Among those aged 18 years or over disability is estimated to be 14 percent, or 10 million adults. Visual and hearing/speech defects are said to account for 70 to 80 percent of disabilities. These disabilities clearly limit access to education, health, employment, income and basic services. One micro-study concluded that 50 percent of impairments were due to disease and malnutrition, 17 percent to birth defects, 15 percent to accidents and 8 percent to old age (there was some non-response). 2.24 Disadvantaged Women and Widows. While the exact number is not available, many women, especially those residing in rural areas in Bangladesh, would fall in this group. It includes women who are functionally landless, have extremely low farm income, are widowed and have little means of support, work as day laborers, and have few productive assets.

12
13
3. SAFETY NET PROGRAMS IN BANGLADESH
A. HOUSEHOLD RISK COPING MECHANISMS
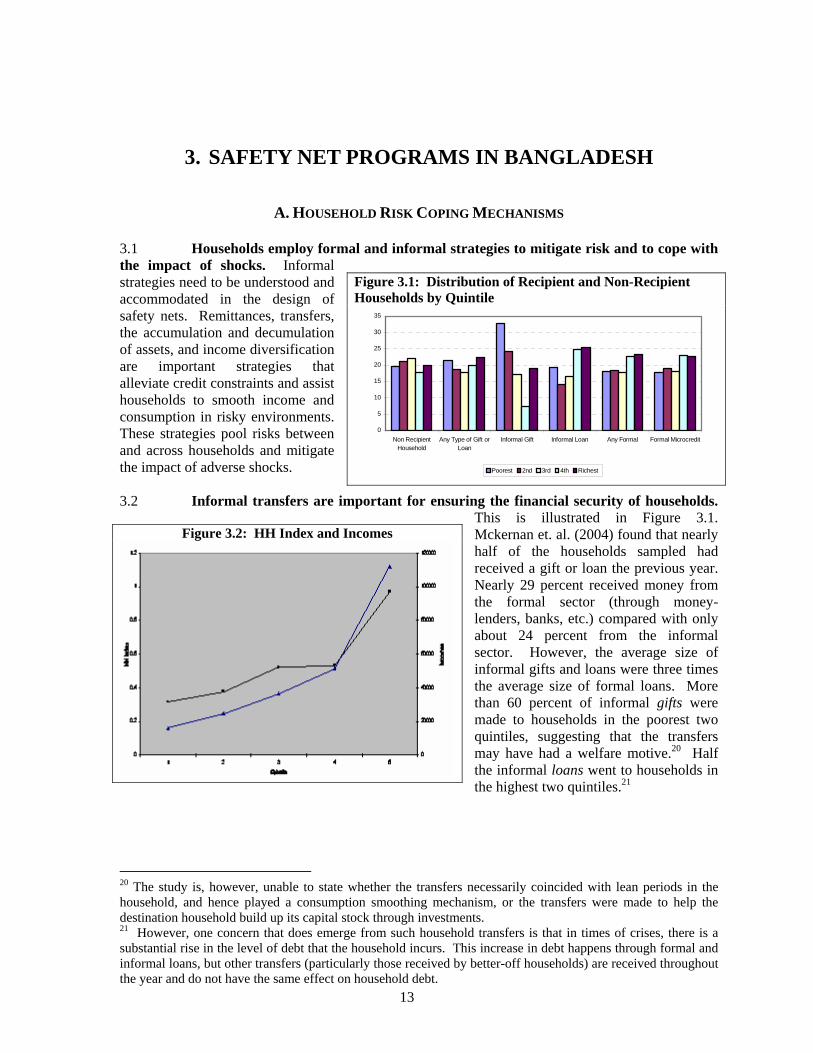
3.1 Households employ formal and informal strategies to mitigate risk and to cope with the impact of shocks. Informal strategies need to be understood and accommodated in the design of safety nets. Remittances, transfers, the accumulation and decumulation of assets, and income diversification are important strategies that alleviate credit constraints and assist households to smooth income and consumption in risky environments. These strategies pool risks between and across households and mitigate the impact of adverse shocks. 3.2 Informal transfers are important for ensuring the financial security of households.
This is illustrated in Figure 3.1. Mckernan et. al. (2004) found that nearly half of the households sampled had received a gift or loan the previous year. Nearly 29 percent received money from the formal sector (through money-lenders, banks, etc.) compared with only about 24 percent from the informal sector. However, the average size of informal gifts and loans were three times the average size of formal loans. More than 60 percent of informal gifts were made to households in the poorest two quintiles, suggesting that the transfers may have had a welfare motive.20 Half the informal loans went to households in the highest two quintiles.21
20 The study is, however, unable to state whether the transfers necessarily coincided with lean periods in the household, and hence played a consumption smoothing mechanism, or the transfers were made to help the destination household build up its capital stock through investments. 21 However, one concern that does emerge from such household transfers is that in times of crises, there is a substantial rise in the level of debt that the household incurs. This increase in debt happens through formal and informal loans, but other transfers (particularly those received by better-off households) are received throughout the year and do not have the same effect on household debt.
Figure 3.1: Distribution of Recipient and Non-Recipient Households by Quintile
0
5
10
15
20
25
30
35
Non RecipientHousehold
Any Type of Gift orLoan
Informal Gift Informal Loan Any Formal Formal Microcredit
Poorest 2nd 3rd 4th Richest
Figure 3.2: HH Index and Incomes
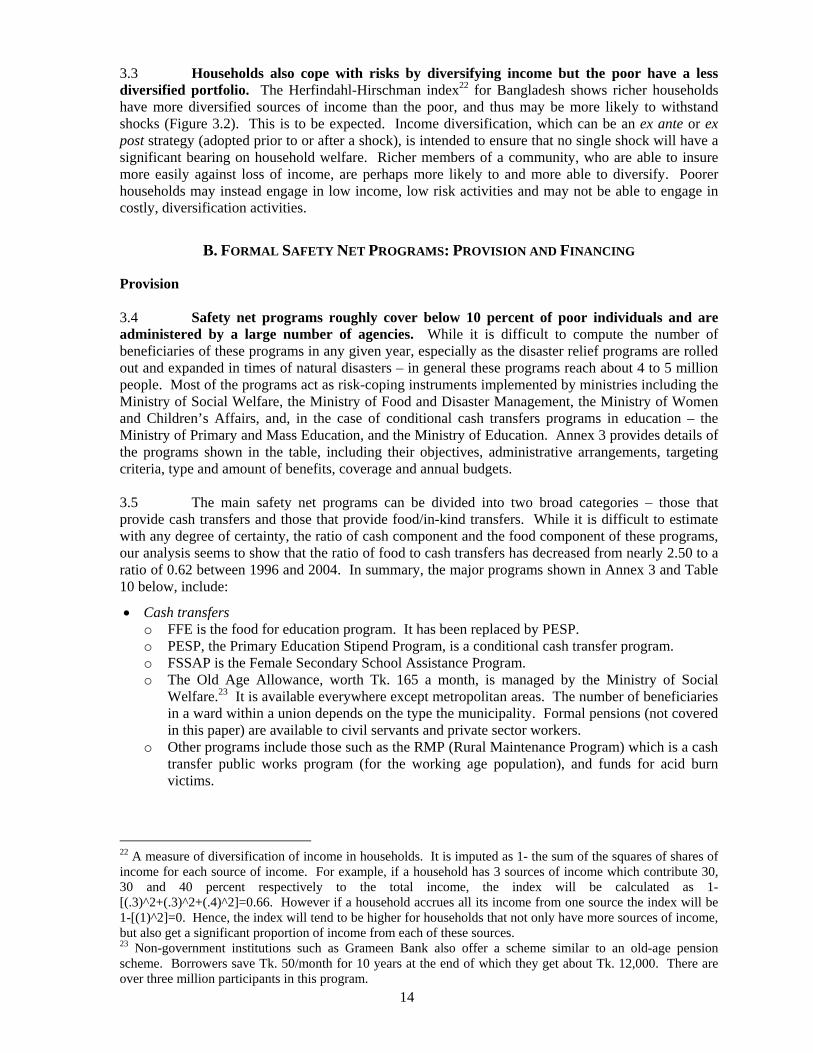
14
3.3 Households also cope with risks by diversifying income but the poor have a less diversified portfolio. The Herfindahl-Hirschman index22 for Bangladesh shows richer households have more diversified sources of income than the poor, and thus may be more likely to withstand shocks (Figure 3.2). This is to be expected. Income diversification, which can be an ex ante or ex post strategy (adopted prior to or after a shock), is intended to ensure that no single shock will have a significant bearing on household welfare. Richer members of a community, who are able to insure more easily against loss of income, are perhaps more likely to and more able to diversify. Poorer households may instead engage in low income, low risk activities and may not be able to engage in costly, diversification activities.
B. FORMAL SAFETY NET PROGRAMS: PROVISION AND FINANCING
Provision 3.4 Safety net programs roughly cover below 10 percent of poor individuals and are administered by a large number of agencies. While it is difficult to compute the number of beneficiaries of these programs in any given year, especially as the disaster relief programs are rolled out and expanded in times of natural disasters – in general these programs reach about 4 to 5 million people. Most of the programs act as risk-coping instruments implemented by ministries including the Ministry of Social Welfare, the Ministry of Food and Disaster Management, the Ministry of Women and Children’s Affairs, and, in the case of conditional cash transfers programs in education – the Ministry of Primary and Mass Education, and the Ministry of Education. Annex 3 provides details of the programs shown in the table, including their objectives, administrative arrangements, targeting criteria, type and amount of benefits, coverage and annual budgets. 3.5 The main safety net programs can be divided into two broad categories – those that provide cash transfers and those that provide food/in-kind transfers. While it is difficult to estimate with any degree of certainty, the ratio of cash component and the food component of these programs, our analysis seems to show that the ratio of food to cash transfers has decreased from nearly 2.50 to a ratio of 0.62 between 1996 and 2004. In summary, the major programs shown in Annex 3 and Table 10 below, include:
• Cash transfers o FFE is the food for education program. It has been replaced by PESP. o PESP, the Primary Education Stipend Program, is a conditional cash transfer program. o FSSAP is the Female Secondary School Assistance Program. o The Old Age Allowance, worth Tk. 165 a month, is managed by the Ministry of Social
Welfare.23 It is available everywhere except metropolitan areas. The number of beneficiaries in a ward within a union depends on the type the municipality. Formal pensions (not covered in this paper) are available to civil servants and private sector workers.
o Other programs include those such as the RMP (Rural Maintenance Program) which is a cash transfer public works program (for the working age population), and funds for acid burn victims.
22 A measure of diversification of income in households. It is imputed as 1- the sum of the squares of shares of income for each source of income. For example, if a household has 3 sources of income which contribute 30, 30 and 40 percent respectively to the total income, the index will be calculated as 1-[(.3)^2+(.3)^2+(.4)^2]=0.66. However if a household accrues all its income from one source the index will be 1-[(1)^2]=0. Hence, the index will tend to be higher for households that not only have more sources of income, but also get a significant proportion of income from each of these sources. 23 Non-government institutions such as Grameen Bank also offer a scheme similar to an old-age pension scheme. Borrowers save Tk. 50/month for 10 years at the end of which they get about Tk. 12,000. There are over three million participants in this program.
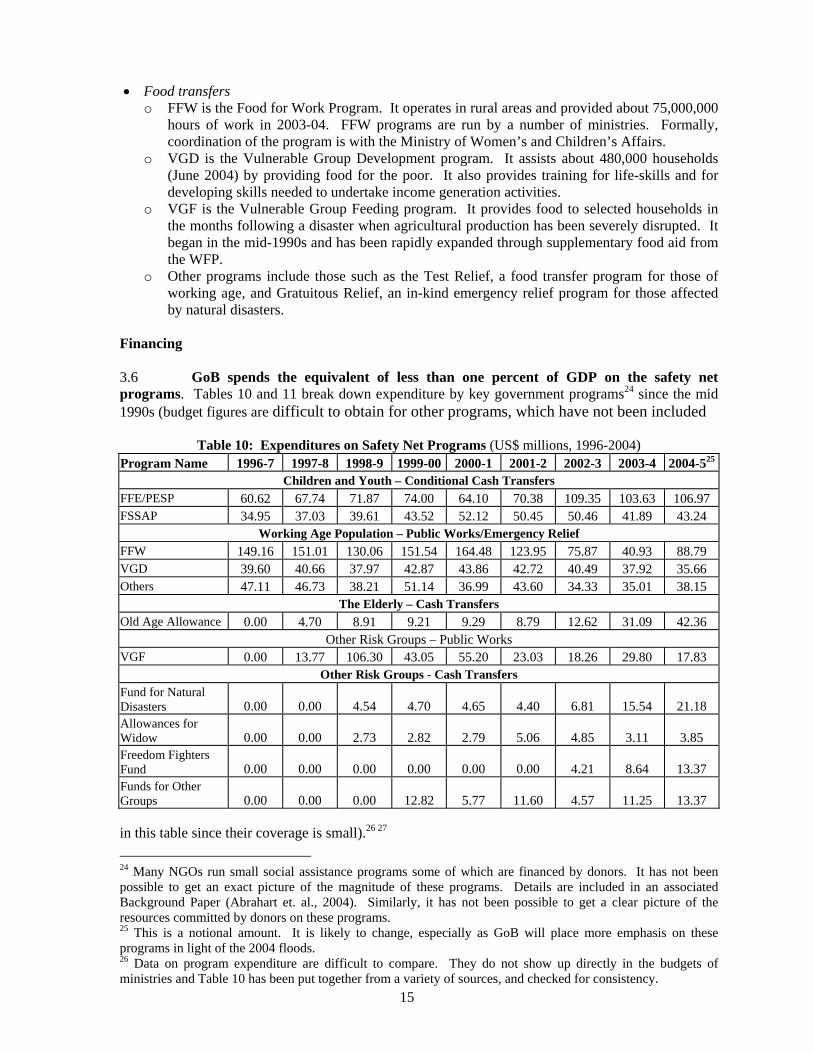
15
• Food transfers
o FFW is the Food for Work Program. It operates in rural areas and provided about 75,000,000 hours of work in 2003-04. FFW programs are run by a number of ministries. Formally, coordination of the program is with the Ministry of Women’s and Children’s Affairs.
o VGD is the Vulnerable Group Development program. It assists about 480,000 households (June 2004) by providing food for the poor. It also provides training for life-skills and for developing skills needed to undertake income generation activities.
o VGF is the Vulnerable Group Feeding program. It provides food to selected households in the months following a disaster when agricultural production has been severely disrupted. It began in the mid-1990s and has been rapidly expanded through supplementary food aid from the WFP.
o Other programs include those such as the Test Relief, a food transfer program for those of working age, and Gratuitous Relief, an in-kind emergency relief program for those affected by natural disasters.
Financing 3.6 GoB spends the equivalent of less than one percent of GDP on the safety net programs. Tables 10 and 11 break down expenditure by key government programs24 since the mid 1990s (budget figures are difficult to obtain for other programs, which have not been included
Table 10: Expenditures on Safety Net Programs (US$ millions, 1996-2004) Program Name 1996-7 1997-8 1998-9 1999-00 2000-1 2001-2 2002-3 2003-4 2004-525
Children and Youth – Conditional Cash Transfers FFE/PESP 60.62 67.74 71.87 74.00 64.10 70.38 109.35 103.63 106.97 FSSAP 34.95 37.03 39.61 43.52 52.12 50.45 50.46 41.89 43.24
Working Age Population – Public Works/Emergency Relief FFW 149.16 151.01 130.06 151.54 164.48 123.95 75.87 40.93 88.79 VGD 39.60 40.66 37.97 42.87 43.86 42.72 40.49 37.92 35.66 Others 47.11 46.73 38.21 51.14 36.99 43.60 34.33 35.01 38.15
The Elderly – Cash Transfers Old Age Allowance 0.00 4.70 8.91 9.21 9.29 8.79 12.62 31.09 42.36
Other Risk Groups – Public Works VGF 0.00 13.77 106.30 43.05 55.20 23.03 18.26 29.80 17.83
Other Risk Groups - Cash Transfers Fund for Natural Disasters 0.00 0.00 4.54 4.70 4.65 4.40 6.81 15.54 21.18 Allowances for Widow 0.00 0.00 2.73 2.82 2.79 5.06 4.85 3.11 3.85 Freedom Fighters Fund 0.00 0.00 0.00 0.00 0.00 0.00 4.21 8.64 13.37 Funds for Other Groups 0.00 0.00 0.00 12.82 5.77 11.60 4.57 11.25 13.37 in this table since their coverage is small).26 27 24 Many NGOs run small social assistance programs some of which are financed by donors. It has not been possible to get an exact picture of the magnitude of these programs. Details are included in an associated Background Paper (Abrahart et. al., 2004). Similarly, it has not been possible to get a clear picture of the resources committed by donors on these programs. 25 This is a notional amount. It is likely to change, especially as GoB will place more emphasis on these programs in light of the 2004 floods. 26 Data on program expenditure are difficult to compare. They do not show up directly in the budgets of ministries and Table 10 has been put together from a variety of sources, and checked for consistency.
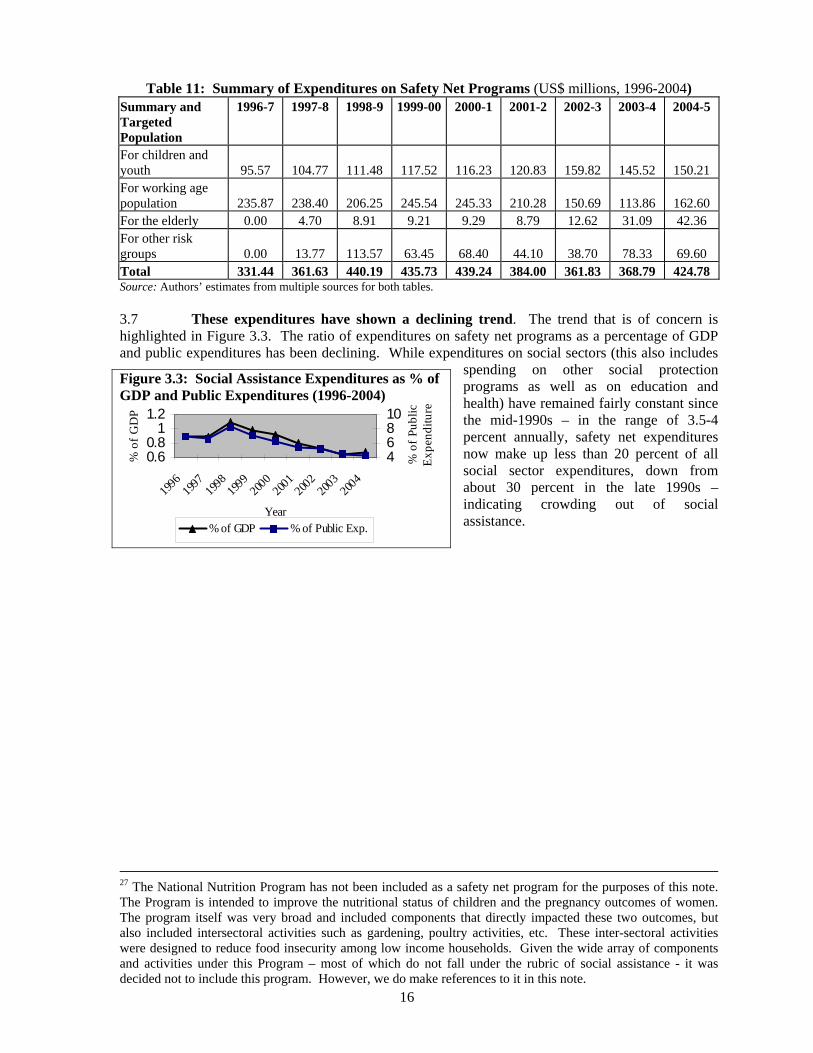
16
Table 11: Summary of Expenditures on Safety Net Programs (US$ millions, 1996-2004)
Summary and Targeted Population
1996-7 1997-8 1998-9 1999-00 2000-1 2001-2 2002-3 2003-4 2004-5
For children and youth 95.57 104.77 111.48 117.52 116.23 120.83 159.82 145.52 150.21 For working age population 235.87 238.40 206.25 245.54 245.33 210.28 150.69 113.86 162.60 For the elderly 0.00 4.70 8.91 9.21 9.29 8.79 12.62 31.09 42.36 For other risk groups 0.00 13.77 113.57 63.45 68.40 44.10 38.70 78.33 69.60 Total 331.44 361.63 440.19 435.73 439.24 384.00 361.83 368.79 424.78 Source: Authors’ estimates from multiple sources for both tables. 3.7 These expenditures have shown a declining trend. The trend that is of concern is highlighted in Figure 3.3. The ratio of expenditures on safety net programs as a percentage of GDP and public expenditures has been declining. While expenditures on social sectors (this also includes
spending on other social protection programs as well as on education and health) have remained fairly constant since the mid-1990s – in the range of 3.5-4 percent annually, safety net expenditures now make up less than 20 percent of all social sector expenditures, down from about 30 percent in the late 1990s – indicating crowding out of social assistance.
27 The National Nutrition Program has not been included as a safety net program for the purposes of this note. The Program is intended to improve the nutritional status of children and the pregnancy outcomes of women. The program itself was very broad and included components that directly impacted these two outcomes, but also included intersectoral activities such as gardening, poultry activities, etc. These inter-sectoral activities were designed to reduce food insecurity among low income households. Given the wide array of components and activities under this Program – most of which do not fall under the rubric of social assistance - it was decided not to include this program. However, we do make references to it in this note.
Figure 3.3: Social Assistance Expenditures as % of GDP and Public Expenditures (1996-2004)
0.60.8
11.2
1996
1997
1998
1999
2000
2001
2002
2003
2004
Year
% o
f GD
P
46810
% o
f Pub
lic
Expe
nditu
re
% of GDP % of Public Exp.
17
4. EVIDENCE OF PROGRAM IMPACTS 4.1 Few of the interventions described in the preceding section have been rigorously evaluated. It has not been possible to make a comprehensive and rigorous assessment of the entire safety net system given the large number of programs run by the Government and the manner in which they have been developed and implemented. Although some programs have been evaluated many of the evaluations have focused on the microcredit component of the safety net programs and less on program impacts. This makes it somewhat difficult to draw definite conclusions about the performance and future policy directions of safety net programs in Bangladesh. Based on the limited evidence available, we have tried to examine the extent to which safety net programs have been successful in addressing poverty and vulnerability and also looked at whether these programs have had other impacts – e.g., on human capital accumulation and empowerment of women. 4.2 Studies present a mixed picture of the impacts of various programs. While some conclude that the evidence demonstrates the importance of safety net programs, others conclude that there is limited support for the success of these programs. 4.3 There is evidence that program participation helps increase consumption and income levels for beneficiary households compared to non-beneficiary households. Studies show that most households benefiting from cash transfer programs have increased household income (del Ninno and Dorosh (2001), Matin and Hulme (2003). They have concluded that households that have benefited from these programs are seen to have improved their income levels and the quality and quantity of their food-intake. Impact evaluations of VGD suggest the program has had a positive impact on reducing the poverty of beneficiaries. 4.4 There is evidence of the long-term developmental impact of some programs.. Evaluation studies of RMP showed that about three-fifths of beneficiaries maintained their standard of living and undertook self-employment after graduating from the program. Khanum (2000) reports remarkable improvement in housing conditions of RMP beneficiaries where pre-RMP and post-RMP home ownership mushroomed from 3 to 33 percent respectively. Nearly 90 percent of beneficiaries improved their housing conditions by changing poles, fencing materials, doors and roofs. Beneficiary households are also shown to have allocated a part of their total household income to the purchase of productive assets, as well as sustaining consumption levels across time. This investment spending is expected to improve future income and livelihood opportunities for these households and provide a strategy for mitigating risk through asset diversification. Begum and Majumdar (2001) show that about 19 per cent of Old Age Allowance recipients invested their allowance money for buying goat, cow, poultry etc., which has a long-term development impact through livelihood creation. Similarly, beneficiaries from the widow allowance program acquired cattle and poultry, which have potential for future income generation. Extensive evaluations of the National Nutrition Program (Karim et. al., 2003) suggest considerable improvements in welfare, with significant reductions in poverty, improvements in school enrolment, particularly for girls and in lowering the age at first marriage. 4.5 Participation in programs is credited with considerable changes in social and household characteristics, the most important being the role and empowerment of women in the household and society. Recent findings from a BIDS survey (BIDS, 2003) finds that more beneficiaries than non-beneficiaries live with children and in joint families, thereby addressing concerns of old age security

18
for parents and helping to revive traditional family systems.28 The impact of microcredit schemes in Bangladesh has been credited with reducing fertility through the increased use and acceptance of contraceptives, ensuring participation of girls in schooling activities, and improving the social status of women in the household. Improvements in the social status of women have been particularly true for widows, divorcees, and disabled women. 4.6 Evidence of the impact of public workfare programs is mixed. When workfare programs have been well planned and administered, with key community infrastructure objectives such as school building, water tanks, irrigation canals, rural roads, etc., being undertaken, they have succeeded in building sustainable community assets. Unfortunately, much of the anecdotal evidence suggests the inability of weak, local governments to undertake these projects and create community assets that are of good quality and durable. Furthermore, once the infrastructure has been created there is very little input into the maintenance of these assets. 4.7 Evidence of the impact of conditional transfer programs is encouraging. While conditional transfer programs have had an impact on human capital accumulation, their impact on poverty is more difficult to gauge. For example, the FSSAP and the FFE programs have had an impact on long term development by fostering human capital formation through increasing the primary enrollment rate, promoting school attendance, and reducing drop-out rates (BIDS, 2003). Girls now constitute about 55 percent of secondary enrollment, compared to around 33 percent in 1993 when the FFSAP program was initiated. There is also some evidence that dropout rates for girls are lower than that for boys, even though boys seem to perform better on average than girls (Ahmed, 2004a). In the case of the FFE program, the overall enrollment rate following the introduction of the program rose by 34 percent (27 percent for boys and 41 percent for girls), compared with a rise of only 2.5 percent for non-FFE schools (Ahmed and del Ninno 2002). Ahmed and del Ninno (2002) also find that attendance rates for FFE schools were 10 percentage points higher than for non-FFE schools, and drop-out rates were just about 6 percent compared to 15 percent for non-beneficiaries in FFE schools, and 11 percent in non-FFE schools. . 4.8 The proportion of girls of secondary school age who work has declined significantly. Table 12 shows that working girls – who were the potential beneficiaries from the female stipend program – dropped sharply as compared to boys between 1995/6-2002/3.
Table 12: Working Children 10-14 Number of Children
(‘000) Number of Working
Children (‘000) Percent of working
children Year Boys Girls Boys Girls Boys Girls
1995/6 9,064 7,993 3,416 2,261 37.7 28.3 2002/3 8,923 7,980 3,192 1,215 35.8 15.2
Source: National Child Labor Survey, 2002-3.
28 Although the opposite is a key concern of introducing social security schemes, which may then alter family structures and impact on old age security.

19
5. ISSUES FOR CONSIDERATION 5.1 This section draws out issues for consideration that could be the subject of further discussion among stakeholders, and between the World Bank and the Government. The issues include questions of program design – the coverage of programs and their targeting, and leakage of assistance to non-beneficiaries. They also include questions of program management - administrative issues that hamper effective and timely delivery of these services, and inadequate monitoring and evaluation.
A. PROGRAM DESIGN Financing and Fiscal Impacts 5.2 The Government of Bangladesh spends less than five percent of government expenditures, equivalent to less than one percent of GDP, on safety net programs. The budget has
also been declining relative to the GDP and public expenditures since the late 1990s. Figure 5.1 illustrates expenditure on safety net programs in other regions. Exact comparisons between regions are difficult since the package of interventions included in each region can vary substantially from one to another. Sub-Saharan Africa and South Asia probably
spend largely on relief and crisis operations, while Eastern and Central Europe spend on unemployment insurance. North America and Western Europe spend mostly on old age social security programs. The most valid comparisons for Bangladesh are probably with sub-Saharan Africa and South Asia, where most social protection focuses on safety nets. Even if expenditure on other social protection programs (pensions, labor market) is included, Bangladesh still seems to spend somewhat below the norm (less than two percent of GDP)29 – as compared to two percent for Africa and close to five percent for South Asia. 5.3 It is difficult to assess the optimal expenditure for social protection programs, particularly social safety nets. Social protection programs have the potential to address vulnerability and income inequality and can help to improve social cohesion, provide strategies for risk mitigation by households, and reduce irreversible loss of assets.30 However, programs need to balance protection of the poor against their fiscal impacts. If poorly designed, programs can be expensive, have high opportunity costs, and incur deadweight loss.
29 Less than four percent of GDP, if expenditures on health and education are added. It is difficult to quantify the amount spent by external donors on these programs. 30 Except in the event of a massive aggregate shock as the Asian Financial Crisis or the 1998 floods in Bangladesh.
Figure 5.1: International Expenditures on SP (as %of GDP) )
0
5
10
15
20
25
SubSaharanAfrica
South Asia East Asiaand thePacif ic
Lat inAmerica
andCaribbean
M iddleEast and
NorthAfrica
Easternand
CentralEurope
NorthAmerica
WesternEurope
20
5.4 Eliminating all poverty only through safety net programs is not fiscally affordable. It is possible to simulate crudely the expenditure that would be needed to eliminate poverty in Bangladesh at a point in time. The national poverty gap in Bangladesh is 12.9 percent; in order to cover this gap, perfectly targeted transfers to poor households (with no administrative costs and no leakage) would cost 4.9 percent and 2.3 percent of GDP. This would bring households to the overall poverty line and the food poverty line respectively. These numbers would be equivalent to about 35 percent and 17 percent respectively of public expenditure. This is clearly unaffordable, especially in a fiscally constrained environment such as Bangladesh. 5.5 Expenditure should at least be kept constant in real terms and some increase might still be warranted on programs targeted at the most vulnerable. While a whole scale increase in the size of all programs is not warranted, a case can be made to enhance expenditures on programs that are shown to be working reasonably well and those that target the most vulnerable. Coverage of Safety Net Programs 5.6 While coverage is relatively low, a significant number of households gain access to multiple programs. It is difficult to measure program coverage precisely (that is, the number of beneficiaries). However, it is assumed that some 4 to 5 million (excluding conditional cash transfers in the education sector) are receiving assistance. Even if the interventions were perfectly targeted that would still mean that less than 10 percent of the poor receive benefits – due to mistargeting and leakages, only about 6-7 percent of the poor are actually covered. Households and individuals who gain access to multiple programs further diminish the overall coverage. Data from a study of transfer programs31 shows that about a quarter of households were receiving transfers from more than one government safety net program. Analysis of the HIES also showed that over 11 percent of households were participating in at least two of the three programs analyzed in the survey – VGD, FFE and FFW. This points to a need to specify program objectives and target beneficiaries more clearly, to tighten administrative procedures to avoid overlaps in target groups, and to put in place procedures to minimize the number of households capturing benefits from more than one program. 5.7 Coverage in urban areas remains low. This can be justified on the grounds that there are roughly 4-5 times as many poor people in rural areas as there are in urban areas. In addition, existing social assistance programs have two major antecedents – relief from natural disasters and the development of income generation activities – that have favored the introduction of programs in rural areas. However, given the rapid expansion in urban populations and the inadequacy of services provided to these residents, significant social problems are expected to emerge in the near future. Urban poverty seems to be increasing, and the rapid increase in urban population is bound is placing further strain on infrastructure and services.
5.8 Programs often do not take account of seasonality and need to better address natural disasters. Annual recurring difficulties arise as a result of the climactic conditions in Bangladesh. A seasonal crisis breaks out – e.g., in the annual ‘monga’ season (Box 3) – between times of crop harvesting when little farm-based employment is available in rural areas and many poor workers migrate to the city in search of temporary employment. In some cases, public works programs creating infrastructure are geared towards generating employment in the dry season, which is also the peak season for agricultural employment. Hence, programs are not necessarily geared to respond to this seasonality in employment.
31 Delivery Mechanism for Cash Transfer Programs to the Poor (Ahmed, 2004).
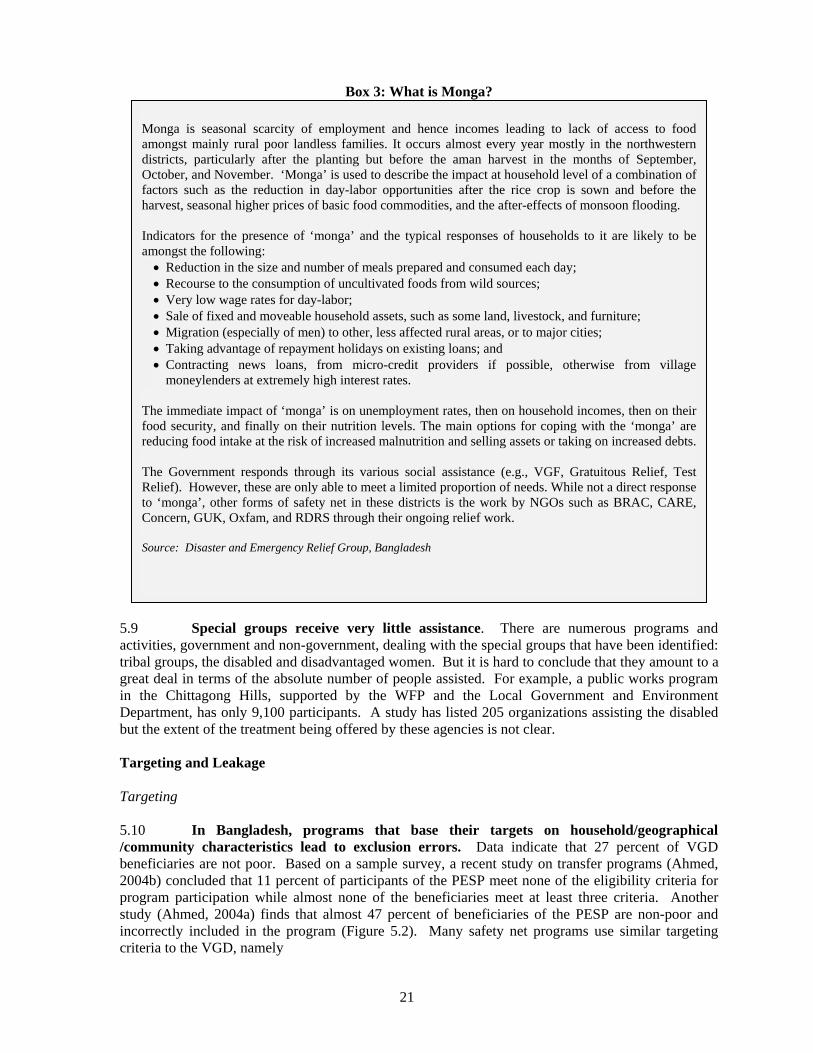
21
Box 3: What is Monga?
5.9 Special groups receive very little assistance. There are numerous programs and activities, government and non-government, dealing with the special groups that have been identified: tribal groups, the disabled and disadvantaged women. But it is hard to conclude that they amount to a great deal in terms of the absolute number of people assisted. For example, a public works program in the Chittagong Hills, supported by the WFP and the Local Government and Environment Department, has only 9,100 participants. A study has listed 205 organizations assisting the disabled but the extent of the treatment being offered by these agencies is not clear. Targeting and Leakage Targeting 5.10 In Bangladesh, programs that base their targets on household/geographical /community characteristics lead to exclusion errors. Data indicate that 27 percent of VGD beneficiaries are not poor. Based on a sample survey, a recent study on transfer programs (Ahmed, 2004b) concluded that 11 percent of participants of the PESP meet none of the eligibility criteria for program participation while almost none of the beneficiaries meet at least three criteria. Another study (Ahmed, 2004a) finds that almost 47 percent of beneficiaries of the PESP are non-poor and incorrectly included in the program (Figure 5.2). Many safety net programs use similar targeting criteria to the VGD, namely
Monga is seasonal scarcity of employment and hence incomes leading to lack of access to food amongst mainly rural poor landless families. It occurs almost every year mostly in the northwestern districts, particularly after the planting but before the aman harvest in the months of September, October, and November. ‘Monga’ is used to describe the impact at household level of a combination of factors such as the reduction in day-labor opportunities after the rice crop is sown and before the harvest, seasonal higher prices of basic food commodities, and the after-effects of monsoon flooding. Indicators for the presence of ‘monga’ and the typical responses of households to it are likely to be amongst the following: • Reduction in the size and number of meals prepared and consumed each day; • Recourse to the consumption of uncultivated foods from wild sources; • Very low wage rates for day-labor; • Sale of fixed and moveable household assets, such as some land, livestock, and furniture; • Migration (especially of men) to other, less affected rural areas, or to major cities; • Taking advantage of repayment holidays on existing loans; and • Contracting news loans, from micro-credit providers if possible, otherwise from village
moneylenders at extremely high interest rates. The immediate impact of ‘monga’ is on unemployment rates, then on household incomes, then on their food security, and finally on their nutrition levels. The main options for coping with the ‘monga’ are reducing food intake at the risk of increased malnutrition and selling assets or taking on increased debts. The Government responds through its various social assistance (e.g., VGF, Gratuitous Relief, Test Relief). However, these are only able to meet a limited proportion of needs. While not a direct response to ‘monga’, other forms of safety net in these districts is the work by NGOs such as BRAC, CARE, Concern, GUK, Oxfam, and RDRS through their ongoing relief work. Source: Disaster and Emergency Relief Group, Bangladesh
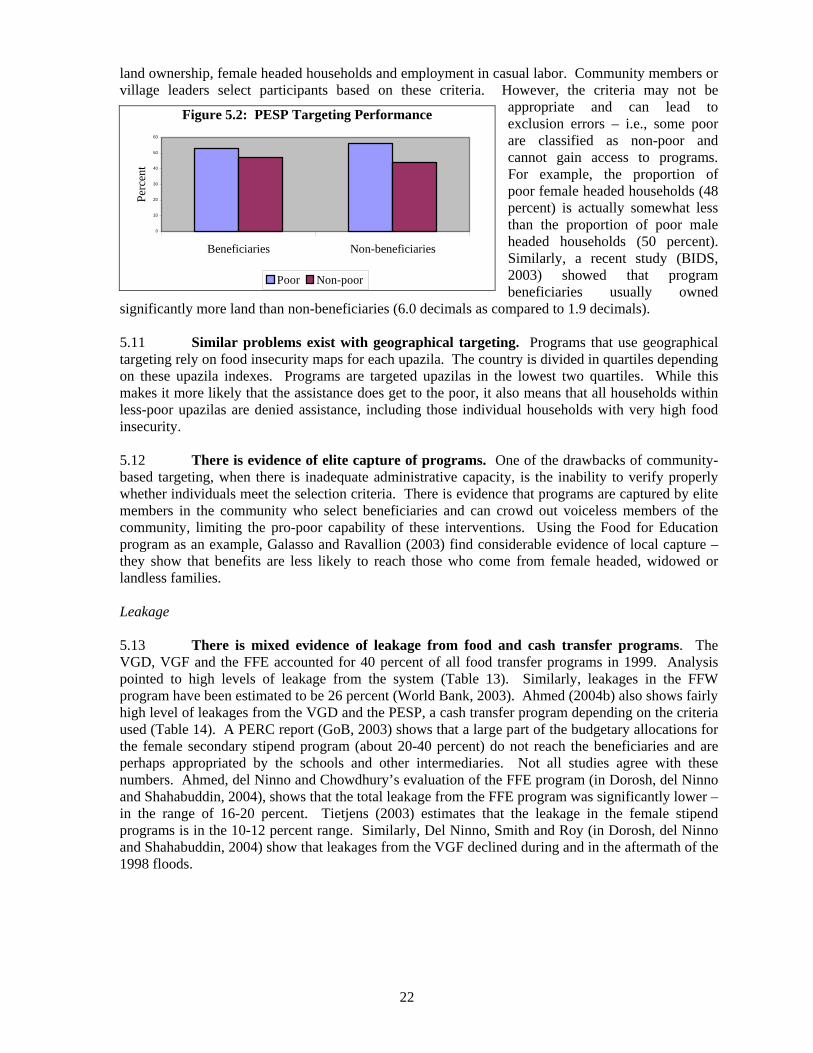
22
land ownership, female headed households and employment in casual labor. Community members or village leaders select participants based on these criteria. However, the criteria may not be
appropriate and can lead to exclusion errors – i.e., some poor are classified as non-poor and cannot gain access to programs. For example, the proportion of poor female headed households (48 percent) is actually somewhat less than the proportion of poor male headed households (50 percent). Similarly, a recent study (BIDS, 2003) showed that program beneficiaries usually owned
significantly more land than non-beneficiaries (6.0 decimals as compared to 1.9 decimals). 5.11 Similar problems exist with geographical targeting. Programs that use geographical targeting rely on food insecurity maps for each upazila. The country is divided in quartiles depending on these upazila indexes. Programs are targeted upazilas in the lowest two quartiles. While this makes it more likely that the assistance does get to the poor, it also means that all households within less-poor upazilas are denied assistance, including those individual households with very high food insecurity. 5.12 There is evidence of elite capture of programs. One of the drawbacks of community-based targeting, when there is inadequate administrative capacity, is the inability to verify properly whether individuals meet the selection criteria. There is evidence that programs are captured by elite members in the community who select beneficiaries and can crowd out voiceless members of the community, limiting the pro-poor capability of these interventions. Using the Food for Education program as an example, Galasso and Ravallion (2003) find considerable evidence of local capture – they show that benefits are less likely to reach those who come from female headed, widowed or landless families. Leakage 5.13 There is mixed evidence of leakage from food and cash transfer programs. The VGD, VGF and the FFE accounted for 40 percent of all food transfer programs in 1999. Analysis pointed to high levels of leakage from the system (Table 13). Similarly, leakages in the FFW program have been estimated to be 26 percent (World Bank, 2003). Ahmed (2004b) also shows fairly high level of leakages from the VGD and the PESP, a cash transfer program depending on the criteria used (Table 14). A PERC report (GoB, 2003) shows that a large part of the budgetary allocations for the female secondary stipend program (about 20-40 percent) do not reach the beneficiaries and are perhaps appropriated by the schools and other intermediaries. Not all studies agree with these numbers. Ahmed, del Ninno and Chowdhury’s evaluation of the FFE program (in Dorosh, del Ninno and Shahabuddin, 2004), shows that the total leakage from the FFE program was significantly lower – in the range of 16-20 percent. Tietjens (2003) estimates that the leakage in the female stipend programs is in the 10-12 percent range. Similarly, Del Ninno, Smith and Roy (in Dorosh, del Ninno and Shahabuddin, 2004) show that leakages from the VGF declined during and in the aftermath of the 1998 floods.
Figure 5.2: PESP Targeting Performance
0
10
20
30
40
50
60
Beneficiaries Non-beneficiaries
Perc
ent
Poor Non-poor

23
Table 13: Estimates of Leakage from the VGD, VGF and FFE
Program
2000 HIES-based survey estimates
(metric tons)
95% confidence interval for
estimate
Program off-take for FY1999-2000
(metric tons)
Survey estimate as % of total program
allocation (confidence intervals)
VGD 99,978 [72,894, 127,061] 216,675 [34%–59%] VGF 70,760 [44,251, 97,267] 149,138 [30%–65%] FFE 49,951 [27,192, 72,710] 285,973 [10%–25%]
Source: World Bank (2002(c)); Program Off-take: Bangladesh Food Grain Digest, World Food Program, Dhaka, Bangladesh.
Table 14: Comparative Losses from Different Programs Leakage VGD PESP RMP A. Losses due to delivery of amount less than stipulated
and other unauthorized expenses (per taka) 0.17 0.23 0.02
B. Losses due to beneficiaries not meeting… B(i)…at least one targeting criteria 0.00 0.11 0.00 B(ii)…at least three targeting criteria 0.61 0.98 0.00 Total Losses…. …A+B(i) 0.17 0.34 0.02 …A+B(ii) 0.78 1.22 0.02
Source: Ahmed (2004b) author’s calculation. 5.14 Leakages from programs show a strong correlation with the number of intermediaries in the transfer process. While different data sources point to varying estimates of leakage, the prevalence of this problem cannot be ignored. VGD and other food transfer programs depend on the public food distribution system, with food being loaded and unloaded at a number of points before finally being delivered to beneficiaries (see figure 5.3 below summarizing IGVGD funds flow and Annex 4 for IGVGD delivery mechanism). PESP also involves a large number of intermediaries – involved in selecting students, disbursing stipends and monitoring the program. Initial evaluations suggest that it has leakage of over 20 percent. A distinguishing characteristic of the RMP, which has an estimated leakage of less than 5 percent, is that it appears to have few intermediaries, or at least none that are able to intervene in the cash payment process at any point.32
32 The paper does not attempt to evaluate across programs and try to determine the relative effectiveness of these. There are three primary reasons for this: (i) evaluation of programs should be based on the stated objectives of those programs and not across multiple goals established for different programs, (ii) program goals typically evolve over time and the instead of a yardstick against which to measure success, we confront moving goal posts, and (iii) while it is possible to evaluate a program against a broader set of goals (that all agree with), the specific programs may not have been designed to achieve these broader targets. This makes comparisons very difficult. Perhaps the two programs that lend themselves for comparison are the VGD and the RMP, since their outcome indicators are very similar and the difference is largely in implementation and management.
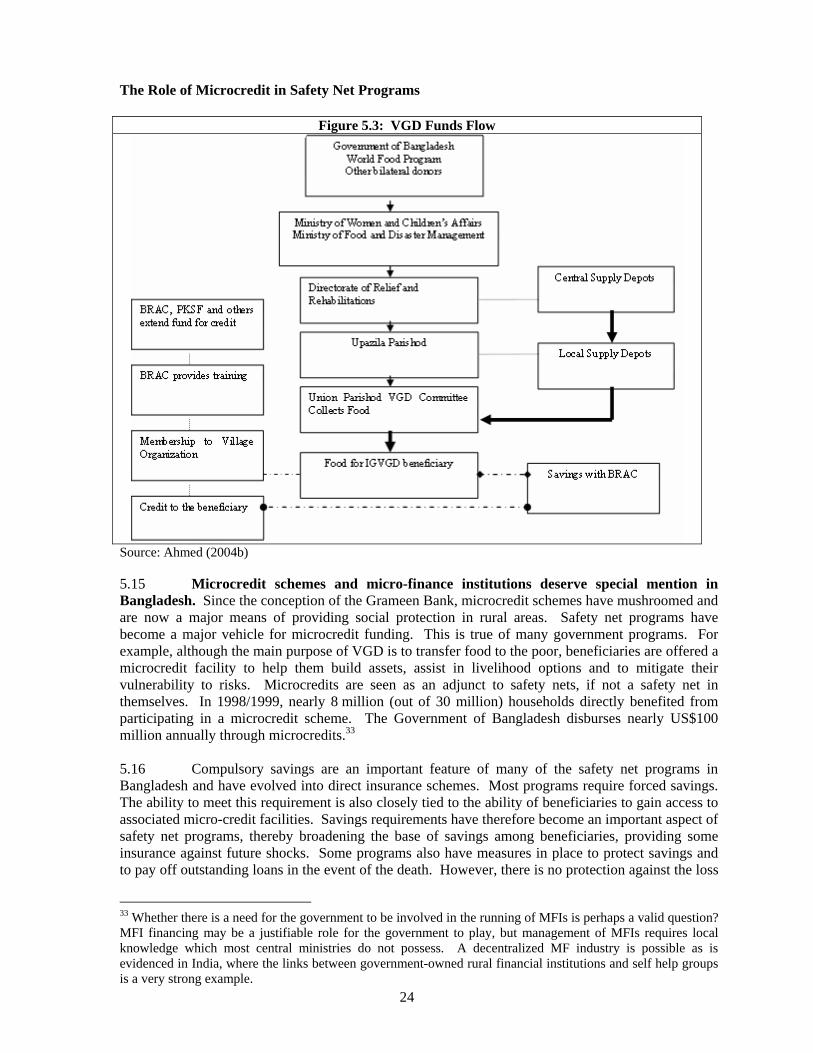
24
The Role of Microcredit in Safety Net Programs
Figure 5.3: VGD Funds Flow
Source: Ahmed (2004b) 5.15 Microcredit schemes and micro-finance institutions deserve special mention in Bangladesh. Since the conception of the Grameen Bank, microcredit schemes have mushroomed and are now a major means of providing social protection in rural areas. Safety net programs have become a major vehicle for microcredit funding. This is true of many government programs. For example, although the main purpose of VGD is to transfer food to the poor, beneficiaries are offered a microcredit facility to help them build assets, assist in livelihood options and to mitigate their vulnerability to risks. Microcredits are seen as an adjunct to safety nets, if not a safety net in themselves. In 1998/1999, nearly 8 million (out of 30 million) households directly benefited from participating in a microcredit scheme. The Government of Bangladesh disburses nearly US$100 million annually through microcredits.33 5.16 Compulsory savings are an important feature of many of the safety net programs in Bangladesh and have evolved into direct insurance schemes. Most programs require forced savings. The ability to meet this requirement is also closely tied to the ability of beneficiaries to gain access to associated micro-credit facilities. Savings requirements have therefore become an important aspect of safety net programs, thereby broadening the base of savings among beneficiaries, providing some insurance against future shocks. Some programs also have measures in place to protect savings and to pay off outstanding loans in the event of the death. However, there is no protection against the loss
33 Whether there is a need for the government to be involved in the running of MFIs is perhaps a valid question? MFI financing may be a justifiable role for the government to play, but management of MFIs requires local knowledge which most central ministries do not possess. A decentralized MF industry is possible as is evidenced in India, where the links between government-owned rural financial institutions and self help groups is a very strong example.
25
of investments made through micro-credits (for example, poultry and other micro-business assets) as a result of natural disasters.34 5.17 Microcredit schemes have had an impact on alleviating vulnerability of the poor. There is a broad consensus in the literature that participation in microcredit schemes has contributed to reducing the vulnerability of poor households (Morduch 1998, Zaman 2004, Khandhker 1998 and Khandhker and Pitt, 1998). There evidence that microfinance helps to smooth consumption is especially strong but less so that it helps to build and accumulate assets.35 These studies also find evidence that participation promotes human capital investments, contraceptive use and other awareness among poor households. Further, microcredit programs targeted at women do lead to asset accumulation on the part of the woman and increased exercise of power in household decision-making. 5.18 Social assistance programs that provide microcredit may not be targeting the poorest. Some participants are chosen less because they are poor and need cash and food transfers than because they wish to gain access to microcredits and have the capacity to repay loans. This can effectively deny access to safety net schemes for those who most need assistance. Summarizing several other studies, Sen and Hulme (2004) find that “.the general finding from several studies is that the extreme poor on average participate much less than their share in the population. It is the households clustered around the poverty line, that tend to have a much higher level on microfinance participation than their share in the population.” This is also borne out by a qualitative evaluation of the VGD program (Tufts University, 2002), which shows that a significant minority of participants joined the VGD in order only to access the microcredit scheme. Few, in the words of the report, could be described as "truly destitute." They were found to be more confident than other participants, with above average social and human capital. More importantly, in terms of program selection criteria, they held “major assets” prior to joining VGD, had a diversified income, and were able to assume a management position in the village. They were more likely to have husbands with an earned income. These characteristics should have excluded them from participation.
Table 15: Poverty Indicators Comparisons Indicator Social Assistance + Access to
Micro-Credit Social Assistance Only
Marital Status… Married and living with husband 58% 30% Widowed 32% 58% Occupation… Household work 63% 48% Day laborer 8% 23% Assets and Expenditures… Owning land 12% 7% Expenditures on non-food items (such as tin, bamboo)
154 taka 51 taka
Source: Matin and Hulme (2003).
34 However, this does raise questions regarding the target groups for these activities. If the poorest of the poor are being targeted, is a forced saving strategy feasible? Assuming that the poorest are incapable of participating in a scheme that requires forced savings, this implies that they are being omitted during targeting and implementation. 35 In discussions for this report, comments by central officials singled a very few successful borrowers who had become leaders in their communities (even elected as members of union parishads), presumably as a result of building up both their assets and their standing in the village. Negative comments, on the other hand, referred to the increased indebtedness of borrowers.
26
Responding to Natural Disasters 5.19 Bangladesh is extremely prone to natural disasters and these disasters typically uproot the lives and livelihoods of people in Bangladesh. The typical set of natural disasters includes inter alia floods, cyclones and storm surges, flash floods, drought, tornado, and landslides. Table 15 below provides a typology of key disasters that afflict Bangladesh. For example, in the 1990s alone, four major cyclonic events happened in Bangladesh in 1991, 1994, 1995 and 1997 leading to large agricultural and livestock losses. Similarly, the 1998 floods led to over a two million ton shortfall in rice production – 10 percent of the projected output for 1998/99 (Dorosh, del Ninno and Shahabuddin, 2004).
Table 16: Natural Disasters Affecting Bangladesh Type of disaster Areas Affected Impacts Floods Floodplains of the
Brahmaputra-Jamuna, the Ganges Padma and the Meghna river systems
Loss of agricultural and livestock production, disruption of communication and livelihood systems, injury and death, damage and destruction to infrastructure, disruption in essential services, national economic loss, and biodiversity loss.
Cyclone and storm surges
Coastal areas and offshore islands.
Loss of agricultural and livestock production, disruption of communication and livelihood systems, injury and death, damage and destruction to infrastructure, disruption in essential services, national economic loss, and biodiversity loss.
Drought Almost all areas, especially the NW region of the country
Loss of agricultural and livestock production, stress on national economy and disruption in livelihoods.
Erosion Banks of the Brahmaputra-Jamuna, the Ganges Padma and the Meghna river.
Loss of land, displacement of human populations and livestock, production and livestock losses.
5.20 The current disaster management strategy focuses on risk coping. Bangladesh is prone to natural disasters, particularly flooding by rivers and tidal surges, droughts in some parts of the country, and others. These events can have catastrophic effects on the lives and livelihoods of the population all over the country, both directly through loss of life, and indirectly through reduced food stocks, higher market prices, etc.36 While the effectiveness of these existing programs such as the VGF, the GR and the Fund for Mitigation of Natural Disasters in coping with disasters has not been evaluated rigorously, anecdotal evidence suggests that they have a positive impact in the short-run. However, their long-term impacts are likely to be more limited. For example, the Fund for Mitigating Risks from Natural Disasters is a government-financed program with a total allocation of Tk. 1.5 billion. The fund has doubled over its two years of operation but it has only about 22,000 beneficiaries. 5.21 However, household and community-based risk-coping mechanisms tend to fail in the face of major shocks. This is particularly relevant to safety net participants who are unable to benefit from programs that are seasonal in nature (such as public works programs). It is also important to participants who have taken microcredits but find themselves severely set back by disasters, even to the point of losing their investment, but remain in debt. Increased indebtedness can be a significant negative outcome of natural disasters. del Ninno, Dorosh and Smith (2003), show
36 Dorosh et al. (2004) illustrate how in two consecutive years, a drought followed by a flood, impacted on the availability and price of aman rice, with the prices rising by almost 19 percent in some of the key aman producing areas.
27
that after the 1998 floods household debt of poor and flood-exposed households rose to an average of 1.5 months of typical consumption compared with only a small proportion of monthly consumption before the flood. While the share of households with outstanding debt had fallen to 54 percent one year after the floods, it still left a large proportion of households vulnerable to further shocks.
B. PROGRAM MANAGEMENT
Administering Social Protection 5.22 Safety net programs in Bangladesh are administered through numerous agencies, including many arms of government, non-governmental organizations, and international bi-lateral and multi-lateral partners. While the involvement of a number of agencies in social protection provides a high visibility for this sector, it can also prove a hurdle when there is a need to coordinate and navigate through many different agencies to achieve an objective or undertake a task. 5.23 At a government level, many ministries are involved but there is little coordination among them. A number of ministries and departments within them offer safety net programs as a matter of their core business. Nodal ministries are those of Women’s and Children’s Affairs and the Ministry of Social Welfare. The use of small infrastructure development programs such as road maintenance, to provide workfare programs also involves agencies whose core business is elsewhere, such as the Local Government Ministry and the Water Resources Ministry. The impact of natural disasters means that the Ministry of Food and Disaster Management becomes involved periodically, including through its own safety net programs, which are triggered by disaster. The Ministry also has an on-going involvement through its FFW program. There is little coordination across ministries and programs - many of the programs are fairly similar and targeted at similar beneficiaries, leading to overlaps and households gaining access to more than one program (see section on coverage above). For example, both the Ministry of Social Welfare and Ministry of Food and Disaster Management run public work programs (see Annex 3) but have little knowledge of each other’s programs. 5.24 At a non-government level, there are some large significant players and hundreds of NGOs involved in the delivery of safety net services. NGOs are often the major providers of micro-finance and also play a critical role in delivering particular safety net programs. The development and implementation of safety net policies now appears to proceed in coordination with these NGOs.37 5.25 Bangladesh lacks an integrated national policy on safety nets. There is no integrated national policy for developing social safety net programs. This may have resulted in programs that are unsustainable being developed, many of them financed with donor assistance directly with individual ministries. Budgetary provisions are ad-hoc and given as block allocations. Monitoring and Evaluation 5.26 Problems of leakage and misallocation often arise due to inadequate monitoring of programs. Most implementing ministries lack sufficient capacity to monitor programs, which leads to benefits being misallocated. Monitoring should be used to provide information to management. This allows progress with implementation to be assessed and for timely decisions to be made, ensuring progress against stated milestones. Monitoring also allows for the measurement of quality and effect of processes and procedures. 5.27 Insufficient program evaluation means decision-making is not properly informed. The importance that the government places on safety net programs does not always emphasize the crucial role of information. Collecting, analyzing and disseminating information on program impacts 37 A list of NGO programs is included in an associated Background Paper.
28
and effectiveness would allow the government to make more accurate decisions on whether to expand or contract a particular program. Evaluations, carried out at regular intervals, should determine whether the project objectives, expressed set in terms of expected outputs, are being or will be met and at some future point in time.
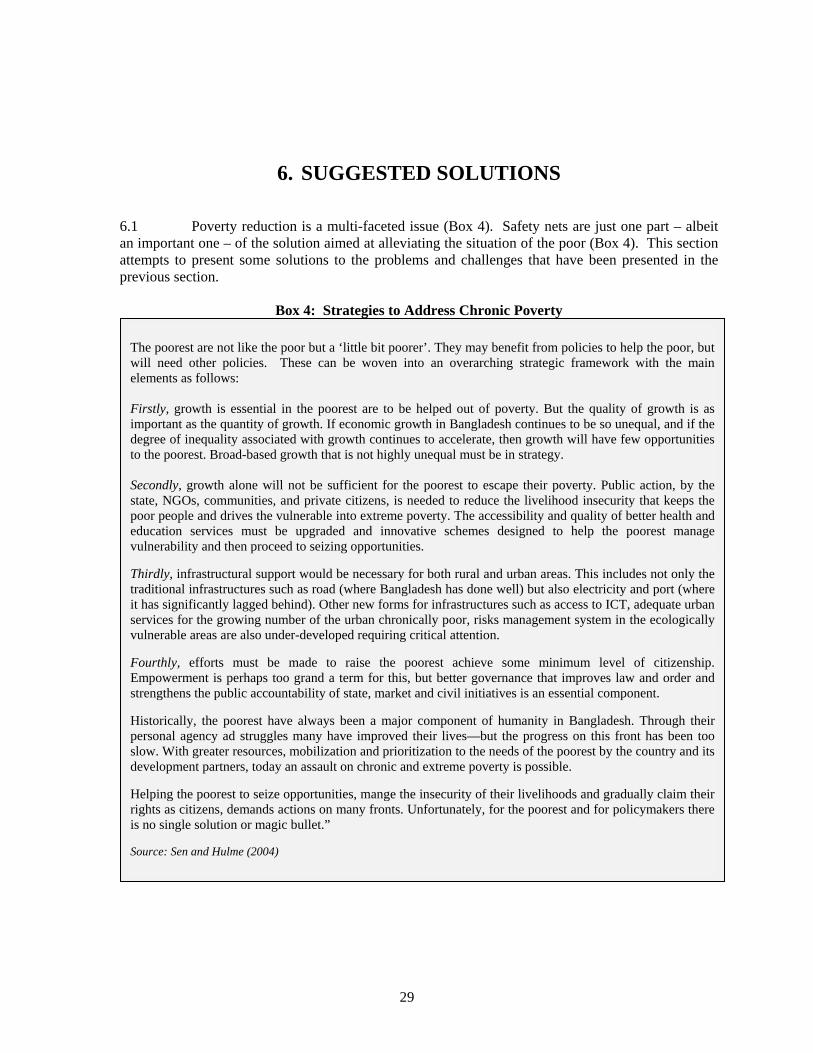
29
6. SUGGESTED SOLUTIONS 6.1 Poverty reduction is a multi-faceted issue (Box 4). Safety nets are just one part – albeit an important one – of the solution aimed at alleviating the situation of the poor (Box 4). This section attempts to present some solutions to the problems and challenges that have been presented in the previous section.
Box 4: Strategies to Address Chronic Poverty
The poorest are not like the poor but a ‘little bit poorer’. They may benefit from policies to help the poor, but will need other policies. These can be woven into an overarching strategic framework with the main elements as follows: Firstly, growth is essential in the poorest are to be helped out of poverty. But the quality of growth is as important as the quantity of growth. If economic growth in Bangladesh continues to be so unequal, and if the degree of inequality associated with growth continues to accelerate, then growth will have few opportunities to the poorest. Broad-based growth that is not highly unequal must be in strategy. Secondly, growth alone will not be sufficient for the poorest to escape their poverty. Public action, by the state, NGOs, communities, and private citizens, is needed to reduce the livelihood insecurity that keeps the poor people and drives the vulnerable into extreme poverty. The accessibility and quality of better health and education services must be upgraded and innovative schemes designed to help the poorest manage vulnerability and then proceed to seizing opportunities. Thirdly, infrastructural support would be necessary for both rural and urban areas. This includes not only the traditional infrastructures such as road (where Bangladesh has done well) but also electricity and port (where it has significantly lagged behind). Other new forms for infrastructures such as access to ICT, adequate urban services for the growing number of the urban chronically poor, risks management system in the ecologically vulnerable areas are also under-developed requiring critical attention. Fourthly, efforts must be made to raise the poorest achieve some minimum level of citizenship. Empowerment is perhaps too grand a term for this, but better governance that improves law and order and strengthens the public accountability of state, market and civil initiatives is an essential component. Historically, the poorest have always been a major component of humanity in Bangladesh. Through their personal agency ad struggles many have improved their lives—but the progress on this front has been too slow. With greater resources, mobilization and prioritization to the needs of the poorest by the country and its development partners, today an assault on chronic and extreme poverty is possible. Helping the poorest to seize opportunities, mange the insecurity of their livelihoods and gradually claim their rights as citizens, demands actions on many fronts. Unfortunately, for the poorest and for policymakers there is no single solution or magic bullet.” Source: Sen and Hulme (2004)
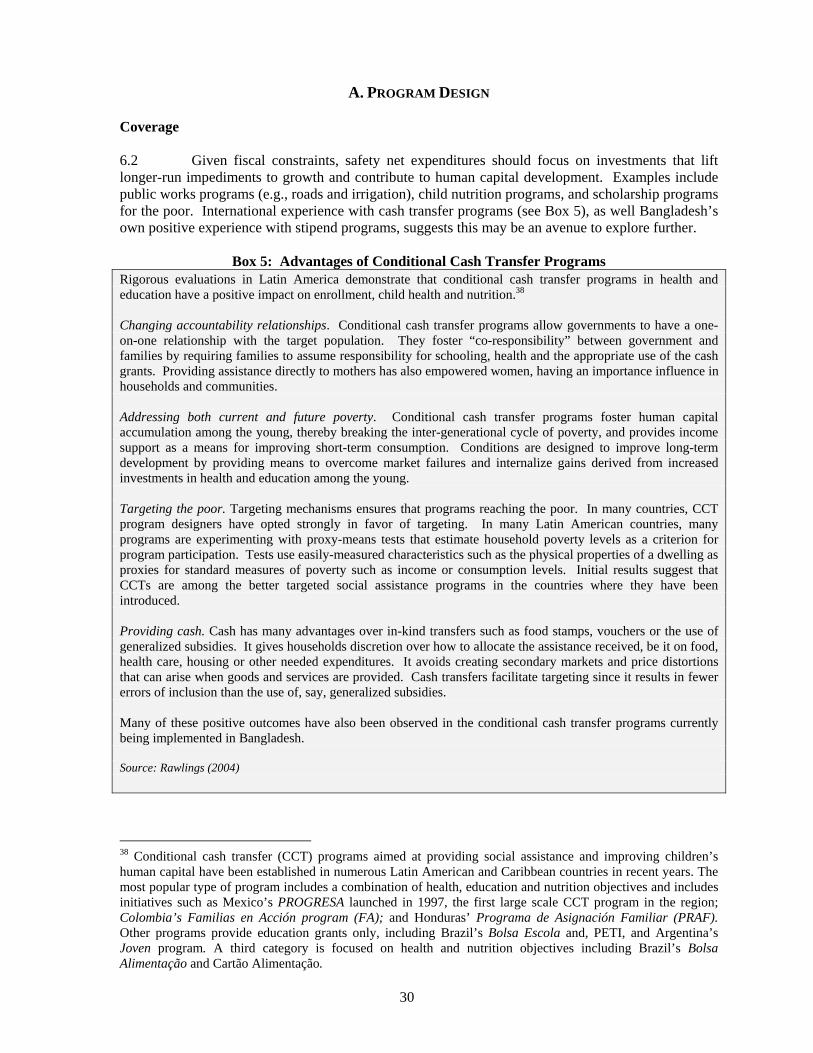
30
A. PROGRAM DESIGN
Coverage 6.2 Given fiscal constraints, safety net expenditures should focus on investments that lift longer-run impediments to growth and contribute to human capital development. Examples include public works programs (e.g., roads and irrigation), child nutrition programs, and scholarship programs for the poor. International experience with cash transfer programs (see Box 5), as well Bangladesh’s own positive experience with stipend programs, suggests this may be an avenue to explore further.
Box 5: Advantages of Conditional Cash Transfer Programs Rigorous evaluations in Latin America demonstrate that conditional cash transfer programs in health and education have a positive impact on enrollment, child health and nutrition.38 Changing accountability relationships. Conditional cash transfer programs allow governments to have a one-on-one relationship with the target population. They foster “co-responsibility” between government and families by requiring families to assume responsibility for schooling, health and the appropriate use of the cash grants. Providing assistance directly to mothers has also empowered women, having an importance influence in households and communities. Addressing both current and future poverty. Conditional cash transfer programs foster human capital accumulation among the young, thereby breaking the inter-generational cycle of poverty, and provides income support as a means for improving short-term consumption. Conditions are designed to improve long-term development by providing means to overcome market failures and internalize gains derived from increased investments in health and education among the young. Targeting the poor. Targeting mechanisms ensures that programs reaching the poor. In many countries, CCT program designers have opted strongly in favor of targeting. In many Latin American countries, many programs are experimenting with proxy-means tests that estimate household poverty levels as a criterion for program participation. Tests use easily-measured characteristics such as the physical properties of a dwelling as proxies for standard measures of poverty such as income or consumption levels. Initial results suggest that CCTs are among the better targeted social assistance programs in the countries where they have been introduced. Providing cash. Cash has many advantages over in-kind transfers such as food stamps, vouchers or the use of generalized subsidies. It gives households discretion over how to allocate the assistance received, be it on food, health care, housing or other needed expenditures. It avoids creating secondary markets and price distortions that can arise when goods and services are provided. Cash transfers facilitate targeting since it results in fewer errors of inclusion than the use of, say, generalized subsidies. Many of these positive outcomes have also been observed in the conditional cash transfer programs currently being implemented in Bangladesh. Source: Rawlings (2004)
38 Conditional cash transfer (CCT) programs aimed at providing social assistance and improving children’s human capital have been established in numerous Latin American and Caribbean countries in recent years. The most popular type of program includes a combination of health, education and nutrition objectives and includes initiatives such as Mexico’s PROGRESA launched in 1997, the first large scale CCT program in the region; Colombia’s Familias en Acción program (FA); and Honduras’ Programa de Asignación Familiar (PRAF). Other programs provide education grants only, including Brazil’s Bolsa Escola and, PETI, and Argentina’s Joven program. A third category is focused on health and nutrition objectives including Brazil’s Bolsa Alimentação and Cartão Alimentação.
31
6.3 Some changes to the design of existing programs could increase the coverage of programs even without an increase of budget. The Government could consider reducing the duration of benefit in some programs so as to increase the throughput of participants for a set budget. For example, throughput in RMP could be increased by reducing participation from 4 to 3 years. This could be offset by offering a place in mainstream (Local Government Engineering Department) infrastructure maintenance to those who complete their participation in RMP,39 giving participants the prospect of longer term economic security. As another example, participation in VGD could proceed in two one-year phases. The first year would emphasize life skills training; the second year would emphasize IGA training leading to microcredits. New first year entrants would replace those who dropped out after one year because they did not wish to take out microcredits. This would strengthen the role of VGD as program designed for people willing to use microcredits as a means of improving their longer-term prospects, while keeping its focus on targeting the poor. 6.4 Roll-out programs in such a manner as to reduce the impact of seasonality and ensure consumption smoothing. Providing programs to cover seasons of lean agricultural/rural employment – e.g., through rolling out public works programs during such times – would assist households to smooth their consumption spending, avoiding the losses in human capital that occur each year. For example, in India’s nationwide public works program of Jawahar Rojgar Yojnna (JRY), the program operated intensively during agricultural off-peak seasons; annually as many as 55 million people were employed through this program during the off-season. The JRY confers significant stabilization (consumption-smoothing) benefits even though it did not provide adequate transfer benefits (Subbarao, 2002). 6.5 To deliver social assistance programs in urban areas, imaginative models would be required to develop an administrative system based on, not bypassing, existing social structures. Delivering safety net programs in urban areas is problematic. There is, for example, no exact equivalent to the elected union parashad, although urban areas do elect “Ward Commissioners” under the control of municipalities. The informal mechanisms are also quite different. Slum dwellers are said40 to depend on “patrons (slum-lords and/or local ‘mastaans’)”. It is evident that the structures and hierarchies of rural villages do not occur in slums. A methodology could be developed for creating urban profiles (covering cities and townships) to perform functions similar to food insecurity maps in rural areas. The profiles could cover the ‘townships’ that are growing out of settlements springing up alongside transport routes in rural areas. Procedures could also be developed for selecting target urban areas (slums and ‘townships’) based on the profiles. New administrative arrangements could be developed for selecting program participants or infrastructure works once urban areas are chosen. In addition, there are several anti-poverty programs designed for urban areas that are supported by the private sector and NGOs. Such programs include Marie Stoppes Clinic’s Red Card health care program, subsidized health cards for the poor. Aparajoy Bangladesh and other urban-based NGOs work with street children, while Nissho (assetless paupers) works with street beggars. It will be useful to evaluate the effectiveness of these programs, and GoB could co-finance some of those that are found to be working well, while maintaining NGO management. 6.6 Increased focus on special groups is still required. Mainstream programs need to be made more suitable for special groups (e.g., tribal groups, people with disabilities) taking into account political, cultural and geographical variations and sensitivities. However, not all mainstream programs may be suitable for special groups.41 Public works programs, for example, may not be appropriate for all disabled people. Hence, special programs may also be required for these groups. 39 LGED provides 125 million workdays, broadly equivalent to a year’s employment for 500,000 workers. Only a small percentage comes through RMP or targeted programs. LGED projects earmarked as WFP projects, for example, are only 1 percent of LGED’s Annual Development Program for 2002/03. 40 Dhaka Urban Poverty Study - Concept Note, World Bank January 2004. 41 However, it is important to note that it is not being suggested that all members of these special groups may not be able to participate in mainstream programs. There should not be a ghettoization of specific chronic poverty groups in non-mainstream programs.

32
For example, programs could be designed for disabled people that include an element of cash transfer combined with demand-driven job-oriented training which will enhance employability and reduce their vulnerability. Targeting and Leakage Targeting 6.7 International experience indicates that there is no single best approach to targeting. Alternative targeting mechanisms – many of which are used in the different safety net programs in Bangladesh - have their advantages and drawbacks (see Box 6). International evidence shows that no particular mechanism is clearly superior. Evaluations tend to show that, relative to targeting that uses self-selection based on consumption, means testing, geographic targeting, and self-selection based on a work requirement lead to a greater share of benefits going to the bottom quintiles. Proxy means testing, community-based selection of individuals, and demographic targeting to children show good results on average, but with considerable variation. Demographic targeting to the elderly, and self-selection based on consumption, show limited potential.42 6.8 Consideration could be given to targeting individual households using criteria that are most closely related to occupation and other verifiable characteristics rather than merely through a single asset targeting mechanism such as the use of land holding to target. Many programs in Bangladesh use land criteria such as criteria 2 and 3 shown in Table 16. The table shows that these may not be the most effective. For example, 42 percent of household heads with no more than primary education are non-poor. A selection based solely on this criterion could result in a significant misallocation of resources. As another example, 36 percent of people who own less than 50 decimals of land are non-poor. This criterion could result in over a third of PESP stipends going to non-poor households.43 Programs targeted to the ultra poor require applicants to have no more than 3 decimals of land. The table (see criterion 3) suggests that this is not much more effective than using the PESP land criterion and tightening the land criterion may have little effect. Using criteria related to income sources may be a more effective way of targeting. Only 25 percent of household heads earning casual wages are non-poor. If this were combined with dwelling characteristics (which are directly related to income through affordability) only 8 percent of the designated target group would be non-poor.44
42 Targeting solely on the basis of the presence of an elderly in the household is likely to result in substantial Type II errors, with many non-poor households falling into this category. 43 The fact that the Ahmed (2004b) study showed that misallocation was only 11 percent suggests that local officials are indeed making judgments based on other criteria instead or as well. 44 Even though these criteria are visible and hence more easily verifiable, these forms of targeting are also potentially subject to elite capture. Hence, it is important that the local community be closely involved in validating the beneficiaries.
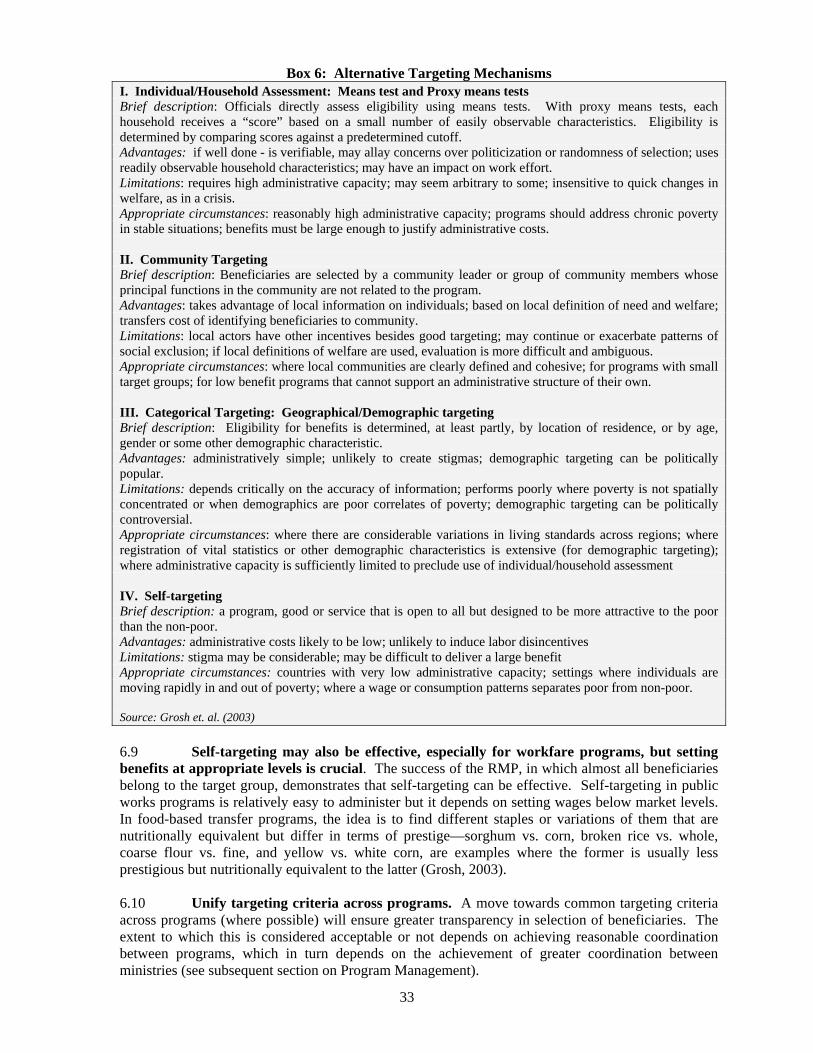
33
Box 6: Alternative Targeting Mechanisms I. Individual/Household Assessment: Means test and Proxy means tests Brief description: Officials directly assess eligibility using means tests. With proxy means tests, each household receives a “score” based on a small number of easily observable characteristics. Eligibility is determined by comparing scores against a predetermined cutoff. Advantages: if well done - is verifiable, may allay concerns over politicization or randomness of selection; uses readily observable household characteristics; may have an impact on work effort. Limitations: requires high administrative capacity; may seem arbitrary to some; insensitive to quick changes in welfare, as in a crisis. Appropriate circumstances: reasonably high administrative capacity; programs should address chronic poverty in stable situations; benefits must be large enough to justify administrative costs. II. Community Targeting Brief description: Beneficiaries are selected by a community leader or group of community members whose principal functions in the community are not related to the program. Advantages: takes advantage of local information on individuals; based on local definition of need and welfare; transfers cost of identifying beneficiaries to community. Limitations: local actors have other incentives besides good targeting; may continue or exacerbate patterns of social exclusion; if local definitions of welfare are used, evaluation is more difficult and ambiguous. Appropriate circumstances: where local communities are clearly defined and cohesive; for programs with small target groups; for low benefit programs that cannot support an administrative structure of their own. III. Categorical Targeting: Geographical/Demographic targeting Brief description: Eligibility for benefits is determined, at least partly, by location of residence, or by age, gender or some other demographic characteristic. Advantages: administratively simple; unlikely to create stigmas; demographic targeting can be politically popular. Limitations: depends critically on the accuracy of information; performs poorly where poverty is not spatially concentrated or when demographics are poor correlates of poverty; demographic targeting can be politically controversial. Appropriate circumstances: where there are considerable variations in living standards across regions; where registration of vital statistics or other demographic characteristics is extensive (for demographic targeting); where administrative capacity is sufficiently limited to preclude use of individual/household assessment IV. Self-targeting Brief description: a program, good or service that is open to all but designed to be more attractive to the poor than the non-poor. Advantages: administrative costs likely to be low; unlikely to induce labor disincentives Limitations: stigma may be considerable; may be difficult to deliver a large benefit Appropriate circumstances: countries with very low administrative capacity; settings where individuals are moving rapidly in and out of poverty; where a wage or consumption patterns separates poor from non-poor. Source: Grosh et. al. (2003) 6.9 Self-targeting may also be effective, especially for workfare programs, but setting benefits at appropriate levels is crucial. The success of the RMP, in which almost all beneficiaries belong to the target group, demonstrates that self-targeting can be effective. Self-targeting in public works programs is relatively easy to administer but it depends on setting wages below market levels. In food-based transfer programs, the idea is to find different staples or variations of them that are nutritionally equivalent but differ in terms of prestige—sorghum vs. corn, broken rice vs. whole, coarse flour vs. fine, and yellow vs. white corn, are examples where the former is usually less prestigious but nutritionally equivalent to the latter (Grosh, 2003). 6.10 Unify targeting criteria across programs. A move towards common targeting criteria across programs (where possible) will ensure greater transparency in selection of beneficiaries. The extent to which this is considered acceptable or not depends on achieving reasonable coordination between programs, which in turn depends on the achievement of greater coordination between ministries (see subsequent section on Program Management).

34
Table 17: Effectiveness of Poverty Indicators
Criteria Indicator Percent of poor who
meet criteria
Percent of non-poor who meet criteria
Number of poor HH/100 who meet criteria
Number of non-poor
HH/100 who meet criteria
Number of all HH/100 who meet criteria
Misallocation
1. Household head has less than primary education
64 52 34 24 58 42
2. Household has less than 50 decimals of land
74 47 39 22 61 36
3. Household has less than 5 decimals of land
59 36 31 17 48 35
4. Household is not-electrified 83 48 44 23 67 34
5. Household has no toilets 62 29 33 14 46 29
6. Household head earns casual wages 67 25 36 12 47 25
Combinations 7. 6. and 3. 40 9 21 4 25 17 8. 6. and 5. 42 7 22 3 25 13 9. 6. and 5. and 4. 34 3 18 2 20 8
Source: Authors’ calculations based on HIES (2000). Leakage 6.11 One way to reduce leakage could be to monetize benefits. In a study on the delivery of safety net programs, BIDS (2003) found that cash transfer programs had less leakage than food transfer programs. Evidence suggests that cash transfer programs such as RMP (leakages below five percent) and secondary stipend programs (leakages of 10-12 percent)45 seem to perform better than food transfer programs. Monetizing benefits is already an important development in Bangladesh, most notably with the replacement of FFE by PESP and the move towards a wage-based public works program to replace the FFW program. However, simply shifting to a monetized system may not be a panacea – initial estimates point to a 23 percent leakage from the PESP, which does not compare favorably to the food transfer programs. 6.12 Consideration could be given to minimizing the number of intermediaries in safety net programs. Although monetizing benefits should reduce leakage, as we can see from PESP, it is not necessarily sufficient. PESP still involves a number of intermediaries making decisions about the specific level of entitlement of each beneficiary (for example, whether they have attended sufficient classes). The evidence suggests these intermediaries are a source of leakage. More transparent procedures are required. More transparent procedures are also required for allocating food. They are needed to guarantee full delivery and to ensure accountability of intermediaries. For example, new procedures are needed for packing and distributing food grains through pre-packaged containers. The procedures would make it more difficult for ad hoc amounts to be stolen and misappropriated and make it easier for recipients to know they are receiving their exact entitlements. Consideration could be given to establishing a monitoring unit under the authority of a national coordinating committee to check food distribution at final point. Microcredit Programs 6.13 Government programs should focus on providing social assistance rather than providing social assistance and microcredits in the same program. There are many agencies in Bangladesh (e.g., 45 The PERC leakage estimates (which are not based on a nationally representative sample) are higher.
35
BRAC, Grameen Bank) that have a comparative advantage relative to the government in the provision of microcredit.46 Adding micro credit schemes with social safety net programs, as is done in many GoB safety net programs, often diffuses the focus and leads to the dual objectives of poverty alleviation and income generation, with perhaps both objectives not being effectively achieved. GoB safety net programs should thus focus on the provision of social assistance – which is their primary objective – and not on providing micro-credit assistance, which should be left to financial institutions or NGOs that have a comparative advantage in this area. 6.14 Programs are being developed to target microcredits to the ultra poor. A major development is the recently initiated Financial Services to the Poor (FSP) program, which provides microcredit assistance targeted to the ultra poor. BRAC is also attempting to address the issue through its Specially Targeted Ultra-Poor Program (STUP) and BRAC Dropout Program for the Ultra-Poor (BDPUP) – microcredit schemes aimed at benefiting the ultra-poor. 6.15 Programs need to be better targeted and more flexible. If reaching the ultra poor is to remain a firm goal, further action may be required. FSP, for example, could be expanded and targeted to households using occupation and income source as criteria, together with dwelling characteristics rather than land ownership. Lending to first year participants in VGD could also be expanded using the same flexible plans offered by FSP (e.g., flexible repayment schedules, flexible floor on amount of savings), making it easier for the ultra poor to borrow. Disaster Management 6.16 A disaster management strategy covering social protection issues is required. Such a strategy would involve (World Bank, 2002a):
• Emphasizing a decentralized approach, with the direct involvement of the government, communities and the private sector, and aim to improve disaster management capacity.
• Developing mechanisms for immediate and widespread relief efforts following a disaster. The Government should enlist the help of local community-based and non-governmental institutions to identify those affected and to create an efficient distribution network. The strategy should incorporate public health measures to guard against diseases and epidemics, focusing especially on vulnerable groups like children and the elderly.
• Incorporating measures to address the long-term needs of the affected people, providing them with assistance to rebuild their lives, including their homes and livelihood. Assistance can take various forms such as direct grants, subsidized loans, technical help, and skills training. Public works programs can provide an important coping mechanism for those who have lost their livelihood, while helping to rebuild communities and infrastructure.
• Developing insurance provisions for those affected. Options could include developing the existing Fund for Mitigating Risk from Disasters as an autonomously managed fund receiving contributions from a variety of stakeholders, including premiums from those at risk. Innovative forms of agricultural insurance such as weather insurance could also be considered.
• Incorporating a plan to provide financial support to institutions. Community-based efforts, including microfinance institutions, are vulnerable to disasters. Their loan recovery rates fall to a point where the institution may no longer be sustainable. This is exacerbated by borrowers and others withdrawing their savings, which is detrimental to the long-term development potential of the affected region or community.
46 For example, recovery rates in micro credit schemes offered by NGOs are usually around 95-97 percent while government micro-credit programs have recovery rates of just over 80 percent.
36
6.17 A multifaceted approach to food-insecurity in times of disaster is also needed. The government has shown increased flexibility in its ability to mitigate the effects of natural disasters on the welfare of its population. Food grain availability and price stability following the 1998 floods were achieved through a combination of strategies. Key elements of such an approach include (Dorosh, del Ninno and Shahbuddin, 2004):
• Maintaining incentives for sustained growth in domestic food production. This involves agricultural research and dissemination, investments in irrigation and market infrastructure, and appropriate domestic foodgrain procurement and price stabilization policies.
• Developing private markets to facilitate efficient storage and distribution, timely food imports in times of shortfall, and exports of agricultural and small-scale industrial products to increase incomes of the poor.
• Emergency preparedness to alleviate transitory food insecurity through maintaining public foodgrain stock equal to three-four months of requirements.
• Targeting food and non-food interventions to food-insecure people – especially poor women and children, old and infirm individuals. Targeting is critical in order to conserve scarce resources and limit adverse impacts of foodgrain distribution on producer prices.
• Increasing investment in rural infrastructure and social services, and ensuring proper nutrition for vulnerable individuals such as women and children.
6.18 Improvements in weather forecasting methodology using advances in information technology provide long-term information on climate variability and provide forecasts up to six months ahead. This makes it easier to track and predict weather events and to target relief programs for maximum effect. This would induce readiness on the part of the vulnerable population and the public authorities to cope with such risks.
B. PROGRAM MANAGEMENT
Administration 6.19 Considerable effort should be expended on ensuring adequate coordination among the numerous government agencies involved in the provision of these services. While overlaps and gaps in services are sometimes unavoidable, improved coordination can minimize any adverse impact. The focus should be on developing a national policy that leads to a coordinated inter-ministerial approach on social safety nets, minimizing overlaps between programs, and setting uniform targeting criteria for similar programs. Emphasis should also be placed on fostering coordination between government agencies and NGO’s who are implementing social assistance programs. One benefit would be the development of procedures for presenting transparent financial data on social protection, making long-term planning and monitoring and evaluation more meaningful. Without these procedures, greater coordination would lose most of its potential benefits. Paramount among those benefits would be the ability to assess the value of programs, including their administrative capacity and efficiency, and consequently the value and feasibility of expanding them. Coordination can be achieved in a number of ways:
• Choosing a lead agency from among the line ministries. This is meant to be the case for food for work programs where the Ministry of Women’s and Children’s Affairs has a coordinating role, and for programs for the disabled where the Ministry of Social Welfare has the lead. On the other hand, despite its importance as the Government’s wholesaler, PKSF has no such role in microcredit programs administered by ministries and administrative divisions. Choosing a lead agency mostly fails in practice; it becomes too hard for a lead agency to insist on coordination and the mechanism gets quickly worn away.

37
• Designating a central agency to be the coordinating agency. Obvious examples are the finance ministry, planning ministry or a prime minister’s department. This option is also difficult to manage in practice. Although it makes it easier for external partners to engage the Government, central agencies are always reluctant to get drawn into dealing with the administrative practices of line ministries.
• Introducing inter-agency mechanisms as forums for policy developments and program administration. Typical forums are Budget committees, audit committees, and more ad hoc inter-ministerial committees. Particularly relevant examples are the inter-ministerial committees that have been formed to provide input into the PRSP. This, too, can be difficult to manage but it offers the best scope for Government to be appraised of the full implications of policy development and of failures and weaknesses in program delivery.
6.20 Reducing the number of ministries responsible for safety net programs could be considered. Reducing the multiplicity of ministries responsible for safety net programs could not be considered immediately. However, in the longer term, as greater consideration is given to overlapping target groups and programs, it will become a more reasonable option. As an increasing number of benefits are monetized, consideration will have to be given to a single payment agency, even if programs are not consolidated. This will allow consistent procedures to be used in transferring benefits. 6.21 Devolution of authority to lower levels of government to administer programs may not be feasible in the short run. District, upazila and union level officials are often involved in selecting beneficiaries and handing out assistance. There are, of course, variations between programs depending on the ministry involved, but even where the lower layers of administration have only a limited formal role, their impact through informal networks can still be significant. Union officials, in particular, become involved in selecting program beneficiaries and often have a substantial degree of freedom in making their choices. Union officials, and others, are involved in distributing assistance. There is weak capacity to both administer and monitor the system – often leading to leakages and inefficient targeting of beneficiaries. 6.22 The delivery of social assistance programs could be outsourced to agents operating at the local level. Separating public financing from private provision is becoming increasingly common (Box 7). The agent may vary from place to place. There are two factors to consider when outsourcing. First, the organization would have to be provided with resources - some form of management fee to cover the cost of their involvement. Their involvement would include taking responsibility for selecting program beneficiaries and, in the case of food assistance, responsibility for final food distribution. Second, an agent would need a secure contract, say for three years, with clear performance criteria and performance measuring procedures in place. Auditable procedures would be needed to monitor the outsourcing arrangements. In the case of food distribution, this would cover the monitoring of transfers between distribution layers (for example, between upazila distribution centers and union distribution centers). When distribution fell outside pre-set tests (such as a loss of more than two percent – WPF international standard), the organization with the outsourced contract would be responsible and they could be penalized for failure, for example, through a reduction in their management fee.
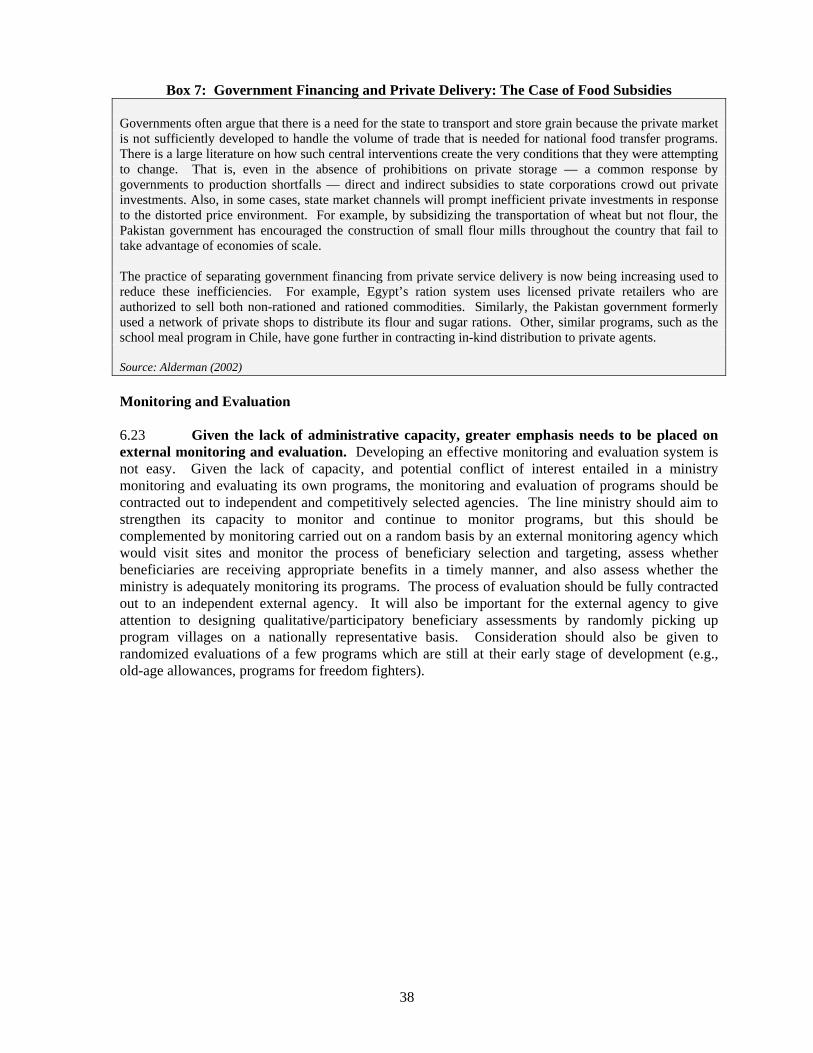
38
Box 7: Government Financing and Private Delivery: The Case of Food Subsidies
Governments often argue that there is a need for the state to transport and store grain because the private market is not sufficiently developed to handle the volume of trade that is needed for national food transfer programs. There is a large literature on how such central interventions create the very conditions that they were attempting to change. That is, even in the absence of prohibitions on private storage — a common response by governments to production shortfalls — direct and indirect subsidies to state corporations crowd out private investments. Also, in some cases, state market channels will prompt inefficient private investments in response to the distorted price environment. For example, by subsidizing the transportation of wheat but not flour, the Pakistan government has encouraged the construction of small flour mills throughout the country that fail to take advantage of economies of scale. The practice of separating government financing from private service delivery is now being increasing used to reduce these inefficiencies. For example, Egypt’s ration system uses licensed private retailers who are authorized to sell both non-rationed and rationed commodities. Similarly, the Pakistan government formerly used a network of private shops to distribute its flour and sugar rations. Other, similar programs, such as the school meal program in Chile, have gone further in contracting in-kind distribution to private agents. Source: Alderman (2002) Monitoring and Evaluation 6.23 Given the lack of administrative capacity, greater emphasis needs to be placed on external monitoring and evaluation. Developing an effective monitoring and evaluation system is not easy. Given the lack of capacity, and potential conflict of interest entailed in a ministry monitoring and evaluating its own programs, the monitoring and evaluation of programs should be contracted out to independent and competitively selected agencies. The line ministry should aim to strengthen its capacity to monitor and continue to monitor programs, but this should be complemented by monitoring carried out on a random basis by an external monitoring agency which would visit sites and monitor the process of beneficiary selection and targeting, assess whether beneficiaries are receiving appropriate benefits in a timely manner, and also assess whether the ministry is adequately monitoring its programs. The process of evaluation should be fully contracted out to an independent external agency. It will also be important for the external agency to give attention to designing qualitative/participatory beneficiary assessments by randomly picking up program villages on a nationally representative basis. Consideration should also be given to randomized evaluations of a few programs which are still at their early stage of development (e.g., old-age allowances, programs for freedom fighters).

39
Annexes

40
41
ANNEX 1: THE SCOPE OF THE REPORT
1. This paper is concerned with social protection. Because it is the first such World Bank report on Bangladesh, it was necessary to decide what the study should include and what it should exclude. 2. The World Bank has defined Social Protection as a collection of measures to improve or protect human capital. Social Protection programs assist individuals, households, and communities to better manage the income risks that leave them vulnerable to poverty. They contribute to the solidarity, social cohesion, and social stability of a country. When they are designed and implemented well, they support sustainable economic development in a participatory manner. Specifically, Social Protection seeks to:
• reduce the vulnerability of low-income households with regard to basic consumption and services;
• allow households to shift income efficiently over the life-cycle, financing consumption when needed; and
• enhance equity, particularly with regard to exposure to adverse shocks. 3. Within the rubric of Social Protection, the World Bank includes safety net programs, social insurance (pensions, unemployment), and labor market policies/programs. 4. The first of these, safety net programs, is the scope of this report. Safety net programs are designed to provide targeted income support and access to basic social services for the poorest population groups, and those needing assistance after economic downturns, natural disasters, or other events that pose major risks. For this first report, it proved difficult to draw a simple fence around what could be called safety net programs. Three main issues arose. 5. First, a number of conditional cash transfer programs are designed to assist the poor educate their children and might otherwise be regarded as education programs rather than safety net programs. However, the techniques used to identify the target groups and to deliver the benefits are similar to those used by programs that are usually classified as safety net programs. The experiences of the education programs are directly relevant to safety net programs and vice versa. It could also be reasonably argued that a household benefiting from one of the education programs should be excluded from participating in a safety net program, given the government’s limited budget. It was therefore decided to include these programs in the study. 6. Second, microfinance is not considered a safety net program per se, though it has the objective of targeting credit to poor households. But in Bangladesh, many safety net programs are intertwined with microfinance. A number offer entry to micro-credit schemes to the extent that the micro-credit schemes could be considered the driving force of the programs. For that reason the report has included a section detailing issues in microfinance, but only so far as it relates to safety net programs. The report does not consider microfinance as a topic in itself or seek to classify it as being under the social protection rubric. 7. Third, programs which have some safety net aspects – but cannot be broadly classified as safety net programs – such as the National Nutrition Program (NNP), have been discussed in the study but not included under the rubric of safety net programs for the purposes of this paper. While recognizing the significance of malnutrition in the country, the NNP has not been classified as a safety nets program as it does not have social assistance as a primary focus.
42
8. Social insurance programs, labor market policies and programs and pension usually act by pooling risk across a number of individuals or households. They include unemployment insurance, old age or disability pension, and sickness insurance. These programs are not covered by this report, with the exception of one program of assistance to the elderly. This program could be considered a first pillar pension system. But it is not an insurance scheme and the techniques for selecting and for delivering benefits are similar to those for safety net programs. 9. In effect, the report has chosen to consider the question of safety nets from the point of view of the target groups and the means of identifying those groups rather than through the eyes of a particular subset of government programs. Future studies may choose to concentrate attention more closely on different aspects of programs.
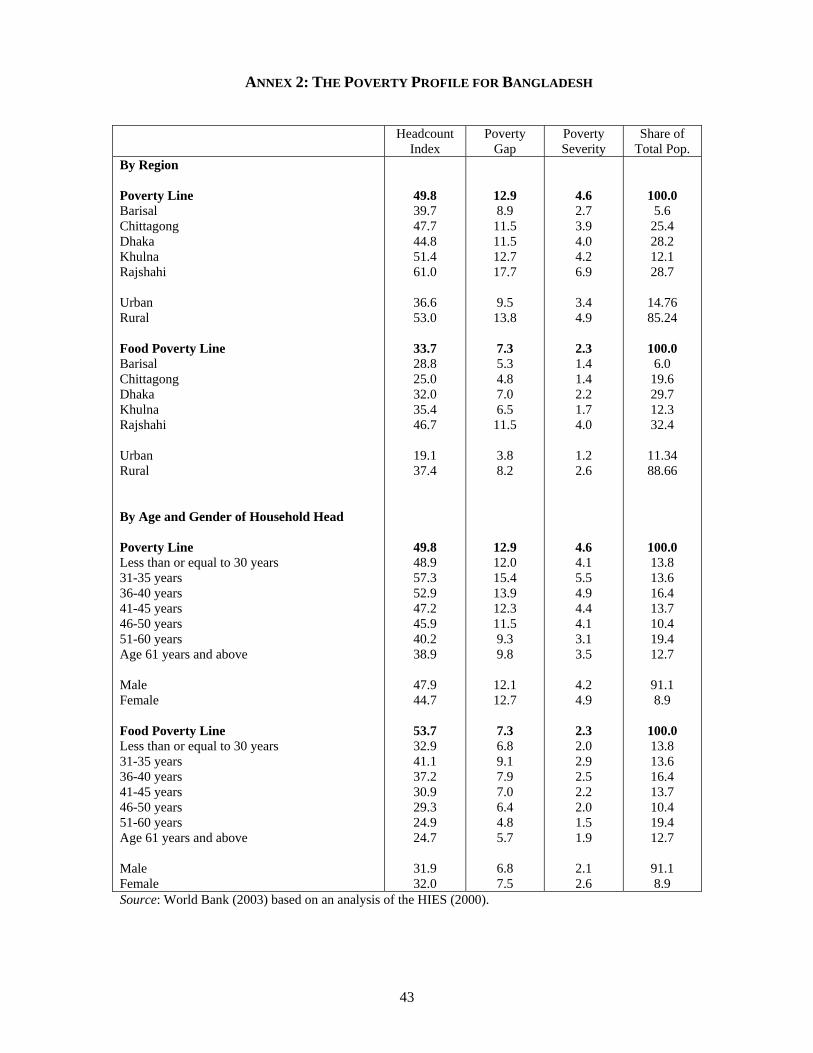
43
ANNEX 2: THE POVERTY PROFILE FOR BANGLADESH
Headcount
Index Poverty
Gap Poverty Severity
Share of Total Pop.
By Region Poverty Line Barisal Chittagong Dhaka Khulna Rajshahi Urban Rural Food Poverty Line Barisal Chittagong Dhaka Khulna Rajshahi Urban Rural By Age and Gender of Household Head Poverty Line Less than or equal to 30 years 31-35 years 36-40 years 41-45 years 46-50 years 51-60 years Age 61 years and above Male Female Food Poverty Line Less than or equal to 30 years 31-35 years 36-40 years 41-45 years 46-50 years 51-60 years Age 61 years and above Male Female
49.8 39.7 47.7 44.8 51.4 61.0
36.6 53.0
33.7 28.8 25.0 32.0 35.4 46.7
19.1 37.4
49.8 48.9 57.3 52.9 47.2 45.9 40.2 38.9
47.9 44.7
53.7 32.9 41.1 37.2 30.9 29.3 24.9 24.7
31.9 32.0
12.9 8.9
11.5 11.5 12.7 17.7
9.5
13.8
7.3 5.3 4.8 7.0 6.5
11.5
3.8 8.2
12.9 12.0 15.4 13.9 12.3 11.5 9.3 9.8
12.1 12.7
7.3 6.8 9.1 7.9 7.0 6.4 4.8 5.7
6.8 7.5
4.6 2.7 3.9 4.0 4.2 6.9
3.4 4.9
2.3 1.4 1.4 2.2 1.7 4.0
1.2 2.6
4.6 4.1 5.5 4.9 4.4 4.1 3.1 3.5
4.2 4.9
2.3 2.0 2.9 2.5 2.2 2.0 1.5 1.9
2.1 2.6
100.0 5.6
25.4 28.2 12.1 28.7
14.76 85.24
100.0 6.0
19.6 29.7 12.3 32.4
11.34 88.66
100.0 13.8 13.6 16.4 13.7 10.4 19.4 12.7
91.1 8.9
100.0 13.8 13.6 16.4 13.7 10.4 19.4 12.7
91.1 8.9
Source: World Bank (2003) based on an analysis of the HIES (2000).
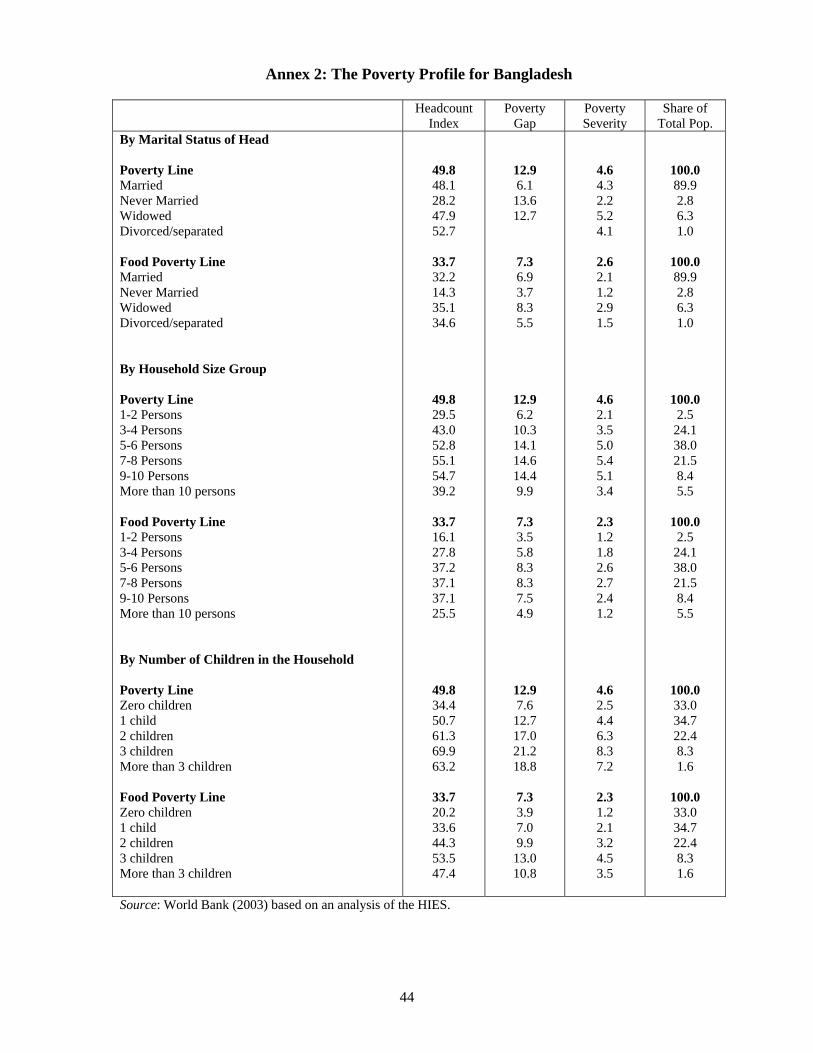
44
Annex 2: The Poverty Profile for Bangladesh
Headcount Index
Poverty Gap
Poverty Severity
Share of Total Pop.
By Marital Status of Head Poverty Line Married Never Married Widowed Divorced/separated Food Poverty Line Married Never Married Widowed Divorced/separated By Household Size Group Poverty Line 1-2 Persons 3-4 Persons 5-6 Persons 7-8 Persons 9-10 Persons More than 10 persons Food Poverty Line 1-2 Persons 3-4 Persons 5-6 Persons 7-8 Persons 9-10 Persons More than 10 persons By Number of Children in the Household Poverty Line Zero children 1 child 2 children 3 children More than 3 children Food Poverty Line Zero children 1 child 2 children 3 children More than 3 children
49.8 48.1 28.2 47.9 52.7
33.7 32.2 14.3 35.1 34.6
49.8 29.5 43.0 52.8 55.1 54.7 39.2
33.7 16.1 27.8 37.2 37.1 37.1 25.5
49.8 34.4 50.7 61.3 69.9 63.2
33.7 20.2 33.6 44.3 53.5 47.4
12.9 6.1
13.6 12.7
7.3 6.9 3.7 8.3 5.5
12.9 6.2
10.3 14.1 14.6 14.4 9.9
7.3 3.5 5.8 8.3 8.3 7.5 4.9
12.9 7.6
12.7 17.0 21.2 18.8
7.3 3.9 7.0 9.9
13.0 10.8
4.6 4.3 2.2 5.2 4.1
2.6 2.1 1.2 2.9 1.5
4.6 2.1 3.5 5.0 5.4 5.1 3.4
2.3 1.2 1.8 2.6 2.7 2.4 1.2
4.6 2.5 4.4 6.3 8.3 7.2
2.3 1.2 2.1 3.2 4.5 3.5
100.0 89.9 2.8 6.3 1.0
100.0 89.9 2.8 6.3 1.0
100.0 2.5
24.1 38.0 21.5 8.4 5.5
100.0
2.5 24.1 38.0 21.5 8.4 5.5
100.0 33.0 34.7 22.4 8.3 1.6
100.0 33.0 34.7 22.4 8.3 1.6
Source: World Bank (2003) based on an analysis of the HIES.

45
Annex 2: The Poverty Profile for Bangladesh
Headcount
Index Poverty Gap
Poverty Severity
Share of Total Pop.
By Religion of Head Poverty Line Islam Others Food Poverty Line Islam Others By Education Level and Literacy Status of Head Poverty Line No Schooling Primary Lower Secondary Higher Secondary University Literate Illiterate Food Poverty Line No Schooling Primary Lower Secondary Higher Secondary University Literate Illiterate
49.8 48.0 43.3 33.7 32.5 25.8 49.8 60.6 40.2 33.3 18.0 4.1 29.0 61.2 33.7 42.5 25.1 18.8 8.6 0.1 16.5 43.1
12.9 12.3 10.0 7.3 7.1 5.3 12.9 16.1 9.4 7.3 3.5 0.7 6.4 16.3 7.3 9.4 4.9 3.5 1.6 0.2 3.2 9.5
4.6 4.4 3.4 2.6 7.1 5.3 4.6 5.8 3.1 2.3 1.1 0.2 2.1 5.9 2.3 2.9 1.5 0.1 0.1 0.0 0.1 3.0
100.0 90.9 9.1 100.0 90.9 9.1 100.0 56.5 14.7 8.7 18.2 2.0 54.6 45.4 100.0 56.5 14.7 8.7 18.2 2.0 54.6 45.4
Source: World Bank (2003) based on an analysis of the HIES.
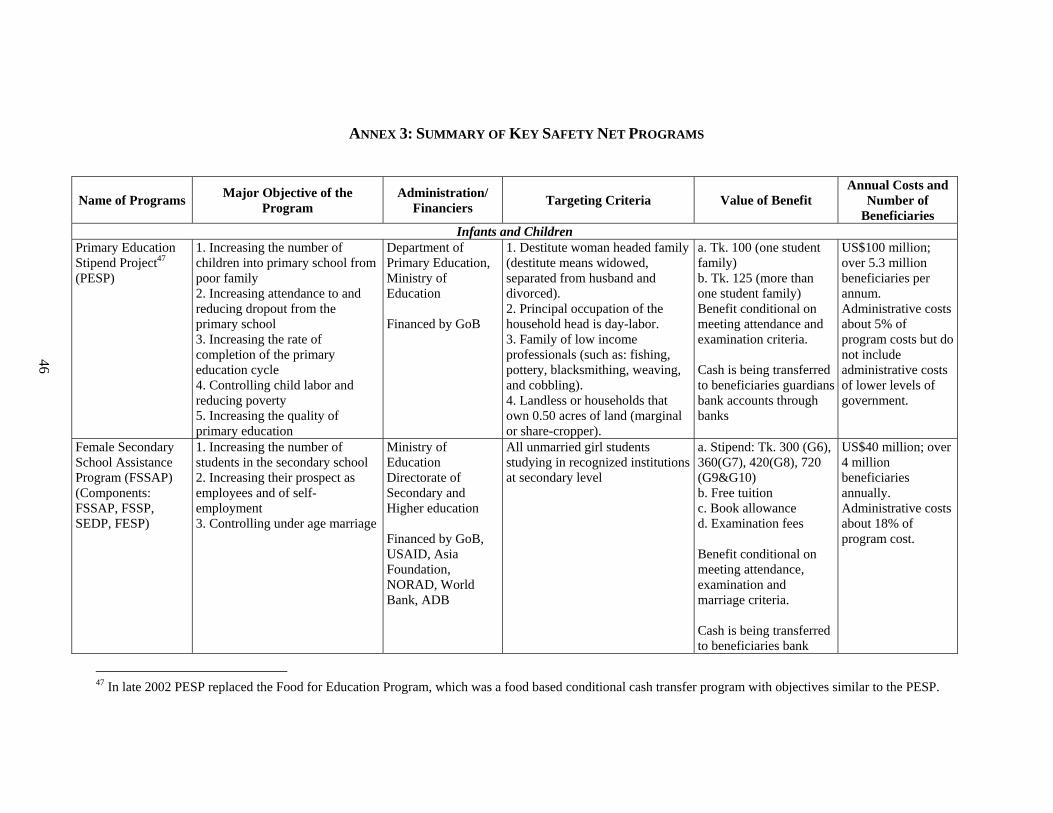
46
ANNEX 3: SUMMARY OF KEY SAFETY NET PROGRAMS
Name of Programs Major Objective of the Program
Administration/ Financiers Targeting Criteria Value of Benefit
Annual Costs and Number of
Beneficiaries Infants and Children
Primary Education Stipend Project47 (PESP)
1. Increasing the number of children into primary school from poor family 2. Increasing attendance to and reducing dropout from the primary school 3. Increasing the rate of completion of the primary education cycle 4. Controlling child labor and reducing poverty 5. Increasing the quality of primary education
Department of Primary Education, Ministry of Education Financed by GoB
1. Destitute woman headed family (destitute means widowed, separated from husband and divorced). 2. Principal occupation of the household head is day-labor. 3. Family of low income professionals (such as: fishing, pottery, blacksmithing, weaving, and cobbling). 4. Landless or households that own 0.50 acres of land (marginal or share-cropper).
a. Tk. 100 (one student family) b. Tk. 125 (more than one student family) Benefit conditional on meeting attendance and examination criteria. Cash is being transferred to beneficiaries guardians bank accounts through banks
US$100 million; over 5.3 million beneficiaries per annum. Administrative costs about 5% of program costs but do not include administrative costs of lower levels of government.
Female Secondary School Assistance Program (FSSAP) (Components: FSSAP, FSSP, SEDP, FESP)
1. Increasing the number of students in the secondary school 2. Increasing their prospect as employees and of self-employment 3. Controlling under age marriage
Ministry of Education Directorate of Secondary and Higher education Financed by GoB, USAID, Asia Foundation, NORAD, World Bank, ADB
All unmarried girl students studying in recognized institutions at secondary level
a. Stipend: Tk. 300 (G6), 360(G7), 420(G8), 720 (G9&G10) b. Free tuition c. Book allowance d. Examination fees Benefit conditional on meeting attendance, examination and marriage criteria. Cash is being transferred to beneficiaries bank
US$40 million; over 4 million beneficiaries annually. Administrative costs about 18% of program cost.
47 In late 2002 PESP replaced the Food for Education Program, which was a food based conditional cash transfer program with objectives similar to the PESP.
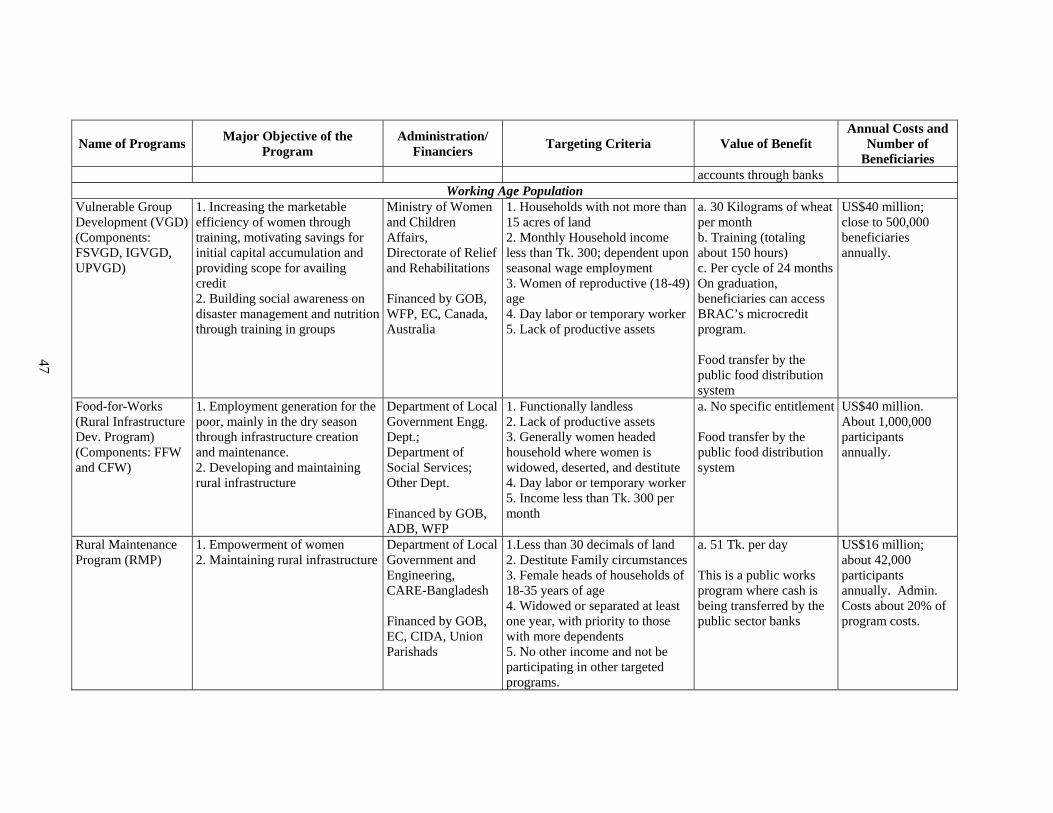
47
Name of Programs Major Objective of the Program
Administration/ Financiers Targeting Criteria Value of Benefit
Annual Costs and Number of
Beneficiaries accounts through banks
Working Age Population Vulnerable Group Development (VGD) (Components: FSVGD, IGVGD, UPVGD)
1. Increasing the marketable efficiency of women through training, motivating savings for initial capital accumulation and providing scope for availing credit 2. Building social awareness on disaster management and nutrition through training in groups
Ministry of Women and Children Affairs, Directorate of Relief and Rehabilitations Financed by GOB, WFP, EC, Canada, Australia
1. Households with not more than 15 acres of land 2. Monthly Household income less than Tk. 300; dependent upon seasonal wage employment 3. Women of reproductive (18-49) age 4. Day labor or temporary worker 5. Lack of productive assets
a. 30 Kilograms of wheat per month b. Training (totaling about 150 hours) c. Per cycle of 24 monthsOn graduation, beneficiaries can access BRAC’s microcredit program. Food transfer by the public food distribution system
US$40 million; close to 500,000 beneficiaries annually.
Food-for-Works (Rural Infrastructure Dev. Program) (Components: FFW and CFW)
1. Employment generation for the poor, mainly in the dry season through infrastructure creation and maintenance. 2. Developing and maintaining rural infrastructure
Department of Local Government Engg. Dept.; Department of Social Services; Other Dept. Financed by GOB, ADB, WFP
1. Functionally landless 2. Lack of productive assets 3. Generally women headed household where women is widowed, deserted, and destitute 4. Day labor or temporary worker 5. Income less than Tk. 300 per month
a. No specific entitlement Food transfer by the public food distribution system
US$40 million. About 1,000,000 participants annually.
Rural Maintenance Program (RMP)
1. Empowerment of women 2. Maintaining rural infrastructure
Department of Local Government and Engineering, CARE-Bangladesh Financed by GOB, EC, CIDA, Union Parishads
1.Less than 30 decimals of land 2. Destitute Family circumstances 3. Female heads of households of 18-35 years of age 4. Widowed or separated at least one year, with priority to those with more dependents 5. No other income and not be participating in other targeted programs.
a. 51 Tk. per day This is a public works program where cash is being transferred by the public sector banks
US$16 million; about 42,000 participants annually. Admin. Costs about 20% of program costs.
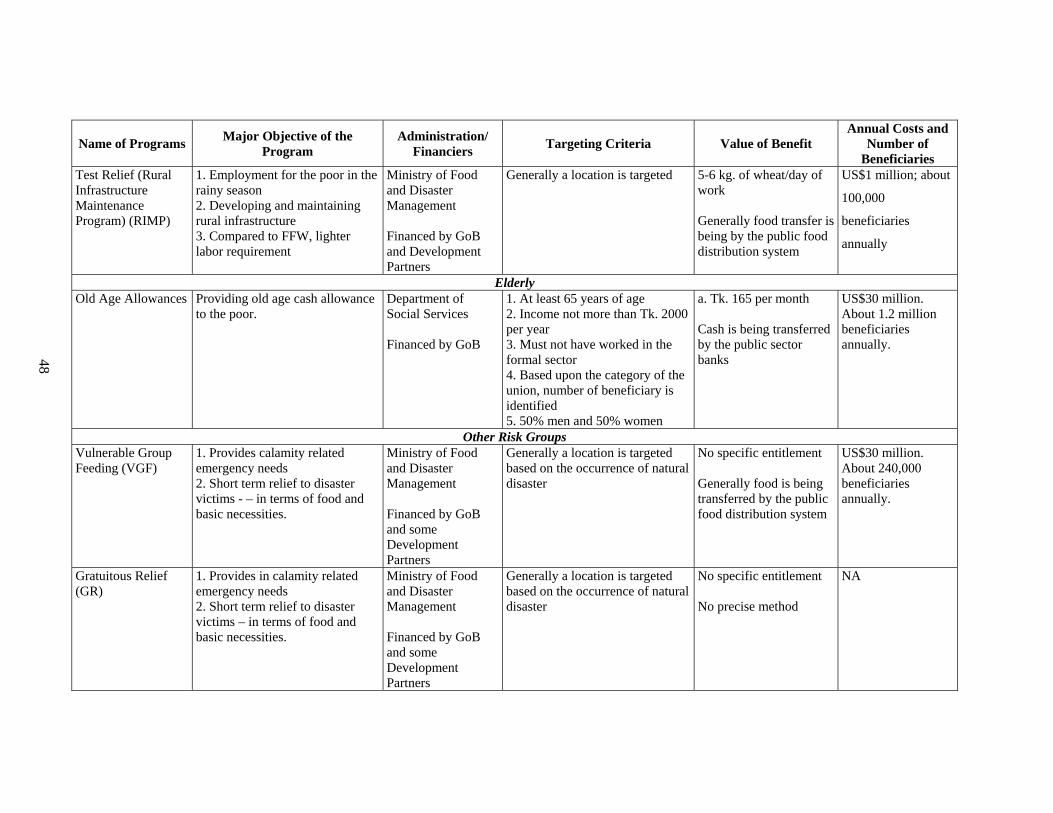
48
Name of Programs Major Objective of the Program
Administration/ Financiers Targeting Criteria Value of Benefit
Annual Costs and Number of
Beneficiaries Test Relief (Rural Infrastructure Maintenance Program) (RIMP)
1. Employment for the poor in the rainy season 2. Developing and maintaining rural infrastructure 3. Compared to FFW, lighter labor requirement
Ministry of Food and Disaster Management Financed by GoB and Development Partners
Generally a location is targeted 5-6 kg. of wheat/day of work Generally food transfer is being by the public food distribution system
US$1 million; about
100,000
beneficiaries
annually
Elderly Old Age Allowances Providing old age cash allowance
to the poor. Department of Social Services Financed by GoB
1. At least 65 years of age 2. Income not more than Tk. 2000 per year 3. Must not have worked in the formal sector 4. Based upon the category of the union, number of beneficiary is identified 5. 50% men and 50% women
a. Tk. 165 per month Cash is being transferred by the public sector banks
US$30 million. About 1.2 million beneficiaries annually.
Other Risk Groups Vulnerable Group Feeding (VGF)
1. Provides calamity related emergency needs 2. Short term relief to disaster victims - – in terms of food and basic necessities.
Ministry of Food and Disaster Management Financed by GoB and some Development Partners
Generally a location is targeted based on the occurrence of natural disaster
No specific entitlement Generally food is being transferred by the public food distribution system
US$30 million. About 240,000 beneficiaries annually.
Gratuitous Relief (GR)
1. Provides in calamity related emergency needs 2. Short term relief to disaster victims – in terms of food and basic necessities.
Ministry of Food and Disaster Management Financed by GoB and some Development Partners
Generally a location is targeted based on the occurrence of natural disaster
No specific entitlement No precise method
NA

49
Name of Programs Major Objective of the Program
Administration/ Financiers Targeting Criteria Value of Benefit
Annual Costs and Number of
Beneficiaries Fund for Mitigation of Risk of Natural Disaster
Mitigate sufferings of people affected by natural disasters. Provision of loans to set up small businesses.
Ministry of Food and Disaster Management Financed by GoB
Generally a location is targeted based on the occurrence of natural disaster
a. Loan between Tk. 5,000 to Tk. 25,000 for 1 to 3 years with nominal 5% service charge Cash is being transferred by the public sector banks
US$15 million. About 100,000 beneficiaries annually.
Allowances to the Widowed, Deserted, and Destitute Women
Minimizing the problems of the women at distress through cash transfers.
Ministry of Women and Children's Affairs Financed by GoB
1. Women who are either widowed, deserted, or destitute 2. Based upon the category of the union, number of beneficiary is identified
a. Tk. 165 per month Cash is being transferred by the public sector banks
US$3 million. About 100,000 beneficiaries annually.
Honorarium Program for Insolvent Freedom Fighters
Assisting poor freedom fighters through cash transfers.
Ministry of Freedom Fighters Affairs Financed by GoB
1. Verifiable in cross section of references 2. Income less than Tk. 6000 per year 3. Disabled or partially disabled or landless or unemployed or none in the family to depend upon
a. Tk. 300 per month Cash is being transferred by the public sector banks
US$8 million. About 200,000 beneficiaries.
Fund for Housing for the Distressed (Grihayan Tahabil)
Solve the housing problem of the homeless, poor and low income people
Housing Fund Authority in association with NGO, institutions and local government Financed by GoB
1. Rural poor, low income and homeless family 2. Household affected by natural disaster and fire 3. Capable of paying 5% flat interest rate
a. Loan up to Tk. 20,000 Cash is being transferred by the public sector banks
NA
Fund for Rehabilitation of Acid Burnt Women and the Physically Handicapped
1. Assisting acid burnt women and disabled through provision of credit and skills training. 2. Creating opportunities for IGA 3. Raising social awareness
Ministry of Women and Children's Affairs Financed by GoB
Installation of facility Generally based upon case
a. Training b. Credit Not known
US$4 million.

50
Annex 4: VGD Delivery Mechanism: Duties and Responsibilities at a Glance Agents Duties and Responsibilities
Central
Coordination
Committee
1. Policy frame working and analysis
2. Coordinating between ministries, directorates and NGOs
3. Protecting government properties
Implementation
Committee
4. Ensuring efficient execution of the program based on manuals
5. Ensuring supplies of logistics
6. Coordinating among various agencies
7. Evaluating fund flow, food, credit
8. Analyzing reports and progress
9. Providing field level directives
District VGD
Committee
10. Ensuring success of the program based on manuals
11. Ensuring delivery of wheat by exact quantity and quality
12. Taking actions for transport and ancillary expenses
13. Identifying problems and providing solutions
14. Preparing and reporting to the higher agencies
Upazila VGD
Committee
15. Ensuring proper selection of beneficiaries
16. Allocating VGD cards to unions based on relative poverty
17. Cooperating and coordinating NGOs
18. Supervising delivery of wheat and ensuring exact quantity and quality
19. Collecting fund for transport and ancillary expenses in time
20. Preparing and reporting to the higher agencies
Upazila IGVGD
Committee
21. Scrutinizing list of beneficiaries and the selection process
22. Implementing skill training program and providing technical support
23. Evaluating group based progress of the women’s social, health and nutrition related factors
24. Assessing income generating activities and credit schemes
25. Preparing and reporting to the higher agencies
Union VGD
Committee
26. Ensuring appropriate selection process based on manuals
27. Ensuring delivery of 30 KGs of wheat by exact quantity and quality
28. Ensuring distribution in time on the date
29. Keeping documents updated and reporting to the higher agencies
30. Assisting NGOs and helping them with the savings scheme
31. Ensuring the safety and storing of collected wheat
NGO 32. Providing varieties of predetermined training
33. Collecting mandatory savings
34. Extending credit as per contract with the Ministry of Women and Child Affairs
35. Preparing and reporting to the higher agencies
Beneficiary 36. Saving the mandatory savings
37. Attending distribution center in time
38. Taking various training
Source: Ahmed (2004b).
51
REFERENCES
Ahmed, A.U. (2004a). Assessing the Performance of Conditional Cash Transfer Programs for Girls and Boys in Primary and Secondary Schools in Bangladesh. Working Paper, IFPRI. Ahmed, Shaikh (2004b). Delivery Mechanism for Cash Transfer Programs to the Poor. Social Protection Discussion Paper Series 0520, World Bank. Ahmed, A.U. and Carlo del Ninno (2002). The Food for Education Program in Bangladesh: An Evaluation of its Impact on Educational Attainment and Food Security. Food Consumption and Nutrition Division Discussion paper No. 138. International Food Policy Research Institute, Washington D.C. (September). Alderman (2002). Subsidies as Social Safety Nets: Effectiveness and Challenges, Social Protection Discussion Paper Series, No. 0224, World Bank. Abrahart, A., S. Ahmed, A. Dar, and V. Sundararaman (2004). Safety Net Programs in Bangladesh. Prepared as Background Paper for Social Safety Nets in Bangladesh: An Assessment. World Bank. Begum, S. and P. Paul-Majumder (2001). The Allowance Scheme for Widowed and Husband Deserted Women in Bangladesh: Some Field Level Information. The Bangladesh Institute of Development Studies, Dhaka, (mimeographed). BIDS (2003). Impact Evaluation of Social Safety Nets Initiatives, Final Report, April, Dhaka. Coady, D., M. Grosh and J. Hoddinott (2004). Targeting of Transfers in Developing Countries: Review of Lessons and Experience. World Bank-IFPRI Working Paper. Danish Bilharziasis Laboratory (2004). Disability in Bangladesh: A Situation Analysis. del Ninno, C. and P. Dorosh (2001). In-kind Transfers and Household Food Consumption: Implication for Targeted Food Programs in Bangladesh. FMRSP Working Paper No. 17, IFPRI, Dhaka. del Ninno, C., P. Dorosh and L. Smith (2003). Public Policy, Markets and Household Coping Strategies in Bangladesh: Avoiding a Food-Security Crisis Following the 1998 Floods. World Development 31(7). Dorosh, P., C. del Ninno and Q. Shahabuddin (2004). The 1998 Floods and Beyond: Towards Comprehensive Food Security in Bangladesh. A University Press Limited and IFPRI Publication. Galasso, E. and M. Ravallion (2000). Distributional Outcomes of a Decentralized Welfare Program. Policy Research Working Paper 2316, World Bank. Grosh et.al. (2003). Proxy Means Tests for Targeting Social Programs: Simulations and Speculation, Living Standards Measurement Study (LSMS) Working Paper; no. 118, World Bank.

52
Matin, I., and D. Hulme (2003). Programs for the Poorest: Learning from the IGVGD Program in Bangladesh. World Development, 2003, vol. 31, issue 3, pages 647-665. Karim, R., S. Lamstein, M. Akhtaruzzaman, K. Rahman and N. Alam (2003). The Bangladesh Integrated Nutrition Project: Endline Evaluation of the Community-Based Nutrition Component. Background Paper for the World Bank. Khandhker, S. (1998). Fighting Poverty with Microcredit: Experience in Bangladesh. Oxford University Press, U.S.A.. Khandhker, S. and M. Pitt (1998). The Impact of Group-Based Credit Programs on Poor Households in Bangladesh: Does the Gender of Participants Matter? Journal of Political Economy, October 1998. Khanum S. M. (2000). Knocking at the Doors: The Impact of RMP on the Womenfolk in the Project Adjacent Areas. Journal of the Institute of Bangladesh Studies, Vol. XXIII, pp. 77-98. McKernan, Signe-Mary, M. Pitt and D. Moskowitz (2004). Use of the Formal and Informal Financial Sectors: Does Gender Matter? Empirical Evidence from Rural Bangladesh. Working Paper. Morduch, J. (1998). The Microfinance Schism. Development Discussion Paper No. 626, Harvard University. Rawlings, L. (2004). A New Approach to Social Assistance: Latin America’s Experience with Conditional Cash Transfer Programs. Working Paper Report No. 30165, World Bank. Sen, B. and D. Hulme (2004). Chronic Poverty in Bangladesh: Tales of Ascent, Descent, Marginality and Persistence. Smith, W. and K. Subbarao (2003). What Role for Safety Net Transfers in Very Low Income Countries? Social Protection Discussion Paper Series; No. SP 0301, World Bank. Subbarao, K. (2002). Systemic Shocks and Social Protection: Role and Effectiveness of Public Works Programs. Social Protection Discussion Paper Series; No. SP 0302, World Bank. Tabor, S. (2002). Assisting the Poor with Cash: Design and Implementation of Social Transfer Programs. Social Protection Discussion Paper Series 0223, World Bank. Tietjen, K. (2003). Female Secondary School Assistance Project (FSSAP) – II: A Review of New Design Elements. Draft Paper for the World Bank. Tufts University (2002). Does Microcredit Meet the Needs of all Poor Women? Constraints to Participation among Destitute Women in Bangladesh. Food Policy and Applied Nutrition Program, Discussion Paper No. 3. World Bank (2001). Social Safety Net Assessment. A Toolkit for Latin America and the Caribbean. —— (2002a). Poverty and Vulnerability in South Asia.
53
—— (2002b). Public Expenditure Review ( 2003). —— (2002c). Poverty in Bangladesh: Building on Progress. —— (2003a). Sustainable Development in a Dynamic World. Transforming Institutions, Growth and Quality of Life. —— (2003b). World Development Report. —— (2004). Concept Note on Dhaka Urban Poverty Study. Zaman, H. (2004). The Scaling-Up of Microfinance in Bangladesh: Determinants, Impact, and Lessons. World Bank Discussion Paper.
54
World Bank Bangladesh Development Series Publications
1. Bangladesh PRSP Forum Economic Update – Recent Developments and Future
Perspectives, paper no. 1, November 2005. 2. End of MFA Quotas: Key Issues and Strategic Options for Bangladesh Readymade
Garment Industry, paper no. 2, December 2005. 3. Bangladesh Country Water Resources Assistance Strategy, paper no. 3, December 2005 4. Comparative Advantages of Health Care Provision, paper no. 4, December 2005 5. Targeting Resources for the Poor in Bangladesh, paper no. 5, December 2005 6. Improving Trade and Transport Efficiency – Understanding the Political Economy of
Chittagong Port, paper no. 6, December 2005 7. Revitalizing the Agricultural Technology System in Bangladesh, paper no. 7, December
2005 8. Bangladesh Integrated Nutrition Project, Effectiveness and Lessons Learned, paper no. 8,
December 2005 9. Social Safety Nets in Bangladesh: An Assessment, paper no. 9, January 2006
All Bangladesh Development Series papers are available at www.worldbank.org.bd/bds