Embed Size (px)
Citation preview

00
IND
ON
ESIA
OECD Development Pathways
Social Protection System Review of Indonesia
OECD Development Pathways
Social Protection System Review of IndonesiaIndonesia has made impressive progress in reducing income inequality and improving living standards since the Asian Financial Crisis but the decline in poverty has slowed in recent years while inequality has risen and a large part of the population remains vulnerable. The Government of Indonesia has recognised the potential of social protection to address these challenges and to underpin a long-term development strategy based on more inclusive economic growth. As a consequence, social assistance programmes have grown significantly in recent years while social insurance has undergone major reforms. The Government is gradually realising its vision of a system of social protection, based on comprehensive and coherent coverage for all age groups.
The Social Protection System Review of Indonesia charts the evolution of social protection. It explores the current context for social protection and how this is likely to evolve in the future, analyses the extent to which existing programmes are aligned to those needs and how effective these programmes are at reducing poverty. It also examines the financing of social protection. Finally, it proposes policies to enhance the social protection system across a number of dimensions, including programmes, institutions, financing and information architecture.
ISBN 978-92-64-97045-8
Consult this publication on line at https://doi.org/10.1787/788e9d71-en.
This work is published on the OECD iLibrary, which gathers all OECD books, periodicals and statistical databases. Visit www.oecd-ilibrary.org for more information.
9HSTCQE*jhaefi+This project is co-funded bythe European Union
So
cial Pro
tection S
ystem R
eview o
f Ind
on
esia O
EC
D D
evelop
ment P
athways

OECD Development Pathways
Social Protection System Review of Indonesia

This work is published under the responsibility of the Secretary-General of the OECD. The
opinions expressed and arguments employed herein do not necessarily reflect the official
views of the member countries of the OECD or its Development Centre.
This document, as well as any data and any map included herein, are without prejudice
to the status of or sovereignty over any territory, to the delimitation of international
frontiers and boundaries and to the name of any territory, city or area.
Please cite this publication as:OECD (2019), Social Protection System Review of Indonesia, OECD Development Pathways, OECDPublishing, Paris.https://doi.org/10.1787/788e9d71-en
ISBN 978-92-64-97045-8 (print)ISBN 978-92-64-37045-6 (pdf)
OECD Development PathwaysISSN 2308-734X (print)ISSN 2308-7358 (online)
The statistical data for Israel are supplied by and under the responsibility of the relevant Israeli authorities. The use ofsuch data by the OECD is without prejudice to the status of the Golan Heights, East Jerusalem and Israeli settlements inthe West Bank under the terms of international law.
Photo credits: Cover © Design by the OECD Development Centre.
Corrigenda to OECD publications may be found on line at: www.oecd.org/about/publishing/corrigenda.htm.
© OECD 2019
You can copy, download or print OECD content for your own use, and you can include excerpts from OECD publications, databases and
multimedia products in your own documents, presentations, blogs, websites and teaching materials, provided that suitable
acknowledgement of OECD as source and copyright owner is given. All requests for public or commercial use and translation rights should
be submitted to [email protected]. Requests for permission to photocopy portions of this material for public or commercial use shall be
addressed directly to the Copyright Clearance Center (CCC) at [email protected] or the Centre français d’exploitation du droit de copie
(CFC) at [email protected].

FOREWORD │ 3
SOCIAL PROTECTION SYSTEM REVIEW OF INDONESIA © OECD 2019
Foreword
Social protection in Indonesia has evolved as fast as the country itself over the past two
decades. Today, the Government of Indonesia (GoI) recognises social protection as being
central to its economic, political and social development as well as its ambition of
becoming one of the world’s ten largest economies by 2030. Social protection is at the
core of the 2015-19 Medium Term Development Plan (RPJMN), which articulates a
vision for inclusive economic growth that promotes equality of income and opportunity
as a precondition for escaping the middle-income trap and fulfilling the country’s
potential.
This Social Protection System Review of Indonesia (SPSR) is produced by the European
Union Social Protection Systems Programme (EU-SPS) in close collaboration with the
Ministry of National Development Planning (BAPPENAS) and with the broader support
of the GoI as well as development partners. The SPSR intends to inform next Indonesia’s
RPJMN for the period 2020-24 as well as related policy processes.
The SPSR examines how social protection has evolved since the Asian Financial Crisis. It
maps social protection provision and analyses the impact of key programmes. It also
examines the financing of social protection and the challenges of harmonising programme
implementation and poverty-targeting across Indonesia’s vast geographical area.
The SPSR also focuses on the GoI’s progress in closing gaps in social protection
provision and achieving greater coherence and co-ordination amongst different
programmes, institutions and levels of government in order to create a social protection
system. This is essential for reducing poverty and high levels of inequality as well as
optimising financial resources. New challenges, such as shifting demographics, climate
change and the fourth industrial revolution, heighten the urgency of strengthening the
social protection system.
Numerous stakeholders in the GoI, development partners involved with social protection,
and representatives from academia and broader civil society worked together to develop
the recommendations in this report. These address challenges such as enhancing the
impact of social assistance on poverty, expanding social insurance coverage, optimising
the institutional and information architecture for social protection, and mitigating gender
imbalances. We hope this review will contribute to further enhancing social protection in
Indonesia, maximising its potential to promote inclusive growth and thus underpin the
country’s progress towards achieving prosperity for all Indonesians.
Mario Pezzini
Director of the OECD Development
Centre and Special Advisor
to the OECD Secretary-General on Development

4 │ ACKNOWLEDGEMENTS
SOCIAL PROTECTION SYSTEM REVIEW OF INDONESIA © OECD 2019
Acknowledgements
The Social Protection System Review of Indonesia was prepared by the Social Cohesion
Unit of the OECD Development Centre as part of the European Union Social Protection
Systems Programme (EU-SPS).
The team was led by Alexandre Kolev, Head of the Social Cohesion Unit, under the
guidance of Naoko Ueda and Mario Pezzini, Director of the OECD Development Centre
and Special Advisor to the OECD Secretary-General on Development. The report was
drafted by Alexander Pick and Caroline Tassot, drawing on a background paper prepared
by the Economic Policy Research Institute. Justina La provided assistance at every stage.
The report was reviewed by Pak Pungky Sumadi, Pak Maliki and Ibu Vivi Yulaswati
from the Indonesian Ministry of National Development Planning (BAPPENAS),
Christine Lewis from the Economics Department of the OECD and Marco Schaefer
(World Bank), all of whom provided extremely valuable feedback. Thank you.
Particular thanks are due to Pak Maliki, who has been an outstanding source of guidance
and support for EU-SPS activities in Indonesia, particularly those related to this report.
Massimo Geloso Grosso, head of the OECD’s Jakarta office, has also provided valuable
assistance. Anja Hornig (GFA Consulting Group) has also been an excellent source of
support during the compilation of the report.
The recommendations contained in this report benefited considerably from presentations
and comments at a workshop held at BAPPENAS in Jakarta on 17 October 2018. Many
thanks to all who participated.
The OECD Development Centre’s publication team, led by Delphine Grandrieux,
produced the publication. The cover was designed by Aida Buendía.
The European Union Social Protection Systems Programme is co-financed by the
European Union, the OECD and the Government of Finland.
This publication has been produced with the assistance of the European Union and
Finland. The contents of this publication are the sole responsibility of the OECD and can
in no way be taken to reflect the views of the European Union or the Government of
Finland.
TABLE OF CONTENTS │ 5
SOCIAL PROTECTION SYSTEM REVIEW OF INDONESIA © OECD 2019
Table of contents
Foreword ................................................................................................................................................ 3
Acknowledgements ................................................................................................................................ 4
Abbreviations and acronyms .............................................................................................................. 10
Executive summary ............................................................................................................................. 12
Assessment and recommendations ..................................................................................................... 14
Indonesia’s economic development has not benefited the entire population ..................................... 14 Social assistance has evolved rapidly and expanded recently ........................................................... 16 Indonesia is making rapid progress towards universal health coverage but pension coverage
remains low ........................................................................................................................................ 18 Social protection spending is constrained by low domestic resource mobilisation ........................... 20 A systems approach is reducing fragmentation of social protection.................................................. 20 Recommendations .............................................................................................................................. 22
Chapter 1. A forward-looking assessment of social protection needs ............................................. 25
Indonesia confronts a last-mile problem in reducing poverty ............................................................ 26 Women, children and the elderly are most exposed to risks across the life cycle ............................. 37 Climate change is a threat while Industry 4.0 poses opportunities and risks ..................................... 53 Note .................................................................................................................................................... 55 References .......................................................................................................................................... 55
Chapter 2. Social protection coverage ............................................................................................... 61
Social protection is growing in prominence ...................................................................................... 62 Social assistance has evolved in a fragmented fashion ...................................................................... 63 Social insurance is leading systematisation of social protection ....................................................... 71 Labour market programmes are too small to increase productivity ................................................... 75 Gaps in social protection reflect structural constraints to Indonesia´s development ......................... 78 Notes .................................................................................................................................................. 79 References .......................................................................................................................................... 80 Annex 2.A. Detailed inventory of social protection programmes ..................................................... 84
Chapter 3. Effectiveness of social protection .................................................................................... 91
Rice for the Poor: Rastra .................................................................................................................... 92 Assistance for Poor Students: Programme Indonesia Pintar (PIP) .................................................... 98 Social Health Insurance for the Poor and Near Poor: Penerima Bayaran Iuran (PBI) ..................... 102 Conditional cash transfer: Program Keluarga Harapan (PKH) ........................................................ 108 Pensions in Indonesia: a gender perspective .................................................................................... 114 Notes ................................................................................................................................................ 121 References ........................................................................................................................................ 121
Chapter 4. Financing social protection ............................................................................................ 125

6 │ TABLE OF CONTENTS
SOCIAL PROTECTION SYSTEM REVIEW OF INDONESIA © OECD 2019
Changes to the structure of spending offer space for social protection to scale up ......................... 126 Spending on key social assistance programmes is growing strongly .............................................. 131 JKN’s success in reaching the missing middle is threatening its sustainability .............................. 136 Low revenues are a major constraint on Indonesia’s development ................................................. 137 Indonesia’s fiscal deficit is narrowing and debt levels have declined ............................................. 141 The combined impact of taxes and direct transfers is to reduce inequality ..................................... 142 References ........................................................................................................................................ 146
Chapter 5. Strengthening the social protection system .................................................................. 149
The institutional structure for social protection remains fragmented .............................................. 150 Shared system functions should be expanded .................................................................................. 152 Build on and refine the Unified Database ........................................................................................ 153 Clarify and optimise sub-national government’s role in social protection ...................................... 155 Empower social workers to implement and strengthen social protection policies .......................... 157 Continue to consolidate social assistance programmes ................................................................... 157 Prepare for growing pressure around benefits for the elderly .......................................................... 159 Strengthen the contributory system to reach the missing middle .................................................... 160 A bright future for social protection but higher funding is needed .................................................. 161 References ........................................................................................................................................ 162
Tables
Table 1.1. The health burden of non-communicable diseases is increasing .......................................... 51 Table 2.A.1. Inventory of social protection programmes ...................................................................... 84 Table 3.1. Rastra subsidies represent an increasing burden on government ......................................... 94 Table 3.2. Rastra benefits represent a decreasing share of living standards .......................................... 94 Table 3.3. Rastra significantly reduces poverty .................................................................................... 97 Table 3.4. All PIP benefits increased after 2013 ................................................................................... 99 Table 3.5. PIP benefits are relatively large ............................................................................................ 99 Table 3.6. PIP is a cost-efficient tool to alleviate poverty ................................................................... 102 Table 3.7. PBI premiums are low ........................................................................................................ 104 Table 3.8. Supply side and adverse selection are factors in JKN enrolment for informal workers ..... 107 Table 3.9. PKH currently targets children and mothers ...................................................................... 109 Table 3.10. PKH benefits have not significantly increased in recent years ........................................ 111 Table 3.11. PKH is the most efficient poverty alleviation programme ............................................... 114 Table 3.12. In households with higher child dependency ratios, women work less than men ............ 117 Table 3.13. In households with higher child dependency ratios, women and men are more likely to
work informally ........................................................................................................................... 118 Table 3.14. Women with formal jobs are more likely to stay in the labour force when they have
children than women in informal jobs ......................................................................................... 118 Table 4.1. JKN’s deficit is widening ................................................................................................... 136

TABLE OF CONTENTS │ 7
SOCIAL PROTECTION SYSTEM REVIEW OF INDONESIA © OECD 2019
Figures
Figure 1.1. The decline in national poverty has slowed ........................................................................ 26 Figure 1.2. Poverty fell in rural and urban areas in 2018 ...................................................................... 29 Figure 1.3. Indonesia’s poor population is relatively homogenous ....................................................... 30 Figure 1.4. Around 40% of the population is poor or vulnerable .......................................................... 31 Figure 1.5. Many individuals have emerged from poverty but some are becoming poor ..................... 32 Figure 1.6. Urban inequality is higher than rural .................................................................................. 32 Figure 1.7. Recent growth has benefited individuals in the middle of the income distribution ............ 33 Figure 1.8. Prevalence and intensity of multi-dimensional poverty are declining slowly ..................... 34 Figure 1.9. Child mortality is among the leading dimensions of deprivation ....................................... 34 Figure 1.10. Poverty rates vary greatly by province .............................................................................. 35 Figure 1.11. Poverty is concentrated among children and the elderly ................................................... 37 Figure 1.12. Indonesia has made a rapid demographic transition ......................................................... 38 Figure 1.13. The old-age dependency ratio is about to start a rapid ascent ........................................... 39 Figure 1.14. Maternal mortality has more than halved since 2000 ....................................................... 40 Figure 1.15. Access to medical services before and at birth is close to universal ................................. 40 Figure 1.16. Mortality under age 5 has fallen since the 1990s .............................................................. 41 Figure 1.17. Stunting remains a significant problem ............................................................................. 42 Figure 1.18. Enrolment in pre-school education has increased ............................................................. 43 Figure 1.19. School enrolment is high and rising .................................................................................. 44 Figure 1.20. Senior high school enrolment is rising rapidly ................................................................. 45 Figure 1.21. Tertiary enrolment lags behind benchmark countries ....................................................... 46 Figure 1.22. The proportion of youth NEET remains high, especially among women ......................... 46 Figure 1.23. A large gender gap exists in labour force participation .................................................... 47 Figure 1.24. Unemployment has declined and varies by province ........................................................ 48 Figure 1.25. Informality is declining slowly ......................................................................................... 49 Figure 1.26. Informality and poverty are correlated .............................................................................. 49 Figure 1.27. Old-age poverty has barely declined in recent years ......................................................... 50 Figure 1.28. The proportion of people treating themselves has declined .............................................. 52 Figure 1.29. Agriculture’s share of output and employment has declined ............................................ 54 Figure 2.1. JKN coverage and type of membership .............................................................................. 74 Figure 3.1. A majority of informal and about half of unemployed individuals benefits from Rastra ... 93 Figure 3.2. Rastra coverage is declining ............................................................................................... 93 Figure 3.3. Rastra coverage is wide but inclusion errors are prominent in urban areas ........................ 95 Figure 3.4. Rastra beneficiary distribution displays important differences across rural and urban
areas ............................................................................................................................................... 96 Figure 3.5. About one third of Rastra benefits are received by poorest quintile ................................... 97 Figure 3.6. PIP coverage has risen strongly but is now steady.............................................................. 98 Figure 3.7. PIP beneficiary incidence is pro-poor and much larger in rural areas .............................. 100 Figure 3.8. PIP beneficiaries are better targeted in urban areas .......................................................... 100 Figure 3.9. PIP incidence by type of benefit ....................................................................................... 101 Figure 3.10. The PIP benefit distribution is pro-poor .......................................................................... 101 Figure 3.11. PIP benefit distribution varies across education levels ................................................... 102 Figure 3.12. PBI coverage is rising ..................................................................................................... 103 Figure 3.13. PBI covers around one-quarter of informal or unemployed individuals ......................... 104 Figure 3.14. PBI beneficiary incidence is pro-poor............................................................................. 105 Figure 3.15. PBI beneficiary distribution is more pro-poor in urban areas ......................................... 106 Figure 3.16. PBI benefit distribution ................................................................................................... 106 Figure 3.17. PKH coverage has grown significantly since 2014 ......................................................... 110

8 │ TABLE OF CONTENTS
SOCIAL PROTECTION SYSTEM REVIEW OF INDONESIA © OECD 2019
Figure 3.18. PKH beneficiary incidence is pro-poor ........................................................................... 112 Figure 3.19. PKH beneficiary distribution is more pro-poor in urban areas ....................................... 113 Figure 3.20. PKH benefit distribution ................................................................................................. 113 Figure 3.21. Women work less and are more likely to work informally than men ............................. 116 Figure 3.22. Women are more likely to be family workers than men ................................................. 116 Figure 3.23. Women are more likely than men to rely on children for old-age support ..................... 119 Figure 3.24. Women are much less likely than men to receive a pension in old age .......................... 120 Figure 4.1. Government spending has declined as a proportion of GDP ............................................ 128 Figure 4.2. The composition of public spending is changing .............................................................. 128 Figure 4.3. Fiscal space has opened up as interest payments and subsidies decline ........................... 129 Figure 4.4. Energy subsidies declined dramatically after 2014 ........................................................... 130 Figure 4.5. Social assistance spending increased as fuel subsidies declined ....................................... 131 Figure 4.6. Premium subsidies for PBI beneficiaries is rising sharply as coverage grows ................. 132 Figure 4.7. Rastra spending is on the rise but beneficiary numbers are steady ................................... 133 Figure 4.8. PIP spending and coverage are on the rise ........................................................................ 134 Figure 4.9. PKH spending has increased rapidly................................................................................. 134 Figure 4.10. BLSM is a time-bound but significant intervention ........................................................ 135 Figure 4.11. Government revenues have declined as a proportion of GDP ........................................ 138 Figure 4.12. Tax revenues are very low by regional standards ........................................................... 138 Figure 4.13. Direct taxes account for over half of tax revenue ........................................................... 139 Figure 4.14. Declining oil revenues are bringing down non-tax revenue ........................................... 140 Figure 4.15. The fiscal deficit widened after 2010 .............................................................................. 141 Figure 4.16. The debt-to-GDP ratio has declined significantly ........................................................... 142 Figure 4.17. The tax system is mildly progressive .............................................................................. 143 Figure 4.18. Direct and indirect taxes weigh on consumption ............................................................ 144 Figure 4.19. Transfers do not outweigh the impact of taxes on poverty ............................................. 145 Figure 5.1. Social protection coverage is not comprehensive amongst the poor ................................ 158
Boxes
Box 1.1. National and international poverty measures and terms used in this Review ......................... 27 Box 1.2. The poor population is relatively homogenous ....................................................................... 29 Box 1.3. Reaching marginalised areas and people through the Village Funds ..................................... 36 Box 2.1. Social protection in rooted in the Constitution ....................................................................... 63 Box 2.2. The Unified Database is the basis for a social assistance system ........................................... 66 Box 3.1. Adverse selection and barriers to JKN enrolment ................................................................ 107 Box 4.1. Deepening decentralisation in Indonesia’s intergovernmental system ................................. 126 Box 4.2. Spending on subsidies has declined significantly but rebounded in 2018 ............................ 130 Box 4.3. PKH loan recognises the investment case for social protection ........................................... 135 Box 4.4. Increasing tobacco excise taxes for revenues and health ...................................................... 140 Box 5.1. Social protection cards are promoting access to benefits and financial inclusion ................ 154 Box 5.2. Social protection can address systemic gender disadvantages .............................................. 160

TABLE OF CONTENTS │ 9
SOCIAL PROTECTION SYSTEM REVIEW OF INDONESIA © OECD 2019
Follow OECD Publications on:
http://twitter.com/OECD_Pubs
http://www.facebook.com/OECDPublications
http://www.linkedin.com/groups/OECD-Publications-4645871
http://www.youtube.com/oecdilibrary
http://www.oecd.org/oecddirect/Alerts
OECD

10 │ ABBREVIATIONS AND ACRONYMS
SOCIAL PROTECTION SYSTEM REVIEW OF INDONESIA © OECD 2019
Abbreviations and acronyms
AIDS Acquired Immune Deficiency Syndrome
BAPPENAS Kementerian Negara Perencanaan Pembangunan, Ministry for
Planning and Development
BDT Basis Data Terpadu, see also UDB
Bidikmisi Student Special Assistance
BPJS Badan Pengelola Jaminan Sosial, National Social Security
Administering Body
DJSN National Social Security Council
FAO Food and Agricultural Organization
GDP Gross domestic product
GoI Government of Indonesia
HIV Human Immunodeficiency Virus
IDR Indonesian rupiah
IFLS Indonesian Family Life Survey
ILO International Labour Organization
IMF International Monetary Fund
JKN Program Jaminan Kesehatan Nasional, Public Health Insurance
KIS Kartu Indonesia Sehat, Healthy Indonesia Card
KUBE Kelompok Usaha Bersama, Co-operative Business Groups
MoEC Ministry of Education and Culture
MoEMR Ministry of Energy and Mineral Resources
MoF Ministry of Finance
MoPWPH Ministry of Public Works and Public Housing
MoRA Ministry of Religious Affairs
MoRTHE Ministry of Research, Technology and Higher Education
MoSA Ministry of Social Affairs
NGO Non-governmental organisation
OECD Organisation for Economic Co-operation and Development
OPHI Oxford Poverty Development Initiative

ABBREVIATIONS AND ACRONYMS │ 11
SOCIAL PROTECTION SYSTEM REVIEW OF INDONESIA © OECD 2019
PBI Penerima Bantuan Iuran, Non-contributory health programme
PBPU Non-wage or informal workers
PEKKA Perempuan Kepala Keluarga, Female-Headed Household
Empowerment Program
PIP Indonesian smart card
PKH Program Keluarga Harapan, Family of Hope conditional cash
transfer programme
PODES Potensi Desa
PPLS 2011 Pendataan Program Perlindungan Sosial or Data Collection on
Social Protection Programmes for 2011
PPP Purchasing power parity
PT ASABRI Asuransi Sosial Angkatan Bersenjata, Social insurance for the
Armed Forces
PT TASPEN Tabungan dan Asuransi Pensiun, Civil Servants Insurance Savings
RPJMN National Medium Term Development Plan, Indonesia
SJSN Sistem Jaminan Sosial Nasional, National Social Security System
SUSENAS Survei Sosial Ekonomi Nasional, National Socioeconomic Survey
TNP2K Tim Nasional Percepatan Penanggulangan Kemiskinan, National
Team for Accelerating Poverty Reduction
UDB Unified Database for Targeting, see also BDT
USAID US Agency for International Development
UN United Nations
UNDP UN Development Programme
UNICEF UN Children’s Fund
USD United States dollar

12 │ EXECUTIVE SUMMARY
SOCIAL PROTECTION SYSTEM REVIEW OF INDONESIA © OECD 2019
Executive summary
The Asian Financial Crisis of 1997-98 caused massive economic, political and social
upheaval in Indonesia. Two decades later, the country has set its sights on becoming one
of the ten largest economies in the world. Social protection has proven a key component
of Indonesia’s economic recovery, its transition to democracy and progress towards a
more cohesive society. The Government of Indonesia (GoI) considers social protection as
a critical means of reducing inequalities of wealth and opportunity that represent a critical
constraint to the country’s economic and social ambitions.
Since the Asian Financial Crisis, Indonesia has made great progress towards establishing
a social protection system that cover a wide range of risks. Successive governments have
replaced the country’s traditional approach to poverty relief with developmental social
assistance programmes and reformed the social insurance system by implementing a new
administrative and legislative architecture, expanding coverage and improving benefits.
The extraordinary progress towards universal health coverage is emblematic of
Indonesia’s achievements. As of October 2018, 203 million people, or three quarters of
the population, were covered by Jaminan Kesehatan Nasional (JKN, national health
insurance). Driving the growth in coverage is the GoI’s policy to subsidise fully or in-part
the contributions of individuals who might otherwise be excluded from health provision.
Yet social protection is not yet operating at its full potential. Poor households with
children are entitled to a number of complementary social protection programmes to
promote their sustainable exit from poverty but only a minority of beneficiaries receive
the full range of benefits. The largest programmes, in particular the rice subsidy for the
poor, have historically been the least well targeted. At the same time, a new pension
system is struggling to increase coverage amongst Indonesia’s large informal sector,
while the growth of JKN is raising concerns around its long-term sustainability. Labour
market policies to promote economic participation and productive employment amongst
vulnerable groups are underdeveloped.
Social protection confronts major challenges. First, it must help address Indonesia’s last-
mile problem. The GoI has targeted a national poverty rate of around 8% since 2004; the
rate fell below double-figures for the first time in 2018. Income poverty is concentrated
among children and the elderly. It also varies greatly be region: the poverty rate in Jakarta
is below 5% but exceeds 30% in a number of eastern provinces. In addition to the poor
population, some 30% of Indonesians are considered vulnerable.
Social protection can do more to improve livelihoods and income security among this
group, particularly individuals (typically in informal employment) who are not eligible
for social assistance but are also unable or unwilling to register for social insurance,
sometimes referred to as the missing middle. Strengthening mechanisms to protect and
promote this cohort – and the informal workforce as a whole – is a key means of growing
the middle class, which currently accounts for some 20% of the population and is key to
Indonesia’s future economic prospects. Major gender imbalances also exist. Women are

EXECUTIVE SUMMARY │ 13
SOCIAL PROTECTION SYSTEM REVIEW OF INDONESIA © OECD 2019
poorer across the life cycle and face disadvantages at school and, especially, in
employment.
Looking ahead, Indonesia’s demographics will become less benign as the population
starts to age rapidly. Poverty amongst elderly Indonesians has not declined at the same
rate as for other groups (notably children), in part because their access to social protection
is extremely low. The productivity of the next generations of workers will be crucial in
determining whether the Fourth Industrial Revolution is an opportunity or a threat. Other
threats also loom in Indonesia’s future, such as the impact of climate change and
increased frequency of natural disasters.
To meet these challenges, GoI should press ahead with its commitment to establish a
social protection system based on two overarching priorities. First, it must address gaps in
social assistance and social insurance provision to achieve comprehensive coverage
across the lifecycle. Secondly, greater co-ordination and coherence between programmes
is needed, as well as between the institutions that implement them and the information
and targeting systems they use. Lack of co-ordination between central and sub-national
government, between which responsibility for social protection provision is shared, is a
further structural challenge to the implementation of national social protection strategies.
Social protection also faces significant financing constraints. To achieve long-term
reductions in poverty and meet the risks identified here, higher allocations to social
protection are required and resources must be optimised. However, Indonesia’s low levels
of domestic resource mobilisation, as well as a large number of competing government
priorities, are likely to limit the fiscal resources available to social protection.
Formalisation policies will be important both for generating higher taxes, generating
better jobs and expanding social insurance coverage.
In spite of these challenges, Indonesia possesses important foundations for a social
protection system. Strong programmes have emerged, such as the Program Keluarga
Harapan (PKH), a conditional cash transfer that has proven effective not only in reducing
poverty but also improving beneficiaries’ health and education outcomes. Eligibility for
PKH is determined by the Unified Database (UDB), a common targeting instrument for
all social assistance programmes that links beneficiaries to complementary interventions,
thereby maximising their chances of escaping from poverty.
This review proposes a number of recommendations for strengthening the social
protection system that were developed jointly with the GoI, development partners and
other social protection stakeholders. The review identifies scope to consolidate social
protection programmes, to improve co-ordination between national and sub-national
government, and to enhance the information architecture for social protection, for
instance the UDB, as well as monitoring and evaluation systems. It also emphasises the
importance of strengthening the social workforce and examines to what degree social
protection might enhance gender equality and provide long-term income security to the
elderly.

14 │ ASSESSMENT AND RECOMMENDATIONS
SOCIAL PROTECTION SYSTEM REVIEW OF INDONESIA © OECD 2019
Assessment and recommendations
Indonesia’s recovery from the Asian Financial Crisis and the economic, political and
social upheaval it caused has led to an impressive reduction in poverty and a significant
improvement in living standards. However, the growing prosperity has not been shared
by the entire population; inequality has risen strongly over the past two decades. The
Government of Indonesia (GoI) has recognised this uneven development as a key
constraint on its ambition to become one of the world’s ten largest economies and it has
placed social protection at the centre of its inclusive growth strategy.
The GoI is committed to establishing a social protection system that provides
comprehensive coverage for the entire population and achieves coherence and co-
ordination between the various institutions involved in social protection. Such a system
will be able to address a number of structural challenges, including a last-mile problem
confronting strategies to reduce poverty, extensive vulnerability among individuals who
have emerged from poverty but have not yet joined the middle class, and long-term
demographic change, particularly population ageing.
This report identifies mechanisms for strengthening the social protection system. It is
intended for social protection stakeholders both within Indonesia and outside. Amid
increasing global emphasis on establishing social protection systems, Indonesia’s policy
response to rising inequality, disparities in territorial development, demographic change
and information challenges can make a significant contribution to best practice in social
protection internationally.
Indonesia’s economic development has not benefited the entire population
Indonesia faces a last-mile problem. The national poverty rate fell from 24.2% in 1998 (at
the height of the Asian Financial Crisis) to 9.7% in 2018. However, the decline slowed
significantly after 2010. Meanwhile, inequality has increased: the Gini coefficient
increased from 0.30 points in 2004 to 0.41 points in 2014, one of the fastest increases in
the region. It started to decline in 2017, falling to 0.38 in September 2018.
Poverty is concentrated among children and the elderly, with women more likely to be
poor than men at almost all ages. The GoI classifies almost two-fifths of the population as
poor or vulnerable, although the proportion fell from 42.6% to 38.2% between 2011 and
2016. There has been considerable movement of individuals between income levels and
in and out of poverty over the past decade.
Poverty also has a clear spatial dimension. The five poorest provinces are in the east, and
their poverty rates in 2016 were, on average, 18 percentage points higher than the average
for the five least-poor provinces. Rural areas are significantly poorer than urban areas. In
order to address these disparities, a recent reform to the Village Funds has resulted in
villages across the entire country receiving a large increase in funding from the central
government and gaining significantly greater autonomy. Concerns as to the extent to
which the Village Funds are achieving sustainable declines in poverty have prompted the

ASSESSMENT AND RECOMMENDATIONS │ 15
SOCIAL PROTECTION SYSTEM REVIEW OF INDONESIA © OECD 2019
GoI both to revise the formula by which the size of the transfers to different villages is
determined and to emphasise the importance of the allocations being used to build basic
infrastructure and for the economic empowerment of disadvantaged groups.
Indonesians face a range of risks along the life cycle despite a marked improvement in
many human development indicators since 2000. Maternal and infant mortality have
fallen significantly, although they remain high by regional standards. However, stunting
remains a major problem: in 2013, 37.2% of children under age 5 suffered from stunting,
up from 36.8% in 2007. Enrolment in early childhood education and learning facilities
has improved but the majority of children still do not access these services.
Children from poor and vulnerable households are far less likely to benefit from
improvements in public services than their wealthier peers, meaning they are deprived
during a crucial period of cognitive and physical development. There are also major
regional disparities: only 40.4% of children Aceh and Papua under age 5 are fully
immunised, for example. The long-term consequences for inter-generational transmission
of poverty and the development of Indonesia’s human capital are grave, especially in a
context where the country’s demographics are becoming less favourable.
Indonesia has experienced a rapid demographic transition. Birth rates increased rapidly
following independence in 1945, resulting in a baby boom evident in the size of today’s
working-age population. With birth rates subsequently declining, Indonesia has benefited
from a demographic dividend, with a large economically active population supporting a
relatively small number of young or old dependants. Over the coming decades, today’s
working-age individuals will reach old age, resulting in a rapid ageing of the population.
From the mid 2020s onwards, the dependency ratio will begin a rapid ascent.
These trends require that Indonesia’s workforce becomes more productive. Education
reforms since 2000 have significantly improved access to education at all age groups and
financing for the sector is protected by a Constitutional requirement that it receive 20% of
the budget. However, the quality of education has seen less improvement. A reform in
2016 increasing the duration of compulsory education from 9 to 12 years will expand
access but it will also reduce the finances available per student for much-needed quality
improvements. Productivity is also a function of the health of the workforce, meaning the
public health system has an important role to play.
Some 23.2% of the youth (aged 15-24) were not in education, employment or training
(NEET) in 2016, a 6.4 percentage point decrease from 2008. The percentage of female
youth NEET is considerably higher than for males, although the gap appears to be
shrinking. This disparity between male and female labour outcomes persists across the
working age: average labour force participation rates for men and women between 2000
and 2015 were 79.7% and 47.1% respectively, and there has been little evidence of
convergence. The gender salary gap for full-time workers in 2014 exceeded 30%.
The national unemployment rate fell from 10.3% in 2006 to 5.3% in 2018. However,
some 30% of workers are under-employed and many workers confront long working
hours and low pay. Informal employment remains the norm for most workers, despite
declining: between 2006 and 2016, the rate of informal workers (defined by Statistics
Indonesia as own-account workers, temporary or casual employees and unpaid family
workers) fell from 68.9% to 57.6%. Informality and poverty are closely correlated.
Individuals in informal employment (and their families) are unlikely to be covered by
social protection, which in turn renders them more exposed to ill-health and other shocks.
The GoI is making a particular effort to expand contributory arrangements into the

16 │ ASSESSMENT AND RECOMMENDATIONS
SOCIAL PROTECTION SYSTEM REVIEW OF INDONESIA © OECD 2019
informal sector. Informal workers often find themselves in the “missing middle” of social
protection coverage, whereby they are ineligible for poverty-targeted social assistance but
excluded from employment-based contributory arrangements.
Indonesia’s elderly population is relatively small but it is the age group most prone to
poverty. In 2016, 14.7% of individuals over age 65 had incomes below the poverty line,
versus 14.9% in 2010. The prevalence of informality means that less than 10% of the
elderly receive a pension, with coverage among women especially low. As a
consequence, they rely on family for income support rather than public social protection
arrangements. Close to half the population aged 65 or over has some form of disability,
making it very hard for them to remain economically active and support themselves.
Indonesia’s demographic and societal changes are accompanied by an epidemiological
transition. Non-communicable diseases are becoming a more significant burden on health
than communicable diseases (although there has been a notable increase in the prevalence
of HIV/AIDS). The proportion of total deaths attributable to non-communicable diseases
rose from 63% in 2010 to 77% in 2014. The proportion of the population that is obese
more than doubled between 2007 and 2018, from 10.5% to 21.8% (Ministry of Health,
2018[1]). The high prevalence of smoking, especially among men, is also a major health
concern.
The costs and accessibility of healthcare have a major impact on individuals’ response to
ill health or injury. A majority of Indonesians suffering a health issue choose self-
treatment instead of visiting health facilities or medical professionals, although this trend
is decreasing: in 2014, 61% treated themselves, compared with 68.4% in 2009.
Around 8.6% of the population over the age of two have some type of disability and half
(48.5%) report multiple disabilities. Rates are higher for females than for males and for
rural residents than for urban residents. Individuals with disabilities face more risks and
vulnerabilities than the general population, and access to social protection is extremely
low, with about 1% of people with disabilities accessing the principal social assistance
mechanism covering this risk.
Looking ahead, Indonesia’s economic prospects are positive, although labour productivity
is a concern. The Fourth Industrial Revolution holds major potential for the Indonesian
economy but could also be a threat if the workforce lacks the skills to harness it. Social
protection will need to be part of the policy response as the GoI prepares for Industry 4.0.
Climate change is also likely to have adverse consequences for the economy and the
workforce over the longer term through its impact on the agricultural sector.
Social assistance has evolved rapidly and expanded recently
Indonesia’s recovery from the far-reaching economic, political and social consequences
of the Asian Financial Crisis of 1997-98 is an international success story. Although
recognised as a basic human right by Indonesia’s constitution, social protection was
poorly developed prior to the Crisis but emerged as an important part of the response and
has since played an ever-larger role in Indonesia’s development.
Three presidents have charted the evolution of social protection in Indonesia: Megawati
Sukarnoputri (2001-04), Susilo Bambang Yudhoyono (2004-14) and Joko Widodo (2014-
present). Their respective administrations took responsibility for scaling up social
assistance and for reforming social insurance, although the degree of continuity between
governments has varied.

ASSESSMENT AND RECOMMENDATIONS │ 17
SOCIAL PROTECTION SYSTEM REVIEW OF INDONESIA © OECD 2019
Social assistance reforms have not occurred in a particularly strategic manner. Each
administration has prioritised different programmes over others, experimenting with new
programmes and rejecting or reforming programmes based on their impact. The
development of social insurance has followed a more linear trajectory.
Over the past two decades, the GoI’s perception of social protection has evolved
relatively swiftly. Having fulfilled a traditional relief-response function in the wake of the
Asian Financial Crisis, it subsequently came to the fore as a mechanism for mitigating the
impact of reductions in energy subsidies. Nowadays, the GoI recognises its importance
from a longer-term developmental perspective. The National Medium-Term Development
Plan (RPJMN) for 2015-19 recognises social protection as being central to its objective of
reducing inequality between income groups and between regions to achieve stronger
economic growth and shared prosperity.
Social assistance consists of multiple programmes implemented by a number of different
line ministries, including the Ministry of Social Affairs (MoSA), the Ministry of
Education and Culture, the Ministry of Religious Affairs and the Ministry of Health. It
encompasses programmes covering a wide variety of risks, from conditional cash
transfers (CCTs) to food subsidies and student scholarships. However, eligibility for these
programmes is determined by a single mechanism: the Unified Database (UDB), which
has been developed since 2005 as a common targeting mechanism for social assistance.
The largest social assistance programmes are Rastra, which provides subsidised rice for
the poor; Programme Indonesia Pintar (PIP, Assistance for Poor Students) and Program
Keluarga Harapan (PKH). Rastra is being integrated with an electronic food voucher
system, Bantuan Pangan Non Tunai (BPNT). The GoI (through the Ministry of Health)
also fully subsidises the health insurance contributions of poor and vulnerable
households. Beneficiary households are known as Penerima Bayaran Iuran (PBI)
members of JKN.
This review analyses how these programmes differ significantly in terms of their
coverage, cost and impact. All the programmes succeed in reducing poverty but the
efficiency with which they do so varies widely. Rastra was accessed by 45% of the
population in 2016, demonstrating significant errors of inclusion that dilute the efficiency
with which it reduces poverty. PIP has scaled up significantly and currently covers
around 20 million beneficiaries; it is more efficient than Rastra in eliminating poverty but
there is still extensive leakage to the non-poor, which has been attributed to beneficiaries
being selected by schools or local government rather than with reference to the UDB.
PBI has also scaled up strongly in recent years, covering 92.4 million beneficiaries in
2018 (102 million if local schemes are included). Although PBI has been criticised for its
poor targeting performance (reflecting both errors of inclusion and exclusion) it is slightly
more efficient at reducing poverty than Rastra. However, supply-side barriers prevent the
programme from increasing access to health services among beneficiaries to the full
extent.
PKH is shown to be the most effective programme at reducing poverty and is scaling up
rapidly to cover more geographical areas and a larger portion of the poor population.
Coverage has increased to 10 million households in 2018, up from 6 million in 2016,
reflecting PKH’s effectiveness at reaching poor households. The benefit modalities are
currently being revised by the GoI with a view to increasing benefit values and re-
establishing variable benefit levels prior to a further expansion of coverage. The
programme has been shown to have not only a short-term impact in reducing poverty but

18 │ ASSESSMENT AND RECOMMENDATIONS
SOCIAL PROTECTION SYSTEM REVIEW OF INDONESIA © OECD 2019
also longer-term benefits in human capital development, notably a reduction in stunting
rates among beneficiaries.
An important point to bear in mind is that social assistance programmes are intended to
be complementary. With eligibility underpinned by the UDB, individuals who access one
programme should typically access the others, since each covers a particular risk.
However, significant progress is required in this regard: in 2014 (before UDB was as
widely used across social assistance programmes as it is today), less than 30% of families
in the poorest decile that were receiving PKH also benefited from PIP and Rastra and
were registered as PBI. This lack of coherence is a major constraint on the individual
programmes’ capacity to achieve lasting reductions in poverty and inequality.
Tax-financed active labour market policies are an important mechanism for promoting the
skills and productivity of poor and vulnerable workers. While such programmes exist in
Indonesia, they are not implemented at a significant scale, although infrastructure projects
financed by the Village Funds often employ poor and unemployed individuals, meaning
they share some features with public works programmes.
The most important labour-market policies are minimum wages and severance pay. Both
instruments are well established but risk being distortive. Severance pay is considered a
constraint to hiring and firing workers while minimum wages are high relative to the
median wage. Both instruments are poorly implemented: minimum wages often do not
hold and only a small minority of workers receive full severance pay when they lose their
jobs.
At present, Indonesia does not have an unemployment insurance arrangement. Combined
with the uneven functioning of severance pay, this not only leaves workers vulnerable to
a sharp reduction in welfare if they lose their job but also means that Indonesia lacks an
effective counter-cyclical social protection mechanism.
Indonesia is making rapid progress towards universal health coverage but pension
coverage remains low
In what has been described as a big bang approach to social insurance, two key pieces of
social insurance legislation were passed within the space of a decade. The first, in 2004,
created the policy framework for social insurance: the Sistem Jaminan Sosial Nasional
(SJSN; National Social Security System). The second, in 2011 created the institutional
framework by establishing the Badan Jaminan Sosial Nasional (BJPS; National Social
Security Administering Body).
BJPS Kesehatan (henceforth BPJS Health), which began operations in January 2014, took
effect was made responsible for Jaminan Kesehatan Nasional (JKN; Public Health
Insurance with the aim of achieving universal health coverage. BPJS Ketenagakerjaan
(henceforth BPJS Labour), which began operations in July 2015, is responsible for
employment-related social security. The SJSN reforms recognised a need to establish a
social insurance system with much greater coverage than previous arrangements had
achieved. BPJS Health has been much more effective than BPJS Labour in this regard.
Since July 2015, BPJS Labour has implemented all social security programmes for
employees and non-wage or informal workers. Before 2015, JAMSOSTEK administered
benefits for private sector workers. TASPEN remains the administrator of benefits for
civil servants while ASABRI administers those for armed forces personnel.

ASSESSMENT AND RECOMMENDATIONS │ 19
SOCIAL PROTECTION SYSTEM REVIEW OF INDONESIA © OECD 2019
A new pension programme, the Jaminan Pensiun (JP), has been introduced as part of a
broader reform of retirement arrangements. The JP is run on a defined benefit basis for
formal-sector workers, funded by a contribution rate of 3% of salary, with a retirement
age of 56 and a vesting period of 15 years. The retirement age and contribution rate will
both rise gradually, with the latter expected to reach 8% (although no clear timetable
exists). The JP is intended to sit alongside the existing provident fund (Jaminan Hari Tua,
JHT), to which workers in the formal and informal sector alike are expected to contribute.
Civil servants and other state employees are meant to transition to this new arrangement
by 2029.
Some 30 million workers were active members of BPJS Labour at the end of 2018.
Coverage outside formal enterprises remains very low. Efforts to attract informal workers
to enrol by offering low contribution rates are hampered by the stipulation that they must
also contribute to employment injury insurance. Some form of contribution subsidy might
be required to address this issue, and it is a concern that current social assistance
arrangements for the elderly are so small, leaving large groups of elderly (particularly
women) without any formal income support.
Low coverage levels of the JP might have implications for the long-term solvency of the
fund, as would a failure to increase the contribution rate or increase the retirement age.
Achieving a balance between these parameters will be critical. The integration of the
public sector is likely to be difficult if the programme is not well established and solvent.
BPJS Health has expanded coverage of JKN, the national health insurance system, at a
much faster rate. In 2011, the GoI targeted achieving universal health coverage (UHC) by
2019. As of October 2018, it covered 205.1 million individuals (78% of the population),
up from 111.6 million in January 2014. However, the effective usage of JKN enrolees is a
concern, with not all of them accessing the medical services to which they should be
entitled, a consequence of a range of supply- and demand-side barriers.
Its success has important lessons for BPJS Labour regarding contributions mechanisms.
A high proportion of those covered by JKN are subsidised by the GoI, partly or in-full
according to income. It also underlines a failure to co-ordinate between the two agencies,
such as that increased enrolment in JKN generates greater coverage of BPJS Labour.
There are two main categories of JKN enrolee: PBI and non-PBI (contributory). Non-PBI
members comprise various sub-categories, whose premiums reflect differing capacity to
contribute. These include workers in the informal sector, who can choose between three
different premium levels entitling them to different levels of service. A missing middle of
JKN coverage has been identified, with only 52% of individuals aged 20 to 35 years in
the middle-income groups enrolled.
Notwithstanding the overall progress towards UHC, high enrolment brings financial
challenges. The flexibility for informal workers to make irregular contributions is
resulting in individuals gaming the system by registering when they (or their household)
have a health problem. The majority of informal workers also opt for the lowest premium.
The overall effect has been to drive the claims ratio above 100%, which in turn is driving
a sharp increase in JKN’s deficit. Unless these structural issues are addressed, JKN risks
becoming an ever-larger strain on public finances as coverage grows.

20 │ ASSESSMENT AND RECOMMENDATIONS
SOCIAL PROTECTION SYSTEM REVIEW OF INDONESIA © OECD 2019
Social protection spending is constrained by low domestic resource mobilisation
Social assistance spending has risen significantly in absolute terms since 2012 but, at
0.7% of GDP in 2016, is low for a country at Indonesia’s income level. Low allocations
on social assistance reduce its capacity to reduce poverty and inequality, especially when
divided across a large number of institutions. This heightens the need to improve
coherence between programmes and improve targeting. Social insurance spending has
typically been larger than social assistance but the gap has shrunk significantly in recent
years. According to World Bank calculations, social insurance expenditure was
IDR 99.6 trillion in 2016, versus IDR 78.3 trillion on social assistance.
Total social protection spending was 1.4% of GDP in 2016, up from 1% of GDP in 2007.
However, it is notable that social protection spending was 15.4% of total central spending
in 2016, up from 10.7% in 2012, underlining that social protection is growing as a
budgetary priority. In 2019, increases in PKH benefits and PBI spending are expected to
be a major driver of overall public expenditure.
Indonesia’s Achilles Heel is its low level of domestic resource mobilisation. In 2016, the
tax-to-GDP ratio was 11.6%, one of the lowest in the region and a major constraint on the
country’s fiscal capacity, in particular its redistributive potential. Reductions in energy
subsidies have enabled an expansion of social assistance, although not all the fiscal space
created by these structural reforms has been absorbed by social assistance. Social
protection faces competition from a number of other priority areas of public spending,
including infrastructure; higher tax revenues are critical if social protection is to grow
significantly.
Efforts to increase social insurance coverage can ease the direct burden on public
finances. However, they must work in tandem with policies to increase tax revenues
through broader formalisation policies. If these function coherently, a virtuous circle is
achievable whereby a larger proportion of the population is formally employed and
contributing to social security arrangements at the same time as paying more in taxes,
with the consequence that workers’ livelihoods are protected and the government can
afford to spend more on tax-financed social protection for individuals who are unable to
work. Of course, taxes and social security contributions can also militate against
formalisation by increasing the cost of employment; careful policy design and
implementation is critical.
At the same time, it is important that higher taxation does not have an adverse impact on
the poor. Fiscal incidence analysis of the major direct transfer programmes in this report
indicates that the combined impact of taxes and transfers is to reduce income inequality
but increase poverty, although the impact on poverty is reversed when other social
spending is included, particularly subsidies and in-kind health and education benefits.
A systems approach is reducing fragmentation of social protection
Social protection is characterised by extensive fragmentation. Roles and responsibilities
are divided across various line ministries and administrative bodies, without one central
co-ordinating body. Indonesia has made progress towards developing the information
infrastructure to underpin a social protection system through the development of the
UDB, a single targeting mechanism for social assistance programmes. However, this is
not used by all stakeholders in the social protection system. To improve its targeting
performance and build greater confidence in the UDB, it is necessary to strengthen

ASSESSMENT AND RECOMMENDATIONS │ 21
SOCIAL PROTECTION SYSTEM REVIEW OF INDONESIA © OECD 2019
updating and verification mechanisms. Recent progress in developing single-window
services and on-demand application should be maintained to reduce exclusion errors.
Indonesia does not have an integrated management information system, although MoSA
is currently developing one for PKH. The absence of an MIS constrains the GoI’s
capacity to monitor and evaluate the functioning of social assistance programmes and to
ensure that beneficiaries are receiving all the benefits to which they are eligible. The rapid
scale-up of certain social protection programmes in recent years has magnified the
challenge of establishing and maintaining information systems.
Under the decentralised system of government, central and sub-national government in
Indonesia share responsibility for social protection provision. Sub-national governments
can implement their own social protection programmes, although few do. Co-ordination
in social protection provision across different levels of government is inadequate, and the
flows of information and resources between them uneven. As a result, national
programmes might not receive the buy-in they need from sub-national government and
the implementation of centrally-led reforms might differ from what was intended. This
makes it difficult to establish a national system of social protection and raises the
importance of the Ministry of Home Affairs as the link between national and sub-national
government.
Social workers, known as facilitators in Indonesia, have a critical role to play in the social
protection system. However, this role has in the past not been universally recognised and
there are shortcomings in the training social workers receive. Progress has been made
towards addressing these challenges but the potential of social workers to support the
implementation of a social protection system is under-utilised.
Ensuring that the 23 million children currently on the UDB access the full range of social
assistance programmes to which they are eligible is critical for improving their
developmental outcomes and reducing poverty. Merging PIP with PKH might reduce
gaps in coverage amongst this group while ensuring that a higher proportion of social
assistance expenditure reaches the intended beneficiaries. In so doing, it would enable
beneficiaries to graduate from PKH sooner.
As the population ages, demand for improved social protection for the elderly is likely to
intensify. In a context of slow increases in coverage of contributory social insurance
arrangements, particularly among women, a clear strategy for social assistance for the
elderly should be developed.
The policy response to ensuring higher pension coverage amongst the missing middle
might also include dual approaches to enrolling own-account workers and those in small
and medium-sized enterprises respectively. Increasing social insurance coverage (and
enhancing formalisation) will also require a broader restructuring of employment
legislation, in particular severance pay. At the same time, the policy response to
population ageing should extend beyond income replacement and consider the broader
welfare needs of elderly individuals.
The political context for social protection in Indonesia – and therefore for the reforms
proposed in this review – appears highly favourable. Strong political commitment at the
presidential level is reflected in policy frameworks, and this is likely to continue with the
RJPMN being developed for the period 2020-24. This lessens social protection’s
vulnerability to the electoral cycle.

22 │ ASSESSMENT AND RECOMMENDATIONS
SOCIAL PROTECTION SYSTEM REVIEW OF INDONESIA © OECD 2019
At the same time, there is strong commitment from the international community to
support the development of social protection in Indonesia. This is reflected by a recent
World Bank loan to support the development of systems that will underpin the scale-up of
PKH as well as by the many other institutions supporting Indonesia to develop the
architecture for a social protection system. Indonesia’s rapid progress towards UHC is
generating strong interest amongst donors and other developing countries, making
Indonesia a champion both in this area and in the global push towards universal social
protection.
Recommendations
Consolidate child grants and strengthen social assistance for the elderly to
address the last-mile problem (short-to-long term)
Complete the scaling-up of the PKH, ensuring that households covered by the
intervention belong to the target group.
Ensure PKH benefits keep pace with inflation to maintain purchasing power.
Integrate PIP with PKH to improve social assistance coverage amongst children
in the UDB.
Gradually scale up social assistance for the elderly.
Strengthen the information architecture for social protection (short-to-medium
term)
Continue to develop and co-ordinate mechanisms for updating and verification of
the UDB.
Institutionalise capacity within Ministry of Social Affairs to maintain the UDB in
collaboration with other institutions involved in its development.
Include vulnerable populations in disaster-prone regions within UDB to facilitate
adaptive social protection programmes and integration of social protection within
disaster risk management strategies.
Improve the reach of civil registration services to increase the proportion of
individuals (especially in remote areas) with identification documents and a
National Identity Number.
Consider the feasibility of using the MIS currently being developed for PKH to
cover other social assistance programmes.
Regularise and strengthen social services (short-to-medium term)
Implement the legislative framework for the provision of social services.
Identify staffing needs and the competencies required by social workers to deliver
social services across Indonesia.
Improve the employment conditions of social workers and enable them to work
across social programmes.
Prioritise provision of early childhood development infrastructure and services,
including family visits by social workers to PKH recipients.

ASSESSMENT AND RECOMMENDATIONS │ 23
SOCIAL PROTECTION SYSTEM REVIEW OF INDONESIA © OECD 2019
Strengthen social insurance coverage among the missing middle (short term)
Adopt a dual approach to improving social insurance coverage amongst
(respectively) employees and own-account workers in the informal sector.
Subsidise social security contributions of informal workers by covering the cost
of employment injury insurance.
Leverage JKN enrolment and awareness-raising to increase coverage by BPJS
Labour.
Revise contribution requirements to safeguard the financial sustainability of JKN
without undermining the quality of services.
Reconfigure labour market interventions to meet the needs of Indonesia today
(medium term)
Review severance pay arrangements while enforcing pension contributions,
especially among SMEs.
Consider establishing an unemployment insurance arrangement.
Invest in active labour market policies to promote productivity amongst
vulnerable workers.
Revise decentralisation for coherence between national and sub-national
government (medium term)
Led by the Ministry of Home Affairs, promote coherence between national and
sub-national government, for example by revising local minimum service
standards to support social assistance programme implementation.
Clarify and formalise financing responsibilities between national and sub-
national government for social assistance provision.
Strengthen engagement between MoSA and the Ministry of Villages,
Disadvantaged Regions and Transmigration to embed social protection objectives
and mechanisms within Village Fund projects.
Consolidate the institutional framework for social protection (medium term)
Establish or empower a single institution with oversight of all social protection.
Rationalise the number of ministries involved in social protection policy at
national level, with MoSA playing a lead role.
Leverage social protection to offset gender disparities (medium term)
Design specific active labour market policies for women not in education,
employment or training.
Consider incorporating care credits within the pension system.
Consider including an earlier eligibility age for women in social assistance
programmes for the elderly.


CHAPTER 1. A FORWARD-LOOKING ASSESSMENT OF SOCIAL PROTECTION NEEDS │ 25
SOCIAL PROTECTION SYSTEM REVIEW OF INDONESIA © OECD 2019
Chapter 1. A forward-looking assessment of social protection needs
Thanks to a prolonged period of robust economic growth, combined with political and
social stability, Indonesia has achieved a dramatic reduction in poverty and major
improvements in living standards for the majority of its population over the past two
decades. However, there remain structural barriers to the inclusive growth that the
government has identified as key to its economic ambitions and sustained social cohesion
– barriers that social protection can overcome. This chapter examines the context for
social protection, assessing the trajectories of poverty and inequality and analysing the
risks individuals face along the life cycle, including pervasive informality. Finally, it
maps the threats and opportunities that lie in store for Indonesia, its population and its
economy in the future.

26 │ CHAPTER 1. A FORWARD-LOOKING ASSESSMENT OF SOCIAL PROTECTION NEEDS
SOCIAL PROTECTION SYSTEM REVIEW OF INDONESIA © OECD 2019
Indonesia has achieved great political and economic progress since the watershed of the
Asian Financial Crisis in 1997-98. Having achieved average annual growth in gross
domestic product (GDP) of 5.3% since 2000, it has set its sights on becoming an upper
middle income country and one the world’s top ten economies by 2030 (Ministry of
Industry, n.d.[1]).
However, Indonesia’s ambitions face significant obstacles which, if not addressed,
threaten to leave it in a middle-income trap (World Bank, 2014[2]). Chief among these is
the failure of Indonesia’s economic development to benefit the whole population, leaving
large groups in poverty and vulnerability, without the skills or opportunities to contribute
to economic progress.
Achieving more inclusive growth is critical for ensuring that prosperity is shared, yet
Indonesia represents an extraordinary challenge to this objective. It is the world’s fourth
most populous country, with a population approaching 270 million in 2018, and consists
of 17 000 islands. An estimated 700 languages are spoken by some 300 ethnic groups.
The Government of Indonesia (GoI) has placed social protection at the heart of its
inclusive growth strategy. As such, social protection holds the key to Indonesia’s
economic future if it can address unevenness in the country’s growth trajectory identified
in this chapter.
Indonesia confronts a last-mile problem in reducing poverty
Indonesia’s robust economic performance over the past two decades has driven
significant progress in reducing poverty. However, the decline in poverty stalled after
2010, with a large proportion of the population remaining poor or vulnerable. At the same
time, inequality has risen. This section examines the dynamics and determinants of
poverty and vulnerability, at both an aggregate and individual level.
Figure 1.1. The decline in national poverty has slowed
Poverty headcount ratios (2001-18)
Source: Statistics Indonesia (2019[3]), Poverty and Inequality: Basic Statistics,
bps.go.id/subject/23/kemiskinan-dan-ketimpangan.html#subjekViewTab3; Statistics Indonesia (2016[4]),
SUSENAS, microdata.bps.go.id/mikrodata/index.php/catalog/769; World Bank (2018[5]), World Development
Indicators, data.worldbank.org/products/wdi.
0
5
10
15
20
25
30
35
40
2001 2002 2003 2004 2005 2006 2007 2008 2009 2010 2011 2012 2013 2014 2015 2016 2017 2018
% of population
National poverty line International USD 1.90/day

CHAPTER 1. A FORWARD-LOOKING ASSESSMENT OF SOCIAL PROTECTION NEEDS │ 27
SOCIAL PROTECTION SYSTEM REVIEW OF INDONESIA © OECD 2019
Indonesia’s national poverty rate fell from 24.2% in 1998 (at the height of the Asian
Financial Crisis) to 9.66% in 2018 (Statistics Indonesia, 2019[3]). However, the decline
has slowed significantly since 2010 and bringing the poverty rate below 10% has taken
longer than expected despite robust economic growth over this period. The National
Medium Term Development Plans (Rencana Pembangunan Jangka Menengah Nasional,
RPJMN) for the period 2004-09 envisaged the national poverty rate falling to 8.2% and
its successor for 2010-14 targeted a decline to 8% (BAPPENAS, 2014[6]).
In a context where economic growth alone has proven unable to eliminate poverty, the
GoI recognises social protection as a direct means of reducing poverty, preventing
vulnerable households from falling into poverty and reducing inequality both in the short
term (though fiscal redistribution) and the long term (by ensuring equality of opportunity
for younger generations through access to mechanisms for enhancing human capital).
Box 1.1. National and international poverty measures and terms used in this Review
Monetary or income poverty: Poverty status based on either household consumption or
household income as a welfare metric. The national statistical office, Badan Pusat
Statistik (BPS) of the Government of Indonesia (GoI), has defined poverty as the
“economic inability to fulfil basic food and non-food needs measured by expenditure”
(Statistics Indonesia, 2018[7]).
National (monetary) poverty line (national; GoI): the minimum amount needed
to afford a specific basket of food and non-food basic needs, defined by the food
poverty line and the non-food poverty line, respectively. BPS calculates the
poverty line twice a year (in March and September), as well as separately for
urban and rural areas. Data from the Consumption and Expenditure Module of the
nationally representative socio-economic survey, the Survei Sosial Ekonomi
Nasional (SUSENAS), are used to assess average expenditure and the appropriate
consumption threshold for poverty. In September 2016, the rural poverty line was
set at IDR 350 420 per month per capita (USD 27.00 [United States dollars] in
current prices), and the urban poverty line at IDR 372 114 per month per capita
(USD 28.86 in current prices). In September 2018, the rural poverty line was set
at IDR 392 154 per month per capita (USD 27.15 in current prices), and the urban
poverty line at IDR 425 770 per month per capita (USD 29.48 in current prices).
BPS also calculates provincial poverty lines.
Extreme poverty line (national): This threshold is set at 0.8 times the poverty
line.
Vulnerability line (national): The vulnerability line is equal to 1.5 times the
national poverty line.
Food poverty line (national; GoI): The food poverty line is set at the amount
necessary to afford a basket of food equivalent to 2 100 kilocalories per capita per
day. The food basket comprises 52 types of commodities (grains, tubers, fish,
meat, eggs and milk, vegetables, nuts, fruits, oils and fats, etc.). The September
2016 national monthly food poverty line was equivalent to about USD 20 per
capita in both urban and rural areas (current USD). The September 2018 national
monthly food poverty line was equivalent to about USD 21 per capita in both
urban and rural areas (current USD).

28 │ CHAPTER 1. A FORWARD-LOOKING ASSESSMENT OF SOCIAL PROTECTION NEEDS
SOCIAL PROTECTION SYSTEM REVIEW OF INDONESIA © OECD 2019
Global poverty lines (international): Poverty lines defined by the World Bank
based on the 15 poorest countries in 2005. The International USD 1.90 per day
per capita poverty line currently acts as the baseline for action on Sustainable
Development Goal (SDG) 1, to end poverty in all its forms everywhere. As of
September 2015, the Intl. USD 3.10 lower and middle-income poverty line and
Intl. USD 5.20 upper and middle-income poverty line have been updated to reflect
changes in inflation and purchasing power parity (PPP), and are now set at
Intl. USD 3.20 and Intl. USD 5.50 per day per capita, respectively. The
Intl. USD 1.90 lower income poverty line remains unchanged.
Poverty rate (GoI): The proportion of the population that lives below a specified
poverty line. Based on the 2016 SUSENAS, the national poverty rate in
September 2016 was measured at 10.70%. In September 2018, BPS estimated the
national poverty rate at 9.66%.
Poverty gap: How far (on average) poor households are below the poverty line,
expressed as a percentage of the level at which the poverty line is set.
Multi-dimensional or non-income poverty: Poverty status based on deprivations of a
household in areas beyond monetary poverty.
The Oxford Poverty and Human Development Initiative (OPHI)
Multidimensional Poverty Index (MPI) covers three areas: education, health
and standard of living through ten indicators: years of schooling, school
attendance, child mortality, nutrition, electricity, sanitation, access to or
cleanliness of water, conditions of the floor of their shelter, type of cooking fuel
used, and assets. The indicators are weighted to create a deprivation score: a score
of 33.3% indicates multi-dimensional poverty, a score of 50% or more indicates
severe multi-dimensional poverty, and a score between 20-33.3% indicates near
multi-dimensional poverty.
The United Nations Development Programme (UNDP) Human Development
Index (HDI) covers three areas: health, education and standard of living. It is a
summary measure based on the geometric mean of normalised indices for each
dimension (life expectancy at birth, average and expected years of schooling and
gross national income per capita).
The poverty rate calculated according to the World Bank’s International USD 1.90/day
poverty line [International United States dollar]) has fallen consistently since 2006,
dropping to 8.3% in 2014. This implies the national poverty line is set higher than the
World Bank’s extreme poverty line. The poverty gap followed similar trends, declining
from 3.0% in 2007 to 1.8% in 2017. The latter figure is only slightly down from 1.9%
in 2012. Indeed, the poverty gap increased in rural areas between 2012 and 2017, while it
decreased in urban areas (Figure 1.2).

CHAPTER 1. A FORWARD-LOOKING ASSESSMENT OF SOCIAL PROTECTION NEEDS │ 29
SOCIAL PROTECTION SYSTEM REVIEW OF INDONESIA © OECD 2019
Figure 1.2. Poverty fell in rural and urban areas in 2018
Urban, rural and national poverty rates (2007, 2012, 2017, 2018)
Source: Statistics Indonesia (2019[3]), Poverty and Inequality: Basic Statistics,
bps.go.id/subject/23/kemiskinan-dan-ketimpangan.html#subjekViewTab3.
Box 1.2. The poor population is relatively homogenous
Organisation for Economic Co-operation and Development (OECD) experts conducted a
Latent Class Analysis (LCA) for this report, based on the 2016 Survei Sosial Ekonomi
Nasional (SUSENAS; National Socio-Economic Survey), to understand better the profile
of poor households (Statistics Indonesia, 2016[4]). This technique clusters poor
households based on several characteristics, including household composition (presence
of children or the elderly), employment status of the household head (in particular,
informal employment) and extreme poverty (based on the food poverty line). Additional
characteristics are then evaluated across groups, including more detailed household
composition, household head gender and age, and household location. Chapter 3
discusses receipt of social protection benefits.
Figure 1.3 displays household clusters according to socio-economic and demographic
composition. There is notable homogeneity among clusters, which (in theory) makes it
easier to design social protection policies to alleviate poverty. The two largest clusters, 1
and 2, account for 68% of the poor population and have very similar characteristics, with
the exception that households in cluster 2 are slightly larger, and a significantly higher
proportion of them fall under the food poverty line (40% vs. 25% in cluster 1). As discussed
in Chapter 5, these two clusters also differ according to their access to social protection.
The presence of children in a household is a common feature across poor households.
Households in all clusters except cluster 4 contain children under age 16, with the number
of children under age 5 particularly high in clusters 1, 2 and 3. These clusters represent
large households without elderly individuals (defined as over age 60) in which the
dependency ratio between children and working-age individuals is about 1. Cluster 3
households differ due to the formal employment of household heads vs. their informal
employment in clusters 1 and 2.
0.0
0.2
0.4
0.6
0.8
1.0
1.2
Urban Rural National
% of population
2007 2012 2017 2018

30 │ CHAPTER 1. A FORWARD-LOOKING ASSESSMENT OF SOCIAL PROTECTION NEEDS
SOCIAL PROTECTION SYSTEM REVIEW OF INDONESIA © OECD 2019
Households in cluster 4 tend to be the smallest (2.8 individuals on average) and typically
lack children. The household head is often elderly, one-third of them lack working-age
individuals, and some 20% of household heads are female, who often show low
educational attainment relative to household heads in other clusters.
Households in cluster 5 typically contain both elderly members and children. As a result,
they have the highest dependency ratio: 44% have a ratio of two dependants to one
working-age individual.
Figure 1.3. Indonesia’s poor population is relatively homogenous
LCA clusters for Indonesia’s poor population (2016)
Note: DR = dependency ratio. Extreme poor = food poor. Informal/formal HHH = Informally/formally
employed household head. U5 = Under age 5.
Source: Statistics Indonesia (2016[4]), SUSENAS,
https://microdata.bps.go.id/mikrodata/index.php/catalog/769.
A large proportion of the population is vulnerable to falling into poverty in the event of a
household-level or macroeconomic shock (Figure 1.4). Between 2011 and 2016, the
proportion of the population with an income between the poverty line and 1.2 times the
poverty line (classified as near poor) fluctuated within a narrow band, averaging 10.9%.
The proportion with incomes between 1.2 times and 1.6 times the poverty line (the
vulnerable poor) also fluctuated over this period, averaging 18.9%. Overall, the
proportion classified as poor or vulnerable fell from 42.6% to 38.2% between 2011 and
2016.
Cluster 1: Just under two young children, no elderly, working age, informally employed heads of household, 25% extremely poor
Cluster 2:Two young children or more on average, no elderly, working age, large households, informally employed heads of household, 40% extremely poor
Cluster 3:Two young children on average, no elderly, working age, formallyemployed heads of household, 50% urban
Cluster 4:Elderly, no 15-64 year-olds present, no education, 25% female, small household size
Cluster 5:Highest dependency ratios, have children and elderly

CHAPTER 1. A FORWARD-LOOKING ASSESSMENT OF SOCIAL PROTECTION NEEDS │ 31
SOCIAL PROTECTION SYSTEM REVIEW OF INDONESIA © OECD 2019
Figure 1.4. Around 40% of the population is poor or vulnerable
Disaggregation of the population by poverty status (2011-16)
Source: Statistics Indonesia (2016[4]), SUSENAS,
https://microdata.bps.go.id/mikrodata/index.php/catalog/769.
Poverty status in Indonesia is dynamic. Although large numbers of individuals have
emerged from poverty, a smaller (but still significant) number have moved in the other
direction. According to data from the Indonesia Family Life Survey (IFLS), shown in
Figure 1.5, 75.8% of the population that was poor in 2007 had emerged from poverty
by 2014. Meanwhile 63.7% of the population with an income between the poverty line
and 1.5 times the poverty line (the definition of vulnerable typically used by the Social
Protection System Review) were neither poor nor vulnerable by 2014 (OECD, 2018[8]).
However, 4.8% of individuals who were neither poor nor vulnerable fell below the
poverty line in 2014, while 12.9% of those classified as vulnerable did likewise.
While poverty has fallen over the past two decades, inequality has risen. The Gini
coefficient increased from 0.30 points in 2004 to 0.41 points in 2014, one of the fastest
increases in the region. Estimates based on the 2016 SUSENAS put the Gini coefficient at
0.39 nationally, up slightly from 2010 but down from 2013. Inequality is higher in urban
than in rural areas (Figure 1.6).
Inequality has been on a downwards trajectory since 2017. According to the BPS, the
national Gini coefficient was 0.384 in September 2018, just below the GoI’s target for the
year, of 0.385. BPS publishes inequality data twice a year, at the same as it publishes
poverty data.
0
10
20
30
40
50
60
70
80
90
100
2011 2012 2013 2014 2015 2016
% of population
Very poor Poor Near poor Vulnerable poor Non-poor

32 │ CHAPTER 1. A FORWARD-LOOKING ASSESSMENT OF SOCIAL PROTECTION NEEDS
SOCIAL PROTECTION SYSTEM REVIEW OF INDONESIA © OECD 2019
Figure 1.5. Many individuals have emerged from poverty but some are becoming poor
Transitions in and out of poverty between 2007 and 2014
Source: RAND Institute (2007[9]; 2015[10]), Indonesian Family Life Survey, www.rand.org/well-being/social-
and-behavioral-policy/data/FLS/IFLS.html.
Figure 1.6. Urban inequality is higher than rural
Urban, rural and national Gini coefficients (2010, 2013, 2016, 2018)
Source: Statistics Indonesia (2016[4]), SUSENAS,
https://microdata.bps.go.id/mikrodata/index.php/catalog/769.
0.00
0.05
0.10
0.15
0.20
0.25
0.30
0.35
0.40
0.45
0.50
2010 2013 2016 2018
Gini index
Urban Rural National

CHAPTER 1. A FORWARD-LOOKING ASSESSMENT OF SOCIAL PROTECTION NEEDS │ 33
SOCIAL PROTECTION SYSTEM REVIEW OF INDONESIA © OECD 2019
Growth incidence curves show that the poor have not benefited as much as other income
groups from the growth of the economy since 2010 (Figure 1.7). Economic growth
between 2010 and 2013 primarily benefited households in the top quintile. The lowest
decile also benefited more than average, but this was associated with the weakest
consumption increases for households in the third to the seventh deciles. This trend was
reversed in 2013-16: consumption increased by the lowest amount for the bottom and top
three deciles. Individuals in the middle of the income distribution benefited more than
other groups (TNP2K, 2018[11]).
The middle of the income distribution is not analogous to a middle class. According to
the World Bank, Indonesia’s middle class has grown significantly, from 7% of the
population in 2002 to 20% in 2016, but this is still low by regional standards. Indonesia’s
National Team for the Acceleration of Poverty Reduction (Tim Nasional Percepatan
Penanggulangan Kemiskinan, TNP2K) has calculated the middle class to be smaller still,
with only the top 13.6% of the income distribution qualifying as secure middle class and
rich in 2017 (TNP2K, 2018[11]). Expanding the middle class is critical to the country’s
long-term prosperity, both as a driver of consumption growth and by expanding the tax
base, thereby improving low levels of domestic resource mobilisation (World Bank,
2018[12]).
Figure 1.7. Recent growth has benefited individuals in the middle of the income distribution
Growth incidence curves (2010-13, 2013-16)
Source: Statistics Indonesia (2016[4]), SUSENAS,
https://microdata.bps.go.id/mikrodata/index.php/catalog/769.
Broader measures of deprivation, or multi-dimensional poverty, affect a higher proportion
of Indonesia’s population than monetary poverty, indicating gaps in provision of basic
services such as health, education and infrastructure. According to Oxford Policy and
Human Development Initiative’s Multidimensional Poverty Index (MPI), the multi-
dimensional poverty rate fell from 20.8% in 2007 to 15.5% in 2012. However, the
intensity of deprivation remained high over this period (Figure 1.8).
0
10
20
30
40
50
60
70
80
1 4 7 10 13 16 19 22 25 28 31 34 37 40 43 46 49 52 55 58 61 64 67 70 73 76 79 82 85 88 91 94 97 100
%
Percentile
2010-13 2013-16
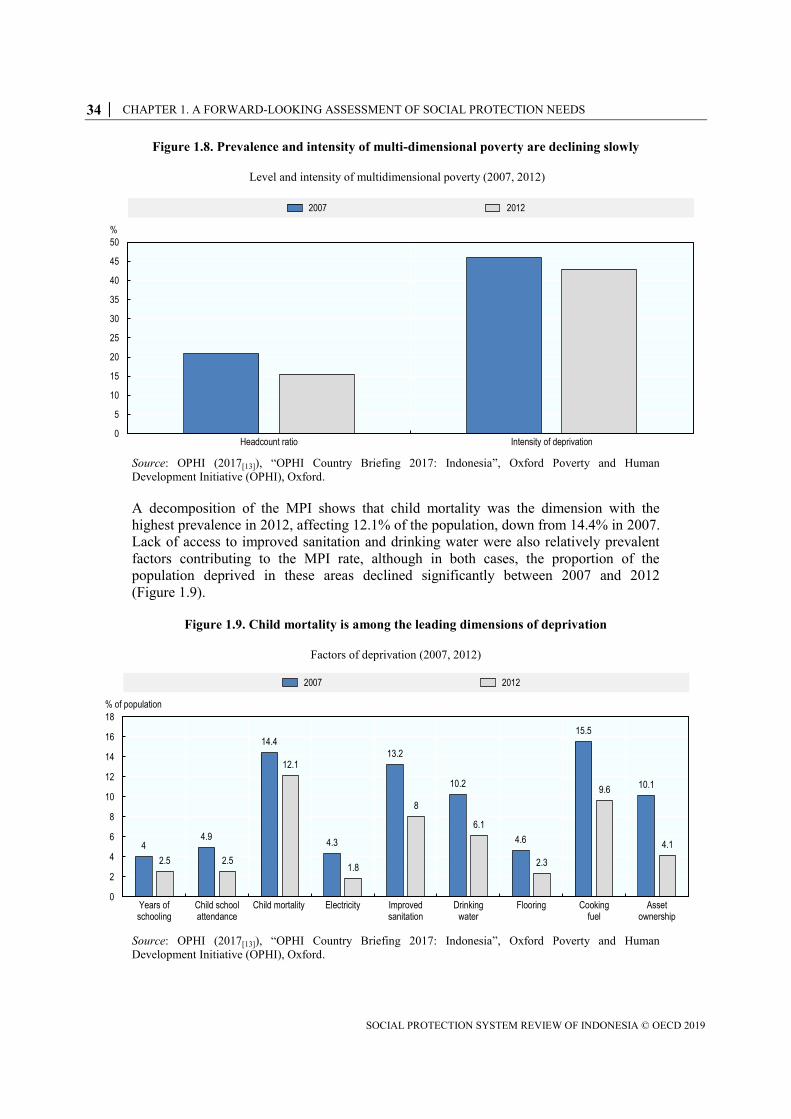
34 │ CHAPTER 1. A FORWARD-LOOKING ASSESSMENT OF SOCIAL PROTECTION NEEDS
SOCIAL PROTECTION SYSTEM REVIEW OF INDONESIA © OECD 2019
Figure 1.8. Prevalence and intensity of multi-dimensional poverty are declining slowly
Level and intensity of multidimensional poverty (2007, 2012)
Source: OPHI (2017[13]), “OPHI Country Briefing 2017: Indonesia”, Oxford Poverty and Human
Development Initiative (OPHI), Oxford.
A decomposition of the MPI shows that child mortality was the dimension with the
highest prevalence in 2012, affecting 12.1% of the population, down from 14.4% in 2007.
Lack of access to improved sanitation and drinking water were also relatively prevalent
factors contributing to the MPI rate, although in both cases, the proportion of the
population deprived in these areas declined significantly between 2007 and 2012
(Figure 1.9).
Figure 1.9. Child mortality is among the leading dimensions of deprivation
Factors of deprivation (2007, 2012)
Source: OPHI (2017[13]), “OPHI Country Briefing 2017: Indonesia”, Oxford Poverty and Human
Development Initiative (OPHI), Oxford.
0
5
10
15
20
25
30
35
40
45
50
Headcount ratio Intensity of deprivation
%
2007 2012
44.9
14.4
4.3
13.2
10.2
4.6
15.5
10.1
2.5 2.5
12.1
1.8
8
6.1
2.3
9.6
4.1
0
2
4
6
8
10
12
14
16
18
Years ofschooling
Child schoolattendance
Child mortality Electricity Improvedsanitation
Drinkingwater
Flooring Cookingfuel
Assetownership
% of population
2007 2012

CHAPTER 1. A FORWARD-LOOKING ASSESSMENT OF SOCIAL PROTECTION NEEDS │ 35
SOCIAL PROTECTION SYSTEM REVIEW OF INDONESIA © OECD 2019
Indonesia’s score on the Human Development Index (HDI) has increased steadily in recent
decades (up 30.5% from 1990 to 0.689 in 2015). Life expectancy at birth rose from
63.3 years in 1990 to 69.1 years in 2015, while mean years of schooling more than doubled,
from 3.3 years to 7.9 years, and gross national income per capita increased by 135.4% to
USD 10 053. Yet, its 2015 score was below the East Asia and the Pacific average, placing
Indonesia 113th out of 188 countries and territories included (UNDP, 2016[14]).
Regional differences
There is a strong spatial dimension to poverty and inequality in Indonesia. Differences
exist both between urban and rural areas and between different regions; the east of the
country is significantly more deprived than other areas. This phenomenon has prompted
successive administrations to adopt a dual approach to poverty reduction that combines
social protection with efforts to stimulate local economic development through
community infrastructure initiatives financed by large-scale fiscal transfers.
In 2007, the official poverty headcount ratio in urban areas was 12.5%, compared with
20.4% in rural areas. By 2016, the poverty headcount had fallen to 7.7% in urban areas and
14.0% in rural areas. As a consequence of sustained and rapid urbanisation, the urban
population exceeded the rural population in 2011, having accounted for just 30.5% in 1990.
As a result, rural poverty’s weight on the national poverty rate is declining and will
continue to do so: two-thirds of the population is expected to live in urban areas by 2050.
Poverty rates in eastern provinces are typically much higher than those in western or
central areas, although these areas are also much less populated, which limits their
weighting in national poverty figures. The five poorest provinces are in the east, and their
poverty rates in 2018 were, on average, 18 percentage points higher than the average for
the five least-poor provinces (Figure 1.10). The gap between Jakarta and Papua (the least-
poor and poorest provinces) in 2018 was close to 25 percentage points.
Figure 1.10. Poverty rates vary greatly by province
Poverty rates in the poorest and least-poor provinces (2007, 2010, 2013, 2018)
Note: DKI = Daerah Khusus Ibukota.
Source: Statistics Indonesia (2016[4]), SUSENAS,
https://microdata.bps.go.id/mikrodata/index.php/catalog/769.
0
5
10
15
20
25
30
35
40
45
DKI Jakarta Banten Bali CentralKalimantan
SouthKalimantan
East NusaTenggara
Gorontalo Maluku West Papua Papua
Poverty headcount ratio, %
2007 2010 2013 2018
36 │ CHAPTER 1. A FORWARD-LOOKING ASSESSMENT OF SOCIAL PROTECTION NEEDS
SOCIAL PROTECTION SYSTEM REVIEW OF INDONESIA © OECD 2019
A 2014 reform to increase the autonomy and the resources available for villages’
economic and social development is a critical component of the GoI’s current efforts to
address regional disparities (Box 1.3). The so-called Village Funds represent an important
mechanism for reducing poverty that is not considered as social protection but which
nonetheless has numerous potential overlaps with social protection.
Box 1.3. Reaching marginalised areas and people through the Village Funds
In 2014, the GoI enacted a new Village Law (Law No. 6/2014), which
significantly increased the autonomy and financial resources of Indonesia’s
74 091 villages. This reform of the country’s decentralised system of governance
is intended to promote economic development in areas that have so far not
benefited from Indonesia’s economic growth to the same extent and to promote
the inclusion of marginalised individuals and groups. The reform therefore tackles
inequality at regional and individual levels.
Some 89% of Village Funds expenditure was allocated to infrastructure
development in 2015, the first year of operation. Around 6% of spending was
allocated to building construction and 2.5% to capacity building and
empowerment, respectively. Lack of infrastructure in many rural areas is a key
constraint on communities’ livelihoods and welfare. Infrastructure was a priority
of existing village development plans, which, to a large extent, drove allocation of
the funds in the early years. There is an emphasis on road construction, but
projects to improve drainage and sanitation have also been implemented.
The full economic impact of the Village Funds will take time to emerge as new
and better roads gradually enhance villages’ access to markets and other
opportunities. The evaluation shows that villages are as keen to generate non-
agricultural activities as they are to boost the productivity of local farmers; funds
are invested in village-owned enterprises, and individuals (especially women) are
provided with training in a range of skills considered valuable to the local
economy.
At present, the direct economic benefits – largely in the form of participant wages
and purchase of building materials – tend to stay in the villages, but the meso-
level benefits associated with greater connection among villages could be
significant. As these emerge, it will be important that national infrastructure, rural
development and labour policies are cognisant of, and aligned with, the impact of
Village Funds (Gama, Saget and Elsheikhi, 2018[15]).
The GoI is currently undertaking efforts to ensure Village Funds benefit the
poorest individuals. At a national level, it has revised the formula by which
resources are allocated to ensure that the least developed villages receive
proportionally greater funding. At the same time, it is pushing projects to
rebalance towards building basic infrastructure and economic empowerment of
disadvantaged groups.

CHAPTER 1. A FORWARD-LOOKING ASSESSMENT OF SOCIAL PROTECTION NEEDS │ 37
SOCIAL PROTECTION SYSTEM REVIEW OF INDONESIA © OECD 2019
Women, children and the elderly are most exposed to risks across the life cycle
Indonesians face clear risks at different points in the lifecycle and are especially
vulnerable in early childhood and old age. Women are poorer at almost all ages than men
and the disadvantages they face relative to men are compounded over the course of the
lifecycle. For the majority of Indonesia’s working-age population, informal employment
is a critical source of income but is also associated with heightened poverty and
vulnerability.
This section analyses the different risks confronting different age groups with a view to
understanding where greatest demand for different types of social protection intervention
might be required. It starts by examining the age structure of Indonesia’s population and
how this is expected to change over the 21st Century, thereby providing insights into
future dynamics of demand for social protection,
Age profile
Poverty in Indonesia has a clear age profile (Figure 1.11). Poverty rates are highest
amongst children (especially the very young) and amongst the elderly. Although poverty
rates declined across all age groups between 2010 and 2016, the decline was negligible
for individuals aged over 65, an age group which currently has little access either to
social assistance or social insurance. Recent analysis by TNP2K demonstrates that
poverty is higher amongst women than men at nearly every age (TNP2K, 2018[11]).
Figure 1.11. Poverty is concentrated among children and the elderly
Poverty by five-year age cohort, 2010 and 2016
Source: Statistics Indonesia (2016[4]; 2010[16]), Survei Sosial Ekonomi Nasional (SUSENAS),
https://microdata.bps.go.id/mikrodata/index.php/catalog/769.
Indonesia experienced a rapid demographic transition in the last 65 years (Figure 1.12).
Birth rates increased rapidly following independence in 1945, resulting in a baby boom
evident in the size of today’s working-age population. Birth rates have since declined,
associated in part with a successful birth control programme introduced in the 1970s. The
total fertility rate declined from 5.7 children per woman in the early 1960s to 2.4 in 2015.
Mortality more than halved over the same period.
0
2
4
6
8
10
12
14
16
18
20
0-4 5-9 10-14 15-19 20-24 25-29 30-34 35-39 40-44 45-49 50-54 55-59 60-64 65+
Poverty headcount, %
Age group

38 │ CHAPTER 1. A FORWARD-LOOKING ASSESSMENT OF SOCIAL PROTECTION NEEDS
SOCIAL PROTECTION SYSTEM REVIEW OF INDONESIA © OECD 2019
Figure 1.12. Indonesia has made a rapid demographic transition
Population growth and rate of birth and deaths in Indonesia (1950-2015)
Source: UNDESA (2017[17]), World Population Prospects: The 2017 Revision,
un.org/en/development/desa/population/publications.
The large size of the working-age population and the declining fertility rate are driving a
decline in Indonesia’s dependency ratio, which measures the number of children up to
age 15 and adults over age 65 as a proportion of the population between these ages.
Elsewhere in Asia, declines in the dependency ratio have been a key driver of economic
growth (Bloom and Williamson, 1998[18]).
Indonesia’s dependency ratio declined from 67.3 to 49.2 between 1990 and 2015 and is
projected to keep falling until it reaches 46.4 in 2030 (UNDESA, 2017[17]). However,
even at the present time, the ageing of the baby boom generation is causing a rapid
increase in the old-age dependency ratio. From 2030, this will offset a continued decline
in the child dependency ratio to reverse the decline in the total dependency ratio.
The child dependency ratio was 41.6 in 2015 and is projected to decline to 29.2 by 2055.
By contrast, the old-age dependency ratio was 7.6 in 2015 and will nearly triple to 22.4
by 2055. As the population ages, the proportion age 24 or under will fall, from 45% in
2015 to 33% in 2055 (Figure 1.13). In 2015, 20% of the population was younger than age
10, a proportion projected to fall to 12% in 2055.
0
50
100
150
200
250
0
5
10
15
20
25
30
35
40
45
50
1950 1975 1995 2015
Total population, millionBirth and death rate
per 1 000 people
Crude birth rate Crude death rate Population
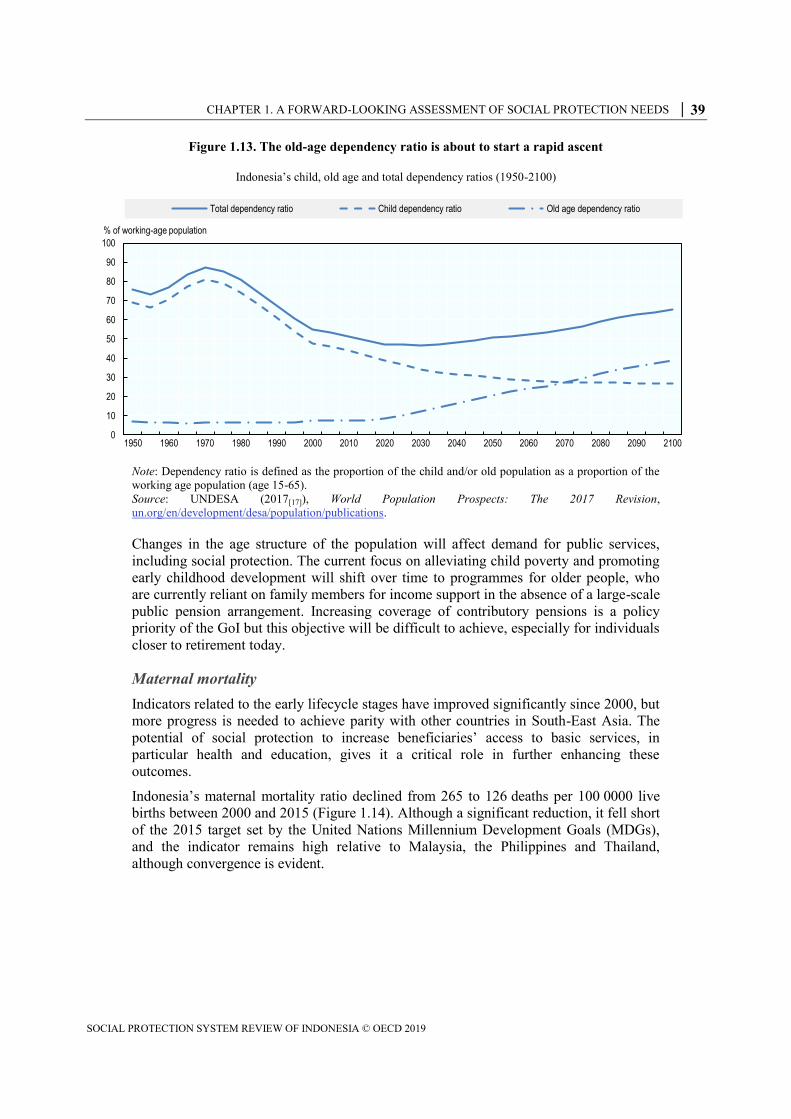
CHAPTER 1. A FORWARD-LOOKING ASSESSMENT OF SOCIAL PROTECTION NEEDS │ 39
SOCIAL PROTECTION SYSTEM REVIEW OF INDONESIA © OECD 2019
Figure 1.13. The old-age dependency ratio is about to start a rapid ascent
Indonesia’s child, old age and total dependency ratios (1950-2100)
Note: Dependency ratio is defined as the proportion of the child and/or old population as a proportion of the
working age population (age 15-65).
Source: UNDESA (2017[17]), World Population Prospects: The 2017 Revision,
un.org/en/development/desa/population/publications.
Changes in the age structure of the population will affect demand for public services,
including social protection. The current focus on alleviating child poverty and promoting
early childhood development will shift over time to programmes for older people, who
are currently reliant on family members for income support in the absence of a large-scale
public pension arrangement. Increasing coverage of contributory pensions is a policy
priority of the GoI but this objective will be difficult to achieve, especially for individuals
closer to retirement today.
Maternal mortality
Indicators related to the early lifecycle stages have improved significantly since 2000, but
more progress is needed to achieve parity with other countries in South-East Asia. The
potential of social protection to increase beneficiaries’ access to basic services, in
particular health and education, gives it a critical role in further enhancing these
outcomes.
Indonesia’s maternal mortality ratio declined from 265 to 126 deaths per 100 0000 live
births between 2000 and 2015 (Figure 1.14). Although a significant reduction, it fell short
of the 2015 target set by the United Nations Millennium Development Goals (MDGs),
and the indicator remains high relative to Malaysia, the Philippines and Thailand,
although convergence is evident.
0
10
20
30
40
50
60
70
80
90
100
1950 1960 1970 1980 1990 2000 2010 2020 2030 2040 2050 2060 2070 2080 2090 2100
% of working-age population
Total dependency ratio Child dependency ratio Old age dependency ratio

40 │ CHAPTER 1. A FORWARD-LOOKING ASSESSMENT OF SOCIAL PROTECTION NEEDS
SOCIAL PROTECTION SYSTEM REVIEW OF INDONESIA © OECD 2019
Figure 1.14. Maternal mortality has more than halved since 2000
Maternal mortality across benchmark countries (2000, 2005, 2010, 2015)
Source: World Bank (2018[5]), World Development Indicators (database), data.worldbank.org/products/wdi.
The decline in maternal mortality is partly attributable to the increased proportion of
women accessing antenatal care: access has steadily increased since the early 1990s, from
76.3% in 1991 to 95.5% in 2013 (Figure 1.15A). However, antenatal care is correlated
with income and education (Figure 1.15B): 99.0% of pregnant higher education graduates
received antenatal care vs. 76.6% of those with no education (MoH, 2013[19]).
Figure 1.15. Access to medical services before and at birth is close to universal
Access to ante-natal care (1991-2013) and proportion of births attended by skilled medical personnel (2013)
Source: World Bank (2018[5]), World Development Indicators (database), data.worldbank.org/products/wdi;
MoH (2013[19]), Basic Health Research, Ministry of Health, Government of Indonesia.
0
50
100
150
200
250
300
2000 2005 2010 2015
Deaths per 100 000 live births
Indonesia Malaysia Thailand Philippines
0
10
20
30
40
50
60
70
80
90
100
1991 1994 1997 2000 2003 2005 2006 2007 2008 2009 2010 2012 2013
A. Percentage of women giving prenatal care
% of pregnant women
84.1
94.7
97 98.2
98.9
75
80
85
90
95
100
Lowest Lower middle Middle Upper middle Highest
B. Percentage of women receiving antenatal care, by wealth index
% of pregnant women
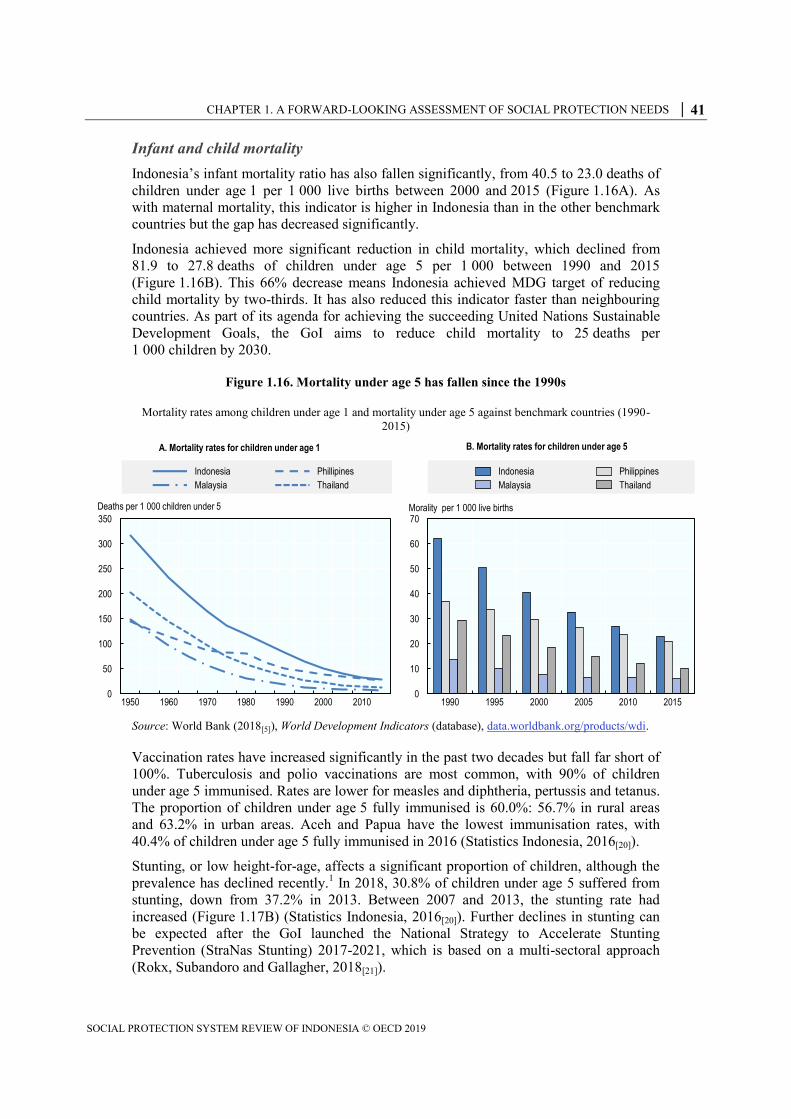
CHAPTER 1. A FORWARD-LOOKING ASSESSMENT OF SOCIAL PROTECTION NEEDS │ 41
SOCIAL PROTECTION SYSTEM REVIEW OF INDONESIA © OECD 2019
Infant and child mortality
Indonesia’s infant mortality ratio has also fallen significantly, from 40.5 to 23.0 deaths of
children under age 1 per 1 000 live births between 2000 and 2015 (Figure 1.16A). As
with maternal mortality, this indicator is higher in Indonesia than in the other benchmark
countries but the gap has decreased significantly.
Indonesia achieved more significant reduction in child mortality, which declined from
81.9 to 27.8 deaths of children under age 5 per 1 000 between 1990 and 2015
(Figure 1.16B). This 66% decrease means Indonesia achieved MDG target of reducing
child mortality by two-thirds. It has also reduced this indicator faster than neighbouring
countries. As part of its agenda for achieving the succeeding United Nations Sustainable
Development Goals, the GoI aims to reduce child mortality to 25 deaths per
1 000 children by 2030.
Figure 1.16. Mortality under age 5 has fallen since the 1990s
Mortality rates among children under age 1 and mortality under age 5 against benchmark countries (1990-
2015)
Source: World Bank (2018[5]), World Development Indicators (database), data.worldbank.org/products/wdi.
Vaccination rates have increased significantly in the past two decades but fall far short of
100%. Tuberculosis and polio vaccinations are most common, with 90% of children
under age 5 immunised. Rates are lower for measles and diphtheria, pertussis and tetanus.
The proportion of children under age 5 fully immunised is 60.0%: 56.7% in rural areas
and 63.2% in urban areas. Aceh and Papua have the lowest immunisation rates, with
40.4% of children under age 5 fully immunised in 2016 (Statistics Indonesia, 2016[20]).
Stunting, or low height-for-age, affects a significant proportion of children, although the
prevalence has declined recently.1 In 2018, 30.8% of children under age 5 suffered from
stunting, down from 37.2% in 2013. Between 2007 and 2013, the stunting rate had
increased (Figure 1.17B) (Statistics Indonesia, 2016[20]). Further declines in stunting can
be expected after the GoI launched the National Strategy to Accelerate Stunting
Prevention (StraNas Stunting) 2017-2021, which is based on a multi-sectoral approach
(Rokx, Subandoro and Gallagher, 2018[21]).
0
50
100
150
200
250
300
350
1950 1960 1970 1980 1990 2000 2010
A. Mortality rates for children under age 1
Deaths per 1 000 children under 5
Indonesia Phillipines
Malaysia Thailand
0
10
20
30
40
50
60
70
1990 1995 2000 2005 2010 2015
B. Mortality rates for children under age 5
Morality per 1 000 live births
Indonesia Philippines
Malaysia Thailand

42 │ CHAPTER 1. A FORWARD-LOOKING ASSESSMENT OF SOCIAL PROTECTION NEEDS
SOCIAL PROTECTION SYSTEM REVIEW OF INDONESIA © OECD 2019
Ministry of Health (MoH) data indicate that the prevalence of stunting is higher amongst
poor households, with a 10.8 percentage point gap between households in the bottom and
top wealth quintiles in rates of severe stunting (MoH, 2013[19]) (Figure 1.17A). A recent
World Bank study showed that 49% of children under age 5 in the lowest two quintiles
were stunted, up from 43% in 2007 (World Bank, 2017[22]). The stunting rate also varied
by province in 2018, from 17.7% in DKI Jakarta to 42.6% in Nusa Tenggara Timur.
Figure 1.17. Stunting remains a significant problem
Stunting levels of children by income group and over time (2007, 2010 and 2013)
Source: UNESCO (2017[23]), UIS.Stat (database), data.uis.unesco.org.
Stunting in the first two years, part of the “critical window of opportunity” spanning the
first 1 000 days from conception, can lead to long-term adverse effects on an individual’s
physical and cognitive development. Undernourished children are more likely to have
reduced adult height, decreased school attendance, lower wages in adulthood and give
birth to smaller infants. Considerable evidence also shows a strong correlation between
stunting and lowered cognitive ability (Victora et al., 2008[24]; Grantham-McGregor et al.,
2007[25]; Hoddinott et al., 2013[26]).
Access to education at an early age is an important means of promoting cognitive
development. Although Indonesia has made strides in improving access to pre-primary
education in recent years, further progress is needed, especially in rural areas. UNESCO
data indicate that the gross enrolment ratio for pre-primary education more than doubled
in a decade, from 27.0% in 2004 to 58.2% in 2014 (Figure 1.18). However, once again,
access improves with income: according to Jung and Hasan (2016[27]), a four-year-old
from the poorest quintile has a 16% likelihood of accessing early childhood education and
development services versus 40% from the richest 20% of households (2016[27]).
0
5
10
15
20
25
30
Lowest Lower middle Middle Upper middle Highest
% of children
A. Stunting of children by income group
Very short Short
18.8 18.5 18
18 17.1 19.2
36.835.6
37.2
0
5
10
15
20
25
30
35
40
2007 2010 2013
% of children
B. Stunting of children over time
Very short Short Total

CHAPTER 1. A FORWARD-LOOKING ASSESSMENT OF SOCIAL PROTECTION NEEDS │ 43
SOCIAL PROTECTION SYSTEM REVIEW OF INDONESIA © OECD 2019
Figure 1.18. Enrolment in pre-school education has increased
Pre-school enrolment by sex (2000-14)
Source: UNESCO (2017[23]), UIS.Stat (database), data.uis.unesco.org.
Despite high rates of stunting and low enrolment of children from low-income
households, there is evidence that public interventions are succeeding in addressing these
challenges successes. The Posyandu village health facilities provided an integrated health
and nutrition programme in the 1990s, while more recently, a community-driven
development programme, Generasi, contributed to reducing rates of stunting.
Social protection is a critical policy component in improving developmental outcomes,
thus enhancing the likelihood of escaping poverty. The Pendidikan Anak Usia Dini (Early
Childhood Education and Development) programme has driven improvements in both
pre-school enrolment and duration of enrolment of poor children in implementing
communities. Program Keluarga Harapan (PKH; Family of Hope Programme), the GoI’s
conditional cash transfer discussed in Chapter 2, is associated with reduced severe
stunting, higher school enrolment and improved use of health care services.
The GoI has the instruments to address persistently high rates of stunting and continued
wealth-based inequalities in access to health, nutrition and education services more
broadly. However, as the World Bank (2017[22]) states, these programmes are “neither
integrated nor implemented at scale” in Indonesia.
Education
In 2016, Indonesia increased the duration of compulsory education from 9 to 12 years to
maximise the long-term economic potential of its large youth population. The change is
likely to increase the number of children who complete high school and demand for
tertiary education. The reform will impose significant capacity and financial burdens on
the state, since it is obliged to meet basic education costs. The GoI currently provides
scholarships to poor children to encourage attendance (see Chapter 2); coverage of this
intervention will need to match growth in enrolment if children from lower-income
groups are to benefit.
Elementary (primary) school and junior high (lower secondary) school are free, and
coverage is almost universal (Figure 1.19). Junior high enrolment has increased
0
10
20
30
40
50
60
70
2000 2001 2002 2003 2004 2005 2006 2007 2008 2009 2010 2011 2012 2013 2014
Gross enrolment ratio
Male Female Total

44 │ CHAPTER 1. A FORWARD-LOOKING ASSESSMENT OF SOCIAL PROTECTION NEEDS
SOCIAL PROTECTION SYSTEM REVIEW OF INDONESIA © OECD 2019
significantly in recent years, from 85.5% in 2009 to 94.7% in 2015. Rural enrolment
remains lower than urban enrolment but the gap shrunk, from 8.0 percentage points in
2009 to 3.2 in 2015. Female enrolment is slightly higher than for males for both
elementary and junior high school.
Figure 1.19. School enrolment is high and rising
Enrolment in elementary and junior high school, by region and sex (2009-15)
Source: Statistics Indonesia (2016[4]), SUSENAS,
https://microdata.bps.go.id/mikrodata/index.php/catalog/769.
The gross enrolment rate is much lower for senior high (upper secondary) school, which
was fee-paying until 2016. Enrolment increased by 15.4 percentage points to 70.6%
between 2009 and 2015 (Figure 1.20) and will increase significantly with 12-year
compulsory schooling. Again, females are slightly more likely to be enrolled than males.
Until recently, less than one-third of students graduated (Shin Jongsoon et al., 2017[28]).
Student outcomes are not improving at the same pace as enrolment, contributing to skills
shortages in the economy (Allen, 2016[29]). The latest results of the OECD Programme for
International Student Assessment, in which the country has participated since 2000,
showed that around three-quarters of 15 year-olds do not have basic skills in mathematics
and less than one-third have basic reading proficiency (OECD, 2018[30]). However,
Indonesian students showed one of the strongest improvements in science assessments
among participating countries between 2012 and 2015 while their performance in
mathematics assessments also improved also over the period (OECD, 2016[31]).
80
82
84
86
88
90
92
94
96
98
100
2009 2010 2011 2012 2013 2014 2015
A. Elementary school participation
Participation rate
80
82
84
86
88
90
92
94
96
98
100
2009 2010 2011 2012 2013 2014 2015
B. Junior high school participationParticipation rate
Urban Rural Male Female Total

CHAPTER 1. A FORWARD-LOOKING ASSESSMENT OF SOCIAL PROTECTION NEEDS │ 45
SOCIAL PROTECTION SYSTEM REVIEW OF INDONESIA © OECD 2019
Figure 1.20. Senior high school enrolment is rising rapidly
Enrolment in senior high school by region and sex (2009-15)
Source: Statistics Indonesia (2016[4]), SUSENAS,
https://microdata.bps.go.id/mikrodata/index.php/catalog/769.
Tertiary education enrolment almost doubled between 2000 and 2016, from 14.9% to
27.9%, although it remains below enrolment in the benchmark countries (Figure 1.21).
Growth in the proportion of students completing secondary education drove demand for
tertiary education even before the expansion in basic education (Negara and Benveniste,
2014[32]). Evidence indicates there are significant returns to higher education in terms of
labour force participation, wages and job availability (Negara and Benveniste, 2014[33]).
Only 10% of students enrolled in tertiary education were from the lowest two income
quintiles in 2012, despite legislation requiring that 20% of higher education students
come from “frontier, outer and disadvantaged areas” (Negara and Benveniste, 2014[32];
Sekretariat Negara Republik Indonesia, 2012[34]). This disparity in education outcomes
predicated on income risks exacerbating and perpetuating inequalities.
0
10
20
30
40
50
60
70
80
2009 2010 2011 2012 2013 2014 2015
Senior high school participation rate
Urban Rural Male Female Total

46 │ CHAPTER 1. A FORWARD-LOOKING ASSESSMENT OF SOCIAL PROTECTION NEEDS
SOCIAL PROTECTION SYSTEM REVIEW OF INDONESIA © OECD 2019
Figure 1.21. Tertiary enrolment lags behind benchmark countries
Gross enrolment ratios in tertiary education across benchmark countries (2000-16)
Source: World Bank (2018[5]), World Development Indicators (database), data.worldbank.org/products/wdi.
Increased enrolment in senior high school and tertiary education is associated with a
decline in the proportion of youth (aged 15-24) not in education, employment or training
(NEET) (Figure 1.22). Some 23.2% of Indonesian youth were classified as NEET in
2016, a 6.4 percentage point decrease from 2008 (ILO, 2015[35]). The percentage of
female youth NEET is considerably higher than for males, although the gap appears to be
shrinking.
Figure 1.22. The proportion of youth NEET remains high, especially among women
Proportion of males and females NEET (2008-16)
Source: ILO (2015[35]), Key Indicators of the Labour Market, 9th edition (database),
www.ilo.org/global/statistics-and-databases/research-and-databases/kilm/lang--en/index.htm (accessed
22 June 2018).
0
10
20
30
40
50
60
2000 2001 2002 2003 2004 2005 2006 2007 2008 2009 2010 2011 2012 2013 2014 2015 2016
Tertiary gross enrolment ratio
Indonesia Malaysia Thailand Philippines
0
5
10
15
20
25
30
35
40
2008 2009 2010 2013 2015 2016
% of youth
Male Female Total

CHAPTER 1. A FORWARD-LOOKING ASSESSMENT OF SOCIAL PROTECTION NEEDS │ 47
SOCIAL PROTECTION SYSTEM REVIEW OF INDONESIA © OECD 2019
Adulthood
Although the labour force has grown significantly in absolute terms, rates of labour force
participation have changed little since 2000. There is a major disparity in labour market
participation between men and women, contributing to women’s vulnerability at working
age as well as in old age. The average labour force participation rates for men and women
between 2000 and 2015 were 79.7% and 47.1% respectively and there is little evidence of
convergence (Figure 1.23). The gender pay gap for full-time workers in 2014 exceeded
30% (OECD, 2017[36]).
Figure 1.23. A large gender gap exists in labour force participation
Male and female labour force participation (2000-17)
Source: ILO (2015[35]), Key Indicators of the Labour Market, 9th edition (database),
www.ilo.org/global/statistics-and-databases/research-and-databases/kilm/lang--en/index.htm (accessed
22 June 2018).
The economy has so far been able to accommodate strong growth in the labour force. The
national unemployment rate fell from 10.3% in 2006 to 5.6% in 2016. Although rates
vary by province, they declined in all provinces except Kalimantan Utara between 2006
and 2016 (Pratomo, 2015[37]). Although unemployment is low, approximately 30% of the
labour force is thought to be underemployed and workers also confront widespread low
pay and long working hours (OECD, 2017[36]).
0
10
20
30
40
50
60
70
80
90
2000 2001 2002 2003 2004 2005 2006 2007 2008 2009 2010 2011 2012 2013 2014 2015 2016 2017
Employment-to-population ratio
Male Female

48 │ CHAPTER 1. A FORWARD-LOOKING ASSESSMENT OF SOCIAL PROTECTION NEEDS
SOCIAL PROTECTION SYSTEM REVIEW OF INDONESIA © OECD 2019
Figure 1.24. Unemployment has declined and varies by province
Unemployment rate by province, 2006 and 2016
Note: DI = Daerah Istimewa; DKI = Daerah Khusus Ibukota.
Source: Statistics Indonesia (2016[4]), SUSENAS,
https://microdata.bps.go.id/mikrodata/index.php/catalog/769.
The rate of informality has declined but nonetheless accounts for the majority of
employment in Indonesia. Between 2006 and 2016, the rate of informal workers (defined
by Statistics Indonesia as own-account workers, temporary or casual employees and
unpaid family workers) fell from 68.9% to 57.6% (Figure 1.25A). Informality is
associated with elevated exposure to a range of risks. Defining informality at the
household rather than individual level, this review finds that households containing
informal workers tend to be worse off.
According to IFLS data for 2014, 42.9% of the informal workforce were own-account
workers, 42.4% were employees, 12.5% were unpaid family workers and 2.2.% were
employers. Men were more likely to be informal employees than women (47.8% versus
35.4%) while women were much more likely to be unpaid family workers than men
(21.6% versus 5.4%).
0
2
4
6
8
10
12
14
16
18
20
Unemployment rate
2006 2016

CHAPTER 1. A FORWARD-LOOKING ASSESSMENT OF SOCIAL PROTECTION NEEDS │ 49
SOCIAL PROTECTION SYSTEM REVIEW OF INDONESIA © OECD 2019
Figure 1.25. Informality is declining slowly
Informality rate over time (2006-16) and by level of education (2016)
Note: National definitions used in the estimation of informality.
Source: Authors’ calculations based on Statistics Indonesia (2016[4]), SUSENAS,
https://microdata.bps.go.id/mikrodata/index.php/catalog/769.
The likelihood of being informally employed decreases with higher educational
attainment: 35.3% of individuals who only completed elementary education are in
informal work compared with 1.9% of university graduates (Figure 1.25B).Based on data
from the IFLS for 2014/15, informality is inversely correlated with income. In the first
quintile, 86% of households contain only informal workers compared with 57% in the top
quintile (Figure 1.26A). Some 91% of households classified as poor by the global
USD 1.90/day benchmark contain only informal workers (Figure 1.26B).
Figure 1.26. Informality and poverty are correlated
Source: Authors’ calculations, based on RAND Institute (2015[10]), Indonesian Family Life Survey – Wave 5,
www.rand.org/labor/FLS/IFLS.html.
0
20
40
60
80
100
2006 2007 2008 2009 2010 2011 2012 2013 2014 2015 2016
% of workers
A. Informality rate
Informal Formal
0
10
20
30
40
B. Informally employed workers by level of education
% of informally employed workers
71
91
68
85
66 82
12
14
175
17
17
12
18
14
0
10
20
30
40
50
60
70
80
90
100
Non poor Poor Non poor Poor Top 60% Bottom40%
Int. USD 1.90/day Int. USD 3.10/day Relative poverty
% of households
B. Degree of informality of household by poverty status
0
10
20
30
40
50
60
70
80
90
100
All Q1 Q2 Q3 Q4 Q5
% of households
A. Degree of informality of household by quintile
Informal Formal Mixed

50 │ CHAPTER 1. A FORWARD-LOOKING ASSESSMENT OF SOCIAL PROTECTION NEEDS
SOCIAL PROTECTION SYSTEM REVIEW OF INDONESIA © OECD 2019
As discussed in Chapter 3, informal households are less likely to be covered by social
protection, which in turn increases their exposure to health and other shocks. The GoI is
making a particular effort to expand contributory arrangements in the informal sector.
Informal workers often find themselves in the “missing middle” of social protection
coverage, whereby they are ineligible for poverty-targeted social assistance but do not
have access to employer-based social insurance arrangements, making it important that
they can access public schemes.
Old age
Indonesia’s elderly population is relatively small but it is highly prone to poverty. In
2016, 14.7% of individuals over age 65 were poor, down only slightly from 14.9% in
2010. Poverty among all other age groups declined over the same period, most
significantly among children, the cohort in which poverty was previously most
concentrated (Figure 1.27B).
Figure 1.27. Old-age poverty has barely declined in recent years
Main activity of elderly population (2016) and poverty rate by age (2010 and 2016)
Source: Authors’ calculations, based on Statistics Indonesia (2016[4]), SUSENAS,
https://microdata.bps.go.id/mikrodata/index.php/catalog/769.
The majority of elderly individuals do not receive support from public social protection.
Contributory pension arrangements have historically been targeted at formal workers,
resulting in less than 10% coverage among today’s working population and lower still
among the elderly (OECD, 2017[36]). Social assistance has been extended to elderly
individuals but coverage remains extremely low (see Chapter 2).
In 2007, only 6.8% of individuals aged 60-64 received a pension. The rate decreased for
older cohorts: coverage was 4.9% for ages 70 to 74 and 2.7% for age 75+. Women were
three to five times less likely to receive a pension (Priebe and Howell, 2014[38]). Elderly
individuals, especially women, are highly reliant on transfers from household members.
Nearly one in three men continue to work past age 60 (Figure 1.27A). However, the
disability rate among the population aged over 65 has been calculated to be 46.5%, much
higher than for the population as a whole. This limits the elderly’s population remain
0
10
20
30
40
50
60
70
80
90
100
Male Female Urban Rural
% of workers
A. Main activity of older persons (60+ years old)
Working Unemployed
Taking care of household Others
0
2
4
6
8
10
12
14
16
18
20
% of population
Age groups
B. Poverty rate by age group
2010 2016

CHAPTER 1. A FORWARD-LOOKING ASSESSMENT OF SOCIAL PROTECTION NEEDS │ 51
SOCIAL PROTECTION SYSTEM REVIEW OF INDONESIA © OECD 2019
economically active and support themselves (Adioetomo, Mont and Irwanto, 2014[39]).
With the elderly population starting to increase rapidly, the need to expand old-age social
protection will become increasingly pressing; failure to do so would risk driving poverty
rates upwards
Health risks
Indonesia is undergoing an epidemiological transition. Non-communicable diseases are
becoming a more significant burden on health than communicable diseases: the
proportion of total deaths attributable to non-communicable diseases rose from 63% in
2010 to 77% in 2014. The most common causes of death in 2014 were cardiovascular
diseases, cancer and diabetes (WHO, 2014[40]).
This transition is borne out by the number of Disability-Adjusted Life Years (DALYs)
lost to major causes from 2000 to 2015 (Table 1.1). Although communicable diseases still
accounted for the largest proportion of DALYs in 2015, their contribution declined by
32.5% from 2000. There were significant increases for cardiovascular diseases; diabetes;
and urogenital, blood, endocrine and chronic liver diseases.
Table 1.1. The health burden of non-communicable diseases is increasing
Changes in principal causes of loss of DALYs (2000-15)
Cause 2000 2005 2010 2015 Percentage point change
(2000-15)
Communicable, maternal, neonatal and nutritional diseases
29 556 26 231 23 211 20 005 -32.3
HIV/AIDS and tuberculosis 4 051 4 114 4 172 4 156 2.6
Diarrhea, lower respiratory and other common infectious diseases
12 873 10 232 8 150 6 575 -48.9
Neglected tropical diseases and malaria 1 617 1 648 1 536 1 549 -4.2
Maternal disorders 906 754 597 511 -43.6
Neonatal disorders 7 474 6 899 6 260 4 974 -33.5
Nutritional deficiencies 2 075 2 036 1 979 1 765 -15.0
Other communicable, maternal, neonatal and nutritional diseases
558 547 516 475 -14.9
Neoplasms 3 199 3 576 4 023 4 516 41.2
Cardiovascular diseases 10 216 11 280 12 400 13 769 34.8
Chronic respiratory diseases 3 149 3 209 3 365 3 225 2.4
Cirrhosis and other chronic liver diseases 1 465 1 587 1 743 1 738 18.6
Digestive diseases 1 824 1 897 1 881 2 110 15.7
Neurological disorders 1 851 2 004 2 165 2 318 25.3
Mental and substance use disorders 3 641 3 954 4 289 4 638 27.4
Diabetes and urogenital, blood and endocrine diseases
4 540 5 098 5 865 6 617 45.7
Musculoskeletal disorders 3 238 3 617 4 061 4 545 40.3
Other non-communicable diseases 4 890 5 295 5 649 6 020 23.1
Transport injuries 2 900 2 759 2 728 2 717 -6.3
Self-harm and interpersonal violence 422 457 498 538 27.6
Forces of nature, war and legal intervention 117 208 201 114 -2.3
All causes 73 498 73 634 74 537 75 269 2.4
Source: IHME (2016[41]), Global Burden of Disease (database), www.healthdata.org/gbd/data (accessed
22 June 2018).

52 │ CHAPTER 1. A FORWARD-LOOKING ASSESSMENT OF SOCIAL PROTECTION NEEDS
SOCIAL PROTECTION SYSTEM REVIEW OF INDONESIA © OECD 2019
The increase in HIV/AIDS is noteworthy. Data from the Joint United Nations Programme
on HIV and AIDS indicate that nearly 690 000 Indonesians aged 15-49 lived with HIV in
2015, equivalent to a prevalence rate of 0.5%, up from 0.1% in 2003 (WHO, 2016[42]).
National rates mask important regional variation. MoH data indicate that Jakarta has the
largest population living with HIV/AIDS. Bali, East Java and Papua also report relatively
large populations (Indonesian National AIDS Commission, 2014[43]).
Rates might be much higher than is reported, as cases often go undiagnosed. Only around
35% of individuals living with HIV/AIDS know their status (Indonesian National AIDS
Commission, 2014[43]). HIV/AIDS was responsible for 35 000 deaths in 2015, leaving
110 000 children orphaned (Indonesian National AIDS Commission, 2014[43]). Few
individuals diagnosed with HIV receive antiretroviral therapy: 13% received treatment in
2016 (WHO, 2016[42]).
The proportion of Indonesians who are obese has risen dramatically in recent years and
represents a significant long-term health threat. The proportion of the population that is
obese more than doubled between 2007 and 2018, from 10.5% to 21.8% (Ministry of
Health, 2018[44]).
The high prevalence of smoking, especially among men, is a particular health concern. It
is a major cause of non-communicable disease. In 2013, some 66.0% of adult males and
6.7% of females smoked, up from 62.2% and 1.3% in 2001 (MoH, 2013[45]). As of 2018,
the mean age at initiation of daily smoking is 17.6 years, and 34.8% of the population
aged 15 and older smoke tobacco regularly: roughly 67% of Indonesian men and 2.7% of
Indonesian women (WHO Regional Office for South-East Asia, 2018[46]).
A majority of Indonesians suffering a health issue choose self-treatment instead of
visiting health facilities or medical professionals, although this trend is decreasing: in
2014, 61% treated themselves, compared with 68.4% in 2009. Overall, men and rural
residents are more likely to choose self-treatment, possibly because of lack of access to
adequate health facilities (Figure 1.28).
Figure 1.28. The proportion of people treating themselves has declined
Percentage choosing self-treatment by location and sex (2009-14)
Source: Authors’ calculations, based on Statistics Indonesia (2016[4]), SUSENAS,
https://microdata.bps.go.id/mikrodata/index.php/catalog/769.
54
56
58
60
62
64
66
68
70
72
2009 2010 2011 2012 2013 2014
% of population
Urban Rural Male Female Total

CHAPTER 1. A FORWARD-LOOKING ASSESSMENT OF SOCIAL PROTECTION NEEDS │ 53
SOCIAL PROTECTION SYSTEM REVIEW OF INDONESIA © OECD 2019
People with disabilities
The 2015 Intercensal Population Survey indicated that around 8.6% of the population
over age 2 have some type of disability and half (48.5%) report multiple disabilities.
Using a combination of population and household surveys, TNP2K has calculated the rate
to be between 10% and 15% of the population but suggests that the actual rate could be
much higher. Rates are higher for females than for males and for rural residents than for
urban residents and individuals with disabilities face more risks and vulnerabilities than
the general population (Adioetomo, Mont and Irwanto, 2014[39]).
Poverty rates among households with a member with a disability are 2.4 percentage
points higher than among those without. Individuals with disabilities are less likely to be
enrolled in school, and those with a disability have a 66.8% probability of completing
primary education relative to those with no impairments. Individuals with a mild
disability are 31.1% less likely to be employed than un-impaired individuals; those with
severe impairments are 91.8% less likely.
A legislative framework for integrating people with disabilities within mainstream
development policies is being established. Following the ratification of the United
Nations Convention on the Rights of Persons with Disabilities in 2007 and its passing
into law in 2011, Indonesia passed Law No. 8/2016 on Persons with Disabilities in 2016
that takes a rights-based approach to disability (Wardana and Dewi, 2017[47]). Improving
access to social protection for people with disabilities is a critical enabler for their
integration within the developmental process. According to TNP2K, just 1% of people
with disabilities access Asistensi Sosial Orang Dengan Kecacatan Berat (ASODKB), the
principal social assistance programme for this group. ASODKB, which became Asistensi
Sosial Penyandang Disabilitas Berat, is discussed further in Chapter 2.
Climate change is a threat while Industry 4.0 poses opportunities and risks
Indonesia’s long-term economic performance will be a key determinant of demand for
social protection in the future. The prospects for sustained economic growth to drive
increases in per capita income and improvements in living standards are positive.
However, the associated impact on poverty and inequality will depend on the structure of
this growth and the extent to which it can be harnessed by the tax system to finance
redistributive fiscal policies. At the same time, the structure of employment will influence
the extent to which Indonesia is affected by challenges such as climate change and the
Fourth Industrial Revolution
Indonesia’s economic structure has changed significantly in the past 20 years, with a shift
away from the primary sector. The service sector accounted for 43.6% of GDP in 2017,
while industry accounted for 39.4% and agriculture for 13.1% (Figure 1.29). The service
sector is also the largest employer, accounting for 48% of employment in 2017, up from
37% in 2000, while agriculture’s employment share fell from 45% to 30% over the same
period (World Bank, 2018[5]). Employment in industry increased from 17% to 22%
(World Bank, 2018[5]).

54 │ CHAPTER 1. A FORWARD-LOOKING ASSESSMENT OF SOCIAL PROTECTION NEEDS
SOCIAL PROTECTION SYSTEM REVIEW OF INDONESIA © OECD 2019
Figure 1.29. Agriculture’s share of output and employment has declined
Composition of GDP and employment (2017)
Source: World Bank (2018[5]), World Development Indicators, accessed 21 January 2019.
These economic and labour-market changes have been important drivers of enhanced
productivity and instrumental in accommodating growth in the working-age population.
Indonesia’s economic prospects are positive: the economy is expected to maintain growth
rates in excess of 5% up to 2020, inflation is mild, and monetary and fiscal policy are
contributing to a stable macroeconomic environment. However, Indonesia risks being
caught in a middle-income trap if it doesn’t generate more inclusive growth and
strengthen human capital.
Indonesia is approaching 40 years as a middle-income country, which is significantly
longer than some of the East Asian tigers, such as South Korea (Estrada et al., 2017[48]).
Neighbours such as the Philippines and Malaysia are expected to graduate to high-income
status before Indonesia. Weaknesses in public service delivery through the decentralised
system of government has been identified as a key constraint to Indonesia’s graduation
(Huang, Morgan and Yoshino, 2018[49]).
Climate change is likely to have an adverse impact on the economy and labour force over
the longer term. Indonesia was the fifth-largest emitter of greenhouse gases in the world
in 2017 but has pledged to reduce emissions by 29% from a business as usual scenario by
2030 (World Resources Institute, 2016[50]). A 2011 International Food Policy Research
Institute (IFPRI) study shows that climate change will reduce GDP between now and
2030. Output will also decrease for some crops, such as rice and paddy, increasing their
prices and reducing food security (Oktaviani et al., 2011[51]).
At the same time, the proportion of the population vulnerable to climate change will
increase significantly. An Asian Development Bank study indicates that the population
vulnerable to poverty will increase by between 15% and 91% due to the increased
flooding and drought associated with climate change (Fujii, 2016[52]). Non-climate related
natural disasters also pose a major threat to livelihoods: Indonesia is considered
extremely vulnerable to earthquakes and tsunamis, as demonstrated by the events that
struck Sulawesi in September 2018 and Sunda Strait in December 2018.
According to the National Disaster Mitigation Agency, there were 2 426 natural disasters
in Indonesia in 2018, which left 4 231 people dead or missing (Heriyanto and Cahya,
0
10
20
30
40
50
60
Services Industry Agriculture
% of GDP
A. Structure of output
0
10
20
30
40
50
60
Services Industry Agriculture
% of employment
B. Structure of employment
CHAPTER 1. A FORWARD-LOOKING ASSESSMENT OF SOCIAL PROTECTION NEEDS │ 55
SOCIAL PROTECTION SYSTEM REVIEW OF INDONESIA © OECD 2019
2018[53]). Social protection has been shown to be an important part of the policy response
to natural disasters and climate shocks in Southeast Asia. It can support households not
only to cope with shocks but also adapt to climate change and enhance resilience
(Hallegatte et al., 2016[54]). The human and economic benefits of ex ante responses
relative to disaster relief are substantial.
The Fourth Industrial Revolution is likely to have a profound influence on Indonesia’s
future. It present great opportunities in terms of increasing productivity, higher growth
rates, and better-paid jobs, as a result of which rising demand will offset declines in
employment associated with automation (Asian Development Bank, 2018[55]).
However, it also threatens disruption, with some sectors more affected by automation
than others. According to the International Labour Organization (ILO), 85% of salaried
workers in Indonesia’s retail sector – a major source of employment for women – are at
high risk from automation. At the same time, 60% of salaried workers in automotive
engineering, more than 60% of salaried workers in electrics and electronics, and 64% of
salaried workers in textiles, clothing and footwear are also at high risk (Chang, Rynhart
and Huynh, 2016[56]).
As the Asian Development Bank notes, the policy response to Industry 4.0 must be wide-
ranging: “Governments should respond to these challenges by ensuring that workers are
protected from the downside of new technologies and able to harness the new
opportunities they provide. This will require co-ordinated action on skills development,
labour regulation, social protection, and income redistribution.” By embedding social
protection in national development plans, the GoI is maximising its potential to play a
supportive role both in protecting workers and enhancing long-term productivity, as well
as promoting inclusive growth more broadly.
Note
1 Stunting is defined as the percentage of children whose z-score for the height-for-age index is
below two standard deviations below the mean.
References
Adioetomo, S., D. Mont and Irwanto (2014), “Persons with disabilities in Indonesia: Empirical
Facts and Implications for Social Protection Policies”, Demographic Institute, Faculty of
Economics, University of Indonesia and Tim Nasional Percepatan Penanggulangan
Kemiskinan,
http://www.tnp2k.go.id/images/uploads/downloads/Disabilities%20report%20Final%20sept2
014%20(1)-1.pdf (accessed on 22 June 2018).
[39]
Allen, E. (2016), “Analysis of Trends and Challenges in the Indonesian Labor Market”, ADB
Papers on Indonesia, No. 16, Asian Development Bank, Manila,
https://www.adb.org/sites/default/files/publication/182935/ino-paper-16-2016.pdf (accessed
on 22 June 2018).
[29]

56 │ CHAPTER 1. A FORWARD-LOOKING ASSESSMENT OF SOCIAL PROTECTION NEEDS
SOCIAL PROTECTION SYSTEM REVIEW OF INDONESIA © OECD 2019
Amannullah, G. (2016), Measuring disability in Indonesia, United Nations Regional Meeting on
Disability Measurement and Statistics, Bangkok, https://unstats.un.org/unsd/demographic-
social/meetings/2016/bangkok--disability-measurement-and-statistics/Session-
6/Indonesia.pdf (accessed on 22 June 2018).
[58]
Asian Development Bank (2018), Asian Development Outlook 2018: How Technology Affects
Jobs, ADB, Manila, http://www.adb.org (accessed on 7 March 2019).
[55]
BAPPENAS (2014), Rencana Pembangunan Jangka Menengah Nasional 2015-2019 [Medium
Term Development Plan RPJMN 2015-2019], Ministry of National Development Planning
(BAPPENAS), Government of the Republic of Indonesia, http://www.social-
protection.org/gimi/gess/RessourcePDF.action?ressource.ressourceId=50077 (accessed on
22 June 2018).
[6]
Bloom, D. and J. Williamson (1998), “Demographic transitions and economic miracles in
emerging Asia”, The World Bank economic review, Vol. 12/3, pp. 419-455,
http://documents.worldbank.org/curated/en/934291468206034843/Demographic-transitions-
and-economic-miracles-in-emerging-Asia (accessed on 22 June 2018).
[18]
Chang, J., G. Rynhart and P. Huynh (2016), The future of jobs at risk of automation,
International Labour Organization, Geneva,
http://www.ilo.org/actemp/publications/WCMS_579554/lang--en/index.htm (accessed on
22 June 2018).
[56]
Estrada, G. et al. (2017), “Asia’s middle-income challenge: An overview”, ADB Economics
Working Paper Series, No. 525, Asian Development Bank, Manila,
http://dx.doi.org/10.22617/WPS179122-2.
[48]
Fujii, T. (2016), “Climate Change and Vulnerability to Poverty: An Empirical Investigation in
Rural Indonesia”, ADBI Working Papers, No. 622, Asian Development Bank Institute,
Manila, https://www.adb.org/publications/climate-change-vulnerability-poverty-indonesia
(accessed on 22 June 2018).
[52]
Gama, A., C. Saget and A. Elsheikhi (2018), Labour Market Inventory ASEAN 2010-15: Labour
market policy in an age of increasing economic integration, International Labour
Organization, Geneva, https://www.ilo.org/global/research/WCMS_650064/lang--
en/index.htm (accessed on 30 January 2019).
[15]
Grantham-McGregor, S. et al. (2007), “Developmental potential in the first 5 years for children
in developing countries.”, Lancet (London, England), Vol. 369/9555, pp. 60-70,
http://dx.doi.org/10.1016/S0140-6736(07)60032-4.
[25]
Hallegatte, S. et al. (2016), Shock Waves: Managing the Impacts of Climate Change on Poverty,
World Bank, Washington, DC,
https://www.gfdrr.org/sites/default/files/publication/Shock_Waves.pdf (accessed on
22 June 2018).
[54]
Heriyanto, D. and G. Cahya (2018), “2018 sees Indonesia’s deadliest year in decade”, The
Jakarta Post, https://www.thejakartapost.com/news/2018/12/27/2018-sees-indonesia-s-
deadliest-year-decade.html (accessed on 30 January 2019).
[53]
CHAPTER 1. A FORWARD-LOOKING ASSESSMENT OF SOCIAL PROTECTION NEEDS │ 57
SOCIAL PROTECTION SYSTEM REVIEW OF INDONESIA © OECD 2019
Hoddinott, J. et al. (2013), “The economic rationale for investing in stunting reduction”,
Maternal & Child Nutrition, Vol. 9, pp. 69-82, http://dx.doi.org/10.1111/mcn.12080.
[26]
Huang, B., P. Morgan and N. Yoshino (2018), Avoiding the Middle-Income Trap in Asia: The
Role of Trade, Manufacturing, and Finance, Asian Development Bank Institute, Tokyo,
http://www.adbi.org (accessed on 30 January 2019).
[49]
IHME (2016), Global Burden of Disease (GBD) (database), Institute for Health Metrics and
Evaluation, http://www.healthdata.org/gbd/data (accessed on 22 June 2018).
[41]
ILO (2015), Key Indicators of the Labour Market, 9th edition (database), International Labour
Organization, https://www.ilo.org/global/statistics-and-databases/research-and-
databases/kilm/lang--en/index.htm (accessed on 22 June 2018).
[35]
ILO (2013), Key Indicators of the Labour Market, 9th edition,
http://ilo.org/employment/areas/WCMS_234860.
[59]
Indonesian National AIDS Commission (2014), Global AIDS Response Progress Reporting:
Indonesia Country Progress Report 2014, Indonesian National AIDS Commission,
Government of Indonesia,
http://www.unaids.org/sites/default/files/country/documents/IDN_narrative_report_2014.pdf
(accessed on 30 January 2019).
[43]
Jung, H. and A. Hasan (2016), “The impact of early childhood education on early achievement
gaps in Indonesia”, Journal of Development Effectiveness, Vol. 8/2, pp. 216-233,
http://dx.doi.org/10.1080/19439342.2015.1088054.
[27]
Ministry of Health (2018), Hasil Utama Riskesdas 2018, Kementerian Kesehatan Badan
Penelitian dan Pengembangan Kesehatan (Ministry of Health),
http://www.depkes.go.id/resources/download/info-terkini/hasil-riskesdas-2018.pdf (accessed
on 8 March 2019).
[44]
Ministry of Industry (n.d.), Making Indonesia 4.0: Benchmarking Implementasi Industri,
Ministry of Industry, Government of Indonesia.
[1]
MoH (2013), Basic Health Research, Ministry of Health, Government of the Republic of
Indonesia.
[19]
MoH (2013), Basic Health Research, Ministry of Health, Government of Indonesia. [45]
Negara, S. and L. Benveniste (2014), Indonesia’s higher education system: how responsive is it
to the labor market?, World Bank, Washington, DC,
http://documents.worldbank.org/curated/en/596601468268792237/Indonesias-higher-
education-system-how-responsive-is-it-to-the-labor-market (accessed on 22 June 2018).
[33]
Negara, S. and L. Benveniste (2014), Tertiary education in Indonesia: directions for policy,
World Bank, Washington, DC,
http://documents.worldbank.org/curated/en/105061468044074141/Tertiary-education-in-
Indonesia-directions-for-policy (accessed on 22 June 2018).
[32]

58 │ CHAPTER 1. A FORWARD-LOOKING ASSESSMENT OF SOCIAL PROTECTION NEEDS
SOCIAL PROTECTION SYSTEM REVIEW OF INDONESIA © OECD 2019
OECD (2018), OECD Economic Surveys: Indonesia 2018, OECD Publishing, Paris,
https://dx.doi.org/10.1787/eco_surveys-idn-2018-en.
[30]
OECD (2018), Social Protection System Review: A Toolkit, OECD Development Policy Tools,
OECD Publishing, Paris, https://dx.doi.org/10.1787/9789264310070-en.
[8]
OECD (2017), A Decade of Social Protection Development in Selected Asian Countries, OECD
Publishing, Paris, https://dx.doi.org/10.1787/9789264272262-en.
[36]
OECD (2016), “PISA 2015 Country Note: Indonesia”, OECD Publishing, Paris,
https://www.oecd.org/pisa/PISA-2015-Indonesia.pdf (accessed on 22 June 2018).
[31]
Oktaviani, R. et al. (2011), “The impact of global climate change on the Indonesian economy”,
IFPRI Discussion Papers, International Food Policy Research Institute (IFPRI), Washington,
DC, http://www.ifpri.org/publication/impact-global-climate-change-indonesian-economy
(accessed on 22 June 2018).
[51]
OPHI (2017), “OPHI Country Briefing 2017: Indonesia”, Oxford Poverty and Human
Development Initiative (OPHI), Oxford.
[13]
Pratomo, D. (2015), “The Analysis of Underemployment in Indonesia: Determinants and its
Implication”, Procedia - Social and Behavioral Sciences, Vol. 211, pp. 528-532,
http://dx.doi.org/10.1016/J.SBSPRO.2015.11.070.
[37]
Priebe, J. and F. Howell (2014), Old-Age Poverty in Indonesia: Empirical Evidence and Policy
Options - A Role for Social Pensions, Tim Nasional Percepatan Penanggulangan Kemiskinan,
Jakarta, http://socialprotection.org/discover/publications/old-age-poverty-indonesia-
empirical-evidence-and-policy-options-role-social (accessed on 22 June 2018).
[38]
RAND Institute (2015), Indonesian Family Life Survey (IFLS) - Wave 5, Indonesian Family Life
Surveys, https://www.rand.org/labor/FLS/IFLS.html (accessed on 22 June 2018).
[10]
RAND Institute (2007), Indonesian Family Life Survey (IFLS) - Wave 4, Indonesian Family Life
Surveys, http://www.rand.org/labor/FLS/IFLS.html.
[9]
Rokx, C., A. Subandoro and P. Gallagher (2018), Aiming high - Indonesia’s ambition to reduce
stunting, World Bank,
http://documents.worldbank.org/curated/en/913341532704260864/pdf/128954-REVISED-
WB-Nutrition-Book-Aiming-High-11-Sep-2018.pdf (accessed on 8 March 2019).
[21]
Sekretariat Negara Republik Indonesia (2012), Law on Higher Education (Law No. 12/2012),
http://www.ilo.org/dyn/natlex/natlex4.detail?p_lang=en&p_isn=91045 (accessed on
22 June 2018).
[34]
Shin Jongsoon et al. (2017), “Indonesia : Selected Issues”, Country Report, No. 17/48,
International Monetary Fund, Washington, DC,
https://www.imf.org/en/Publications/CR/Issues/2017/02/11/Indonesia-Selected-Issues-44654
(accessed on 22 June 2018).
[28]

CHAPTER 1. A FORWARD-LOOKING ASSESSMENT OF SOCIAL PROTECTION NEEDS │ 59
SOCIAL PROTECTION SYSTEM REVIEW OF INDONESIA © OECD 2019
Statistics Indonesia (2019), Poverty and Inequality: Basic Statistics,
https://www.bps.go.id/subject/23/kemiskinan-dan-ketimpangan.html#subjekViewTab3
(accessed on 6 February 2019).
[3]
Statistics Indonesia (2018), Poverty and Inequality: Concept, Government of Indonesia, Jakarta,
https://www.bps.go.id/subject/23/kemiskinan-dan-ketimpangan.html#subjekViewTab1
(accessed on 12 December 2018).
[7]
Statistics Indonesia (2016), Consumption of Calorie and Protein of Indonesia Population and
Province (Book 2), Statistics Indonesia, Government of the Republic of Indonesia.
[20]
Statistics Indonesia (2016), Survei Sosial Ekonomi Nasional 2016 Maret (KOR),
https://microdata.bps.go.id/mikrodata/index.php/catalog/769 (accessed on 22 June 2018).
[4]
Statistics Indonesia (2010), Survei Sosial Ekonomi Nasional 2010 Semester 1 (Panel), Statistics
Indonesia (Badan Pusat Statistik), Government of Indonesia,
https://mikrodata.bps.go.id/mikrodata/index.php/catalog/128 (accessed on 30 January 2019).
[16]
TNP2K (2018), The Future of the Social Protection System in Indonesia: Social Protection for
All, The National Team for the Acceleration of Poverty Reduction, Jakarta.
[11]
UNDESA (2017), World Population Prospects: The 2017 Revision, United Nations Department
of Economic and Social Affairs, New York,
http://un.org/en/development/desa/population/publications.
[17]
UNDP (2016), Human Development Report 2016: Indonesia Country Brief, United Nations
Development Programme, New York,
http://www.id.undp.org/content/dam/indonesia/2017/doc/INS-
Indonesia_Country%20Explanatory%20Note_HDR2016.pdf (accessed on 22 June 2018).
[14]
UNESCO (2017), UIS.Stat (database), United Nations Educational, Scientific and Cultural
Organization, http://data.uis.unesco.org/ (accessed on 22 June 2018).
[23]
Victora, C. et al. (2008), “Maternal and child undernutrition: consequences for adult health and
human capital.”, Lancet (London, England), Vol. 371/9609, pp. 340-57,
http://dx.doi.org/10.1016/S0140-6736(07)61692-4.
[24]
Wardana, A. and N. Dewi (2017), “Moving Away From Paternalism: The New Law on
Disability in Indonesia”, Asia-Pacific Journal on Human Rights and the Law, Vol. 18/2,
pp. 172-195, http://dx.doi.org/10.1163/15718158-01802003.
[47]
WHO (2016), Progress Report on HIV in the WHO South-East Asia Region 2016, World Health
Organization, Regional Office for South-East Asia,
http://apps.searo.who.int/PDS_DOCS/B5282.pdf (accessed on 30 January 2019).
[42]
WHO (2014), “Noncommunicable Diseases (NCD) Country Profiles: Indonesia”, World Health
Organization, Geneva, http://www.who.int/nmh/countries/idn_en.pdf?ua=1 (accessed on
22 June 2018).
[40]

60 │ CHAPTER 1. A FORWARD-LOOKING ASSESSMENT OF SOCIAL PROTECTION NEEDS
SOCIAL PROTECTION SYSTEM REVIEW OF INDONESIA © OECD 2019
WHO Regional Office for South-East Asia (2018), WHO Factsheet 2018: Indonesia, World
Health Organization, Bangkok, http://www.searo.who.int/tobacco/data/ino_rtc_reports,
(accessed on 8 March 2019).
[46]
World Bank (2018), Navigating Uncertainty: East Asia and Pacific Economic Update, October,
World Bank, Washington DC, http://dx.doi.org/10.1596/978-1-4648-1366-5.
[12]
World Bank (2018), World Development Indicators (WDI), World Bank, Washington, DC,
https://datacatalog.worldbank.org/dataset/world-development-indicators (accessed on
6 December 2018).
[5]
World Bank (2017), “Operationalizing a Multi-Sectoral Approach for the Reduction of Stunting
in Indonesia: An Application Using the 2007 and 2013 Riskesdas”, Economic and Sector
Work (ESW) Studies, https://openknowledge.worldbank.org/handle/10986/26409 (accessed
on 22 June 2018).
[22]
World Bank (2017), World Development Indicators, http://data.worldbank.org/products/wdi
(accessed on 1 June 2017).
[57]
World Bank (2014), Indonesia: Avoiding the Trap, World Bank, Washington DC,
https://openknowledge.worldbank.org/handle/10986/18944 (accessed on 30 January 2019).
[2]
World Resources Institute (2016), CAIT Climate Data Explorer, World Resources Institute,
http://cait.wri.org/ (accessed on 22 June 2018).
[50]

CHAPTER 2. SOCIAL PROTECTION COVERAGE │ 61
SOCIAL PROTECTION SYSTEM REVIEW OF INDONESIA © OECD 2019
Chapter 2. Social protection coverage
Social protection in Indonesia has evolved rapidly since the Asian Financial Crisis,
through both a major scale-up of social assistance and “big bang” reforms to social
insurance. This chapter charts this trajectory over the past two decades, outlining the
main economic, political and legislative drivers of social protection before examining in
greater detail the main programmes that have been established during this period. It
provides an inventory of existing schemes, analyses their key design features and scale of
operation, and discusses how well they meet the present and future needs identified in
Chapter 1, as well identifying major gaps in this regard.

62 │ CHAPTER 2. SOCIAL PROTECTION COVERAGE
SOCIAL PROTECTION SYSTEM REVIEW OF INDONESIA © OECD 2019
Indonesia’s recovery from the far-reaching economic, political and social consequences
of the Asian Financial Crisis of 1997-98 is an international success story. Social
protection was poorly developed prior to the Crisis but emerged as an important part of
the response and has since played an ever-larger role in Indonesia’s development. As the
Government of Indonesia (GoI) confronts the challenges identified in Chapter 1 – a
marked slowdown in the decline in poverty, the vulnerability of the middle class, major
regional disparities and high inequality – social protection is featuring ever-more
prominently in national strategies.
Social protection is growing in prominence
The Asian Financial Crisis, which caused widespread unemployment and a substantial
increase in poverty in Indonesia, exposed both a lack of social programmes and major
shortcomings in the programmes that did exist. Prior to the crisis, Indonesia’s social
protection programmes were traditionally been relief-oriented interventions rather than
integrated systems of preventive programmes that keep families from falling into poverty
(Jellema and Hassan, 2012[1]). Following the crisis, the GoI set about adopting a stronger
set of policies addressing poverty alleviation and implementing centralised social
protection programmes (Perdana, 2014[2]). Key legislation related to employment was
also introduced, for example through the Manpower Act of 2003.
Three presidents have charted the evolution of social protection in Indonesia: Megawati
Sukarnoputri (2001-04), Susilo Bambang Yudhoyono (2004-14) and Joko Widodo (2014-
present). Their respective administrations took responsibility for scaling up social
assistance and for reforming social insurance, although the degree of continuity between
governments has varied.
Social assistance reforms have not occurred in a particularly strategic manner. Each
administration has prioritised different programmes over others, experimenting with new
programmes and rejecting or reforming programmes based on their impact. The evolution
of social assistance, particularly under President Yudhoyono, was strongly influenced by
the imperative to compensate poor households (and ward off popular discontent)
following cuts in fuel subsidies. Although President Yudhoyono’s ten years in office was
a period of major policy development in social assistance, it is notable that budgetary
allocations did not increase accordingly (Tomsa, Mietzner and Aspinall, 2015[3]).
The development of social insurance has been propelled by big bang reforms in 2004 and
2011 (Bauer and Thant, 2010[4]). President Megawati initiated discussions around the first
far-reaching social insurance reforms, which culminated in the 2004 legislation creating
the Sistem Jaminan Sosial Nasional (SJSN; National Social Security System) policy
framework. President Yudhoyono’s second administration then oversaw passage of
another landmark reform seven years later: the 2011 Social Security Provider Law
No. 24, which created Badan Jaminan Sosial Nasional (BJPS; National Social Security
Administering Body).
BJPS Kesehatan (henceforth BPJS Health), which began operations in January 2014, was
made responsible for Jaminan Kesehatan Nasional (JKN; Public Health Insurance) with
the aim of achieving universal health coverage (UHC). BPJS Ketenagakerjaan
(henceforth BPJS Labour), which began operations in July 2015, is responsible for
employment-related social security.
The SJSN reforms recognised a need to establish a social insurance system with much
greater expanded coverage than previous arrangements had achieved. As this chapter and

CHAPTER 2. SOCIAL PROTECTION COVERAGE │ 63
SOCIAL PROTECTION SYSTEM REVIEW OF INDONESIA © OECD 2019
Chapter 3 will discuss, the BPJS Health has been much more effective than BPJS Labour
in this regard. At the same time, there is growing recognition of the need to create a
system of social assistance, which has evolved in a highly fragmented manner with little
coherence between the various institutions involved. Overall, 37 programmes social
protection programmes were implemented in 2015, up from 30 in 2012 (Adioetomo,
Pardede and Quarina, 2012[5]).
The National Medium-Term Development Plan (RPJMN) for 2015-19 calls for a social
protection system to cover the entire population based on comprehensive coverage of all
citizens throughout the lifecycle and for special programmes for the poor. The strategy
also calls for improved targeting of social assistance to increase coverage among the poor
population. An objective under Outcome 2 – Equitable access to social services and
social protection – is the ‘integration of several family-based social assistance schemes
for poor and vulnerable families that have children, disabled, and elderly in the form of
conditional cash transfers and/or through in-kind assistance to support nutrition’.
As this report will discuss, there are many dimensions to establishing a social protection
system. These include not only coherence between programmes but also between
institutions, information systems, targeting systems and financing arrangements.
Box 2.1. Social protection in rooted in the Constitution
Social protection is recognised as a basic human right by Indonesia’s constitution, which
was promulgated in 1945 and amended in 1999, 2001 and 2002.
Article 28 enshrines that:
Every person shall have the right to live in physical and spiritual prosperity, to
have a home and to enjoy a good and healthy environment, and shall have the
right to obtain medical care.
Every person shall have the right to receive facilitation and special treatment to
have the same opportunity and benefit in order to achieve equality and fairness.
Every person shall have the right to social security in order to develop oneself
fully as a dignified human being.
Meanwhile, Article 34 stipulates that:
Impoverished persons and abandoned children shall be taken care of by the
The state shall develop a system of social security for all of the people and shall
empower the inadequate and underprivileged in society in accordance with human
dignity.
The state shall have the obligation to provide sufficient medical and public service
facilities.
Social assistance has evolved in a fragmented fashion
Formal social assistance programmes emerged after the Asian Financial Crisis and have
since experienced strong growth. Social assistance in characterised by multiple
programmes implemented by a number of different line ministries. It encompasses
various programmes, from conditional cash transfers (CCTs) to food subsidies and

64 │ CHAPTER 2. SOCIAL PROTECTION COVERAGE
SOCIAL PROTECTION SYSTEM REVIEW OF INDONESIA © OECD 2019
student scholarships. A key impetus behind growth in social protection since 2005 has
been the phasing out of fuel subsidies. Social assistance programmes were implemented
to cushion the impact of these reforms and were financed by the resultant decline in tax
expenditure.
As will be discussed in Chapter 4, social assistance has received relatively low levels of
funding; social assistance accounted for 29.7% of total social protection spending in 2015
(Adioetomo, Aninditya and Radjiman, 2016[6]). However, this is starting to change, in
part because there is political support for the investment case for social assistance. The
administration of President Widodo has placed social protection at the centre of its
inclusive growth strategy (World Bank, 2017[7]). As Chapter 3 explains, not many of the
programmes outlined in this section are achieving their potential in terms of reducing
poverty and inequality.
Background
Following adoption of the 1945 Constitution, social protection was primarily provided by
families and communities rather than centralised government initiatives (Kwon and Kim,
2015[8]). Poverty reduction was not a policy objective until the early 1990s (Perdana,
2014[2]). Social assistance during the New Order administration (1966-98) was
characterised by religious-based protection, Zakat (the social protection institution of
Islam), whereby each Muslim is obliged to contribute in cash and in kind at religious
festivals to support poorer Muslims. In 1968, Zakat was installed as a semi-governmental
operation to distribute welfare to the population (Kwon and Kim, 2015[8]).
Prior to the Asian Financial Crisis, social spending consisted principally of supply-side
improvements in health, education and infrastructure (water, sanitation, electrification)
(Sudarno and Bazzi, 2011[9]). In the aftermath of the crisis, which led to mass lay-offs and
high inflation, an additional 36 million Indonesians were pushed into poverty, driving the
poverty rate up to 24%.
At the same time, a political shift towards a more democratic government provided a
more conducive environment for national social protection initiatives (Jellema and
Hassan, 2012[1]). In 1998, the GoI established a social safety net programme, Jaring
Pengaman Sosial (JPS), which offered temporary relief programmes providing access to
food, health care and education for those affected by the crisis (Perdana, 2014[2]). The JPS
programmes were found to be inefficient due to mis-targeting and low coverage (Mukul,
Zen and Dita, 2018[10]).
Over the past two decades, the GoI has transitioned from a traditional relief-response
outlook to a longer-term developmental agenda that incorporates social protection more
comprehensively. In 2008, the Ministry of National Development Planning (BAPPENAS)
introduced the Possible Social Protection Reforms for Indonesia report, which detailed
the shortcomings of existing social programmes and committed to developing effective
programmes (Kwon and Kim, 2015[8]).
The RPJMN for 2015-19 focuses on reducing inequality between income groups and
between regions as a necessary condition for stronger economic growth and shared
prosperity. (Perdana, 2014[2]). Social protection is a critical component of the RPJMN,
featuring in two of the four outcomes.

CHAPTER 2. SOCIAL PROTECTION COVERAGE │ 65
SOCIAL PROTECTION SYSTEM REVIEW OF INDONESIA © OECD 2019
Social assistance programmes
For the most part, the GoI’s budget allocation for social assistance programmes, Dana
Bantuan Sosial (Bansos)1 is managed by the Ministry of Social Affairs (MoSA).
However, resources for social assistance are also shared with other line ministries and
institutions that implement social assistance programmes.
The Bansos fund is intended to cover six functions of social assistance:
1. protect, prevent and handle the risk of social vulnerability among
individuals/families/groups/communities so that their basic needs are fulfilled
2. help rehabilitate people with a dysfunctional ability to recover
3. meet the basic needs of the whole population through an institutionalised scheme
4. empower individuals with social problems to meet their basic needs
5. alleviate poverty among people/families/groups/communities not in work or with
insufficient work to fulfil their needs
6. disaster preparedness and management programmes and policies.
This section provides information about a range of social assistance programmes intended
to protect individuals against the risks identified in Chapter 1. These programmes, which
vary substantially in terms of expenditure and coverage, are implemented by a wide range
of institutions; in a number of cases, social protection is not their core mandate. A full
inventory of social assistance is provided in Annex 2.A.
Food assistance
Rice for the Poor: Rastra
Rastra (formerly Raskin) provides subsidised rice for the poor. The programme was
initiated in 1998 to reduce the impact of the rise in food prices following the Asian
Financial Crisis by reducing the burden on household food expenditure and stabilising the
price of rice. Rice accounts for almost one-quarter of poor households’ total average
monthly expenditure (Timmer, Hastuti and Sumarto, 2017[11]). The allocation of
subsidised rice was 15 kg per poor household per month in 2017, at a price of
approximately IDR 1 600 (USD 0.12) per kg.2
Households eligible for Rastra are registered in the UDB, although not all poor and
vulnerable households in the UDB receive Rastra. Since 2013, Rastra covered
15.5 million households, representing 62% of households in the UDB and about one-
quarter of all households in Indonesia (Timmer, Hastuti and Sumarto, 2017[11]). In 2017, a
reform was initiated to integrate Rastra with an electronic food voucher system, Bantuan
Pangan Non Tunai (BPNT).
Through the BPNT, households receive an electronic savings card to be used in E-
Warongs – shops appointed by the bank to sell food commodities to BPNT recipients via
Electronic Data Capture machines.3 In 2017, the GoI entered into an agreement with
Himpunan Bank Milik Negara (The Assemblage of State Owned Banks) to disburse
BPNT benefits. Every eligible household receives IDR 110 000 (USD 8.36) per month to
buy rice or sugar with the savings card. In 2017, the programme was implemented in
44 cities4 but had not been implemented in rural areas due to infrastructure constraints.
Approximately 1.2 million households benefited from the BPNT in 2017, with an
allocated budget of IDR 1.6 trillion (USD 0.12 billion) (Kusnaini, 2017[12]). In 2018, the
BPNT was expanded to 219 districts, covering 10.3 million households. The full

66 │ CHAPTER 2. SOCIAL PROTECTION COVERAGE
SOCIAL PROTECTION SYSTEM REVIEW OF INDONESIA © OECD 2019
integration of Rastra and BPNT is expected to be completed in 2019, with an expansion
to the remaining 295 districts and an additional 5.3 million households (TNP2K, 2018[13]).
Box 2.2. The Unified Database is the basis for a social assistance system
In 2005, the GoI began developing the Basis Data Terpadu untuk Program
Penanggulangan Kemiskinan (henceforth Unified Database, UDB), an electronic
database containing social, economic and demographic information. This was an
important first step in establishing the information architecture for social protection
and allows for a major scaling up of social assistance programmes
A Statistics Indonesia survey, the Pendataan Sosial Ekonomi (PSE; Socioeconomic
Data Collection), was the starting point for the UDB. The 2005 survey included
basic information on 19 million households in the bottom 30% of the income
distribution. Surveys conducted in 2008 and 2011 by the newly established Tim
Nasional Percepatan Penanggulangan Kemiskinan (TNP2K; National Team for the
Acceleration of Poverty Reduction of the Vice President’s Office) increased
coverage to 24.7 million households, representing the poorest 40% of the population,
or about 96.4 million individuals.
Initial categorisation of households involved 14 non-monetary variables to compute
a weighted welfare index. Subsequent rounds relied on a proxy means test to score
households, constantly improved to targeted outcomes. To improve the UDB’s
accuracy and enhance traction at a local level, an update in 2015, which surveyed
28 million households, involved public consultation forums with groups of around
20 villagers and community leaders to decide which households should continue
registered, be added and be dropped (World Bank, 2017[7]).
The UDB is the foundation for various programmes, including Beras Sejahtera
(Rastra, formerly Raskin; Rice for the Poor), JKN, Bantuan Siswa Miskin (BSM,
Cash Assistance to Poor Students), Program Keluarga Harapan (PKH; Family of
Hope Programme) and Smart Indonesia Programme, as well as local poverty
reduction programmes. PKH is the only programme to fully adopt the UDB to
generate quotas and determine eligibility, and to implement an update procedure.
TNP2K, BAPPENAS and the MoSA are currently piloting on-demand applications
to update the UDB to reduce exclusion errors (World Bank, 2017[7]).
The UDB is currently managed by an inter-ministerial working group lead by the
Ministry of Social Affairs, including TNP2K, Ministry of Planning, Coordinating
Ministry of Human Development and Culture, Ministry of Education, Ministry of
Health, Ministry of Home Affairs (Civil Registry), BPJS, the Central Bureau of
Statistics. The working group is organised around three main functions:
1. supporting access to and use of the UDB
2. developing, implementing and maintaining the infrastructure to ensure the
availability, security and integrity of UDB data
3. monitoring the use and evaluating the performance of the UDB for targeting,
as well as investing in research for continuous improvement of the system.

CHAPTER 2. SOCIAL PROTECTION COVERAGE │ 67
SOCIAL PROTECTION SYSTEM REVIEW OF INDONESIA © OECD 2019
Education
Assistance for Poor Students: Programme Indonesia Pintar (PIP)
In 2015, President Joko Widodo launched PIP, a collaboration between the Ministry of
Education and Culture (MoEC), MoSA and the Ministry of Religious Affairs (MoRA), as
an improvement over the previous Poor Student Assistance Programme (see PIP analysis
in Chapter 3). The MoEC implements PIP for elementary, junior and senior high school,
while the MoRA implements it for religion-based schools: Madrasah Ibtidayah
(elementary), Madrasah Tsanawiyah (junior high school) and Madrasah Aliyah (senior
high school).
PIP supports school-age children aged 6-21 through cash transfers to reduce education
expenses and thereby prevent dropout. In particular, it targets poor and vulnerable
households in the bottom quartile. Each eligible student receives a Kartu Indonesia Pintar
(KIP; Smart Indonesia Card). Students can register by bringing their Kartu Keluarga
Sejahtera (KKS, Family Welfare Card) to the nearest education facility or showing their
Surat Keterangan Tidak Mampu (SKTM, Certificate of Poverty) (Ministry of Education
and Culture, 2016[14]). Benefit levels range between IDR 450 000 to IDR 1 000 000 per
year, depending on the grade. Beneficiaries are encouraged to use these transfers for
school supplies, transport and fees. As of 2017, more than 18 million students had
benefited.
Student Scholarships: Bidikmisi
The GoI also provides scholarships, or Bidikmisi (Special Assistance for Students), for
study at general and religion-based universities to improve access for those with the
potential but not the means. The Ministry of Research, Technology and Higher Education
(MoRTHE) and MoRA implement Bidikmisi collaboratively. The MoRA implements
Bidikmisi for religion-based universities.
Cash transfers
Family of Hope Programme: Program Keluarga Harapan (PKH)
In 2007, the GoI launched PKH, the first conditional cash transfer programme in
Indonesia. Administered by the MoSA, it seeks to improve the quality of human capital
by providing cash transfers conditional on households accessing specified health and
education services. The PKH helps reduce the burden of household/family expenditure
for very poor households (the immediate consumption effect), while investing in future
generations through improved health and education (the human capital development
effect).
PKH provides a combination of short- and long-term assistance (Nazara and Rahayu,
2013[15]). As it encourages beneficiaries to access and use basic health, nutrition and
education services, it is expected to promote future generations’ opportunity and
productivity (World Bank, 2017[7]). In particular, PKH conditionalities consist of health
check-ups for pregnant women, newborns and toddlers, and school attendance for
children aged 6-18.
Beneficiaries are households in the UDB that rank below a certain poverty cut-off and
contain one of the following:
a pregnant or lactating woman

68 │ CHAPTER 2. SOCIAL PROTECTION COVERAGE
SOCIAL PROTECTION SYSTEM REVIEW OF INDONESIA © OECD 2019
at least one child under age 6
children aged 7-21 attending elementary or high school
children aged 16-21 who have not yet completed basic education
an older person age 70 or over not covered by other social assistance transfers, or a
person with a severe disability (new as of November 2016).
Beyond the cash transfer, PKH also provides Family Development Sessions through
monthly meetings targeting mothers. These information sessions aim in particular at
improving parenting skills, healthy behaviours, child protection, household financing and
productive economy, including saving behaviour, financial literacy and business advice.
PKH recipient households that are no longer categorised as poor, do not meet other
criteria or have received benefits for six years are no longer eligible and are considered to
have graduated from the programme. Households still qualifying after six years are
eligible for a three-year extension (transition period), after which they are considered to
have graduated from the programme and to have access to other social assistance
programmes, such as Kelompok Usaha Bersama (KUBE; Co-operative Business Groups),
discussed below.
As of 2016, the PKH was the third-largest CCT in the world, with a massive and rapid
scale-up in coverage, from 3.5 million families in 2015 to 6 million families (about 9% of
the population) by the end of 2016 and 10 million households in 2018 (World Bank,
2017[7]). PKH is among the largest social assistance programmes in Indonesia, estimated
to have cost IDR 8 964 billion (USD 681 million) in 2016, of which 89% was spent on
benefits (World Bank, 2017[7]).
Neglected Elderly Social Assistance: ASLUT
Under the Asistensi Sosial Lanjut Usia Terlantar (ASLUT), the GoI provides social
assistance for abandoned or neglected people age 70 and older (age 60 and older, if
bedridden) who do not have a regular income to fulfil basic needs and suffer from
sickness or are unable to perform daily activities. Beneficiaries are entitled to
IDR 200 000 (USD 15.2) per month. The programme helps caregivers meet beneficiaries’
basic needs and provides for other social rehabilitation services. In 2017, the GoI
allocated IDR 61.1 billion (USD 4.6 million) for approximately 30 000 beneficiaries.
To identify and determine beneficiaries, local/district social offices collect data, and
select and document potential beneficiaries and the waiting list. If beneficiaries die, move
out or no longer fulfil the criteria, the programme assistant sends an update and details of
the beneficiary replacement to the Direktorat Rehabilitasi Sosial Lanjut Usia (Directorate
of Elderly Social Rehabilitation). Every beneficiary is given an ASLUT ID Card with
information their bank account, name, age, sex and address.
Co-operative Business Groups: KUBE
KUBE was designed as a strategy for still-poor households graduating from the PKH
after six years. Following a recertification process, these households are granted an
additional three years of transfers, complemented by additional livelihood and support
from programmes like KUBE (a follow-up to the Family Development Sessions) to set up
sustainable businesses.
KUBE assists households in building a sustainable path out of poverty during a three-year
transition period, providing necessary supports to develop or participate in economically

CHAPTER 2. SOCIAL PROTECTION COVERAGE │ 69
SOCIAL PROTECTION SYSTEM REVIEW OF INDONESIA © OECD 2019
productive activities through cash or in-kind transfers. The programme encourages the
creation of group-based microbusinesses by providing capital to groups of seven to ten
people from poor households, along with entrepreneurship and business training (World
Bank, 2017[7]). Around 20 000 KUBE-PKH groups received grants of up to
IDR 20 million (USD 2 000) in 2015 (World Bank, 2017[7]). Recent developments
include continued web-based training for PKH facilitators to better support beneficiaries
with business proposals and to manage the KUBE-PKH database monitoring their
business activities.
The Direktorat Penangan Fakir Miskin Perdesaan and the Direktoran Jenderal
Penanganan Fakir Miskin, Kemensos run KUBE. The MoSA administers and finances it
through the social assistance budget. In 2017, KUBE reaching 53 600 beneficiaries with a
budget of IDR 292 billion (Kusnaini, 2017[12]).
Empowerment of the Indigenous Community: Komunitas Adat Terpencil (KAT)
The GoI recognises 1 128 ethnic groups among its population of 250 million. Some
indigenous communities are characterised as KAT if they are geographically isolated.
The three-year programme improves access to essential services in these communities by
developing housing and providing a living allowance and essentials, such as clothing and
bedding. The MoSA implements the programme, investing in basic infrastructure,
including roads, transport and electricity, and improving access to information.
Every beneficiary household receives four components of assistance during the three
years:
1. residential quality improvement (provision of simple residence/houses)
2. environment facilities (provision of toilets, worship/prayer places, community
halls and lighting devices. Construction involves local people)
3. life insurance (to support a focus on mental health mentoring, motivation sessions
and other human resource development opportunities)
4. plant seeds, work equipment and household utensils (includes land certification).
In 2017, the GoI allocated IDR 94.9 million (USD 7.2 million) to 2 064 households with
limited access to basic social services, dependent on natural resources, marginalised in
rural or urban areas, located in the borders, coast or outer and remote islands (Kusnaini,
2017[12]).
Social Assistance for Children and Family Development
This programme provides social services and rehabilitation to fulfil children’s basic
needs, such as nutrition, care and schooling. Beneficiaries are children neglected or
abandoned, street children, children who commit crimes (juvenile delinquencies),
children with disabilities, and children who need special protection (including victims of
natural disasters).
In 2017, the GoI allocated IDR 63.8 million to 77 420 beneficiary children. The benefit is
up to IDR 1.1 million per year, consisting of IDR 200 000 for eligible children,
IDR 200 000 for parents of children with disabilities and children who need special
protection, and IDR 700 000 for meeting children’s basic and nutritional needs.
Benefits are disbursed to the organisation that files the application and manages the
child’s capacity-building activities. The Social Assistance Fund is transferred to the
Lembaga Kesejahteraan Sosial Anak (Child Social Welfare Institution), which submit a

70 │ CHAPTER 2. SOCIAL PROTECTION COVERAGE
SOCIAL PROTECTION SYSTEM REVIEW OF INDONESIA © OECD 2019
proposal for child and family development to the district- or city-level social office, along
with a statement of willingness to take care of the children and their families.
Social Assistance for the Severely Disabled: Asistensi Sosial Penyandang
Disabilitas Berat (ASPDB)
The ASPDB provides essential services to people with disabilities and those suffering
physical or mental deficiencies that limit their ability to conduct physical, spiritual or
social functions adequately. Direct cash transfers of IDR 300 000 per person per month
are provided only to caregivers or family members of people with severe disabilities to
maintain their health and meet their daily basic needs. In 2017, the GoI allocated
IDR 67.5 million to 22 500 beneficiaries.
To identify and determine beneficiaries, local or district social offices gather information
on the potential beneficiaries and their families, including name, address, type of
disability, household socio-economic profile, recipient ID number, full body picture
showing physical disability, copy of family registry card,5 copy of ASPDB recipient ID
document (if already registered), and copy of household head and guardian ID cards. The
MoSA receives information on the potential beneficiary from the community, non-
governmental and other grassroots organisations, and mass media selected and verified by
social offices at the district and province levels.
Rehabilitation and Social Assistance for Drug Addicts: Rehabilitasi dan
Perlindungan Sosial untuk Korban Penyalahgunaan Napza
This programme supports drug and alcohol addiction recovery – rehabilitating
beneficiaries to regain and enhance self-confidence, thereby encouraging and enabling
them to be more responsible for their lives – through “self-help groups”. The monetary
benefit is provided to social development centres and social care centres that conduct the
rehabilitation. The 2011 Annual Report of the Ministry of Social Welfare reported
4 810 drug addicts were rehabilitated under the programme for the drug addicts.
Beneficiaries increased to 14 394 in 2015.
Social Assistance for Socially Vulnerable People: Perlindungan Sosial untuk
Tuna Sosial
This programme targeted the socially vulnerable, such as juvenile delinquents, ex-
convicts, victims of drug abuse, the homeless, beggars, people living with HIV/AIDS,
transvestites and abandoned people with chronic diseases. It provides support to improve
their basic social services through activities that fulfil basic needs or increase social
institutions providing assistance and rehabilitation services. The programme assisted
7 967 in 2011 and 7 430 in 2015.
Stimulus Assistance for Housing: Bantuan Stimulan Perumahan Swadaya
(BSPS)
Through BSPS, the Ministry of Public Housing (MoPH) provides social assistance to
develop new housing, improve the quality of housing, or develop and improve the public
facilities, empowering low-income households to build or improve the quality of their
homes and ensure a secure dwelling.
BSPS is specifically targeted at low-income households in coastal, remote, natural
disaster-prone and slum areas. Assistance is directly transferred to eligible households

CHAPTER 2. SOCIAL PROTECTION COVERAGE │ 71
SOCIAL PROTECTION SYSTEM REVIEW OF INDONESIA © OECD 2019
through community-based institutions. In 2017, the BSPS budget reached IDR 1.8 trillion
(USD 139.6 million), covering 110 000 beneficiaries (Kusnaini, 2017[12]).
The MoPH provides other subsidies for public housing: Facility of House Financing, also
known as subsidy for mortgage loans; subsidy for bank interest; and subsidy for down
payment fee. To access these, beneficiaries must be Indonesian citizens (proved by
national ID Card), not own a house, never have received a government housing subsidy,
have a tax ID number, have proof of tax payment, have a monthly income not exceeding
IDR 4 million (USD 304.1) for a rumahtapak (ordinary house) or IDR 7 million
(USD 532.16) for rumahsusun (flat). Informal workers with uncertain monthly incomes
may pay daily or weekly instalments, in accordance with bank regulation.
Uninhabitable House Rehabilitation Programme: Rahabilitasi Rumah Tidak
Layak Huni (RS-RTLH)
This GoI programme provides social assistance for PKH beneficiaries and other poor
families with social welfare cards to improve their housing and sanitation facilities. The
MoSA implements the programme, which was estimated to cost
IDR 25 650 000 000 million (USD 1.9 million) in 2017, according to the budget (TNP2K,
forthcoming[16]).
Beneficiaries are poor households included in the UDB that meet the following criteria:
receives Rastra benefits or has a KKS, KIS or letter from head of village stating a
person or household is poor and eligible to receive SKTM assistance from head of
village over duty stamp or is registered in the PKH
has an ID Card or other ID and valid family identification card and/or
has a house on his/her own land, proved by certificate of ownership or other
documents.
Social insurance is leading systematisation of social protection
Social insurance in Indonesia has a much longer history than social assistance, with some
programmes pre-dating the New Order administration. Historically, public social
insurance consisted of four operators: ASKES (mandatory health insurance for civil
servants), TASPEN (mandatory old-age security defined benefit programme for civil
servants), ASABRI (mandatory old-age security defined benefit programme for the armed
forces) and JAMSOSTEK (mandatory retirement, work accident and death benefits for
formal workers in the private sector).
An overhaul of social insurance provision began with SJSN Law No. 40 of 2004, which
mandated universal social security coverage for all Indonesians, including health care,
work accident, old-age savings, pension and death. In particular, the law stipulates
entitlements for the entire labour force, including the gradual inclusion of informal
workers through a staircase approach, with non-contributory schemes for the poorest,
contributory schemes with nominal contributions for the self-employed and informal
workers, and statutory social security schemes with contributions set as a percentage of
wages for formal workers (Mukul, Zen and Dita, 2018[10]).
The SJSN Law mandated that social security should guarantee the fulfilment of basic
needs through an integrated and comprehensive system. Law No. 24 of 2011 and
Presidential Regulation No. 109 of 2013 provided the regulatory and policy framework
for systematisation (Government of Indonesia, 2011[17]; President of the Republic of

72 │ CHAPTER 2. SOCIAL PROTECTION COVERAGE
SOCIAL PROTECTION SYSTEM REVIEW OF INDONESIA © OECD 2019
Indonesia, 2013[18]). These established BPJS as the implementing agency of social
security and outlined the gradual stages of social security programme participation.
BPJS is responsible for specific areas of coverage through two management bodies:
(BPJS Health; health care coverage based on the ASKES operator) and BPJS Labour;
arising from a merger of TASPEN, ASABRI and JAMSOSTEK) (Mukul, Zen and Dita,
2018[10]). Dewan Jaminan Sosial Nasional (DJSN; National Social Security Board) is the
oversight body for BPJS Health and BPJS Labour.
Old-age and work accident programmes
Since July 2015, BPJS Labour has implemented all social security programmes for
employees and non-wage or informal workers (PBPU). Coverage has not increased at the
same rate as membership of JKN: at the end of 2018, there were 30.5 million members
(News Desk, The Jakarta Post, 2019[19]).
Prior to the 2015 reform, JAMSOSTEK administered benefits for private sector workers.
TASPEN remains the administrator of benefits for civil servants, while ASABRI
administered those for armed forces personnel. ASKES, TASPEN, ASABRI and
JAMSOSTEK were hampered by low investment returns, poor governance, limited
benefits and low coverage (Mukul, Zen and Dita, 2018[10]).
The Jaminan Pensiun (JP), created in 2014, is governed by the SJSN Law, Articles 39 to
42. It is compulsory insurance for workers in the formal private sector to help participants
and their dependents maintain a decent standard of living in case of loss of income due to
death, total permanent disability and retirement. It is run on a defined benefit basis, with
benefits paid either as an annuity (for those with at least 15 years of contribution) or a
lump sum (for those with less than 15 years of contribution. It acts as an old-age pension
and disability pension but also covers the family, including the contributor’s parents,
spouse and children. Employees and their employers pay contributions (1% and 2%,
respectively, to be increased over time to 8% total). PBPU contribute 3% of their income
(Mukul, Zen and Dita, 2018[10]).
The Jaminan Hari Tua (JHT; Old-Age Savings) provides a guarantee against social and
economic risks upon retirement, resignation, lay-off without active employment, or
permanent emigration from the territory of Indonesia. BPJS delivers the programme
under the SJSN law, and it is mandatory for all, including informal workers. For formal
workers, the employee contribution rate is 2% of wages and the employer rate is 3.7% of
wages. The contribution rate for informal workers is defined by the GoI.
JHT benefits are paid as a lump sum upon reaching retirement (minimum age 56 years),
the amount corresponding to the accumulated value of contributions plus investment
returns (guaranteed at the minimum of average time deposits rate of state-owned banks).
One-time partial withdrawal before retirement is allowed for individuals who have
contributed for ten years.
The Jaminan Kematian (JKM; Death Benefit) provides for participants upon the death of
their wives/husbands/children or for families upon the death of participants. It is paid to
heirs if participants die during the active period. This includes a lump-sum compensation,
periodic compensation, funeral expenses and scholarships for children. For wage or
formal workers (PPU), the premium is 0.30% of monthly wages while for non-wage
earners (PBPU), it is set at IDR 6 800 (Indonesian rupiah).

CHAPTER 2. SOCIAL PROTECTION COVERAGE │ 73
SOCIAL PROTECTION SYSTEM REVIEW OF INDONESIA © OECD 2019
Jaminan Kecelakaan Kerja (JKK; Occupational Accident Benefit) provides protection
against the risks of work-related accidents, including those incurred in transit to or from
work and illness caused by the working environment. Employers pay the premium, which
varies from 0.24% to 1.74% of the monthly wage, depending on the degree of risk of the
work. Beneficiaries receive both health treatment and a cash transfer paid to either the
affected worker or the family of those who suffer a severe disability.
PT Tabungan Asuransi Pegawai Negeri (PT TASPEN, Civil Servants Insurance Savings)
manages the JKK, Old-Age Security, Pension Insurance and JKM/Insurance for retired
government workers. Under these schemes, a retired civil servant receives a monthly
pension benefit and a lump-sum benefit at retirement age. In 2015, PT TASPEN had
4 402 391 participants, and total expenditure for claims and benefits was
IDR 11.15 million (PT TASPEN, 2016[20]). Participants consisted of civil servants from
the central government, civil servants in the autonomous region, state officials, state-
owned enterprise (SOE) participants, judges and veterans.
Both PT ASABRI and PT TASPEN are to be integrated within BPJS Labour by 2029
(Silaban, 2015[21]). However, this is not yet a plan for how this will occur.
Armed forces and police personnel are also covered by pension and old-age saving
benefits with additional occupational injuries benefits and life insurance. Asuransi
Angkatan Bersenjata Republik Indonesia (PT ASABRI) manages the savings and
insurance programmes for the armed forces. The retirement age for military personnel
varies depending on their level: age 53 for the lowest level (Tamtama) and age 58 for
officers (Perwira).6 PT ASABRI health insurance covered approximately 1.18 million
military and police personnel in 2015 and incurred expenditure of IDR 1.03 trillion.
Health insurance
While the right of all citizens to be physically, mentally and spiritually healthy was
included in the Basic Health Law of 1960, the greatest changes in the implementation of
the health care system have taken place since 2000, with the ambitious declaration in
2012 to achieve UHC by 2019. The legislative path to UHC has been marked by domestic
political concerns, decentralisation and the increasing importance of health services as an
electoral issue (Pisani, Maarten and Nugroho, 2017[22]).
Law No. 24 of 2011, which created BPJS Health, was a significant milestone towards
UHC. BPJS Health is a non-profit trust fund replacing the PT JAMSOSTEK, Jamkesmas
and PT ASKES schemes, which had been controversial and unpopular due to operational
dysfunctions, inaccurate targeting and issues in the supply of services (Pisani, Maarten
and Nugroho, 2017[22]). BPJS Health’s main mission is to implement JKN, in particular to
manage its membership, collect premium from contract providers and make direct
payments to providers. It also co-ordinates with BPJS Labour in cases of road traffic
injuries and work accidents.
BPJS Health operations started in January 2014 with 111.6 million members, a number
which quickly exceeded the roadmap goal of 121.6 million to reach 133.4 million at the
end of 2014. Coverage increased further, to 171.9 million at the end of 2016, and
203 million (75% of the population) in October 2018 (Agustina et al., 2019[23]). To
achieve UHC by the end of 2019, JKN would need to cover 257 million individuals,
making it the world’s largest UHC plan.
There are two main categories of JKN participant: non-contributory members registered
as Penerima Bayaran Iuran (PBI) and contributory members (non-PBI). PBI members are

74 │ CHAPTER 2. SOCIAL PROTECTION COVERAGE
SOCIAL PROTECTION SYSTEM REVIEW OF INDONESIA © OECD 2019
individuals identified as poor and near poor by the UDB who receive a 100% subsidy
from the GoI, which pays their premiums directly (Mahendradhata et al., 2017[24]). PBI
members receive a Kartu Indonesia Sehat (KIS; Healthy Indonesia Card).7 Total
beneficiaries increased from 86.4 million in 2-14 to 117 million in 2018 (including
members of locally run schemes).
Figure 2.1. JKN coverage and type of membership
Source: Dewan Jaminan Sosial Nasional, JKN (website), http://sismonev.djsn.go.id/kepesertaan/index.php
(accessed December 2018).
Non-PBI members consist of PPU, PBPU and non-workers (BP). PPU include civil
servants, military officers, police officers, government officials, government officials
with no civil servant status, private workers and workers not included in previous
categories but who receive wages, including foreigners who have been working in
Indonesia for at least six months. A great majority of these workers had health insurance
coverage prior BPJS Health implementation, for instance through PT ASKES and
PT JAMSOSTEK. Private sector PPU members contribute 4.5% of monthly wages to
JKN, with their employers contributing 0.5%; public sector PPU members contribute 2%
and their employers 3% (Mahendradhata et al., 2017[24]).
PBPU are those working without contract (or independent workers), including foreigners
who have been working in Indonesia for at least for six months, those with irregular
incomes, the self-employed and other individuals who were previously not covered by
health insurance but can, under JKN, voluntarily register themselves and their family
members. PBPU members can choose among three benefit packages, ranging from
IDR 30 000 per member per month for benefits in the third class ward to IDR 51 000 for
benefit services in the second class and IDR 80 000 for benefits in the first class ward
(Mahendradhata et al., 2017[24]).
BP are investors; employers; pension beneficiaries (retired civil servants, retired military
personnel, retired government officials, widowers or orphans of pension beneficiaries);
veterans; national independence heroes; widowers; orphans of veterans and national
independence heroes; and non-employees not included in previous categories but able to
pay the insurance premiums.
The social insurance premium was set at IDR 23 000 per person per month in 2017
(World Bank Group, 2016[25]). Both PBPU and BP are contributory members of JKN and,
2.0
11.6
18.6
46.1
21.7
BP (Non-workers)
PBPU (Non-wage employees)
PPU (Wage employees)
PBI (Poor and near poor)
Not in JKN

CHAPTER 2. SOCIAL PROTECTION COVERAGE │ 75
SOCIAL PROTECTION SYSTEM REVIEW OF INDONESIA © OECD 2019
as such, should pay monthly premiums. However, their contribution habits threaten the
system’s sustainability, as discussed in Chapter 4.
JKN benefits have been revised several times since initial regulation in 2013 by the
Ministry of Health (MoH). Packages stipulate benefits not covered (vs. those covered),
such as services that do not follow procedures, services in non-BPJS-contracted facilities,
services covered by the JKK, services abroad, disorders caused by drug or alcohol
addiction, self-harm, traditional medicine, experimental procedures and disaster situations
(World Bank Group, 2016[25]).
While the expansion of JKN has allowed inclusion of poor and near-poor households in
national health insurance as PBI members, an issue arises among households with
workers who are not poor but may not be able to afford the premiums to be integrated as
PBPU members. Three-quarters of the top 60% of the income distribution work
informally and are ineligible as PBI but might face difficulties providing regular
contributions.
Segments of the population are thus left unprotected by both social assistance
programmes for the poorest households and social insurance programmes for workers
able to pay contributions. For example, only 52% of individuals aged between 20 and
35 years in the middle of the income distribution were registered with JKN in 2018 and
there are also notable gaps in coverage for children from birth up to the age of four
(Agustina et al., 2019[23]).
Labour market programmes are too small to increase productivity
The GoI’s vision for social protection involves empowering groups that are currently
poor or vulnerable to make a full contribution to Indonesia’s economy and share in its
prosperity. While social assistance is capable of promoting long-term human capital
development and breaking the inter-generational transmission of poverty, active labour-
market policies are also important, particularly in the short term, in increasing the skills
and productivity of poor, vulnerable and marginalised workers. However, such
programmes are currently implemented at relatively small scale, with small budget
allocations. Meanwhile, passive labour market policies are better established but
compliance with severance pay and minimum wages is uneven.
Active labour market policies
According to the Asian Development Bank, labour market programmes account for a
small fraction of Indonesia’s social protection expenditure. In 2012, Indonesia had a
Social Protection Index of 0.03 for labour market programmes: expenditure on such
programmes averaged over all potential beneficiaries represented only 3% of per capita
overall poverty line expenditure (ADB, 2013[26]).
Active labour market programmes are primarily implemented by the Ministry of
Manpower, MoEC and Ministry of Agriculture (MoA). The main labour market
programme is the Life Skills Education Programme (LSEP), administered by the MoE
and funded by the Social Assistance Fund. This programme has two components:
Assistance for Community Life Skills Programme and Community Entrepreneurship
Education. The LSEP helps dropouts, the unemployed and the poor acquire competitive
and improved work skills and secure entrepreneurship opportunities.

76 │ CHAPTER 2. SOCIAL PROTECTION COVERAGE
SOCIAL PROTECTION SYSTEM REVIEW OF INDONESIA © OECD 2019
Beneficiaries include the following individuals:
aged 16-40, especially KIP holders
aged 16-21 with KKS
dropped out of school or not continuing studies (including those attending school
equalisation programmes, except for vocation school equalisation programme) and
never joined similar programmes
not attending an education programme or similar training funded by the state or
provincial budgets
willing to follow an education programme and develop incubator businesses.
Indonesia does not implement a national-level public works programme. However, some
90% of financing from the Village Funds is allocated to small-scale local infrastructure
projects (mostly road building), meaning that they have a strong public works rationale.
The extent to which they can be classified as social protection programmes varies,
however, with some villages placing much more emphasis on employing unemployed
individuals (especially youths) that others (Gama, Saget and Elsheikhi, 2018[27]).
The significant expansion of the Village Funds recalls the Program Nasional
Pemberdayaan Mandiri (PNPM, Community Empowerment Programme) established by
the administration of former president Yudhoyono in 2006 to accelerate the decline in
poverty and promote equality. The PNPM, implemented by the Ministry of Home Affairs
on a nationwide basis, built on the successes of the Kecamatan Development Programme
and the Urban Poverty Project.
The PNPM was aimed at reducing poverty and addressing broader measures of
deprivation through community-driven development. Projects were chosen through a
participatory process, with a particular emphasis on improving local infrastructure and
increasing access to social services, particularly health and education. Micro-credits were
also made available to some 30 000 groups (World Bank, 2012[28]; Centre for Public
Impact, 2017[29]).
The PNPM was found to be effective at reducing poverty, especially in poor sub-districts,
but did not benefit groups that were marginalised for other reasons. It also increased
employment and use of health services (including immunisations and ante-natal visits)
but had little impact on school enrolment. It is notable that communities considered the
programme to be for the community as a whole rather than for poor, vulnerable or
marginalised households (World Bank, 2012[28]).
The PNPM’s success has clearly been a driving force behind the Village Funds
programme, which has sought to reinforce community ownership and strengthen village-
level governance structures. The World Bank has proposed that Indonesia implement a
public works programme as part of a shock-responsive social protection system but at
present this doesn’t appear to be under consideration.
Passive labour market policies
Passive labour market programmes are prominent in the social protection landscape.
Indonesia does not operate an unemployment insurance fund but workers who lose their
jobs are, in theory, protected by a system of severance pay. Current severance pay
regulations were established by Law No. 13 of 2003 on Manpower, which increased the
level of payment that employers were required to make from previous levels.

CHAPTER 2. SOCIAL PROTECTION COVERAGE │ 77
SOCIAL PROTECTION SYSTEM REVIEW OF INDONESIA © OECD 2019
Under the 2003 legislation, three forms of benefit exist for workers who leave a job:
severance pay, a reward for working time and a compensation fee. Eligibility for the
different benefits depends on the reason for leaving a job, and the total benefit varies by
years of service, as well as whether a worker contributed to a private pension arrangement
(ILO, 2017[30]). As a result of this dispensation, severance pay rates are significantly
higher in Indonesia than elsewhere in the region; after 20 years if service, employees
might be eligible for a lump-sum payment equivalent to 30 months’ salary.
Employers, who are responsible for making these payments, complain that severance pay
imposes a significant cost and impacts heavily on their ability to hire or dismiss workers.
This was a particularly contentious issue during the Global Financial Crisis and is likely
to remain important as Indonesia’s labour market confronts the impact of the Fourth
Industrial Revolution.
However, the impact of severance pay arrangements on the efficient functioning of the
labour market is diminished by low compliance rates. The World Bank (2012[31]) finds
that “approximately one-third of legally-eligible employees actually receive severance
pay after a job separation. On average, the ratio of the severance pay received to the
legally-entitled amount is below 40%. The product of these two ratios yields a wage-loss
protection share of between 10% to 14% of eligible severed workers’ monthly wages.”
A strategy of non-compliance might be advantageous for the functioning of the labour
market, but the World Bank report shows that the most vulnerable workers are also the
least likely to receive the severance pay to which they are entitled. Moreover, a system
that inculcates a culture of non-compliance can also have knock-on effects for other
regulations, including social insurance enrolment and even tax compliance
Recent reforms to the JHT have heightened the need to revisit severance pay
arrangements. Under the previous dispensation, workers were allowed to withdraw funds
from their provident fund whenever they lost their job. A reform in 2015 tightened up the
rules on withdrawals to ensure that workers have a reasonable amount in their account
when they reach retirement but this was swiftly reversed (ILO, 2017[30]).
Given the malfunctioning of the severance pay system, the GoI should consider the
possibility of implementing a system of unemployment insurance. This is important not
only for protecting workers’ welfare but also for maintaining aggregate demand. In the
absence of such an arrangement, Indonesia’s social protection is highly pro-cyclical,
constraining its capacity to support incomes during an economic downturn.
Since the 1970s, Indonesia has also implemented a system of minimum wages. The level
of the minimum wage varies by province to take into account different costs of living
across the country; under the labour legislation of 2003, the minimum wage is intended to
provide an adequate standard of living for a single worker. (OECD, 2018[32]) found that
the minimum wage is equivalent to around 90% of the median wage, which is high
relative both to countries at a similar income level and OECD countries. This study finds
that young workers are most likely to be disadvantaged by the high minimum wage.

78 │ CHAPTER 2. SOCIAL PROTECTION COVERAGE
SOCIAL PROTECTION SYSTEM REVIEW OF INDONESIA © OECD 2019
The impact of minimum wages on Indonesian firms in the manufacturing sector has been
shown to vary by size, causing a reduction in formal employment in firms that are small,
labour-intensive and low-skilled but not in large firms (Del Carpio, Nguyen and Wang,
2012[33]). In other sectors, the minimum wage often does not hold, resulting in some 40% of
the workforce receiving a salary at or above the minimum wage in 2015 (BAPPENAS,
2014[34]).
The recent changes to social insurance and the looming disruption associated with
Industry 4.0 make a review of severance pay and minimum wages timely. (OECD,
2018[32]) proposes that the GoI pilot lower levels of employment protection and
discounted minimum wages for youths working in special economic zones, with close
monitoring of the results.
Gaps in social protection reflect structural constraints to Indonesia´s development
This Chapter concludes by assessing whether there exist obvious gaps in legal or de jure
coverage of social protection, that is to say whether individuals are protected against the
risks identified in Chapter 1. This is not the same as effective (or de facto) coverage of
social protection, which will be examined (for the largest programmes) in Chapter 3.
The analysis in this chapter (and the inventory below) indicates that Indonesia’s social
protection system comprises programmes that cover many of the risks and vulnerabilities
identified in Chapter 1, through a combination of social assistance, social insurance and
active labour market policies. However, the large number of programmes, and the large
number of institutions with responsibility for implementing them, has generated
fragmentation and duplication which undermine the system’s effectiveness. This
inefficiency is a particular concern given the low levels of financing for social protection,
discussed in Chapter 4.
Nonetheless, there are some notable gaps in provision, particularly in three key areas:
early childhood development (ECD), programmes for youths not in education,
employment or training (NEET) and social assistance for the elderly. Each represents a
different challenge for social protection planners.
For example, ECD programmes require a combination of health, education, welfare
services and income support (Britto et al., 2017[35]), not to mention physical infrastructure
such as clinics and childcare facilities. This demands a degree of co-ordination between
different line ministries that is hard enough in itself; it also requires vertical coherence
between central and local government to ensure services meet required standards. Both
Indonesia’s size and its high level of decentralisation militate against such coherence.
The challenge facing programmes for youths NEET is also, to an extent, one of co-
ordination. Indonesia has one of the highest rates of upper secondary school students
enrolled in vocational education and training (VET): 45% in 2015, versus 20% in 2005
(Asian Development Bank, 2018[36]). To ensure students receive the skills they need to
meet the needs of the economy, MoEC needs to work in close collaboration with the
Ministry of Manpower, as well as engagement from employers (OECD, 2018[32]).

CHAPTER 2. SOCIAL PROTECTION COVERAGE │ 79
SOCIAL PROTECTION SYSTEM REVIEW OF INDONESIA © OECD 2019
To make sure that students from poor families stay in school up to upper secondary level
would requires an even stronger policy push and additional expenditure. Indonesia’s
demographics make financing a particular challenge greater still: 17.2% of the population
was aged between 15 and 24 in 2015, representing enormous potential demand for
training (UNDESA, 2017[37]). However, it is also important to note that the
unemployment rate for individuals aged 25-34 who have completed secondary education
is almost as high as for those who did not reach upper secondary education (OECD,
2018[32]); the return on education might simply not be sufficiently obvious to students or
their families to warrant the investment.
Cultural factors play a large role in the lack of social assistance provision for the elderly:
families are expected to look after elderly relatives, without their having to rely on public
support. Nonetheless, these attitudes are being tested by large-scale internal migration
(often to cities), which results in elderly relatives being left behind as their children
pursue better economic opportunities (Priebe and Howell, 2014[38]). In the future,
demographic trends mean that the number of elderly relative to the size of the working
age population will increase, placing further strain on such arrangements.
In addition to these structural deficiencies in the social protection system, Indonesia is
also reacting more slowly to the potential of shock-responsive social protection
mechanisms than some of its neighbours, such as the Philippines (World Bank, 2018[39]).
Faced with a high risk of natural disasters, Indonesia lacks adequate shock response or
protective programmes for poor and vulnerable households to prevent them from falling
into poverty in the event of shocks (Perdana, 2014[2]). However, the UDB will be a huge
asset if and when Indonesia sets about addressing the situation.
Finally, a shortcoming that cuts across the social protection system is its failure to address
systemic gender inequalities. Besides maternal health and maternal leave, Indonesia does
not have programmes specifically targeting women’s empowerment. As a consequence,
women are more at-risk from poverty across their lives. Moreover, Indonesia is not
maximising the economic and social potential of a huge part of the population, implying a
major constraint to the GoI’s objective of sustained, robust and inclusive growth.
Notes
1 This allocation is regulated under the Ministry of Finance Decrees No. 81 of 2012, No. 254 of
2015 and No. 228 of 2016.
2 Coordinating Ministry of Human Development and Culture (CMoHDC), Technical Guidelines of
Rastra, 2017.
3 Electronic Data Capture machines allow merchants to accept and process credit and debit card
transactions.
4 In-depth interview with the Deputy Assistance of Social Compensation in the CMoHDC, Jakarta,
May 2017.
5 A national family identification card with a family ID number.
6 2004 Law No. 34 on Indonesia’s Tentara Nasional Indonesia (armed forces).
7 KIS holders consist of PBI members, the homeless, people with disabilities and Penyandang
Masalah Kesejahteraan Sosial (people with social welfare problems).

80 │ CHAPTER 2. SOCIAL PROTECTION COVERAGE
SOCIAL PROTECTION SYSTEM REVIEW OF INDONESIA © OECD 2019
References
ADB (2013), Social Protection Index, Asian Development Bank, Manila,
http://hdl.handle.net/11540/79.
[26]
Adioetomo, S., F. Aninditya and D. Radjiman (2016), Country Social Protection Indicator (SPI)
at a Glance: Indonesia, Asian Development Bank.
[6]
Adioetomo, S., E. Pardede and Q. Quarina (2012), Republic of Indonesia: Updating and
Improving the Social Protection Index, Asian Development Bank.
[5]
Agustina, R. et al. (2019), “Universal health coverage in Indonesia: concept, progress, and
challenges”, The Lancet, Vol. 393/10166, pp. 75-102, http://dx.doi.org/10.1016/S0140-
6736(18)31647-7.
[23]
BAPPENAS (2014), Rencana Pembangunan Jangka Menengah Nasional 2015-2019 [Medium
Term Development Plan RPJMN 2015-2019], Ministry of National Development Planning
(BAPPENAS), Government of the Republic of Indonesia, http://www.social-
protection.org/gimi/gess/RessourcePDF.action?ressource.ressourceId=50077 (accessed on
22 June 2018).
[34]
Bauer, A. and M. Thant (2010), Poverty and Sustainable Development in Asia Impacts and
Responses to the Global Economic Crisis, Asian Development Bank, Mandaluyong City,
http://www.adb.org (accessed on 7 March 2019).
[4]
Britto, P. et al. (2017), “Nurturing care: promoting early childhood development”, The Lancet,
Vol. 389/10064, pp. 91-102, http://dx.doi.org/10.1016/S0140-6736(16)31390-3.
[35]
Brusentsev, V., D. Newhouse and W. Vroman (2012), Severance pay compliance in Indonesia,
http://documents.worldbank.org/curated/en/696971468267608690/Severance-pay-
compliance-in-Indonesia (accessed on 30 January 2019).
[31]
Centre for Public Impact (2017), Case Study: Indonesia’s Programme for Community
Empowerment (PNPM), https://www.centreforpublicimpact.org/case-study/indonesias-
programme-community-empowerment-pnpm/ (accessed on 30 January 2019).
[29]
Del Carpio, X., H. Nguyen and L. Wang (2012), Does the Minimum Wage Affect Employment?
Evidence from the Manufacturing Sector in Indonesia, World Bank, Washington DC,
http://econ.worldbank.org. (accessed on 30 January 2019).
[33]
Edimon Ginting, Christopher Manning, A. (ed.) (2018), Indonesia: Enhancing Productivity
through Quality Jobs, Asian Development Bank, Manila, http://dx.doi.org/10.22617.
[36]
Gama, A., C. Saget and A. Elsheikhi (2018), Labour Market Inventory ASEAN 2010-15: Labour
market policy in an age of increasing economic integration, International Labour
Organization, Geneva, https://www.ilo.org/global/research/WCMS_650064/lang--
en/index.htm (accessed on 30 January 2019).
[27]

CHAPTER 2. SOCIAL PROTECTION COVERAGE │ 81
SOCIAL PROTECTION SYSTEM REVIEW OF INDONESIA © OECD 2019
Government of Indonesia (2011), Law of the Republic of Indonesia N°24 in 2011 on the
Implementing Agency of Social Security, President of the Republic of Indonesia, Jakarta,
http://www.flevin.com/id/lgso/translations/Laws/Law%20No.%2024%20of%202011%20on%
20Implementing%20Agency%20of%20Social%20Security%20(MoF).pdf (accessed on
8 March 2019).
[17]
ILO (2017), Actuarial Study on the Reform of the Indonesian BPJS Ketenagakerjaan,
International Labour Organization, Jakarta Office, http://www.ilo.org/publns.
[30]
Jellema, J. and N. Hassan (2012), “Protecting poor and vulnerable households in Indonesia :
Main report”, in Public Expenditure Review (PER), World Bank, Washington, DC,
http://documents.worldbank.org/curated/en/459361468044650535/Main-report.
[1]
Kusnaini, D. (2017), The Directorate of State Budget Formulation, Ministry of Finance,
Government of Indonesia.
[12]
Kwon, H. and W. Kim (2015), “The Evolution of Cash Transfers in Indonesia: Policy Transfer
and National Adaptation”, Asia & The Pacific Policy Studies, Vol. 2/Special Issue: Health
Policy Challenges in Asia and the Pacific, https://doi.org/10.1002/app5.83.
[8]
Mahendradhata, Y. et al. (2017), “The Republic of Indonesia Health System Review”, Health
systems in transition, Vol. 7/1,
http://apps.who.int/iris/bitstream/handle/10665/254716/9789290225164-
eng.pdf;jsessionid=53DE73ADCE1D371D3A132DF7AC4D59DB?sequence=1.
[24]
Ministry of Education and Culture (2016), Indonesian Smart Card Program FAQ,
http://indonesiapintar.kemdikbud.go.id/ (accessed on 6 December 2018).
[14]
Mukul, A., F. Zen and A. Dita (eds.) (2018), Social Protection Goals in East Asia Strategies and
Methods to Generate Fiscal Space, Routledge.
[10]
Nazara, S. and S. Rahayu (2013), “Program Keluarga Harapan (PKH): Indonesian Conditional
Cash Transfer Programme”, Research Brief, No. 42, International Policy Centre for Inclusive
Growth, http://www.tnp2k.go.id/images/uploads/downloads/IPCPolicyResearchBrief42.pdf.
[15]
News Desk, The Jakarta Post (2019), “BPJS Ketenagakerjaan records 30.5m participants in
December - Business -”, The Jakarta Post,
https://www.thejakartapost.com/news/2019/01/07/bpjs-ketenagakerjaan-records-30-5m-
participants-in-december.html (accessed on 30 January 2019).
[19]
OECD (2018), OECD Economic Surveys: Indonesia 2018, OECD Publishing, Paris,
https://dx.doi.org/10.1787/eco_surveys-idn-2018-en.
[32]
Perdana, A. (2014), “The Future of Social Welfare Programs in Indonesia: From Fossil-Fuel
Subsidies to Better Social Protection”, The International Institute for Sustainable
Development, https://www.iisd.org/gsi/sites/default/files/ffs_indonesia_briefing_welfare.pdf.
[2]
Pisani, E., O. Maarten and K. Nugroho (2017), “Indonesia’s road to universal health coverage: a
political journey”, Health Policy and Planning, Vol. 32/2, pp. 267-276,
https://academic.oup.com/heapol/article/32/2/267/2555434.
[22]

82 │ CHAPTER 2. SOCIAL PROTECTION COVERAGE
SOCIAL PROTECTION SYSTEM REVIEW OF INDONESIA © OECD 2019
President of the Republic of Indonesia (2013), Regulation of the President of the Republic of
Indonesia N°109 in 2013 concerning the Gradual Stages of Social Security Program
Participation, Government of Indonesia , Jakarta,
https://www.bpjsketenagakerjaan.go.id/assets/uploads/tiny_mce/Peraturan%20inggris/151220
15_110302_Perpres%20109%202013%20Penahapan.pdf (accessed on 8 March 2019).
[18]
Priebe, J. and F. Howell (2014), “Old Age Poverty in Indonesia Empirical Evidence and Policy
Options: A Role for Social Pensions i OLD-AGE POVERTY IN INDONESIA: Empirical
Evidence and Policy Options A Role for Social Pensions”, No. 07-2014, TNP2K,
http://www.tnp2k.go.id (accessed on 7 March 2019).
[38]
PT TASPEN (2016), Laporan Tahunan (Annual Report) 2015, PT TASPEN, Jakarta,
http://www.taspen.com/wp-content/uploads/2016/08/AR-Taspen-2015.pdf (accessed on
7 November 2018).
[20]
Silaban, R. (2015), The reform of social security in Indonesia, https://www.ituc-csi.org/the-
reform-of-social-security-in (accessed on 27 April 2018).
[21]
Sudarno, S. and S. Bazzi (2011), “Social Protection in Indonesia: Past Experiences and Lessons
for the Future”, https://mpra.ub.uni-muenchen.de/57893/1/MPRA_paper_57893.pdf.
[9]
Timmer, P., Hastuti and S. Sumarto (2017), “Evolution and Implementation of the Rastra
Program in Indonesia”, in Harold Alderman, Ugo Gentilini and Ruslan Yemtsov (eds.), The
1.5 Billion People Question: Food, Vouchers, or Cash Transfers, World Bank Group,
Washington, DC, http://dx.doi.org/10.1596/978-1-4648-1087-9.
[11]
TNP2K (2018), The Future of the Social Protection System in Indonesia: Social Protection for
All, The National Team for the Acceleration of Poverty Reduction, Jakarta.
[13]
TNP2K (forthcoming), Handbook of G2P Programmes in Indonesia 2017, Government of
Indonesia.
[16]
Tomsa, D., M. Mietzner and E. Aspinall (2015), The Yudhoyono presidency : Indonesia’s decade
of stability and stagnation, Institute of Southeast Asian Studies.
[3]
UNDESA (2017), World Population Prospects: The 2017 Revision, United Nations Department
of Economic and Social Affairs, New York,
http://un.org/en/development/desa/population/publications.
[37]
World Bank (2018), Republic of the Philippines Philippines: Social Protection Review and
Assessment, World Bank, Washington, http://www.copyright.com/. (accessed on
7 March 2019).
[39]
World Bank (2017), The Republic of Indonesia Social Assistance Reform Program, The World
Bank Social Protection and Labor Global Practice East Asia and Pacific Region,
http://documents.worldbank.org/curated/en/353221496152466944/pdf/Program-Appraisal-
Document-PAD-disclosable-version-P160665-2017-04-15-04202017.pdf.
[7]
World Bank (2012), History and Evolution of Social Assistance in Indonesia, World Bank,
Washington, DC, http://hdl.handle.net/10986/12259.
[28]

CHAPTER 2. SOCIAL PROTECTION COVERAGE │ 83
SOCIAL PROTECTION SYSTEM REVIEW OF INDONESIA © OECD 2019
World Bank Group (2016), Indonesia Health Financing System Assessment: Spend More, Right
and Better, World Bank Group, Washington, DC,
https://openknowledge.worldbank.org/handle/10986/25363.
[25]

84 │ CHAPTER 2. SOCIAL PROTECTION COVERAGE
SOCIAL PROTECTION SYSTEM REVIEW OF INDONESIA © OECD 2019
Annex 2.A. Detailed inventory of social protection programmes
Table 2.A.1. Inventory of social protection programmes
Programme Eligibility criteria Benefit Target/number of
beneficiaries
Budget/expenditure (IDR)
Budget/expenditure (USD)
Responsible ministry/agency
Old-Age Security Individuals who have lost income due to work inability, such as death, total and permanent disability, and retirement upon reaching age 55
Lump sum, based on employee’s total contribution plus interest
13 112 2832 (2015) 13 413 9013 (mid-2016)
16 754 000 000 0002 (2015)
18 610 000 000 0001 (2016)
1 214 498 007 1 385 084 847
Badan Pengelola Jaminan Sosial (BPJS) Labour, Tabungan Asuransi Pensiun (PT TASPEN), PT ASABRI
Death Benefit (JKM)
Survivors of participants who died due to non-work-related accidents
JKM and funeral costs 14 042 5922 (2015) 14 057 192 (mid-2016)
448 000 000 0002 (2015)
597 120 000 0001 (2016)
32 475 535 44 441 798
BPJS Labour, PT TASPEN, PT ASABRI
Occupational Accident Benefit (JKK)
Individuals who become ill or hurt because of their occupation
Benefits include transport, expenses for medical services, medications and disability
14 042 5922 (2015) 14 057 1923 (mid-2016)
627 000 000 0002 (2015)
833 440 000 0001 (2016)
45 451 250 62 030 366
BPJS Labour, PT TASPEN, PT ASABRI
Jaminan Pensiun (JP)
Formal workers who are registered and have paid the premium, where 2% of the premium is paid by the employer and 1% is paid by the employee
Either an annuity (15 years of contributions) or a lump sum (fewer than 15 years of contributions)
6 481 9832 (2015) 8 191 1133 (mid-2016)
36 000 000 0002 (2015)
15 760 000 0001 (2016)
2 679 369 1 172 968
BPJS Labour, PT TASPEN, PT ASABRI
Construction workers insurance (Jaminan Konstruksi)
Formal workers from construction companies who are registered and have paid the premium
JKK and JKM 4 946 4042 (2015) 2 000 000 0002 (2015) 144 980 BPJS Labour

CHAPTER 2. SOCIAL PROTECTION COVERAGE │ 85
SOCIAL PROTECTION SYSTEM REVIEW OF INDONESIA © OECD 2019
The informal/independent workers insurance/benefit
Informal workers who are registered and have paid the premium: 1% for work-related insurance, 2% for Death Benefit and IDR 6.800 per person per month
Old-Age Security, JKK and JKM
614 6332 (2015) 881 2333 (mid-2016)
22 000 000 0002 (2015)
15 000 000 0001 (2016)
1 594 781 1 116 404
BPJS Labour
Social insurance for the armed forces and police
Armed forces and police Insurance savings, hospitalisation, JKM, pension benefit
1 183 5365 (2015) 1 178 9986 (2016)
1 038 049 8445 (claim expenses 2015)
1 237 704 0006 (2016)
75 248 92 118
PT ASABRI
Savings and insurance for civil servants
Civil servants Basic and supporting examination, class 1 in-patient at public hospital, intensive treatment, diagnostic support, medical equipment and implant, surgery, blood transfusion and/or medical rehabilitation
11 195 8727 (2015) 11 154 280 00 (claim expenses 2015)
808 574 PT TASPEN
Neglected Elderly Social Assistance (ASLUT)
Poor individuals over age 60 who are ill and require assistance or are neglected
IDR 200 000 per person per month
30 00010 (2017) 61 100 000 0008 (2017) 4 644 975 Ministry of Social Affairs (MoSA)
Non-PBI (contributory JKN members)
Formal sector employee (PPU), self-registered members (PBPU) and employers (BP)
Free health care 69 275 8694 (2017) 67 247 884 000 0001 (total claim expenses for all contributory and non-contributory members 2016)
5 005 052 397 BPJS Health
Health insurance subsidies for the poor and near-poor, Penerima Bantuan Iuran [PBI] (non-contributory JKN members)
Households in the poorest 40% (poor and near poor)
Free health care in class III public hospitals
92.2 million4 (2017) 25 502 400 000 0008 (premium allocated for non-contributory,
MoF, 2017) 67 247 884 000 0001 (total claim expenses for PBI+NonPBI 2016)
1 938 756 272 5 005 052 397
Ministry of Health and BPJS Health
Rice for the Poor (Rastra formerly Raskin)
Below poverty line 15 kg of rice per household per month at 75% to 80% lower than market price
14.2 million households9 (2017)
19 787 100 000 0008 (2017) 1 504 264 862 Bulog (GoI logistic agency), co-ordinated by MoSA and Coordinating Ministry of Human Development and

86 │ CHAPTER 2. SOCIAL PROTECTION COVERAGE
SOCIAL PROTECTION SYSTEM REVIEW OF INDONESIA © OECD 2019
Culture (CMoHDC)
Non-cash Food Assistance10 (Bantuan Pangan Non Tunai [BPNT])
Households in the poorest 25% in 44 pilot cities
IDR 110 000 per household per month
1 432 408 households10 (2017)
1 596 000 000 0008 (2017) 121 331 914 MoSA
Assistance for Poor Students (Indonesian Smart Card [PIP])
Students from households in the poorest 25%
IDR 450 000 (elementary); IDR 750 000 (junior high); IDR 1 000 000 (senior high) per student per year
16 487 87211 (2017) 9 456 320 000 0008 (2017) 718 893 112 Ministry of Education and Culture (MoEC)
Assistance for Poor Students (PIP for Islamic-based school)
Students from households in the poorest 25%
IDR 450 000 (elementary/Madrasah Ibtidaiyah); IDR 750 000 (junior high/Madrasah Tsanawiyah); IDR 1 000 000 (senior high/Madrasah Aliyah) per student per year
1 576 41112 (2017) 1 223 820 000 0008 (2017) 93 037 859 Ministry of Religious Affairs (MoRA)
Student Special Assistance (Bidikmisi)
Students living in poor households (previous Indonesian Smart Card recipients) who have good academic potential
IDR 3 900 00 00 for living allowance and IDR 2 400 000 00 for education fees per student per semester
80 00013 (2017) 3 474 550 000 0008 (2017) 264 143 987 Ministry of Research, Technology and Higher Education (MoRTHE)
Student Special Assistance (Bidikmisi) for Islamic-based school
Students living in poor households (previous Indonesian Smart Card recipients) who have good academic potential
IDR 3 900 000 00 for living allowance and IDR 2 400 000 00 for education fees per student per semester
7 50012 (2017) 252 630 000 0008 (MoF, 2017) 19 205 565 MoRA
Family of Hope Programme (PKH)
Households in the poorest 8% (poorest of the poor)
IDR 1 890 000 per household per year
7 000 000 households10 (2017)
11 340 000 000 0008 (2017) 862 095 180 MoSA
Co-operative Business Groups (Kelompok Usaha Bersama [KUBE])
Poorest of the poor (previous PKH household recipients)
Stimulant aid to Co-operative Business Groups (sum depends on the businesses developed)
53 60010 (2017) 292 050 000 0008 (2017)
22 202 372 MoSA
Empowerment of Indigenous households in border Assistance for 1 721 households10 94 900 000 0008 (2017) 7 214 536 MoSA

CHAPTER 2. SOCIAL PROTECTION COVERAGE │ 87
SOCIAL PROTECTION SYSTEM REVIEW OF INDONESIA © OECD 2019
the Indigenous Community (Komunitas Adat Terpencil [KAT])
areas, underdeveloped regions, isolated areas and outer islands
improving housing and surrounding environment, and empowering the indigenous community in border areas, underdeveloped regions, isolated areas and outer islands
(2017)
Social Assistance for Children and Family Development (TEPAK)
Vulnerable children (neglected, abandoned, disabled, in jail, etc.)
IDR 1 100 000 per child/family per year
77 42010 children or parents (2017)
63 710 000 0008 (2017) 4 843 394 MoSA
Social Assistance for the Severely Disabled (ASPDB)
Individuals who have severe disabilities (aged 2-59)
IDR 300 000 per person per month
22 50010 (2017) 67 500 000 0008 (2017) 5 131 519 MoSA
Rehabilitation and Social Assistance for Drug Addicts
Drug and alcohol addicts in rehabilitation institutions
14 39410 (2015) 72 711 140 85010 (2015) 5 270 833 MoSA
Social Assistance for Socially Vulnerable
Basic social services 7 43010 (2015) 45 100 935 00010 (2015) 3 269 368 MoSA
Electricity subsidy Households that have 450 VA and 900 VA, based on Unified Databased
Subsidy for electricity tariff: IDR 1 043 per kWh per household (450 VA); IDR 875 per kWh per household (900 VA)
19.1 million households (450 VA); 6.54 million household (900 VA)17
(2017)
45 375 200 000 0008 (2017) 3 449 536 263 Ministry of Energy and Mineral Resources (MoEMR)
Liquid petroleum gas subsidy (LPG)
Households and small and medium-sized enterprises
Subsidy for liquid gas: IDR 17 750 per LPG tube
Number of beneficiaries will be selected from UDB February 2018
35 413 100 000 008 (2017) 2 692 192 489 MoEMR
Assistance for Energy-Saving Solar Lamps (Bantuan Penyediaan Lampu Tenaga
Households no connection to power lines located in border areas, underdeveloped regions, isolated areas and outer islands
Energy-saving solar lamp package
95 72917 packages (2017)
294 050 000 0008 ( 2017) 22 354 417 MoEMR

88 │ CHAPTER 2. SOCIAL PROTECTION COVERAGE
SOCIAL PROTECTION SYSTEM REVIEW OF INDONESIA © OECD 2019
Surya Hemat Energi [LTSHE])
Social Assistance for Improving Productivity of Poor People through improving housing and its public facilities (Rahabilitasi Rumah Tidak Layak Huni [RS-RTLH])
Poorest of poor households (PKH recipients) who have poor-quality houses and public facilities (water sanitation, personal hygiene facilities, etc.)
Cash transfer for improving housing conditions and sanitation facilities (sum depends on the condition)
1 000 households and 710 households in border areas, underdeveloped regions, isolated areas and outer islands10 (2017)
27 950 000 0008(2017) 2 124 829 MoSA
Stimulus Assistance for Housing (Bantuan Stimulan Perumahan Swadaya [BSPS])
Individual who do not have a house with minimum wage in provincial level
Assistance fund or raw materials for building or improving house
110 000 houses (2017)14 1 837 050 000 0008 (2017) 139 657 139 Ministry of Public Works and Public Housing (MoPWPH)
Liquidity Facility for Housing Mortgage (Fasilitas Likuiditas Pembiayaan Perumahan [FLPP])
Husband and wife workers (formal or informal) whose joint income is maximum IDR 4 000 000 to IDR 7 000 000 per month
120 00014 (2017) 3 100 000 000 0008 (2017) 235 669 758 MoPWPH
Subsidy for Bank Interest of Housing Mortgage (Subsidi Selisih Bunga [SSB])
Husband and wife workers (formal or informal) whose joint income is maximum IDR 4 000 000 to IDR 7 000 000 per month
5% of bank Interest for mortgage
225 00014 (2017) 3 702 600 000 0008 (2017) 281 480 918 MoPWPH
Subsidy for Mortgage Down Payment (Subsidi Bantuan Uang Muka [SBUM])
Husband and wife workers (formal or informal) whose joint income is maximum IDR 4 000 000 to IDR 7 000 000 per month
IDR 4 000 000 per person
550 00014 (2017) 1 112 000 000 0008 (2017) 84 537 023 MoPWPH
Subsidy for Farmers who have fewer than 3.6 million t urea, Ministry of Agriculture 31 153 400 000 00015 (2017) 2 368 359 434 MoA

CHAPTER 2. SOCIAL PROTECTION COVERAGE │ 89
SOCIAL PROTECTION SYSTEM REVIEW OF INDONESIA © OECD 2019
fertiliser 2 km2 of rice fields 800 000 t SP-36, 1 million t ZA and 895 000 t organic fertiliser per year at 50% to 75% lower than market price
(MoA) did not do any recapitulations on number of beneficiaries
Assistance for premium insurance for rice farmers (Bantuan Premi Asuransi Usaha Tani Padi [AUTP])
Farmers who have fewer than 2 km2 of rice fields
Premium of insurance, IDR 144 000 per km2 per planting season (72% from total premium)
500 00015 (2017) 147 360 000 0008 (2017) 11 202 676 MoA
Assistance for premium insurance for cow farmers (Bantuan Premi Asuransi Usaha Ternak Sapi [AUTS])
Cow farmers who have small-scale enterprises
Premium of insurance, IDR 160 000 per km2 per planting season (80% of total premium)
- 20 840 000 0008 (2017) 1 584 309 MoA
Assistance for premium insurance for fishermen (Bantuan Premi Asuransi Nelayan [BPAN])
Small-scale and traditional fishermen who are under age 65
Premium of insurance, IDR 175 000 per person per year
500 000 (2017) 87 500 000 000 (2017) 6 651 969 Ministry of Ocean and Fisheries Affaires
Assistance for premium insurance for small fish farmers (Bantuan Premi Asuransi bagi Pembudidaya IkanKecil [BPAPIK])
Fish farmers who have small-scale enterprises
Premium of insurance, IDR 450 000 per person per year
300 000 (2017) 135 000 000 00016 (2017) 10 263 038 Ministry of Ocean and Fisheries Affairs
Skills development for Sidoarjo mud flow disaster
Sidoarjo mud flow disaster victims in 12 villages (those who lost jobs, and children unable to study or
Skills development training
250 (2015) 757 812 650 (2015) 54 934 Badan Penanggulangan Lumpur Sidoarjo (BPLS; Sidoarjo Mud Flow
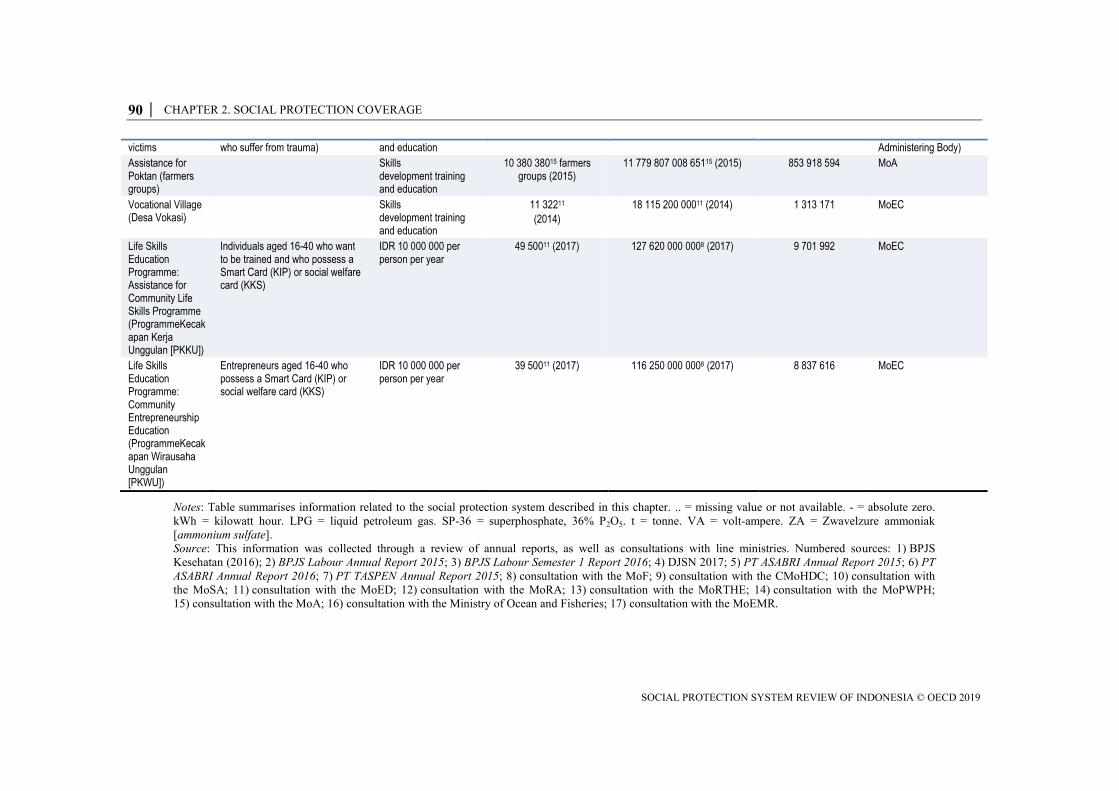
90 │ CHAPTER 2. SOCIAL PROTECTION COVERAGE
SOCIAL PROTECTION SYSTEM REVIEW OF INDONESIA © OECD 2019
victims who suffer from trauma) and education Administering Body)
Assistance for Poktan (farmers groups)
Skills development training and education
10 380 38015 farmers groups (2015)
11 779 807 008 65115 (2015) 853 918 594 MoA
Vocational Village (Desa Vokasi)
Skills development training and education
11 32211 (2014)
18 115 200 00011 (2014) 1 313 171 MoEC
Life Skills Education Programme: Assistance for Community Life Skills Programme (ProgrammeKecakapan Kerja Unggulan [PKKU])
Individuals aged 16-40 who want to be trained and who possess a Smart Card (KIP) or social welfare card (KKS)
IDR 10 000 000 per person per year
49 50011 (2017) 127 620 000 0008 (2017) 9 701 992 MoEC
Life Skills Education Programme: Community Entrepreneurship Education (ProgrammeKecakapan Wirausaha Unggulan [PKWU])
Entrepreneurs aged 16-40 who possess a Smart Card (KIP) or social welfare card (KKS)
IDR 10 000 000 per person per year
39 50011 (2017) 116 250 000 0008 (2017) 8 837 616 MoEC
Notes: Table summarises information related to the social protection system described in this chapter. .. = missing value or not available. - = absolute zero.
kWh = kilowatt hour. LPG = liquid petroleum gas. SP-36 = superphosphate, 36% P2O5. t = tonne. VA = volt-ampere. ZA = Zwavelzure ammoniak
[ammonium sulfate].
Source: This information was collected through a review of annual reports, as well as consultations with line ministries. Numbered sources: 1) BPJS
Kesehatan (2016); 2) BPJS Labour Annual Report 2015; 3) BPJS Labour Semester 1 Report 2016; 4) DJSN 2017; 5) PT ASABRI Annual Report 2015; 6) PT
ASABRI Annual Report 2016; 7) PT TASPEN Annual Report 2015; 8) consultation with the MoF; 9) consultation with the CMoHDC; 10) consultation with
the MoSA; 11) consultation with the MoED; 12) consultation with the MoRA; 13) consultation with the MoRTHE; 14) consultation with the MoPWPH;
15) consultation with the MoA; 16) consultation with the Ministry of Ocean and Fisheries; 17) consultation with the MoEMR.

CHAPTER 3. EFFECTIVENESS OF SOCIAL PROTECTION │ 91
SOCIAL PROTECTION SYSTEM REVIEW OF INDONESIA © OECD 2019
Chapter 3. Effectiveness of social protection
A selection of the programmes identified in Chapter 2 have emerged as central to
Indonesia’s strategies for reducing poverty and inequality and promoting inclusive
growth. This chapter examines the effectiveness of these key programmes: Rastra
(formerly Raskin; Rice for the Poor), Programme Indonesia Pintar (PIP; Assistance for
Poor Students), Penerima Bayaran Iuran (PBI; Social Health Insurance for the Poor and
Near Poor) and Program Keluarga Harapan (PKH; Family of Hope Programme). It
analyses their impact across four dimensions: coverage, adequacy, equity and efficiency.
This analysis is intended to inform the evolution of these programmes and support
appropriate allocation of resources across the social protection system. The chapter
concludes with a gender-based analysis of the pension system.

92 │ CHAPTER 3. EFFECTIVENESS OF SOCIAL PROTECTION
SOCIAL PROTECTION SYSTEM REVIEW OF INDONESIA © OECD 2019
The Government of Indonesia (GoI) has placed social protection at the centre of its
inclusive growth strategy. Social assistance represents the most direct means by which the
GoI can address persistent levels of poverty and high inequality. However, the extent to
which it fulfils this potential depends on the extent to which programmes reach the
intended beneficiaries, especially in the constrained financing environment discussed in
Chapter 4.
In recent years, it has scaled up four key non-contributory programmes outlined in
Chapter 2: Rastra, PKH, PBI and PIP. This chapter provides in-depth analysis of these
programmes’ coverage, adequacy, equity and efficiency, shedding light on their potential
to alleviate poverty, reduce inequality and protect vulnerable populations. A final section
focuses on social insurance and vulnerability in old age through a gender lens.
Rice for the Poor: Rastra
Rastra (formerly Raskin) emerged as a response to national food emergency linked to the
1997 Asian Financial Crisis. The subsidy to purchase rice, Indonesia’s food staple, was
subsequently expanded and integrated into the national social protection system. In its
non-crisis function, the subsidy aims to reduce low-income household food spending and
provide poor and near-poor households with access to rice (CMoHDC, 2017[1]),
strengthen food resilience and alleviate poverty (Rahayu, 2014[2]).
In 2017, rice had a market price of IDR 9 220 (Indonesian rupiah) per kg. By contrast,
Rastra households paid a fixed rate of IDR 1 600 per kg, nearly 80% below market price.
The GoI allocated approximately IDR 19 trillion to cover the difference between marked
and subsidised price for fiscal year 2017/18. Between 2011 and 2016, Rastra expenditure
amounted to 37.3% of government spending on its main social assistance programmes
(World Bank, 2017[3]). Although substantial, this marks a notable decrease, compared
with preceding years, as the programme is being integrated into the Bantuan Pangan Non
Tunai programme (BPNT; Non-cash Food Assistance) (see Chapter 2 overview.)
Coverage of Rastra
According to the 2016 Survei Sosial Ekonomi Nasional (SUSENAS; National Socio-
Economic Survey), an estimated 44.6% of the population reported being covered by
Rastra, making it the largest social assistance programme in Indonesia by far (Statistics
Indonesia, 2016[4]). Covering nearly half the population is a remarkable feat for any social
programme but notably so for a country with a population of 261 million and large
geographic disparity. As such, Rastra delivery procedures are complex and contend with
significant targeting challenges.
According to 2016 SUSENAS data, Rastra covers a larger proportion of the informally
employed (54.3%) and unemployed (49.5%), compared with the formally employed
(31.2%). It also reaches 41.1% of those excluded from Indonesia’s labour force
(Figure 3.1).

CHAPTER 3. EFFECTIVENESS OF SOCIAL PROTECTION │ 93
SOCIAL PROTECTION SYSTEM REVIEW OF INDONESIA © OECD 2019
Figure 3.1. A majority of informal and about half of unemployed individuals benefits from
Rastra
Rastra coverage by labour force status (2016)
Source: Authors’ calculations, based on Statistics Indonesia (2016[4]), SUSENAS
https://microdata.bps.go.id/mikrodata/index.php/catalog/769.
Targeting performance
Rastra aims to cover all households in the bottom 40% of households included in the
Unified Database (UDB (CMoHDC, 2017[1]). According to Tim Nasional Percepatan
Penanggulangan Kemiskinan (TNP2K; National Team for the Acceleration of Poverty
Reduction), 15.5 million households were eligible for Rastra in 2013. By 2017, eligible
households had declined to 14.2 million, largely due to budget reallocations to a
successor programme, BPNT (Figure 3.2).
Figure 3.2. Rastra coverage is declining
Rastra beneficiaries (2008-17)
Source: Authors’ calculations, based on Statistics Indonesia (2016[4]), SUSENAS,
https://microdata.bps.go.id/mikrodata/index.php/catalog/769.
0
10
20
30
40
50
60
Formally employed Informally employed Inactive Unemployed
% of population
17.5 17.5 17.5 17.5 17.5
15.5 15.5 15.5 15.5
14.2
10
11
12
13
14
15
16
17
18
19
2008 2009 2010 2011 2012 2013 2014 2015 2016 2017
Number of beneficiaries, million

94 │ CHAPTER 3. EFFECTIVENESS OF SOCIAL PROTECTION
SOCIAL PROTECTION SYSTEM REVIEW OF INDONESIA © OECD 2019
Adequacy of Rastra
Analysis of the adequacy of the Rastra benefit compares the subsidy’s generosity against
a number of socio-economic indicators, such as food adequacy, the extreme (or food)
poverty line (EPL), the national overall poverty line (OPL), the average household
consumption threshold and the poverty gap.
On average, per capita monthly rice consumption stands at 9.5 kg (38 kg for a four-
member household). By distributing 15 kg of rice to each household, Rastra contributed
39.5% to households’ total rice consumption, equivalent to IDR 108 975 per month or
IDR 1 307 700 per year (2016 prices) per household. Table 3.1 summarises benefit values
between 2014 and 2016 (Rahayu, 2014[2]).
Table 3.1. Rastra subsidies represent an increasing burden on government
Subsidy amount, GoI purchase price and household purchase price for rice (2014-16)
2014 2015 2016
Subsidy (IDR/kg) 6 447 6 725 7 265
Government purchase price (IDR/kg) 8 047 8 325 8 865
Household purchase price (IDR/kg) 1 600 1 600 1 600
Source: CMoHDC (2016).
Between 2014 and 2016, the benefit value decreased across multiple reference indicators,
pointing to a lower level of sufficiency. In 2016, the benefit accounted for 47.3% of
average rice consumption expenditure per capita but substantially lower shares of the
various subsistence levels: 9.6% of the EPL, 7.7% of the OPL and 2.9% of the average
household consumption per capita (Table 3.2).
Table 3.2. Rastra benefits represent a decreasing share of living standards
Rastra benefits as a share of selected living standards indicators (2014-16)
Year
Rastra benefits per capita relative to average rice consumption per capita
(monthly) (%)
Rastra benefits per capita relative to
EPL (%)
Rastra benefits per capita relative to
OPL (%)
Rastra benefits per capita relative to average household consumption
per capita (%)
2014 50.1 11.2 9.0 3.5
2015 45.4 10.3 8.2 3.1
2016 47.3 9.6 7.7 2.9
Source: Authors’ calculations, based on Statistics Indonesia (2016[4]), SUSENAS,
https://microdata.bps.go.id/mikrodata/index.php/catalog/769.
Rastra suffers from severe implementation shortcomings. There are, for instance,
substantial disparities between the value of the benefit reported by beneficiaries (reported
in the SUSENAS) and the total amount purchased by the government for distribution
(World Bank, 2017[3]). Survey respondents reported that, on average, the subsidised rate
for rice in 2016 was IDR 2 054/kg, in lieu of the promised IDR 1 600/kg. A single
household ought to have received rice to a total value of IDR 1 307 700 in 2016. Survey
data show that the average household received IDR 435 900 (World Bank, 2017[3]).1

CHAPTER 3. EFFECTIVENESS OF SOCIAL PROTECTION │ 95
SOCIAL PROTECTION SYSTEM REVIEW OF INDONESIA © OECD 2019
Inclusion error is also a concern that has been attributed to community-level decisions on
programme implementation. Using SUSENAS data, TNP2K-Mahkota estimates that in
2017, for example, Rastra benefited almost double the number of households on its
registration rolls (15.6 million registered households versus 28.6 million beneficiary
households) (TNP2K, 2018[5]). Discrepancies in the number of targeted versus actual
beneficiaries and rice rates are reportedly due to community leaders reduce perceived
inequality in distribution directives (TNP2K, 2018[5]; TNP2K, 2015[6]; Mawardi et al.,
2007[7]).
Despite widely reported issues with inclusion error, evaluations of programme impact on
nutrient consumption of poor households are largely positive. In 2012, it was estimated
that the savings associated with Rastra enrolment helped beneficiary households to
increase expenditure on food with higher nutritive value and health services
(Pangaribowo, 2012[8]). Kustianingrum and Terawaki (2018[9]) similarly find that Rastra
improves nutritious intake for poor households, by an average of 5.3 kcal per IDR 100 of
subsidy.
Equity of Rastra
Beneficiary incidence and distribution
Figure 3.3 shows the beneficiary incidence with the percentage of households covered in
each consumption decile. In rural areas, the programme covers over 60% of the bottom
five deciles. The programme demonstrates higher coverage of rural households than
urban and of poorer deciles than wealthier. Coverage is wide, but inclusion errors are
quite important under Rastra, particularly in rural areas. Coverage of wealthier deciles is
significantly higher in rural than in urban areas: 27% of the wealthiest decile in rural
areas benefits, compared with 2.4% in urban areas (Figure 3.3).
Figure 3.3. Rastra coverage is wide but inclusion errors are prominent in urban areas
Beneficiary incidence shown as share of each decile covered by Rastra (2016)
Source: Authors’ calculations, based on Statistics Indonesia (2016[4]), SUSENAS,
https://microdata.bps.go.id/mikrodata/index.php/catalog/769.
0
10
20
30
40
50
60
70
80
1st 2nd 3rd 4th 5th 6th 7th 8th 9th 10th
% of decile
Decile
Urban Rural Total

96 │ CHAPTER 3. EFFECTIVENESS OF SOCIAL PROTECTION
SOCIAL PROTECTION SYSTEM REVIEW OF INDONESIA © OECD 2019
Figure 3.4 depicts the distribution of beneficiaries across expenditure deciles. While a
higher share of beneficiaries belong to poorer deciles than wealthier deciles, a substantial
share of beneficiaries belong to the top seven deciles. The share of poor beneficiaries is
higher in urban areas, whereas the distribution is more uniform across deciles in rural
areas. In rural areas, households in the lowest decile are 2.6 times more likely to receive
the grant than those in the richest decile, compared with 32.1 times more likely in urban
areas. The lowest three deciles make up 45.7% of all beneficiaries.
Figure 3.4. Rastra beneficiary distribution displays important differences across rural and
urban areas
Share of total beneficiaries in each decile (2016)
Source: Authors’ calculations, based on Statistics Indonesia (2016[4]), SUSENAS,
https://microdata.bps.go.id/mikrodata/index.php/catalog/769.
Benefit incidence and distribution
Figure 3.5 depicts the percentage of total benefits received by expenditure decile. While
the tenth decile receives 2% of benefits, many deciles receive significant payouts. The
bottom two deciles receive about a third of all benefits disbursed; the poorest decile
receives 16% of total Rastra benefits.
0 10 20 30 40 50 60 70 80 90 100
Urban
Rural
Total
% of beneficiaries
Decile 1 Decile 2 Decile 3 Decile 4 Decile 5
Decile 6 Decile 7 Decile 8 Decile 9 Decile 10

CHAPTER 3. EFFECTIVENESS OF SOCIAL PROTECTION │ 97
SOCIAL PROTECTION SYSTEM REVIEW OF INDONESIA © OECD 2019
Figure 3.5. About one third of Rastra benefits are received by poorest quintile
Rastra benefits shown as share of total benefits in each decile (2016)
Source: Authors’ calculations, based on Statistics Indonesia (2016[4]), SUSENAS,
https://microdata.bps.go.id/mikrodata/index.php/catalog/769.
Efficiency of Rastra
Impact studies of Rastra and its predecessor, Raskin, on food consumption show several
positive results. A 2005 study found that the subsidy increased household consumption by
4.4%, while reducing the likelihood of falling below the overall poverty line by 3.8%
(Sumarto, Suryahadi and Widyanti, 2004[10]). Another study showed that the programme
helps beneficiaries smooth their food consumption and build resilience against economic
and environmental shocks (Pangaribowo, 2012[11]).
Rastra cost the GoI nearly IDR 16.9 trillion, or 0.014% of gross domestic product (GDP),
in 2016 and generated a 7.7% poverty headcount reduction, an 8.2% extreme poverty
headcount reduction, a 11.9% poverty gap reduction and a 21.8% extreme poverty gap
reduction (Table 3.3).
Table 3.3. Rastra significantly reduces poverty
Rastra cost and poverty impacts (2016)
Disbursed amount (IDR trillion and %
of GDP)
Poverty headcount reduction
Extreme poverty headcount reduction
Poverty gap reduction
(IDN million)
Extreme poverty gap reduction (IDN million)
17 2 340 996 745 422 2 829 571 980 854 0.014% 7.71% 8.15% 11.89% 21.76%
Source: Authors’ calculations, based on Statistics Indonesia (2016[4]), SUSENAS,
https://microdata.bps.go.id/mikrodata/index.php/catalog/769.
The programme’s efficiency is calculated as the ratio of the poverty gap reduction to the
programme cost, presented in percentages. The analysis depicts the change in the poverty
gap for every IDR 100 spent. With a poverty-reducing efficiency of approximately 16.8%
(i.e. for every IDR 100 spent, the poverty gap reduces by IDR 16.76) and an extreme
0 10 20 30 40 50 60 70 80 90 100
% of benefits
Decile 1 Decile 2 Decile 3 Decile 4 Decile 5
Decile 6 Decile 7 Decile 8 Decile 9 Decile 10

98 │ CHAPTER 3. EFFECTIVENESS OF SOCIAL PROTECTION
SOCIAL PROTECTION SYSTEM REVIEW OF INDONESIA © OECD 2019
poverty-reducing efficiency of 5.8%, Rastra demonstrates the lowest poverty reduction
cost efficiency across the four programmes analysed in this study.
Assistance for Poor Students: Programme Indonesia Pintar (PIP)
The GoI’s original Bantuan Siswa Miskin (BSM; Cash Assistance to Poor Students)
programme was developed in 2008 to complement the Bantuan Operasional Sekolah
(School Operational Assistance) programme, a school fee waiver for poor children. BSM
covers additional costs, such as books, uniforms, shoes or transport cost (TNP2K,
2014[12]). The combined programmes address supply-side financial constraints and
demand-side financial barriers to education to raise attendance (Larasati and Howell,
2014[13]). Recently, BSM was redesigned and implemented as PIP to include children
attending informal institutions.
The BSM has undergone many reforms since 2008, largely due to its moderate
performance. Based on a 2012 TNP2K study, targeting accuracy was low and suffered
from severe inclusion and exclusion errors: many non-poor households received BSM,
while some children from poor households did not. The study also confirmed timing
problems, especially disbursement delays (Larasati and Howell, 2014[13]).
Coverage of PIP
PIP coverage has significantly increased since 2013 for two main reasons. First, in 2012,
the GoI began using the UDB to target beneficiaries. The following years (2013-16) saw
a significant increase in beneficiaries, from an annual average of 6.6 million in 2008-12
to 16.9 million in 2013-16 (World Bank, 2017[3]). With this change and a general
expansion of the programme, PIP significantly boosted coverage and improved
performance. Second, the rise in recipients also reflects a 2015 redesign to include
informal education facilities, with a corresponding peak in coverage of 20 million
(Figure 3.6). Since 2015, beneficiary numbers have stagnated.
Figure 3.6. PIP coverage has risen strongly but is now steady
Number of PIP, million (2008-17)
Source: Authors’ calculations, based on Statistics Indonesia (2016[4]), SUSENAS,
https://microdata.bps.go.id/mikrodata/index.php/catalog/769.
0
5
10
15
20
25
2008 2009 2010 2011 2012 2013 2014 2015 2016 2017
Number of beneficiaries, million

CHAPTER 3. EFFECTIVENESS OF SOCIAL PROTECTION │ 99
SOCIAL PROTECTION SYSTEM REVIEW OF INDONESIA © OECD 2019
Adequacy of PIP
Analysis of the adequacy of PIP benefits compares their generosity against multiple
living standards indicators, such as education costs, the EPL, the OPL, the average
household consumption threshold and the poverty gap. Table 3.4 presents benefits by
education level before and after 2013.
Table 3.4. All PIP benefits increased after 2013
PIP benefits by education level (before and after 2013)
Category Before 2013 After 2013
Elementary school IDR 380 000 IDR 450 000
Junior high school IDR 550 000 IDR 750 000
Senior high school IDR 750 000 IDR 1 000 000
Source: World Bank (2017[3]).
Overall, benefit levels increased after 2013 due to the dissolution of Bahan Bakar Minyak
(fuel subsidies). Senior high school students received the largest transfer, followed by
junior high school and elementary school students, corresponding to increasing costs
associated with higher levels of education (Larasati and Howell, 2014[13]). Table 3.5
shows the value of benefits students receive relative to various subsistence standards.
Table 3.5. PIP benefits are relatively large
PIP benefit by education level as a share of selected living standards indicators (2016)
Category PIP benefits per capita relative to
EPL (%) PIP benefits per capita
relative to OPL (%) PIP benefits per capita relative to average
household consumption per capita (%)
Average 26.2 21.0 7.9
Elementary school 17.2 13.7 5.1
Junior high school 26.2 20.9 7.9
Senior high school 35.5 28.4 10.6
Source: Authors’ calculations, based on Statistics Indonesia (2016[4]), SUSENAS,
https://microdata.bps.go.id/mikrodata/index.php/catalog/769.
In 2016, the average PIP benefit was equivalent to 26.2% of the per capita EPL, 21.0% of
the per capita OPL and 7.9% of the average household consumption per capita. Benefits
provided to senior high school students were the most generous of the three categories,
representing 35.5% of the per capita EPL and 28.4% of the per capita OPL.
Equity of PIP
Beneficiary incidence and distribution
Like Rastra, PIP is programmed to benefit all households in the bottom two quintiles
listed in the UDB with school-age children. PIP covers almost one-third of the bottom
40% of households with school-age children (Figure 3.7). However, coverage among
non-targeted households is substantial. Similar to Rastra, rural households with children
are more likely to be covered, indicating that social assistance programmes focus strongly
on rural populations, which represent 63% of the total population. PIP covers 31% of the
poorest decile.

100 │ CHAPTER 3. EFFECTIVENESS OF SOCIAL PROTECTION
SOCIAL PROTECTION SYSTEM REVIEW OF INDONESIA © OECD 2019
Figure 3.7. PIP beneficiary incidence is pro-poor and much larger in rural areas
Share of each decile covered by PIP (2016)
Source: Authors’ calculations, based on Statistics Indonesia (2016[4]), SUSENAS,
https://microdata.bps.go.id/mikrodata/index.php/catalog/769.
Figure 3.8 shows the total number of beneficiaries distributed by expenditure decile. This
indicator reveals better targeting of urban than rural poor students: over 28% of urban PIP
recipients are in the poorest expenditure decile, compared with 17% in rural areas.
Figure 3.8. PIP beneficiaries are better targeted in urban areas
Share of total beneficiaries in each decile (2016)
Source: Authors’ calculations, based on Statistics Indonesia (2016[4]), SUSENAS,
https://microdata.bps.go.id/mikrodata/index.php/catalog/769.
Figure 3.9 illustrates coverage by decile for each education level. Coverage of senior high
school student benefits was somewhat lower than that of other categories among the
lower half of the distribution, reflecting lower enrolment rates.
0
5
10
15
20
25
30
35
1st 2nd 3rd 4th 5th 6th 7th 8th 9th 10th
% of decile
Decile
Urban Rural Total
0 10 20 30 40 50 60 70 80 90 100
Urban
Rural
Total
% of beneficiaries
Decile 1 Decile 2 Decile 3 Decile 4 Decile 5
Decile 6 Decile 7 Decile 8 Decile 9 Decile 10

CHAPTER 3. EFFECTIVENESS OF SOCIAL PROTECTION │ 101
SOCIAL PROTECTION SYSTEM REVIEW OF INDONESIA © OECD 2019
Figure 3.9. PIP incidence by type of benefit
Share of each decile covered by PIP by education level (2016)
Source: Authors’ calculations, based on Statistics Indonesia (2016[4]), SUSENAS,
https://microdata.bps.go.id/mikrodata/index.php/catalog/769.
Benefit distribution
Figure 3.10 shows benefit distribution by expenditure decile. Households in the poorest
three deciles receive approximately half of all PIP benefits.
Figure 3.10. The PIP benefit distribution is pro-poor
Share of total benefits in each decile (2016)
Source: Authors’ calculations, based on Statistics Indonesia (2016[4]), SUSENAS,
https://microdata.bps.go.id/mikrodata/index.php/catalog/769.
Figure 3.11 shows that the senior high school benefits are more skewed towards the richer
quintiles than the elementary and junior high school benefits.
0
5
10
15
20
25
30
35
40
45
1st 2nd 3rd 4th 5th 6th 7th 8th 9th 10th
Coverage, %
Decile
Primary school Junior secondary school Senior secondary school
0
5
10
15
20
25
1st 2nd 3rd 4th 5th 6th 7th 8th 9th 10th
% of benefits
Decile

102 │ CHAPTER 3. EFFECTIVENESS OF SOCIAL PROTECTION
SOCIAL PROTECTION SYSTEM REVIEW OF INDONESIA © OECD 2019
Figure 3.11. PIP benefit distribution varies across education levels
Share of total beneficiaries in each decile by education level (2016)
Source: Authors’ calculations, based on Statistics Indonesia (2016[4]), SUSENAS,
https://microdata.bps.go.id/mikrodata/index.php/catalog/769.
Efficiency of PIP
PIP cost the GoI 0.006% of GDP in 2016 and generated a 4.6% poverty headcount
reduction, 1.0% extreme poverty headcount reduction, 6.6% poverty gap reduction and a
13.7% extreme poverty gap reduction (Table 3.6).
Table 3.6. PIP is a cost-efficient tool to alleviate poverty
PIP cost and poverty impacts (2016)
Disbursed amount (IDR trillion and % of GDP)
Poverty headcount reduction
Extreme poverty headcount reduction
Poverty gap reduction (IDR million)
Extreme poverty gap reduction (IDR million)
7 1 354 955 85 981 1 489 081 559 194 0.01% 4.61% 1.01% 6.63% 13.68%
Source: Authors’ calculations, based on Statistics Indonesia (2016[4]), SUSENAS,
https://microdata.bps.go.id/mikrodata/index.php/catalog/769.
PIP’s poverty-reducing efficiency, measured by the change in the poverty gap for every
IDR 100 spent on the programme, is 20%; its extreme poverty-reducing efficiency is
7.5%. PIP is thus more cost efficient than Rastra for poverty alleviation purposes.
Social Health Insurance for the Poor and Near Poor: Penerima Bayaran Iuran
(PBI)
PBI was introduced in 2014 as a mandatory contributory scheme replacing Jaskemas, a
tax-funded health care fee-waiver programme. It is designed to respond to the high level
of out-of-pocket (OOP) expenditure and its impact on access to health services by the
poor (WHO, 2017[14]). It is a scheme for poor and near-poor members of the Jaminan
Kesehatan Nasional (JKN; the national health insurance programme) to protect them from
health care-related financial risks and commitments. As the GoI pays the premium for the
0 10 20 30 40 50 60 70 80 90 100
Elementary school
Junior high school
Senior high school
% of benefits
Decile 1 Decile 2 Decile 3 Decile 4 Decile 5
Decile 6 Decile 7 Decile 8 Decile 9 Decile 10

CHAPTER 3. EFFECTIVENESS OF SOCIAL PROTECTION │ 103
SOCIAL PROTECTION SYSTEM REVIEW OF INDONESIA © OECD 2019
poor and near poor, PBI can be considered a social assistance programme for those
households.
Coverage of PBI
In 2014, PBI covered 86.4 million people, of which 21.8 million were poor (Ernada,
2015[15]). Beneficiary numbers began to rise steadily in 2016 as a result of GoI efforts to
achieve universal health coverage, reaching 92.4 million in 2017(Figure 3.12).
PBI is commonly criticised for poor targeting. PBI mostly consists of Jamkesmas
members; however, Jamkesmas applied broader eligibility criteria than PBI (World Bank,
2017[3]). A fortiori, while PBI targeting uses the poorest 40% of households listed in the
UDB, Ministry of Health (MoH) staff determined eligibility for its predecessor scheme
locally, resulting in vast geographical differences, as well as serious inclusion and
exclusion errors (World Bank, 2017[3]). Additionally, only 55% of those covered by PBI
access the health services they need, raising concerns regarding awareness and insurance
literacy in the target population.
Figure 3.12. PBI coverage is rising
Number of PBI beneficiaries (million) (2008-18)
Source: Agustina, R et al. (2019[16]), “Universal health coverage in Indonesia: concept, progress, and
challenges”, The Lancet.
The 2016 SUSENAS data indicate that PBI covers approximately 25.4% of the formally
employed, 23.9% of the unemployed and 20.6% of those excluded from Indonesia’s
labour force (Figure 3.13). It reaches a comparatively lower share of the formally
employed (14.3%).
0
10
20
30
40
50
60
70
80
0
50
100
150
200
250
2013 January, 2014 January, 2015 January, 2016 April, 2017 October, 2018
% of populationPopulation, million
Subsidized group (LHS) Salary earners and formal workers (LHS)
Non-salaried earners and informal workers (LHS) NHIS coverage (RHS)
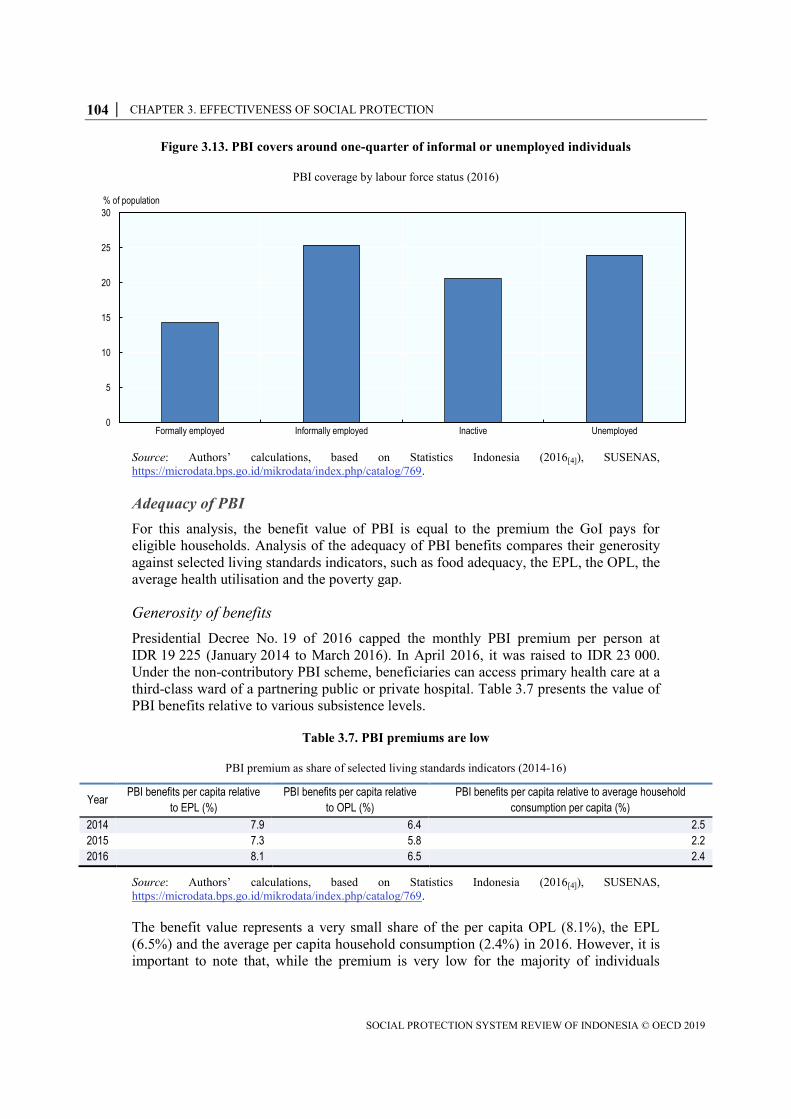
104 │ CHAPTER 3. EFFECTIVENESS OF SOCIAL PROTECTION
SOCIAL PROTECTION SYSTEM REVIEW OF INDONESIA © OECD 2019
Figure 3.13. PBI covers around one-quarter of informal or unemployed individuals
PBI coverage by labour force status (2016)
Source: Authors’ calculations, based on Statistics Indonesia (2016[4]), SUSENAS,
https://microdata.bps.go.id/mikrodata/index.php/catalog/769.
Adequacy of PBI
For this analysis, the benefit value of PBI is equal to the premium the GoI pays for
eligible households. Analysis of the adequacy of PBI benefits compares their generosity
against selected living standards indicators, such as food adequacy, the EPL, the OPL, the
average health utilisation and the poverty gap.
Generosity of benefits
Presidential Decree No. 19 of 2016 capped the monthly PBI premium per person at
IDR 19 225 (January 2014 to March 2016). In April 2016, it was raised to IDR 23 000.
Under the non-contributory PBI scheme, beneficiaries can access primary health care at a
third-class ward of a partnering public or private hospital. Table 3.7 presents the value of
PBI benefits relative to various subsistence levels.
Table 3.7. PBI premiums are low
PBI premium as share of selected living standards indicators (2014-16)
Year PBI benefits per capita relative
to EPL (%)
PBI benefits per capita relative
to OPL (%)
PBI benefits per capita relative to average household
consumption per capita (%)
2014 7.9 6.4 2.5
2015 7.3 5.8 2.2
2016 8.1 6.5 2.4
Source: Authors’ calculations, based on Statistics Indonesia (2016[4]), SUSENAS,
https://microdata.bps.go.id/mikrodata/index.php/catalog/769.
The benefit value represents a very small share of the per capita OPL (8.1%), the EPL
(6.5%) and the average per capita household consumption (2.4%) in 2016. However, it is
important to note that, while the premium is very low for the majority of individuals
0
5
10
15
20
25
30
Formally employed Informally employed Inactive Unemployed
% of population

CHAPTER 3. EFFECTIVENESS OF SOCIAL PROTECTION │ 105
SOCIAL PROTECTION SYSTEM REVIEW OF INDONESIA © OECD 2019
living in Java, it is far from affordable for residents of poor provinces, for instance the
eastern provinces (Zen and Dita, 2018[17]).
Although this analysis is based on the IDR 23 000 premium, Dewan Jaminan Sosial
Nasional (DJSN; National Social Security Board) and various health financing experts
have estimated a higher effective monthly cost: up to IDR 36 000 per person (Hidayat,
2015[18]).
Equity of PBI
This section draws on 2016 SUSENAS data to analyse the beneficiary incidence and
benefit distribution by decile.
Beneficiary incidence and distribution
Nearly half (44%) of those in the poorest decile and 35% in the second decile received
the PBI fee-waiver (Figure 3.14). Although the beneficiary incidence steadily declines for
richer deciles, almost 22% of those in the fifth decile claimed benefits.
Figure 3.14. PBI beneficiary incidence is pro-poor
Share of each decile covered by PBI (2016)
Source: Authors’ calculations, based on Statistics Indonesia (2016[4]), SUSENAS,
https://microdata.bps.go.id/mikrodata/index.php/catalog/769.
Urban PBI targeting is more pro-poor than rural targeting (Figure 3.15). The highest-to-
lowest decile coverage ratio is 15.3 in urban areas and 4.6 in rural areas. This means that,
in urban areas, the poorest households are 15 times more often covered than the richest,
expressing a high degree of pro-poor coverage.
0
5
10
15
20
25
30
35
40
45
50
1st 2nd 3rd 4th 5th 6th 7th 8th 9th 10th
% of decile
Decile
Urban Rural Total

106 │ CHAPTER 3. EFFECTIVENESS OF SOCIAL PROTECTION
SOCIAL PROTECTION SYSTEM REVIEW OF INDONESIA © OECD 2019
Figure 3.15. PBI beneficiary distribution is more pro-poor in urban areas
Share of total beneficiaries in each decile (2016)
Source: Authors’ calculations, based on Statistics Indonesia (2016[4]), SUSENAS,
https://microdata.bps.go.id/mikrodata/index.php/catalog/769.
Benefit distribution
Figure 3.16 shows the benefits distribution by decile. Households in the bottom two
deciles receive 36% of all benefits, while those in the richest receive 2% (Figure 3.16).
Figure 3.16. PBI benefit distribution
Share of total benefits in each decile (2016)
Source: Authors’ calculations, based on Statistics Indonesia (2016[4]), SUSENAS,
https://microdata.bps.go.id/mikrodata/index.php/catalog/769.
0
5
10
15
20
25
1st 2nd 3rd 4th 5th 6th 7th 8th 9th 10th
% of beneficiaries
Decile
Urban Rural Total
0
5
10
15
20
25
1st 2nd 3rd 4th 5th 6th 7th 8th 9th 10th
% of benefits
Decile
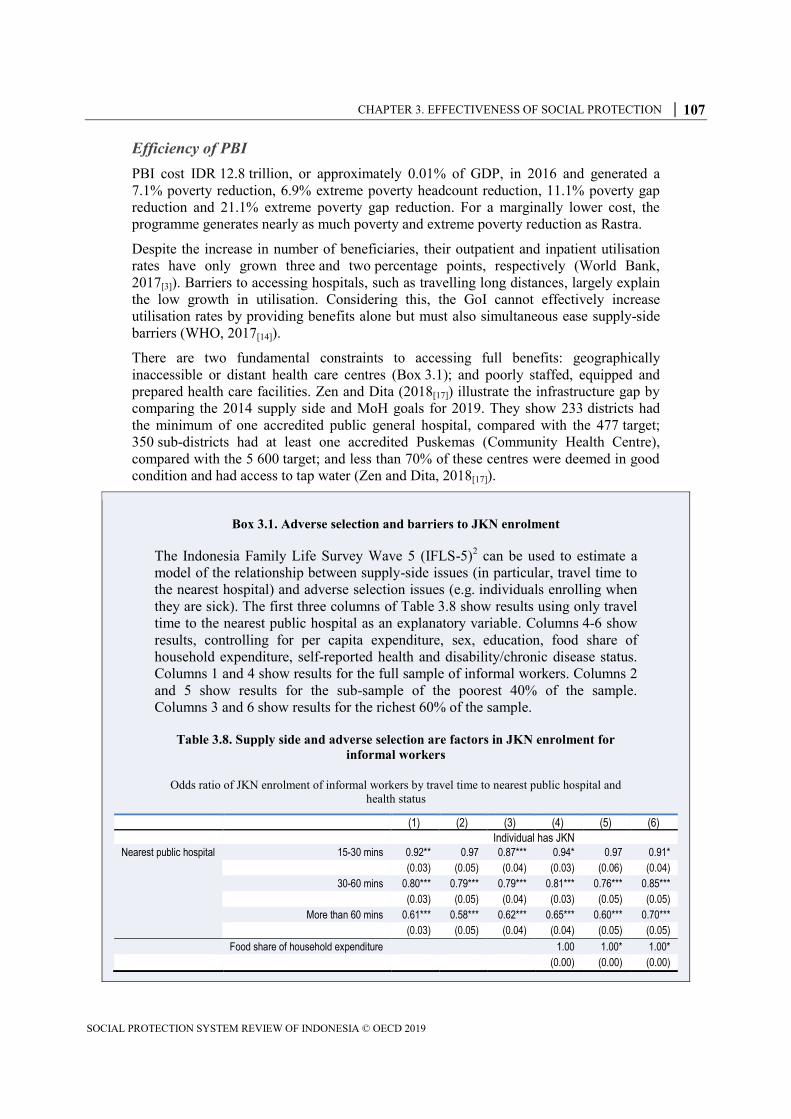
CHAPTER 3. EFFECTIVENESS OF SOCIAL PROTECTION │ 107
SOCIAL PROTECTION SYSTEM REVIEW OF INDONESIA © OECD 2019
Efficiency of PBI
PBI cost IDR 12.8 trillion, or approximately 0.01% of GDP, in 2016 and generated a
7.1% poverty reduction, 6.9% extreme poverty headcount reduction, 11.1% poverty gap
reduction and 21.1% extreme poverty gap reduction. For a marginally lower cost, the
programme generates nearly as much poverty and extreme poverty reduction as Rastra.
Despite the increase in number of beneficiaries, their outpatient and inpatient utilisation
rates have only grown three and two percentage points, respectively (World Bank,
2017[3]). Barriers to accessing hospitals, such as travelling long distances, largely explain
the low growth in utilisation. Considering this, the GoI cannot effectively increase
utilisation rates by providing benefits alone but must also simultaneous ease supply-side
barriers (WHO, 2017[14]).
There are two fundamental constraints to accessing full benefits: geographically
inaccessible or distant health care centres (Box 3.1); and poorly staffed, equipped and
prepared health care facilities. Zen and Dita (2018[17]) illustrate the infrastructure gap by
comparing the 2014 supply side and MoH goals for 2019. They show 233 districts had
the minimum of one accredited public general hospital, compared with the 477 target;
350 sub-districts had at least one accredited Puskemas (Community Health Centre),
compared with the 5 600 target; and less than 70% of these centres were deemed in good
condition and had access to tap water (Zen and Dita, 2018[17]).
Box 3.1. Adverse selection and barriers to JKN enrolment
The Indonesia Family Life Survey Wave 5 (IFLS-5)2 can be used to estimate a
model of the relationship between supply-side issues (in particular, travel time to
the nearest hospital) and adverse selection issues (e.g. individuals enrolling when
they are sick). The first three columns of Table 3.8 show results using only travel
time to the nearest public hospital as an explanatory variable. Columns 4-6 show
results, controlling for per capita expenditure, sex, education, food share of
household expenditure, self-reported health and disability/chronic disease status.
Columns 1 and 4 show results for the full sample of informal workers. Columns 2
and 5 show results for the sub-sample of the poorest 40% of the sample.
Columns 3 and 6 show results for the richest 60% of the sample.
Table 3.8. Supply side and adverse selection are factors in JKN enrolment for
informal workers
Odds ratio of JKN enrolment of informal workers by travel time to nearest public hospital and
health status
(1) (2) (3) (4) (5) (6)
Individual has JKN
Nearest public hospital 15-30 mins 0.92** 0.97 0.87*** 0.94* 0.97 0.91*
(0.03) (0.05) (0.04) (0.03) (0.06) (0.04)
30-60 mins 0.80*** 0.79*** 0.79*** 0.81*** 0.76*** 0.85***
(0.03) (0.05) (0.04) (0.03) (0.05) (0.05)
More than 60 mins 0.61*** 0.58*** 0.62*** 0.65*** 0.60*** 0.70***
(0.03) (0.05) (0.04) (0.04) (0.05) (0.05)
Food share of household expenditure 1.00 1.00* 1.00*
(0.00) (0.00) (0.00)

108 │ CHAPTER 3. EFFECTIVENESS OF SOCIAL PROTECTION
SOCIAL PROTECTION SYSTEM REVIEW OF INDONESIA © OECD 2019
Male 1.06*** 1.07*** 1.06***
(0.02) (0.03) (0.02)
Per capita expenditure 1.00*** 1.00*** 1.00
(0.00) (0.00) (0.00)
Education 0.95** 0.89*** 0.97
(0.02) (0.03) (0.03)
Self-reported health Somewhat healthy 1.10** 0.97 1.21***
(0.04) (0.06) (0.07)
Somewhat unhealthy 1.21*** 1.11 1.31***
(0.06) (0.08) (0.09)
Unhealthy 1.40** 1.63** 1.23
(0.21) (0.37) (0.25)
Some disability diagnosed 1.23*** 1.20** 1.24***
(0.07) (0.11) (0.08)
Mixed formal/informal household 1.93*** 1.18** 2.60***
(0.08) (0.08) (0.14)
Labour force status Informal Informal Informal Informal Informal Informal
Poorest 40% Yes Yes No Yes Yes No
Richest 60% Yes No Yes Yes No Yes
Notes: Standard errors in parentheses: *** = p<0.01; ** = p<0.05; * p = <0.1. The reference group
for travel time was those living fewer than 15 minutes to the nearest public hospital. The reference
group for self-reported health was those reporting being healthy.
Source: Authors’ calculations based on RAND Institute (2015[19]), Indonesia Family Life Survey –
Wave 5.
Individuals living fewer than 15 minutes from the nearest public hospital
represent the reference group. Thus, individuals living further away have lower
odds of having health insurance, confirming supply-side constraints to enrolment.
The reference group for the variable self-reported health is the healthiest group.
Hence, those feeling less than healthy are more likely to get health insurance,
confirming the hypothesis of adverse selection.
Informal workers with a diagnosed disability are 1.20 times (bottom 40%) and
1.24 times (top 60%) more likely to have insurance than those not diagnosed with
a disability/chronic condition. Informal workers living in mixed households with
formal workers are almost twice as likely as those in non-mixed households to
have insurance.
Multiple studies confirm JKN’s positive impact on the accessibility of health care
(Hidayat, 2015[20]); (Agustina et al., 2019[16]). Nevertheless, continuously high OOP
payments curb this impact. A 2015 DJSN study found that 18% of patients incurred some
OOP expense under JKN. The survey also revealed that the average OOP cost stood at
IDR 235 945 for outpatients and IDR 1 244 786 for in-patients. The main reason for
continued OOP payments is the high cost of medicine (Hidayat, 2015[20]).
Conditional cash transfer: Program Keluarga Harapan (PKH)
The PKH CCT programme, launched in 2007, targets the poorest 8% of UDB households
to improve their access to health, education and social welfare services (World Bank,
2017[3]). It seeks to reduce household expenditure on health and education while investing
in future generations through improved health and education. Key objectives include

CHAPTER 3. EFFECTIVENESS OF SOCIAL PROTECTION │ 109
SOCIAL PROTECTION SYSTEM REVIEW OF INDONESIA © OECD 2019
improving the nutritional status of children and pregnant and post-partum women,
reducing the poverty gap across income groups and improving the education levels of
children in poor households (Hadna, Dyah and Tong, 2017[21]). PKH benefits are
conditional on specified health or education requirements (Table 3.9).
Table 3.9. PKH currently targets children and mothers
PKH conditionalities and benefits
PKH beneficiaries Core conditionalities to receive benefits Yearly benefit value (IDR)
(2013-15)
Yearly benefit value (IDR)
(2016)
Pregnant or lactating/post-partum women
Complete 4 antenatal care visits in each trimester of pregnancy and take iron tablets during pregnancy. Newborns should be delivered in a health facility, assisted by a trained health professional. Lactating/post-partum women must complete 2 neonatal care visits before newborns are one month old.
1 000 000 1 200 000
Children aged 0-6 Complete childhood immunisation and monthly growth monitoring check-ups, especially for weight and height. Ensure children take vitamin A capsules twice per year.
1 000 000 1 200 000
Children aged 6-21 Enrol children in the relevant education level. Ensure attendance reaches at least 85% of school days.
500 000 (children in elementary school);
1 000 000 (children in junior high school).
450 000 (children in elementary school);
750 000 (children in junior high school);
1 000 000 (children in senior high school).
Elderly people age 70 or older not covered by other social assistance programmes;
Complete health check-ups at health facilities or at the household via home care and attend day care or social activities, if available.
People suffering heavy disabilities not covered by other social assistance programmes
Complete health check-ups, as needed, at health facilities or via home care, and follow day care or social activities, if available.
Source: MoSA (2016[22]).
Coverage of PKH
PKH eligibility criteria are twofold, taking into account 1) household composition
(e.g. presence of a pregnant/lactating woman, one or more children below age 5, children
aged 6-15 attending school or children aged 16-18 yet to complete basic education); and
2) household consumption (threshold set at the bottom 14% of households in the UDB.
The PKH was piloted in 2007 in seven provinces, 48 districts and 337 sub-districts,
reaching 382 000 households
(TNP2K, 2014[23]). The programme grew to reach
1.5 million poor households in all provinces in 2012, 3.5 million in 2015 and 6 million in
2016 (Figure 3.17). It aims to reach 15.6 million families by 2020. This rapid expansion
has involved broader geographic coverage, including the poorest districts of Papua and
West Papua, and previously not covered areas (World Bank, 2017[24]).

110 │ CHAPTER 3. EFFECTIVENESS OF SOCIAL PROTECTION
SOCIAL PROTECTION SYSTEM REVIEW OF INDONESIA © OECD 2019
Figure 3.17. PKH coverage has grown significantly since 2014
Number of households covered (million) (2006-20)
Source: Authors’ calculations, based on Statistics Indonesia (2016[4]), SUSENAS,
https://microdata.bps.go.id/mikrodata/index.php/catalog/769.
Adequacy of PKH
Analysis of the adequacy of PKH benefits compares their generosity against multiple
living standards indicators, such as the EPL, the OPL and the average household
consumption per capita.
In 2007-12, annual benefits ranged from IDR 600 000 to a maximum of IDR 2 200 000
per household (TNP2K, 2014[23]). In 2013-15, benefits ranged from IDR 800 000 to
IDR 2 800 000. In 2016, the maximum increased to IDR 3 700 000, with beneficiary
households receiving IDR 500 000 regardless of meeting PKH conditionalities. In 2017,
the PKH was reformed to offer a single benefit of IDR 1 890 000 per household per year,
including those with members above age 70 or with heavy disabilities. On average, this
new benefit accounts for 13% of average household expenditure. The benefit modalities
are currently being revised by the Government with a view to increasing benefit values
and re-establishing variable benefit levels prior to a further expansion of coverage. As of
2016, various state-owned banks disburse benefits electronically, whereas they were
previously cash-based and disbursed through the post (World Bank, 2017[3]).
0.390.72 0.72 0.81
1.111.51
2.42.8
3.5
6 6
10
0
2
4
6
8
10
12
2006 2008 2010 2012 2014 2016 2018 2020
Number of households, million

CHAPTER 3. EFFECTIVENESS OF SOCIAL PROTECTION │ 111
SOCIAL PROTECTION SYSTEM REVIEW OF INDONESIA © OECD 2019
Table 3.10. PKH benefits have not significantly increased in recent years
PKH benefits for target groups (2014-16)
Household composition conditionalities to receive
benefits Year
PKH benefits per capita as % of
EPL
PKH benefits per capita as % of
OPL
PKH benefits per capita as % of average household consumption
per capita
Pregnant or lactating/post-partum women and/or children aged 0-6
2014 34.4 27.5 10.7
2015 31.5 25.2 9.6
2016 35.3 28.2 10.6
Children aged 6-21 attending elementary school
2014 17.2 13.8 5.4
2015 15.7 12.6 4.8
2016 13.2 10.6 4.0
Children aged 6-21 attending junior high school
2014 34.4 27.5 10.7
2015 31.5 25.2 9.6
2016 22 17.6 6.6
Children aged 6-21 attending senior high school
2014 - - -
2015 - - -
2016 29.4 23.5 8.8
Source: Authors’ calculations, based on Statistics Indonesia (2016[4]), SUSENAS,
https://microdata.bps.go.id/mikrodata/index.php/catalog/769.
In 2016, the PKH benefit for households with pregnant or lactating/post-partum women
and/or children aged 0-6 was 35% of the EPL, 28% of the OPL and 11% of the average
household consumption per capita. The benefit level increased from 2014 compared with
poverty line indicators but remained stable compared with the average household
consumption per capita.
The benefit for households with children aged 6-21 attending elementary school was 13%
of the EPL, 11% of the OPL and 4% of the average per capita household consumption.
The benefit levels for this group have steadily declined in the last two years, compared
with living standard indicators.
In 2016, the benefit for households with children aged 6-21 attending junior high school
was 22% of the EPL, 18% of the OPL and 7% of the average consumption per capita,
showing benefit levels were lower in 2016 than in 2014. The relative benefit received by
households with children aged 6-21 attending senior high school was greater than for
those with children in junior high or elementary school: 29% of the EPL, 23% of the OPL
and 9% of the average consumption per capita.
Overall, PKH benefit levels are relatively low, compared with other CCT programmes
around the world. CCTs in Mexico, Brazil and the Philippines have benefit levels of
about 20% of consumption (World Bank, 2017[24]).
Nonetheless, several studies indicate that PKH benefits have positive effects on health
and education indicators. A 2015 TNP2K evaluation study found that PKH transfers
significantly increased monthly household expenditure and increased the number of visits
to health facilities at the posyandus (sub-district) level by 3%. Child growth-monitoring
checks also rose by five percentage points. More modest improvements in school
attendance and immunisation were also attributed to the receipt of the grant (TNP2K,
2014[23]).
In 2017, a World Bank mid-line evaluation showed that PKH increased average monthly
household expenditure by 10%, with most going towards protein food consumption and
health care costs. It also showed a 22 percentage point increase in child growth-

112 │ CHAPTER 3. EFFECTIVENESS OF SOCIAL PROTECTION
SOCIAL PROTECTION SYSTEM REVIEW OF INDONESIA © OECD 2019
monitoring checks, a 7 percentage point increase in the share of households receiving
immunisation and a 7.1 percentage point increase in the number of neonatal visits. The
share of women conducting at least four antenatal care visits increased by nine percentage
points, and the share of births delivered at health facilities or by skilled health personnel
increased by five percentage points. Other impacts of the grant include reductions in
severe stunting and increases in elementary and junior high school participation rates
(TNP2K, 2014[23]).
Equity of PKH
This section draws on 2014 SUSENAS data to analyse the incidence of beneficiaries and
benefits by decile.
Beneficiary incidence and distribution
Approximately 26.2% of those in the poorest decile and 11.4% of those in the second
poorest are PKH recipients (Figure 3.18). Beneficiary incidence sharply declines for
richer deciles, with less than 3% of each of the top five deciles receiving benefits.
Figure 3.18. PKH beneficiary incidence is pro-poor
Share of each decile covered by the PKH (2016)
Source: Authors’ calculations, based on Statistics Indonesia (2016[4]), SUSENAS,
https://microdata.bps.go.id/mikrodata/index.php/catalog/769.
Figure 3.19 presents the total number of beneficiaries by expenditure decile. Distribution
clearly skews towards the poorest deciles: about 75% of beneficiaries are in the first three
consumption deciles, while only 1.4% are in the top two. Urban targeting is more pro-
poor than rural, as larger numbers of rural households in top deciles receive the grant.
0
5
10
15
20
25
30
35
1st 2nd 3rd 4th 5th 6th 7th 8th 9th 10th
% of decile
Decile
Urban Rural Total

CHAPTER 3. EFFECTIVENESS OF SOCIAL PROTECTION │ 113
SOCIAL PROTECTION SYSTEM REVIEW OF INDONESIA © OECD 2019
Figure 3.19. PKH beneficiary distribution is more pro-poor in urban areas
Share of total beneficiaries in each decile
Source: Authors’ calculations, based on Statistics Indonesia (2016[4]), SUSENAS,
https://microdata.bps.go.id/mikrodata/index.php/catalog/769.
Benefit distribution
Households in the first decile receive the largest share of PKH benefits (46.2%)
(Figure 3.20). The bottom three deciles receive 76.1%, while the top three receive 2.5%.
PKH targeting thus appears to be the most accurate, compared with other social
assistance programmes in the country (World Bank, 2017[3]).
Figure 3.20. PKH benefit distribution
Share of total benefits in each decile
Source: Authors’ calculations, based on Statistics Indonesia (2016[4]), SUSENAS,
https://microdata.bps.go.id/mikrodata/index.php/catalog/769.
0 10 20 30 40 50 60 70 80 90 100
Urban
Rural
Total
% of beneficiaries
Decile 1 Decile 2 Decile 3 Decile 4 Decile 5
Decile 6 Decile 7 Decile 8 Decile 9 Decile 10
0 10 20 30 40 50 60 70 80 90 100% of benefits
Decile 1 Decile 2 Decile 3 Decile 4 Decile 5
Decile 6 Decile 7 Decile 8 Decile 9 Decile 10

114 │ CHAPTER 3. EFFECTIVENESS OF SOCIAL PROTECTION
SOCIAL PROTECTION SYSTEM REVIEW OF INDONESIA © OECD 2019
Efficiency of PKH
Based on 2014 SUSENAS data, analysis finds a 5.7% reduction in poverty headcount and
25.9% reduction in extreme poverty headcount, with a cost equivalent to 0.05% of GDP
(Table 3.11).
Table 3.11. PKH is the most efficient poverty alleviation programme
PKH cost and poverty impacts (2014)
Disbursed amount (IDR trillion and % of
GDP)
Poverty headcount reduction
Extreme poverty headcount reduction
Poverty gap reduction
(IDR million)
Extreme poverty gap reduction (IDR million)
5.3 1 806 063.0 2 069 845.0 2 362 689.7 979 580.9
0.05% 5.71% 25.91% 11.92% 30.94%
Note: The analysis of PKH equity, coverage and efficiency is conducted using the 2014 SUSENAS as more
recent versions of the survey do not capture the receipt of the grant. The 2014 wave however under-reports
coverage of the grant (1.2 million households instead of the reported 2.8 million). For this purpose, a probit
regression is run using receipt of the grant as dependent variable and a series of grant receipt determinants as
predictors. The latter include household characteristics, receipt of other grants, demographic variables and
economic ones. The determinants are selected to maximise the regressions explanatory power and goodness-
of-fit. A probability threshold above which households are assumed to be PKH beneficiaries is then selected.
This threshold is calibrated to reach the government-reported total beneficiary number. For additional
robustness, the poverty rate (both regular and food poverty) among actual receiving households and those
determined based on the probit are compared. The findings show that these vary by 3.6 percentage points in
the case of the OPL, and 1.8 percentage points for the EPL.
Source: Authors’ calculations, based on Statistics Indonesia, SUSENAS 2014,
https://microdata.bps.go.id/mikrodata/index.php/catalog/769.
PKH’s poverty-reducing efficiency, as measured by the change in the poverty gap for
every IDR 100 spent on the programme, is 44.2%; its extreme poverty-reducing
efficiency is 18.31%. PKH is thus the best-performing programme on both counts.
Beyond poverty levels, a recent evaluation conducted by TNP2K (Cahyadi et al., 2018[25])
found important impacts in terms of primary and secondary school attainment and in the
level of deliveries in a facility by trained birth attendants. Importantly, this evaluation
conducted six years after the programme’s introduction found that the continued
investment in children over time resulted in cumulative outcomes, in particular in terms
of reduced stunting.
Pensions in Indonesia: a gender perspective
This section outlines the risks women reaching old age face, followed by results of an
analysis based on the IFLS. The IFLS is a very rich survey, with information on
respondents and their families, households, communities, and health and education
facilities (Strauss, Witoelar and Sikoki, 2016[26]). The wide range of modules in the
questionnaire, as well as the panel data nature of the survey, allow in-depth analysis of
the labour force histories of women and men.

CHAPTER 3. EFFECTIVENESS OF SOCIAL PROTECTION │ 115
SOCIAL PROTECTION SYSTEM REVIEW OF INDONESIA © OECD 2019
Women are vulnerable in old age
Indonesia has one of the world’s largest populations, and it is expected to increase
sharply, from 258 million in 2015 to 321 million in 2050. Average life expectancy is
projected to rise, from 68.6 years in 2015 to 73.9 years in 2050 (UN DESA, 2015[27]).
Indonesia has the fifth largest elderly population in the world (HelpAge, 2012[28]), and
while the share of men and women is about equal, 57% of the elderly above age 70 are
women (Surbakti and Devasahayam, 2015[29]).
Large segments of the global population rely on contributory pension systems for old-age
consumption. However, by design, these systems can exclude many potential
beneficiaries or provide inadequate benefits, due to contribution density issues.3 When the
population age 60 or over is the fastest growing globally (UN DESA, 2015[27]), this
exclusion and inadequacy can affect the well-being of older individuals, who must
otherwise rely on work income or family and network support.
Women are particularly vulnerable. They live longer than men and are more likely to be
widowed. They also tend to be less educated: about one-third of Indonesian women age
70 and over are literate, compared to 65% of men (Priebe and Howell, 2014[30]).
Women’s labour force histories also diverge significantly from men’s. Care-giving
responsibilities mean women are more likely to interrupt work or never enter the labour
market. They may also be more likely to work informally, including in more precarious
jobs, granting them flexibility for child care.
Pension systems may also treat women and men differently, including earlier mandatory
retirement for women (up to five years earlier), which exposes them to vulnerability if
benefits are computed as a function of years of contribution (Arza, 2015[31]).
Employment histories
IFLS surveys can generate employment histories by combining retrospective histories and
labour force status at the time of the surveys. Figure 3.21 displays the proportion of each
lifecycle decade that men and women spend in employment, the share of men and women
in constant employment throughout the decade and the percentage of working years spent
in informal employment. On average, women work less than men in every decade and are
much less likely to be in constant employment, but they are more likely to work
informally and to be informally employed the older they are.

116 │ CHAPTER 3. EFFECTIVENESS OF SOCIAL PROTECTION
SOCIAL PROTECTION SYSTEM REVIEW OF INDONESIA © OECD 2019
Figure 3.21. Women work less and are more likely to work informally than men
Labour force history indicators for men and women by lifecycle decade (1997-2014)
Source: Authors’ calculations based on RAND Institute (1993[32]; 1997[33]; 2000[34]; 2007[35]; 2015[19]),
Indonesia Family Life Surveys, www.rand.org/labor/FLS/IFLS.html.
Reported type of employment also allows for inferring the share of work life spent in
various types of employment, namely as government workers, family workers, private
sector workers and self-employed workers. Figure 3.22 shows women are much more
likely to be family workers, increasingly so as they age; men are more likely to be self-
employed, increasingly so as they age.
Figure 3.22. Women are more likely to be family workers than men
Share of worked years spent in various types of employment by lifecycle decade (1997-2014)
Source: Authors’ calculations based on RAND Institute (1993[32]; 1997[33]; 2000[34]; 2007[35]; 2015[19]),
Indonesia Family Life Surveys, www.rand.org/labor/FLS/IFLS.html.
0
10
20
30
40
50
60
70
80
90
100
Women Men Women Men Women Men
Share of worked years Constant employment Informality density
%
20s 30s 40s 50s 60s
0
10
20
30
40
50
60
70
80
90
100
20s 30s 40s 50s 60s 20s 30s 40s 50s 60s
Women Men
%
Self-employed Private workers Government workers Family workers

CHAPTER 3. EFFECTIVENESS OF SOCIAL PROTECTION │ 117
SOCIAL PROTECTION SYSTEM REVIEW OF INDONESIA © OECD 2019
Burden of care and labour force participation
This section focuses on the relationship between household composition and the potential
burden of care of children and elderly relying on working-age individuals.
Work density per decade of the lifecycle was computed for each woman and man
observed throughout a complete decade (20s, 30s, 40s and 50s), along with the share of
those work years spent in informal work (informality density). Regression analysis was
then used to identify the relationship, with variables capturing household composition,
such as the child dependency ratio (number of children per number of working-age
adults) and elderly dependency ratio (number of elderly per number of working-age
adults). Poverty and self-reported health were controlled for. Table 3.12 displays work
density results by decade and sex. Table 3.13 displays informality density results.
Table 3.12 displays coefficients reflecting the relationship between household
composition and work density for women and men in each decade. Overall, women in
their 20s and 30s have lower work density than men when their households have a higher
child dependency ratio, while men have higher work density the higher the child
dependency ratio. The elderly dependency ratio does not have a statistically significant
relationship with the work density.
Table 3.12. In households with higher child dependency ratios, women work less than men
Work density by decade, sex and household composition (averaged over lifecycle decade)
Women Men
20s 30s 40s 50s 20s 30s 40s 50s
Child dependency ratio -0.04** -0.02** 0.01 -0.01 0.06*** 0.01*** 0.01** 0.03**
(0.02) (0.01) (0.01) (0.02) (0.01) (0.00) (0.00) (0.01)
Elderly dependency ratio 0.03 0.02 0.02 0.01 -0.01 -0.02 -0.02* 0.03
(0.04) (0.03) (0.02) (0.02) (0.02) (0.01) (0.01) (0.02)
Poor -0.03** -0.01 -0.02* -0.02 -0.01 -0.01*** -0.01 0.01
(0.02) (0.01) (0.01) (0.02) (0.01) (0.01) (0.01) (0.01)
Health -0.03 -0.07*** -0.02 -0.05** 0.01 -0.01 -0.01 -0.03*
(0.02) (0.02) (0.02) (0.03) (0.01) (0.01) (0.01) (0.01)
Observations 1 461 1 596 1 455 828 1 736 1 786 1 745 1 106
R-squared 0.01 0.01 0.00 0.01 0.02 0.01 0.01 0.01
Notes: For dependency ratios, working age = aged 15-65, child = under age 10, elderly = age 50 and over.
Work density = number of years worked in each decade. *** = p<0.01; ** = p<0.05; * = p<0.1.
Source: Authors’ calculations, based on IFLS-1 through IFLS-5.
While women in their 20s and 30s are less likely to work the higher the child dependency
ratio in their households, they are more likely to work informally if they do. Men are both
more likely to work and more likely to work informally.

118 │ CHAPTER 3. EFFECTIVENESS OF SOCIAL PROTECTION
SOCIAL PROTECTION SYSTEM REVIEW OF INDONESIA © OECD 2019
Table 3.13. In households with higher child dependency ratios, women and men are more
likely to work informally
Informal work density by decade, sex and burden of care (averaged over lifecycle decade)
Women Men
20s 30s 40s 50s 20s 30s 40s 50s
Child dependency ratio 0.09*** 0.05*** -0.00 0.06** 0.07*** 0.07*** -0.04** 0.05**
(0.02) (0.01) (0.02) (0.02) (0.02) (0.02) (0.02) (0.03)
Elderly dependency ratio -0.02 0.02 0.02 0.02 0.12*** 0.12*** -0.11** 0.11**
(0.05) (0.03) (0.03) (0.02) (0.04) (0.04) (0.04) (0.04)
Poor 0.05** 0.04** 0.05*** 0.02 0.03** 0.03** 0.11*** 0.10***
(0.02) (0.02) (0.02) (0.02) (0.02) (0.02) (0.02) (0.02)
Health -0.01 -0.02 -0.01 -0.01 0.01 0.05* 0.07*** 0.03
(0.03) (0.03) (0.02) (0.03) (0.02) (0.03) (0.03) (0.03)
Observations 1 461 1 596 1 455 828 1 736 1 786 1 745 1 106
R-squared 0.02 0.01 0.01 0.01 0.02 0.02 0.03 0.03
Notes: For dependency ratios, working age = aged 15-65, child = under age 10, elderly = age 50 and over.
Work density = number of years worked in each decade. *** = p<0.01; ** = p<0.05; * = p<0.1.
Beyond the relationship between household composition and overall work and
informality density, the effect of changes in household composition on the likelihood of
working and informal or formal work status was also examined. To this end, a fixed
effects model was estimated, which allowed for controlling for time-invariant
characteristics that may affect work status (e.g. education, ethnicity or religion) and
measuring the relationship between changes in household composition (e.g. having a
baby) and work status the following year(s).
Table 3.14 displays the odds ratio by sex of working in a given time period (t), given a
child born in the household that year (t) or in the previous years (t-1 or t-2).
Table 3.14. Women with formal jobs are more likely to stay in the labour force when they
have children than women in informal jobs
Fixed effects model of likelihood of not working (averaged over the lifecycle)
Women Men
All Informal t-1 Formal t-1 All Informal t-1 Formal t-1
Child born in t 0.901*** 1.810*** 0.468*** 0.812*** 0.833*** 0.173***
(0.0221) (0.0616) (0.0194) (0.0318) (0.0361) (0.0123)
Child born in t-1 0.838*** 1.258*** 0.918** 0.829*** 0.842*** 0.920
(0.0217) (0.0513) (0.0343) (0.0327) (0.0369) (0.0472)
Child born in t-2 0.604*** 0.799*** 0.679*** 0.756*** 0.760*** 0.679***
(0.0168) (0.0351) (0.0270) (0.0300) (0.0336) (0.0352)
Married 1.088*** 0.806*** 0.916** 0.693*** 0.699*** 0.377***
(0.0261) (0.0385) (0.0357) (0.0312) (0.0356) (0.0181)
Observations 206 162 83 566 81 366 117 321 92 544 54 892
Number of individuals 13 324 8 110 6 984 8 690 7 169 4 510
Notes: Fixed effects model. Coefficients shown as odds ratio. *** p<0.01; ** p<0.05; * p<0.1.
Source: Authors’ calculations, based on IFLS-1 through IFLS-5.

CHAPTER 3. EFFECTIVENESS OF SOCIAL PROTECTION │ 119
SOCIAL PROTECTION SYSTEM REVIEW OF INDONESIA © OECD 2019
Table 3.14 displays the odds ratio for women (columns 1, 2 and 3) and men (columns 4, 5
and 6) of working in a given time period t given that a child was born in the household in
that year t, or in the previous years t-1 or t-2. While women are overall more likely to
work when they have had a child, there are significant discrepancies between formally
and informally employed women. Previously informally employed mothers are almost
twice as likely not to work as informally employed non-mothers. Previously formally
employed mothers are more likely to work if they have a child. Previously formally
employed fathers are much more likely to work than formally employed non-fathers,
while odds are somewhat similar for previously informally employed fathers and
informally employed non-fathers.
Women’s support strategies in old age
Work
Women are less likely than men to work when they are age 50 or older. About 87% of
men continue to be active in the labour market, compared with 74% of women. When
asked whether they planned to stop working, male and female respondents over age 50
answered similarly: about 54% planned not to stop; 25% planned to work until their
health failed; about 10% had no plans; about 5% planned to change jobs; and 5% planned
to stop.
Family support
Women rely on family, especially children, more than men. Among those age 50 and
older, 70% of women reported receiving financial support from children vs. 45% of men
(Figure 3.23). More women than men anticipate needing or do receive help from children
(e.g. financial, co-habitation). Reported own savings are extremely low: 5.1% among men
and 4.5% among women over age 50.
Figure 3.23. Women are more likely than men to rely on children for old-age support
Proportion of population age 50 and over (2014-15)
Source: Authors’ calculations RAND Institute (2015[19]), Indonesia Family Life Surveys,
www.rand.org/labor/FLS/IFLS.html.
0
10
20
30
40
50
60
70
80
90
Expect to live with children in next 5years
Expect to need financial help fromchildren in next 5 years
Received financial help from children inlast year
Expect to receive financial help fromchildren in next 5 years
% of population age 50+
Female Male

120 │ CHAPTER 3. EFFECTIVENESS OF SOCIAL PROTECTION
SOCIAL PROTECTION SYSTEM REVIEW OF INDONESIA © OECD 2019
Women over age 60 are more likely than men to be widowed: 20% vs. less than 5%. This
is attributable to women’s longer life expectancy, as well as a trend for men to remarry
(Surbakti and Devasahayam, 2015[29]).
Social protection
The great majority of old-age pensions are contributory programmes targeting formal
workers, in particular civil servants and members of the armed forces and police. Pension
coverage for retirees is low at about one-quarter of the population. Women are much less
likely than men to receive a pension: only 12% are beneficiaries (Figure 3.24).
Figure 3.24. Women are much less likely than men to receive a pension in old age
Share of retired individuals reporting to receive old-age pensions
Source: Authors’ calculations RAND Institute (2015[19]), Indonesia Family Life Surveys,
www.rand.org/labor/FLS/IFLS.html.
Implications for the pension system
Pension systems vary across dimensions, such as eligibility, vesting periods, contributory
or non-contributory features and benefit types. The analysis above identifies a number of
factors that vary by sex in terms of labour force participation and type of employment:
1) women work less than men over their lifetimes, and they are more likely to work
informally; 2) women in households with higher child dependency ratios work less than
men, but both sexes in those households are more likely to work informally, compared
with women and men in households with lower ratios; and 3) previously informally
employed mothers are twice as likely to stop working as informally employed non-
mothers.
A simulation exercise to identify a simplified profile of an average woman’s labour
history in comparison to an average man’s demonstrates how the pension system might
affect women’s old-age vulnerability. Compiling the decade information (the 40-year
period individuals might contribute to a pension system to improve income security in
retirement), on average, women spend 32.3 years working, of which 88.7%, or 28.6 years,
is in informal work. On average, men spend 37.3 years working, of which 85.2%, or
31.8 years, is in informal work.
0
5
10
15
20
25
30
35
40
45
Women Men All
% of retired population

CHAPTER 3. EFFECTIVENESS OF SOCIAL PROTECTION │ 121
SOCIAL PROTECTION SYSTEM REVIEW OF INDONESIA © OECD 2019
Indonesia’s old-age pension system consists of contributory schemes, including the
Jaminan Pensiun (JP, established in 2014), Jaminan Hari Tua (Old-Age Savings) and the
PT ASABRI and PT TASPEN, which target civil servants and armed forces personnel,
respectively. Minimum vesting periods are 15 years (180 months), and the retirement age
for both men and women is age 58. Indonesia is planning a significant expansion of
pension coverage through the JP, which is run on a defined benefit basis and accessible to
formal and informal workers.
The system also includes non-contributory pensions for abandoned or neglected people
over age 70 without regular income and unable to perform daily activities. The benefit
entitlement is IDR 200 000 per month, but coverage is limited, reaching about
30 000 beneficiaries in 2017.
Given the very few years spent, on average, by women in formal employment, it will be
crucial for the contributory pension system to integrate informal workers and take into
account fragmented labour force histories due to child care interruptions. At the same
time, an expansion of social assistance for the elderly is an important mechanism for
ensuring the well-being of women excluded from social insurance. Establishing earlier
eligibility ages for social assistance for women than men can partly offset the
disadvantages women face earlier in life, although such an approach can codify inequality
in a manner that violates constitutional requirements.
Notes
1 The annual value of rice to be distributed to households is IDR 1 307 700
(IDR 7 265 x 15 kg x 12 months); the value actually received is IDR 435 900 (IDR 7 265 x 15 kg
[average per household] x 12 months).
2 The IFLS is an ongoing longitudinal survey representative of about 83% of the population in
1993 containing over 30 000 individuals in 13 of the 27 provinces.
3 Contribution density = the number of periods a worker contributed to a pension system as a
percentage of working years.
References
Agustina, R. et al. (2019), “Universal health coverage in Indonesia: concept, progress, and
challenges”, The Lancet, Vol. 393/10166, pp. 75-102, http://dx.doi.org/10.1016/S0140-
6736(18)31647-7.
[16]
Arza, C. (2015), “The gender dimensions of pension systems: Policies and constraints for the
protection of older women”, Discussion paper, UN Women, New York,
http://socialprotection-humanrights.org/wp-content/uploads/2015/08/ARZA-Fin.pdf.
[31]
Cahyadi, N. et al. (2018), “Cumulative impacts of conditional cash transfer programs:
Experimental evidence from Indonesia”, TNP2K Working Paper, No. 4, TNP2K, Jakarta,
http://www.tnp2k.go.id/download/9759Working%20Paper%20Cumulative%20Impacts%20of
%20Conditional%20Cash%20Transfer%20Programs.pdf.
[25]

122 │ CHAPTER 3. EFFECTIVENESS OF SOCIAL PROTECTION
CMoHDC (2017), Pedoman Umum Subsidi Rastra (General Guideline for Rastra Subsidy),
Coordinating Ministry of Human Development and Culture, Jakarta.
[1]
Ernada, S. (2015), Poverty Alleviation Programmes Lessons from Indonesia. [15]
Hadna, A., K. Dyah and K. Tong (2017), “Evaluation of poverty alleviation policy: Can
conditional cash transfers improve the academic performance of poor students in Indonesia?”,
Cogent Social Sciences, Vol. 3/1, http://dx.doi.org/10.1080/23311886.2017.1295548.
[21]
HelpAge (2012), Ageing population in indonesia, http://ageingasia.org/ageing-population-
indonesia/ (accessed on 9 May 2018).
[28]
Hidayat, B. (2015), “Financial Sustainability of the National Health Insurance in Indoensia: A
First Year Review”, http://health.bmz.de/what_we_do/Universal-Health-
Coverage/Indonesia_on_the_way_to_universal_health_coverage/index.html.
[18]
Hidayat, B. (2015), “Out-of-Pocket Payments in the National Health Insurance of Indonesia: A
First Year Review”, http://health.bmz.de/what_we_do/Universal-Health-
Coverage/Indonesia_on_the_way_to_universal_health_coverage/index.html.
[20]
Kustianingrum, W. and T. Terawaki (2018), The Impacts of Rice Price Subsidy on Nutrition
Intake of The Poor: A Case of RASKIN Program in Indonesia, Atlantis Press, Paris, France,
http://dx.doi.org/10.2991/icied-17.2018.39.
[9]
Larasati, D. and F. Howell (2014), Bantuan Siswa Miskin (BSM): Indonesian Cash Transfer
Programme for Poor Students, International Policy Centre for Inclusive Growth UNDP,
Brasilia.
[13]
Mawardi, S. et al. (2007), The Effectiveness of the Raskin Program, SMERU Research Institute,
Jakarta, http://www.smeru.or.id (accessed on 6 February 2019).
[7]
MoSA (2016), Kebijakan Program PKH 2016, Ministry of Social Affairs, Jakarta. [22]
Pangaribowo, E. (2012), The Impact of ‘Rice for the Poor’ on Household Consumption.,
Australian Agricultural and Resource Economics Society, Freemantle, Australia.
[11]
Pangaribowo, E. (2012), The Impact of ’Rice for the Poor’ on Household Consumption,
University of Bonn, Bonn,
https://ageconsearch.umn.edu/bitstream/124358/2/2012AC%20Pangaribowo%20CP.pdf
(accessed on 14 December 2018).
[8]
Priebe, J. and F. Howell (2014), “OLD-AGE POVERTY IN INDONESIA: Empirical Evidence
and Policy Options A Role for Social Pensions”, TNP2K Working Paper, No. 07, TNP2K,
http://www.tnp2k.go.id/images/uploads/downloads/Old%20Age%20Poverty%20April%201
%20Approved%20for%20Publication.pdf.
[30]
Rahayu, S. (2014), Programme Raskin: Upaya Meningkatkan Ketepatan Sasaran dan Jumlah
Beras yang Diterima RTS-PM dalam Rangka Percepatan Penanggulangan Kemiskinan.
[2]

CHAPTER 3. EFFECTIVENESS OF SOCIAL PROTECTION │ 123
RAND Institute (2015), Indonesian Family Life Survey (IFLS) - Wave 5, Indonesian Family Life
Surveys, https://www.rand.org/labor/FLS/IFLS.html (accessed on 22 June 2018).
[19]
RAND Institute (2007), Indonesian Family Life Survey (IFLS) - Wave 4, Indonesian Family Life
Surveys, http://www.rand.org/labor/FLS/IFLS.html.
[35]
RAND Institute (2000), Indonesian Family Life Survey (IFLS) - Wave 3, Indonesian Family Life
Surveys, http://www.rand.org/labor/FLS/IFLS.html.
[34]
RAND Institute (1997), Indonesian Family Life Survey (IFLS) - Wave 2, Indonesian Family Life
Surveys, http://www.rand.org/labor/FLS/IFLS.html.
[33]
RAND Institute (1993), Indonesian Family Life Survey (IFLS) - Wave 1, Indonesian Family Life
Surveys, http://www.rand.org/labor/FLS/IFLS.html.
[32]
Statistics Indonesia (2016), Survei Sosial Ekonomi Nasional 2016 Maret (KOR),
https://microdata.bps.go.id/mikrodata/index.php/catalog/769 (accessed on 22 June 2018).
[4]
Strauss, J., F. Witoelar and B. Sikoki (2016), “The Fifth Wave of the Indonesia Family Life
Survey (IFLS5): Overview and Field Report”, WR-1143/1-NIA/NICHD.
[26]
Sumarto, S., A. Suryahadi and W. Widyanti (2004), “Assessing the Impact of Indonesian Social
Safety Net Programmes on Household Welfare and Poverty Dynamics”,
http://www.smeru.or.id/sites/default/files/publication/assessingindososimpaceng.pdf.
[10]
Surbakti, S. and T. Devasahayam (2015), “Women and Girls in Indonesia: Progress and
Challenges”, Mnograph Series, No. 5, UNFPA Indonesia,
https://indonesia.unfpa.org/sites/default/files/pub-
pdf/Women%20and%20Girls%20in%20Indonesia.pdf.
[29]
TNP2K (2018), The Future of the Social Protection System in Indonesia: Social Protection for
All, The National Team for the Acceleration of Poverty Reduction, Jakarta.
[5]
TNP2K (2015), RASKIN: The Challenge of Improving Programme Effectiveness, National Team
for the Acceleration of Poverty Reduction (TNP2K), Republic of Indonesia,
http://www.tnp2k.go.id/images/uploads/downloads/TNP2K%20Report%20Raskin%20the%2
0challenge%20of%20improving%20programme%20effectiveness.pdf (accessed on
6 February 2019).
[6]
TNP2K (2014), “Programme Bantuan Siswa Miskin (BSM)”, http://www.tnp2k.go.id/id/tanya-
jawab/klaster-i/programme-bantuan-siswa-miskin-bsm/.
[12]
TNP2K (2014), “Programme Bantuan Siswa Miskin (BSM)”, http://www.tnp2k.go.id/id/tanya-
jawab/klaster-i/programme-bantuan-siswa-miskin-bsm/.
[23]
UN DESA (2015), “World Population Prospects: The 2015 Revision, Key Findings and Advance
Tables”, No. ESA/P/WP.241, United Nations, Department of Economic and Social Affairs,
Population Division,
https://esa.un.org/unpd/wpp/Publications/Files/Key_Findings_WPP_2015.pdf.
[27]

124 │ CHAPTER 3. EFFECTIVENESS OF SOCIAL PROTECTION
WHO (2017), “The Republic of Indonesia Health System Review”, Health System in Transition,
Vol. 7/1.
[14]
World Bank (2017), Indonesia Social Assistance Reform Program - Technical Assessment,
http://documents.worldbank.org/curated/en/514291494863149410/pdf/115036-WP-PUBLIC-
P160655-44p-TechnicalAssessmentP.pdf.
[24]
World Bank (2017), “Towards a comprehensive, integrated, and effective social assistance
system in Indonesia”,
http://documents.worldbank.org/curated/en/535721509957076661/Towards-a-
comprehensive-integrated-and-effective-social-assistance-system-in-Indonesia.
[3]
Yulaswati, V. (2017), Social Assistance Reform in Indonesia. [36]
Zen, F. and A. Dita (2018), “Social protection system in Indonesia: an assessment”, in Mukul G.
Asher, Fauziah Zen, A. (ed.), Social Protection Goals in East Asia - Strategies and Methods
to Generate Fiscal Space, Routledge-ERIA Studies in Development Economics, New York.
[17]
CHAPTER 4. FINANCIAL SOCIAL PROTECTION 125
SOCIAL PROTECTION SYSTEM REVIEW OF INDONESIA © OECD 2019
Chapter 4. Financing social protection
Indonesia’s spending on social protection is low for a country at its income level but it
has risen significantly in recent years and is emerging as a budgetary priority. This
chapter locates social protection spending within broader Government of Indonesia
expenditure and identifies how it fits into the intergovernmental budgetary system. It
analyses spending on key social protection programmes as well as the spending dynamics
of various programmes. It assesses the potential to scale up social protection,
particularly the scope for higher levels of tax financing, and concludes by examining the
fiscal incidence of taxes and transfers to understand their combined impact on poverty
and inequality.

126 CHAPTER 4. FINANCIAL SOCIAL PROTECTION
SOCIAL PROTECTION SYSTEM REVIEW OF INDONESIA © OECD 2019
Overall public spending as a percentage of gross domestic product (GDP) is low for a
country at Indonesia’s income level as a result of weak domestic resource mobilisation.
Social protection currently accounts for a small proportion of public expenditure and is
just one of several priorities confronting the Government of Indonesia (GoI). However,
social protection spending has risen in real terms since 2000, has increased as a
proportion of public expenditure in recent years and will be an important driver of overall
public spending in 2019.
Given current weaknesses in the tax system, higher coverage by contributory social
insurance arrangements will be an important mechanism for achieving a step-change in
social protection spending and coverage over time. However, concerns over the
sustainability of these arrangements exist.
Indonesia’s extensive decentralisation complicates the financing of social protection but
also offers potential for higher spending if subnational revenues are increased. Social
protection is not one of the core functions of the central government, which means that
subnational administrations (and the inter-governmental budgetary system) have an
influence on overall spending levels.
Changes to the structure of spending offer space for social protection to scale up
Total government spending (including expenditure by central government and transfers to
local government) declined from 20.0% of GDP in the early 2000s to 15.0% of GDP in
2010 and stood at 14.6% of GDP in 2016 (Figure 4.1). This level of spending is very low
for a country at Indonesia’s income level (IMF, 2017[1]) and limits the GoI’s potential to
invest in the development of physical and human capital required to escape the middle-
income trap. It also constrains the capacity for redistribution through the fiscal system,
which is the most direct means of reducing income poverty and inequality.
Another notable feature of Indonesia’s fiscal system is the high degree of
decentralisation. Under big bang decentralisation reforms of 2001 and 2005, Indonesia
devolved substantial funds and authority to local governments, including responsibility
for public service delivery and natural resource management. The intention was to
improve these functions by empowering local administrations to reflect the country’s
extremely diverse contexts. However, the reforms did not have the desired effect,
resulting in the persistence of sizeable gaps in socio-economic outcomes between
provinces and regions. Low capacity levels in sub-national government have been a
critical constraint (OECD, 2016[2]).
Box 4.1. Deepening decentralisation in Indonesia’s intergovernmental system
The GoI structure comprises five levels of government: central government, provinces,
districts and municipalities, sub-districts and villages. The end of the Suharto era was
followed by a major push for decentralisation: Laws No. 22/1999 and No. 25/1999
significantly increased the political authority and resources of the 491 districts and
municipalities. As a result, sub-national administrations have significant spending power
and great discretion on how public revenues are spent, even though their revenue-raising
is not extensive and there are concerns around the financial management capabilities of
local government (Nasution, 2016[3]).
CHAPTER 4. FINANCIAL SOCIAL PROTECTION 127
SOCIAL PROTECTION SYSTEM REVIEW OF INDONESIA © OECD 2019
Central government spending accounts for the largest share of total expenditure but
spending at this level declined from 15.8% of GDP in 2001 to 9.6% of GDP in 2017.
Since 2007, the local government share of total expenditure has increased steadily,
indicating deepening decentralisation of government functions. Between 2008 and 2009,
a period during which central government spending declined by 3.8 percentage points (in
GDP terms), regional expenditure only decreased by 0.9 percentage points. Between 2014
and 2016, district governments’ share of total expenditure jumped from 31.1% to 38.1%
and was equal to 5.6% of GDP in 2017.
Central government is solely responsible for six absolute (core) functions: finance,
foreign affairs, defence, security, religion, and state administration and justice. Central
government shares responsibility for provinces and districts for other areas of spending
known as concurrent functions. These include the provision of basic services – education,
public health and social welfare, government administration, and infrastructure and public
works – known as mandatory functions. Elective functions cover the economic sector and
include transport, agriculture, industry and trade, capital investment, land, co-operatives,
labour force and environment.
Social protection is thus classified as a mandatory, concurrent function of government.
District governors and mayors are thus implicated in the implementation of national
social protection programmes but are also empowered to develop their own programmes.
This can create confusion and lead to duplication of efforts. It is thought to be a factor
behind the inefficient implementation of national programmes, despite the existence of
minimum standards in place for service provision (UNDP/UNCDF, 2013[4]).
Sub-national government receives large-scale transfers from the central government to
implement concurrent functions. The largest of these is the Dana Alokasi Umum (DAU;
General Allocation Fund), which covers local civil servant salaries. Although it still
accounts for 50% of transfers, the DAU’s significance has been diminishing slightly of
late. The second-largest intergovernmental transfer is the Dana Alokasi Khusus (DAK;
Special Allocations Fund), which has grown rapidly in recent years. DAK usually targets
remote and less developed areas to facilitate capital financing for selected local
governments. The grant is channelled into basic education, preventive health care, basic
infrastructure and road development, district markets and small-scale industry
development, as well as development of regional art and culture.
Historically the second-largest (now the third-largest) source of transfers to sub-national
government is the Dana Bagi Hasil (DBH) Revenue Sharing Grant. The DBH re-allocates
revenues from general tax and the exploitation of natural resources, including mining, oil
and gas.
Provinces raised 37% of their revenues through taxes in 2017, versus around 6% raised
by local governments (districts and municipalities). The Organisation for Economic Co-
operation and Development (OECD) Economic Survey 2018 finds that enhanced
revenue-generation at a sub-national level, primarily through higher revenues from
recurrent taxes on immovable property, would strengthen decentralisation, promoting
local responsibility and accountability by better matching spending and tax (OECD,
2018[5]).

128 CHAPTER 4. FINANCIAL SOCIAL PROTECTION
SOCIAL PROTECTION SYSTEM REVIEW OF INDONESIA © OECD 2019
Figure 4.1. Government spending has declined as a proportion of GDP
Total government spending as a percentage of GDP and in IDR trillion (2001-21)
Note: IDR = Indonesian rupiah.
Source: MoF (2016).
Figure 4.2 shows how the functional classification of central government spending has
evolved since 2005. The GoI disaggregates spending into 12 functions: public services,
defence, order and security, economy, environmental protection, housing and public
facilities, health, tourism and culture, religion, education, social protection, and others
(miscellaneous category). Growth in the social protection function group – from 0.2% of
GDP in 2015 to 1.2% of GDP in 2017 – is partly due to changes in its composition
in 2016.
Figure 4.2. The composition of public spending is changing
Public spending by function of central government (2005-17)
Source: MoF (2017).
0
0.5
1
1.5
2
2.5
0
5
10
15
20
25
2001 2003 2005 2007 2009 2011 2013 2015 2017 2019 2021
IDR trillion% of GDP
Expenditure Projection (lower bound) Projection (upper bound) Total expenditure
0
2
4
6
8
10
12
14
16
2005 2006 2007 2008 2009 2010 2011 2012 2013 2014 2015 2016 2017
% of GDP
0
10
20
30
40
50
60
70
80
90
100
2005 2006 2007 2008 2009 2010 2011 2012 2013 2014 2015 2016 2017
Share of total government expenditure
Public service Defense Order and security Economy
Environmental protection Housing and public facilities Health Tourism and culture
Religion Education Social protection Others

CHAPTER 4. FINANCIAL SOCIAL PROTECTION 129
SOCIAL PROTECTION SYSTEM REVIEW OF INDONESIA © OECD 2019
However, the “social protection” function group covers a broader range of programmes
than are recognised as social protection by this review. Its composition recently changed
to include food/housing subsidies and social contributions, which were previously
classified under the “general government administration” function.
The public services function group is the largest in spending terms, although its allocation
shrunk considerably between 2017 and 2018. Allocations to economic services, the
second-largest function group, increased from 0.8% of GDP in 2005 to 2.4% of GDP in
2017. As a share of total expenditure, economic spending jumped from 6.5% to 25.4% of
total spending over the same period.
The GoI is constitutionally required to allocate at least 20% of its budget (excluding
interest payments) to education, which it has achieved since 2009 (Jasmina, 2016[6]).
Two-thirds of education spending occurs at the sub-national level and is thus not captured
in Figure 4.2. In total, Indonesia allocated resources equivalent to 3.3% of GDP to
education in 2016 (World Bank, 2017[7]). The expansion of basic education to include
senior high school will apply further upward pressure on this allocation.
Public health spending was significantly lower than education spending at 1.4% of GDP
in 2017. Total health spending was 3.0% of GDP in the same year, meaning private
health expenditure was greater than public.
Figure 4.3 disaggregates central government expenditure by economic classification.
Between 2001 and 2016, overall spending declined in line with declining central
government spending, and the composition of expenditure changed significantly. In 2016,
the largest areas of spending were salaries, goods and services, and capital expenditure;
in 2001, the main categories had been interest payments, subsidies and development
expenditure.
Figure 4.3. Fiscal space has opened up as interest payments and subsidies decline
Government expenditure by economic classification
Source: MoF (2016).
The decline in interest payments and subsidies has been an important source of fiscal
space. State subsidies shrank from 4.7% of GDP in 2001 to 1.4% of GDP in 2016 (see
Box 4.2). Interest payments declined from 30% to 15% of spending over the same period.
0
2
4
6
8
10
12
14
16
2001 2004 2007 2010 2013 2016
% of GDPA. Percentage of GDP
0
10
20
30
40
50
60
70
80
90
100
2001 2003 2005 2007 2009 2011 2013 2015
% of total government expenditure
B. Percentage of total spending
Salaries Goods and services Capital Interest payment
Subsidies Social assistance Other Development expenditures

130 CHAPTER 4. FINANCIAL SOCIAL PROTECTION
SOCIAL PROTECTION SYSTEM REVIEW OF INDONESIA © OECD 2019
However, both subsidy spending and interest payments increased in 2018, with subsidy
spending expected to increase further in 2019. Central government spending is budgeted
to increase by 12.4% in nominal terms in 2019 from 2018, driven by higher spending on
energy subsidies (up 69% in nominal terms from 2018), higher PKH benefits and higher
expenditure on PBI JKN, driven both by increased premiums and higher coverage (World
Bank, 2018[8]).
Box 4.2. Spending on subsidies has declined significantly but rebounded in 2018
Indonesia’s main items of tax expenditure are energy and non-energy subsidies. The
former are subsidies for fuel and electricity. The latter comprise nine categories: cooking
oil, food, fertiliser, seeds, soybeans, public service obligations, credit programmes, tax
subsidies and miscellaneous.
Spending on energy subsidies peaked at 4.1% of GDP in 2008 but declined dramatically
after 2014 (Figure 4.4). This decline reflected a strategy to reallocate resources from
energy subsidies to other areas, such as health, infrastructure and social assistance. Until
2014, fuel subsidies were the largest component of spending on energy subsidies;
thereafter, they declined to a similar level as electricity subsidies until 2017.
Spending on subsidies jumped by an estimated 0.3% of GDP in 2018 due to an increase
in the costs of the diesel subsidy (OECD, 2018[9]) and is set to increase further in 2019
but will remain below pre-2015 levels (World Bank, 2018[8]). In 2019, fuel subsidies and
social assistance spending will be important drivers of real growth in public spending.
Figure 4.4. Energy subsidies declined dramatically after 2014
Spending on energy subsidies as percentage of GDP, 2004-2018
Source: Government of Indonesia Audit Board (2019).
0.0
0.5
1.0
1.5
2.0
2.5
3.0
3.5
4.0
4.5
2004 2005 2006 2007 2008 2009 2010 2011 2012 2013 2014 2015 2016 2017 2018
% of GDP

CHAPTER 4. FINANCIAL SOCIAL PROTECTION 131
SOCIAL PROTECTION SYSTEM REVIEW OF INDONESIA © OECD 2019
Spending on key social assistance programmes is growing strongly
Social protection spending reflects the fragmented nature of its implementation – by level
of government, source of financing and institutional responsibility. This makes it very
difficult to calculate an aggregate figure for social protection spending, although
programme-level data make it possible to identify trends in total expenditure.
According to the World Bank public expenditure review (2017[10]), total social protection
spending in 2016 was IDR 177 trillion, equivalent to 1.4% of GDP and 15.4% of total
government spending. Of this amount, IDR 78.3 trillion was spent on social assistance
and IDR 99.6 trillion on social insurance, or 44% and 56% of total social protection
spending respectively.
Three important trends stand out. First, that social protection spending is increasingly a
budgetary priority: in 2012, social protection spending accounted for 10.7% of total
public spending and equated to 1.2% of GDP. Secondly, the disparity between social
insurance and social assistance is diminishing: in 2012, social assistance accounted for
36% of social protection spending. Lastly, Indonesia spends significantly less on social
assistance than other countries at its income level, on average (1.5% of GDP).
Since 2005, Indonesia has invested significantly in social assistance programmes, helped
by the phasing-out of fuel subsidies. In 2010, poverty reduction became integral to the
administration of President Yudhoyono, which sought to redesign social assistance
programmes to achieve broad-based economic growth and fiscal sustainability. Spending
on social assistance has since climbed, reaching 0.7% of GDP in 2015. Although this is
lower than social assistance spending in a number of peer economies, the current upward
trend is expected to continue, thanks to the reform and expansion of key programmes.
Figure 4.5. Social assistance spending increased as fuel subsidies declined
Spending on selected social protection programmes and subsidies (2004-16)
Note: HH SA = household social assistance. BLSM = Bantuan Langsung Sementara Masyarakat
Source: MoF (2017).
0.0
0.5
1.0
1.5
2.0
2.5
3.0
3.5
4.0
0
10
20
30
40
50
60
70
80
2004 2005 2006 2007 2008 2009 2010 2011 2012 2013 2014 2015 2016
% of GDPIDR trillion
Subsidized rice (Rastra) Health insurance for the poor (PBI) Scholarship for poor students (PIP)
Conditional cash transfer (PKH) Unconditional cash transfer (BLSM)
National expenditure on HH SA (% of GDP) Total expenditures on fuel subsidies (as % of GDP)

132 CHAPTER 4. FINANCIAL SOCIAL PROTECTION
SOCIAL PROTECTION SYSTEM REVIEW OF INDONESIA © OECD 2019
The administration that took office in 2015 identified social assistance, in particular the
PKH cash transfer, as a mechanism for reducing inequalities of income and opportunity.
In the same year, social protection surpassed spending on fuel subsidies for the first time
thanks to a major reform in that area (Figure 4.5), although subsidy spending rebounded
strongly in 2018. This section examines the allocation of social assistance spending to the
programmes identified in Chapters 2 and 3.
Penerima Bantuan Iuran (PBI)
PBI, known as Jamkesmas until 2014, are non-contributory members of the Jaminan
Kesehatan Nasional (JKN, national health insurance). The number of beneficiaries
increased from 76 million in 2013 to 92 million in 2018. This increase in coverage has
been accompanied by strong growth in expenditure (Figure 4.6).
Figure 4.6. Premium subsidies for PBI beneficiaries is rising sharply as coverage grows
Expenditure and coverage, PBI (2008-18)
Source: MoF (2019).
Total programme expenditure in 2017 was IDR 25.4 trillion, equating to 2.1% of
government expenditure or 0.19% of GDP. A recent study shows that programme costs
are expected to increase to up to 4.5% of total government expenditure by 2030 as the
GoI advances towards universal health coverage (UHC) (Dartanto, 2017[11]).
Enrolment of the poor and near poor, combined with improving health services,
represents a significant fiscal challenge. BPJS Health aims to overcome this challenge by
incentivising non-poor informal sector workers to join the contributory scheme. To
ensure the system’s sustainability, this strategy must be accompanied by improved cost
control, higher insurance collection rates and activities to promote public health.
0
20
40
60
80
100
120
0
5
10
15
20
25
30
2008 2009 2010 2011 2012 2013 2014 2015 2016 2017 2018
Beneficiaries, millionIDR trillion
Expenditure Beneficiaries

CHAPTER 4. FINANCIAL SOCIAL PROTECTION 133
SOCIAL PROTECTION SYSTEM REVIEW OF INDONESIA © OECD 2019
Rastra and Bantuan Pangan Non Tuna (BPNT)
Rastra is the second-largest social assistance programme in terms of coverage. In 2016,
Rastra expenditure amounted to IDR 22.1 trillion (Figure 4.7), equal to 1.9% of total
government expenditure and 0.18% of GDP. A significant increase in expenditure from
2014 to 2015 has been partly attributed to inclusion errors; Rastra’s inefficient financial
structures are well-known (Shin et al., 2017[12]).
Figure 4.7. Rastra spending is on the rise but beneficiary numbers are steady
Rastra expenditure and beneficiaries, 2004-16
Source: Compiled from MoF (2016) and World Bank (2012) data.
In 2017, the GoI introduced the BPNT (non-cash food assistance) transfer programme for
poor households, which is based on e-vouchers and intends to reduce the leakage
associated with Rastra. The Ministry of Social Affairs (MoSA) administers the
programme, which is intended to gradually replace Rastra. In 2017, approximately
1.4 million households in 44 cities benefitted from BPNT, which had a budget of
IDR 1.6 trillion, equal to 0.13% of total government expenditure or 0.01% of GDP.
Program Indonesia Pintar (PIP)
Improving education outcomes is an important objective of social assistance in Indonesia.
Multiple programmes are implemented, costing roughly IDR 14.4 trillion and account for
1.2% of total government spending or 0.1% of GDP. Programme Indonesia Pintar (PIP),
administered by the Ministry of Education and Culture, is the largest, covering roughly
20 million students. Spending and coverage have grown rapidly since 2000. (Figure 4.8).
0
5
10
15
20
25
2004 2005 2006 2007 2008 2009 2010 2011 2012 2013 2014 2015 2016
IDR trillion
Expenditure Beneficiaries

134 CHAPTER 4. FINANCIAL SOCIAL PROTECTION
SOCIAL PROTECTION SYSTEM REVIEW OF INDONESIA © OECD 2019
Figure 4.8. PIP spending and coverage are on the rise
Source: MoF (2019).
Program Keluarga Harapan (PKH)
PKH, a conditional cash transfer programme and is emerging as Indonesia’s flagship
social protection programme. As modelling in Chapter 3 demonstrates, it is the best
targeted and most effective social assistance programme. Piloted in 2007, PKH
expenditure has increased significantly since 2012 in line with growth in coverage.
Following a recent national scale-up, PKH covered some 6 million households in 2017 at
a cost of IDR 12.8 trillion, equal to 1.1% of total government expenditure or 0.10% of
GDP (Figure 4.9).
Figure 4.9. PKH spending has increased rapidly
PKH expenditure by type and number of beneficiaries (2007-18)
Source: MoF (2019).
0
5
10
15
20
25
30
0
2
4
6
8
10
12
14
2008 2009 2010 2011 2012 2013 2014 2015 2016 2017 2018
Beneficiaries, millionIDR trillion
Expenditure Beneficiaries
0
1
2
3
4
5
6
7
8
9
10
0
2
4
6
8
10
12
14
16
18
20
2007 2008 2009 2010 2011 2012 2013 2014 2015 2016 2017 2018
Beneficiaries, millionIDR trillion
Benefit payouts Admin costs Expenditure Beneficiaries

CHAPTER 4. FINANCIAL SOCIAL PROTECTION 135
SOCIAL PROTECTION SYSTEM REVIEW OF INDONESIA © OECD 2019
Expenditure on PKH increased further in 2018, when the GoI expanded programme
coverage to 10 million households. In 2019, a doubling of benefit levels means it will be
one of the main drivers of growth in overall public spending. The World Bank has
provided a loan to support the development of information systems required to sustain
this scale-up (Box 4.3).
Box 4.3. PKH loan recognises the investment case for social protection
In 2017, the World Bank approved a USD 200 million [United States dollar] loan to help
develop the architecture for PKH. The loan programme will last until 2021 and intends to
support the increase in PKH coverage through strengthening information systems and
delivery mechanisms and improving co-ordination with other social protection
programmes (World Bank, 2017[13]).
Although this amount represents a small proportion of the GoI’s intended spending on the
programme over the coming years, it is nonetheless notable that Indonesia is borrowing
on commercial terms to finance social assistance. This reflects an understanding that
social protection constitutes an investment in human capital and thus the country’s long-
term economic prospects. The loan also demonstrates a mechanism by which donors can
support social protection in middle-income countries that no longer access concessional
financing.
Bantuan Langsung Sementara Masyarakat (BLSM)
BLSM is a time-bound unconditional cash transfer with one objective: to provide cash
assistance to poor households to offset anticipated price inflation related to a specific
policy. In effect, its purpose is to reduce the exposure of poor households to economic
risks arising from declines in fuel subsidies.
Figure 4.10. BLSM is a time-bound but significant intervention
BLSM expenditure and coverage (2004-16)
Source: MoF (2016).
0
2
4
6
8
10
12
14
16
18
20
0
2
4
6
8
10
12
14
16
18
20
2004 2005 2006 2007 2008 2009 2010 2011 2012 2013 2014 2015 2016
Beneficiaries millionIDR trillion
Expenditure Beneficiaries

136 CHAPTER 4. FINANCIAL SOCIAL PROTECTION
SOCIAL PROTECTION SYSTEM REVIEW OF INDONESIA © OECD 2019
The GoI has intervened through BLSM on several occasions. In 2005-06, for instance,
subsidy cuts resulted in household fuel price inflation of over 125%. A similar price-
shock occurred in 2008-09. On both occasions, the government disbursed BLSM to
prevent increases in poverty. In 2015, an estimated 15.8 million households received
IDR 600 000 over two phases, at a cost of IDR 9.5 trillion, equal to 0.9% of total
government expenditure or 0.1% of GDP (Figure 4.10).
JKN’s success in reaching the missing middle is threatening its sustainability
In 2015, some 70 million non-contributory and contributory JKN members claimed a
total of IDR 67.75 trillion, equal to 0.55% of GDP. Almost half of this expenditure
(IDR 30.42 trillion) is financed by contributory members, such as formal sector
employees, self-registered members (informal workers) and employers. The GoI pays the
balance.
There are several concerns with the financial stability of the JKN system. First, the
number of beneficiaries exceeds the number of monthly contributors, resulting in a claims
ratio of above 100%. This partly relates to selection issues: beneficiaries only need to
have been registered for 30 days or more to receive treatment, creating the potential for
individuals to register only when they or their households need medical assistance.
Informal workers also make irregular contributions due to the nature of their income.
Their average contribution level is also low for the same reason, and most informal
workers opt for the lowest monthly premiums.
At the same time, health care availability and quality affect the decision to enrol. In many
areas, services are considered suboptimal, causing people to opt out or resist paying
higher premiums. Increased use of facilities by newly covered individuals can also strain
quality of services.
The GoI aspires to provide UHC by 2019. Even without UHC, BPJS Health’s
accumulated debt is expected to reach IDR 173 trillion in 2019, unless the existing
payment scheme is changed (Table 4.1).
Table 4.1. JKN’s deficit is widening
2014 2015 2016
Beneficiaries (million) 152 162 186
Deficit (IDR trillion) 1.54 4.00 9.79
Source: Dartanto, T. (2017[11]), Universal Health Coverage in Indonesia: Informality, Fiscal Risks and Fiscal
Space for Financing UHC, International Monetary Fund (IMF)/Japan International Cooperation Agency
(JICA), Tokyo.
Expenditure by labour-related social insurance programmes is lower than spending on
JKN and coverage is increasing more slowly. However, the design of the system
established in 2015 and overseen by BPJS Labour will have significant implications for
the financing and sustainability of social insurance over the long term as the population
starts to age.

CHAPTER 4. FINANCIAL SOCIAL PROTECTION 137
SOCIAL PROTECTION SYSTEM REVIEW OF INDONESIA © OECD 2019
At present, the majority of labour-related social insurance spending relates to Jaminan
Hari Tua (JHT, old age security). Old-Age Security is a defined-contribution provident
fund, with employer and employee contributions. Male and female beneficiaries receive a
lump-sum pension payment upon reaching the retirement age of 55. JHT expenditure was
IDR 16.75 trillion in 2015, equal to 1.42% of total government spending or 0.15% of
GDP.
Other insurance programmes include the survivor pension, JKK and a few insurance
schemes targeted at specific employment sectors, for example construction workers (both
formal and informal), members of the armed forces or civil servants. These individual
programmes combined accounted for IDR 1.46 trillion in 2016, equalling 0.13% of total
government expenditure and 0.01% of GDP.
Since 2015, the programme is complemented by a new pension scheme for formal
workers, which is run on a defined-benefit basis. This scheme is currently in the
accumulation phase, and as such, its costs are relatively low. The GoI is keeping
contribution rates and the retirement age relatively low. However, to protect its long-term
sustainability, these parameters will both need to increase within a relatively short period
of time.
Low revenues are a major constraint on Indonesia’s development
Indonesia’s low level of domestic resource mobilisation, for a country at its income level,
is a critical constraint on its ability to continue scaling up social assistance. It also limits
the potential for redistribution through the fiscal framework, which is an important
mechanism for tackling income poverty and inequality. The 2018 OECD Economic
Survey for Indonesia devotes a chapter to raising public revenue through mechanisms that
promote inclusive growth. It provides much greater detail on domestic resource
mobilisation than is available here, as well as policy recommendations for enhancing
revenues that are relevant for this analysis (OECD, 2018[9]).
Efforts to increase social insurance coverage can ease the direct burden on public
finances. However, they must work in tandem with policies to increase tax revenues
through broader formalisation policies. If these function coherently, a virtuous circle is
achievable whereby a larger proportion of the population is formally employed and
contributing to social security arrangements at the same time as paying more in taxes,
with the consequence that workers’ livelihoods are protected and the government can
afford to spend more on tax-financed social protection for individuals who are unable to
work. Of course, taxes and social security contributions can also militate against
formalisation by increasing the cost of employment; careful policy design and
implementation are critical.
According to Ministry of Finance, tax revenue contributes a large majority of the total
state budget revenue: 11.1% of GDP in 2016 versus 2.3% from non-tax revenues
(Figure 4.11). The gap between tax and non-tax revenue has steadily increased since
2009, reflecting a gradual decline in the GoI’s reliance on income from the oil and gas
sector.

138 CHAPTER 4. FINANCIAL SOCIAL PROTECTION
SOCIAL PROTECTION SYSTEM REVIEW OF INDONESIA © OECD 2019
Figure 4.11. Government revenues have declined as a proportion of GDP
Source: MoF (2019).
According to Revenue Statistics in Asian and Pacific Economies 2018, which allows for
direct comparison of the level and structure of countries’ tax revenues by harmonising tax
data, Indonesia’s tax-to-GDP ratio is substantially lower than that of its neighbours
(OECD, 2018[14]). According to this report, Indonesia’s tax-to-GDP ratio was equivalent
to 11.6% of GDP in 2016, versus 14.3% in Malaysia, 17.0% in the Philippines and 18.1%
in Thailand (OECD, 2018[14]). Indonesia’s tax revenues as a percentage of GDP steadily
declined since peaking in 2008 (OECD, 2018[14]), although they recovered in 2018 and
are projected to increase further in 2019 (World Bank, 2018[8]).
Figure 4.12. Tax revenues are very low by regional standards
Tax revenue as a percentage of GDP (2000-16)
Source: OECD (2018[14]), Revenue Statistics in Asian and Pacific Economies 2018,
https://doi.org/10.1787/9789264308091-en.
0
5
10
15
20
25
2001 2002 2003 2004 2005 2006 2007 2008 2009 2010 2011 2012 2013 2014 2015 2016 2017
% of GDP
Total tax revenue Non-tax revenue Grants
0
5
10
15
20
25
2000 2001 2002 2003 2004 2005 2006 2007 2008 2009 2010 2011 2012 2013 2014 2015 2016
% of GDP
Indonesia Thailand Malaysia Philippines

CHAPTER 4. FINANCIAL SOCIAL PROTECTION 139
SOCIAL PROTECTION SYSTEM REVIEW OF INDONESIA © OECD 2019
Figure 4.13 depicts the composition of tax revenues between 2001 and 2017. The share of
income tax in total tax revenue collection increased by 1.5 percentage points to 34.1% in
2016, exceeding the pre-2012 levels, after lower collections between 2012 and 2015.
Taxes on income from oil and gas declined, from 5.2% of tax revenues in 2014 to 1.8% in
2016.
Figure 4.13. Direct taxes account for over half of tax revenue
Tax structure as percentage of total tax revenue (2001-17)
Source: MoF (2016).
The potential exists to enhance revenues from VAT, which is a relatively efficient source
of revenue from an economic growth perspective. Indonesia can broaden the VAT base
by removing a number of exemptions and lowering the VAT registration threshold, which
is high relative to OECD countries. Such reforms would raise more revenue without
increasing the rate, although it would nonetheless be important to calculate the impact on
low-income households of removing the exemptions. Excise taxes on tobacco are also an
important source of income (see Box 4.4).
Weak tax compliance contributes to Indonesia’s low tax-to-GDP ratio. Between 17.8%
and 35.7% of Indonesians aged 15 or over were registered for personal income tax (PIT),
which is low by emerging economy standards (OECD, 2018[9]). The GoI has taken steps
to increase tax compliance and reduce tax evasion over the last decade, including multiple
bilateral tax agreements and three tax amnesties in 2008, 2015 and 2016.
0.0
0.1
0.2
0.3
0.4
0.5
0.6
0.7
0.8
0.9
1.0
2001 2002 2003 2004 2005 2006 2007 2008 2009 2010 2011 2012 2013 2014 2015 2016 2017
Share of total tax revenue
Income tax Income tax (from non oil and gas) Income tax (from oil and gas) Value added tax
Land and building tax Duties on land and building transfer Excise duties
Other domestic taxes International trade tax - import International trade tax - export

140 CHAPTER 4. FINANCIAL SOCIAL PROTECTION
SOCIAL PROTECTION SYSTEM REVIEW OF INDONESIA © OECD 2019
Box 4.4. Increasing tobacco excise taxes for revenues and health
As discussed in Chapter 1, smoking is emerging as a major threat to the Indonesian
population’s long-term health, and there is a strong case for increasing tobacco taxation.
Indonesia has one of the highest rates of smoking and tobacco use in the world – three-
quarters of men smoke – and is one of the few countries where smoking rates have
increased in the past decade. Taxation has proven a cost-effective means of reducing
smoking internationally. Indonesia's tax rate remains below the World Health
Organization’s recommendation of 70% of the retail price.
In its Economic Survey of 2018, the OECD recommends that Indonesia increase and
harmonise excises across tobacco products (OECD, 2018[9]). At the same time, it is
important that higher taxation be accompanied by public information campaigns to
increase awareness of the dangers of smoking, as well as tighter regulation of tobacco
advertising. In late 2018, the GoI cancelled plans to increase the excise tax on tobacco in
2019, making it the first year in which this has not happened since 2014 (Reuters,
2018[15]). Smoking is not the only major lifestyle-related health threat affecting Indonesia.
With obesity rates also rising fast, there is a case for the GoI to use taxation to influence
behaviour, and it is thought to be one of a number of countries in South-East Asia to be
considering a tax on sugar-sweetened drinks (OECD, 2018[9]).
The oil and gas sector generates the majority of non-tax revenue but its contribution has
declined as a percentage of GDP since 2001 (Figure 4.14). Other sources include natural
resources, profits from SOEs, public service institutions and other non-tax revenues. Non-
tax revenues peaked in 2006 at 8.2% of GDP but plunged sharply in 2009 to 4.6% of
GDP. Since then, non-tax revenues have remained under 5% of GDP. In 2016, they
amounted to 2.3% of GDP. External grants are a small and volatile component,
accounting for 0.6% of total government revenue in 2016.
Figure 4.14. Declining oil revenues are bringing down non-tax revenue
Non-tax revenue by component as percentage of GDP, 2001-17
Source: MoF (2018).
0
1
2
3
4
5
6
7
8
9
2001 2002 2003 2004 2005 2006 2007 2008 2009 2010 2011 2012 2013 2014 2015 2016 2017
% of GDP
Total non-tax revenue Oil revenues Gas revenues
Other natural resources Profit transfer from SOEs Bank Indonesia surplus
Revenue from public service institutions Other non-tax revenues

CHAPTER 4. FINANCIAL SOCIAL PROTECTION 141
SOCIAL PROTECTION SYSTEM REVIEW OF INDONESIA © OECD 2019
Tax buoyancy measures the efficiency and responsiveness of revenue mobilisation in
response to growth in national income. Indonesia’s tax buoyancy between 2001 and 2016
was 0.84, implying that tax revenues rose at a slower rate than the economy grew over
this period. This has been a continuous concern in Indonesia, largely due to the
burgeoning informal sector, weak government monitoring and poor law enforcement that
make tax evasion possible.
Indonesia’s fiscal deficit is narrowing and debt levels have declined
Indonesia is required by law to keep its combined fiscal deficit (central and regional
government) below 3% of GDP. The fiscal deficit has gradually approached this
threshold in recent years, reaching 2.5% of GDP in 2017 (Figure 4.15), reflecting an
expansionary fiscal policy. However, the central government deficit declined to 1.7% of
GDP in 2018, giving weight to estimates that the overall deficit will have narrowed to
between 1.9% and 2.2% of GDP in 2018 (Reuters, 2019[16]). The deficit is expected to
decline further in 2019 (OECD, 2018[9]; World Bank, 2018[8]).
Figure 4.15. The fiscal deficit widened after 2010
Fiscal balance, percentage of GDP (2001-18)
Note: RHS = right-hand side. LHS = left-hand side.
Source: MoF (2019).
Indonesia’s debt-to-GDP ratio has declined significantly over the past two decades, from
88.8% in 2000 to 29.8% in 2018 (Figure 4.16). Fiscal discipline, sustained and robust
GDP growth, effective debt management and successful negotiations for lower interest
rates have contributed to the decline. The GoI also sold several state-owned enterprises to
pay off foreign debt in 2003-04 and restructured its foreign debt three times (2003, 2006
and 2008).
2.83.5
1.5 1.7 1.8
1.50.8
1.7
0.1
0.6
0.1
-0.6-1.0 -0.9
-1.2 -1.0-1.3
-0.5
-2.5
-1.3-1.7
-1.0-0.5
-0.9-1.3
-0.1
-1.6
-0.7-1.1
-1.8-2.2 -2.1
-2.6 -2.5-2.9
-2.2
-4
-3
-2
-1
0
1
2
3
4
0
5
10
15
20
25
2001 2002 2003 2004 2005 2006 2007 2008 2009 2010 2011 2012 2013 2014 2015 2016 2017 2018
% of GDP% of GDP
Primary balance (RHS) Post interest balance (RHS)
Government revenue (LHS) Government expenditure (LHS)

142 CHAPTER 4. FINANCIAL SOCIAL PROTECTION
SOCIAL PROTECTION SYSTEM REVIEW OF INDONESIA © OECD 2019
Figure 4.16. The debt-to-GDP ratio has declined significantly
Total public debt in absolute terms and as percentage of GDP (2000-18)
Source: Directorate General of Budget Financing and Risk Management (2018).
While the debt-to-GDP ratio declined between 2000 and 2012, the GoI increased
borrowing in 2014 to finance planned infrastructure investments. Nonetheless, the current
debt-to-GDP ratio remains well below the 60% threshold established by Law No. 17 of
2003 and is lower than that of Malaysia, the Philippines and Thailand.
Recent upgrades to Indonesia’s credit rating reflect its strengthening macrofiscal
environment. Standard and Poor’s Rating Agency, Fitch Ratings and Moody’s Investors
Service all raised the country’s sovereign rating in 2017/18, with the result that it is now
rated as investment grade by all three. These upgrades make it easier for Indonesia to
attract foreign and domestic investment.
The combined impact of taxes and direct transfers is to reduce inequality
Taxes and social transfers offer governments powerful and flexible tools for achieving
core development objectives while promoting social equity. These instruments serve
multiple cross-cutting purposes, among them to 1) finance vital government activities;
2) create incentives to align private behaviour with social interests; 3) correct market
failures; 4) tackle poverty and vulnerability; and 5) promote a more equitable distribution
of income, wealth and other resources.
Fiscal incidence analysis can provide complex evaluations to assess the objective of
equity, as often the real burden of taxation falls on individuals who might or might not be
directly liable for the payments. For example, corporations pay corporate income tax
(CIT) but the incidence ultimately falls on the shareholders, who receive lower after-tax
dividends, employees who receive lower wages and consumers who pay higher prices.
Similarly, the outcomes of government transfers (and social protection programmes more
broadly) often involve pathways complicated by targeting errors, opportunity costs and
stochastic long-term payoffs. Both supply- and demand-side barriers create challenges for
lower-income households to benefit from government expenditure aimed at reducing
poverty and inequality.
0
10
20
30
40
50
60
70
80
90
100
0
500
1 000
1 500
2 000
2 500
3 000
3 500
4 000
4 500
5 000
2000 2001 2002 2003 2004 2005 2006 2007 2008 2009 2010 2011 2012 2013 2014 2015 2016 2017 2018
Debt-to-GDP ratioIDR trillion
Debt (LHS) Debt-to-GDP ratio (RHS)

CHAPTER 4. FINANCIAL SOCIAL PROTECTION 143
SOCIAL PROTECTION SYSTEM REVIEW OF INDONESIA © OECD 2019
This review carries out fiscal incidence analysis based on 2016 Survei Sosial Ekonomi
Nasional (SUSENAS; National Socio-Economic Survey) data (Statistics Indonesia,
2016[17]). It simulates the five leading sources of tax revenues from direct taxes (PIT, CIT,
property tax) and indirect taxes (VAT, excise tax), which together accounted for over
95% of government tax revenues from 2001 to 2017. Modelling the incidence of CIT,
which accounts for about 32% of the tax burden, requires strong assumptions; in this
case, the report assumes that the burden is distributed equally between owners of capital
and consumers.
To analyse the impact of transfers, the model includes three major government transfer
programmes: Rastra, PIP/Bantuan Siswa Miskin and PBI. PKH cannot be modelled
because it is not specifically identified in the 2016 SUSENAS.
The total microsimulated tax revenues from the five taxes accounts for 96.6% of total
reported tax revenues for 2016. Figure 4.17A demonstrates how the tax burden is
distributed across consumption deciles, illustrating the burden as a percentage of
household expenditure. The total tax burden is highest among households in the first
decile: the effective tax rates reach 38.5% for the first decile, compared with 44.8% for
the top decile.
Figure 4.17. The tax system is mildly progressive
Average tax rates and total tax expenditure by consumption decile, 2016
Source: Authors’ calculations based on Statistics Indonesia (2016[17]), SUSENAS
https://microdata.bps.go.id/mikrodata/index.php/catalog/769.
Individuals at the higher end of the income distribution pay a much larger share of total
taxes than lower deciles (Figure 4.17B). The top decile pays a total of USD 31.3 billion,
more than the bottom six deciles combined. The highest decile also accounts for 33.2% of
the total tax burden, compared with 2.6% for the lowest decile. Given that the effective
tax rates do not vary by such a wide margin, this disparity in tax payments reflects a
concentration of consumption at the top of the distribution.
34
36
38
40
42
44
46
1st 2nd 3rd 4th 5th 6th 7th 8th 9th 10th
Decile
% of household expenditure
0
5 000
10 000
15 000
20 000
25 000
30 000
35 000
1st 2nd 3rd 4th 5th 6th 7th 8th 9th 10th
USD million
Decile
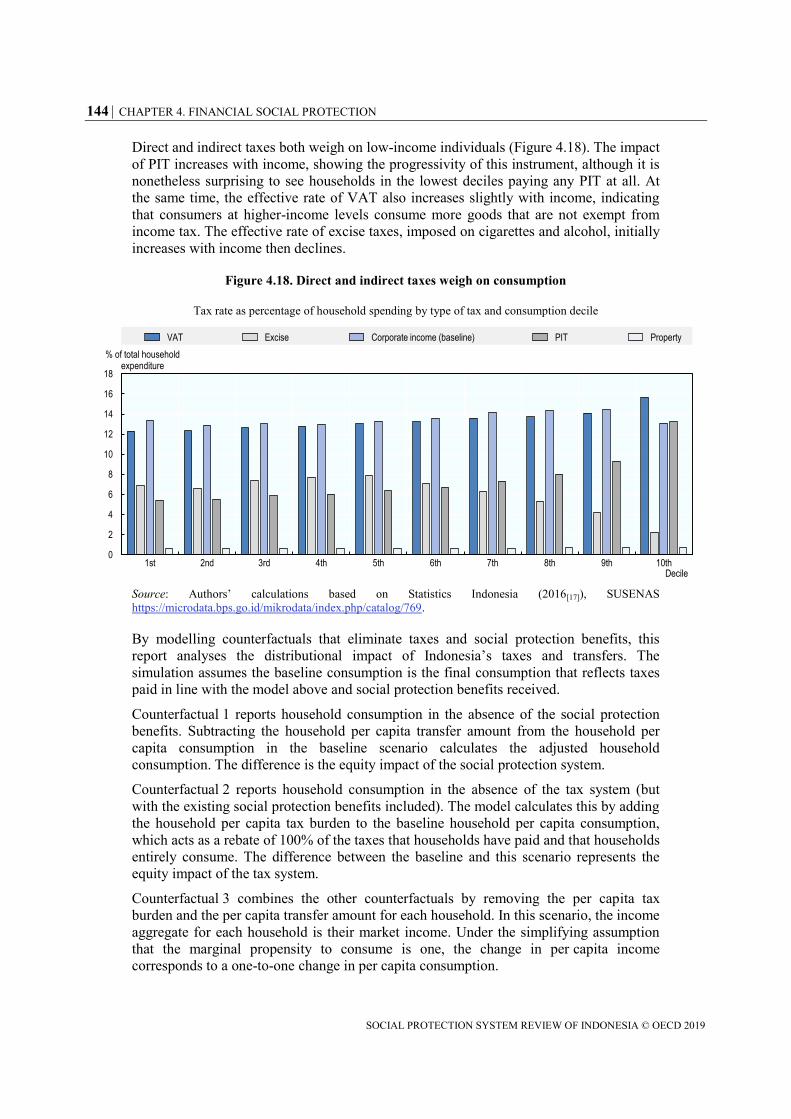
144 CHAPTER 4. FINANCIAL SOCIAL PROTECTION
SOCIAL PROTECTION SYSTEM REVIEW OF INDONESIA © OECD 2019
Direct and indirect taxes both weigh on low-income individuals (Figure 4.18). The impact
of PIT increases with income, showing the progressivity of this instrument, although it is
nonetheless surprising to see households in the lowest deciles paying any PIT at all. At
the same time, the effective rate of VAT also increases slightly with income, indicating
that consumers at higher-income levels consume more goods that are not exempt from
income tax. The effective rate of excise taxes, imposed on cigarettes and alcohol, initially
increases with income then declines.
Figure 4.18. Direct and indirect taxes weigh on consumption
Tax rate as percentage of household spending by type of tax and consumption decile
Source: Authors’ calculations based on Statistics Indonesia (2016[17]), SUSENAS
https://microdata.bps.go.id/mikrodata/index.php/catalog/769.
By modelling counterfactuals that eliminate taxes and social protection benefits, this
report analyses the distributional impact of Indonesia’s taxes and transfers. The
simulation assumes the baseline consumption is the final consumption that reflects taxes
paid in line with the model above and social protection benefits received.
Counterfactual 1 reports household consumption in the absence of the social protection
benefits. Subtracting the household per capita transfer amount from the household per
capita consumption in the baseline scenario calculates the adjusted household
consumption. The difference is the equity impact of the social protection system.
Counterfactual 2 reports household consumption in the absence of the tax system (but
with the existing social protection benefits included). The model calculates this by adding
the household per capita tax burden to the baseline household per capita consumption,
which acts as a rebate of 100% of the taxes that households have paid and that households
entirely consume. The difference between the baseline and this scenario represents the
equity impact of the tax system.
Counterfactual 3 combines the other counterfactuals by removing the per capita tax
burden and the per capita transfer amount for each household. In this scenario, the income
aggregate for each household is their market income. Under the simplifying assumption
that the marginal propensity to consume is one, the change in per capita income
corresponds to a one-to-one change in per capita consumption.
0
2
4
6
8
10
12
14
16
18
1st 2nd 3rd 4th 5th 6th 7th 8th 9th 10th
% of total household expenditure
Decile
VAT Excise Corporate income (baseline) PIT Property
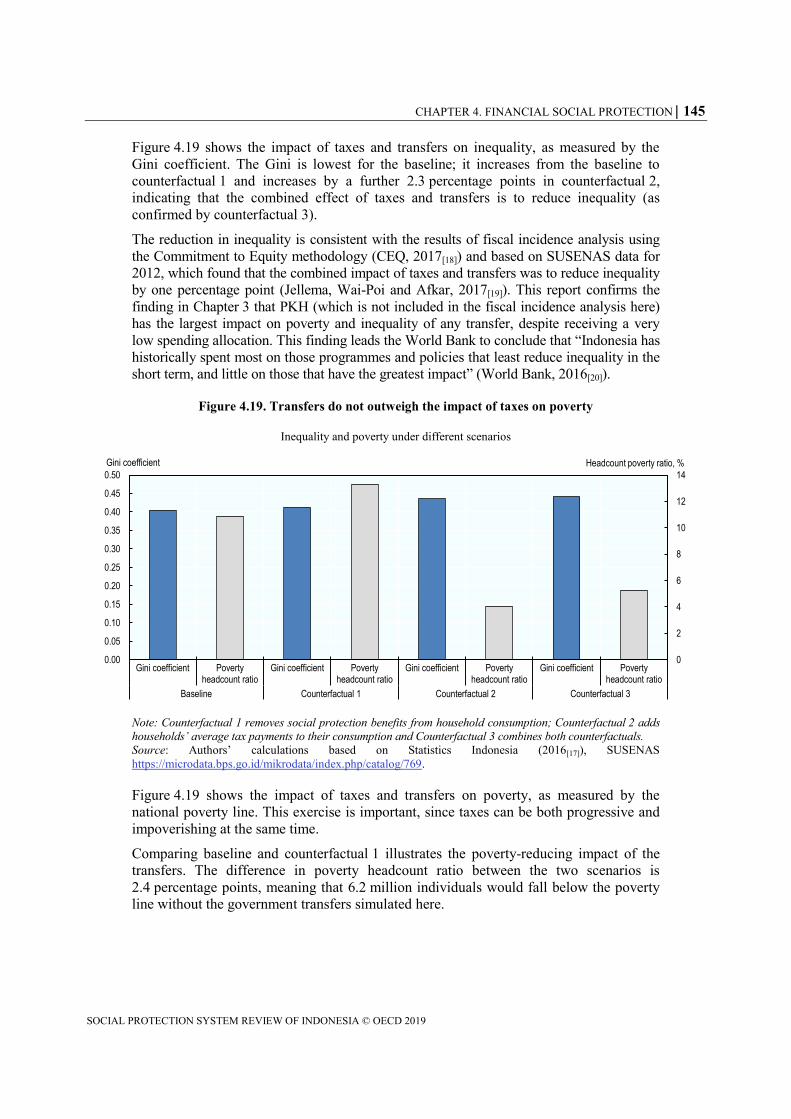
CHAPTER 4. FINANCIAL SOCIAL PROTECTION 145
SOCIAL PROTECTION SYSTEM REVIEW OF INDONESIA © OECD 2019
Figure 4.19 shows the impact of taxes and transfers on inequality, as measured by the
Gini coefficient. The Gini is lowest for the baseline; it increases from the baseline to
counterfactual 1 and increases by a further 2.3 percentage points in counterfactual 2,
indicating that the combined effect of taxes and transfers is to reduce inequality (as
confirmed by counterfactual 3).
The reduction in inequality is consistent with the results of fiscal incidence analysis using
the Commitment to Equity methodology (CEQ, 2017[18]) and based on SUSENAS data for
2012, which found that the combined impact of taxes and transfers was to reduce inequality
by one percentage point (Jellema, Wai-Poi and Afkar, 2017[19]). This report confirms the
finding in Chapter 3 that PKH (which is not included in the fiscal incidence analysis here)
has the largest impact on poverty and inequality of any transfer, despite receiving a very
low spending allocation. This finding leads the World Bank to conclude that “Indonesia has
historically spent most on those programmes and policies that least reduce inequality in the
short term, and little on those that have the greatest impact” (World Bank, 2016[20]).
Figure 4.19. Transfers do not outweigh the impact of taxes on poverty
Inequality and poverty under different scenarios
Note: Counterfactual 1 removes social protection benefits from household consumption; Counterfactual 2 adds
households’ average tax payments to their consumption and Counterfactual 3 combines both counterfactuals.
Source: Authors’ calculations based on Statistics Indonesia (2016[17]), SUSENAS
https://microdata.bps.go.id/mikrodata/index.php/catalog/769.
Figure 4.19 shows the impact of taxes and transfers on poverty, as measured by the
national poverty line. This exercise is important, since taxes can be both progressive and
impoverishing at the same time.
Comparing baseline and counterfactual 1 illustrates the poverty-reducing impact of the
transfers. The difference in poverty headcount ratio between the two scenarios is
2.4 percentage points, meaning that 6.2 million individuals would fall below the poverty
line without the government transfers simulated here.
0
2
4
6
8
10
12
14
0.00
0.05
0.10
0.15
0.20
0.25
0.30
0.35
0.40
0.45
0.50
Gini coefficient Povertyheadcount ratio
Gini coefficient Povertyheadcount ratio
Gini coefficient Povertyheadcount ratio
Gini coefficient Povertyheadcount ratio
Baseline Counterfactual 1 Counterfactual 2 Counterfactual 3
Headcount poverty ratio, %Gini coefficient

146 CHAPTER 4. FINANCIAL SOCIAL PROTECTION
SOCIAL PROTECTION SYSTEM REVIEW OF INDONESIA © OECD 2019
In counterfactual 2, when the model transfers the collected tax revenues back to
households, the poverty rate decreases from the baseline, from 10.9% to 4.1%, reflecting
increased household disposable income and per capita consumption. The result suggests
that microsimulated taxes push about 6.8% of the population (17.5 million individuals)
below the poverty line. The poverty-increasing impact of taxes is thus larger than the
poverty-reducing impact of transfers.
The results of the analysis presented here should be treated with caution, principally
because it only looks at social assistance transfers and does not include PKH. These
account for a very small proportion of the broader social spending included in the fiscal
analysis, which includes in-kind health and education benefits, as well as subsidies. Once
these are taken into account, (Jellema, Wai-Poi and Afkar, 2017[19]) find that the fiscal
system succeeds in reducing poverty as well as inequality.
References
Chen, D. et al. (2018), Indonesia Economic Quarterly June 2018: Learning more, growing faster,
World Bank, Jakarta,
http://documents.worldbank.org/curated/en/305361528210283009/pdf/126891-WP-PUBLIC-
on-6-5-18.pdf (accessed on 22 June 2018).
[24]
Dartanto, T. (2017), Universal Health Coverage in Indonesia: Informality, Fiscal Risks and
Fiscal Space for Financing UHC, International Monetary Fund (IMF)/Japan International
Cooperation Agency (JICA), Tokyo.
[11]
Gehrke, E. and R. Hartwig (2015), “How can public works programmes create sustainable
employment?”, Discussion Paper, No. 11/2015, Deutsches Institut für Entwicklungspolitik
[German Development Institute], Bonn, https://www.die-
gdi.de/uploads/media/DP_11.2015.pdf (accessed on 22 June 2018).
[23]
IMF (2017), IMF Fiscal Monitor: Tackling Inequality, October 2017, International Monetary
Fund, Washington, DC, http://www.imf.org/en/Publications/FM/Issues/2017/10/05/fiscal-
monitor-october-2017 (accessed on 22 June 2018).
[1]
Jasmina, T. (2016), “Public Spending and Learning Outcomes of Basic Education at the District
Level in Indonesia”, Economics and Finance in Indonesia, Vol. 62, pp. 180-190,
https://ideas.repec.org/a/lpe/efijnl/201615.html (accessed on 5 December 2018).
[6]
Jellema, J., M. Wai-Poi and R. Afkar (2017), “The Distributional Impact of Fiscal Policy in
Indonesia”, in The Distributional Impact of Taxes and Transfers: Evidence From Eight
Developing Countries, The World Bank, http://dx.doi.org/10.1596/978-1-4648-1091-6_ch5.
[19]
Nasution, A. (2016), “Government Decentralization Program in Indonesia”, ADB Working
Papers, No. 601, Asian Development Bank, Manila,
https://www.adb.org/publications/government-decentralization-program-indonesia (accessed
on 16 January 2019).
[3]

CHAPTER 4. FINANCIAL SOCIAL PROTECTION 147
SOCIAL PROTECTION SYSTEM REVIEW OF INDONESIA © OECD 2019
Nora Lustig (ed.) (2017), Commitment to Equity Handbook: Estimating the Impact of Fiscal
Policy on Inequality and Poverty, Brookings Institution Press and Commitment to Equity
(CEQ) Institute, New Orleans.
[18]
OECD (2018), OECD Economic Surveys: Indonesia 2018, OECD Publishing, Paris,
https://dx.doi.org/10.1787/eco_surveys-idn-2018-en.
[5]
OECD (2018), OECD Economic Surveys: Indonesia 2018, OECD Publishing, Paris,
https://dx.doi.org/10.1787/eco_surveys-idn-2018-en.
[9]
OECD (2018), Revenue Statistics in Asian and Pacific Economies, OECD Publishing, Paris,
https://dx.doi.org/10.1787/9789264308091-en.
[14]
OECD (2016), OECD Economic Surveys: Indonesia 2016, OECD Publishing, Paris,
http://dx.doi.org/10.1787.
[2]
Rahman, A. (2017), Tax compliance in Indonesia : the role of public officials as taxprayers,
University of Twente, Enschede, The Netherlands,
http://dx.doi.org/10.3990/1.9789036542425.
[22]
Reuters (2019), “Indonesia posts narrowest budget deficit in 6 years in 2018”, Nikkei Asian
Review, https://asia.nikkei.com/Economy/Indonesia-posts-narrowest-budget-deficit-in-6-
years-in-2018 (accessed on 11 March 2019).
[16]
Reuters (2018), “Indonesia to keep tobacco excise steady in 2019”, Reuters,
https://www.reuters.com/article/indonesia-tobacco-tax/indonesia-to-keep-tobacco-excise-
steady-in-2019-minister-idUSL4N1XG3M7 (accessed on 11 March 2019).
[15]
Shin, J. et al. (2017), “Indonesia : Selected Issues”, Country Report, No. 17/48, International
Monetary Fund, Washington, DC,
https://www.imf.org/en/Publications/CR/Issues/2017/02/11/Indonesia-Selected-Issues-44654
(accessed on 22 June 2018).
[12]
Statistics Indonesia (2016), Survei Sosial Ekonomi Nasional 2016 Maret (KOR),
https://microdata.bps.go.id/mikrodata/index.php/catalog/769 (accessed on 22 June 2018).
[17]
UNDP/UNCDF (2013), “Strengthening the Governance of Social Protection: The Role of Local
Government Regional Analysis”, United Nations Development Programme (UNDP), UN
Capital Development Fund (UNCDF), http://www.asia-
pacific.undp.org/content/dam/rbap/docs/Research%20&%20Publications/democratic_governa
nce/RBAP-DG-2014-Strengthening-Governance-of-Social-Protection.pdf (accessed on
16 January 2019).
[4]
World Bank (2018), Indonesia Economic Quarterly December 2018 - Strengthening
competitiveness, World Bank,
http://documents.worldbank.org/curated/en/276171544466081210/pdf/132825-WP-P165633-
PUBLIC-dec12-6pm-dc-add-series-IEQ-Dec-2018-ENG-for-web.pdf (accessed on
9 March 2019).
[8]

148 CHAPTER 4. FINANCIAL SOCIAL PROTECTION
SOCIAL PROTECTION SYSTEM REVIEW OF INDONESIA © OECD 2019
World Bank (2017), Improving quality of spending in Indonesia: 2017 Budget and beyond,
http://www.anggaran.depkeu.go.id/content/Publikasi/bidang%20pendidikan/improving%20qu
ality%20of%20spending.pdf (accessed on 22 June 2018).
[7]
World Bank (2017), Indonesia Public Expenditure and Financial Accountability, World Bank,
Jakarta, https://openknowledge.worldbank.org/handle/10986/29820 (accessed on
31 January 2019).
[10]
World Bank (2017), Program Appraisal Document on a Proposed Loan in the amount of US$200
million to the Republic of Indonesia for a Social Assistance Reform Program, World Bank,
Washington DC,
http://documents.worldbank.org/curated/en/353221496152466944/pdf/Program-Appraisal-
Document-PAD-disclosable-version-P160665-2017-04-15-04202017.pdf (accessed on
16 January 2019).
[13]
World Bank (2016), “Indonesia’s rising divide”, World Bank, Washington, DC,
http://documents.worldbank.org/curated/en/267671467991932516/Indonesias-rising-divide
(accessed on 7 December 2018).
[20]
World Bank (2014), International Development Association Project Appraisal Document, for
Productive Safety Net Project 4, Report No: PAD1022, World Bank, Washington, DC,
http://documents.worldbank.org/curated/en/477011468037548038/pdf/PAD10220PAD0P101
0Box385319B00OUO090.pdf (accessed on 29 June 2018).
[21]

CHAPTER 5. STRENGTHENING THE SOCIAL PROTECTION SYSTEM 149
SOCIAL PROTECTION SYSTEM REVIEW OF INDONESIA © OECD 2019
Chapter 5. Strengthening the social protection system
Indonesia has made great strides towards establishing a social protection system,
supported by sustained political backing across administrations, the scaling up of key
programmes and the emergence of a strong information architecture. This chapter charts
the progress that Indonesia has made towards establishing a social protection system and
identifies the key levers for strengthening this system in the future. It also recognises the
constraints to systematisation and proposes reforms to the institutions, policies and
information systems that underpin social protection as a means of enhancing its capacity
to address the challenges identified in the report and underpin inclusive economic
growth.
150 CHAPTER 5. STRENGTHENING THE SOCIAL PROTECTION SYSTEM
SOCIAL PROTECTION SYSTEM REVIEW OF INDONESIA © OECD 2019
The Government of Indonesia (GoI) is fulfilling the commitment to establish a social
protection system articulated in the National Medium Term Development Plan (RPJMN)
2015-2019. Important progress has been made in strengthening coherence and co-
ordination across a number of dimensions, including legislation, policies and institutions.
There has been a strong increase in spending on key programmes, such as Penerima
Bantuan Iuran (PBI) and Program Keluarga Harapan (PKH). Nonetheless, further
progress is required to realise the RPJMN’s vision of a comprehensive and coherent
social protection system covering the entire population as the cornerstone of its inclusive
growth strategy.
A minority of the poor population is accessing all the interventions to which they are
entitled, and which they need to exit poverty on a permanent basis. Social insurance
schemes face important constraints (and difficult financial trade-offs) with respect to
increasing coverage. Active labour market policies to increase the skills and productivity
of vulnerable workers do not operate at sufficient scale while workers are left vulnerable
by low compliance with severance pay and minimum wage legislation, as well as the
absence of an unemployment insurance fund.
At the same time, social protection policy makers at a national level must harness the
power of sub-national government to address wide variation in local contexts across the
country. In addition, ambitions to expand social protection are held in check by a lack of
financing. Social protection spending remains very low by regional standards, which is in
large part a function of weak domestic resource mobilisation. As a result, it is essential to
optimise resources allocated to social protection by creating synergies and enhancing
efficiency wherever possible.
This chapter outlines the main dimensions of the social protection system in Indonesia. It
then identifies the main challenges to strengthening this system and proposes appropriate
policy responses.
The institutional structure for social protection remains fragmented
Indonesia is developing the policy, legislative and information infrastructure for a social
protection system. However, the overall system architecture is still characterised by
extensive fragmentation and a lack of clear oversight. Efforts to enhance coherence are
hampered both by the number of line ministries involved in provision of social protection
programmes and by an excess of co-ordinating bodies.
The social protection system is not organised under one central co-ordinating body. The
roles and responsibilities of legislative work, co-ordination, supervision, implementation
and management are divided across various line ministries and administrative bodies.
Furthermore, ministries with little or no experience have direct involvement in poverty-
reduction activities.
The Coordinating Ministry of Human and Cultural Development oversees key social
policies but it does not guide the direction of social protection specifically. It provides
oversight to technical ministries directly involved in the delivery of key social protection
programmes such as the Ministry of Social Affairs (MoSA), the Ministry of Health and
the Ministry of Education and Culture. It is also responsible for ensuring policy co-
ordination and harmonisation of programmes across ministries but not with specific
reference to social protection.
CHAPTER 5. STRENGTHENING THE SOCIAL PROTECTION SYSTEM 151
SOCIAL PROTECTION SYSTEM REVIEW OF INDONESIA © OECD 2019
The Ministry for Planning and Development (Kementerian Negara Perencanaan
Pembangunan, BAPPENAS) is responsible for national development planning and
budgeting. It plays a significant role in the planning of social protection programmes with
two specific directorates responsible for social protection and poverty alleviation.
Dewan Jaminan Sosial Nasional (DJSN, the national social security council), established
under Law No. 40/2004, is mandated to supervise the implementation of a national social
security system (SJSN). This legislation empowers the DJSN to formulate general policy
and synchronise implementation of the national security system. The DJSN works under
direct supervision of the President and consists of government officials, experts in social
protection, and members of employers and workers associations.
The DJSN is responsible for overseeing Badan Penyelenggara Jaminan Sosial (BPJS, the
social security administrative body). BPJS, established under Law No. 24/2011, is
responsible for social security policy development, harmonisation of the implementation
of social security schemes, and monitoring social security funds. The BPJS law
consolidated social insurance programmes under two independent bodies: BPJS
Kesehatan (Health) and BJPS Ketenagakerjaan (Labour).
BPJS Health is responsible for achieving universal health coverage in Indonesia through
the Program Jaminan Kesehatan Nasional (JKN, national health insurance). This
programme includes both contributory and non-contributory components, thus cutting
across the social assistance and social insurance pillars. Within the contributory
component are three classes of member: wage recipients, non-wage recipients, and
retirees and veterans. Different contribution rates apply for each category.
Under the BPJS Law, BPJS Labour is responsible for managing the old-age benefit, work
accident insurance, death benefit and new pension programmes. The social security
programmes for workers in the public sector, currently implemented by PT TASPEN and
PT ASABRI, are scheduled to merge with the BPJS Labour programmes in 2029.
The National Team for Accelerating Poverty Reduction (Tim Nasional Percepatan
Penanggulangan Kemiskinan, TNP2K) was established by Presidential Decree
No. 15/2010 and reports to the Vice President. It is responsible for developing regulations
and programmes for poverty reduction, for ensuring synergies across programmes
through synchronisation, harmonisation and integration of poverty-reduction initiatives
run by various line ministries.
The role of the TNP2K overlaps with the responsibilities of some key administrative
bodies including the Coordinating Ministry of Human and Cultural Development, MoSA,
BAPPENAS and the National Statistics Bureau. Its status is determined by the degree of
support it receives from the President’s office.
MoSA is the lead agency for multiple social assistance programmes, including cash
transfers and some social services such as rehabilitation and housing support. It does not
have direct reporting requirements to DJSN, despite the latter’s co-ordinating function for
social protection. Since 2015, MoSA has been responsible for managing data on the poor
population, specifically for the social protection programmes targeting the poor, a role
previously undertaken by Central Bureau of Statistics. This expansion of its workload
was not matched with a concomitant increase in resources. While MoSA is responsible
for the management and delivery of cash transfer programmes, sectoral programmes and
subsidies are managed and run by individual line ministries.

152 CHAPTER 5. STRENGTHENING THE SOCIAL PROTECTION SYSTEM
SOCIAL PROTECTION SYSTEM REVIEW OF INDONESIA © OECD 2019
Shared system functions should be expanded
Indonesia has developed a single targeting mechanism for social assistance programmes
but does not have an integrated management information system. This constrains the
GoI’s capacity to monitor and evaluate the functioning of social assistance programmes
and to ensure that beneficiaries are receiving all the benefits to which they are eligible.
The absence of a management information system for social assistance is partly a
function of fragmentation in the sector, not to mention the challenge of co-ordinating
information flows across a country as large and diverse as Indonesia. Numerous
programmes exist and responsibility for social assistance programmes at a national level
is divided between MoSA, the Ministry of Education and numerous other institutions.
Sub-national governments also have an important role in implementation. This situation
has made it impossible to co-ordinate information systems as well as meaning that each
programme has its own operational processes, monitoring and evaluation strategies,
beneficiary lists and budgets (TNP2K, 2018[1]).
The rapid scale-up of certain social protection programmes has magnified the challenge
of establishing and maintaining information systems. This has been a particular problem
with PKH. As the World Bank’s Programme Appraisal Document for PKH notes, the
programme’s existing management information system ‘was not designed to manage
millions of beneficiary families and its performance, capability, and reliability have
become so inadequate that many administration tasks cannot be carried out effectively,
hampering efficiency, transparency, and accountability of the programme’ (World Bank,
2017[2]).
This situation is made harder by the fact that social assistance programmes do not use a
single identification number. An individual might have multiple identification numbers if
he or she was enrolled in multiple programmes in addition to national personal and family
identification numbers. Box 5.1 explains how a new set of identification cards is helping
to improve coherence in this regard.
Only once the scale-up plateaus will it be possible to fully understand the strengths and
weaknesses of the PKH information system. At this point, it will be important to
implement the action plan proposed by the World Bank to develop an adequate data
system for the programme and establish the capacity required to monitor such a system.
Meanwhile, MoSA will need to enhance its ability to collect and analyse data from other
programmes.
Over the longer term, an ideal end-point would be a single management information
system for social assistance. The lack of such a system places considerable financial and
administrative strain on individual ministries to continually gather and update data that
could be centrally managed with cost-sharing across programme implementing agencies.
An integrated database would also simplify and streamline regular monitoring and
evaluation through independent agencies.
Meanwhile, social insurance bodies such as BPJS Health, BPJS Labour, TASPEN and
ASABRI have more sophisticated information systems that record all information
relevant to their various programmes and the key indicators to measure programme risk.
However, these are not sufficiently well co-ordinated or used to expand social insurance
coverage.
CHAPTER 5. STRENGTHENING THE SOCIAL PROTECTION SYSTEM 153
SOCIAL PROTECTION SYSTEM REVIEW OF INDONESIA © OECD 2019
Build on and refine the Unified Database
The Unified Database (UDB) is underpinning the development of a social assistance
system in Indonesia. Covering approximately 27 million households (or 96 million
individuals) in 2018, it not only serves as a targeting mechanism for a number of social
protection programmes but also to ensure that beneficiaries eligible for one programme
also receive other benefits to which they are entitled. From the perspective of the
beneficiary, the UDB significantly increases the likelihood they will emerge from poverty
by ensuring they access to a number of complementary social protection initiatives. From
a systems perspective, the UDB ensures coherence between programmes in terms of
whom they are targeting and serves as a basis for co-ordination.
However, not all ministries have opted to use the UDB for targeting or beneficiary
selection with many, such as the Ministry of Education and Culture, adopting their own
processes either due to outdated information in the UDB or due to missing variables that
are integral to their targeting approaches. As a consequence, the intended beneficiaries of
social assistance programmes often do not benefit from all the programmes to which they
are entitled. Implementers of different programmes or local administrations attempt to
address exclusion errors that might result from imperfect application of the UDB
targeting. However, TNP2K (2018[1]) finds that “this results in an absence of centralised
beneficiary management lists and a targeting system susceptible to bias by local actors”.
Exclusion from one or more social protection programme for which a beneficiary is
eligible is a major constraint on the overall effectiveness of the system in reducing
poverty. As the World Bank (2017[3]) notes, “While each individual program is relevant
for poverty reduction by creating a transparent pathway for beneficiary households to
mitigate a clearly-defined risk, none of these individual initiatives is by design to help all
targeted households fully mitigate or absorb all risks.” Equally, the limited resources
available to social protection also mean that inclusion errors can significantly reduce the
poverty-reducing impact of the system as a whole. As shown in Chapter 3, this is a
particular issue with the RastraRastra programme, which absorbs a significant portion of
the overall allocation to social protection.
In the future, the UDB will be managed by the Sistem Informasi Kesejahteraan Sosial
Next Generation (SIKS NG). SIKS NG will link databases managed by MoSA and other
ministries, state-owned banks and BPJS. The regular verification and validation process
will involve sub-national government. Online and offline SIKS applications were
launched in 2017 and will be updated regularly. The government has identified two
critical challenges to ensuring the success of the SIKS NG: lack of administrative
capacity at the data entry, verification and validation level and ensuring implementing
ministries use the new integrated system for their programmes.

154 CHAPTER 5. STRENGTHENING THE SOCIAL PROTECTION SYSTEM
SOCIAL PROTECTION SYSTEM REVIEW OF INDONESIA © OECD 2019
Box 5.1. Social protection cards are promoting access to benefits and financial inclusion
Identity cards have an important role to play in developing a social protection system in
Indonesia. Not only can they foster integration between schemes and thus expand
coverage but they also have the potential to improve the efficiency of cash-based payment
systems and promote beneficiaries’ financial inclusion. However, gaps in national
registration processes are resulting in the exclusion of poor and vulnerable individuals.
The national identification card, known as the Kartu Tanda Penduduk (KTP) is the
cornerstone of public administration. All citizens require a KTP to access public services.
The card (which is valid for life) contains biometric information on cardholders that is
stored electronically. The children’s identity card (Kartu Identitas Anak, KIA) is the
equivalent of the KTP for children up to the age of 17. Newborn children are supposed to
be issued with a KIA at the same time as they receive a birth certificate. The objective is
for all children should possess a KIA by the end of 2019.
The Prosperous Family Card (Kartu Keluarga Sejahtera, KKS) is the basis for eligibility
for social assistance and is provided to heads of families identified as being poor or
vulnerable by the UDB. Giving effect to Presidential Regulation No. 63/2017 on Cashless
Social Assistance Distribution, the KKS is linked to a bank account, which enables social
protection beneficiaries to receive transfers electronically, thereby promoting their
financial inclusion. It replaced the social protection card (KPS), which was provided to
households eligible for the unconditional cash transfer (BLSM).
Households with a KKS that have children between age 6 and 21 in full-time education
should automatically receive the Smart Indonesia Card (Kartu Indonesia Pintar, KIP),
allowing them to receive the Program Indonesia Pintar (PIP). In the same way, holders of
the KKS should also automatically receive the Healthy Indonesia Card (Kartu Indonesia
Sehat, KIS), which entitles them free access to healthcare as PBI beneficiaries of JKN.
The KKS is provided by four banks (Bank Rakyat Indonesia, Bank Negara Indonesia,
Bank Tabungan Negara and Bank Mandiri). By connecting beneficiaries to the formal
banking sector (leveraging the high penetration of mobile technology across the
population), the KKS contributes to the GoI’s commitment to enhancing financial
inclusion among the poor and vulnerable. This enables beneficiaries to save and borrow.
The cards not only serve as a means of receiving benefits but can also be used to purchase
subsidised goods in special shops (e-Warong). These shops are run by groups of
beneficiaries enrolled in the PKH-KUBE programme in an initiative implemented by
MoSA with the collaboration of other government agencies, the financial regulatory
authority and commercial banks (World Bank, 2017[3]).
While Indonesia’s identification cards hold significant potential as a mechanism for
greater systematisation of social protection as well as greater financial inclusion for
beneficiaries, it must overcome a fundamental challenge with the KTP. Coverage of the
KTP is not universal; estimates of the number of children in Indonesia without birth
certificates range from 29% (or 24 million children) to 47% (DFAT/PEKKA/PUSKAPA
UI, 2015[4]). This means that large numbers of children risk exclusion from social
protection for administrative reasons. Lack of registration is particularly high among low-
income households, with evidence showing the cost of registration to be the principal
impediment, especially in remote areas (Duff, Kusumaningrum and Stark, 2016[5]).

CHAPTER 5. STRENGTHENING THE SOCIAL PROTECTION SYSTEM 155
SOCIAL PROTECTION SYSTEM REVIEW OF INDONESIA © OECD 2019
A major challenge for the UDB is keeping track with the dynamics of poverty and
vulnerability discussed in Chapter 1. Although the stock of poor and vulnerable
households might have been relatively stable at 40% over recent years, there have been
significant flows between income groups by individuals and households. Moreover, the
overall poor and vulnerable population is shrinking as a proportion of the population.
From 2017 onwards, a decree by MoSA requires that the UDB be updated twice per year,
in May and November. Sub-national governments can update it at any time. However,
households in many parts of the country are difficult to reach and the demands associated
with regularly updating the database, both in terms of cost and capacity, are often beyond
local administrations. They might also not recognise the value or importance of doing so.
In this context, it is critical that individuals themselves are aware of their entitlements and
are able to request enrolment in a programme for which they might be eligible. Indonesia
has made progress in this regard through the development of single-window services and
on-demand application. These interventions also yield important gains in terms of
strengthening the social protection system.
MoSA’s integrated referral system (Sistem Rujukan dan Layanan Terpadu, SLRT), which
operates at the district level, allows facilitators to identify poor and vulnerable households
to ensure they are receiving appropriate social protection support. Following a successful
piloting, SLRT is expected to be operating in 150 districts in 2019. On-demand
application, which allows individuals to request enrolment in a programme, is a
component of the SLRT but is managed by TNP2K. It currently operates in 12 districts.
The SLRT is also equipped to deal with grievances (World Bank, 2017[3]).
Single window services have achieved some notable success in Indonesia in recent years.
However, these are typically a mechanism by which local governments can improve
access to (and provision of) local services. In this case, the SLRT is intended as a means
for local governments to enhance access to national.
Nonetheless, the SLRT has the potential to improve the responsiveness of the social
protection system and reduce targeting errors by keeping track of individuals moving in
and out of poverty. It can also ensure beneficiaries are accessing the programmes to
which they are eligible and, where needed, move beneficiaries from one programme to
another.
Clarify and optimise sub-national government’s role in social protection
As discussed in Chapter 4, responsibility for social protection provision is shared between
national and sub-national government as a concurrent function. Such an arrangement is
consistent with other countries, where local administrations not only support the
implementation of national social protection programmes and strategies but also monitor
their impact and performance and provide reliable information that can inform policy-
making at the national level. However, in Indonesia’s case, the degree of decentralisation
and the variation that exists across the country make it a particular challenge as far as
establishing a social protection system is concerned.
Sub-national governments are able to implement their own social protection programmes
even though the Ministry of Home Affairs Regulation No 32 of 2011 prevents local
governments from providing cash transfers to households on an ongoing basis. As
TNP2K notes, “an increasing number of districts and provinces have been introducing
their own social protection schemes…there is a danger that this proliferation…will reduce

156 CHAPTER 5. STRENGTHENING THE SOCIAL PROTECTION SYSTEM
SOCIAL PROTECTION SYSTEM REVIEW OF INDONESIA © OECD 2019
cohesion and co-ordination within the broader social protection system. Furthermore,
challenges with existing regulations restrict local governments’ ability to design their own
cash transfer programmes” (TNP2K, 2018[1]).
Another challenge with decentralisation relates to targeting. As with any sample survey,
the data that served as the basis for the UDB is imperfect. Moreover, considerable time
has elapsed since that survey and, as discussed above, the architecture required to ensure
the UDB remains up to date is not yet in place. In this context, sub-national
administrations have understandable misgivings about the UDB and are empowered to
influence who receives the benefit, meaning they can correct for exclusion errors.
Ad hoc involvement by sub-national administrations in the targeting of benefits for
different programmes makes it less likely that beneficiaries access all the programmes for
which they are eligible. Moreover, eligibility can also be determined by local political
factors, generating inclusion errors and diluting the resources available for poor and
vulnerable households. Enforcing common standards for implementation is rarely
practical, especially given the challenges related to social workers (also known as
facilitators) discussed below. Mechanisms and opportunities for co-ordination between
sub-national administrations and the central government are limited.
Although some 88% of social assistance spending is financed centrally, sub-national
governments’ fiscal autonomy empowers them to contribute to the financing of social
protection (Jellema and Hassan, 2012[6]). In theory, they are expected to top-up social
protection budgets to increase benefit payments and finance the operations of facilitators.
In practice, these contributions have never been formalised. However, certain sub-
national governments implement social protection programmes of their own design,
targeted at beneficiaries according to their own criteria.
This has been observed with the Village Funds. Although almost 90% of Village Fund
expenditure is allocated to local infrastructure development, there is evidence that village
administrations also provide cash transfers and food to households that they consider in
need of support, without regard for national registries (Gama, Saget and Elsheikhi,
2018[7]). Indeed, a household might receive support precisely because they are not eligible
for a national social protection programme.
As a result, the implementation of reforms designed by national social protection planners
might differ widely from what was intended. This undermines attempts to reduce poverty
by expanding a specific programme. As the World Bank (2017[8]) notes, “entrenched and
idiosyncratic operating principles suggest that increasing any single programme’s
coverage will bring only a small percentage of targeted households a ‘full’ benefit”.
Looking ahead, Indonesia’s progress towards universal health coverage has been an
international success story but also provides a cautionary tale regarding how tensions
between national and sub-national government can delay reform. In the early 2000s,
health provision emerged as a key electoral issue at the sub-national government level,
which in turn raised the level of political commitment at central government. Subsequent
initiatives to enhance health coverage that were driven by national government, including
JKN itself, have encountered resistance from sub-national governments reluctant to give
up their schemes (Pisani, Kok and Nugroho, 2017[9]).
CHAPTER 5. STRENGTHENING THE SOCIAL PROTECTION SYSTEM 157
SOCIAL PROTECTION SYSTEM REVIEW OF INDONESIA © OECD 2019
Empower social workers to implement and strengthen social protection policies
Social workers, known as facilitators in Indonesia, play a critical role in any social
protection system. They have the face-to-face contact with poor and vulnerable
households required to ensure they are receiving the holistic support they need (beyond
income), and they have unique insight to how well social protection programmes –
national or otherwise – are responding to people’s needs and how well such programmes
are being implemented.
Social work faces fundamental challenges in Indonesia. It is not universally considered a
profession and there are shortcomings in the education and training social workers
receive. Consistent with many countries in South-East Asia, policies to elevate the status
of social workers and improving their training are required. The GoI, which is the
principal employer of social workers, has a role to play in both, by fully recognising and
clearly articulating the role of social workers, by implementing regulations that govern
their work, and through quality assurance for their training (O’Leary et al., 2018[10]).
Progress has been made towards addressing these challenges, in part as a consequence of
the national and international response to the tsunami in Aceh in December 2004.
Nonetheless, the potential of social workers to support the implementation of a social
protection system is largely under-utilised. Facilitators are employed by MoSA, not as
permanent employees but on the basis of annual contracts, which is a constraint on the
development of a large, well-qualified body of social workers in social protection.
The principal responsibilities of facilitators are to ensure that eligible individuals receive
benefits and to monitor compliance with conditionalities. As Chapter 2 notes, PKH is
placing greater emphasis on supporting families more broadly. This is consistent with
emerging evidence that supporting parents is critical for enhancing the cognitive
developmental of young children, underlining the importance of embedding cash transfers
such as PKH within a broader set of interventions aimed at families as a whole (Aboud
and Yousafzai, 2015[11]; Arriagada et al., 2018[12]).
At the time of writing, not enough is known about the specific workloads (or the time
required to fulfil these workloads) of social workers across Indonesia. It is therefore not
possible to assess whether sufficient facilitators are employed or whether they possess
adequate skills. All facilitators are supposed to receive centralised training courses when
they start, but financial and logistical factors mean this doesn’t always happen. These
factors also limit the possibility to provide further training to bring social workers up to
speed with social protection reforms. Given the speed with which PKH and other
programmes have scaled up in recent years, not to mention the complexity of the overall
social protection system, it is not realistic to presume facilitators will be able to keep up.
Continue to consolidate social assistance programmes
The current approach to social assistance is one of targeting (resources to individuals
most in need through a number of complementary arrangements that, together, will allow
them to exit poverty on a sustainable basis. With the key social assistance programmes
meant to be using the UDB and an associated system of cards to designate eligibility, the
underlying architecture appears to be in place. However, it is frequently not the case that
a poor individual will receive all the benefits to which they are entitled: in 2014 (before
UDB was as widely used across social assistance programmes as it is today), less than

158 CHAPTER 5. STRENGTHENING THE SOCIAL PROTECTION SYSTEM
SOCIAL PROTECTION SYSTEM REVIEW OF INDONESIA © OECD 2019
30% of families in the poorest decile that were receiving PKH also benefited from PIP
and Rastra and were registered as PBI (World Bank, 2017[2]).
Figure 5.1. Social protection coverage is not comprehensive amongst the poor
Social protection coverage across the five poor clusters, 2016
Note: PKH is not included because it is not identified by Susenas 2016
Source: Susenas 2016.
This picture of fragmented coverage is borne out by the Latent Class Analysis (LCA)
carried out in Chapter 1. Figure 5.1 identifies coverage of social protection mechanisms
amongst the five poor clusters identified in Chapter 1 using data from Susenas 2016
(excluding PKH, receipt of which was not specified by the survey). It demonstrates
significant variation between the different clusters in terms of which social protection
programmes they receive (including health insurance). Raskin is the only programme
with coverage in excess of 50% in any of the poor clusters. This exercise also shows low
coverage of social protection cards.
The challenges inherent to linking poor households to a range of complementary
interventions indicate a need to rationalise programmes in alignment with the
vulnerabilities identified by the LCA in Chapter 1 and invest in the ones that are most
effective in reducing poverty. For example, to address child poverty, there is overlap
between PKH and the PIP.
This report supports the recommendation of TNP2K that PKH and PIP be merged. The
results of Chapter 3 indicate that PKH is more effective at reducing poverty and support
the GoI’s decision to continue scaling up the programme. The logic for maintaining both
programmes is weakening. However, this is unlikely to be straightforward, given that
different ministries are responsible for implementing these programmes and the
populations covered by the respective programmes are different (even though by design
there should be significant overlaps).
Cluster 1: [66%] Raskin[45%] No health insurance[32%] PBI[23%] PIP[20%] Social protection card
[25%] Extreme poor[25%] No social protection
Cluster 2:[72%] Raskin [50%] Social protection card [42%] PBI [34%] PIP[33%] No health insurance
[40%] Extreme poor[16%] No social protection
Cluster 3:[75%] No social protection card[64%] Raskin[45%] No health insurance[30%] PBI
[17%] Extreme poor[25%] No social protection
Cluster 4:[80%] Raskin[40%] PBI[39%] No health insurance[38%] Social protection card
[33%] Extreme poor[16%] No social protection
Cluster 5:[73%] Raskin; [40%] No health insurance; [38%] PBI; [18%] PIP; [33%] SP card [14%] Extreme poor

CHAPTER 5. STRENGTHENING THE SOCIAL PROTECTION SYSTEM 159
SOCIAL PROTECTION SYSTEM REVIEW OF INDONESIA © OECD 2019
This report also acknowledges TNP2K’s proposal that PKH does not serve as a
mechanism for providing benefits to poor and vulnerable elderly individuals or those with
severe disabilities, since benefits to these groups should be provided by other social
protection programmes. However, incorporating a benefit for the elderly within PKH has
been a critical means of increasing support for such an intervention and has thus made it
more likely that poor elderly individuals will receive some form of public income
support.
Universalisation of a child grant would eliminate a number of the institutional and
geographical factors responsible for the low levels of coverage currently achieved by
PKH. However, the cost would be prohibitive, unless benefits are so low as to have a
minimal impact on poverty. It would be difficult to achieve universal coverage of a child
grant given the large numbers of children without proper identification, including birth
certificates.
Scaling up and better targeting an integrated PKH-PIP benefit to cover the 23 million
children registered on the UDB might represent the optimal outcome. This expansion
should be accompanied by a concerted effort to enhance access to early childhood
education and learning facilities and other complementary interventions.
Prepare for growing pressure around benefits for the elderly
As Chapter 1 discusses, old-age poverty is high and has not achieved the same decline as
poverty among children in recent years. Given the challenges inherent to increasing social
insurance coverage in Indonesia (discussed below), pressure for more effective social
assistance for the elderly is likely to build as Indonesia’s demographic transition
progresses. This would also be a mechanism for mitigating the disadvantages women face
over the course of their lives.
TNP2K proposes a universal pension for all individuals aged 70 and over who are not in
receipt of a contributory pension (TNP2K, 2018[1]). At the present time, this proposal is
unlikely to gain traction: the financial implications of such an intervention would be very
large and there is a lack of both political and popular demand for the measure.
Nonetheless, it is important to prepare the social protection system as a whole for the
rapid ageing of the population, rather than relying solely on growth in social insurance
arrangements. As such, it is important to consider the scope and design of both
contributory and non-contributory arrangements.
Social assistance for the elderly should be harmonised with social insurance arrangements
in order to establish a coherent set of public policies for individuals in retirement.
TNP2K’s proposal that a social pension be provided from age 70 onwards would create a
large discrepancy in retirement ages between social assistance and the contributory
system (where the retirement age was 56 for men and women in 2018 but will rise to 65
over time).
Taking advantage of the greater consistency of retirement ages across different
programmes, Thailand established a voluntary savings scheme, the National Savings
Fund, in 2015 by which individuals can supplement the low monetary value of the old-
age allowance without jeopardising their access to it. Indonesia’s old age savings scheme
provides social insurance access to non-wage earners, including low contribution rates for
those with low incomes, but members must also contribute to schemes providing survivor
benefits and compensation for injury at work. BPJS is considering subsiding these

160 CHAPTER 5. STRENGTHENING THE SOCIAL PROTECTION SYSTEM
SOCIAL PROTECTION SYSTEM REVIEW OF INDONESIA © OECD 2019
contributions for the poor and at-risk to enhance the affordability, flexibility and
attractiveness of the saving scheme (TNP2K, 2018[1]).
Box 5.2. Social protection can address systemic gender disadvantages
As Chapters 1 and 3 of this report demonstrate, girls and women in Indonesia tend to be
poorer than men at almost every stage in the life cycle. Disadvantages women face earlier
in life, for example a lower likelihood of completing education, have a significant impact
on their prospects at working age. Female labour force participation is much lower than
the equivalent metric for men and women’s incomes are lower as a result. The cumulative
effect is to leave women extremely vulnerable in old age.
Indonesia’s current social protection system does little to address the disadvantages
women face over the course of their lives. When considering the future of social
protection in Indonesia, it will be critical to ensure reforms are gender-sensitive and
mitigate rather than reinforce these disadvantages.
As Chapter 3 notes, promoting social insurance coverage of the informal sector and
recognising the impact of child-bearing on women’s potential to contribute to such
arrangements will be very important in this regard. Higher social assistance coverage
among the elderly would also help to reduce women’s vulnerability in old age.
Strengthen the contributory system to reach the missing middle
As this review has identified, Indonesia confronts a significant missing middle problem.
Although poverty has declined significantly since the Asian Financial Crisis, the
proportion of the population classified as poor and vulnerable has remained relatively
consistent, at around 40% of the population. Social assistance programmes have
predominantly been targeted at households in extreme poverty, while only households at
the high end of the income distribution are enrolled in pension programmes. At the heart
of the missing middle problem lies the high proportion of workers in informal
employment.
Through the SJSN and BPJS Laws of 2004 and 2011, social insurance has been at the
forefront of systematisation of social protection. Institutional arrangements for health and
labour insurance have been integrated into BPJS Health and Labour respectively, with
DJSN providing oversight of both. At the same time, new programmes have been added
to broaden coverage of contributory arrangements. However, health and labour social
insurance arrangements have very different administrative and financial modalities,
which limits the extent to which co-ordination between them is feasible.
Rapid growth in the proportion of the population covered by health insurance has been
the major success story of social protection in Indonesia. By using general revenues to
subsidise contributions of individuals with limited capacity to contribute, it is on the way
to achieving universal health coverage in a relatively short period of time. However, its
success has come at a cost: overcoming the missing middle challenge has resulted in
adverse selection and behavioural responses outlined in Chapter 3 that are undermining
the sustainability of the system.
BPJS Labour has also sought to distinguish between different types of member as a
means of expanding coverage, establishing different arrangements for wage and non-

CHAPTER 5. STRENGTHENING THE SOCIAL PROTECTION SYSTEM 161
SOCIAL PROTECTION SYSTEM REVIEW OF INDONESIA © OECD 2019
wage workers. As mentioned above, contributions are lower for non-wage workers (who
are not enrolled in the new JP scheme) but the GoI does not subsidise pension
contributions like it does health contributions.
Although this dual system might facilitate enrolment in at least one public programme, it
weakens the coherence of the retirement landscape. If some form of social pension were
to be introduced, it would be important that it doesn’t serve to further fragment this space;
a requirement that social pension recipients do not receive other forms of pension might
control costs of universalisation but it would reduce coherence.
Faced with perhaps the fastest demographic transition ever registered (as well as a large-
scale informal sector), Viet Nam is making a major push to increase pension coverage.
Following China’s example, a social insurance reform in 2014 has made it much easier to
enrol in social insurance for low-income workers in agriculture and the informal sector on
a voluntary basis. However, low contribution rates will translate into low pensions in
retirement.
The composition of the informal sector indicates that a differentiated strategy for reaching
this group is required. The proportion of the informal workforce classified as employees
and own-account workers respectively is very similar; together they account for 85% of
the informal labour force. Recent experience from Viet Nam indicates that increasing
coverage in small and medium-sized enterprises (SMEs) is critical to reaching individuals
in the middle of the income distribution (Castel and Pick, 2018[13]).
Although Indonesia’s SME sector is not an extensive as Viet Nam’s, it accounts for 97%
of domestic employment (OECD, 2018[14]). Expanding coverage among these workers
would go a long way towards enhancing social insurance coverage in Indonesia and
might also promote higher levels of formalisation and tax compliance. A combination of
contribution incentives and stronger enforcement are likely to hold the key to expanding
coverage amongst Viet Nam’s SMEs and might do likewise in Indonesia (Castel and
Pick, 2018[13]).
Increasing social insurance coverage (and enhancing formalisation) will require a broader
restructuring of employment legislation in Indonesia. Current severance pay
arrangements impose a cost on compliant employers and risk distorting employment
decisions. As a result, many employers do not implement these arrangements properly,
leaving employees vulnerable to a sharp loss in income in the event they lose their jobs,
especially since Indonesia lacks an unemployment insurance scheme. Reviewing these
arrangements while incentivising and enforcing employer contributions to social
insurance has the potential both to better protect the employee and to improve the
functioning of the labour market.
An issue for consideration in this regard is whether Indonesia requires an unemployment
insurance fund. Viet Nam has such a fund but it is notable that it does not seem to prevent
workers from wanting to access retirement savings when they change job. In the
Indonesian context, the provident fund serves the purpose of a precautionary saving
arrangement for formal sector employees.
A bright future for social protection but higher funding is needed
A number of the reforms proposed in this report are far-reaching, institutionally
disruptive, or difficult to implement. They will require strong political will and technical
expertise. Recent evidence indicates that these necessary conditions for reform are falling

162 CHAPTER 5. STRENGTHENING THE SOCIAL PROTECTION SYSTEM
SOCIAL PROTECTION SYSTEM REVIEW OF INDONESIA © OECD 2019
into place. Social protection in Indonesia has received strong support from successive
administrations since the Asian Financial Crisis. This has been a critical factor behind
some the passage of the two landmark social insurance laws and, more recently, the scale-
up of social assistance.
The current president, Joko Widodo, has played a key role in raising the profile of social
assistance. A presidential election scheduled to take place in 2019 raises the possibility of
a change in administration. However, the integration of social protection in key policy
frameworks reduces the extent to which the momentum behind social protection would be
reversed in that eventuality.
Donors are playing a critical role in supporting the development of a social protection
system. Although volumes of official development assistance have declined substantially
since Indonesia graduated from the International Development Association in 2009,
development partners are supporting the development of social protection system through
technical assistance and financing support, exemplified by the World Bank’s PKH loan
mentioned in Chapter 4.
At present, a lack of financing is the greatest constraint to the effectiveness of social
protection. Although social protection is becoming a high budget priority and will even
drive higher overall public spending in 2019, Indonesia’s tax revenues remain too low to
allow for a major scale-up of social protection in the short-to-medium term. Spending
will increase in absolute terms but is likely to remain below 2% of GDP. Recent increases
in tax revenues will need to be sustained to increase the social protection system’s
capacity to reduce poverty and inequality.
References
Aboud, F. and A. Yousafzai (2015), “Global Health and Development in Early Childhood”,
Annual Review of Psychology, Vol. 66/1, pp. 433-457, http://dx.doi.org/10.1146/annurev-
psych-010814-015128.
[11]
Arriagada, A. et al. (2018), Promoting early childhood development by strengthening linkages
between cash transfers and parenting behaviors, World Bank, Washington DC,
http://documents.worldbank.org/curated/en/489331538646764960/pdf/130492-WP-PUBLIC-
P163425-BriefCombiningCashTransfersandParentingInterventionsWEB.pdf (accessed on
7 February 2019).
[12]
Castel, P. and A. Pick (2018), “Increasing social insurance coverage in Viet Nam’s SMEs”,
OECD Development Policy Papers, No. 13, OECD Publishing, Paris,
https://dx.doi.org/10.1787/ec14725e-en.
[13]
DFAT/PEKKA/PUSKAPA UI (2015), AIPJ Baseline Study on Legal Identity: Indonesia’s
Missing Millions, Australia Indonesia Partnership for Justica (AIPJ), Department of Foreign
Affairs and Trade (DFAT); Perempuan Kepala Keluarga (PEKKA); Pusat Kajian dan
Advokasi Perlindungan dan Kualitas Hidup Anak, Universitas Indonesia (PUSKAPA UI),
http://www.dfat.gov.au (accessed on 16 January 2019).
[4]
CHAPTER 5. STRENGTHENING THE SOCIAL PROTECTION SYSTEM 163
SOCIAL PROTECTION SYSTEM REVIEW OF INDONESIA © OECD 2019
Duff, P., S. Kusumaningrum and L. Stark (2016), “Barriers to birth registration in Indonesia”,
The Lancet Global Health, Vol. 4/4, pp. e234-e235, http://dx.doi.org/10.1016/S2214-
109X(15)00321-6.
[5]
Gama, A., C. Saget and A. Elsheikhi (2018), Labour Market Inventory ASEAN 2010-15: Labour
market policy in an age of increasing economic integration, International Labour
Organization, Geneva, https://www.ilo.org/global/research/WCMS_650064/lang--
en/index.htm (accessed on 30 January 2019).
[7]
Jellema, J. and N. Hassan (2012), “Protecting poor and vulnerable households in Indonesia :
Main report”, in Public Expenditure Review (PER), World Bank, Washington, DC,
http://documents.worldbank.org/curated/en/459361468044650535/Main-report.
[6]
OECD (2018), SME and Entrepreneurship Policy in Indonesia 2018, OECD Studies on SMEs
and Entrepreneurship, OECD Publishing, Paris, https://dx.doi.org/10.1787/9789264306264-
en.
[14]
O’Leary, P. et al. (2018), “Developing the social work role in the Indonesian child protection
system”, International Social Work, Vol. 00/0, pp. 1-15,
http://dx.doi.org/10.1177/0020872817747028.
[10]
Pisani, E., M. Kok and K. Nugroho (2017), “Indonesia’s road to universal health coverage: a
political journey”, Health Policy and Planning, Vol. 32, pp. 267-276,
http://dx.doi.org/10.1093/heapol/czw120.
[9]
TNP2K (2018), The Future of the Social Protection System in Indonesia: Social Protection for
All, The National Team for the Acceleration of Poverty Reduction, Jakarta.
[1]
World Bank (2017), Indonesia Public Expenditure and Financial Accountability, World Bank,
Jakarta, https://openknowledge.worldbank.org/handle/10986/29820 (accessed on
31 January 2019).
[8]
World Bank (2017), Program Appraisal Document on a Proposed Loan in the amount of US$200
million to the Republic of Indonesia for a Social Assistance Reform Program, World Bank,
Washington DC,
http://documents.worldbank.org/curated/en/353221496152466944/pdf/Program-Appraisal-
Document-PAD-disclosable-version-P160665-2017-04-15-04202017.pdf (accessed on
16 January 2019).
[2]
World Bank (2017), Towards a Comprehensive, Integrated, and Effective Social Assistance
System in Indonesia, World Bank Group, Washington, DC,
http://documents.worldbank.org/curated/en/535721509957076661/Towards-a-comprehensive-
integrated-and-effective-social-assistance-system-in-Indonesia.
[3]

ORGANISATION FOR ECONOMIC CO-OPERATIONAND DEVELOPMENT
The OECD is a unique forum where governments work together to address the economic, social andenvironmental challenges of globalisation. The OECD is also at the forefront of efforts to understand and tohelp governments respond to new developments and concerns, such as corporate governance, theinformation economy and the challenges of an ageing population. The Organisation provides a settingwhere governments can compare policy experiences, seek answers to common problems, identify goodpractice and work to co-ordinate domestic and international policies.
The OECD member countries are: Australia, Austria, Belgium, Canada, Chile, the Czech Republic,Denmark, Estonia, Finland, France, Germany, Greece, Hungary, Iceland, Ireland, Israel, Italy, Japan, Korea,Latvia, Lithuania, Luxembourg, Mexico, the Netherlands, New Zealand, Norway, Poland, Portugal, theSlovak Republic, Slovenia, Spain, Sweden, Switzerland, Turkey, the United Kingdom and the United States.The European Union takes part in the work of the OECD.
OECD Publishing disseminates widely the results of the Organisation’s statistics gathering andresearch on economic, social and environmental issues, as well as the conventions, guidelines andstandards agreed by its members.
OECD DEVELOPMENT CENTRE
The OECD Development Centre was established in 1962 as an independent platform for knowledgesharing and policy dialogue between OECD member countries and developing economies, allowing thesecountries to interact on an equal footing. Today, 27 OECD countries and 27 non-OECD countries aremembers of the Centre. The Centre draws attention to emerging systemic issues likely to have an impacton global development and more specific development challenges faced by today’s developing andemerging economies. It uses evidence-based analysis and strategic partnerships to help countriesformulate innovative policy solutions to the global challenges of development.
For more information on the Centre and its members, please see www.oecd.org/dev.
OECD PUBLISHING, 2, rue André-Pascal, 75775 PARIS CEDEX 16
ISBN 978-92-64-97045-8 – 2019

00
IND
ON
ESIA
OECD Development Pathways
Social Protection System Review of Indonesia
OECD Development Pathways
Social Protection System Review of IndonesiaIndonesia has made impressive progress in reducing income inequality and improving living standards since the Asian Financial Crisis but the decline in poverty has slowed in recent years while inequality has risen and a large part of the population remains vulnerable. The Government of Indonesia has recognised the potential of social protection to address these challenges and to underpin a long-term development strategy based on more inclusive economic growth. As a consequence, social assistance programmes have grown significantly in recent years while social insurance has undergone major reforms. The Government is gradually realising its vision of a system of social protection, based on comprehensive and coherent coverage for all age groups.
The Social Protection System Review of Indonesia charts the evolution of social protection. It explores the current context for social protection and how this is likely to evolve in the future, analyses the extent to which existing programmes are aligned to those needs and how effective these programmes are at reducing poverty. It also examines the financing of social protection. Finally, it proposes policies to enhance the social protection system across a number of dimensions, including programmes, institutions, financing and information architecture.
ISBN 978-92-64-97045-8
Consult this publication on line at https://doi.org/10.1787/788e9d71-en.
This work is published on the OECD iLibrary, which gathers all OECD books, periodicals and statistical databases. Visit www.oecd-ilibrary.org for more information.
9HSTCQE*jhaefi+This project is co-funded bythe European Union
So
cial Pro
tection S
ystem R
eview o
f Ind
on
esia O
EC
D D
evelop
ment P
athways


![Auditing and Optimising your Social Media Strategy_matt_alder[1]](https://img.pdfslide.us/doc/110x75/54838b11b4af9f2e148b46fd/auditing-and-optimising-your-social-media-strategymattalder1.jpg)