Embed Size (px)
Citation preview

Social Origins of Dictatorships: Elite Networks andPolitical Transitions in Haiti
Suresh Naidu∗ James A. Robinson† Lauren E. Young‡
October 2017
Abstract
Existing theories of coups against democracy emphasize that elites mount coups whendemocracy is particularly threatening to their interests. But holding interests constant,some potential plotters may have more influence over whether or not a coup succeeds. Wedevelop a model where coups generate rents for elites and show that the likelihood of eliteparticipation is increasing in their network centrality. We empirically explore the modelusing an original dataset of Haitian elite networks which we linked to firm-level data. Weshow that central families were more likely to participate in the 1991 coup against thedemocratic Aristide government. We then find that the retail prices of staple goods importedby coup participators differentially increase during subsequent periods of non-democracy.Finally, we find that urban children born during democratic reversions are more likely toexperience adverse health outcomes. Our results suggest that elite social structure affectsdevelopment via political institutions.
JEL Classification: D7, D85, I13, L12, N46.Keywords: Democracy, Autocracy, Coups, Elites, Social Networks.
∗Columbia University, Department of Economics/SIPA, 420 W 118 St MC 3308, New York, NY 10027; E-mail:[email protected].†University of Chicago, Harris School of Public Policy, 1155 East 60th Street Chicago, Illinois 60637; E-mail:
[email protected].‡UC Davis, Department of Political Science, 1 Shields Ave, Davis, CA 95616; E-mail: [email protected].
We thank PEDL, INURED, the Columbia Population Research Centre, and the Harvard Weatherhead Programfor research support. We thank Louis Marcelin, Paul Farmer, and the late Patrick Elie for valuable contacts andconversations about Haiti. Becky Simonson, Jeff Jacobs, and Ellora Derenoncourt all provided valuable researchassistance.
1

1 Introduction
Between 1960 and 2010, 51 countries experienced a total of 71 democratic reversals (Acemoglu
et al., 2014). Existing theories suggest that coups occur when democracy threatens the interests
of elites who have the power to overthrow it. When the elites control a greater proportion of
wealth, or are invested in activities that can be easily taxed, the policy choices of the masses
under democracy are more likely to create an economic incentive for these elites to support a
coup.
Ultimately, coups take place when a group of elites, whether military commanders, a political
faction, or the wealthy, collectively organize to overthrow a government. We argue that within
these groups, social networks are important for coordinating activities or spreading information,
and that network positions create variation in the amount of influence that individuals have
over the behavior of others. Despite the considerable focus on social networks in other areas of
collective action, the role of elite social networks in organizing resistance to democracy has so
far received little attention.
In this paper we undertake to our knowledge the first investigation of the role of social
networks in coups against democracy. We develop a dynamic game theoretic model of coups in
the spirit of Acemoglu and Robinson (2001, 2006, 2008) extended to include social networks
as modeled by Ballester, Calvó-Armengol and Zenou (2006). There are three types of agents:
citizens, elites and a dictator. The economy features a fixed number of industries, each inhabited
by a subset of elites. The median voter, a citizen, determines policy in a democracy and prefers
competitive markets. Elites, however, prefer entry barriers that allow them to raise prices. To
achieve this they can choose to exert effort towards a coup and they are inter-connected via
a social network. We assume that elite actions are strategic complements along the network
and the incentive to mount a coup is that if democracy falls the dictator who comes to power
concedes to some elites the right to levy ‘taxes’ on competitors as barriers to entry to generate
rents for themselves.
The model has a number of implications that we take to the data. First, the willingness of an
elite agent to contribute to a coup is an increasing function of their network (Bonacich) centrality.

Intuitively, the more central an elite is in the network the more impact his actions have on the
actions of others and the more likely it is that he will be a coup participant. Second, the higher
the centrality of an elite, the more likely he will be part of the ruling coalition. Third, the model
predicts that coup participants should gain economically from the coup and in particular should
see their prices rise. Finally, the model predicts that coups hurt citizens through the higher retail
prices that result from less competitive markets.
To test these hypotheses we constructed several original Haitian datasets which we describe
in detail in Section 5. There were a number of motivations for testing the ideas in Haiti, a
case that is archetypical of many politically unstable countries. First, after the 1991 coup
against the democratically-elected government of Jean-Bertrand Aristide, the U.S. Treasury
Department published a targeted sanctions list which named individual elites associated with the
coup government. This list was created on the basis of rigorous intelligence efforts by the U.S.
government to determine who had provided support to the 1991 coup. This gives us a rare list
of people who participated in a coup. Second, there are rich genealogical sources for Haiti that
allow us to understand the social networks of elite families and map elite family involvement
in business and politics back to the 19th century. Moreover, Haiti is sufficiently small that one
has some hope of constructing a relatively complete network. Fourth, given our focus, it is
advantageous that there is variation in regime type because of frequent coups and transitions.
Finally, it is much easier to access data on imports than on domestic production because goods
are tracked when they enter the country. Because much of the Haitian elite’s wealth stems from
imports, and because many Haitian households’ consumption baskets, particularly in urban areas,
are highly import-dependent, a relatively large portion of the Haitian economy is visible to us.
We use this data in several ways. First we estimate the probability that a particular elite
family participated in the 1991 coup. Our data allows us to examine the relationship between
centrality and coup participation conditional on economic interests, social characteristics, and
past political involvement. Our main results are consistent with the model: the probability that a
family participated in the coup is increasing in a range of centrality measures.
Next we turn to the relationship between coup participation and retail prices. We test whether
the domestic prices of the goods imported by coup participants went up more than the prices of
2

goods imported by non-participants in a subsequent period of autocracy. We estimate a dynamic
panel data model to estimate the differential effect of this autocratic spell from 2004 to 2006 on
the retail prices of products imported by families who participated in the 1991 coup. We find
robust evidence that the prices of goods imported by coup participants increased relative to those
of non-participants during autocracy.
Finally, we look directly at welfare, in particular child health. We use data on child heights and
weights from four waves of the Demographic and Health Survey (DHS) to test whether children
born in import-dependent urban areas under autocracy have differentially worse nutritional
outcomes than rural children who get more of their nutrition from home production. We find
robust evidence that urban children born during autocratic reversions are smaller in terms of
height and weight both over time and relative to rural children born at the same time. Together,
our results suggest that elite network structure is important for non-democratic transitions, and
ultimately for welfare and development.
Our paper is related to several other contributions. Our basic theoretical results on the
connection between network centrality and coups are applications of ideas first proposed by
Ballester, Calvó-Armengol and Zenou (2006) and Galeotti et al. (2010). Our model is also related
to other models of coups, in particular Acemoglu, Ticchi and Vindigni (2010) who focus on the
military. Although most of the literature on autocratic persistence has focused on institutions (e.g.
Gandhi, 2008, and Svolik, 2012), Carter (2014) shows how the president of Congo-Brazzaville
manipulated elite social networks to maintain power.
On the empirical side to our knowledge nobody has estimated a micro model of participation
in a coup before. Indeed, most of the empirical work on political regime transitions has been very
macro (an exception is the pioneering work of Aidt and Franck (2013), who study the extension
of voting rights in 19th century Britain). However, several past studies have found evidence that
coups have materialistic motivations (Mitra, Thomakos and Ulubasoglu, 2002; Dube, Kaplan
and Naidu, 2011), and that elites benefit economically from restrictions of democracy (Naidu,
2012) and suffer during expansions (Dasgupta and Ziblatt, 2014). Conversely, there is existing
evidence that democracy improves the general welfare in terms of health and nutrition (Besley
and Kudamatsu, 2006; Blaydes and Kayser, 2011) and that coups lower growth and public goods
3

provision (Acemoglu et al., 2014, 2015; Meyersson, 2016).
Our research is also related to other research on networks. Our approach to measuring the
power of elite agents builds on a rich tradition in sociology, includign Padgett and Ansell’s
(1993) seminal study of the Medici family in medieval Florence (see also Puga and Trefler,
2014). The literature on social movements has also stressed the importance of network structure
in understanding the potential for collective action (Zald and McCarthy, 1987, Barkey and van
Rossem, 1997). Network analysis has also been used in recent political science research, for
example to look at linkages between politicians and clients (Calvo and Murillo, 2013), between
legislators (Alemán and Calvo, 2013), and between citizens (Campbell, 2013). The social
connections between politicians and firms have also been studied (Fisman, 2001). A recent paper
by König et al. (2014) also conducts a political economy extension of Ballester, Calvó-Armengol
and Zenou (2006), but the model and empirical context is civil war. Most related to our study,
Cruz, Labonne and Querubín (2017) examine the social networks of politicians in the Philippines.
To our knowledge these ideas have not been applied to the study of democratic reversions and
nobody has estimated a model of the relationship between network position and participation of
the kind we analyze here.
2 Background on Haiti
Haiti is underdeveloped and unequal with 65% of its population below the poverty line and a
likely underestimated Gini coefficient of 0.6. Much of the wealth derives from international trade,
the ownership and control of which has historically been very concentrated. Haiti’s dependence
on international trade dates back to its pre-independence period as an extractive slave society.
Foreign merchants enter in the late 19th century, staying in Haiti as resident aliens to maintain
the protection of foreign governments, yet marrying into elite Haitian society to circumvent
restrictions on foreign ownership of Haitian property (Plummer, 1988). By the early 1900s, more
recent immigrants, particularly those from Syria and Lebanon, owned the major trading houses,
as well as transportation and communication systems (Plummer, 1988). According to a reference
produced by the U.S. forces during the occupation in the 1910s and 1920s, “The provisional
4

heart, lungs and stomach of the Republic of Haiti, which means literally, agriculture, commerce
and industries, from 1804 to 1915 were largely foreigners: Germans, French, Syrians, Belgians
and English, with importance in the order named, who cared very little what became of Haiti so
long as they got their ‘bit’” (1919, 23).
The Duvalier dictatorship after 1957 largely preserved this concentrated economic structure.
Monopolies were a common reward for economic elites who worked with the government. A
long list of industries became monopolies by presidential decree during the 1950s and 1960s:
“mineral and petroleum exploration and exploitation, the construction and operation of television
stations, the planting and processing of kenaf, sesame, and ramie, the processing of guano,
the manufacture of chocolate, a fertilizer industry, the development of casinos and hotels, the
construction of a sugar factory, the improvement of the telephone system, etc.” (Rotberg, 1971,
210). By 1985, some 19 families held almost exclusive rights to import many of the most
commonly consumed products in Haiti, as detailed in Figure A.1.
Democratization threatened the economic interests of these elites. The 1990 election brought
to power Jean-Bertrand Aristide with almost 70% of the vote. Aristide had campaigned on a
platform of pro-poor redistribution, and began putting in place policies to give the state a more
“interventionist, dirigiste, and even protectionist role in economic development” (Fatton, 2002,
113). During the first period of democracy in 1991, the Aristide regime increased enforcement of
tax collection, including import fees and arrears (Hallward, 2010, 33). As a result, the Direction
Générale des Impôts “registered a historic increase in total revenues” (Dupuy, 2007, 118). It also
put into place price controls on products such as rice and wheat (Hallward, 2010; Dupuy, 2007;
Farmer, 1994).
The first coup occurred in September 1991 just eight months after Aristide took office, and
put into power a military government under Raoul Cedras. The New York Times reported that
some wealthy Haitians offered as much as $5,000 apiece to selected soldiers and policemen
for their participation in the coup (October 13 1991). Farmer quotes one rich businessman as
saying that “‘everyone who is anyone is against Aristide... except the people’” (1994, 150). The
U.S. government, opposed to Aristide’s policies but nevertheless concerned with the accounts
of political violence and streams of migrants pouring out of Haiti, imposed sanctions on the
5

military junta and its economic backers.
Aristide returned in 1994 and served out the rest of his term to be replaced by the election
of René Préval in 1996. Aristide was re-elected in 2001 but ousted by a second coup in 2004.
Again, economic elites partnered with armed groups to push Aristide from power. Although
much less is known about which specific families participated in this coup, the top private sector
backers were largely the same network of individuals. Andy Apaid, who had played a catalyzing
role in 1991, is credited with having the most control of any member of the private sector on
the gangs and rebels that precipitated Aristide’s departure from power. Apaid, along with his
brother-in-law Charles Baker (also a sponsor of the 1991 coup), began offering to pay gang
leaders in Cité Soleil, a poor suburb of Port-au-Prince, to turn against Aristide. One gang leader
who took up the offer was paid $30,000 and offered a U.S. visa (Hallward, 2010; Podur, 2013).
It also appears that Apaid had control over the rebels who advanced on Port-au-Prince in 2004:
Colin Powell reportedly called Apaid in late February 2004 after the rebels took control of Cap
Haitien and asked him personally to restrain them (Hallward, 2010, 224-225).
Shortly after the 2004 coup, the collection of some taxes paid by elites was suspended
(Hallward, 2010, 261; Schuller, 2008). Price controls were lifted, and the price of consumer
goods skyrocketed in response, with the price of rice doubling within five months of the February
coup (Hallward 2010, 261; The New York Times June 1 2004).
3 Model
3.1 Demographics, Preferences and Production Structure
We develop a simple model to formalize the connection between coup participation and network
position. There are three types of agents which play roles in the model, citizens, elites, and a
potential dictator all of whom live forever. Let C and E denote the sets of citizens and elites
respectively. There are E elites in total, so |E |= E, where |S| denotes the cardinality of set S,
and we use e ∈ E to refer to a representative elite. Similarly, |C | = L > E to ensure that the
median voter in a democracy will be a citizen. Citizen/consumers have a per-period standard
6

Cobb-Douglas utility function defined over M different goods:
Ui =M
∏m=1
xαmim (1)
where xim is the consumption of good m by agent i and αm is the share of income spent on good
m where ∑Mm=1 αm = 1. Since it does not play an important role in the analysis we let αm = α for
all m and thus α = 1/M. Let xm be the aggregate demand for good m. There are no intertemporal
economic linkages and no saving or accumulation. The only economic decision citizens take
is to allocate their exogenous income between the different goods. Each agent maximizes this
utility function subject to the budget constraint ∑Mm=1 pmxim ≤ Y where pm is the price of good
m and Y is the income of citizen i in terms of the numeraire which we treat as exogenous and
identical for all citizens. Standard arguments imply that the Marshallian demand function for
good m can be written as, xm = Lxim = LYMpm
since there is mass L of citizens.
Elites own firms distributed across the different sectors and can also take actions to overthrow
democracy and install the potential dictator in power. Let Em ⊆ E denote the set of elites who are
active in sector m. We assume that each good is produced by a sector and that there are multiple
elites in each sector of the economy, but this varies across sectors and is fixed. We assume that
each good can be produced with a constant returns to scale technology with fixed marginal cost
κ . However, elite producers are also capacity constrained and can produce in total qm units of
output in a sector m. For simplicity we assume qm = q for all m. We assume later that for all
sectors total elite supply is less than the total demand for that good so we do not have to consider
rationing schemes across elites.
In addition to the elite producers in a sector there is also a competitive fringe of firms who
have access to the same technology. The equilibrium in each sector without any government
intervention therefore will involve elites limit pricing and setting their prices equal to κ and
profits are zero for each elite in each sector. However, we allow the government to set a ‘tax’ of
τm ≥ 1 which varies across sectors which raises the marginal cost of the fringe producers only,
and this allows the elite to increase the prices they can set. We interpret τm as a generic entry
barrier (e.g. privileged access to imports, government regulations) which makes it more costly
7

for fringe producers to produce good m thus allowing incumbent elites to raise prices and extract
rents. Thus with government intervention the limit price will be pm = τmκ ≥ κ and profits of a
particular elite member e who produces in sector m will be pmq−κq or (τm−1)qκ ≥ 0, and
clearly profits of elite agent e in sector m are increasing in the tax levied on the fringe producers
in that sector. The total profits of the elite in sector m is π(τm) and define πe = ∑Mm=1 wemπ(τm),
where wem is the share of total profits in industry m that accrues to elite e. Total elite profits will
be ∑Ee=1 πe = ∑
Ee=1 ∑
Mm=1 wemπ(τm).
Though levying taxes creates profits for elites it is costly. Specifically we assume that there
is an administrative cost of C(τm) associated with levying the tax rate τm in sector m. C is a
strictly increasing, differentiable and strictly convex function with C(0) = 0. The total cost of
levying the tax vector τ(s) = (τ1(s),τ2(s), ...,τM(s)) would be ∑Mm=1C(τm). To simplify we let
C be quadratic so that C(τm) =τ2
m2 .
We can now write the indirect utility of a citizen as a function of the policy vector τ(s) which
potentially depends on the state, to be defined shortly, which is
W i(τ(s)) =M
∏m=1
(Y
Mτm(s)κ
) 1M
−1D
M
∑m=1
C(τm(s)). (2)
Here 1D is an indicator function such that 1D = 1 if the political state is democracy and
1D = 0 otherwise. Hence (2) says that the indirect utility of citizens is made up of a part which
is based on their consumption decisions minus an equal share of the administrative costs from
taxation in a democracy (we assume below that in a dictatorship that any administrative costs are
born by the elites).
All agents aim to maximize the expected present discounted value of utility where future
payoffs are discounted by the factor β ∈ (0,1). For consumers their per-period payoff in each
period is simply (2). For members of the elite it is profits minus the cost of taking actions
to mount a coup which we will discuss below. For the dictator it is exogenous rents from
officeholding, denoted Z. We allow the dictator to incentivize elites into the ‘ruling coalition’,
denoted R, by giving them the right to decide on taxes if a coup succeeds. This creates an extra
incentives for elites to exert effort. We assume that the number of potential positions in this
8

coalition, denoted |R| is fixed (for example the number of ministerial positions or ambassadors’
jobs). To model this we assume that the tax vector is chosen to maximize the sum of the payoffs
of the members of the ruling coalition.
3.2 Political Regimes, Network Structure and Transitions
There are two possible political regimes, denoted by D and N, corresponding to democracy and
dictatorship (nondemocracy). At any point in time, the “state” of this society will be represented
by st ∈ D,N, which designates the political regime that applies at that date. In a democracy we
will assume that policy is chosen by the median voter, a citizen/consumer, while in a dictatorship
it will be chosen by the ruling coalition.
Transitions between democracy and dictatorship and back can occur because the elite can
use their ‘de facto power’ to try to overthrow democracy or maintain dictatorship. In particular,
suppose that elite e ∈ E spends an amount ae ∈ [0,1] as a contribution to activities to create or
sustain dictatorships. We can interpret this action in different ways, for example it could involve
giving the dictator money to bribe the army, or hire paramilitaries directly, both of which have
certainly played a role in Haiti. If the elite take actions in this way then their aggregate ‘power’
to place the dictator in power is
PE (ae,a−e(s)) =1E
(ae + ∑
e′ 6=eae′
)(3)
where ae is the action choice of elite member e, a−e(s) the vector of actions of elite members
other than e and the notation ∑e′ 6=e ae′ means summation over all elite agents except agent e.
The scaling factor 1E is added simply to make sure we have a well defined probability of a coup
below since it guarantees that the sum of the actions is always between 0 and 1. There is a cost
associated with action ae which is captured by the function χ(ae) which takes the specific form
χ(ae) =− ∑e′ 6=e
ωee′ae′ae +δa2
e2
(4)
where δ is a positive constant which are the same for all agents. (4) has a usual quadratic term in
9

the own action of elite e, the term δa2
e2 , but it also includes an interaction term so that if the action
of player e increases, the marginal cost of exerting effort for player e′ falls if the two agents are
connected in the elite social network. This is so if ωee′ 6= 0 and we shall assume that ωee′ > 0 for
all ee′ which guarantees that the action choices of the elite are strategic complements. The E×E
matrix whose entries are the individual ωee′ is the adjacency matrix which shows the network
interactions between the elites. The combination of equation (3) and (4) means that our model is
an adaption of the preferences proposed by Ballester, Calvó-Armengol and Zenou (2006) (see
also Jackson (2008), Section 9.5.2) to the technology for generating de facto political power.
We assume this technology is the same in democracy and non-democracy.1 The formula in (4)
brings out the network interactions between the actions of the different elite members and the
formula builds in that these actions are strategic complements. We do not take a strong stand
on the source of the complementarity in actions among the elite. Information flows, trust, or
altruism could all generate situations where elite actions were strategic complements.
Whether or not a coup succeeds depends on whether the power of the elite is greater than
the power of the citizens (as in Acemoglu and Robinson, 2008). Since we assume that the
citizens are too numerous to solve the collective action problem this power is not systematically
organized but nevertheless in idiosyncratic circumstances the citizens may have some power. We
model this as a shock θ which is drawn every period from a distribution function H with density
function h on support [0,1]. Thus the power of the citizens is
PC (a(s)) = θ (5)
Denote the probability that there is a dictatorship next period by p(ae,a−e(s)). This is the
probability that the power of the elite is greater than the power of the citizens, or the probability
that PE (ae,a−e(s))≥ PC (a(s)), which is simply
p(ae,a−e(s)) = H
(1E
(ae + ∑
e′ 6=eae′
))1There may be a number of reasons for why the elite’s ability to lobby and bribe politicians or use paramilitaries
may be more restricted in democracy, Acemoglu and Robinson (2008) allow this technology to differ betweendemocracy and non-democracy.
10

For simplicity and since we want to maintain a linear quadratic structure of payoffs we assume
that H is uniform with constant unit density. Shortly it will be useful to use the notation p(a(s))
for p(ae,a−e(s)) with a(s) referring to the vector of elite action choices in state s.
3.3 Timing of Events
We now explain the timing of events in this basic environment.
At each date t, society starts with an inherited political state st ∈ D,N. Given this, the
following sequence of events take place:
1. The dictator chooses which elites to allow into the ruling coalition R.
2. Each elite agent e∈ E simultaneously chooses ae ∈ [0,1] and PE (ae,a−e(s)) is determined
according to (3).
3. The random variable θ is drawn from the distribution H, and PC is determined according
to (5).
4. If st = D and PE ≥ PC democracy collapses, the dictator takes power taxes are set by the
ruling coalition and st+1 = N; if PE < PC the tax vector is chosen by the median voter
and st+1 = D. Taxation and consumption takes place.
5. If st = N and PE ≥ PC then dictatorship survives, taxes are set by the ruling coalition and
st+1 = N; if PE < PC dictatorship collapses, the tax vector is chosen by the median voter
and st+1 = D. Taxation and consumption takes place.
6. The following date, t +1, starts with state st+1.
4 Analysis of the Model
We now analyze the model described in the previous section. As is common in this literature
Acemoglu and Robinson (2008), we focus on the pure strategy Markov Perfect Equilibria (MPE).
An MPE will consist of decisions by the median voter τ(D) about whether or not set positive
11

taxes; decisions by the ruling coalition τ(N) on what taxes to set; and contribution functions
ae (s)e∈E for each elite agent (potentially as a function of the political state). The focus on
MPE is natural in this context as a way of modeling the potential collective action problem
among the elite.2
The MPE can be characterized by backward induction within the stage game at some arbitrary
date t, given the state s ∈ D,N. Let V i(s) for s ∈ D,N be the value function of a player of
type i in state s. Since all citizens are the same we use the generic notation c for citizens, e, for
elite and d for dictator.
We can now write down the optimization problem of a representative citizen in democracy
V c (D | a(D) ,a(N) ,τ(N)) (6)
= maxτ(D)≥1
p(a(D))(W c(τ(N))+βV c (N | a(D) ,a(N) ,τ(N)))
+(1− p(a(D)))(W c(τ(D))+βV c (D | a(D) ,a(N) ,τ(N))) ,
Here V c (D | a(D) ,a(N) ,τ(N)) defines the expected present discounted value of the citizen
in a democracy when elite agents choose actions a(D) and a(N) in democracy and dictatorship,
respectively, and when the elite ruling coalition choose action τ(N). The probability a coup
succeeds and democracy collapses is p(a(D)). In this event we assume, as mentioned above,
that the policy is chosen collectively by the ruling coalition which gives an indirect utility to
the citizens of W c(τ(N)). A citizen then gets the continuation value V c (N | a(D) ,a(N) ,τ(N))
which is discounted back to the present. With probability 1− p(a(D)) the coup fails, the median
voter receives the payoff W c(τ(D)) corresponding to the policy chosen τ(D) (recall we defined
this net of administrative costs) and the value V c (D | a(D) ,a(N) ,τ(N)) recurs since democracy
survives.
Applying backward induction within the stage game it is clear that in democracy (i.e. if
the coup fails) the median voter will set τ(D) = 1. Taxes create administrative costs and lower
2It is worth emphasizing here that the timing of the game and the restriction to Markov strategies rules out in asimple way the median voter trying to set (or promise) positive taxes in order to avoid a coup. There are differentways this can be modelled. For example, in Acemoglu and Robinson (2001) such promises may not be crediblewith Markov strategies when the opportunity to mount a coup is transitory.
12

consumer welfare so it cannot be optimal in an MPE to set a tax rate greater than one. In
non-democracy, however, the ruling elite will have an incentive to set τ(N) > 1 since higher
taxes generates higher prices and profits.
We can now analyze the decision of the elites about how much effort to allocate to overthrow-
ing democracy. A member of the elite e faces the problem
V e (D | a−e (D) ,a−e (N) ,τ(D),τ(N))
(7)
= maxae(D)∈[0,1]
−χ(ae)+ p
(ae,a−e(D)
)×[
M
∑m=1
wem (τm(N)−1)qκ−1e∈Rτ(N)2
2 |R|
+βV e (N | a−e (D) ,a−e (N) ,τ(D),τ(N))]
+(1− p
(ae,a−e(D)
))βV e (D | a−e (D) ,a−e (N) ,τ(D),τ(N)
)where τ(D) = 1 and τm(N) for m = 1, ..,M and 1e∈R is an indicator function which is equal to 1
if elite member e is part of the ruling coalition and thus has to bear deadweight costs of taxation.
Here V e (D | a−e (D) ,a−e (N) ,τ(D),τ(N)) is the value of an elite in sector m when all other
elites take the actions a−e (D) and a−e (N) in democracy and dictatorship and when the median
voter chooses the policy vector τ(D) and the elite chooses the policy vector τ(N). This notation
allows for non-symmetric action choices since as we shall see elite agents will make different
decisions depending on their network position (see Acemoglu and Robinson, 2006b, for a
treatment of non-symmetric equilibria in a related model). If a coup takes place then the ruling
coalition chooses the tax vector as above and a dictatorship is created. The payoff to every
elite member e is ∑Mm=1 wem (τm(N)−1)qκ which is the sum across all sectors of the economy
in which that elite member is active, taking into account the tax set in those different sectors.
Finally, if a coup does not take place then the elite will get a flow payoff of zero and the value
V e (D | a−e (D) ,a−e (N) ,τ(D),τ(N)) recurs.
At the last stage the members of the ruling coalition choose the tax vector to maximize the
13

total surplus of the ruling coalition, or
maxτ(N)
∑e∈R
M
∑m=1
wem (τm(N)−1)qκ− τ(N)2
2 |R|
with a representative first-order condition
∑e∈R
wemqκ− τm(N)
|R|= 0 (8)
Now it follows from this that if you take two industries m and i that
τm(N)
τ i(N)=
∑e∈R wem
∑e∈R wei
so that τm(N)> τ i(N) if the industry share of elites in the coup coalition is bigger. This inequality
implies that after a successful coup the prices of goods in sectors in which the elites in the ruling
coalition have a larger share will be relatively higher.
Now with the post-coup tax vector determined (noting that (8) is a recursive system of m
equations in m unknowns) we move backward to the decision by elites about whether or not to
allocate effort to mounting a coup. Consider the optimal action choice of the elite in the two
states of the world. From (7) we have the first order condition for elite agent e
∑e′ 6=e
ωe′eae′−δae +1E
[M
∑m=1
wem (τm(N)−1)qκ−1e∈Rτ(N)2
2 |R|+β∆V e(N)
]= 0 (9)
with an interior solution (we return to the conditions that guarantee this). Here ∆V e(N) ≡
V e (N | a−e (D) ,a−e(N),τ(D),τ(N))−V e (D | a−e (D) ,a−e (N) ,τ(D),τ(N)).
As the Appendix shows, the decision problem for an elite in a dictatorship is identical in the
sense that the ‘prize’ is the same in both states and the cost function is the same. Moreover, as
we establish shortly the set of elites in the ruling coalition in a dictatorship is identical to that in
a democracy. This implies that for elite agent e, ae(N) = ae(D). Nevertheless, since elite agents
differ in their network positions this does not imply that their action choices will be the same,
hence ae(s) 6= ae′(s) for some elite agent e′ 6= e. However, it does imply that p(a(N)) = p(a(D))
14

which greatly simplifies the analysis. Indeed, using this observation we have that ∆V e(N) = 0.
Now we can write (9) for all elite agents as a matrix equation where elite agents are ordered
from 1 to E
a = Π+1δ
ωa
where a = (a1, ..,aE) is a column vector of action choices by the elites (which is not state
dependent as discussed above), Π is the (weighted) elite net profit vector defined as:
Π≡ 1δE
(M
∑m=1
w1m (τm(N)−1)qκ−1e∈Rτ(N)2
2 |R|, ..,
M
∑m=1
wEm (τm(N)−1)qκ−1e∈Rτ(N)2
2 |R|
)(10)
and recall that ω is the adjacency matrix. We can write the solution to 9 in matrix notation as
a =
(I− 1
δω
)−1
Π (11)
where I is the identity matrix. It is worthwhile noting for future reference that,
ae =1
δE
E
∑f=1
Ωe f
[M
∑m=1
wem (τm(N)−1)qκ−1e∈Rτ(N)2
2 |R|
](12)
where Ωe f are the cells of the matrix(I− 1
δω)−1
. Note that because of the network structure
the optimal choice of ae depends on the tax rate set in a particular sector not just via own profits,
but also through the profits of elite agents who are connected to e in the adjacency matrix.
As Ballester, Calvó-Armengol and Zenou (2006) show (Theorem 1 and
Remark 1) this implies that the action choice of agent e can be writ-
ten as their weighted Bonacich centrality with weights given by profits(∑
Mm=1 w1m (τm(N)−1)qκ−1e∈R
τ(N)2
2|R| , ...,∑Mm=1 wEm (τm(N)−1)qκ−1e∈R
τ(N)2
2|R|
)/δE
and decay factor 1/δ . For convenience write (12) as a(τm).
From this the first result, which is a direct consequence of Ballester, Calvó-Armengol and
Zenou (2006) Theorem 1, follows
Proposition 1: The equilibrium action of elite agent e is increasing in his weighted Bonacich
15

centrality.
A related result which we can also examine empirically was provided by Galeotti, Goyal,
Jackson, Vega-Redondo and Yariv (2010):
Proposition 2: The equilibrium action of elite agent e is non-decreasing in his degree.
Where the degree of a player is simply the numbers of nodes to which he is linked directly.
Applying backward induction again we move to the initial decision of the dictator about
which elite agents to allow into the ruling coalition. The dictator chooses which elites to admit
into the coalition R by maximizing
1E
(E
∑f=1
E
∑e
Ω f ewem (τm(N)−1)qκ−1e∈Rτ(N)2
2 |R|
)·Z (13)
where the tax rate depends on who will be let into the coalition. Since the elite bear the cost of
taxation it is immediate that the dictator simply wants to maximize the probability that a coup
happens. This implies he wants to maximize ∑Ee=1 ae. From the above solution for the elite effort
this sum is maximized when the elite admitted into the ruling coalition are the |R| members
of the elite who have the largest weighted Bonacich centralities. The timing of the game is
important for this result: elite decisions about actions are taken after dictator decisions about
who is in the coalition, so elites cannot promise higher effort in order to affect being included in
the ruling coalition. This leads to one of the most important results we can test in the paper
Proposition 3: The greater the Bonacich centrality of an elite, the greater the probability that
they will be included in the ruling coalition after a successful coup.
There remain a couple of technical issues to address. Recall that we required that ae ∈ [0,1]
and assumed that the elite’s first-order condition was interior. From (12) it is clear that ae ≥ 0
with a strict inequality if the elite has any network connection, and the same formula shows that
a sufficient condition to guarantee that ae ≤ 1 is that κ is sufficiently small. Finally, we need
to make sure that elites are not demand constrained. Since the competitive price is lower than
16

the post-coup prices it suffices to assume that elites are not demand constrained at the prices
determined by (8) which implies that the following inequality holds
q2κ
2M |R|maxm
∑
e∈Rwem
≤ LY (14)
where maxm ∑e∈R wem is the largest market share that the ruling coalition has.
We are now in a position to sum up the nature of pure strategy MPE of this game.
Proposition 4: Assume (14) holds. There is a unique MPE in the game specified where in
each period elite agents choose the vector a which satisfies (12). In this equilibrium in
democracy there is a coup with probability p(a) and if the coup fails τ(D) = 1. If the
coup succeeds then the coup participants set the tariff vector τ(N) which satisfies (8) and
dictatorship is created. In a dictatorship the regime survives with the same probability
p(a) and the coup participants again set τ(N). With probability 1− p(a) democratization
occurs and citizens set τ(D) = 1.
Obviously there are other types of equilibria in this model. Our intention here is only to show
that this equilibria can occur for an open set of parameter values. Several testable predictions
emerge. First, the higher is an elite agent’s Bonacich centrality, the greater effort they put into
making a coup happen. This happens for two reasons. First, an agent with higher centrality will
be able to have a greater impact on the outcome of the coup. Elite agents with high centrality
can influence more elite agents aside from themselves to take actions to make a coup happen.
Second, high centrality agents will be precisely those chosen by the dictator to be part of the
ruling coalition and this gives them decision rights over taxes and allows them to create rents
in precisely the sectors in which they have more investments. This creates a greater incentive
for them to exert effort. Thus our model predicts that agents with greater Bonacich centrality
would be more likely to be seen to take part in such a coup if this was observable (to be in the
ruling coalition). Second, the model predicts that elites who are in the ruling coalition should
be rewarded by higher prices for the goods they produce. Since most elites are diversified, the
Haitian one included, the model predicts that the greater a particular market is dominated by
17

elites which took part in the coup, the higher prices should rise after a coup takes place (this
is immediate from (8)). Finally, given this increase in prices, the consumption and welfare of
citizens falls after a coup and in a dictatorship if it persists (relative to democracy).
5 Data
To test the predictions of our model we constructed a dataset that brings together information
on families, firms, and products from more than 15 different sources. In the process, we draw
on genealogical data going back to the mid-19th century, contemporary firm-level data, and
information on ownership of hundreds of businesses. We describe the data assembly process
in detail in Appendix A, and in this section detail the construction of the two most distinctive
variables: the coup participation list and the network centrality measure, both of which vary at
the family level.
We first draw in data on participation in the 1991 coup. This information comes from the U.S.
Treasury Department’s targeted sanctions list, which named individual official and unofficial
leaders in the coup government in power during the early 1990s. The U.S. had sanctions against
Haiti from 1991 until the restoration of democracy in 1994 based on an executive order by
President Bush in 1991 and populated with specific individuals by the Office of Foreign Assets
Control based on intelligence. Participation in coups is an illicit activity that most participants
prefer to hide, and the existence of this list is one of the reasons that we chose to test this general
theory of elite resistance to democracy in Haiti.
The sequence of events in the 1990s suggests that this list represents the U.S. government’s
best information on which elites were instrumental to installing and supporting the coup govern-
ment.3 Being added to the sanctions list meant that an individual’s U.S.-based assets were frozen,
they were barred entry into the U.S., and they were unable to trade with U.S. partners. From this
list, we create a measure of coup participation that indicates whether one or more members of a
3The text of the Executive Order establishing the sanctions list defines it to target those within the regime, whoprovided support to the regime, or who obstructed efforts to negotiate a settlement. One Haitian academic suggestedto us that the criteria for inclusion on the list were a) public statements from those individuals; b) open affiliationwith the coup leaders; c) open support to the anti-Aristide rebels; and d) human rights reports that documented theirinvolvements.
18

family were identified as coup participators by the U.S. government.
For the second coup in 2004 we do not have a similar list but the historical literature suggests
that the main instigators and supporters of the coup were the same, and that many were connected
by kinship and social ties. We therefore use the same list of elites when we examine the
consequences of the second coup and subsequent autocratic period.
Our data on the social structure is taken from the Association Généalogique d’Haïti, a
nonprofit effort to collect genealogical data from Haitian and American archives and the personal
records of Haitian families run by a business leader in Haiti.4 We use the Collective Genealogy
of Haitian Families, which includes information on more than 64000 individual members of
Haitian families beginning in the 17th century. We restrict this data to cohorts born between 1850
and 1975 to ensure that our measure of the social network is relevant, and also show robustness
to earlier cohorts. We collapse the genealogical data into a network of marriage links between
families.
An important variable in our model is Πe, the profits of an elite family e under dictatorship.
As an imperfect proxy, we use the sum of values of imports across products p and across
businesses j, with the latter divided by the number of owners nown j. πe = ∑p ∑ jvaluee jpnown j
.5 We
examine robustness to different versions of this measure, but given lack of information about
shares of ownership or even costs of importing, this is the closest that can be done with available
data.
We calculate several network statistics implied by our theory, varying the weight placed on
close versus distant ties: degree, Bonacich centrality, and eigenvector centrality.6 The most
general expression of the centrality measures that we use is the weighted Bonacich centrality,
corresponding to expression (12) above:
B(1δ,Π,ω) =
(I− 1
δω
)−1
Π
4Accessible at http://www.agh.qc.ca/.5We use data from 2009 and 2011 to construct this measure. As one check of whether these values are stable
over time, we check whether the value and volume of a type of good imported by a specific family in 2009 and 2011are correlated. For the products that we use in our analyses, the correlations are 0.51 to 0.56.
6For another discussion of these related measures, see Banerjee et al. (2016) or Jackson (2008).
19

where ω is the adjacency matrix, 1δ
is a parameter that determines the emphasis put on close
versus distant nodes, and Π is defined as above. We use a version of the adjacency matrix where
links between families are weighted by the size of each family such that a link between a large
family with another large family with many potential marriages contributes less to the family’s
centrality than a link with a small family. This takes into account the value of the marriage ties to
each family. g is the number of paths of length k that link nodes e and m, multiplied by 1sizee×sizem
where sizee is the number of individuals in family e and sizem is the number of individuals in
family m. Bonacich (1987) suggests that δ take the value in the range (0,λ ), where λ is the
largest eigenvalue of the adjacency matrix ω , in a network with complementarities. To determine
the appropriate weighting parameter 1δ
, we estimate the relationship between centrality in the
network of coup participators and participation in the coup (see Appendix C.1 for a discussion
and the results). Our primary measure of network centrality is the Bonacich centrality where1δ= 0.2, but we also show as a robustness check that our results hold when we parameterize the
Bonacich centrality with values in the range 1δ= [ 9
10λ, 1
10λ] as well as the degree where 1
δ= 0.
6 Results
6.1 Who participates in coups?
In this section we test our model’s prediction that central elites will be more likely to participate
in non-democratic regime change. We estimate the following specification:
Coupi = βCentralityi +ηFamilySizei +Social′iθ +Economic′iγ + ε i
where Coupi is an indicator variable for whether a family participated in the 1991 coup
against the democratically elected Aristide government. Centralityi is a measure of a family’s
centrality in the historical marriage network. Sociali is a vector of social characteristics of
each family including historical military and political service as well as whether the family
immigrated to Haiti after independence, and whether they immigrated from the Middle East.
We also control for the size of the family during the period of our network data. Economici is a
20

vector of characteristics that define the economic interest of a family in having a coup, including
a measure of the value of a family’s trade and the average share of Haitian consumption that the
family’s imports represent, as well as a number of other product-level characteristics that may
make importers more vulnerable to predation or taxation.
We use two separate datasets at the family level for this analysis: one that includes all elites,
meaning any family that appears in our records of historical political or military service or in one
of our business ownership databases, and one that covers only importers. The data on political
and military service is taken from Supplice (2001), and immigration histories are coded from
Supplice (2009). Consumption share is calculated from Jensen, Johnson and Stampley’s (1990)
data on household consumption, and the value of trade is from AGEMAR. The product measures
cover five characteristics, described in the data appendix, that have been found in other contexts
to affect the vulnerability of economic actors to government predation and taxation. They include
divisibility, bulkiness (de la Sierra, 2017), time sensitivity (Hummels, 2007), reference price
(Rauch, 1999), and complexity (Hausmann et al., 2013). When families import more than one
product, these characteristics are aggregated up to the family level weighted by the value of the
family’s import portfolio that each product comprises.
Finally, it is important to note that our sample sizes change for some of the variables due to
missingness. In particular, some families listed as political, military, or business elites did not
show up in the genealogical database. For political elites, 77% of families could be matched to
the genealogical data, but for business and military elites the figure is slightly lower at 71%.
This specification may suffer from omitted variables bias. In Appendix A.2, we examine the
correlates of centrality, and reassuringly find that obvious determinants of coup participation,
such as military or political elite status, are uncorrelated with family centrality conditional on
covariates. Nonetheless we control for many possible observable determinants of centrality,
as well as network neighborhood fixed effects to take into account the fact that families may
cluster based on unobserved factors. In addition, estimating models with network statistics
as independent variables is challenging due to the presence of obvious spillover effects. Any
exogenous change to the network shared by family i and j will change both families’ centrality
scores. The results should be interpreted with these limitations in mind.
21

Table 1 shows the results of regressions of coup participation on a combination of social and
economic characteristics. Columns 1-4 show the results using data from our all elite sample,
while Columns 5-10 use the importer sample. Columns 1 and 5 show the bivariate relationship
between coup participation and centrality. Columns 2 and 6 add a control for the number of
members in each family, and Columns 3-4 and 7-10 add four other social characteristics, namely
whether a family has any historical military and political service, whether a family migrated
to Haiti post-independence, and whether they migrated from the Middle East. Columns 7-10
include our two most important measures of economic interest: the value of a families’ trade and
our proxy for demand inelasticity. Columns 9-10 include the five product characteristics. Finally,
Columns 4 and 10 include fixed effects indicating the community within the social network to
which each family belongs. Models are estimated using OLS with robust standard errors.
[Table 1 about here.]
Table 1 is consistent with the theoretical result that central families are more likely to
participate in coups. This result is robust to the inclusion of a wide range of economic measures
that one would expect would make a family more interested in installing an autocratic regime.
While measures of immigrant, political and military elite status are likely endogenous to the
network position of elites, the centrality coefficient remains significant with all the social controls
in the importer-only sample, but falls in magnitude and loses significance with these added in
Column 3 in the all-elite sample when we include all of the social controls together with family
size.
Furthermore, the results are robust to the inclusion of fixed effects that indicate the community
that each family is part of. We include these fixed effects in the specifications in Columns 4
and 10 to control in a coarse way for endogenous network formation, as there may be groups
of families that intermarry due to some unobservable similarities (such as charisma or wealth).
While there are many methods for calculating communities in networks, we use a walktrap
algorithm (Pons and Latapy, 2006), which groups vertices of the network based on the number
of length-3 random walks that connect them. These improve the R2 considerably but do not
alter the coefficient on centrality. The fact that centrality predicts coup participation even within
22

these tightly intermarried clusters suggest it is in fact centrality of individual families, not broad
unobserved family characteristics, that are driving our results.
Substantively, we find that a one standard deviation increase in centrality is associated with
an 8-21 percentage point change in the probability of participating in the coup. This is roughly
double the effect of being a military family. The estimates in Column 10 imply that an elite
family at the average level of the control variables has a 46% probability of participation in the
coup at the mean level of centrality, increasing to 60% with a one standard deviation increase in
centrality.
Last, we find that a wide range of product characteristics that should predict vulnerability
of business elites to government predation and taxation have little explanatory power. Even
our measures of demand inelasticity or the value of trade are not significantly related to coup
participation.
Overall, this analysis provides fairly robust evidence that network centrality is related to coup
participation conditional on a family’s other characteristics.
We also test whether the relationship between centrality and coup participation is robust to a
range of other measures of network centrality. As discussed in Section 5, our preferred measure
of centrality is a case of Bonacich centrality where the 1δ
parameter that sets the weight of close
over distant ties is equal to 0.2, which we chose based on our estimation of the relationship
between coup degree and coup participation in Appendix C.1. In Figure 1, we recalculate each
family’s centrality allowing this δ parameter to approach the largest eigenvalue in the adjacency
matrix by multiplying this 1δ
by a constant in the range of [0.9,0.1]. This puts increasing weight
on close over distant connections. We also show robustness to 1δ= 0, which equals the degree.
The models estimated for this graph do not include controls and so are similar to Columns 1
and 5 in Table 1. Figure 1 plots the coefficient on centrality. All estimates are well within the
confidence intervals of our original estimate.
[Figure 1 about here.]
Second, we test whether the relationship is robust to constructions of centrality based on
versions of the network further back in history. The results are similar in magnitude and
23
significance if we cut off the network at cohorts born before 1950 and 1925. These results are
presented in Appendix C.2.
Our third check tests whether our results are robust to down-weighting data that appears
to be of lower qualityAs a measure of data quality we calculate the “reachability” within each
last-name dynasty, meaning the probability that there is a path between individuals with the
same last name.Results in Appendix C.3 show that estimates remain similar in magnitude and
are robustly significant if we weight observations by this measure of data quality.
6.2 Elite benefits of coup participation
In this section we estimate the differential increase in prices that coup participators enjoy during
periods of autocracy. This analysis explores the implication of our model that coup participators
will enjoy rents from less competitive markets during autocratic regimes.We use a difference-in-
difference design that controls for time-invariant product characteristics and compares changes
in prices for coup-participants and non-participants during periods of autocracy. We also include
lagged measures of our dependent variable measuring prices to control for dynamic responses of
prices to regime type over time. We estimate variants of the following specification:
log(pit) =4
∑k=1
ρk log(pit−k)+θCoupi×Autocracyt +X ′itβ +µ t +ψ i + ε it
where pit measures retail prices during period t for product i. We control for all time-varying
common shocks with a time fixed effect µ t and we also add a product fixed effect ψ i to control
for time invariant product differences. X ′it is a vector of time-varying product-specific controls,
including the interaction of Coupi and Quaket , an indicator for the month after the January 2010
earthquake, and the world supply price for each product. We also control for factors that affect
profits in addition to retail and supply prices: the number of firms importing each product and the
inelasticity of demand, which we proxy for with the share each product represents of household
consumption.
All prices are measured as levels in the log price indexed to August 2004. The retail prices
used in this analysis are inputs into the consumer price index collected by the Institut Haïtien de
24

Statistiques et Information and cover 18 of the most commonly consumed products in Haiti. The
data on supply prices comes from the U.S. Census Bureau data on international trade between
the U.S. and the rest of the world. Coupi is a continuous measure of the proportion of the market
for a product that is controlled by families who participated in the 1991 coup. All data from
families are aggregated to the product level with the weighted mean described in Appendix A.
Appendix Table A.4 shows summary statistics for our product-level data.
We estimate this model using OLS with standard errors clustered by product. We have a
small number number of clusters, and so we report wild bootstrap clustered standard errors in
square brackets below the clustered standard errors (Cameron, Gelbach and Miller, 2008). While
we have both fixed effects and lagged dependent variables as controls, we also have a long panel
of 145 months, so Nickell bias is unlikely to be large (Nickell, 1981). Nonetheless Appendix D.1
shows robustness to GMM estimators as well as different assumptions on a fixed autocorrelation
parameter in OLS.
Column 1 in Table 2 estimates the effect of the interaction of Coupi×Autocracyt with
product and month fixed effects. We also estimate the differential increase of being a coup
participator during the month after the January 2010 earthquake, when government capacity was
diminished and markets were disrupted. Column 2 adds one lagged measure of our dependent
variable in levels to control for dynamic trends in prices. Column 3 adds three additional lags
of the dependent variable. Column 4 adds the world supply price as a control. Column 5 adds
the interaction of two other product-specific characteristics (the number of firms per product
and our proxy for demand inelasticity) and a dummy for being in an autocratic period. We also
include an interaction of the product fixed effects and the number of conflict events in the GDELT
data (Leetaru and Schrodt, 2013) in order to control for the fact that some products’ prices may
increase during periods of instability. In Column 6, we add the interaction of centrality and being
in an autocratic or post-earthquake period. Columns 7 and 8 change the dependent variable to
the supply price of each good imported into Haiti and the supply price of each good globally as
placebos to check that supply prices of goods being imported are not changing differentially for
coup participators.
[Table 2 about here.]
25

Columns 1-6 in Table 2 show that retail prices of goods imported by coup participators rise
significantly during periods of autocracy. During autocratic periods, a product that is imported
by only coup participators grows by about 1.8% per month faster than products imported by
no coup participators. Accounting for the price dynamics, this translates to a 33% increase in
the price of the good. Appendix Table D.3 shows this relationship is robust to including lagged
measures of the retail price, the supply price of each good, time-variant measures of product
characteristics, the interaction of product dummies and the number of conflict events, and the
interaction of centrality and autocracy.7
Substantively, this means that moving from the sample mean of 60% coup participation by
one standard deviation to 80% is associated with a 0.51% increase in short-run prices, increasing
to 6.3% taking price dynamics into account. Taking as our benchmark product rice, which cost
on average 0.25 USD per pound at contemporary exchange rates in the pre-coup period, and a
coup participation rate of 88%, our estimates imply that the transition to dictatorship increased
the price of rice by 34%.Given that many of the other staple goods like corn meal, sugar, and
chicken also have high levels of coup participation, price increases of this magnitude would have
had a large impact on the budgets of the average household.
There is no evidence that the supply price of goods imported into Haiti or of goods globally is
changing differentially for coup participators during autocratic periods. Adding the global supply
price as a control variable in Columns 3-6 does not change the coefficient on coup participation
interacted with autocracy.
One concern is that the results in our analysis may be driven by one particularly influential
product. To address this, we test whether the coefficient on Coupi×Autocracyt is also robust to
dropping each product in turn. Figure 2 plots the coefficients on Coupi×Autocracyt with 90
and 95% confidence intervals. These regressions also include all the controls in Column 5 of
Table 2. The legend indicates which product is excluded. The magnitude of the effect remains
similar across these product subsets.
[Figure 2 about here.]7The interaction Centrality×Autocracy is positively and significantly associated with prices, conditional on
Coup×Autocracy. One interpretation of this result is that the binary measure of coup participation that we haveaccess to is not picking up the full variation of contributions to the coup that are rewarded by the dictator.
26

As a second check, we conduct a placebo exercise where we arbitrarily move the 26-month
window of autocracy 48 months before and after the true onset of autocracy. When we move
the window of autocracy forward by one month, it includes the one month prior to the coup and
the first 25 months of the actual autocratic period. If we see that there are many time periods
where, by chance, we find a significant interaction between coup participation and this placebo
autocratic period, our results would be less credible. In this figure we present the specification in
Column 1 of Table 2. Figure 3 plot the coefficients from this placebo analysis. The dark line
indicates the magnitude of the estimated coefficient on Coupi×Autocracyt , while the shaded
area marks 90% confidence intervals.
[Figure 3 about here.]
Figure 3 shows that the only windows of time where we would conclude that coup participa-
tors increase their prices more than non-participators is the true autocratic period or a window
that begins four months before and mostly consists of the true autocratic period. In addition, a
failed coup attempt in December 2001 had no effect on the prices of coup participators’ products.
This placebo test suggests that it is unlikely that our results are obtained by chance.
6.3 Impact of autocracy on child health
In this section we test the implication of our model that citizen welfare should decline during
autocracy. While the price increase evidence presented above is suggestive of welfare losses,
it is possible that the CPI prices are inaccurate or easy substitutes are available. We use a
difference-in-difference design to estimate the effect of autocracy on urban vs. rural children.
Urban children are more likely to be affected by increases in the prices of products like rice and
maize because they are more dependent on imported products than rural children, who get a
larger portion of their calories from home production.
To test this hypothesis, we estimate the following specification:
hit = θUrbani×Autocracyt + γ×Urbani +X ′itβ +µ t + ε it
27

where Urbani×Autocracyt represents the interaction between being born in an urban area
and during an autocratic period. X ′ includes an indicator for whether a child is female, one for
being born in an urban area, and first and second degree age polynomials. µ t is a birth-month
fixed effect controlling for all time shocks that might affect the heights and weights of an entire
cohort of children.
This empirical strategy is likely an underestimate of the true impact of autocracy on the health
and welfare of children in Haiti. Our theory in fact predicts that the general welfare in Haiti
should decline in both urban and rural areas. Many of our high-coup products, including edible
oil, kerosene, cigarettes, and cola, are consumed in rural areas but are rarely home produced,
suggesting that increases in import prices should also affect rural households. Nevertheless,
we choose this difference-in-difference specification because it enables us to control for some
shocks to children’s health that occur during autocracy throughout the country, such as declines
in social services or political violence. We also show a specification estimating the time-series
effect of the coup on the entire child population, replacing the time fixed-effects with flexible
functions.
The data in this section covers children born across Haiti between the beginning of the first
democratic period in 1991 and 2012 and is taken from the Demographic and Health Surveys
(DHS) conducted in 1995, 2000, 2006, and 2012. The measures of height and weight are taken
by the DHS enumerator. We use the standardized weight- and height-for-age Z-scores (×100),
which are calculated based on global reference data. These Z-scores are recommended for
measuring nutritional status of children under 5 by the WHO (De Onis and Lobstein, 2010).
Children who fall two standard deviations below the global reference point are considered wasted
or stunted.
Appendix Table A.5 shows the summary statistics for this data. The average weight- and
height-for-age Z-scores of children born during democracy are 0.90 and 1.02 standard deviations
below the global reference, respectively, while during autocracy they are 1.03 and 1.12 standard
deviations below the reference.
Table 3 presents our estimates of the impact of autocracy on children’s heights and weights.
Columns 1-4 use the weight Z-score as the dependent variable. In Column 1 and 5, we include a
28
linear time trend based on month of birth, while in Columns 2-4 and 6-8 we include dummies for
each month of birth and control for two age terms. All columns also include as a control variable
the interaction of being born in an urban area and the number of conflict events except those
organized by the Haitian elite in the GDELT data to control for the level of political violence
(Leetaru and Schrodt, 2013). Columns 5-8 use the same set of independent variables as Columns
1-4, but use as the dependent variable the height Z-score of Haitian children. Columns 1-2, 4-6,
and 8 use data from the beginning of the series in 1991 through 2012, while Columns 3 and 7
restrict the data to the 2001-2012 period where we have data on retail prices. Columns 4 and 8
eliminate children under the age of six months who spent only a small number of months living
under autocracy.
[Table 3 about here.]
Table 3 shows that being born in urban areas during autocracy is associated with a decline in
the weight-and height-for-age Z-scores of children under five. The impact of autocracy on height
in Columns 5-8 is substantively large and robust. In the full 1991-2012 sample with birthdate
fixed effects, urban children during autocracy are 0.14 standard deviations shorter than their rural
peers. This effect is even stronger in the 2001-2012 sample in Column 7 and stronger still when
we restrict the sample to children over the age of six months in Column 8.
Substantively, this negative effect on height is quite large. The negative effect of autocracy
on the heights of urban children is 8-14% of the difference in heights between Haitian children
and the global reference mean.
The impact of Urbani×Autocracyt on weight is less robust, but in the full sample it has a
similar magnitude and significance on weight-for-age Z-scores as on height-for-age. In Column
2 children born in urban areas during autocracy are 0.12 standard deviations shorter than their
rural peers, and this effect grows to 0.14 standard deviations shorter when we exclude children
under six months old in Column 4. In the post-2001 sample, however, there is no significant
effect of autocracy on the weight-for-age Z-scores of children under 5.
Columns 1 and 5 use a birthdate time trend rather than birthdate fixed effects to allow us to
estimate the effect of autocracy on all children in addition to the interaction Urbani×Autocracyt .
29

In both Columns 1 and 5, we see that autocracy has a substantively large and significant negative
effect on children’s nutritional status. Children born during periods of autocracy are more
than 0.25 standard deviations lighter than peers born during democracy and 0.23 standard
deviations shorter. In both cases, this effect is stronger for urban children. Thus, while we draw
identification from the differential impact of autocracy on urban compared to rural children,
it is important to note that autocracy also negatively affects the nutritional indicators of rural
children. Given the strong correlations between early childhood stunting and later educational
outcomes (Grantham-McGregor et al., 2007), this result implies that the transition to autocracy,
and associated increase in import prices, had a persistent effect on human capital formation.
We also tested for an impact of autocracy on infant and under-five mortality. Our dependent
variable is a measure of the percentage of children by birth cohort that died during each month.
While autocracy has a positive and significant effect on infant mortality, there is no significant
difference between urban and rural areas.
Conclusion
In this paper we have developed and empirically explored a novel theory of the role of elite
social networks in coups against democracy. We developed a model of coups based on actions
taken by elites and derived four basic sets of results which we examined in the data. First, the
amount of effort that an elite member puts into making a coup happen is positively related to
the network centrality and network degree of such an agent. Second, this means that the higher
the centrality of an elite, the more valuable they are to a potential dictator and the more he will
wish to incentivize them by ceding decision rights over policy after a successful coup. Third,
coup participants should gain material rewards, which in our specific context implies differential
increases in the prices of the goods they import. Finally, coups should have negative effects on
social welfare. Using a variety of data sources we found support for all of these hypotheses in
Haiti. Together, this evidence points toward elite social structure as an important explanatory
factor in the persistence of predatory, autocratic institutions and under-development.
More broadly, our results have implications for democratization and democratic consolida-
30

tion. While previous theories have focused on reforming institutions or redistributing assets as
mechanisms for consolidating democracy, our results suggest that transforming elite networks
during democracy may be an important component of reducing the likelihood of future coups.
Indeed, elite social capital may have to decay for democratic capital to accumulate. Stepping
back from Haiti, our results suggest that the density of elite networks may be an important factor
in explaining the relative incidence of coups and whether or not democracy is consolidated.
31
ReferencesAcemoglu, Daron, Davide Ticchi and Andrea Vindigni. 2010. “A Theory of Military Dictator-
ships.” American Economic Journal: Macroeconomics 2(1):1–42.
Acemoglu, Daron and James A. Robinson. 2001. “A Theory of Political Transitions.” AmericanEconomic Review 91(4):938–963.
Acemoglu, Daron and James A. Robinson. 2006. Economic Origins of Dictatorship andDemocracy. Cambridge, U.K.: Cambridge University Press.
Acemoglu, Daron and James A. Robinson. 2008. “Persistence of Power, Elites and Institutions.”American Economic Review 98:267–293.
Acemoglu, Daron, Suresh Naidu, Pascual Restrepo and James A Robinson. 2014. “DemocracyDoes Cause Growth.” NBER Working Paper No. 20004.
Acemoglu, Daron, Suresh Naidu, Pascual Restrepo and James A. Robinson. 2015. Democracy,Redistribution and Inequality. In Handbook of Income Distribution, ed. Anthony B. Atkinsonand François Bourguignon. Vol. 2B Amsterdam: North-Holland.
Aidt, Toke S. and Raphaël Franck. 2013. “How to get the snowball rolling and extend thefranchise: Voting on the Great Reform Act of 1832.” Public Choice 155(3-4):220–250.
Alemán, Eduardo and Ernesto Calvo. 2013. “Explaining Policy Ties in the Argentine and ChileanCongress.” Political Studies 61(2):356–377.
Ballester, Coralio, Antoni Calvó-Armengol and Yves Zenou. 2006. “Who’s who in networks.Wanted: the key player.” Econometrica 74:1403–1417.
Banerjee, Abhijit, Arun G. Chandrasekhar, Esther Duflo and Matthew O. Jackson. 2016. “Gossip:Identifying Central Individuals in a Social Network.” NBER Working Paper No. 20422.
Barkey, Karen and Ronan van Rossem. 1997. “Networks of Contention: Villages and RegionalStructures in the 17th Century Ottoman Empire.” American Journal of Sociology 102(5):1345–1382.
Besley, Timothy and Masayuki Kudamatsu. 2006. “Health and democracy.” The AmericanEconomic Review 96(2):313–318.
Blaydes, Lisa and Mark Andreas Kayser. 2011. “Counting Calories: Democracy and Distributionin the Developing World.” International Studies Quarterly 55(4):887–908.
Bonacich, Phillip. 1987. “Power and Centrality: A Family of Measures.” American Journal ofSociology 92(5):1170–1182.
Calvo, Ernesto and María Victoria Murillo. 2013. “When Parties Meet Voters.” ComparativePolitical Studies 46(7):851–882.
32

Cameron, A Colin, Jonah B Gelbach and Douglas L Miller. 2008. “Bootstrap-based improve-ments for inference with clustered errors.” The Review of Economics and Statistics 90(3):414–427.
Campbell, David E. 2013. “Social Networks and Political Participation.” Annual Review ofPolitical Science 16:33–48.
Carter, Brett L. 2014. Inside Autocracy: Political Survival and the Modern Prince PhD thesisHarvard University.
Cruz, Cesi, Julien Labonne and Pablo Querubín. 2017. “Political Family Networks and ElectoralOutcomes: Evidence from the Philippines.” American Economic Review 107(10):3006–3037.
Dasgupta, Aditya and Daniel Ziblatt. 2014. “How did Britain Democratize? Views from theSovereign Bond Market.” Journal of Economic History 75(1):1–29.
de la Sierra, Raul Sanchez. 2017. “On the Origin of States: Stationary Bandits and Taxation inEastern Congo.” https://raulsanchezdelasierra.files.wordpress.com/2013/09/revised-manuscript.pdf.
De Onis, Mercedes and T Lobstein. 2010. “WHO child growth standards.” International Journalof Pediatric Obesity 5(6):458–460.
Dube, Arin, Ethan Kaplan and Suresh Naidu. 2011. “Coups, Corporations, and ClassifiedInformation.” Quarterly Journal of Economics 126(3):1375–1409.
Dupuy, Alex. 2007. The Prophet and Power: Jean-Bertrand Aristide, the International Commu-nity, and Haiti. New York: Rowman & Littlefield Publisher, Inc.
Farmer, Paul. 1994. The Uses of Haiti. Austin, TX: Common Courage Press.
Fass, Simon M. 1990. Political Economy in Haiti: The Drama of Survival. New Brunswick, NJ:Transaction Publishers.
Fatton, Robert. 2002. Haiti’s Predatory Republic: The Unending Transition to Democracy.Boulder, CO: Lynne Rienner.
Fisman, Raymond. 2001. “Estimating the Value of Political Connections.” American EconomicReview 91(4):1095–1102.
French, Howard. The New York Times. October 13 1991. “Haiti policeseen as gaining in coup.” http://www.nytimes.com/1991/10/13/world/haiti-police-seen-as-gaining-in-coup.html.
Galeotti, Andrea, Sanjeev Goyal, Matthew O. Jackson, Fernando Vega-Redondo and Leeat Yariv.2010. “Network Games.” Review of Economic Studies 77(1):218–244.
Gandhi, Jennifer. 2008. Political Institutions under Dictatorship. New York: CambridgeUniversity Press.
33

Grantham-McGregor, Sally, Yin Bun Cheung, Santiago Cueto, Paul Glewwe, Linda Richter andBarbara Strupp. 2007. “Developmental potential in the first 5 years for children in developingcountries.” The Lancet 369(9555):60–70.
Hallward, Peter. 2010. Damming the Flood: Haiti and the Politics of Containment. London:Verso.
Hausmann, Ricardo, César A. Hidalgo, Sebastián Bustos, Michele Coscia, Sarah Chung, JuanJimenez, Alexander Simoes and Muhammed A. Yildirim. 2013. The Atlas of EconomicComplexity: Mapping Paths to Prosperity. Center for International Development.
Hummels, David. 2007. “Transportation Costs and International Trade in the Second Era ofGlobalization.” Journal of Economic Perspectives 21(3):131–154.
Jackson, Matthew O. 2008. Social and Economic Networks. Princeton University Press.
Jensen, Helen H., Stanley R. Johnson and Gary L. Stampley. 1990. Nutrition in Haiti: Evidencefrom the Haiti Household Expenditure and Consumption Survey. Center for Agricultural andRural Development, Iowa State University.
König, Michael, Dominic Rohner, Mathias Thoenig and Fabrizio Zilibotti. 2014. “Networks inConflict: Theory and Evidence from the Great War of Africa.”.
Leetaru, Kalev and Philip A Schrodt. 2013. GDELT: Global data on events, location, and tone.In ISA Annual Convention. Citeseer.
Meyersson, Erik. 2016. “Political man on horseback: coups and development.” StockholmInstitute for Transition Economics (SITE) 5.
Mitra, Devashish, Dimitrios D. Thomakos and Mehmet A. Ulubasoglu. 2002. “Protectionfor Sale in a Developing Country: Democracy vs. Dictatorship.” Review of Economics andStatistics 84(3):497–508.
Naidu, Suresh. 2012. “Suffrage, Schooling, and Sorting in the Post-Bellum U.S. South.” NBERWorking Paper 18129.
Nickell, Stephen. 1981. “Biases in Dynamic Models with Fixed Effects.” Econometrica49(6):1417–1426.
Padgett, John F. and Chrsitopher K. Ansell. 1993. “Robust Action and the Rise of the Medici,1400-1434.” American Journal of Sociology 98(6):1259–1319.
Plummer, Brenda Gayle. 1988. Haiti and the Great Powers, 1902-1915. Baton Rouge, LA:Lousiana State University Press.
Podur, Justin. 2013. Haiti’s New Dictatorship: The Coup, the Earthquake and the UN Occupation.London: Pluto Press.
34

Pons, Pascal and Matthieu Latapy. 2006. “Computing communities in large networks usingrandom walks.” J. Graph Algorithms Appl. 10(2):191–218.
Puga, Diego and Daniel Trefler. 2014. “International Trade and Institutional Change: MedievalVenice’s Response to Globalization.” Quarterly Journal of Economics 129(2):753–821.
Rauch, James E. 1999. “Networks versus markets in international trade.” Journal of InternationalEconomics 48:7–35.
Rotberg, Robert I. 1971. Haiti: The Politics of Squalor. Boston, MA: Houghton MifflinCompany.
Schuller, Mark. 2008. “Behind Haiti’s food riots.” International Socialist Review 59.
Supplice, Daniel. 2001. Dictionnaire biographique des personnalités politiques de la Républiqued’Haïti. Belgium: Imprimerie Lannoo.
Supplice, Daniel. 2009. ...De La Naturalisation en Haiti. Port-au-Prince: Imprimerie HenriDeschamps.
Svolik, Milan W. 2012. The Politics of Authoritarian Rule. New York: Cambridge UniversityPress.
The New York Times. June 1 2004. “The price of rice soars, andHaiti’s hunger deepens.” http://www.nytimes.com/2004/06/01/world/the-price-of-rice-soars-and-haiti-s-hunger-deepens.html.
Zald, Mayer N. and John D. McCarthy. 1987. Social Movements in an Organizational Society.New Brunswick, NJ: Transaction Books.
35

Tables
Table 1: Coup Participation
Dependent variable:Coup
(1) (2) (3) (4) (5) (6) (7) (8) (9) (10)
Centrality 0.213∗∗∗ 0.188∗∗∗ 0.098 0.077 0.193∗∗∗ 0.172∗∗∗ 0.199∗∗∗ 0.130∗ 0.139∗ 0.138∗
(0.055) (0.054) (0.064) (0.069) (0.059) (0.058) (0.065) (0.072) (0.072) (0.076)Family Size 0.057∗∗∗ 0.045∗∗∗ 0.052∗∗∗ 0.082∗∗∗ 0.082∗∗∗ 0.072∗∗∗ 0.068∗∗∗ 0.066∗∗
(0.013) (0.014) (0.015) (0.021) (0.021) (0.026) (0.026) (0.030)Political 0.059 0.038 0.052 0.051 0.042Elite (0.044) (0.051) (0.084) (0.085) (0.095)Military 0.117∗∗∗ 0.106∗∗∗ 0.066 0.075 0.058Elite (0.037) (0.041) (0.101) (0.104) (0.110)Business 0.050 0.048Elite (0.043) (0.048)Middle 0.248∗∗∗ 0.298∗∗∗ 0.168 0.172 0.217Eastern (0.095) (0.105) (0.120) (0.124) (0.141)Immigrant 0.057 0.051 0.078 0.087 0.083
(0.059) (0.065) (0.098) (0.099) (0.108)Value −0.020 −0.021 −0.004 −0.011
(0.030) (0.030) (0.036) (0.040)Consumption 0.026 0.024 0.019 0.012Share (0.052) (0.046) (0.050) (0.053)All Inputs −0.015 0.012 0.173 0.175
(0.139) (0.143) (0.183) (0.212)
Product Chars. X XCommunity FE 72 22
Sample All elite ImportersObservations 716 716 716 716 217 217 217 217 217 217R2 0.017 0.042 0.075 0.152 0.034 0.087 0.092 0.125 0.142 0.205
Robust standard errors in parentheses.∗p<0.1; ∗∗p<0.05; ∗∗∗p<0.01

Table 2: Prices of goods imported by coup participators during autocratic periods
Dependent variable:
Haiti retail priceHaiti
supplyprice
Worldsupplyprice
(1) (2) (3) (4) (5) (6) (7) (8)
Coup × Autocracy 0.188∗∗ 0.022∗∗∗ 0.021∗∗∗ 0.021∗∗∗ 0.018∗∗ 0.023∗∗∗ 0.190 0.066(0.073) (0.006) (0.005) (0.006) (0.007) (0.008) (0.332) (0.066)[0.067] [0.006] [0.005] [0.005] [0.006] [0.007] [0.314] [0.063]
Coup × Quake 0.102 0.074 0.072 0.072 0.069∗ 0.069 0.717∗∗∗ −0.218(0.150) (0.047) (0.047) (0.047) (0.041) (0.045) (0.270) (0.157)
Centrality × Autocracy 0.001∗∗
(0.0003)Centrality × Quake 0.00005
(0.002)World Supply Price 0.001 −0.0003 −0.0003
(0.004) (0.004) (0.004)Number Firms × Autocracy −0.003 −0.002
(0.002) (0.002)Consumption Share × Autocracy −0.0005 −0.0004
(0.001) (0.0005)Month FE X X X X X X X XProduct FE X X X X X X X XNumber of Lagged DVs 1 4 4 4 4 4 4Product × Conflict Events X X
Observations 2,538 2,448 2,250 2,214 2,214 2,214 1,938 2,304Clusters 18 18 18 18 18 18 18 18Breusch-Godfrey test (p-value) <0.001 <0.001 0.82 0.86 0.7 0.666 0.159 <0.001Joint Signif. of Lags (p-value) <0.001 <0.001 <0.001 <0.001 <0.001 <0.001 <0.001Unit Root (p-value) <0.001 <0.001 <0.001 <0.001 <0.001 <0.001 <0.001
Standard errors clustered at the product level in parentheses. Cameron, Gelbach and Miller’s (2008) wild bootstrapclusters in square brackets below the main coefficient of interest to account for the small number of clusters.∗ significant at p < .10; ∗∗p < .05; ∗∗∗p < .01
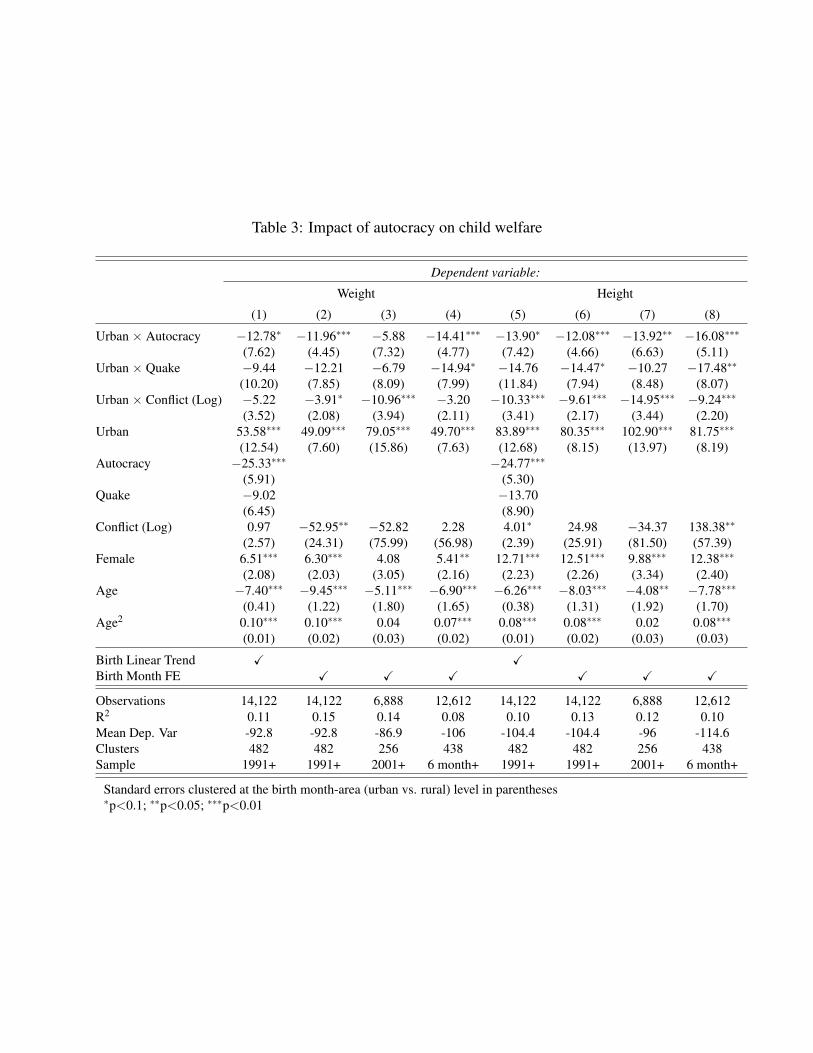
Table 3: Impact of autocracy on child welfare
Dependent variable:
Weight Height
(1) (2) (3) (4) (5) (6) (7) (8)
Urban × Autocracy −12.78∗ −11.96∗∗∗ −5.88 −14.41∗∗∗ −13.90∗ −12.08∗∗∗ −13.92∗∗ −16.08∗∗∗
(7.62) (4.45) (7.32) (4.77) (7.42) (4.66) (6.63) (5.11)Urban × Quake −9.44 −12.21 −6.79 −14.94∗ −14.76 −14.47∗ −10.27 −17.48∗∗
(10.20) (7.85) (8.09) (7.99) (11.84) (7.94) (8.48) (8.07)Urban × Conflict (Log) −5.22 −3.91∗ −10.96∗∗∗ −3.20 −10.33∗∗∗ −9.61∗∗∗ −14.95∗∗∗ −9.24∗∗∗
(3.52) (2.08) (3.94) (2.11) (3.41) (2.17) (3.44) (2.20)Urban 53.58∗∗∗ 49.09∗∗∗ 79.05∗∗∗ 49.70∗∗∗ 83.89∗∗∗ 80.35∗∗∗ 102.90∗∗∗ 81.75∗∗∗
(12.54) (7.60) (15.86) (7.63) (12.68) (8.15) (13.97) (8.19)Autocracy −25.33∗∗∗ −24.77∗∗∗
(5.91) (5.30)Quake −9.02 −13.70
(6.45) (8.90)Conflict (Log) 0.97 −52.95∗∗ −52.82 2.28 4.01∗ 24.98 −34.37 138.38∗∗
(2.57) (24.31) (75.99) (56.98) (2.39) (25.91) (81.50) (57.39)Female 6.51∗∗∗ 6.30∗∗∗ 4.08 5.41∗∗ 12.71∗∗∗ 12.51∗∗∗ 9.88∗∗∗ 12.38∗∗∗
(2.08) (2.03) (3.05) (2.16) (2.23) (2.26) (3.34) (2.40)Age −7.40∗∗∗ −9.45∗∗∗ −5.11∗∗∗ −6.90∗∗∗ −6.26∗∗∗ −8.03∗∗∗ −4.08∗∗ −7.78∗∗∗
(0.41) (1.22) (1.80) (1.65) (0.38) (1.31) (1.92) (1.70)Age2 0.10∗∗∗ 0.10∗∗∗ 0.04 0.07∗∗∗ 0.08∗∗∗ 0.08∗∗∗ 0.02 0.08∗∗∗
(0.01) (0.02) (0.03) (0.02) (0.01) (0.02) (0.03) (0.03)
Birth Linear Trend X XBirth Month FE X X X X X X
Observations 14,122 14,122 6,888 12,612 14,122 14,122 6,888 12,612R2 0.11 0.15 0.14 0.08 0.10 0.13 0.12 0.10Mean Dep. Var -92.8 -92.8 -86.9 -106 -104.4 -104.4 -96 -114.6Clusters 482 482 256 438 482 482 256 438Sample 1991+ 1991+ 2001+ 6 month+ 1991+ 1991+ 2001+ 6 month+
Standard errors clustered at the birth month-area (urban vs. rural) level in parentheses∗p<0.1; ∗∗p<0.05; ∗∗∗p<0.01

Figures
Figure 1: Coefficients on centrality placing increasing weight on close ties
(a) All elite
0.0
0.1
0.2
0.3
Coe
ffici
ent
bon
.9
bon
.8
bon
.7
bon
.6
bon
.5
bon
.4
bon
.3
bon
.2
bon
.1
bon
0
(b) Importers
0.0
0.1
0.2
0.3
Coe
ffici
ent
bon
.9
bon
.8
bon
.7
bon
.6
bon
.5
bon
.4
bon
.3
bon
.2
bon
.1
bon
0
Figure 2: Robustness: Coefficient on Coup × Autocracy dropping each product
−0.
02−
0.01
0.00
0.01
0.02
0.03
0.04
Coe
ffici
ent
CigarettesColaEdible oilKeroseneEvap. milkCorn meal
MedicineFurnitureBreadDry beansFishChicken
RiceSandalsWashing powderBeauty careSugarFabric

Figure 3: Placebo: Coefficient on Coup × Autocracy after arbitrarily moving the window ofautocracy
−1.
0−
0.5
0.0
0.5
Lagged Autocratic Window (Months)
Coe
ffici
ent
−48 −36 −24 −12 0 12 24 36 48
failed coupreal coup