Embed Size (px)
Citation preview

Wirtschaftsuniversität Wien Vienna University of Economics and Business Administration
Working Papers Series:
Growth and Employment in Europe: Sustainability and Competitiveness
Working Paper No. 29
SOCIAL NORMS AND EQUALITY OF OPPORTUNITY IN CONSPICUOUS
CONSUMPTION: ON THE DIFFUSION OF CONSUMER GOOD INNOVATION.
Andreas Reinstaller and Bulat Sanditov
July 2003
This working paper series presents research results of the WU-Research Focus: Growth and Employment in Europe, Sustainability and Competitiveness
The papers are available online under: http://www.wu-wien.ac.at/inst/vw1/gee/workp.html
Social norms and equality of opportunity
in conspicuous consumption: on the
diffusion of consumer good innovation.
Andreas Reinstaller and Bulat Sanditov
August 28, 2003
Abstract
This paper presents a simple evolutionary model to study the diffusion patterns
of product innovations for consumer goods. Following a Veblenian theme, we inter-
pret consumption as a social activity constrained by social norms and equality of
opportunity. Societies that allow for more behavioral variety will experience faster
adoption of new consumer goods. We also find that the speed of diffusion as well as
the saturation levels reached highly depend on the equality of opportunity. Com-
bining these two effects, we conclude that a social structure displaying behavioral
variety and equal opportunities dominates any other social set-up in terms of the
speed of adoption of product innovations.
Address: BReinstaller (corresponding author): Vienna University of Eco-nomics and Business Administration, Department of Economics, Augasse2-6, 1090 Vienna, Austria; Sanditov: Maastricht Economic Research Insti-tute on Innovation and Technology (Merit), Maastricht University, POB 616,6200MD [email protected], [email protected].
JEL Codes: D11, O31
Keywords: Conspicuous consumption, consumption dynamics, diffusionof consumer goods, social norms, equality of opportunity
Acknowledgements: This paper has benefited from comments by RobinCowan, Gunnar Eliasson, Georg Kirchsteiger, Reinhard Pirker and semi-nar participants at the University of Economics in Vienna, the MaastrichtEconomic Research Institute on Innovation and Technology (MERIT), Uni-versity of Maastricht, and participants of the EMAEE 2003 Conference inAugsburg, Germany.
1
1 Introduction
Early economists and contemporary economic historians alike have identi-
fied conspicuous consumption as an important determinant in the expansion
of markets and technological innovations in the Western world in the 18th
century and later. The acquisition and diffusion of consumer goods is driven
by “the recognition and admiration of our fellow human beings”, as “to de-
serve, to acquire, and to enjoy, the respect and admiration of mankind, are
the great objects of ambition and emulation”, (A.Smith, cited in Rosen-
berg [26, p.365]). This was particularly the case for semi-durable consumer
goods, such as ornaments of building, dress, or household furniture, (see e.g.
McKendrick et al. [21], Bianchi [3, p.6]). There is interdependence in the
choices of the different populations of adopters. Members of different so-
cial groups observe the consumption patterns of other members in society.
In the absence of more direct social contact consumption patterns reveal
the social status of people. This is a process in which consumers compare,
evaluate and imitate or reject the choices of relevant others. Furthermore,
socio-economic attributes such as disposable income or more pervasive value
systems have an influence on the choice and the subsequent legitimization of
an innovation in consumer goods. The diffusion of consumer good innova-
tion does not just involve the dissemination of information as the diffusion
literature typically would suggest (for an overview see Geroski [16]), but is
determined by a social process of persuasion and depends on the extent of
consumer heterogeneity in an economy.
Over the years the interest in the study of consumer behavior under the
presence of externalities amongst consumers has steadily increased. Many
contributions have drawn on ideas set out in the classic works of John Rae
[24] and Thorstein Veblen [35] on conspicuous consumption as well as on
1

ideas by sociologists such as Georg Simmel [31] or Pierre Bourdieu [4]. Most
of this literature has addressed the allocational aspect of interdependent
preferences and studied the adoption of pure luxury goods, such as fine art,
holiday resorts, luxury cars or fashion goods (see e.g. Pesendorfer [22] or
Swann [32]), but was not so much interested in the diffusion of positional
goods.
The paper studies the diffusion paths resulting under different parameter
settings capturing the social structure of an economy in a simple evolution-
ary model. By social structure we mean equality of opportunity and social
norms determining group cohesiveness. The first is an indicator for the class
structure and reflects the probability of an individual of being member of any
of the two classes, and the second is a measure for freedom of choice. These
two parameters constrain consumer behavior and hence affect the diffusion
patterns of new semi-durable consumer goods. We model two populations
of agents that differ in their income, in their behavior towards their peers
and in their social position. Agents in the leading high income group seek
distinction from members of the lower social class and draw well-being from
the fact to be similar or dissimilar to their peers. The extent to which be-
havioral variety within a social group exists is determined by social norms,
which may be thought of as social mechanisms sanctioning deviations from
group behavior. The lower class in turn behaves differently. As in the upper
class, there is a behavioral pattern which supports the cohesion of the group.
People draw utility from either conformist or snobbish behavior. But unlike
members of the upper class, lower class types aspire to the lifestyle of people
in the upper class. They want to conform with the social elite. This is a typ-
ical setting of conspicuous consumption. The leading class shows the way,
while the lower class follows. Depending on the social norms and equality
2
of opportunity in society, very different diffusion patterns result, which we
characterize in terms of market penetration time and speed of substitution.
In the next section we review relevant literature and give an overview
on the framework guiding our formal analysis. We then advance the evolu-
tionary model to study the diffusion patterns resulting from different social
settings. In the fourth section we discuss our results and relate them to the
history of consumerism. Final comments conclude our paper.
2 Background
2.1 Previous work
The classical contributions of Duesenberry [11], Leibenstein [20] or Venieris
and Hayakawa [17] have tried to endogenize preferences through introduction
of social or cultural propensities into the consumer’s choice problem or the
incorporation of Veblenian topics into utility functions. These authors imply
that preferences for conspicuous or status goods are driven by comparison of
individuals with social reference groups. People may react positively to the
consumption pattern of some groups and adversely to others. Accordingly,
wants are shown not to be randomly distributed throughout the society but
to cluster for specific social groups.
On this Veblenian line of thought several authors have developed status
game models to study the property of demand schedules under conspicuous
consumption and implications for taxation (see Corneo and Jeanne [7], [8]),
as well as possible market failure resulting from it and conditions under
which it can be avoided (see Pesendorfer [22] and Bagwell and Bernheim [2]).
The diffusion of new products is not an explicit aim of the analysis of these
papers.
Other work has partly addressed this question. Some authors have
3
shown that if the behavioral patterns of an individual are alternatingly en-
forced or dampened by the behavior of significant others, chaotic demand
patterns may emerge (see for instance Congleton [6], Iannaccone [18] or
Rauscher [25]). Similarly Cowan, Cowan and Swann [9] have devised a
stochastic model whose dynamic is based on aspiration-, bandwagon- and
Veblen effects. They show that if certain consumer groups seek distinction
and others aspire to their behavior cyclical consumption patterns and con-
sumption waves may emerge. In a similar fashion Janssen and Jager [19]
explain market dynamics with lock-in, fashions or unstable renewal. They
posit that it is dominated by the behavioral rules of consumers reflecting
preference for distinction or conformity.
Cowan et al. and Janssen and Jager identify consumption norms as
an emergent property of systems of single agents interacting with others.
While we believe that social norms do indeed emerge from social interaction
of individuals, it is also the case that individuals act embedded in some
given social structure. Social norms, for instance, lead often to institutions
which have a semi-permanent character and change only slowly as norms
change. Individuals are also part of different social groups whose members
show similar behavior not only against each other but also against members
of other social groups. We believe that these are factors that should not be
neglected. Therefore, instead of taking an agent based view, we pursue a
population approach and study adoption patterns and the speed of diffusion
in relation to a given social structure.
2.2 Consumption as a social activity: the relation to socialstructure
Commodities do not only have an intrinsic value in use, they have also a
social meaning. Sociologists have long stressed that individuals value goods
4
because they define their social position in relation to associates in lower or
higher status positions. This comparison enters in the assessment of their
well-being (see Bourdieu [4]). In a similar line Amartya Sen [27, p.7] has ar-
gued that commodities have functionings which allow people to do something
or to be something. These functionings are different from having a good or
from having utility. They depend on the evaluation of the circumstances of
life of a person and are also determined through interpersonal comparison.
This points to the fact that preferences of individuals are interrelated.
An early example for the recognition of interrelatedness of preferences
was Duesenberry’s [11] analysis of the consumption patterns of households
which led to the formulation of his relative income hypothesis. It states
that families reduce their savings in order to keep up with the standard
of living to which they have become accustomed in case their income falls.
For Easterlin [12] this corresponds to a model in which the well-being of an
individual varies with his or her income but is inversely related to the income
of others. He shows in a series of papers that people do not feel better off
with increasing affluence unless their relative position with regard to other
members of the society improves. One of the possible reasons for this is
that when consumers interact and learn from each other they do not only
exchange information about the technical characteristics of the products
they own, but also about their social symbols or meanings which are the
result of social interaction. These meanings are constituted by the way in
which people interact in distinct social contexts. Commodities and their
functionings affect the perception people have about themselves and create
identity via social differentiation.
Veblen [35] has suggested that individuals compare themselves to sig-
nificant others in terms of the status that comes with the wealth displayed
5
through consumption. The comparison of the achievements of a person and
the ones of its social reference group is a major force in creating desires and
aspiration. The command over commodities is a mean to these ends. In
a capitalistic society achieved money wealth is an important criterion for
social achievement, but as direct personal interactions are less common this
becomes obvious to others only through the consumption pattern of relevant
others. Accordingly the functionings a person is able to attain through the
acquisition and consumption of commodities act as important signalling de-
vices for status. The differences in achievable functionings are a source for
aspiration. As people desire to live up to “standards of decency” [35, p.88]
in a society that is hierarchically structured the social elites are obvious ex-
amples to follow. People thus tend to seek consumption patterns associated
with the lifestyles of higher income groups. As Frey and Stutzer [15, p. 411]
put it, “people look upward when making comparisons. Aspirations thus
tend to be above the level reached.”
The discussion so far shows that the consumption of commodities does
not only signal what people actually are, but also how they would like to
be considered. Veblen’s theory of conspicuous consumption is based on the
assumption that leading classes tend to seek distinction from other social
groups in order to show their status as social elite. As over time commodi-
ties lose their ability to confer status, members of these social group tend
to continuously acquire new consumption goods. They are the resources
with which the competition of individuals for the scarce resource “status”
takes place (Campbell [5, p.104]). In this way the material norms on which
judgements of well-being are based change continuously.
A possible reason for this is that the members of the leading groups of
society draw part of their identity and well-being from what they consume.
6
Nevertheless, over time the income of the lower social groups increases and
they acquire the capability of imitating the social elite. As a consequence its
members will change their patterns of consumption in order to defend their
relative position of well-being. The dialectic tension between aspiration and
distinction gives rise to a never ending race, as commodities that, at one
time may confer status loose their significance once the other classes have
caught up. In this way tastes do “trickle down” from the higher classes
to lower social strata (see Trigg [34, p. 106]. This is a powerful engine of
social and economic change. Its effect will be more pronounced in an equal
society, where the chances of an individual to become a member of the upper
class are high. Under these circumstances it is more likely that lower class
individuals encounter upper class individuals and induce aspiration effects.
There are different forces at work within social groups that govern group
cohesion or rejection. Social norms establish behavioral regularities to which
the members of a group are supposed to adhere. As consumption is a sig-
nalling device for social status, it is naturally constrained by them as well.
Posner [23] defines social norms as a rule that is based on some socially
shared belief on how people ought to behave but is not promulgated by any
official or legal source. They are sometimes self-enforcing, sometimes en-
forced by expressions of disapproval, ridicule, ostracism or codes of honor
and related actions. Social norms are a behavioral public good to which ev-
ery member should make a positive contribution. If that happens the behav-
ior is reciprocated while deviations from established patterns of behavior are
likely to be heavily punished (see e.g. Fehr and Gachter [13, p.166]). These
mechanisms determine the pressure towards uniformity in groups. People
cannot easily avoid them due to their inherited position in social space, as
repeated social interactions are socially localized. Accordingly people tend
7
to choose similar commodities than their peers because “joining the ’herd’
makes their choice act less assertive and perspicuous” (Sen [28, p. 751]). So-
cial norms determine the bandwidth within which discrepancies in behavior
are allowed and hence the ease to break with the closer social environment.
An example of such a case is the medieval society with its “God given” or-
der discussed later. Any break with the social group assigned by birth was
impossible and could only happen at the danger of being marginalized by
society. In more subtle ways such norms exist still today and are a defining
moment of any society.
As Akerlof [1] has stressed interactions in a social group are not only syn-
ergetic but very often they are also conflictual. People tend to move out of a
group which does not share their basic values and the group in turn supports
their exit in order to maintain its inner cohesion (see Simon [30]). Economic
success or educational achievement may endow members of a social group
with some upper-class power or attributes so that in their aspiration to a
higher standard of living they break with their social environment. People
who already have a high status in turn may feel the need to overcome their
inherited social past, as they resent the social eminence of their peers and
search for alternative means of expression. These forces give rise to behav-
ioral variety within groups which consists of compliance with and rejection
of given lifestyles.
This discussion suggests that the social factors influencing the adoption
of a positional good may be condensed to effects existing between members of
different social classes, namely aspiration and distinction, and intra-group
effects consisting of snobbism or individualistic behavior and conformism
or bandwagon behavior. In the model that follows we take into account
these two characteristics of the social structure in which an individual is
8
embedded to study their influence on the speed of market penetration of
the new commodity. These social characteristics are the engine driving
the dynamics in the model. As will be shown, different constellations of
social coherence in the leading group and equality of opportunity give rise
to different patterns of diffusion.
3 The model
We formalize the considerations put forward in the previous section as an
evolutionary game with two groups of individuals.1 As such our model is
concerned with the frequency evolution of consumption strategies in the
economic system. In this model the members of each population are het-
erogeneous. The perceived utility derived from consumption is based on
the individuals characteristics and the characteristics of the population as
a whole, i.e. the individuals in the game derive their utility of consumption
from the interaction with the members of their own groups, as well as from
the interaction with members of the other social group.
We derive the equilibria of the model analytically and establish their
local stability, but unlike most theoretical work in evolutionary games the
focus of our model does not lie on the investigation of the application of
the evolutionary stable strategy solution concept to the dynamic stability
of the replicator dynamic. We focus on the study of the adjustment process
towards a new equilibrium once a new commodity is introduced into the
economy. For this purpose we simulate the behavior of the model for some
limit scenarios and analyze the resulting diffusion patterns.1See Taylor [33], as well as Cressman [10] and Weibull [36] and the classic references
cited there.
9
3.1 Players and Strategies
There are two social classes in our model. Each class i (i=1,2) is charac-
terized by an “average” available consumption budget per unit of time and
individual wi, w1 < w2, and its share in the total population qi, q1 > q2 with
q1 + q2 = 1. Equality of opportunity is captured by these population shares.
The share of the lower class, q1 may be thought of as a measure of equality:
if q1 = 0.5 we have a perfectly equal class structure, as each agent has an
equal probability of being member in one of the two cohorts. Population
shares and available income (w1, w2, q1, q2) are exogenously given and are
assumed to be constant over time.
We assume that each unit of time an individual of a population chooses
a consumption basket consisting of two parts: a luxury good, and a basic
good. The utility of consuming a basket is the sum of the utilities from
consuming its parts. In choosing a luxury good an individual has the choice
between two alternatives: good X with price px, or good Y with price py. We
assume that the endowment of each individual is large enough to consume
any of the two commodities, (wi > py, px); i = 1, 2. The luxury goods
are indivisible. For simplicity we also assume that they have no other value
than a social one. In other words, individuals derive utility from owning the
good or not as this conveys social status and not from its intrinsic value in
use. Consumption of the basic good has no particular social meaning and
has decreasing marginal utility. The basic good is perfectly divisible. We
assume that prices reflect marginal costs, and that they do not change over
time.2
The share of the lower class consuming good X at time t is given by x1.
The remaining share of the population consuming good Y is y1 = 1 − x1.2This is done for analytical clarity. The results do not change if we assume falling
prices (due to scale or learning economies) for the new good.
10
Similarly, x2 and y2 = 1−x2 are the shares of the upper class of individuals
consuming X and Y , respectively. Thus, individuals in both classes play
pure strategies where the strategies are denoted as ex when she chooses the
basket with good X and ey when he goes for the basket with good Y . The
population states for the two classes are then defined by s1=(x1, y1) for the
lower class, and by s2=(x2, y2) for the upper class.
3.2 Payoffs
Goods with social meaning Capturing some of the considerations ad-
vanced in the previous section, we assume that consumption of goods X
and Y is driven purely by social factors. We analyze two important behav-
ioral motives described before: aspiration and distinction. The lower class
aspires to the standards of decency demonstrated by the upper class, the
social elite. Members of this group would like to signal status similar to
that of the upper class. In terms of our model this means that they want
to buy what the upper class buys. On the other hand the upper class seeks
distinction to preserve their status as social elite.
As for the behavior within the two social groups we will examine a spec-
trum of different “social norms” ranging from a society forcing strict behav-
ioral compliance on their members, to a “non-conformist” society, where it
is important for any individual to emphasize his own identity and individ-
uality from the others. In a conformist society mechanisms of retaliation
will sanction deviant behavior. Conversely in a “non-conformist” society
individuals “aping” others will be perceived as a nuisance and accordingly
retaliatory mechanisms will ensure that this does not happen too frequently.
We assume that an individual is engaged into two contests per unit of
time against a randomly drawn opponent from the total population. The
utility given by a specific consumption profile depends on his expected payoff
11
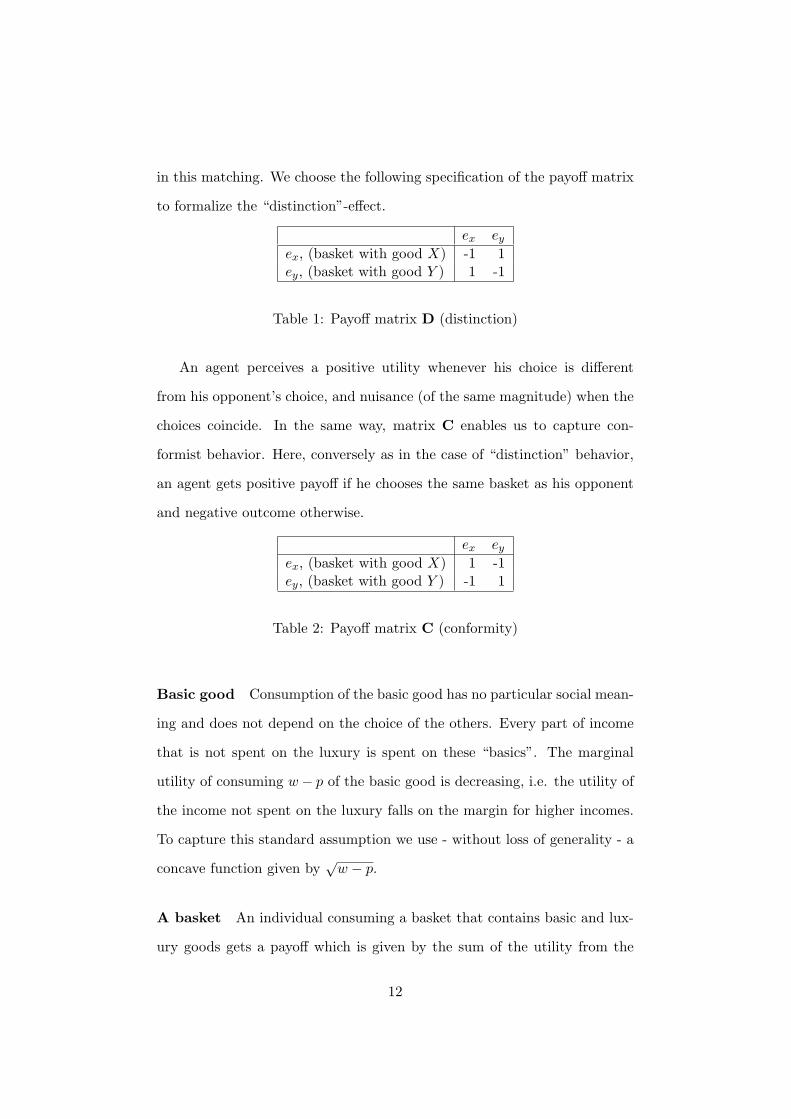
in this matching. We choose the following specification of the payoff matrix
to formalize the “distinction”-effect.
ex ey
ex, (basket with good X) -1 1ey, (basket with good Y ) 1 -1
Table 1: Payoff matrix D (distinction)
An agent perceives a positive utility whenever his choice is different
from his opponent’s choice, and nuisance (of the same magnitude) when the
choices coincide. In the same way, matrix C enables us to capture con-
formist behavior. Here, conversely as in the case of “distinction” behavior,
an agent gets positive payoff if he chooses the same basket as his opponent
and negative outcome otherwise.
ex ey
ex, (basket with good X) 1 -1ey, (basket with good Y ) -1 1
Table 2: Payoff matrix C (conformity)
Basic good Consumption of the basic good has no particular social mean-
ing and does not depend on the choice of the others. Every part of income
that is not spent on the luxury is spent on these “basics”. The marginal
utility of consuming w− p of the basic good is decreasing, i.e. the utility of
the income not spent on the luxury falls on the margin for higher incomes.
To capture this standard assumption we use - without loss of generality - a
concave function given by√
w − p.
A basket An individual consuming a basket that contains basic and lux-
ury goods gets a payoff which is given by the sum of the utility from the
12
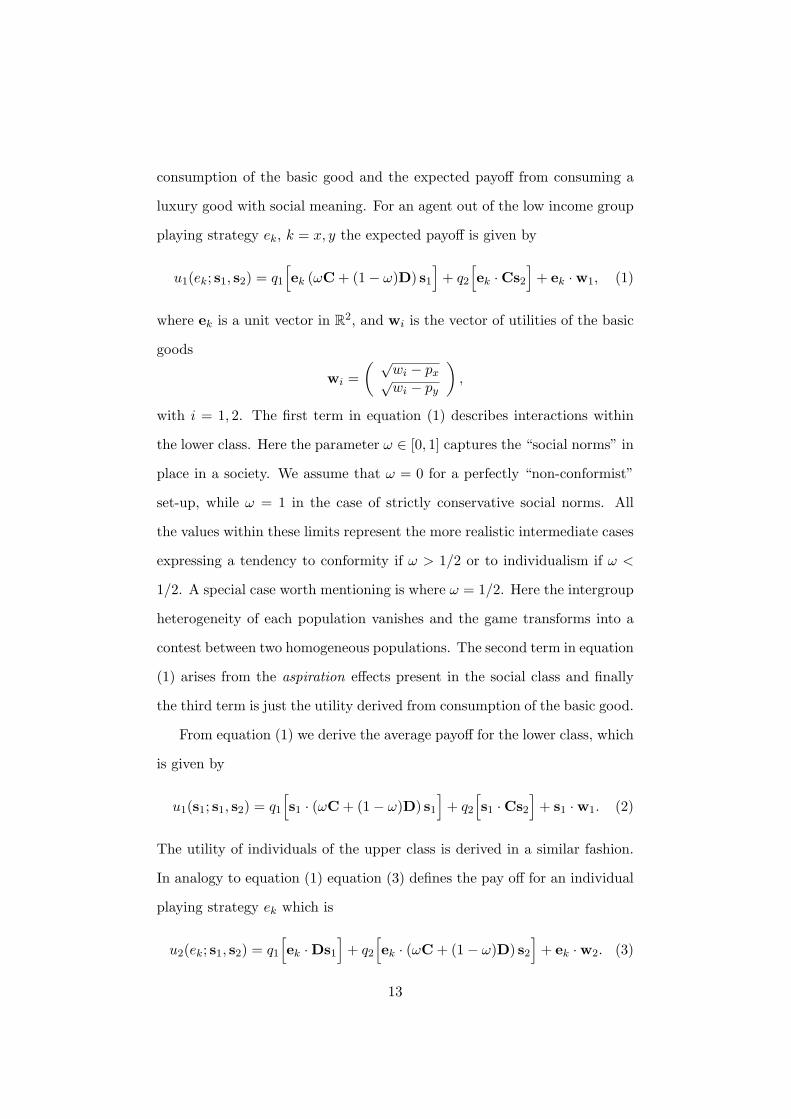
consumption of the basic good and the expected payoff from consuming a
luxury good with social meaning. For an agent out of the low income group
playing strategy ek, k = x, y the expected payoff is given by
u1(ek; s1, s2) = q1
[ek (ωC + (1− ω)D) s1
]+ q2
[ek ·Cs2
]+ ek ·w1, (1)
where ek is a unit vector in R2, and wi is the vector of utilities of the basic
goods
wi =( √
wi − px√wi − py
),
with i = 1, 2. The first term in equation (1) describes interactions within
the lower class. Here the parameter ω ∈ [0, 1] captures the “social norms” in
place in a society. We assume that ω = 0 for a perfectly “non-conformist”
set-up, while ω = 1 in the case of strictly conservative social norms. All
the values within these limits represent the more realistic intermediate cases
expressing a tendency to conformity if ω > 1/2 or to individualism if ω <
1/2. A special case worth mentioning is where ω = 1/2. Here the intergroup
heterogeneity of each population vanishes and the game transforms into a
contest between two homogeneous populations. The second term in equation
(1) arises from the aspiration effects present in the social class and finally
the third term is just the utility derived from consumption of the basic good.
From equation (1) we derive the average payoff for the lower class, which
is given by
u1(s1; s1, s2) = q1
[s1 · (ωC + (1− ω)D) s1
]+ q2
[s1 ·Cs2
]+ s1 ·w1. (2)
The utility of individuals of the upper class is derived in a similar fashion.
In analogy to equation (1) equation (3) defines the pay off for an individual
playing strategy ek which is
u2(ek; s1, s2) = q1
[ek ·Ds1
]+ q2
[ek · (ωC + (1− ω)D) s2
]+ ek ·w2. (3)
13
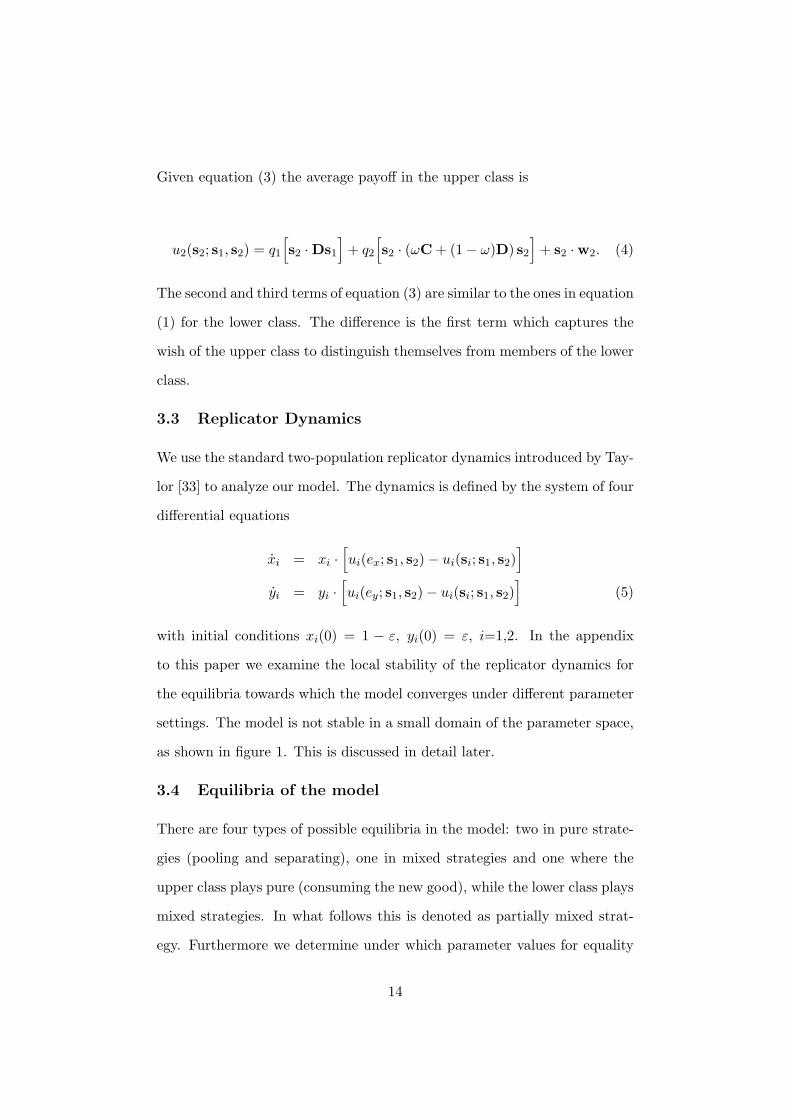
Given equation (3) the average payoff in the upper class is
u2(s2; s1, s2) = q1
[s2 ·Ds1
]+ q2
[s2 · (ωC + (1− ω)D) s2
]+ s2 ·w2. (4)
The second and third terms of equation (3) are similar to the ones in equation
(1) for the lower class. The difference is the first term which captures the
wish of the upper class to distinguish themselves from members of the lower
class.
3.3 Replicator Dynamics
We use the standard two-population replicator dynamics introduced by Tay-
lor [33] to analyze our model. The dynamics is defined by the system of four
differential equations
xi = xi ·[ui(ex; s1, s2)− ui(si; s1, s2)
]yi = yi ·
[ui(ey; s1, s2)− ui(si; s1, s2)
](5)
with initial conditions xi(0) = 1 − ε, yi(0) = ε, i=1,2. In the appendix
to this paper we examine the local stability of the replicator dynamics for
the equilibria towards which the model converges under different parameter
settings. The model is not stable in a small domain of the parameter space,
as shown in figure 1. This is discussed in detail later.
3.4 Equilibria of the model
There are four types of possible equilibria in the model: two in pure strate-
gies (pooling and separating), one in mixed strategies and one where the
upper class plays pure (consuming the new good), while the lower class plays
mixed strategies. In what follows this is denoted as partially mixed strat-
egy. Furthermore we determine under which parameter values for equality
14

of opportunity (q1 > 0.5) and social norms (ω) a given equilibrium ex-
ists and is locally stable in the replicator dynamics (5). In the appendix
we show that they are (locally) stable. For all parameters other than
qi and ω we use the same values as we employ for our simulations, i.e.
w1 = 1, w2 = 2, px = 0.5, py = 1.
3.4.1 Pooling (no penetration) equilibrium: y1 = 0, y2 = 0.
This is an equilibrium where there is no diffusion of the new good at all.
The equilibrium requires
∆u1(0, 0) < 0, and ∆u2(0, 0) < 0.
where ∆ui = ui(ey; s1, s2) − ui(ex; s1, s2), i = 1, 2 represent gains or losses
in utility for each of the classes from consuming the new or the old good.
According to (1) and (3) ∆ui(y1, y2) is then defined as
∆u1(y1, y2) = 4αq1y1 + 4q2y2 −∆w1 − 2αq1 − 2q2,
∆u2(y1, y2) = −4q1y1 + 4αq2y2 −∆w2 + 2q1 − 2αq2, (6)
where α ≡ 2ω − 1 and ∆wi ≡√
wi − px −√
wi − py > 0. Substituting
expressions for ∆ui from (6) we get
q1(1− α) < 1 +∆w1
2, and q1(1 + α) < α +
∆w2
2. (7)
When these inequalities hold, there is no diffusion. Accordingly, the share
of the new good in equilibrium will be zero,
Y ∗ = 0. (8)
3.4.2 Separating equilibrium: y1 = 0, y2 = 1.
In separating equilibrium only the upper class adopts the new good, while
the lower class uses the old one. The conditions for the equilibrium are
∆u1(0, 1) < 0, and ∆u2(0, 1) > 0.
15

or by substituting as before
q1(1 + α) > 1− ∆w1
2, and q1(1− α) <
∆w2
2− α. (9)
The equilibrium market share of the new good when inequalities (9) hold is
given by
Y ∗ ≡ q1y1 + q2y2 = q2. (10)
3.4.3 Partially mixed equilibrium: 0 ≤ y1 ≤ 1, y2 = 1.
The third possible equilibrium is a partially mixed equilibrium where the
upper class uses only the new good, while the lower class uses both. The
conditions for the equilibrium are
∆u1(y∗1, 1) = 0, and ∆u2(y∗1, 1) > 0. (11)
Accordingly, from the first equation in (11) we can find the equilibrium
market share for the lower class y∗1:
y∗1 =12
+∆w1 − 2q2
4αq1for α 6= 0. (12)
The equilibrium market share for the upper class, if condition (11) is to
hold, is y∗2 = q2. From this together with (12) the market share of the new
good in equilibrium is given by
Y ∗ = q1y∗1 + q2 = 1− q1
2+
∆w1 − 2q2
4αfor α 6= 0 (13)
To determine the domain of q1 and ω, where the equilibrium exists we sub-
stitute y∗1 into inequality (11) and in addition we require 0 < y∗1 < 1. It
gives us
(1− q1)(1 + α2) > (<)∆w1 + α∆w2
2,
(1− α)q1 < (>) 1− ∆w1
2,
(1 + α)q1 > (<) 1− ∆w1
2, (14)
16

for α > 0 (α < 0).
3.4.4 Equilibrium in mixed strategies: 0 ≤ y1 ≤ 1, 0 ≤ y2 ≤ 1.
Finally, there is an equilibrium in the model, where individuals from both
classes use the old and the new good. It must hold that u1x = u1y and
u1x = u1y. This implies that the following conditions hold,
∆u1(y∗1, y∗2) = 0, and ∆u2(y∗1, y
∗2) = 0.
The solution to the system of equations is
y∗1 =12
+α∆w1 −∆w2
4(1 + α2)q1,
y∗2 =12
+∆w1 + α∆w2
4(1 + α2)q2.
Therefore the market share of the new good is
Y ∗ = q1y∗1 + q2y
∗2 =
12
+(1 + α)∆w1 − (1− α)∆w2
4(1 + α2)(15)
The solutions of the system must be in the range (0,1). From this follows
that equilibrium (15) exists in the area in parameter space delimited by the
following conditions
q1 >α∆w1 −∆w2
2(1 + α2), q1 < 1 +
∆w1 + α∆w2
2(1 + α2),
q1 > −α∆w1 −∆w2
2(1 + α2), q1 < 1− ∆w1 + α∆w2
2(1 + α2). (16)
3.4.5 Domains of the equilibrium and stability
The domain of the parameters for social norms and equality of opportunity
(ω, q1) (0 ≤ ω ≤ 1, 0.5 ≤ q1 ≤ 1) for which the different equilibria exist and
are locally stable can be divided into five parts by inequalities (7), (9), (14),
(16) and the stability conditions given in the appendix. This is depicted in
the figure 1.
17
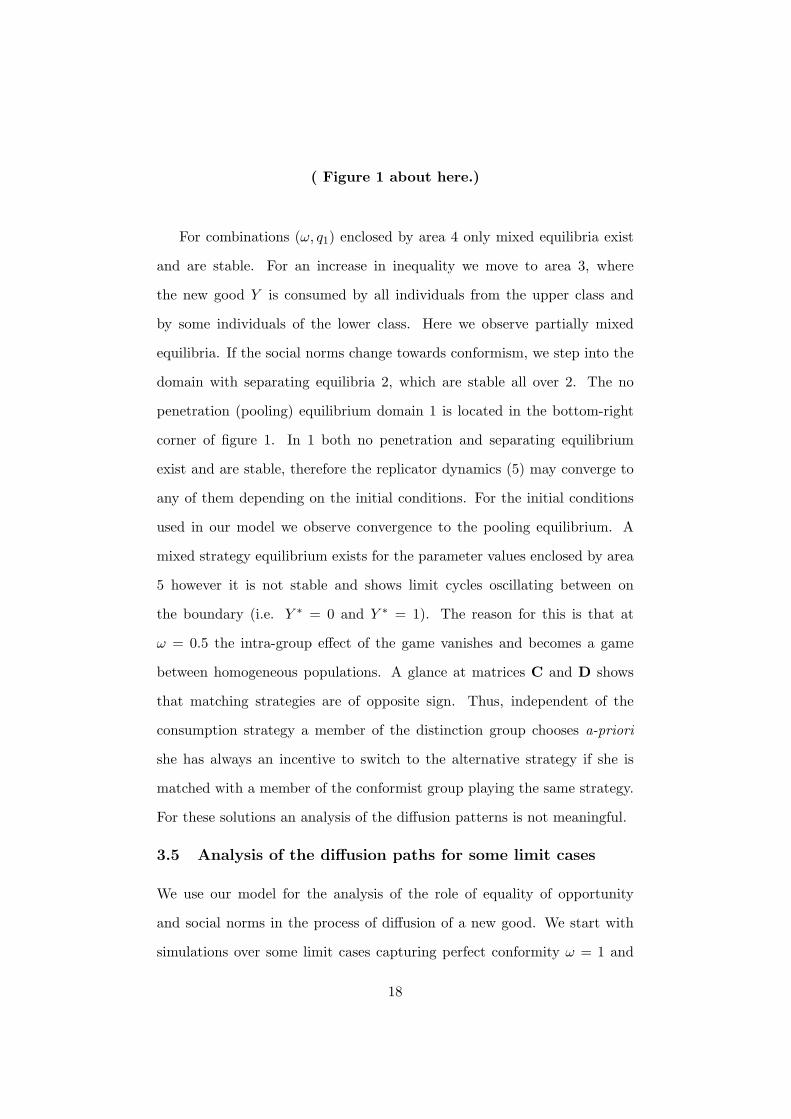
( Figure 1 about here.)
For combinations (ω, q1) enclosed by area 4 only mixed equilibria exist
and are stable. For an increase in inequality we move to area 3, where
the new good Y is consumed by all individuals from the upper class and
by some individuals of the lower class. Here we observe partially mixed
equilibria. If the social norms change towards conformism, we step into the
domain with separating equilibria 2, which are stable all over 2. The no
penetration (pooling) equilibrium domain 1 is located in the bottom-right
corner of figure 1. In 1 both no penetration and separating equilibrium
exist and are stable, therefore the replicator dynamics (5) may converge to
any of them depending on the initial conditions. For the initial conditions
used in our model we observe convergence to the pooling equilibrium. A
mixed strategy equilibrium exists for the parameter values enclosed by area
5 however it is not stable and shows limit cycles oscillating between on
the boundary (i.e. Y ∗ = 0 and Y ∗ = 1). The reason for this is that at
ω = 0.5 the intra-group effect of the game vanishes and becomes a game
between homogeneous populations. A glance at matrices C and D shows
that matching strategies are of opposite sign. Thus, independent of the
consumption strategy a member of the distinction group chooses a-priori
she has always an incentive to switch to the alternative strategy if she is
matched with a member of the conformist group playing the same strategy.
For these solutions an analysis of the diffusion patterns is not meaningful.
3.5 Analysis of the diffusion paths for some limit cases
We use our model for the analysis of the role of equality of opportunity
and social norms in the process of diffusion of a new good. We start with
simulations over some limit cases capturing perfect conformity ω = 1 and
18
total non-conformity ω = 0, as well as set-ups for a society with perfectly
equal opportunity and with strongly unequal opportunity, i.e. for parameter
values q1 = 0.5 and q1 = 0.9 respectively. We assume that the consumption
prior to a date t = 0 is limited to only one basket with good X. At that
moment in time a new product Y is introduced with an initial market share
ε (for both classes). The price of the new product, py, is higher than the
price of the old one, px. We examine the model for px = 0.5, py = 1 and
consumption budgets w1 = 1, w2 = 2,. The initial market share of Y for
both social groups is set to ε = 0.01.
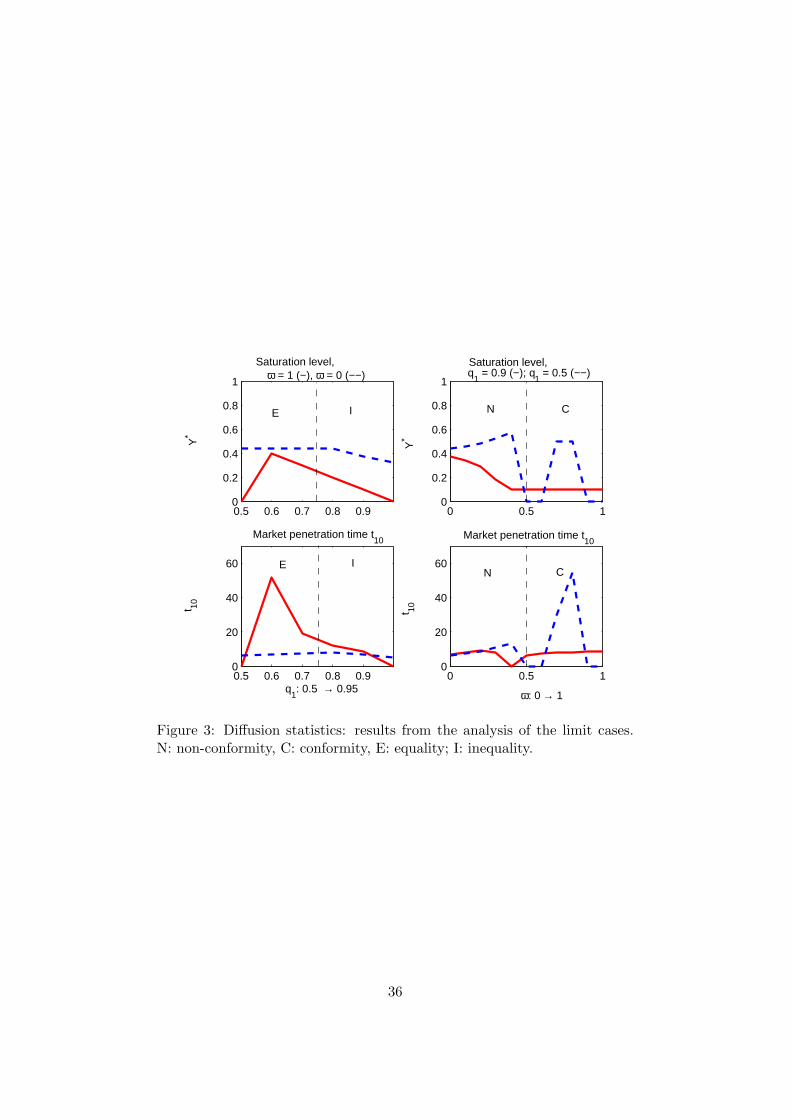
We use standard measures to describe the diffusion paths resulting from
our simulations. Technological forecasters commonly characterize the diffu-
sion speed of new commodities as the length of the time interval elapsing
between the diffusion path reaching 10% and 90% of the final saturation
level of the commodity. This measure is denoted as ∆t := t90% − t10%. As
∆t ignores the time interval elapsing between the initial introduction of the
commodity and it reaching 10% of the final equilibrium market share we will
use the t10% measure separately to capture the time it takes a commodity
to take off and penetrate the market. The results from these calculations
together with the absolute saturation levels is depicted in figure 3. In our
discussion we ignore the ∆t measure, as it is very similar for all runs and does
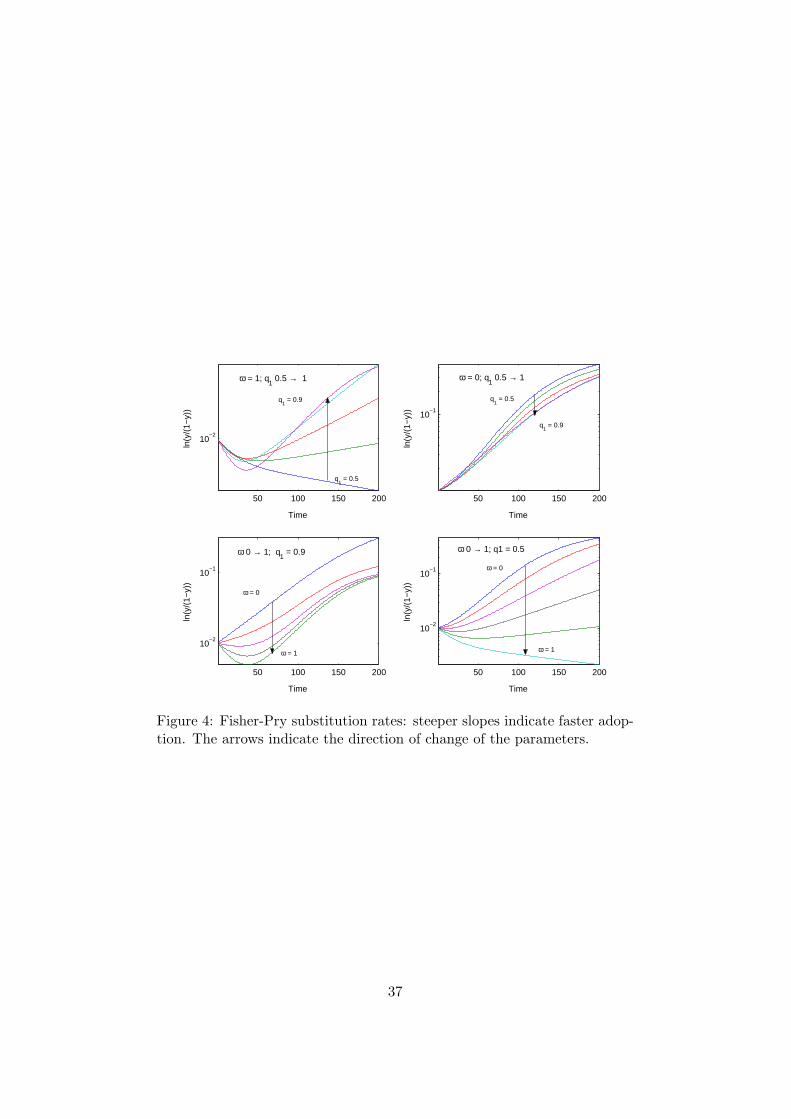
not add much information. Alternatively, we use the Fisher-Pry substitu-
tion rate [14] which captures the speed at which an old commodity is driven
out of the market. This model suggests a logistic substitution trajectory
y
1− y= exp(a + bt).
In its linear transform ln( y1−y ) the slope b of a fitted straight line captures the
learning or substitution speed, while the intercept a measures the adoption
delay. The steeper this line is, the faster substitution takes place, the larger
19
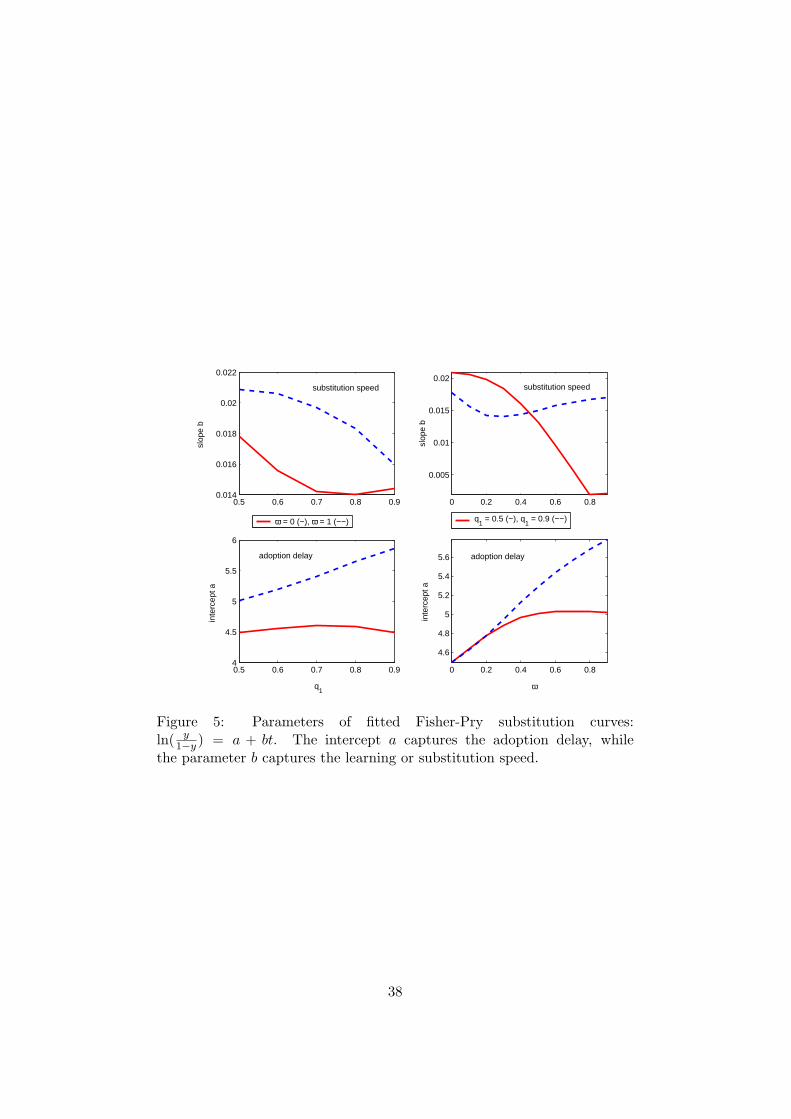
the intercept (in absolute terms), the higher is the adoption delay. The
Fisher-Pry substitution rate is depicted in figure 4, while the intercepts and
slopes of fitted curves are presented in figure 5.
3.5.1 Effect of inequality
We first examine two polar cases of social norms and analyze how changing
equality of opportunity influences the diffusion pattern of the new consumer
good introduced at time t = 0. The paths our model generates for these
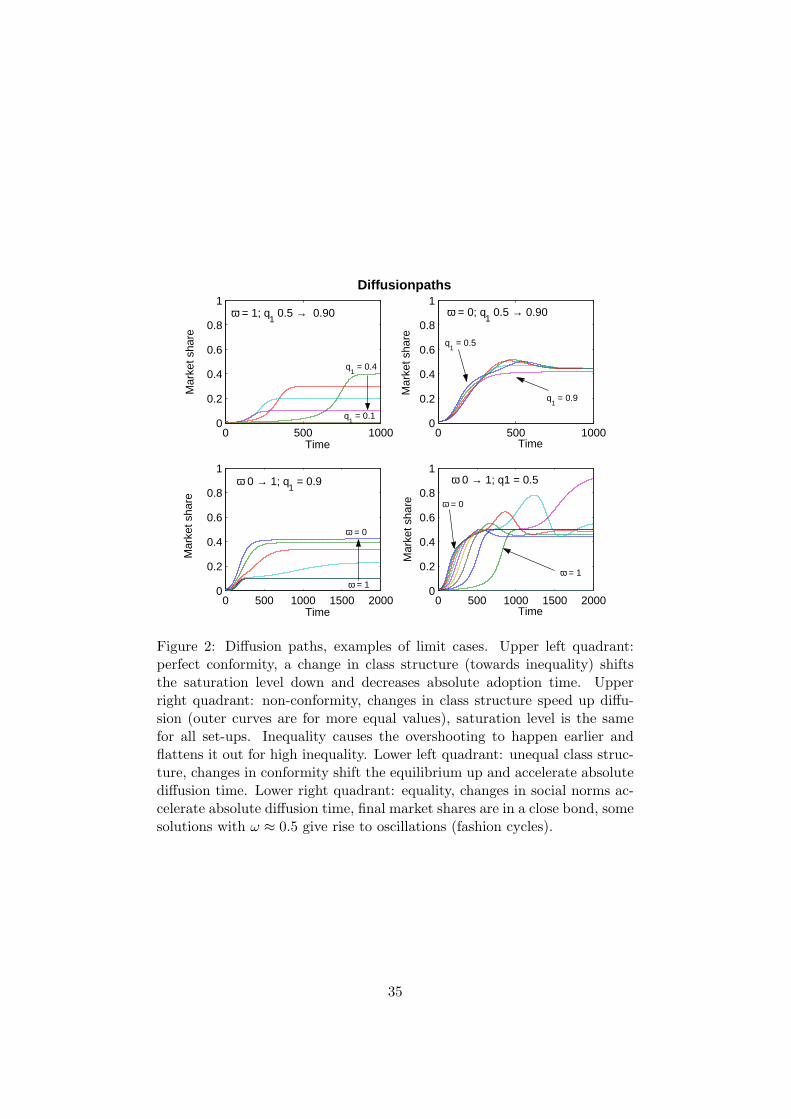
constellations are shown in the upper quadrants of figure 2.
( Figure 2 about here.)
Conservative social norms, ω = 1 Under perfect conformity the intra-
class distinction effect is not present, i.e. the D matrices in the terms cap-
turing inner-group interaction in our equations (1) and (3) disappear. In this
case people of the same social class who are randomly matched play a coor-
dination game given by pay-off matrix C. The top left quadrant of figure 2
shows the diffusion curves resulting for a parameter range 0.5 ≤ q1 ≤ 0.95.
The effect of growing equality is twofold: on one hand it speeds up diffusion
and on the other hand the level of saturation falls.
With the given initial conditions at q1 = q2 the members of the lower
class derive the same expected utility from being equal to their peers as well
as from being equal to the upper class. There is no incentive for members of
the lower class to switch to the new commodity, as given the initial market
shares of the new commodity in the two groups, utility is already almost at
its maximum. We observe at first a pooling equilibrium given by equation
(8). The few initial adopters will switch back to the old luxury due to
existing peer pressure.
20
A change in equality has the effect on the upper class to increase disutility
from being equal than the lower class. It starts paying upper class individu-
als to adopt the new good. The model settles on separating equilibria given
by equation (10). Due to the pressure towards conformity adoption is very
slow. Diffusion takes longest under near-equality conditions (see figure 2)
but eventually the whole upper class will adopt the new commodity.
Non-conformist society, ω = 0 The top right quadrant of figure 2 indi-
cates that the diffusion paths resulting in a non-conformist society are quite
different. In a perfectly non-conformist social constellation the matrix C
capturing intra-group interaction in equations (1) and (3) vanishes. In this
case people of the same social class who are randomly matched play a “hawk-
dove” game given by pay-off matrix D. Each individual seeks to be different
from its peers. This means that over the parameter range of q1 up to the
value of q1 = 0.9 the model settles on a mixed strategy equilibrium given by
equation (15) for both social classes, and to a partially mixed equilibrium
as in equation (13) at that value and beyond. This implies that under the
“individualistic” setting of this run the equilibrium reflects an economy with
maximum variety on the market for most equality of opportunity param-
eters. With fixed ω the market share for the new good gravitates around
0.45, and falls in the partially mixed equilibrium range.
The inter-group effects are responsible for short fashion waves visible as
an overshooting over the final saturation level. As the frequency of adopters
of the new good in the lower class increases, the upper class starts perceiving
disutility from buying it, while utility for the lower class increases, so that
there is an incentive to adopt more of it. This triggers some members of the
upper class to revert to the old commodity. With the frequency of adopters
of the new good in the upper class decreasing, utility of the new good falls
21
for individuals of the lower class as well and the model settles on the mixed
equilibrium. When the opportunity parameter is changed towards values
capturing inequality, the upper class will restrict consumption of Y earlier
as lower class members are encountered at higher frequency, thus causing the
overshooting to appear earlier. Rising inequality has the effect to dampen
out fashion waves as the parameter range for partially mixed equilibria is
approached.
3.5.2 Effect of conformity
While in the first set of runs we examined the diffusion path along the ver-
tical parameter axis in figure 1, we now change parameters to move along
its horizontal parameter axis, examining how changes in social norms in-
fluence the process of diffusion for any given equality of opportunity. The
diffusion curves are shown in the quadrants at the bottom of figure 2. The
diffusion paths resulting from these model runs are hybrids of the first two
cases studied so far.
Inequality, q1 = 0.9 In this case we observe partially mixed Nash equi-
libria and separating equilibria, as the parameter for conformity is changed
from 0 to 1. At low conformism players in both populations would tend
to use both goods but as inequality is high and the probability for upper
class types to encounter similar lower class types is high, it pays them to
play a pure strategy, even though it may cause disutility in playing against
peers. The shift of ω towards conformity leads to a fall in the adoption of
the new good in the lower class as the utility of individuals being equal to
their peers starts outweighing snobbism and aspiration effects. The satura-
tion level shifts downwards and the speed of diffusion decreases. The upper
class on the other hand continues to have an incentive to adopt the new
22
commodity due to the high frequency of members of the lower class in the
total population. The market share drops to the share of the upper class.
Equality, q1 = 0.5 In changing the parameter ω over its parameter range
the model settles on four possible equilibria. Under non-conformity we ob-
serve mixed strategy equilibria, in the parameter range of 0.5 ≤ ω < 0.6 the
model exhibits a cyclical behavior, beyond that separating equilibria and
close to perfect conformism there is a pooling equilibrium. Whether the
model settles on the latter depends on the initial conditions chosen and this
is the case for the parameter value for ε we use.
Fashion cycles emerge as the intra-group effects vanish. Members of the
lower class start deriving more utility from being equal to members of the
upper class, while the latter’s disutility increases through this development.
In approaching the critical value dampened cycles appear, which converge
to a stable saturation level after some time. At ω = 0.5 nevertheless, intra-
group effects completely vanish and fast cycles emerge. The upper class
has a continued incentive to change its consumption pattern, as the lower
class catches up. Only after conformity becomes stronger it pays better for
members of the lower social class to stick on the same consumption pattern
as their peers and forgo utility from imitating the upper classes.
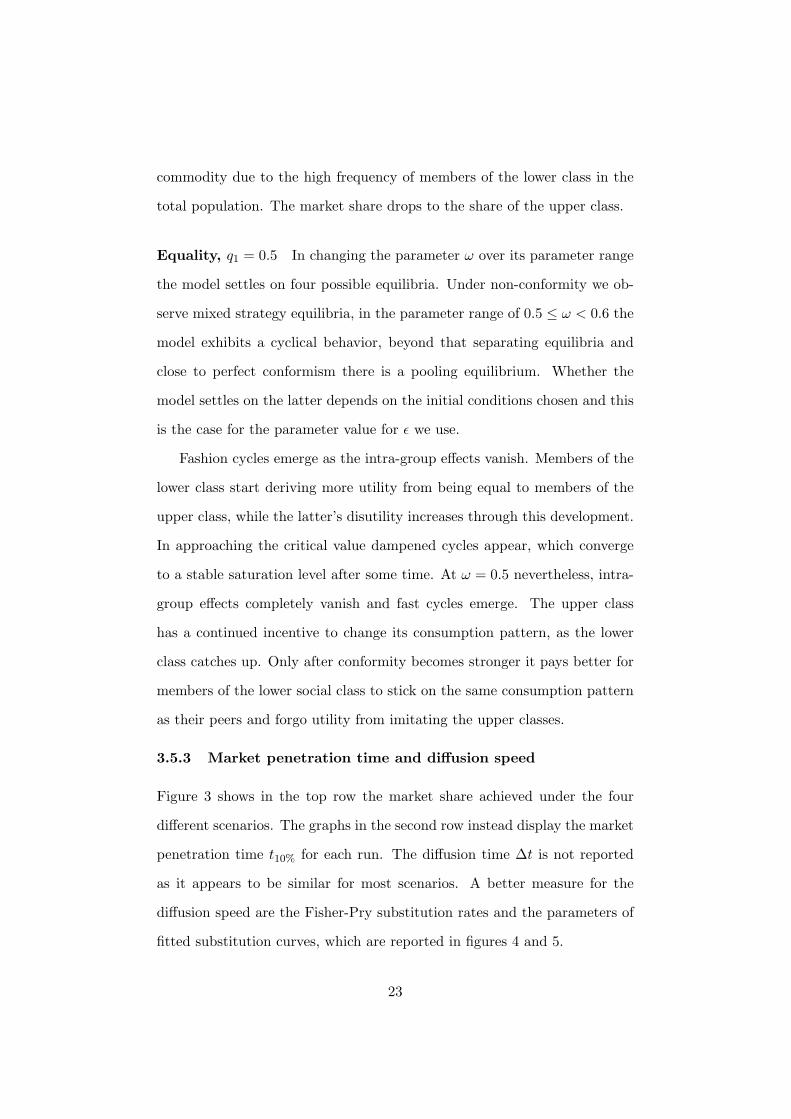
3.5.3 Market penetration time and diffusion speed
Figure 3 shows in the top row the market share achieved under the four
different scenarios. The graphs in the second row instead display the market
penetration time t10% for each run. The diffusion time ∆t is not reported
as it appears to be similar for most scenarios. A better measure for the
diffusion speed are the Fisher-Pry substitution rates and the parameters of
fitted substitution curves, which are reported in figures 4 and 5.
23
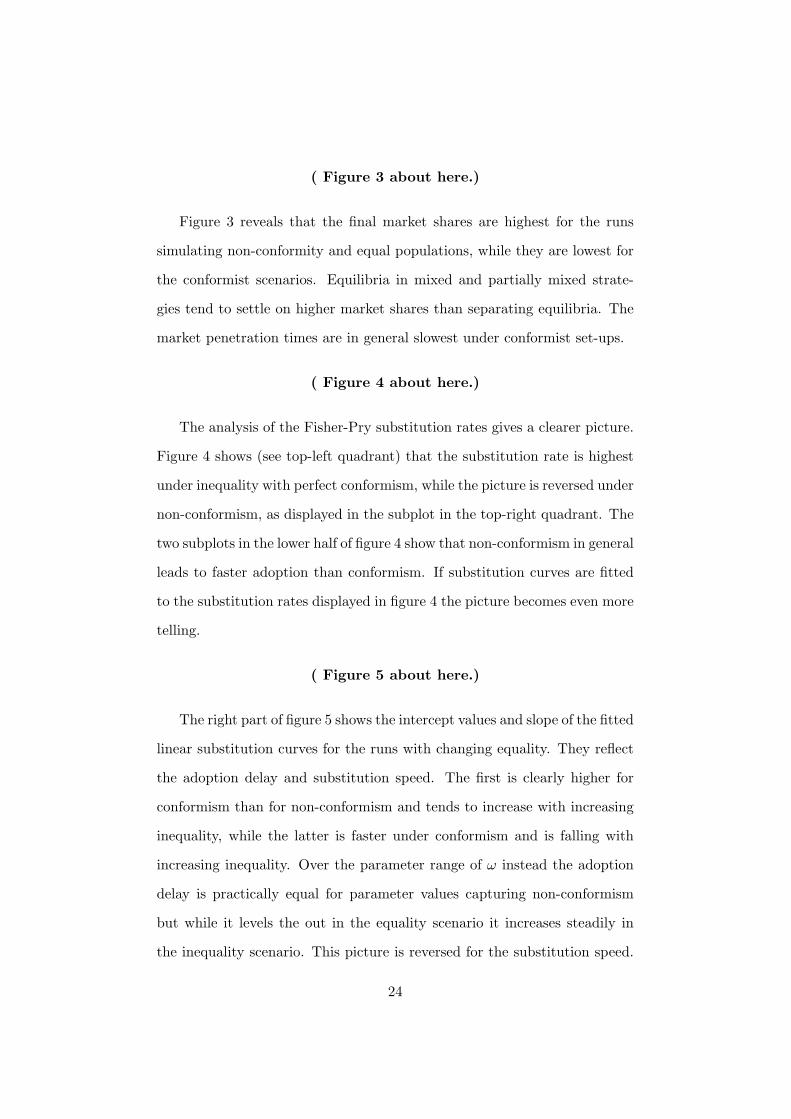
( Figure 3 about here.)
Figure 3 reveals that the final market shares are highest for the runs
simulating non-conformity and equal populations, while they are lowest for
the conformist scenarios. Equilibria in mixed and partially mixed strate-
gies tend to settle on higher market shares than separating equilibria. The
market penetration times are in general slowest under conformist set-ups.
( Figure 4 about here.)
The analysis of the Fisher-Pry substitution rates gives a clearer picture.
Figure 4 shows (see top-left quadrant) that the substitution rate is highest
under inequality with perfect conformism, while the picture is reversed under
non-conformism, as displayed in the subplot in the top-right quadrant. The
two subplots in the lower half of figure 4 show that non-conformism in general
leads to faster adoption than conformism. If substitution curves are fitted
to the substitution rates displayed in figure 4 the picture becomes even more
telling.
( Figure 5 about here.)
The right part of figure 5 shows the intercept values and slope of the fitted
linear substitution curves for the runs with changing equality. They reflect
the adoption delay and substitution speed. The first is clearly higher for
conformism than for non-conformism and tends to increase with increasing
inequality, while the latter is faster under conformism and is falling with
increasing inequality. Over the parameter range of ω instead the adoption
delay is practically equal for parameter values capturing non-conformism
but while it levels the out in the equality scenario it increases steadily in
the inequality scenario. This picture is reversed for the substitution speed.
24
In the part of the parameter space where the adoption delays are equal for
the equality and inequality scenarios it is faster for the equality scenario but
falling as parameters are set to capture conformism.
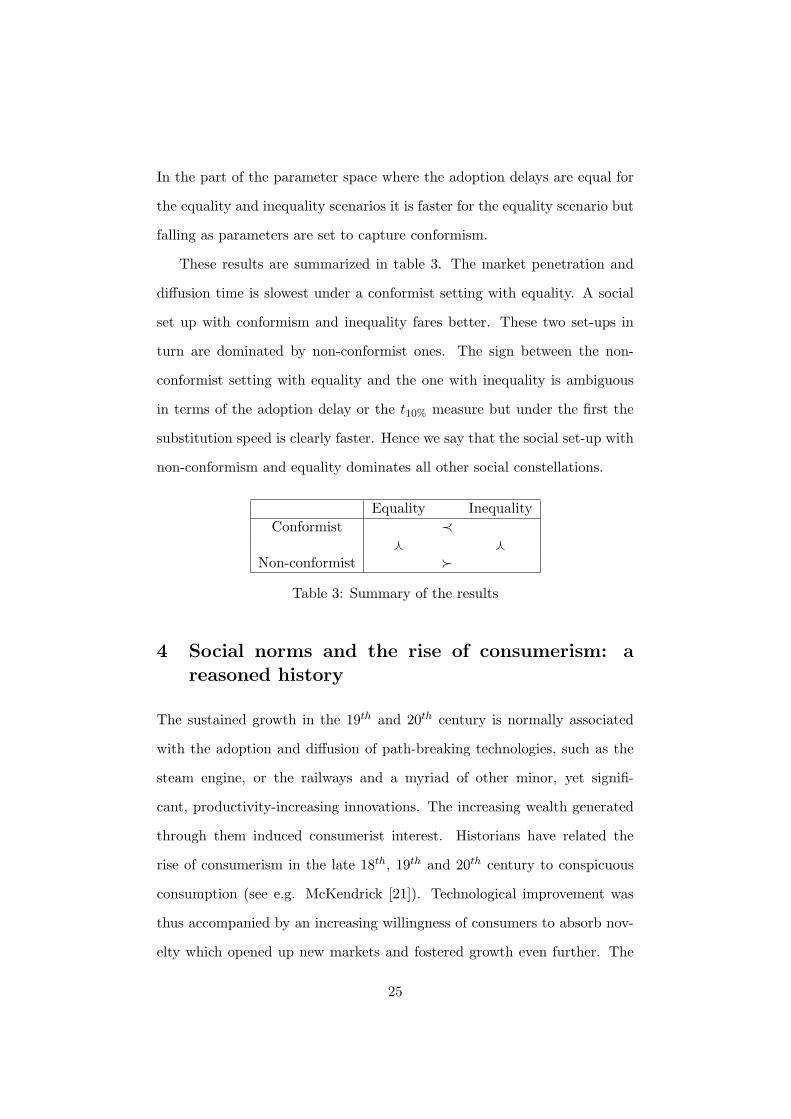
These results are summarized in table 3. The market penetration and
diffusion time is slowest under a conformist setting with equality. A social
set up with conformism and inequality fares better. These two set-ups in
turn are dominated by non-conformist ones. The sign between the non-
conformist setting with equality and the one with inequality is ambiguous
in terms of the adoption delay or the t10% measure but under the first the
substitution speed is clearly faster. Hence we say that the social set-up with
non-conformism and equality dominates all other social constellations.
Equality InequalityConformist ≺
f fNon-conformist �
Table 3: Summary of the results
4 Social norms and the rise of consumerism: areasoned history
The sustained growth in the 19th and 20th century is normally associated
with the adoption and diffusion of path-breaking technologies, such as the
steam engine, or the railways and a myriad of other minor, yet signifi-
cant, productivity-increasing innovations. The increasing wealth generated
through them induced consumerist interest. Historians have related the
rise of consumerism in the late 18th, 19th and 20th century to conspicuous
consumption (see e.g. McKendrick [21]). Technological improvement was
thus accompanied by an increasing willingness of consumers to absorb nov-
elty which opened up new markets and fostered growth even further. The
25
historical record shows that such a relationship existed well before modern
times. Aristocracies tended to define their class lines through the consump-
tion of luxury goods and by fancying extensive mansions. As the group of
merchants grew in size and wealth they tended to imitate their lifestyles.
However consumerism and high class status were not automatic compan-
ions (see Stearns [29]). The causes were twofold. Firstly, before modern
times new products were not continuously generated, therefore there was a
limitation in terms to conspicuous behavior in consumption. The second,
and in relation to our model, more important reason is that social norms
built around traditional values and religious interest limited consumerism
even when the means were available.
Our results summarized in table 3 suggest that social norms can play
an inhibiting role if they do not allow for too much behavioral variety in
the social classes. These social norms have normally emerged and stabilized
over time. Certainly the most important and most influential ones in re-
lation to consumption were those associated with religion. The pervasive
value systems established around major religions urged their members to
seek spiritual goals and to be suspicious of material ones. This holds true
for Buddhism, Christianity or Islam. The display of riches and success was
thus inappropriate in terms of religious norms. A telling example is Christ’s
statement that it would be easier for a camel to pass through the eye of a
needle than for a rich man to gain entry into heaven. This maxim was con-
veniently used by the leading classes to cement the given social order. They
used religion to induce lower classes to stick to their “God given” position in
society and thus not to deviate in their consumption from that of their social
class. As the rules they set were disguised as God’s will, they could easily
develop into a social norm which was no longer perceived as imposed from
26

outside but as a matter of decency. Considering the importance of religious
belief such norms constrained consumer behavior not only in medieval times
but were actually present also during the first and second industrial revolu-
tion. Stearns [29, p.52-3] reports Protestant ministers in the United States
to have rallied as late as 1853 against the parade of luxury and demanding
from lower class believers to aspire to more durable riches than that offered
by the material world. Such reservations were often related to the fact that
conspicuous consumption blurred class lines. In complaining about deterio-
rating popular moral middle- and upper-class observers and their ministers
pointed to the fact that it was increasingly difficult to tell a person’s status
from the dress. This was, of course, not completely true as the differences
in quality remained remarkable. But the increasing importance of urban
life caused a shift in mainstream Protestantism. Consumer goods were now
considered to be God’s gifts to mankind. Our model suggests that the re-
laxation of such norms would ease the diffusion of new goods as it indeed
did.
The reasons for the increase in behavioral variety in the different social
classes in history were manifold and their discussion will also shed some light
on the relation between equality of opportunity and social norms which in
our model were assumed to be exogenous. The historical record suggests
that commercialization setting in with the age of Enlightenment was a ma-
jor driving force in disrupting strict social norms inhibiting consumption.
The new rationality in science led to the development of new productivity
enhancing tools and machines which in turn increased wealth. In addition
to the old aristocracy new wealthy merchant classes emerged. This rise in
equality was accompanied by a quest for a similar lifestyle as the estab-
lished classes. The merchants resented aristocratic eminence and tried to
27
challenge their social status. In turn during the period of the First and
Second Industrial Revolution many traditional lifestyles and the associated
social status were disrupted. The urbanization and the rapid population
growth furthered the process of status change. Consumption increasingly
gained importance in order to demonstrate social achievement. Commodi-
ties served as badges of identity in such a rapidly changing social climate
(see Stearns [29, p. 27-32]). This was even more the case as in the late
19th century workers started their quest for higher wages. The importance
of work changed from being a goal in itself. More and more people consid-
ered it an instrument for other gains and this translated into consumerist
interest (ibid. p. 56). This summary discussion suggests that an increase
in wealth and an increasingly equal equality of opportunity disrupted social
conventions which then exerted an inhibiting influence on behavioral vari-
ety in consumption. A more accurate enquiry into the precise relationship
between the two factors is an issue for further research but imitation and
conspicuous consumption seem to have gained increasing importance over
time. Our model is able to account for all these factors reasonably well.
The model allows to engage into an exercise of periodizing economic his-
tory over the last two centuries in Europe and the United States. The social
conventions over this period have developed in such a way that in terms of
table 3 a gradual move from the north-eastern to the south-western quadrant
took place. The north-eastern quadrant captures the social set-up of antique
or medieval societies with their strict adherence to a given social order and
an accentuated inequality. In the aftermath of the period of Enlighten-
ment wealth shifted increasingly away from the land-owning aristocracy to
merchants. Inequality decreased but remained high. This historical devel-
opment nevertheless disrupted the given social order enshrined in the guild
28
system and increased non-conformity in the society. This happened first in
the upper class where rich merchants competed in innovating new lifestyles
to show their position in society. The two Industrial Revolutions increased
freedom of choice also in the lower social classes, and the rise of democratic
institutions, the rise of public schools as well as the increasing activity of in-
dustrial action through trade unions supported the development of equality
of opportunity. This is the set-up of the south-western quadrant which, as
our results show, dominates all other social set-ups. This underscores again
the main result of the paper.
5 Conclusions
This paper develops a simple model of conspicuous consumption to study
the influence of parameters reflecting social structure on the diffusion paths
of product innovations of consumer goods. We used the set-up of an evolu-
tionary multi-population model with two populations. The first population
is the upper class, whose members act as innovating force in consumption.
The second population is the lower class, whose members imitate the con-
sumption behavior of the higher class. We assumed that in both classes
there are social norms exerting pressure on their members not to innovate
or imitate, i.e. to develop an “individualistic” consumption behavior. We
explored the influence of changes in equality of opportunity between the two
classes, as well as the effect of social norms on the speed of diffusion of new
products their take-off time and the market saturation level. The main find-
ing of the paper is that novelty diffuses most rapidly in a social setting where
equality of opportunity is equal and behavioral variety is high. This social
set-up dominates all other constellations. In other words, societies allow-
ing for more behavioral variety and ensuring equal equality of opportunity
29
should experience a more dynamic consumer behavior than otherwise. Our
model has potentially a wide range of implications, and could be extended
in various directions. Furthermore, we offered a theoretical interpretation of
the historical record on the rise of consumerism. We found that our model
was able to capture this development reasonably well.
References
[1] Akerlof G. A. (1997), Social Distance and Social Decisions, Econometrica,65, pp. 1005-1027.
[2] Bagwell L.S. and B. Douglas Bernheim (1996), Veblen Effects in a Theory ofConspicuous Consumption, American Economic Review, 86(3), pp. 349-373
[3] Bianchi, Marina (2002), Novelty, preferences, and fashion: whengoods areunsettling, Journal of Economic Behavior and Organization, 47, 1-18.
[4] Bourdieu P. (1984): Distinction. Cambridge, MA: Harvard University Press.
[5] Campbell, C. (1995), The sociology of consumption, in: Miller D. (ed.),Acknowledging Consumption, London: Routledge, pp. 96-126.
[6] Congleton, R.D. (1989), Efficient status seeking: externalities and the evo-lution of status games, Journal of Economic Behavior and Organization, 11,p.175-190.
[7] Corneo G., and O. Jeanne (1997), Conspicuous Consumption, Snobbism andConformism, Journal of Public Economics, 66, 55-71.
[8] Corneo G., and O. Jeanne (1997), Snobs, Bandwagons, and the Origin ofSocial Customs in Consumer Behavior, Journal of Economic Behavior andOrganisation, 32, 333-347.
[9] Cowan R., W. Cowan, and P. Swann (1997), A Model of Demand with Inter-action among Consumers, International Journal of Industrial Organization,15, 711-32.
[10] Cressman R. (1995), Evolutionary Game Theory with Two Groups of Indi-viduals, Games and Economic Behavior, 11, pp. 237-253.
[11] Duesenberry J. S. (1949), Income, Saving and the Theory of Consumer Be-havior. London: Cambridge University Press.
[12] Easterlin R. (1995), Will raising the incomes of all increase the happiness ofall?, Journal of Economic Behavior and Organization, 27, pp.35-47.
[13] Fehr E. and Gachter Simon (2000), Fairness and Retaliation, Journal ofEconomic Perspectives, 14(3), pp. 159-181.
[14] Fisher, J.C. and R.H. Pry (1971), A simple substitution model of techno-logical change, Technological Forecasting and Social Change, 3, pp. 75-88.
[15] Frey B. and Alois Stutzer (2002), What can economists learn from happinessresearch?, Journal of Economic Literature, 40(June), pp. 402-435.
30
[16] Geroski P. A. (2000), Models of Technology Diffusion, Research Policy, 29,pp. 603-625.
[17] Hayakawa, H. and Yiannis Venieris (1977), Consumer interdependence viareference groups, Journal of Political Economy, 85(3), 599-615.
[18] Iannaccone, L.R. (1989), Bandwagons and the threat of chaos: interpersonaleffects revisited, Journal of Economic Behavior and Organization, 11, pp.431-442.
[19] Janssen Marco A. and Wander Jager (2001), Fashion, Habits and ChangingPreferences: Simulation of psycological factors affecting market dynamics,Journal of Economic Psychology, 22, 745-772.
[20] Leibenstein, H. (1950), Bandwagon, Snob and Veblen Effects in the Theoryof Consumers, Quarterly Journal of Economics, 65, 183-207.
[21] McKendrick N., J. Brewer, and J. Plumb (1982), The Birth of a ConsumerSociety. The Commercialization of Eighteenth-Century England, London:Europa.
[22] Pesendorfer W. (1995), Design Innovation and Fashion Cycles, AmericanEconomic Review, 85, 771-92.
[23] Posner, R. (1997), Social Norms and the Law: An Economic Interpretation,American Economic Review, 87, 365-369.
[24] Rae, John (1905), The Sociological Theory of Capital, London: Macmillan,reprint of The New Principles of Political Economy publ. 1834.
[25] Rauscher, M. (1993), Demand for social status and the dynamics of con-sumer behavior, Journal of Socio-Economics, 22(2), pp. 105-113.
[26] Rosenberg N. (1968), Adam Smith, Consumer Tastes, and EconomicGrowth, Journal of Political Economy, 76(3), pp. 361-374
[27] Sen A. (1985), Commodities and Capabilities. New Dehli: Oxford UniversityPress.
[28] Sen A. (1997), Maximization and the Act of Choice, Econometrica, 65, pp.745-779.
[29] Stearns Peter N. (2001), Consumerism in World History. The global trans-formation of desire, London: Routledge
[30] Simon, H., and H. Guetzkow (1957), Mechanisms Involved in Pressures to-ward Uniformity in Groups, in: Models of Man, ed. by H. Simon. New York:Wiley Sons, 115-130.
[31] Simmel, G. (1957), Fashion, The American Journal of Sociology, 62, 541-558.
[32] Swann G. M. P. (2001), The Demand for Destinction and the Evolution ofa Prestige Car, Journal of Evolutionary Economics, 11, 59-75.
[33] Taylor, Peter D. (1979), Evolutionary stable strategies with two types ofplayer, Journal of Applied Probability, 16, pp. 76-83.
[34] Trigg A. B. (2001), Veblen, Bourdieu, and Conspicuous Consumption, Jour-nal of Economic Issues, 35(1), pp. 99-115.
[35] Veblen, T. (1921), The Theory of the Leisure Class: An Economic Study ofInstitutions, New York: Macmillan; first edition 1921.
[36] Weibull J.W. (1995), Evolutionary Game Theory, Cambridge: MIT Press
31
A Local stability of the equilibria of the model
Each Nash-equilibrium of our model gives the saturation level the new positional
good will reach for a specific parameter constellation after having been introduced
in the economy. To investigate their stability we rewrite the replicator dynamics
(5) as
y1 = y1(1− y1)∆u1,
y2 = y2(1− y2)∆u2, (17)
where the ∆ui is defined as in equation (6).
A.1 Pooling (no penetration) equilibrium: y1 = 0, y2 = 0.
To check if this equilibrium is (locally) stable we examine the Jacobian of the
replicator dynamics (17) at y∗1 = 0, y∗2 = 0
J (0, 0) =(
∆u1(0, 0) 00 ∆u2(0, 0)
).
Since ∆ui(0, 0) < 0, i = 1, 2 the determinant of the Jacobian is positive, detJ (0, 0) >
0, while the trace is negative, tr J (0, 0) < 0. Thus, we can conclude that for all
values of q1 and ω for which this equilibrium exists it is a stable stationary point
of the system (17).
A.2 Separating equilibrium: y1 = 0, y2 = 1.
At y∗1 = 0, y∗2 = 1 the Jacobian of (17) has form
J (0, 1) =(
∆u1(0, 1) 00 −∆u2(0, 1)
).
The determinant is positive for all q1 and ω. The sign of the trace is
sign(tr J ) = sign(∆u1(0, 1)−∆u1(0, 2)) =
sign(2(1− α)− 4q1 − (∆w1 −∆w2).
For the parameters (wi, pi) we have chosen, once the condition for this equilibrium
(9) hold, the sign of the trace is negative. In combination with the positive deter-
32
minant it implies that the equilibrium is stable for all values of parameters q1 and
ω satisfying (9).
A.3 Partially mixed equilibrium: 0 ≤ y1 ≤ 1, y2 = 1.
The Jacobian at the point of the equilibrium is
J (y∗1 , 1) =(
4αq1y∗1(1− y∗1) 4q2y
∗1(1− y∗1)
0 −∆u2(y∗1 , 1)
).
The sign of the determinant is determined by the sign of α:
sign(detJ )) = −sign(α).
Sign of the trace of the Jacobian is
sign(tr J ) = sign(4αq1y∗1(1− y∗1) + 4q1y
∗1 − 2αq2 + ∆w2 − 2q1).
For q1 and ω satisfying (14) the trace of the Jacobian for ω < 0.5 (α < 0) is negative,
while for ω > 0.5 (α > 0) it is positive. Taking into account that tr (J )2 > 4 det(J )
we can conclude that the equilibrium is a stable node of the replicator dynamics (17)
if ω < 0.5, For ω > 0.5 the equilibrium is a saddle point of the replicator dynamics,
and therefore it would depend on the initial conditions whether the system would
move towards the equilibrium or away from it.
A.4 Equilibrium in mixed strategies: 0 ≤ y1 ≤ 1, 0 ≤ y2 ≤ 1.
The Jacobian at the point of the equilibrium is
J (y∗1 , y∗2) =(
4αq1y∗1(1− y∗1) 4q2y
∗1(1− y∗1)
−4q1y∗2(1− y∗2) 4αq2y
∗2(1− y∗2)
).
The determinante and the trace of the Jacobian at (y∗1 , y∗2) are
detJ = 16q1q2y∗1(1− y∗1)y∗2(1− y∗2)(1 + α2) > 0,
sign(tr J ) = sign(4α(q1y∗1(1− y∗1) + q2y
∗2(1− y∗2)) = sign(α).
Thus, equilibrium in the mixed strategies is stable for ω < 0.5 (α < 0) and unstable
for ω < 0.5 (α < 0).
33
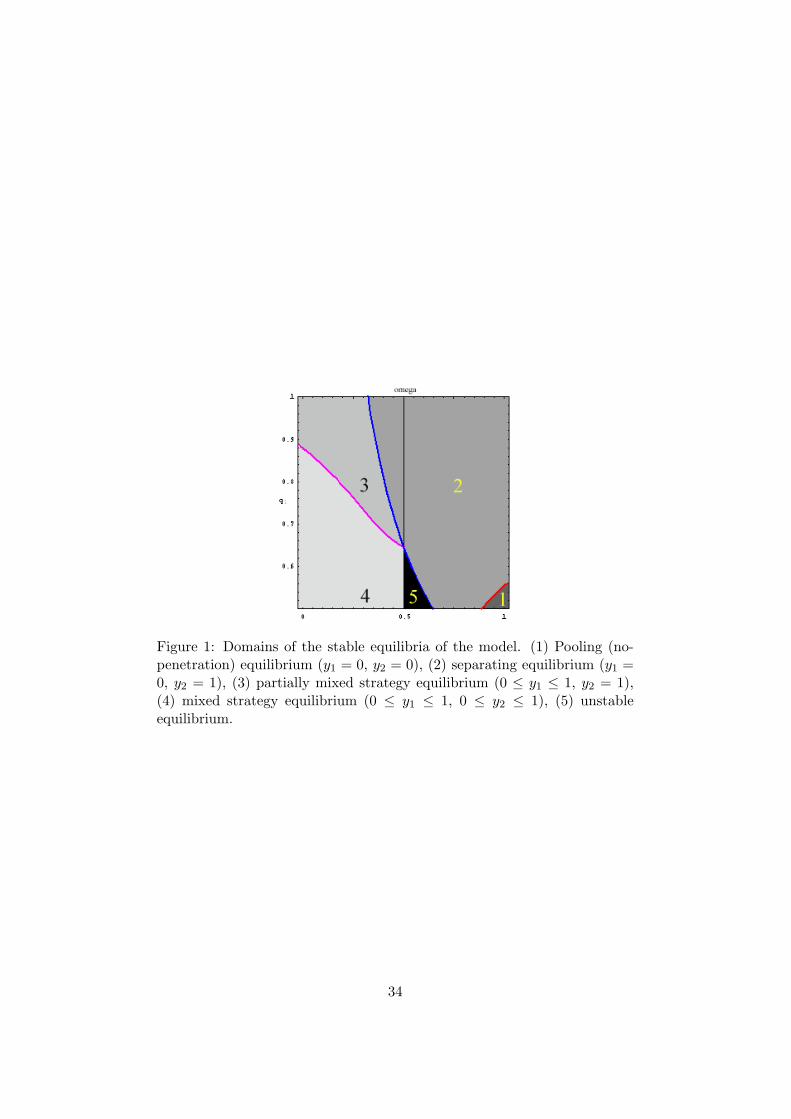
Figure 1: Domains of the stable equilibria of the model. (1) Pooling (no-penetration) equilibrium (y1 = 0, y2 = 0), (2) separating equilibrium (y1 =0, y2 = 1), (3) partially mixed strategy equilibrium (0 ≤ y1 ≤ 1, y2 = 1),(4) mixed strategy equilibrium (0 ≤ y1 ≤ 1, 0 ≤ y2 ≤ 1), (5) unstableequilibrium.
34
0 500 10000
0.2
0.4
0.6
0.8
1
Time
Mar
ket s
hare
ω = 1; q1 0.5 → 0.90
0 500 10000
0.2
0.4
0.6
0.8
1
Time
Mar
ket s
hare
ω = 0; q1 0.5 → 0.90
0 500 1000 1500 20000
0.2
0.4
0.6
0.8
1
Time
Mar
ket s
hare
ω 0 → 1; q1 = 0.9
0 500 1000 1500 20000
0.2
0.4
0.6
0.8
1
Time
Mar
ket s
hare
ω 0 → 1; q1 = 0.5
Diffusionpaths
q1 = 0.4
q1 = 0.1
q1 = 0.9
q1 = 0.5
ω = 1
ω = 0
ω = 1
ω = 0
Figure 2: Diffusion paths, examples of limit cases. Upper left quadrant:perfect conformity, a change in class structure (towards inequality) shiftsthe saturation level down and decreases absolute adoption time. Upperright quadrant: non-conformity, changes in class structure speed up diffu-sion (outer curves are for more equal values), saturation level is the samefor all set-ups. Inequality causes the overshooting to happen earlier andflattens it out for high inequality. Lower left quadrant: unequal class struc-ture, changes in conformity shift the equilibrium up and accelerate absolutediffusion time. Lower right quadrant: equality, changes in social norms ac-celerate absolute diffusion time, final market shares are in a close bond, somesolutions with ω ≈ 0.5 give rise to oscillations (fashion cycles).
35
0.5 0.6 0.7 0.8 0.90
0.2
0.4
0.6
0.8
1
q1: 0.5 → 0.95
Y*
Saturation level, ω = 1 (−), ω = 0 (−−)
0.5 0.6 0.7 0.8 0.90
20
40
60
t 10
Market penetration time t10
0 0.5 10
0.2
0.4
0.6
0.8
1
Y*
Saturation level, q
1 = 0.9 (−); q
1 = 0.5 (−−)
0 0.5 10
20
40
60
t 10
Market penetration time t10
ω: 0 → 1
E I
I E
N C
N C
Figure 3: Diffusion statistics: results from the analysis of the limit cases.N: non-conformity, C: conformity, E: equality; I: inequality.
36
50 100 150 200
10−2
Time
ln(y
/(1−
y))
ω = 1; q1 0.5 → 1
50 100 150 200
10−1
Time
ln(y
/(1−
y))
ω = 0; q1 0.5 → 1
50 100 150 200
10−2
10−1
Time
ln(y
/(1−
y))
ω 0 → 1; q1 = 0.9
50 100 150 200
10−2
10−1
Time
ln(y
/(1−
y))
ω 0 → 1; q1 = 0.5
q1 = 0.5
q1 = 0.9 q
1 = 0.5
q1 = 0.9
ω = 0
ω = 1
ω = 0
ω = 1
Figure 4: Fisher-Pry substitution rates: steeper slopes indicate faster adop-tion. The arrows indicate the direction of change of the parameters.
37
0.5 0.6 0.7 0.8 0.90.014
0.016
0.018
0.02
0.022
slop
e b
substitution speed
q1 = 0.5 (−), q
1 = 0.9 (−−)
0 0.2 0.4 0.6 0.8
0.005
0.01
0.015
0.02
slop
e b
substitution speed
0.5 0.6 0.7 0.8 0.94
4.5
5
5.5
6
q1
inte
rcep
t a
adoption delay
ω = 0 (−), ω = 1 (−−)
0 0.2 0.4 0.6 0.8
4.6
4.8
5
5.2
5.4
5.6
ω
inte
rcep
t a
adoption delay
Figure 5: Parameters of fitted Fisher-Pry substitution curves:ln( y
1−y ) = a + bt. The intercept a captures the adoption delay, whilethe parameter b captures the learning or substitution speed.
38