Embed Size (px)
Citation preview
University of WindsorScholarship at UWindsor
Electronic Theses and Dissertations
4-14-2017
Social Network Analysis using Cultural Algorithmsand its VariantsPooya Moradian ZadehUniversity of Windsor
Follow this and additional works at: https://scholar.uwindsor.ca/etd
This online database contains the full-text of PhD dissertations and Masters’ theses of University of Windsor students from 1954 forward. Thesedocuments are made available for personal study and research purposes only, in accordance with the Canadian Copyright Act and the CreativeCommons license—CC BY-NC-ND (Attribution, Non-Commercial, No Derivative Works). Under this license, works must always be attributed to thecopyright holder (original author), cannot be used for any commercial purposes, and may not be altered. Any other use would require the permission ofthe copyright holder. Students may inquire about withdrawing their dissertation and/or thesis from this database. For additional inquiries, pleasecontact the repository administrator via email ([email protected]) or by telephone at 519-253-3000ext. 3208.
Recommended CitationMoradian Zadeh, Pooya, "Social Network Analysis using Cultural Algorithms and its Variants" (2017). Electronic Theses andDissertations. 5948.https://scholar.uwindsor.ca/etd/5948
Social Network Analysis using Cultural
Algorithms and its Variants
by
Pooya Moradian Zadeh
A Dissertation
Submitted to the Faculty of Graduate Studies
through the School of Computer Science
in Partial Fulfillment of the Requirements for
the Degree of Doctor of Philosophy
at the University of Windsor
Windsor, Ontario, Canada
2017
c© Pooya Moradian Zadeh, 2017
Social Network Analysis using Cultural
Algorithms and its Variants
by
Pooya Moradian Zadeh
APPROVED BY
B. Ombuki-Berman, External Examiner
Brock University
A. Hussein
Department of Mathematics and Statistics
R. Frost
School of Computer Science
J. Lu
School of Computer Science
Z. Kobti, Advisor
School of Computer Science
3 Feb. 2017

iii
Declaration of Co-Authorship/Previous
Publication
1- Co-Authorship Declaration
I hereby declare that this dissertation incorporates material that is the result of re-
search conducted under the supervision of Dr. Ziad Kobti (my supervisor). This
dissertation also incorporates the outcome of a joint research undertaken in collab-
oration with Mr. Mukund Pandey under the supervision of Dr. Ziad Kobti. The
collaboration is covered in Chapters 3 of the thesis. In all cases, the key ideas,
primary contributions, experimental designs, data analysis and interpretation, were
performed by the author, and the contribution of co-authors was primarily through
the proofreading of the published manuscripts. In Chapter 3, Mr. Pandey also con-
tributed in collecting data and explaining the materials.
I am aware of the University of Windsor Senate Policy on Authorship and I certify
that I have properly acknowledged the contribution of other researchers to my thesis,
and have obtained written permission from each of the co-author(s) to include the
above material(s) in my thesis.
I certify that, with the above qualification, this thesis, and the research to which it
refers, is the product of my own work.
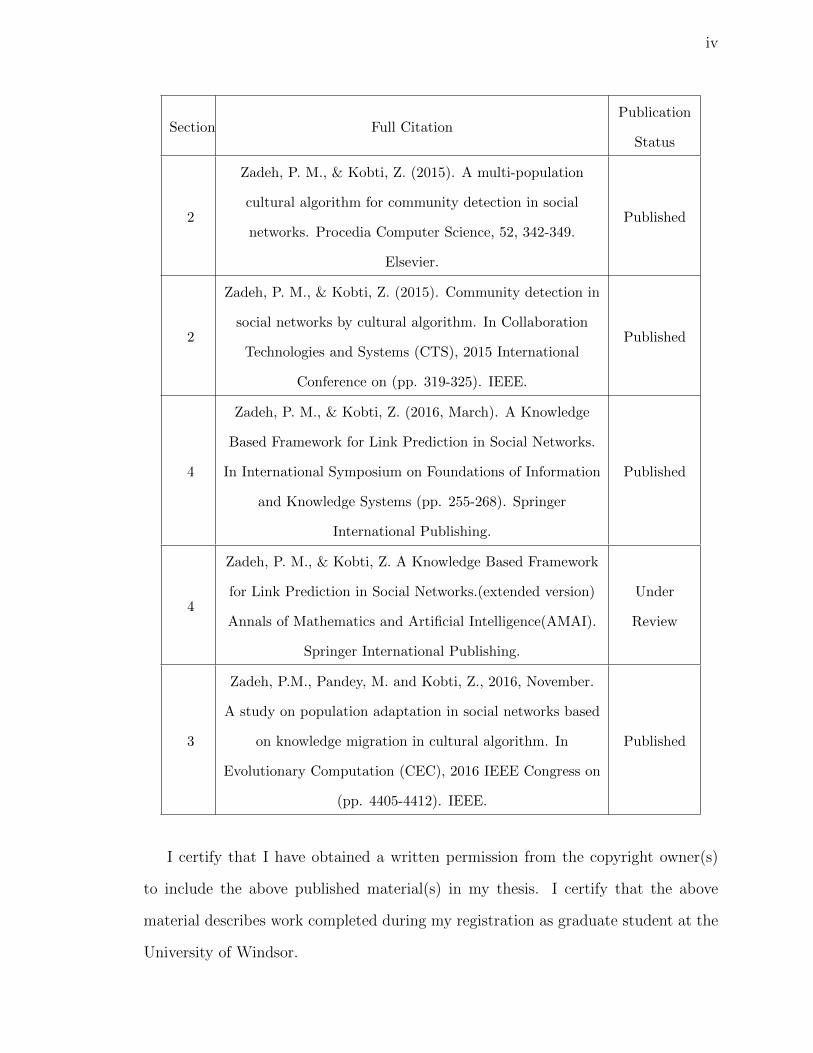
2- Declaration of Previous Publication
This thesis includes 5 original papers that have been previously published/submitted
for publication in peer reviewed journals and conferences, as follows:
iv
Section Full CitationPublication
Status
2
Zadeh, P. M., & Kobti, Z. (2015). A multi-population
cultural algorithm for community detection in social
networks. Procedia Computer Science, 52, 342-349.
Elsevier.
Published
2
Zadeh, P. M., & Kobti, Z. (2015). Community detection in
social networks by cultural algorithm. In Collaboration
Technologies and Systems (CTS), 2015 International
Conference on (pp. 319-325). IEEE.
Published
4
Zadeh, P. M., & Kobti, Z. (2016, March). A Knowledge
Based Framework for Link Prediction in Social Networks.
In International Symposium on Foundations of Information
and Knowledge Systems (pp. 255-268). Springer
International Publishing.
Published
4
Zadeh, P. M., & Kobti, Z. A Knowledge Based Framework
for Link Prediction in Social Networks.(extended version)
Annals of Mathematics and Artificial Intelligence(AMAI).
Springer International Publishing.
Under
Review
3
Zadeh, P.M., Pandey, M. and Kobti, Z., 2016, November.
A study on population adaptation in social networks based
on knowledge migration in cultural algorithm. In
Evolutionary Computation (CEC), 2016 IEEE Congress on
(pp. 4405-4412). IEEE.
Published
I certify that I have obtained a written permission from the copyright owner(s)
to include the above published material(s) in my thesis. I certify that the above
material describes work completed during my registration as graduate student at the
University of Windsor.

v
I declare that, to the best of my knowledge, my thesis does not infringe upon any-
ones copyright nor violate any proprietary rights and that any ideas, techniques,
quotations, or any other material from the work of other people included in my the-
sis, published or otherwise, are fully acknowledged in accordance with the standard
referencing practices. Furthermore, to the extent that I have included copyrighted
material that surpasses the bounds of fair dealing within the meaning of the Canada
Copyright Act, I certify that I have obtained a written permission from the copyright
owner(s) to include such material(s) in my thesis.
I declare that this is a true copy of my thesis, including any final revisions, as ap-
proved by my thesis committee and the Graduate Studies office, and that this thesis
has not been submitted for a higher degree to any other University or Institution.
vi
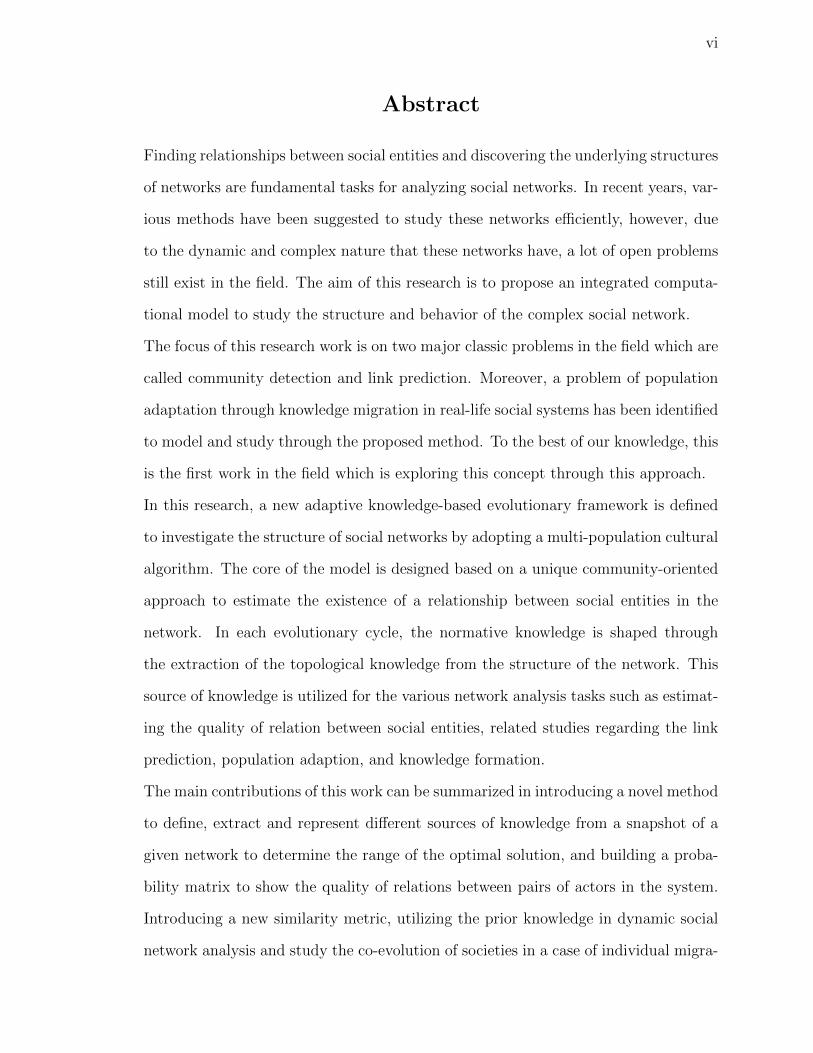
Abstract
Finding relationships between social entities and discovering the underlying structures
of networks are fundamental tasks for analyzing social networks. In recent years, var-
ious methods have been suggested to study these networks efficiently, however, due
to the dynamic and complex nature that these networks have, a lot of open problems
still exist in the field. The aim of this research is to propose an integrated computa-
tional model to study the structure and behavior of the complex social network.
The focus of this research work is on two major classic problems in the field which are
called community detection and link prediction. Moreover, a problem of population
adaptation through knowledge migration in real-life social systems has been identified
to model and study through the proposed method. To the best of our knowledge, this
is the first work in the field which is exploring this concept through this approach.
In this research, a new adaptive knowledge-based evolutionary framework is defined
to investigate the structure of social networks by adopting a multi-population cultural
algorithm. The core of the model is designed based on a unique community-oriented
approach to estimate the existence of a relationship between social entities in the
network. In each evolutionary cycle, the normative knowledge is shaped through
the extraction of the topological knowledge from the structure of the network. This
source of knowledge is utilized for the various network analysis tasks such as estimat-
ing the quality of relation between social entities, related studies regarding the link
prediction, population adaption, and knowledge formation.
The main contributions of this work can be summarized in introducing a novel method
to define, extract and represent different sources of knowledge from a snapshot of a
given network to determine the range of the optimal solution, and building a proba-
bility matrix to show the quality of relations between pairs of actors in the system.
Introducing a new similarity metric, utilizing the prior knowledge in dynamic social
network analysis and study the co-evolution of societies in a case of individual migra-

vii
tion are another major contributions of this work.
According to the obtained results, utilizing the proposed approach in community de-
tection problem can reduce the search space size by 80%. It also can improve the
accuracy of the search process in high dense networks by up to 30% compared with
the other well-known methods. Addressing the link prediction problem through the
proposed approach also can reach the comparable results with other methods and
predict the next state of the system with a notably high accuracy. In addition, the
obtained results from the study of population adaption through knowledge migration
indicate that population with prior knowledge about an environment can adapt them-
selves to the new environment faster than the ones who do not have this knowledge
if the level of changes between the two environments is less than 25%. Therefore,
utilizing this approach in dynamic social network analysis can reduce the search time
and space significantly (up to above 90%), if the snapshots of the system are taken
when the level of changes in the network structure is within 25%.
In summary, the experimental results indicate that this knowledge-based approach
is capable of exploring the evolution and structure of the network with the high
level of accuracy while it improves the performance by reducing the search space and
processing time.

viii
Dedication
This dissertation is dedicated to my parents, Mohammad and Manijeh, and to my
brother, Nima, for their endless love, support, and encouragement.

ix
Acknowledgments
First and foremost, I want to thank my parents for their love and support through-
out my life.
I would like to express my deepest appreciation to my supervisor, Dr. Ziad Kobti,
for his guidance, advice, and support, throughout this study. Without his guidance
and persistent help, this dissertation would not have been possible.
I would also like to thank my committee members, Dr. Richard Frost, Dr. Jianguo
Lu and Dr. Abdulkadir Hussein for their encouragement, insightful comments, and
advice.
x
Table of Contents
Declaration of Co-Authorship/Previous Publication iii
Abstract vi
Dedication viii
Acknowledgments ix
List of Tables xiii
List of Figures xiv
1 Introduction 1
1.1 Social Networks: Basic Concepts . . . . . . . . . . . . . . . . . . . . 2
1.1.1 Characteristics of Social Networks . . . . . . . . . . . . . . . . 4
1.2 Research Problems and Objectives . . . . . . . . . . . . . . . . . . . 5
1.3 Research Contributions . . . . . . . . . . . . . . . . . . . . . . . . . . 7
1.4 Dissertation Outline . . . . . . . . . . . . . . . . . . . . . . . . . . . 10
References . . . . . . . . . . . . . . . . . . . . . . . . . . . . . . . . . . . . 11
2 Community Detection in Social Networks 18
2.1 Introduction . . . . . . . . . . . . . . . . . . . . . . . . . . . . . . . . 19
2.2 Related Works . . . . . . . . . . . . . . . . . . . . . . . . . . . . . . . 21
2.3 Proposed Model for Community Detection . . . . . . . . . . . . . . . 23
xi
2.3.1 Individual Representation . . . . . . . . . . . . . . . . . . . . 23
2.3.2 Initialization . . . . . . . . . . . . . . . . . . . . . . . . . . . . 25
2.3.3 Fitness Function . . . . . . . . . . . . . . . . . . . . . . . . . 25
2.3.4 Belief Space . . . . . . . . . . . . . . . . . . . . . . . . . . . . 26
2.3.5 Crossover and Mutation . . . . . . . . . . . . . . . . . . . . . 29
2.3.6 Our proposed algorithm . . . . . . . . . . . . . . . . . . . . . 30
2.4 Evaluation . . . . . . . . . . . . . . . . . . . . . . . . . . . . . . . . . 31
2.5 Discussion and Conclusion . . . . . . . . . . . . . . . . . . . . . . . . 34
2.5.1 Demonstration of the Evolution Process . . . . . . . . . . . . 35
2.5.2 The Role of Knowledge in Search Space Reduction . . . . . . 42
2.5.3 The Structure of Belief Space . . . . . . . . . . . . . . . . . . 44
2.5.4 Run-Time Analysis . . . . . . . . . . . . . . . . . . . . . . . . 47
2.5.5 More Evaluations . . . . . . . . . . . . . . . . . . . . . . . . . 55
2.5.6 Conclusion . . . . . . . . . . . . . . . . . . . . . . . . . . . . . 61
References . . . . . . . . . . . . . . . . . . . . . . . . . . . . . . . . . . . . 63
3 Population Adaptation in Social Networks based on Knowledge
Migration 67
3.1 Introduction . . . . . . . . . . . . . . . . . . . . . . . . . . . . . . . . 68
3.2 Literature Review . . . . . . . . . . . . . . . . . . . . . . . . . . . . . 70
3.3 Problem Statement . . . . . . . . . . . . . . . . . . . . . . . . . . . 74
3.3.1 Community Detection in Social Networks . . . . . . . . . . . . 75
3.4 Population Adaptation Based on Knowledge Migration . . . . . . . . 79
3.4.1 Scenario 1: Population and knowledge migration . . . . . . . . 82
3.4.2 Scenario 2: Knowledge migration . . . . . . . . . . . . . . . . 83
3.4.3 Scenario 3: Population migration . . . . . . . . . . . . . . . . 84
3.4.4 Scenario 4: Migration of the best individuals . . . . . . . . . . 85
3.5 Evaluation . . . . . . . . . . . . . . . . . . . . . . . . . . . . . . . . . 86
xii
3.5.1 Scenario 1 . . . . . . . . . . . . . . . . . . . . . . . . . . . . . 87
3.5.2 Scenario 2 . . . . . . . . . . . . . . . . . . . . . . . . . . . . . 88
3.5.3 Scenario 3 . . . . . . . . . . . . . . . . . . . . . . . . . . . . . 90
3.5.4 Scenario 4 . . . . . . . . . . . . . . . . . . . . . . . . . . . . . 91
3.6 Conclusion and Future Work . . . . . . . . . . . . . . . . . . . . . . . 92
References . . . . . . . . . . . . . . . . . . . . . . . . . . . . . . . . . . . . 94
4 Link Prediction in Social Networks 97
4.1 Introduction . . . . . . . . . . . . . . . . . . . . . . . . . . . . . . . . 98
4.2 Problem Definition and Related Works . . . . . . . . . . . . . . . . . 102
4.3 Proposed Evolutionary Model . . . . . . . . . . . . . . . . . . . . . . 110
4.3.1 Making the Weighted Graph . . . . . . . . . . . . . . . . . . . 111
4.3.2 Computing the Probabilities . . . . . . . . . . . . . . . . . . . 115
4.3.3 Ranking the Probabilities . . . . . . . . . . . . . . . . . . . . 117
4.4 Evaluation . . . . . . . . . . . . . . . . . . . . . . . . . . . . . . . . . 118
4.5 Conclusion and Future Work . . . . . . . . . . . . . . . . . . . . . . . 128
References . . . . . . . . . . . . . . . . . . . . . . . . . . . . . . . . . . . . 130
5 Conclusions 136
Vita Auctoris 139

xiii
List of Tables
Table 2.1 NMI values of the algorithms on real datasets . . . . . . . . . . 34
Table 4.1 Description of the generated synthetic networks based on Girvan
benchmark . . . . . . . . . . . . . . . . . . . . . . . . . . . . . . 118
Table 4.2 Description of the synthetic networks generated based on LFR
benchmark . . . . . . . . . . . . . . . . . . . . . . . . . . . . . . 120
Table 4.3 Orkut Dataset Specification . . . . . . . . . . . . . . . . . . . . 126
xiv
List of Figures
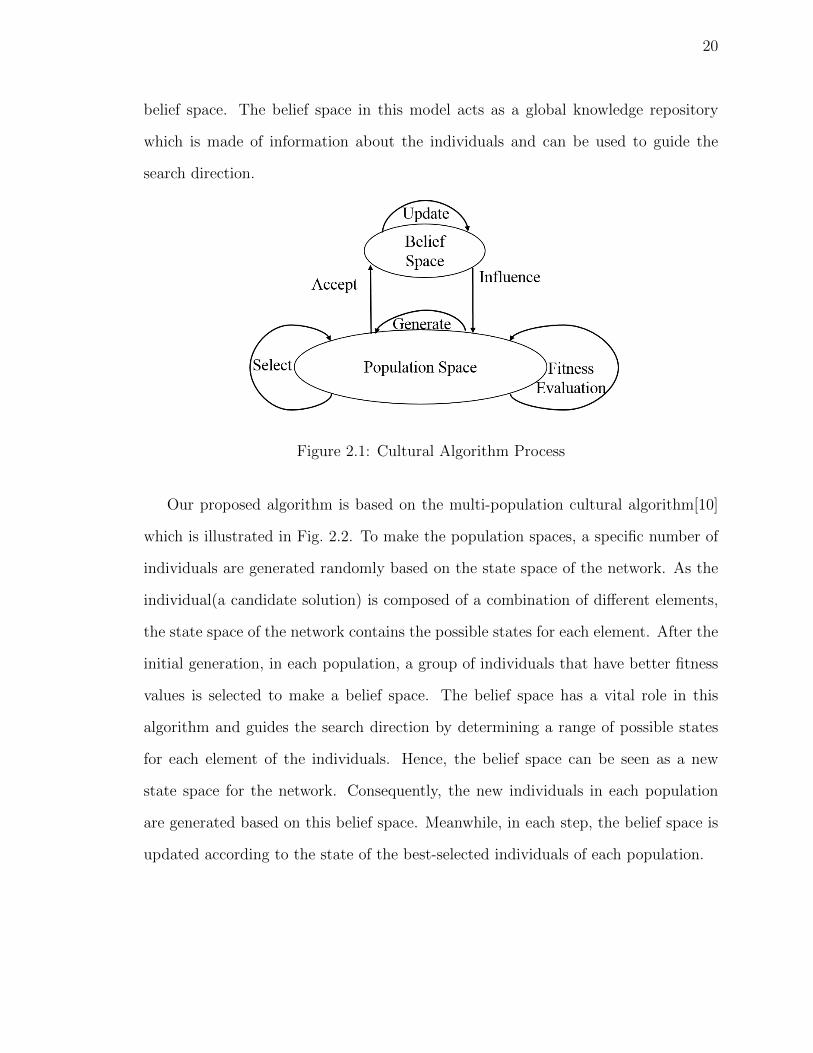
Figure 2.1 Cultural Algorithm Process . . . . . . . . . . . . . . . . . . . . 20
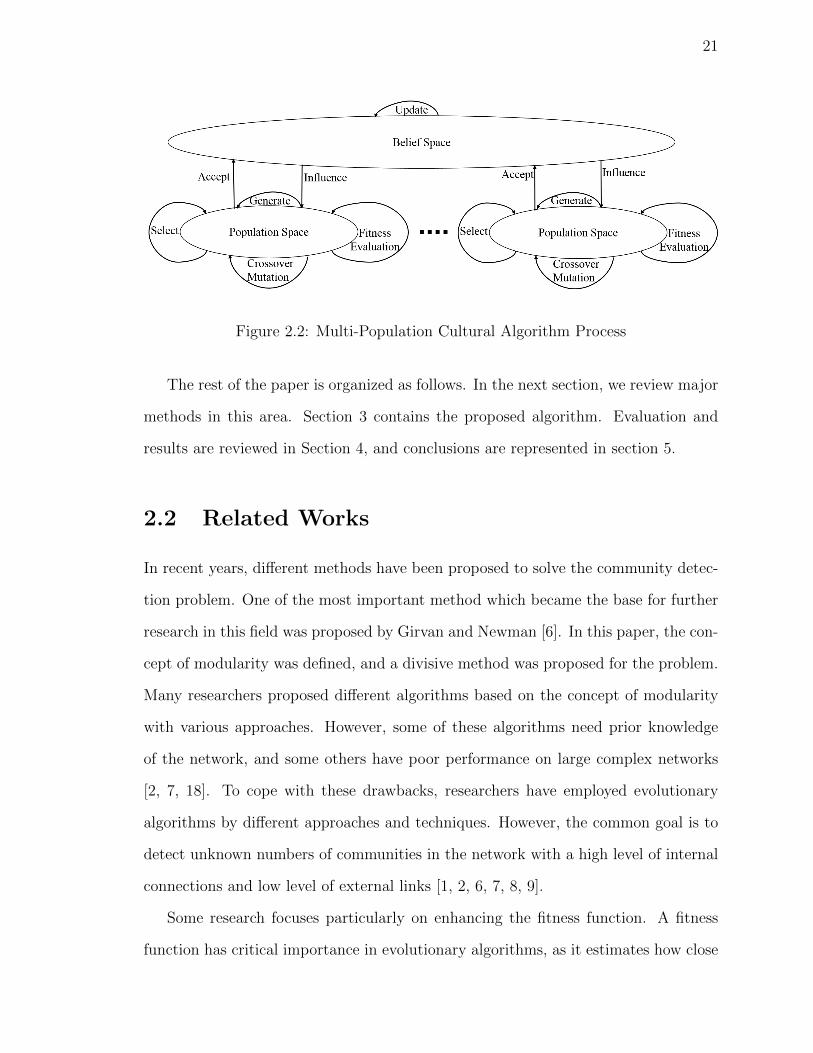
Figure 2.2 Multi-Population Cultural Algorithm Process . . . . . . . . . . 21
Figure 2.3 A network graph . . . . . . . . . . . . . . . . . . . . . . . . . . 24
Figure 2.4 The network state space . . . . . . . . . . . . . . . . . . . . . 25
Figure 2.5 Two random representations of the network . . . . . . . . . . . 25
Figure 2.6 Sample Belief space- N=8 nodes SP=4 individuals . . . . . . . 29
Figure 2.7 Average NMI rate for Zout ranges from 1 to 6 . . . . . . . . . . 33
Figure 2.8 Evolution of individuals in a network with Zout = 5 . . . . . . . 35
Figure 2.9 Identified communities at iteration 1 . . . . . . . . . . . . . . . 36
Figure 2.10Identified communities at iteration 10 . . . . . . . . . . . . . . 37
Figure 2.11Identified communities at iteration 18 . . . . . . . . . . . . . . 37
Figure 2.12Identified communities at iteration 20 . . . . . . . . . . . . . . 38
Figure 2.13Identified communities at iteration 23 . . . . . . . . . . . . . . 38
Figure 2.14Identified communities at iteration 24 . . . . . . . . . . . . . . 39
Figure 2.15Identified communities at iteration 25 . . . . . . . . . . . . . . 39
Figure 2.16Evolution of individuals on a synthetic network with Zout = 5 . 40
Figure 2.17Evolution of individuals-MPCA- Zout = 5 - r=1.7 . . . . . . . . 41
Figure 2.18Evolution of individuals-GA- Zout = 5 - r=1.7 . . . . . . . . . . 42
Figure 2.19A snapshot of the network state space in a graph with Zout = 5 43
Figure 2.20A snapshot of the belief space after the 16th iteration (the first
32 nodes) . . . . . . . . . . . . . . . . . . . . . . . . . . . . . . 44
xv
Figure 2.21A sample belief space with the fixed-size structure . . . . . . . 45
Figure 2.22The number of generations to obtain the optimal solution . . . 47
Figure 2.23Runtime analysis on variable population size and iterations . . 51
Figure 2.24Runtime analysis- Population size = 50 . . . . . . . . . . . . . 52
Figure 2.25Runtime analysis- Population size = 100 . . . . . . . . . . . . . 53
Figure 2.26Runtime analysis- Population size = 200 . . . . . . . . . . . . . 53
Figure 2.27Runtime analysis- Population size = 300 . . . . . . . . . . . . . 54
Figure 2.28Runtime analysis- Population size = 400 . . . . . . . . . . . . . 54
Figure 2.29Runtime- Network size from 128 to 10000 nodes . . . . . . . . . 55
Figure 2.30PDF of Degree- N=1000, µ = 6 . . . . . . . . . . . . . . . . . . 56
Figure 2.31MPCA vs. GA, N=128 to 1000, µ = 0.1 to 0.6 . . . . . . . . . 57
Figure 2.32MPCA- N=128 to 10000 . . . . . . . . . . . . . . . . . . . . . . 58
Figure 2.33Social Graph from twitter data . . . . . . . . . . . . . . . . . . 59
Figure 2.34Identified Communities in the social graph . . . . . . . . . . . . 60
Figure 3.1 Classic schema of a Cultural Algorithm . . . . . . . . . . . . . 71
Figure 3.2 Architecture of an MPCA . . . . . . . . . . . . . . . . . . . . . 73
Figure 3.3 Knowledge migration on an MPCA without global belief space 74
Figure 3.4 Population adaptation process by knowledge migration . . . . . 75
Figure 3.5 Components of the proposed cultural algorithm in [17] . . . . . 77
Figure 3.6 A sample network and two random individuals . . . . . . . . . 77
Figure 3.7 Normative knowledge extracted from the three accepted individuals 79
Figure 3.8 Training process . . . . . . . . . . . . . . . . . . . . . . . . . . 81
Figure 3.9 Migrating trained population and its knowledge to the new network 83
Figure 3.10Migrating knowledge from trained population to another network 84
Figure 3.11Migrating the trained population to new network . . . . . . . . 85
Figure 3.12Migrating the best-trained individuals to new network . . . . . 86
Figure 3.13The results obtained from the first scenario . . . . . . . . . . . 88
xvi
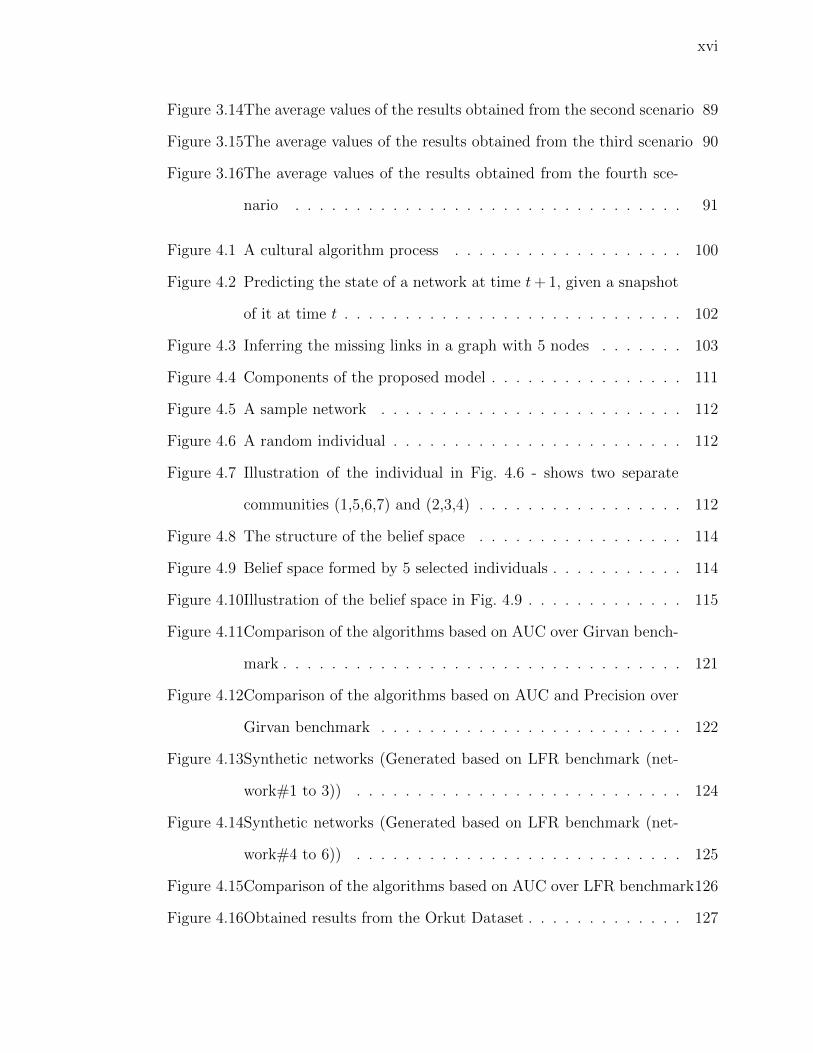
Figure 3.14The average values of the results obtained from the second scenario 89
Figure 3.15The average values of the results obtained from the third scenario 90
Figure 3.16The average values of the results obtained from the fourth sce-
nario . . . . . . . . . . . . . . . . . . . . . . . . . . . . . . . . 91
Figure 4.1 A cultural algorithm process . . . . . . . . . . . . . . . . . . . 100
Figure 4.2 Predicting the state of a network at time t+ 1, given a snapshot
of it at time t . . . . . . . . . . . . . . . . . . . . . . . . . . . . 102
Figure 4.3 Inferring the missing links in a graph with 5 nodes . . . . . . . 103
Figure 4.4 Components of the proposed model . . . . . . . . . . . . . . . . 111
Figure 4.5 A sample network . . . . . . . . . . . . . . . . . . . . . . . . . 112
Figure 4.6 A random individual . . . . . . . . . . . . . . . . . . . . . . . . 112
Figure 4.7 Illustration of the individual in Fig. 4.6 - shows two separate
communities (1,5,6,7) and (2,3,4) . . . . . . . . . . . . . . . . . 112
Figure 4.8 The structure of the belief space . . . . . . . . . . . . . . . . . 114
Figure 4.9 Belief space formed by 5 selected individuals . . . . . . . . . . . 114
Figure 4.10Illustration of the belief space in Fig. 4.9 . . . . . . . . . . . . . 115
Figure 4.11Comparison of the algorithms based on AUC over Girvan bench-
mark . . . . . . . . . . . . . . . . . . . . . . . . . . . . . . . . . 121
Figure 4.12Comparison of the algorithms based on AUC and Precision over
Girvan benchmark . . . . . . . . . . . . . . . . . . . . . . . . . 122
Figure 4.13Synthetic networks (Generated based on LFR benchmark (net-
work#1 to 3)) . . . . . . . . . . . . . . . . . . . . . . . . . . . 124
Figure 4.14Synthetic networks (Generated based on LFR benchmark (net-
work#4 to 6)) . . . . . . . . . . . . . . . . . . . . . . . . . . . 125
Figure 4.15Comparison of the algorithms based on AUC over LFR benchmark126
Figure 4.16Obtained results from the Orkut Dataset . . . . . . . . . . . . . 127

xvii
Figure 4.17Obtained results from the Orkut Dataset (range of training set
from 70% to 90%) . . . . . . . . . . . . . . . . . . . . . . . . . 128

Chapter 1
Introduction
In recent years, the role of social networks in the evolution of societies has been at
the center of attention which is mainly because of the extensive growth of Internet
usage and digital connectivity. In general, the social network consists of social actors
who are linked together through some kind of relations. Having complex interdepen-
dent structures with enormous influences on other systems makes them an attractive
and critical research topic for a broad range of scientific fields including sociology,
computer, physics, business, medical, and management sciences. Indeed, because of
the mutual influence of the network and people, exploring the behavior and struc-
ture of these networks have been reviewed by a vast variety of business-oriented,
socio-economic, and political approaches. [41, 14, 42, 21, 45]
Consequently, social network analysis (SNA) as an interdisciplinary field has many
applications ranging from the study of information propagation and its cascades ef-
fects [5, 11, 17, 19, 26] to spread of disease and viruses [13, 10, 6, 37, 18] and from
events and disasters detection [47, 57, 40, 38, 25] to prediction of future activities
and interactions [48, 23, 4]. Enhancing the marketing and impact maximization tech-
niques [44, 20, 27, 22, 35, 32, 24, 36, 51, 55], identification of high-risk groups and
suspicious activities [12, 15, 16, 9, 52, 39, 49], opinion mining and sentiment analysis
2
[28, 8] are other emerging applications of these studies.
Even though various methods have been already proposed to study these networks
efficiently, due to the dynamic and complex nature of these networks, a lot of open
challenges still exist. In this research work, a novel knowledge-based evolutionary
approach is introduced for the investigation of the structure and evolution of complex
social networks. Three main research problems in the field have been identified and
addressed through this approach. An introduction to this research study is presented
in this chapter with the following structure. Basic concepts and characteristics of the
social networks are reviewed in the next section. The research problems are defined in
section 1.2. The contributions are listed in section 1.3 and the dissertation structure
are discussed in section 1.4.
1.1 Social Networks: Basic Concepts
As mentioned before, social networks are social structures made up of a set of actors
which are connected to each other through some kind of relations. The common
method to represent these networks is mapping them to a graph structure. Therefore,
the set of actors forms the set of nodes, and the relations are mapped to a set of links.
Consequently, G(V,E) represents a social network graph where V = {v1, . . . , vn} is
a set of nodes and E is a set of edges that connect the vertices, e = (vi, vj) ∈
E where vi, vj ∈ V .
Hence, the graph with n nodes can be described by its adjacency matrix denoted
by A which is an n by n matrix where Aij is 1 if there is a link between vi and vj
and it is 0 if the link does not exist. Furthermore, in a case that the direction of
relations is necessary for the analysis a directed graph is used to model the network.
The weighted graph also can be utilized in a case that the quality of relationships
is not uniform. In other words, edge-weight measures the strength of the connection
3
between a pair of nodes.
Weights can be assigned to the edges by using various techniques but in principle
three main criteria are considered for this issue:
• Similarity between the nodes,
• Distance between the nodes,
• The frequency of relations between two nodes.
In the first case, the level of similarity between a pair of nodes can be considered
to calculate the weight of links between them. Different metrics such as the number
of shared features, common neighbor nodes or similar attributes can be employed
for this process. The second case is focusing on the length of the path between two
nodes. Usually, the shorter length leads to have a higher edge-weight. The last one
is counting the number of paths between a pair of nodes. Having more paths means
stronger connections between the nodes. Combinational methods also can be utilized
to make a weighted graph.
On the other hand, in recent years, an emerging concept of multi-layer social
network analysis is receiving close review. The main assumption is that the actors
are linked to each other through different kind of relations simultaneously and can
be members of multiple networks at the same time. In other words, due to the
social nature of humans, each actor accepts different social roles (e.g. friend, teacher,
manager, mother, child, girl) in the society. Each role has its own particular type of
relationship and social etiquette. The fact is, the actor must take some of these roles
concurrently which requires multi-membership in societies. The aim of the multi-layer
approach is to model these relationships in a realistic manner.
In online social networks also the concept is very critical because users can have
profiles on multiple social network websites and perform various activities in more
4
than one network at once which highlights the need for multi-layer social network
analysis.
In this approach, each layer corresponds to a particular network. Thus, each
of them has its own members and relations. Due to the multi-membership effect,
these layers are connected to each other through their common members. As this
is an emerging field, a standard method for representation has not been defined yet.
Nevertheless, if m different layers exist in the system, Gi(V,E) represents a social
graph of the layer i where 1 ≤ i ≤ m. The graph can be weighted or unweighted, and
directed or undirected.
Consequently, a multi-layer structure system can be represented by a multi-graph
denoted by M as M = {G1, G2, . . . , Gm}. Hence, the set of nodes in M denoted by
V (M) is defined as⋃m
i=1 V (Gi) where V (Gi) represents the set of nodes in the layer
i. Meanwhile, V (Gi) ∩ V (Gj) 6= ø, 1 ≤ i, j ≤ m, i 6= j which means that each layer
has two sets of members, the independent and the shared ones. The shared members
act as a bridge between the societies and have a substantial role in the co-evolution
of the layers. As a result, many studies focus on their effects and characteristics in
the network.
1.1.1 Characteristics of Social Networks
Social Networks as a subset of complex networks have the community structure which
is indicated by a high level of clustering coefficient value. Clustering coefficient index
in a graph measures the tendency of nodes to cluster together. It is defined as the
fraction of node’s neighbors that are neighbors of each other. Meanwhile, social actors
are willing to join the communities through their circle of friends and link to similar
others which is referred to the homophily effect in social science. [31, 46, 34, 33, 30]
Moreover, social networks demonstrate the small-world phenomenon which means
that social actors can be linked together through short chains of intermediate friends.
5
In other words, any two random nodes in the network can be linked by a short path
in the graph. In addition, the degree distribution in these networks follow the power-
law distribution. In fact, there exist relatively few nodes in the network with a high
degree of connectivity and many nodes with low degree. [3, 1]
1.2 Research Problems and Objectives
This research focuses on the evolution of social networks with emphasis on the role
of underlying knowledge in the evolution process. The ultimate goal of this research
study is to employ graph theories, network science, and optimization methods to
make a computational intelligence framework for describing the functionality of the
complex dynamic social systems with the capability of exploring behaviors of these
networks.
Utilizing different sources of knowledge extracted from the structure of the network
in the analysis process is the main concept that distinguishes this work from the other
existing approaches in the field of social network analysis.
Although the scope of social network analysis is very vast, finding relationships
between social actors and discovering the underlying structures of the network are its
fundamental tasks [7, 43, 21]. Therefore, community detection and link prediction
problems which are two classic critical issues in the field are extensively studied in
this work. In addition, a real-life problem is introduced and explored which is called
population adaption through knowledge migration. To the best of our knowledge,
this is the first work in the field that addresses this problem with this approach.
Consequently, the following research problems are addressed in this work through
the proposed approach.
Community Detection
Social networks are highly interactive and dynamic systems which are consisted
6
of interconnected communities. Having knowledge about these communities can shed
light on understanding the nature of these social systems which is essential for decision
and policy making processes.
Briefly, community detection in social network is an NP-hard problem which deals
with finding groups of actors who are more similar or close to each other than other
ones in the other groups [50]. In other words, the goal is to find groups of people
who have more relations and interactions with each other in the network. Each of
this group is called a community. The issue can be seen as an optimization problem
where the goal is to maximize the number of relations inside the group and minimize
the links to the outside.
The central concept that distinguishes this problem from the classic graph clus-
tering problems is that the number of communities is unknown in advanced while it
must be known in the classic clustering problem.
Link Prediction
The problem of link prediction in social networks refers to exploring the dynamic
nature of the network and its evolution. The link prediction problem can be defined
as predicting the structure of a network in the near future by having a snapshot of it
at the current time. In other words, given a state of a network at time t, the target
is to estimate the likelihood of a connection between pairs of unconnected actors at
time t+ 1.
The problem has a broad range of application in recommendation systems, e-
commerce, bioinformatic, politics, and security related issues. It can also be used to
monitor the evolution of the system and identify the missing links between pairs of
identities in the network [29, 2]. Identification of the missing links can be interpreted
as finding the hidden connections between pairs of actors which are present in reality
but were not observed.
7
Population Adaptation
Investigating the role of knowledge in the process of individual adaptation is the
next goal of this research topic. The key question here is to find out how a population
can perform in different environments when it has a prior knowledge about the similar
environment? In other words, the question is how a population with prior knowledge
about a problem can solve a similar problem and adapt itself to the new situation.
Moreover, to what level of similarity between two situations, migrated population
can be adapted efficiently? We define this concept as the adaptation process. The
result of this research can lead to a remarkable reduction in the search time and space
throughout the multiple steps of dynamic social network analysis.
1.3 Research Contributions
To address the research problems, a novel adaptive knowledge-based evolutionary
computational model is proposed to study the structure and evolution of social net-
works by adopting a multi-population cultural algorithm (MPCA). This framework
is capable of modeling the above three problems and their associated effects properly.
In order to estimate the existence of a relationship between social entities in the net-
work, a unique community oriented approach is defined which forms the core of the
framework.
Briefly, the proposed model is designed based on the topological knowledge which
is extracted from the structure of the network in each evolution cycle to form the nor-
mative knowledge. The knowledge is used to direct and enhance the search process
to identify the proper sub-populations (Communities). The extracted knowledge can
be employed in various network analysis tasks such as estimating the quality of rela-
tion between social entities, related studies regarding the link prediction, population
adaptation, and knowledge formation.
8
To address the problem of community detection, we have proposed a novel knowledge-
based evolutionary algorithm using a variant of MPCA [53]. Our first contribution
is to propose a novel method to define, extract, and represent normative and domain
knowledge sources from a snapshot of the network to determine the range of the op-
timal solution. The obtained knowledge is stored in a knowledge repository called
belief space to guide the search direction and reduce the size of the required search
space for finding the optimal/near optimal solution. As our second contribution, a
unique data structure has been defined which is based on a probability matrix to form
the belief space.
The results of comparison between our approach and other well-known related
algorithms clearly show that our algorithm is capable of finding near optimal solu-
tion identifying the correct communities faster and more accurately than the others.
Meanwhile, the evaluation results show that the search space can be reduced dramat-
ically by 80% as a result of using our approach.
To deal with the link prediction problem in social network, we have proposed a
community-oriented knowledge-based computational model which can estimate the
next state of a given network with a notably high accuracy in [54]. By identifying
the existing communities of the current state of a given network and make use of the
belief space in [53], our proposed algorithm calculates the probability of a relationship
between each unconnected pair of individuals and estimates the chance of being con-
nected at the next time slot. A unique mapping function and a novel computational
model based on the weighted graph have been introduced in this research to estimate
the interdependency of each pair of individuals in the network.
We have tested and compared the model on synthetic networks and a big real
standard data set from the Stanford large network dataset collection [50]. AUC
(Area under the curve) and Precision measurements have been used to evaluate the
performance of the model against several well-known other methods. The results show
9
that our method is able to predict the next state of the network with approximately
80% accuracy.
To cope the problem of population adaptation, the behavior and status of a dy-
namic social network have analyzed in a case where a population from one network
migrates to another similar network and transfers its knowledge to it [56]. In effect,
we have attempted to find how a migrated population will adapt itself to a new envi-
ronment with similar characteristics based on the knowledge that it has learned from
the previous network and what the role of this prior knowledge is in its evolution. As
a case study we chose the problem of community detection in social networks.
To make a research framework we have adopted our previously proposed MPCA
based community detection algorithm [53] for four different knowledge migration sce-
narios. For each scenario, two cases were examined: one case with individuals with
prior knowledge about the similar networks, and another case with individuals with-
out prior knowledge. The results show that when the changes in the structure of
networks are less than 25%, trained population can adapt itself to the new network
very fast; but when the difference is higher, in the best case they perform like a
random population without any training.
As mentioned before, the significance of this contribution in dynamic social net-
works is that it allows us to use the extracted knowledge from a previous step, stored
in the belief space, to detect new communities by eliminating the need for a new
search if the similarity of two consecutive network snapshots is within 85%. This
method can be generalized to accelerate the search performance in complex dynamic
social networks.

10
1.4 Dissertation Outline
The rest of this dissertation is organized as follows.
In chapter 2, the problem of community detection in social networks as a funda-
mental task in social network analysis is extensively reviewed. Our proposed approach
to deal with this issue is also described in the same chapter which forms the core of
our research work.
In chapter 3, to extend the functionality of the community detection algorithm
into a dynamic environment the problem of population adaption through knowledge
migration are discussed.
In chapter 4, the problem of link prediction in social networks is reviewed. Our
unique community-based approach which utilizes the extracted belief space to tackle
the issue of link prediction is discussed in this chapter.
Finally, the last chapter will be the conclusion of this research.
11
References
[1] Lada A Adamic and Bernardo A Huberman. Power-law distribution of the world
wide web. Science, 287(5461):2115–2115, 2000.
[2] Mohammad Al Hasan and Mohammed J Zaki. A survey of link prediction in
social networks. In Social network data analytics, pages 243–275. Springer, 2011.
[3] Luıs A Nunes Amaral, Antonio Scala, Marc Barthelemy, and H Eugene Stanley.
Classes of small-world networks. Proceedings of the national academy of sciences,
97(21):11149–11152, 2000.
[4] Sitaram Asur and Bernardo A Huberman. Predicting the future with social
media. In Web Intelligence and Intelligent Agent Technology (WI-IAT), 2010
IEEE/WIC/ACM International Conference on, volume 1, pages 492–499. IEEE,
2010.
[5] Eytan Bakshy, Itamar Rosenn, Cameron Marlow, and Lada Adamic. The role of
social networks in information diffusion. In Proceedings of the 21st international
conference on World Wide Web, pages 519–528. ACM, 2012.
[6] Christopher L Barrett, Keith R Bisset, Stephen G Eubank, Xizhou Feng, and
Madhav V Marathe. Episimdemics: an efficient algorithm for simulating the
spread of infectious disease over large realistic social networks. In Proceedings of
the 2008 ACM/IEEE conference on Supercomputing, page 37. IEEE Press, 2008.
12
[7] Punam Bedi and Chhavi Sharma. Community detection in social networks. Wiley
Interdisciplinary Reviews: Data Mining and Knowledge Discovery, 6(3):115–135,
2016.
[8] Freimut Bodendorf and Carolin Kaiser. Detecting opinion leaders and trends in
online social networks. In Proceedings of the 2nd ACM workshop on Social web
search and mining, pages 65–68. ACM, 2009.
[9] Pete Burnap, Matthew L Williams, Luke Sloan, Omer Rana, William Housley,
Adam Edwards, Vincent Knight, Rob Procter, and Alex Voss. Tweeting the
terror: modelling the social media reaction to the woolwich terrorist attack.
Social Network Analysis and Mining, 4(1):1–14, 2014.
[10] Damon Centola. The spread of behavior in an online social network experiment.
science, 329(5996):1194–1197, 2010.
[11] Meeyoung Cha, Alan Mislove, and Krishna P Gummadi. A measurement-driven
analysis of information propagation in the flickr social network. In Proceedings
of the 18th international conference on World wide web, pages 721–730. ACM,
2009.
[12] Rafa l Drezewski, Jan Sepielak, and Wojciech Filipkowski. The application of
social network analysis algorithms in a system supporting money laundering
detection. Information Sciences, 295:18–32, 2015.
[13] Stephen Eubank, Hasan Guclu, VS Anil Kumar, Madhav V Marathe, Aravind
Srinivasan, Zoltan Toroczkai, and Nan Wang. Modelling disease outbreaks in
realistic urban social networks. Nature, 429(6988):180–184, 2004.
[14] Weiguo Fan and Michael D Gordon. The power of social media analytics. Com-
munications of the ACM, 57(6):74–81, 2014.
13
[15] Philip Vos Fellman and Roxana Wright. Modeling terrorist networks, complex
systems at the mid-range. arXiv preprint arXiv:1405.6989, 2014.
[16] Emilio Ferrara, Pasquale De Meo, Salvatore Catanese, and Giacomo Fiumara.
Detecting criminal organizations in mobile phone networks. Expert Systems with
Applications, 41(13):5733–5750, 2014.
[17] Amit Goyal, Francesco Bonchi, and Laks VS Lakshmanan. Learning influence
probabilities in social networks. In Proceedings of the third ACM international
conference on Web search and data mining, pages 241–250. ACM, 2010.
[18] Randi H Griffin and Charles L Nunn. Community structure and the spread of
infectious disease in primate social networks. Evolutionary Ecology, 26(4):779–
800, 2012.
[19] Daniel Gruhl, Ramanathan Guha, David Liben-Nowell, and Andrew Tomkins.
Information diffusion through blogspace. In Proceedings of the 13th international
conference on World Wide Web, pages 491–501. ACM, 2004.
[20] Stephanie Hays, Stephen John Page, and Dimitrios Buhalis. Social media as a
destination marketing tool: its use by national tourism organisations. Current
issues in Tourism, 16(3):211–239, 2013.
[21] Mohsen Jamali and Hassan Abolhassani. Different aspects of social network anal-
ysis. In 2006 IEEE/WIC/ACM International Conference on Web Intelligence
(WI 2006 Main Conference Proceedings)(WI’06), pages 66–72. IEEE, 2006.
[22] Kyomin Jung, Wooram Heo, and Wei Chen. Irie: Scalable and robust influence
maximization in social networks. In 2012 IEEE 12th International Conference
on Data Mining, pages 918–923. IEEE, 2012.
14
[23] David Jurgens, Tyler Finethy, James McCorriston, Yi Tian Xu, and Derek
Ruths. Geolocation prediction in twitter using social networks: A critical analy-
sis and review of current practice. In Proceedings of the 9th International AAAI
Conference on Weblogs and Social Media (ICWSM), 2015.
[24] David Kempe, Jon Kleinberg, and Eva Tardos. Maximizing the spread of influ-
ence through a social network. Theory of Computing, 11(4):105–147, 2015.
[25] Hady W Lauw, Ee-Peng Lim, Hweehwa Pang, and Teck-Tim Tan. Social network
discovery by mining spatio-temporal events. Computational & Mathematical
Organization Theory, 11(2):97–118, 2005.
[26] Kristina Lerman and Rumi Ghosh. Information contagion: An empirical study
of the spread of news on digg and twitter social networks. ICWSM, 10:90–97,
2010.
[27] Yanhua Li, Wei Chen, Yajun Wang, and Zhi-Li Zhang. Influence diffusion dy-
namics and influence maximization in social networks with friend and foe re-
lationships. In Proceedings of the sixth ACM international conference on Web
search and data mining, pages 657–666. ACM, 2013.
[28] Bing Liu. Sentiment analysis and opinion mining. Synthesis lectures on human
language technologies, 5(1):1–167, 2012.
[29] Linyuan Lu and Tao Zhou. Link prediction in complex networks: A survey.
Physica A: Statistical Mechanics and its Applications, 390(6):1150–1170, 2011.
[30] Miller McPherson, Lynn Smith-Lovin, and James M Cook. Birds of a feather:
Homophily in social networks. Annual review of sociology, pages 415–444, 2001.
[31] Alan Mislove, Massimiliano Marcon, Krishna P Gummadi, Peter Druschel, and
Bobby Bhattacharjee. Measurement and analysis of online social networks. In
15
Proceedings of the 7th ACM SIGCOMM conference on Internet measurement,
pages 29–42. ACM, 2007.
[32] Flaviano Morone and Hernan A Makse. Influence maximization in complex
networks through optimal percolation. Nature, 2015.
[33] Mark EJ Newman and Juyong Park. Why social networks are different from
other types of networks. Physical Review E, 68(3):036122, 2003.
[34] Mark EJ Newman, Duncan J Watts, and Steven H Strogatz. Random graph
models of social networks. Proceedings of the National Academy of Sciences,
99(suppl 1):2566–2572, 2002.
[35] Florian Probst, Dipl-Kffr Laura Grosswiele, and Dipl-Kffr Regina Pfleger. Who
will lead and who will follow: Identifying influential users in online social net-
works. Business & Information Systems Engineering, 5(3):179–193, 2013.
[36] Matthew Richardson and Pedro Domingos. Mining knowledge-sharing sites for
viral marketing. In Proceedings of the eighth ACM SIGKDD international con-
ference on Knowledge discovery and data mining, pages 61–70. ACM, 2002.
[37] Adam Sadilek, Henry A Kautz, and Vincent Silenzio. Modeling spread of disease
from social interactions. In ICWSM, 2012.
[38] Takeshi Sakaki, Makoto Okazaki, and Yutaka Matsuo. Earthquake shakes twitter
users: real-time event detection by social sensors. In Proceedings of the 19th
international conference on World wide web, pages 851–860. ACM, 2010.
[39] David Savage, Xiuzhen Zhang, Xinghuo Yu, Pauline Chou, and Qingmai Wang.
Anomaly detection in online social networks. Social Networks, 39:62–70, 2014.
[40] Hassan Sayyadi, Matthew Hurst, and Alexey Maykov. Event detection and
tracking in social streams. In Icwsm, 2009.
16
[41] John Scott. Social network analysis. Sage, 2012.
[42] Steffen Staab, Pedro Domingos, P Mike, Jennifer Golbeck, Li Ding, Tim Finin,
Anupam Joshi, Andrzej Nowak, and Robin R Vallacher. Social networks applied.
IEEE Intelligent systems, 20(1):80–93, 2005.
[43] Lei Tang and Huan Liu. Community detection and mining in social media.
Synthesis Lectures on Data Mining and Knowledge Discovery, 2(1):1–137, 2010.
[44] Tracy L Tuten and Michael R Solomon. Social media marketing. Sage, 2014.
[45] Stanley Wasserman and Katherine Faust. Social network analysis: Methods and
applications, volume 8. Cambridge university press, 1994.
[46] Duncan J Watts and Steven H Strogatz. Collective dynamics of small-
worldnetworks. nature, 393(6684):440–442, 1998.
[47] Jianshu Weng and Bu-Sung Lee. Event detection in twitter. ICWSM, 11:401–
408, 2011.
[48] Lilian Weng, Filippo Menczer, and Yong-Yeol Ahn. Virality prediction and
community structure in social networks. Scientific reports, 3, 2013.
[49] Christopher C Yang and Tobun D Ng. Terrorism and crime related weblog social
network: Link, content analysis and information visualization. In Intelligence
and Security Informatics, 2007 IEEE, pages 55–58. IEEE, 2007.
[50] Jaewon Yang and Jure Leskovec. Defining and evaluating network communities
based on ground-truth. Knowledge and Information Systems, 42(1):181–213,
2015.
[51] Wan-Shiou Yang, Jia-Ben Dia, Hung-Chi Cheng, and Hsing-Tzu Lin. Mining so-
cial networks for targeted advertising. In Proceedings of the 39th Annual Hawaii
17
International Conference on System Sciences (HICSS’06), volume 6, pages 137a–
137a. IEEE, 2006.
[52] Rose Yu, Xinran He, and Yan Liu. Glad: group anomaly detection in social
media analysis. ACM Transactions on Knowledge Discovery from Data (TKDD),
10(2):18, 2015.
[53] Pooya Moradian Zadeh and Ziad Kobti. A multi-population cultural algorithm
for community detection in social networks. Procedia Computer Science, 52:342–
349, 2015.
[54] Pooya Moradian Zadeh and Ziad Kobti. A knowledge based framework for link
prediction in social networks. In International Symposium on Foundations of
Information and Knowledge Systems, pages 255–268. Springer, 2016.
[55] Pooya Moradian Zadeh and Mohsen Sadighi Moshkenani. Mining social network
for semantic advertisement. In Convergence and Hybrid Information Technology,
2008. ICCIT’08. Third International Conference on, volume 1, pages 611–618.
IEEE, 2008.
[56] Pooya Moradian Zadeh, Mukund Pandey, and Ziad Kobti. A study on popu-
lation adaptation in social networks based on knowledge migration in cultural
algorithm. In Evolutionary Computation (CEC), 2016 IEEE Congress on, pages
4405–4412. IEEE, 2016.
[57] Qiankun Zhao, Prasenjit Mitra, and Bi Chen. Temporal and information flow
based event detection from social text streams. In AAAI, volume 7, pages 1501–
1506, 2007.
18
Chapter 2
Community Detection in Social
Networks
Social networks can be viewed as a reflection of the real world which can be studied to
gain insight into the real life societies and events. During the last decade, community
detection as a fundamental part of social network analysis has been explored widely,
however, because of the complex nature of the network, it is still an open problem.
In this chapter, we propose a knowledge-based evolutionary algorithm to solve this
problem by using a multi-population cultural algorithm. In our algorithm, knowledge
is extracted from the network to guide the search direction and find the optimal/near
optimal solution. Meanwhile, in each step, the knowledge is updated based on the
current state of the network. The results of comparison between our method and
other well-known algorithms show that our algorithm is capable of finding the true
communities faster and more accurately than the others.
19
2.1 Introduction
Nowadays, more than 1 billion people around the world use online social networks
to transfer and share their ideas, thoughts, experiments and willingness. Extracting
knowledge from these networks can reveal their structure which has a lot of real-life
applications such as marketing, group analysis, and decision making.
Generally, social networks consist of connected communities formed by individuals
who communicate with each other. Finding these communities is a fundamental task
in social network analysis. However, because of the complex and dynamic nature of
these networks, identifying these communities is still an open challenging problem.
The first step to analyze a network is mapping it into a graph, G(V, E), where
V is a set of nodes or agents and E is a set of edges or links between agents. Let A
be an adjacency matrix for this graph. The entry of A(i,j) is 1 if there is a direct
link between nodes i and j otherwise it is 0 if no link exists. Accordingly, community
detection in a social network can be seen as an optimization problem where the goal is
to find groups of nodes that have more interconnections between each other and fewer
intra-links with other nodes. The target is to find the best solution among all possible
solutions to the problem [8, 18]. As the highlighted problem can be categorized as
an NP-Hard problem, many researchers have proposed various methods based on
evolutionary algorithms to solve it.
While most of the research are based on genetic algorithms, in this paper we use a
different group of evolutionary algorithms which is known as cultural algorithms. The
main feature of cultural algorithms that distinguish them from others is employing
knowledge [3, 21]. In other words, it is a knowledge-based evolutionary algorithm.
The cultural algorithm as shown in Fig. 2.1 is a dual inheritance model which consists
of two main spaces, population, and culture or belief space. According to the model,
in each generation, a group of individuals is selected to update the belief space and
the new population is generated based on the parameters which were defined in the
20
belief space. The belief space in this model acts as a global knowledge repository
which is made of information about the individuals and can be used to guide the
search direction.
Figure 2.1: Cultural Algorithm Process
Our proposed algorithm is based on the multi-population cultural algorithm[10]
which is illustrated in Fig. 2.2. To make the population spaces, a specific number of
individuals are generated randomly based on the state space of the network. As the
individual(a candidate solution) is composed of a combination of different elements,
the state space of the network contains the possible states for each element. After the
initial generation, in each population, a group of individuals that have better fitness
values is selected to make a belief space. The belief space has a vital role in this
algorithm and guides the search direction by determining a range of possible states
for each element of the individuals. Hence, the belief space can be seen as a new
state space for the network. Consequently, the new individuals in each population
are generated based on this belief space. Meanwhile, in each step, the belief space is
updated according to the state of the best-selected individuals of each population.
21
Figure 2.2: Multi-Population Cultural Algorithm Process
The rest of the paper is organized as follows. In the next section, we review major
methods in this area. Section 3 contains the proposed algorithm. Evaluation and
results are reviewed in Section 4, and conclusions are represented in section 5.
2.2 Related Works
In recent years, different methods have been proposed to solve the community detec-
tion problem. One of the most important method which became the base for further
research in this field was proposed by Girvan and Newman [6]. In this paper, the con-
cept of modularity was defined, and a divisive method was proposed for the problem.
Many researchers proposed different algorithms based on the concept of modularity
with various approaches. However, some of these algorithms need prior knowledge
of the network, and some others have poor performance on large complex networks
[2, 7, 18]. To cope with these drawbacks, researchers have employed evolutionary
algorithms by different approaches and techniques. However, the common goal is to
detect unknown numbers of communities in the network with a high level of internal
connections and low level of external links [1, 2, 6, 7, 8, 9].
Some research focuses particularly on enhancing the fitness function. A fitness
function has critical importance in evolutionary algorithms, as it estimates how close
22
the solution is to the final solution and consequently guides the algorithm direction
directly or indirectly. For this purpose, some recent studies have addressed the prob-
lem as a multi-objective problem. The first objective aims at maximizing the internal
links and the second is minimizing the external connections [1, 2, 4, 6, 9, 13, 14].
Pizzuti [18] proposed a new algorithm to solve the problem by using a genetic algo-
rithm. The author has used the density measure and has defined the new concept of
community score as a global measure to partition a given network into clusters. The
goal of the algorithm is to maximize this score.
In Facetnet [13], the authors have proposed a new framework to solve the problem
by using a multi-objective evolutionary algorithm. In their model, an individual can
be a member of more than one community at the same time. They have defined the
snapshot quality function and the temporal cost function and an iterative algorithm
which uses a function to update rules in order to decrease the value of the cost
function uniformly. On the other hand, they have introduced concepts of community
membership, community net and evolution net in their framework. Meanwhile, they
have proposed a mechanism for adding and removing individuals from communities to
cope with the dynamic aspect of the network. A soft modularity function to measure
the effectiveness of a community was also employed.
Some recent research uses the NSGA-II (Non-dominated Sorting Genetic Algo-
rithm) as the core of their algorithm [2, 9, 19]. Kim, Mckey, and Moon [9] proposed
HIGA (hybrid immigrants GA) to cope with the dynamic aspect of the network. The
authors have defined an algorithm called Adaptive Immigrants NSGA-II (AI-NSGA
II) to give their method dynamic adaptability. The min-max cut and global silhouette
index defined as the two objectives of the fitness function. On the other hand, Chen,
Wang, and Wei [2] have employed the modularity function and NMI as similarity
measures for the first and second objectives. They have also used community score
[18] for the solution selection process.
23
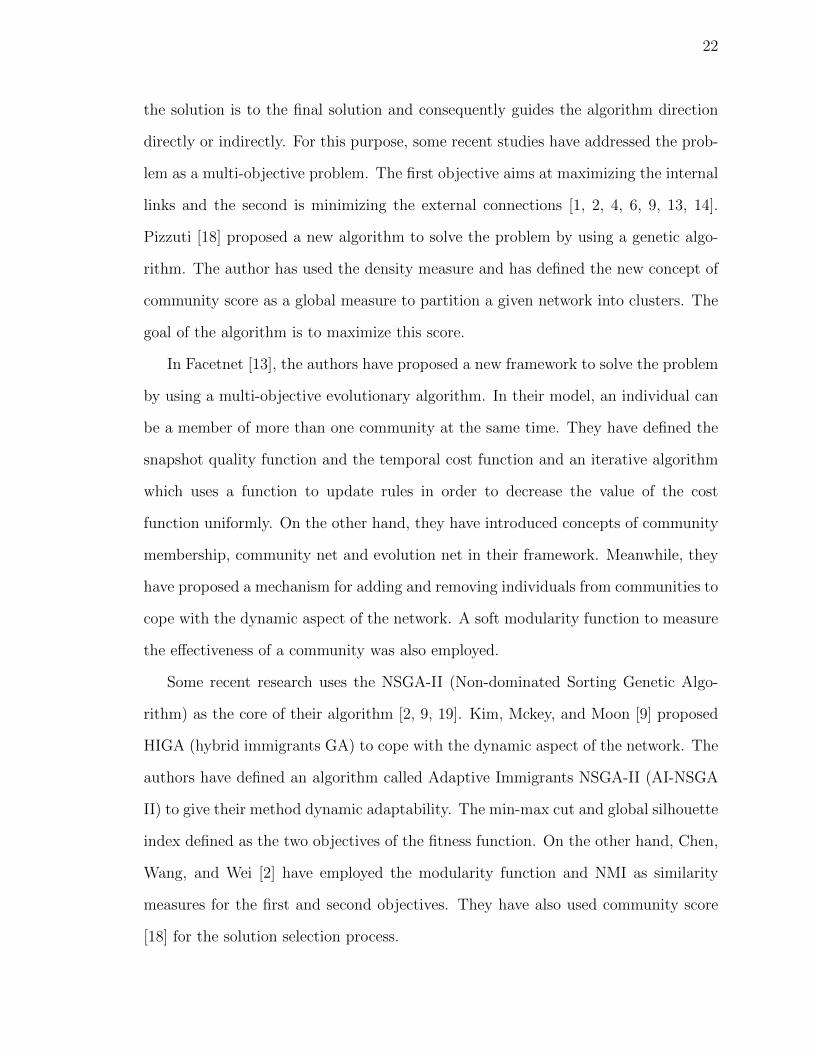
Many studies have also been carried out based on other techniques [1, 6, 7, 20, 15].
Gong et al.[6] proposed a multi-objective algorithm based on the non-dominated
neighbor immune algorithm (NNIA). For the first objective they used the modularity
function [5] and for the second, they used NMI as a similarity measure. Amiri, Hos-
sain, and Crawford [1] have suggested a multi-objective evolutionary algorithm based
on the harmony search algorithm. Jia et al. [7] proposed a Differential Evolution
(DE) approach to solving the problem. Modularity function was employed to obtain
the fitness function while for the initialization step a particular biased process was
used in order to prevent making unreasonable results. Furthermore, for the mutation
they used ”rand/1” strategy. Qiu and Lin [20] proposed a new algorithm to solve the
problem by using a hierarchical structure model. Random walk approach was imple-
mented and the Gaussian Mixture Model (GMM) was used to generate the transition
probability matrix to calculate the likelihood of relation between a node and each
community.
2.3 Proposed Model for Community Detection
In this section, we describe the proposed algorithm which is a multi-population cul-
tural algorithm for community detection in social networks. The individual represen-
tation method and mechanism for crossover and mutation are described in detail in
the next part. After that, the structure of belief space will be defined and discussed.
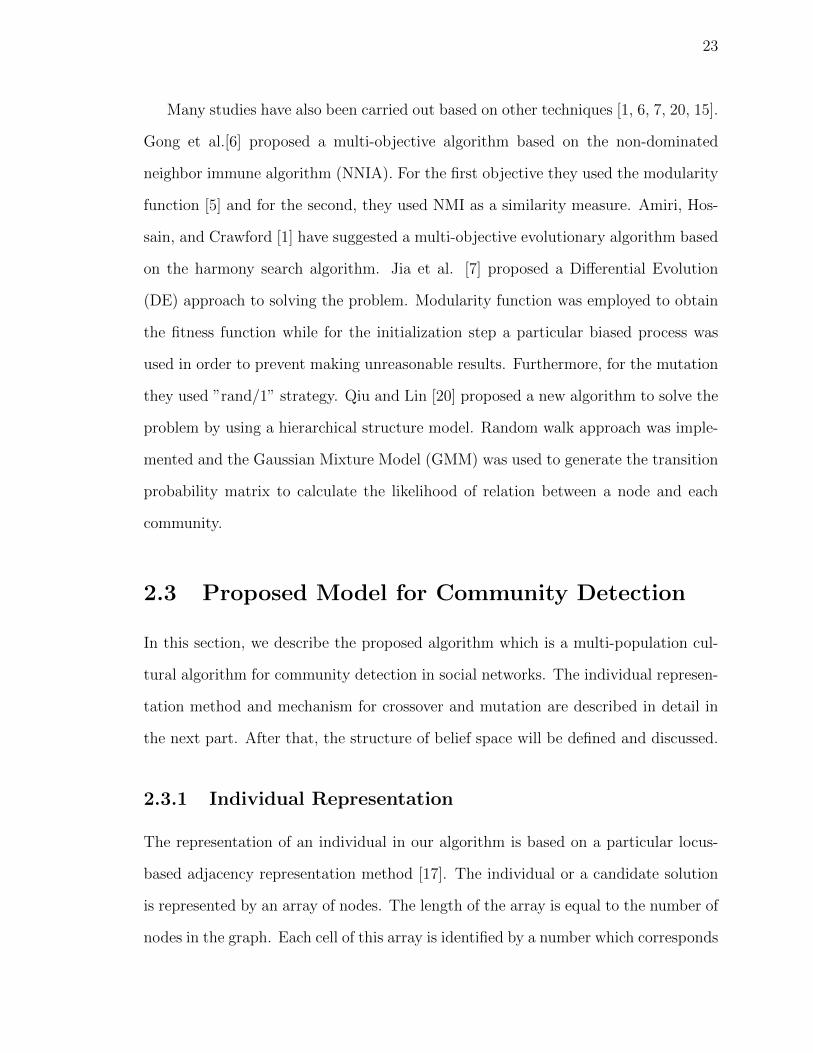
2.3.1 Individual Representation
The representation of an individual in our algorithm is based on a particular locus-
based adjacency representation method [17]. The individual or a candidate solution
is represented by an array of nodes. The length of the array is equal to the number of
nodes in the graph. Each cell of this array is identified by a number which corresponds

24
to the number of nodes in the graph. For example, cell#5 refers to the node #5. The
value of each cell is chosen randomly from the state space of the network denoted by
NS, which is formed based on the adjacency matrix of the network graph. Therefore,
for each node in the graph, a set of neighbor nodes is defined as follows:
Algorithm 1 Network state
1: procedure Main(Adjacency)
2: for i← 1 : n do
3: for j ← i+ 1 : n do
4: if A(i, j) = 1 then
5: NS(i, j)← j
6: NS(j, i)← i
7: end if
8: end for
9: end for
10: end procedure
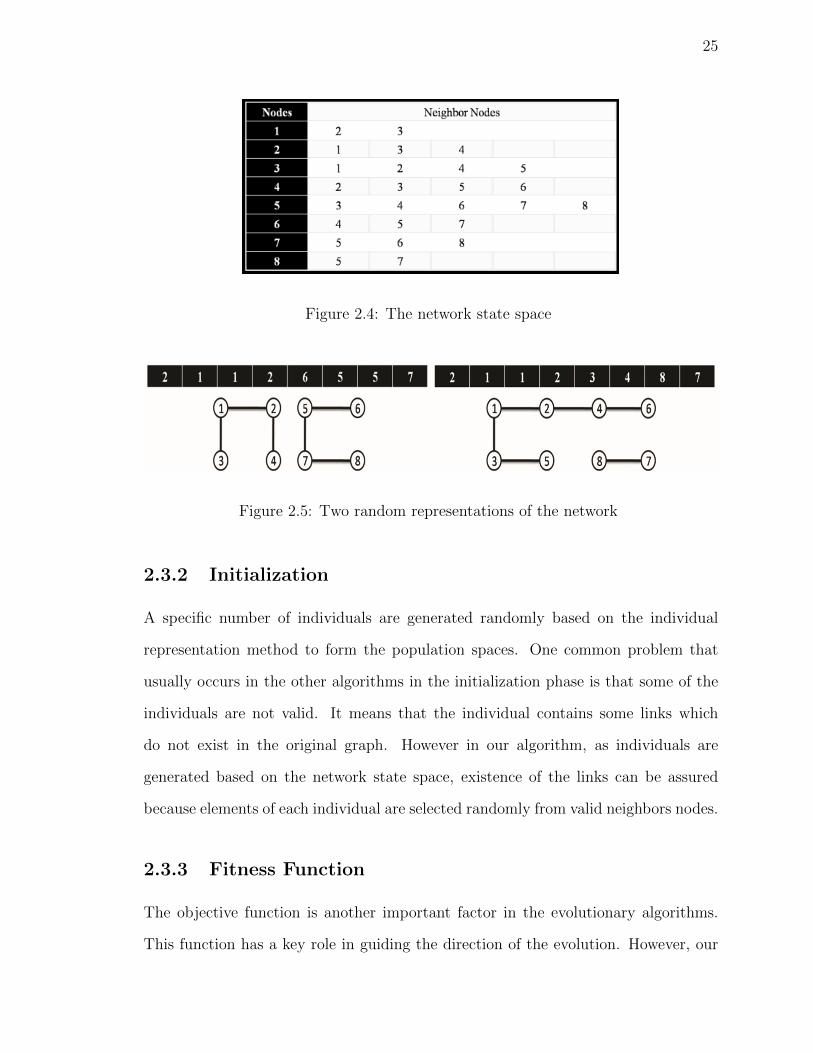
As an example, Fig. 2.4 illustrates the network state space of a network graph
which has been shown in Fig. 2.3. In addition, Fig. 2.5 illustrates two different
random representations of the network based on the network state.
Figure 2.3: A network graph
25
Figure 2.4: The network state space
Figure 2.5: Two random representations of the network
2.3.2 Initialization
A specific number of individuals are generated randomly based on the individual
representation method to form the population spaces. One common problem that
usually occurs in the other algorithms in the initialization phase is that some of the
individuals are not valid. It means that the individual contains some links which
do not exist in the original graph. However in our algorithm, as individuals are
generated based on the network state space, existence of the links can be assured
because elements of each individual are selected randomly from valid neighbors nodes.
2.3.3 Fitness Function
The objective function is another important factor in the evolutionary algorithms.
This function has a key role in guiding the direction of the evolution. However, our
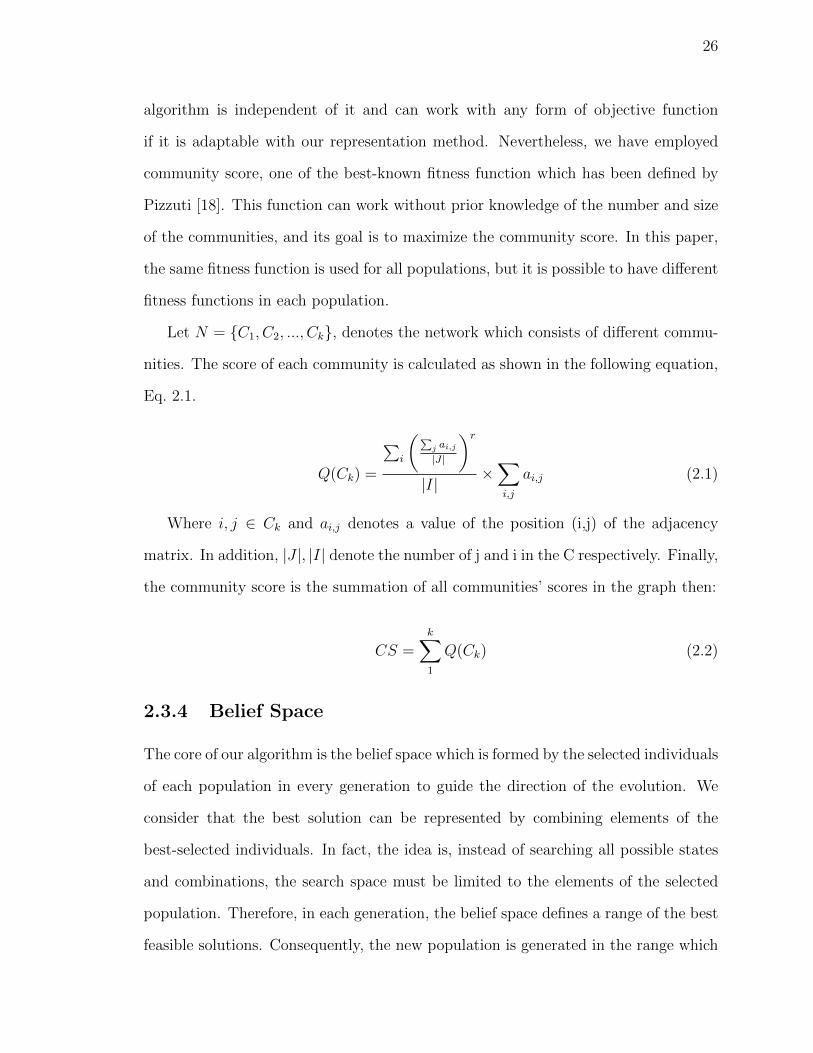
26
algorithm is independent of it and can work with any form of objective function
if it is adaptable with our representation method. Nevertheless, we have employed
community score, one of the best-known fitness function which has been defined by
Pizzuti [18]. This function can work without prior knowledge of the number and size
of the communities, and its goal is to maximize the community score. In this paper,
the same fitness function is used for all populations, but it is possible to have different
fitness functions in each population.
Let N = {C1, C2, ..., Ck}, denotes the network which consists of different commu-
nities. The score of each community is calculated as shown in the following equation,
Eq. 2.1.
Q(Ck) =
∑i
(∑j ai,j
|J |
)r
|I|×∑i,j
ai,j (2.1)
Where i, j ∈ Ck and ai,j denotes a value of the position (i,j) of the adjacency
matrix. In addition, |J |, |I| denote the number of j and i in the C respectively. Finally,
the community score is the summation of all communities’ scores in the graph then:
CS =k∑1
Q(Ck) (2.2)
2.3.4 Belief Space
The core of our algorithm is the belief space which is formed by the selected individuals
of each population in every generation to guide the direction of the evolution. We
consider that the best solution can be represented by combining elements of the
best-selected individuals. In fact, the idea is, instead of searching all possible states
and combinations, the search space must be limited to the elements of the selected
population. Therefore, in each generation, the belief space defines a range of the best
feasible solutions. Consequently, the new population is generated in the range which
27
has been defined in the belief space. It is expected that in each generation, better
solutions are being generated by the algorithm.
We define two different sources of knowledge in the belief space. The first is called
BS average and stores the best ever average fitness value of the previously selected
populations. In each generation, a selected individual can change the belief space
if its fitness value is higher than the average value of the previous individuals which
influenced the belief space (BS average). As shown in Alg. 2, if BS average is less than
the average fitness value of the currently selected population it must be replaced with
the new one. As mentioned before, each individual is represented by an array with
the length of n which is the number of nodes. Therefore the selected population can
be presented by an s by n matrix where each row of the matrix shows an individual
and s is the size of the selected population and n is the number of nodes in the graph.
As shown in Eq. 2.4, let SP denotes the selected population which consists of selected
individuals (SI) in Eq. 2.3 then the average is computed by calculating the average
of fitness values of the selected individuals. It has been represented in Eq. 2.5.
SI = [si1, si2, ..., sin] (2.3)
SP =
SI1
...
SIs
−− > SP =
si1,1 . . . si1,n
... . . ....
sis,1 . . . sis,n
(2.4)
Average =
∑sj=1 Fitness(Sij)
s(2.5)
The second source of knowledge is the normative knowledge, BSN, which is rep-
resented by an n by n matrix. In each generation, for all individuals of the selected
population, the relative frequency of values of all cells are calculated and added into
the corresponding entry in the matrix. In fact, as shown in Alg. 2 for all the selected
individuals, BSN(j, value(j)) is updated with the relative frequency of the value(j) in

28
the cell#j where j is the cell number.
Algorithm 2 Update Beleif Space
1: function Update(SP ) . Selected Population
2: s← |SP |
3: n← |SI|
4: for i← 1 to s do
5: if Fitness(SIi) > BS average then
6: for j ← 1 to n do
7: BSN(j, value(j))← relative frequency value(j) in rowj
8: end for
9: end if
10: end for
11: if BS average < Average then
12: BS average = Average
13: end if
14: end function
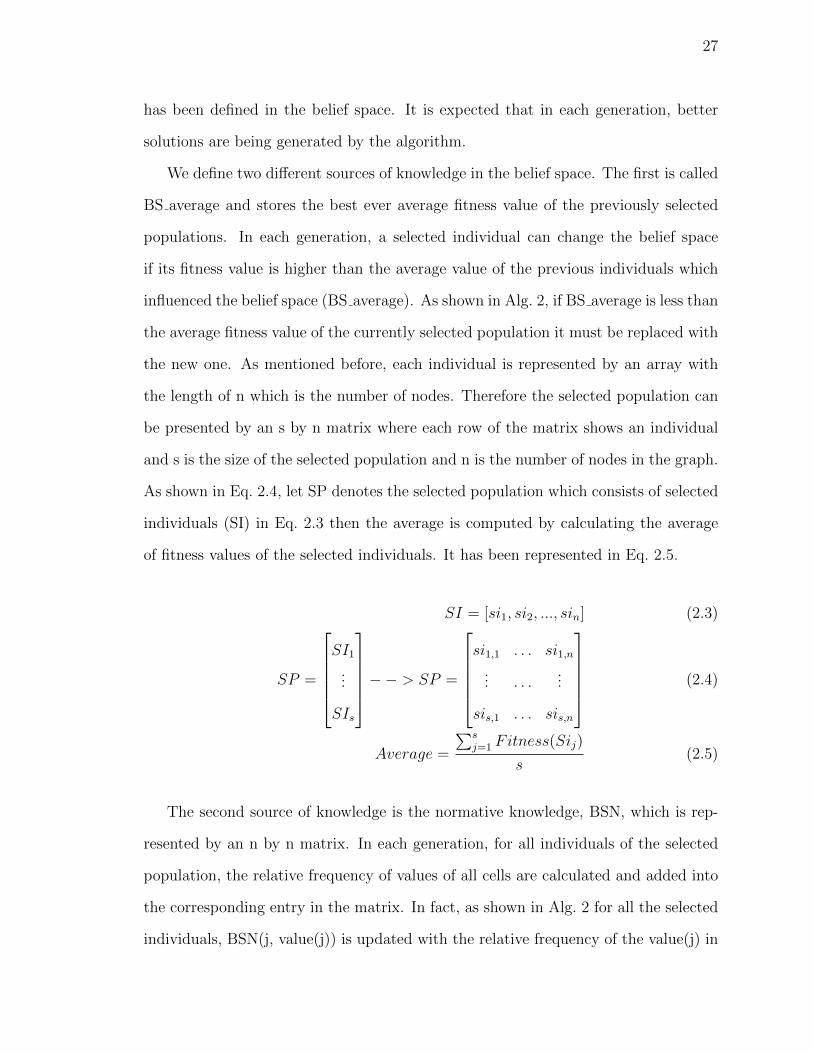
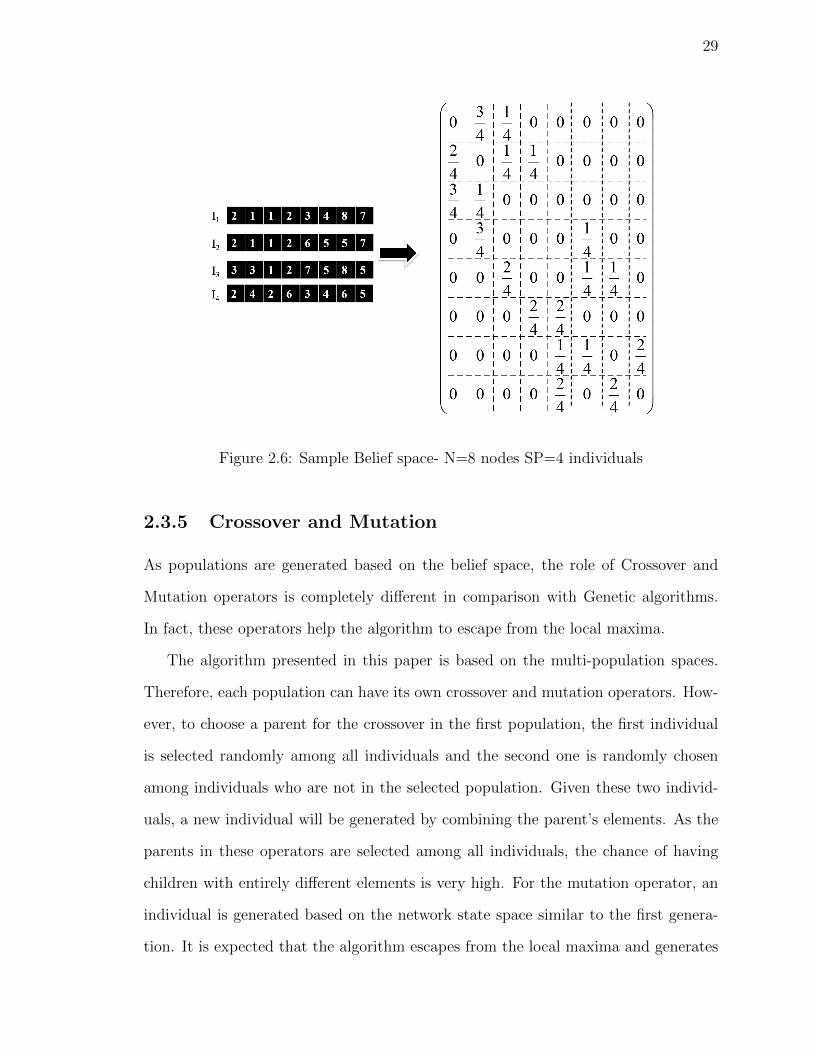
For example, in Fig. 3.6, the BSN is formed based on the network with eight nodes
and four selected individuals. The first row shows neighbors of the node 1. According
to the matrix, the probability of connection between node 1 and node 2 in the final
solution is 75% while it is 25% for node 3. It means that in the next generation, node
2 will be presented in the first cell of the individuals with a probability of 75% while
node 3 with the probability of 25%.
29
Figure 2.6: Sample Belief space- N=8 nodes SP=4 individuals
2.3.5 Crossover and Mutation
As populations are generated based on the belief space, the role of Crossover and
Mutation operators is completely different in comparison with Genetic algorithms.
In fact, these operators help the algorithm to escape from the local maxima.
The algorithm presented in this paper is based on the multi-population spaces.
Therefore, each population can have its own crossover and mutation operators. How-
ever, to choose a parent for the crossover in the first population, the first individual
is selected randomly among all individuals and the second one is randomly chosen
among individuals who are not in the selected population. Given these two individ-
uals, a new individual will be generated by combining the parent’s elements. As the
parents in these operators are selected among all individuals, the chance of having
children with entirely different elements is very high. For the mutation operator, an
individual is generated based on the network state space similar to the first genera-
tion. It is expected that the algorithm escapes from the local maxima and generates
30
some solutions outside the current domain by using crossover and mutation
2.3.6 Our proposed algorithm
Our proposed algorithm is started by generating the initial population, after evalu-
ating the fitness of individuals and sorting them, the best groups of individuals of
each population are selected based on their fitness function. These groups update the
belief space. The new generation of individuals is generated based on the probability
matrix of the belief space. Meanwhile, in each iteration with a small probability some
individuals are generated by crossover or mutation operators. Each population space
in this algorithm can have their own fitness function or operators. The algorithm
continues until the last iteration, and the individual with the best fitness function
value will be presented as the best solution.

31
Algorithm 3 MPCA-CD
1: procedure Main(Adjacency)
2: NS ←MakeNS(Adjacency) . Initialize the network State
3: l← |Selected Individuals| . Define the number of selected individuals
4: el← |Elite Individuals| . Define the number of elite individuals
5: Pop← Represent(NS) . Initialize the populations
6: F ← Fitness(Pop) . Evaluate the individuals’ fitness values
7: Pop← Sort(Pop, F ) . Sort the individuals by their fitness values
8: SP ← Select(Pop, l) . Select individuals to update the belief space
9: Belief = Update(SP ) . Select individuals to update the belief space
10: loop . Start the Loop
11: Pop(el : end)← Represent(Belief) . generate the populations based on
the Belief space
12: F ← Fitness(Pop)
13: Pop← Sort(Pop, F )
14: SP ← Select(Pop, l)
15: Belief = Update(SP )
16: if < stopcriteria > then
17: Break
18: end if
19: end loop
20: end procedure
2.4 Evaluation
To evaluate the effectiveness of the model, we compare it with four well-known al-
gorithms in this field. The first one is GA-Net [18] which is a genetic algorithm,
32
the second one is the Girvan-Newman algorithm(GN), DECD [7] is the third one
which is based on Differential Evolution and the last one is MOGA-Net [19]. We also
compare it with variable-CA [24]. To measure the similarity level between the true
communities and the detected ones we used Normalized Mutual Information (NMI)
[5, 18].
We made 60 artificial networks based on the Newman benchmark [5, 17]. Each
network was generated randomly and has 128 nodes which are categorized in 4 same-
sized communities with 32 nodes while the degree of each node was 16. Meanwhile,
each node is connected to other nodes in its community by internal degree, Zin, and
to other nodes by external degree, Zout (Zin + Zout = 16). The range of Zout of our
artificial networks in this experiment is from 1 to 6 where six implies that each node
is connected to 6 nodes outside of its community which means that the network is
very noisy and fuzzy.
Our proposed algorithm has been implemented in Matlab, and all tests have been
performed on a Pentium dual core 2.1GHz with 2.5 GB RAM. In addition, for the
first population, crossover and mutation rate were set to 0.8 and 0.2 respectively. The
population size was 200, and the number of generations is set to 50 while roulette
selection function was used. For the second population, the size was set to 100, and
the selection rate was 20% similar to the first one, but the rate of mutation increased
to 50% while the roulette wheel selection was used.
As demonstrated in Fig. 2.7, the proposed algorithm can detect actual commu-
nities with 100% success when Zout is less than or equal to 5 while none of other
algorithms can achieve this rate. For Zout of 5, the average NMI of our algorithm
is 1 while the value for GN, GA, DECD, and MOGA-Net are 0.72, 0.77, 0.95 and
0.98 respectively. Even when Zout becomes 6, our algorithm has better performance
when compared to the others, and its value was 0.83 while the best value of other
algorithms was achieved by MOGA-Net which was 0.67. In addition, this value for
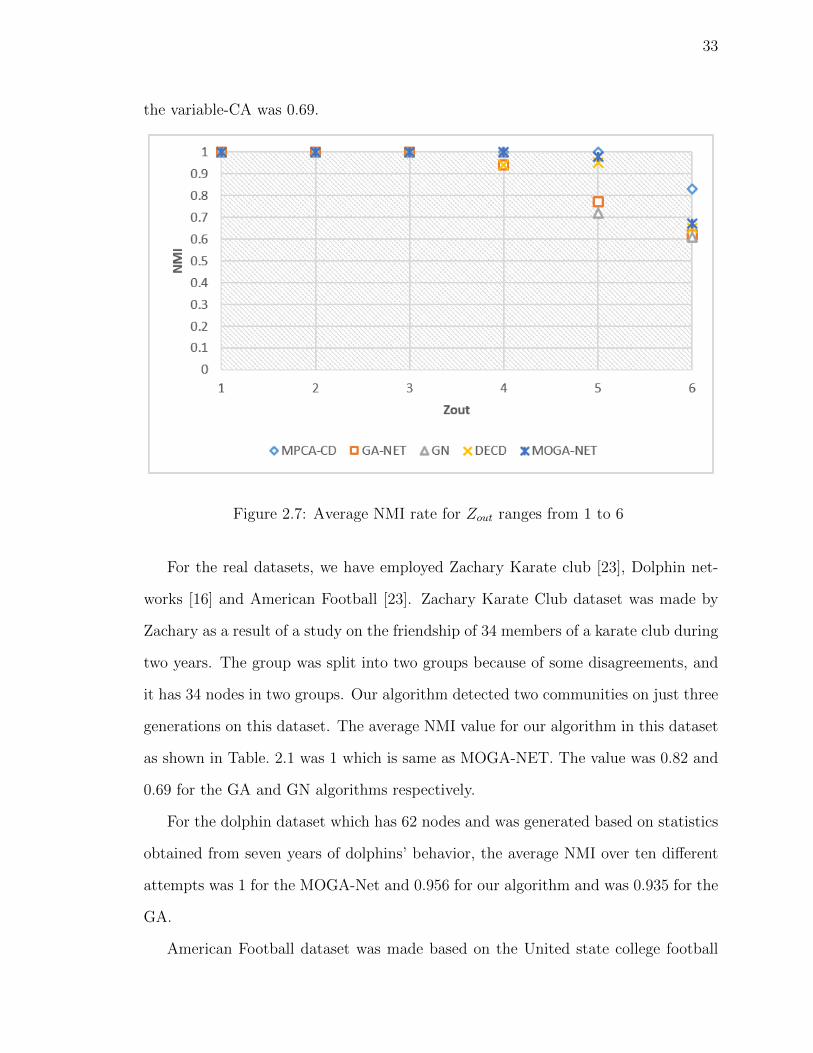
33
the variable-CA was 0.69.
Figure 2.7: Average NMI rate for Zout ranges from 1 to 6
For the real datasets, we have employed Zachary Karate club [23], Dolphin net-
works [16] and American Football [23]. Zachary Karate Club dataset was made by
Zachary as a result of a study on the friendship of 34 members of a karate club during
two years. The group was split into two groups because of some disagreements, and
it has 34 nodes in two groups. Our algorithm detected two communities on just three
generations on this dataset. The average NMI value for our algorithm in this dataset
as shown in Table. 2.1 was 1 which is same as MOGA-NET. The value was 0.82 and
0.69 for the GA and GN algorithms respectively.
For the dolphin dataset which has 62 nodes and was generated based on statistics
obtained from seven years of dolphins’ behavior, the average NMI over ten different
attempts was 1 for the MOGA-Net and 0.956 for our algorithm and was 0.935 for the
GA.
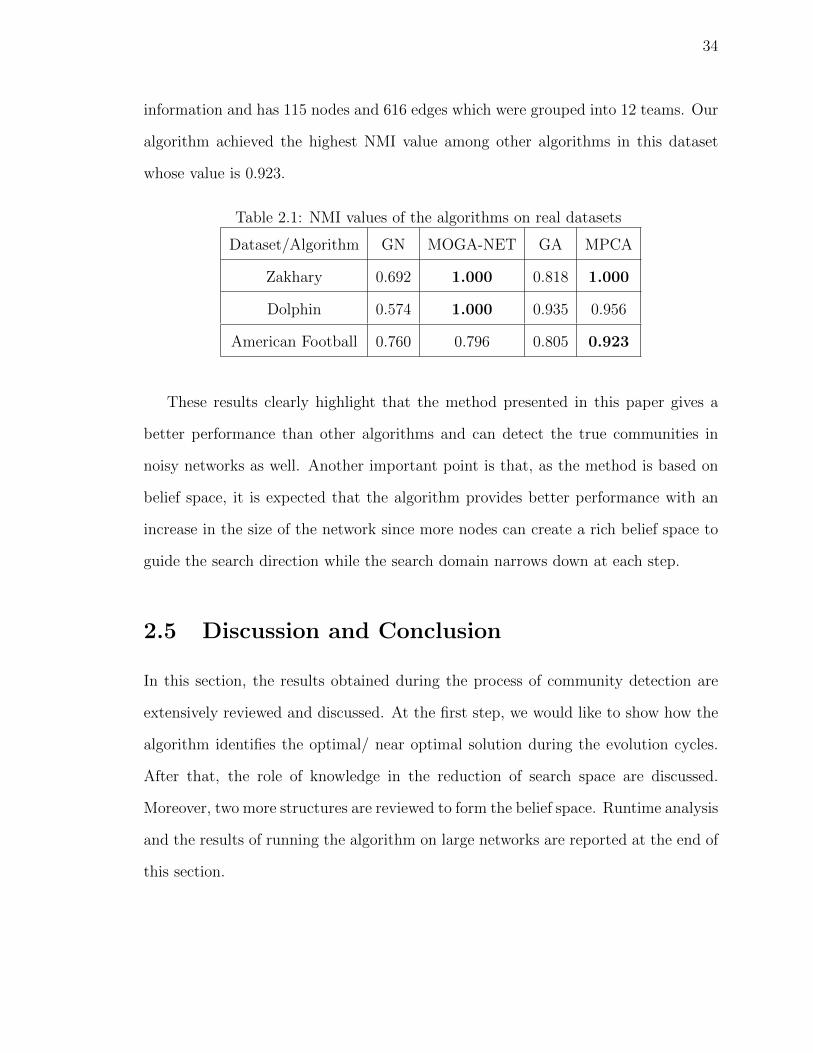
American Football dataset was made based on the United state college football
34
information and has 115 nodes and 616 edges which were grouped into 12 teams. Our
algorithm achieved the highest NMI value among other algorithms in this dataset
whose value is 0.923.
Table 2.1: NMI values of the algorithms on real datasets
Dataset/Algorithm GN MOGA-NET GA MPCA
Zakhary 0.692 1.000 0.818 1.000
Dolphin 0.574 1.000 0.935 0.956
American Football 0.760 0.796 0.805 0.923
These results clearly highlight that the method presented in this paper gives a
better performance than other algorithms and can detect the true communities in
noisy networks as well. Another important point is that, as the method is based on
belief space, it is expected that the algorithm provides better performance with an
increase in the size of the network since more nodes can create a rich belief space to
guide the search direction while the search domain narrows down at each step.
2.5 Discussion and Conclusion
In this section, the results obtained during the process of community detection are
extensively reviewed and discussed. At the first step, we would like to show how the
algorithm identifies the optimal/ near optimal solution during the evolution cycles.
After that, the role of knowledge in the reduction of search space are discussed.
Moreover, two more structures are reviewed to form the belief space. Runtime analysis
and the results of running the algorithm on large networks are reported at the end of
this section.
35
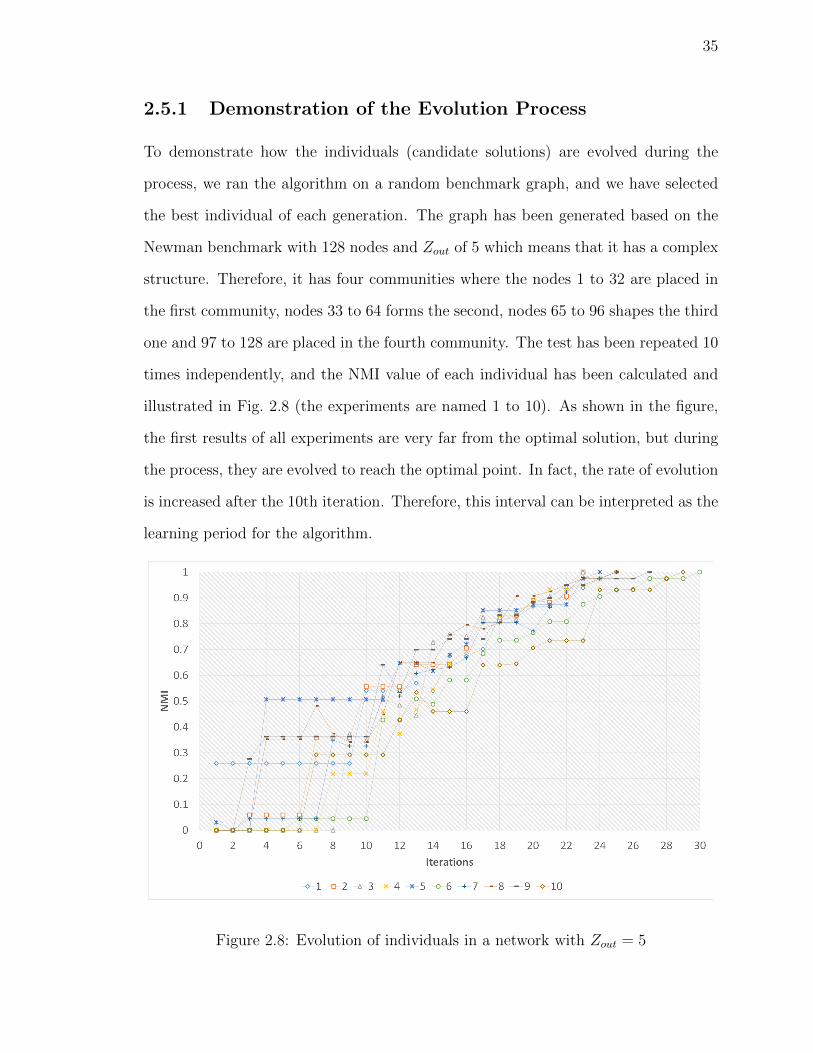
2.5.1 Demonstration of the Evolution Process
To demonstrate how the individuals (candidate solutions) are evolved during the
process, we ran the algorithm on a random benchmark graph, and we have selected
the best individual of each generation. The graph has been generated based on the
Newman benchmark with 128 nodes and Zout of 5 which means that it has a complex
structure. Therefore, it has four communities where the nodes 1 to 32 are placed in
the first community, nodes 33 to 64 forms the second, nodes 65 to 96 shapes the third
one and 97 to 128 are placed in the fourth community. The test has been repeated 10
times independently, and the NMI value of each individual has been calculated and
illustrated in Fig. 2.8 (the experiments are named 1 to 10). As shown in the figure,
the first results of all experiments are very far from the optimal solution, but during
the process, they are evolved to reach the optimal point. In fact, the rate of evolution
is increased after the 10th iteration. Therefore, this interval can be interpreted as the
learning period for the algorithm.
Figure 2.8: Evolution of individuals in a network with Zout = 5
36
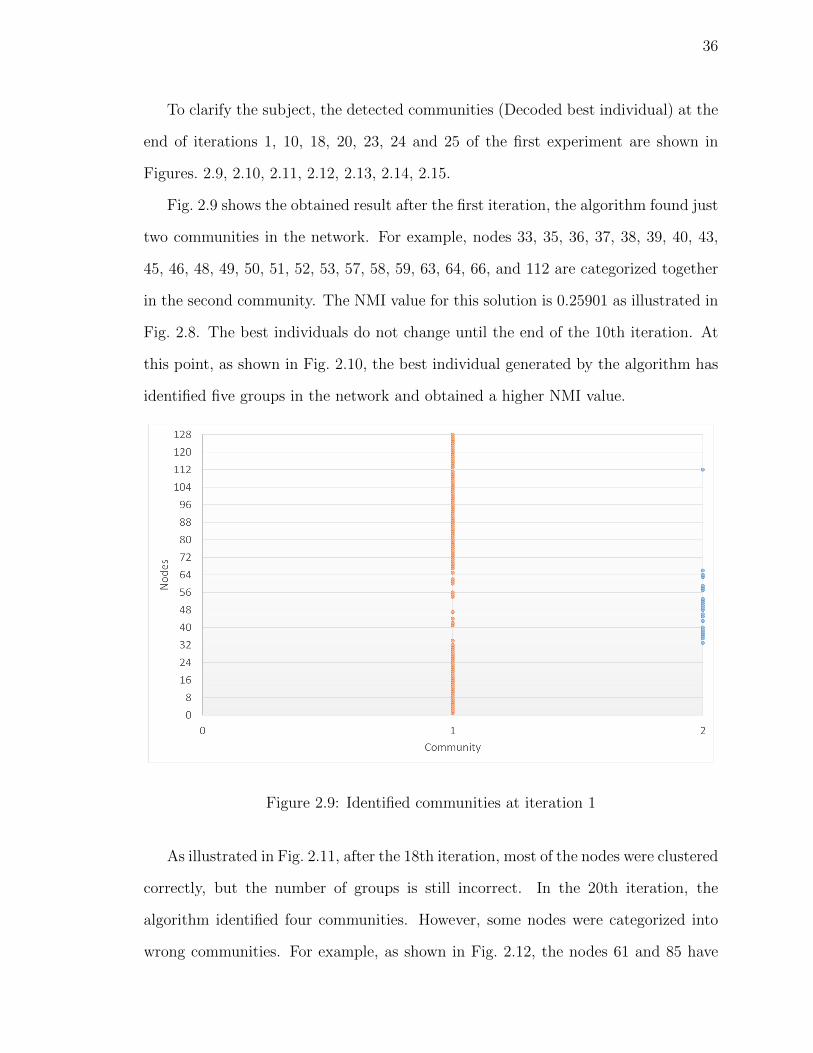
To clarify the subject, the detected communities (Decoded best individual) at the
end of iterations 1, 10, 18, 20, 23, 24 and 25 of the first experiment are shown in
Figures. 2.9, 2.10, 2.11, 2.12, 2.13, 2.14, 2.15.
Fig. 2.9 shows the obtained result after the first iteration, the algorithm found just
two communities in the network. For example, nodes 33, 35, 36, 37, 38, 39, 40, 43,
45, 46, 48, 49, 50, 51, 52, 53, 57, 58, 59, 63, 64, 66, and 112 are categorized together
in the second community. The NMI value for this solution is 0.25901 as illustrated in
Fig. 2.8. The best individuals do not change until the end of the 10th iteration. At
this point, as shown in Fig. 2.10, the best individual generated by the algorithm has
identified five groups in the network and obtained a higher NMI value.
Figure 2.9: Identified communities at iteration 1
As illustrated in Fig. 2.11, after the 18th iteration, most of the nodes were clustered
correctly, but the number of groups is still incorrect. In the 20th iteration, the
algorithm identified four communities. However, some nodes were categorized into
wrong communities. For example, as shown in Fig. 2.12, the nodes 61 and 85 have
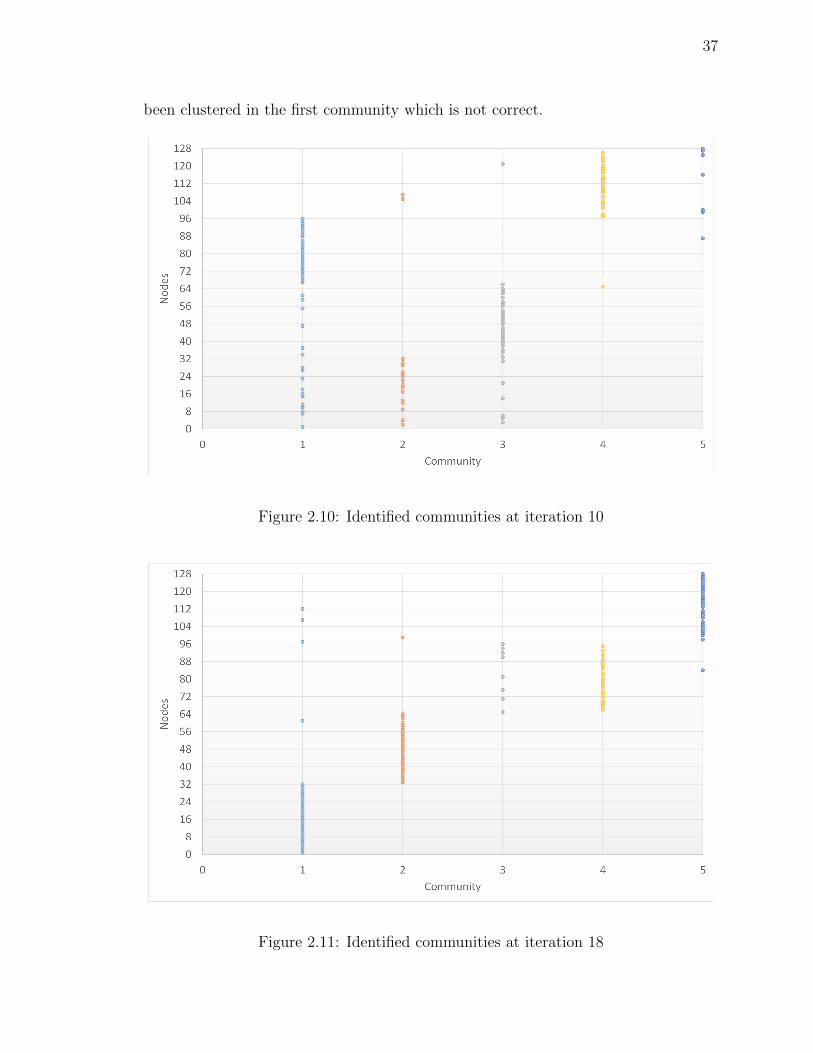
37
been clustered in the first community which is not correct.
Figure 2.10: Identified communities at iteration 10
Figure 2.11: Identified communities at iteration 18
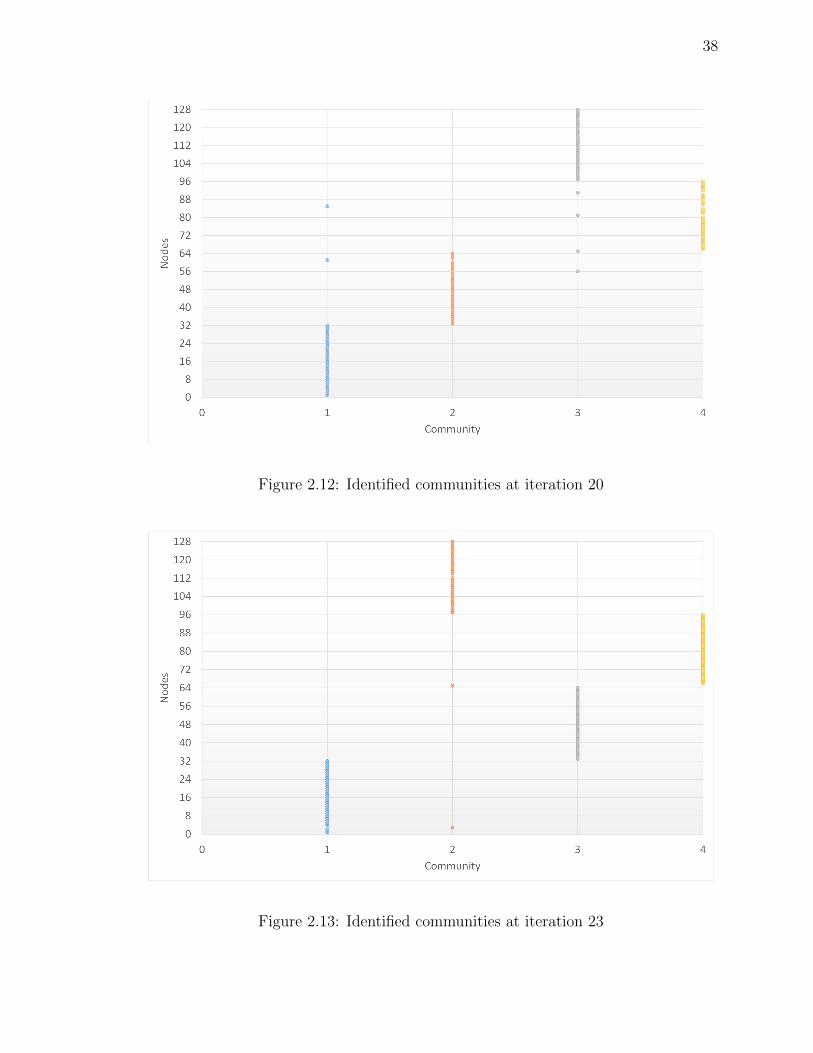
38
Figure 2.12: Identified communities at iteration 20
Figure 2.13: Identified communities at iteration 23
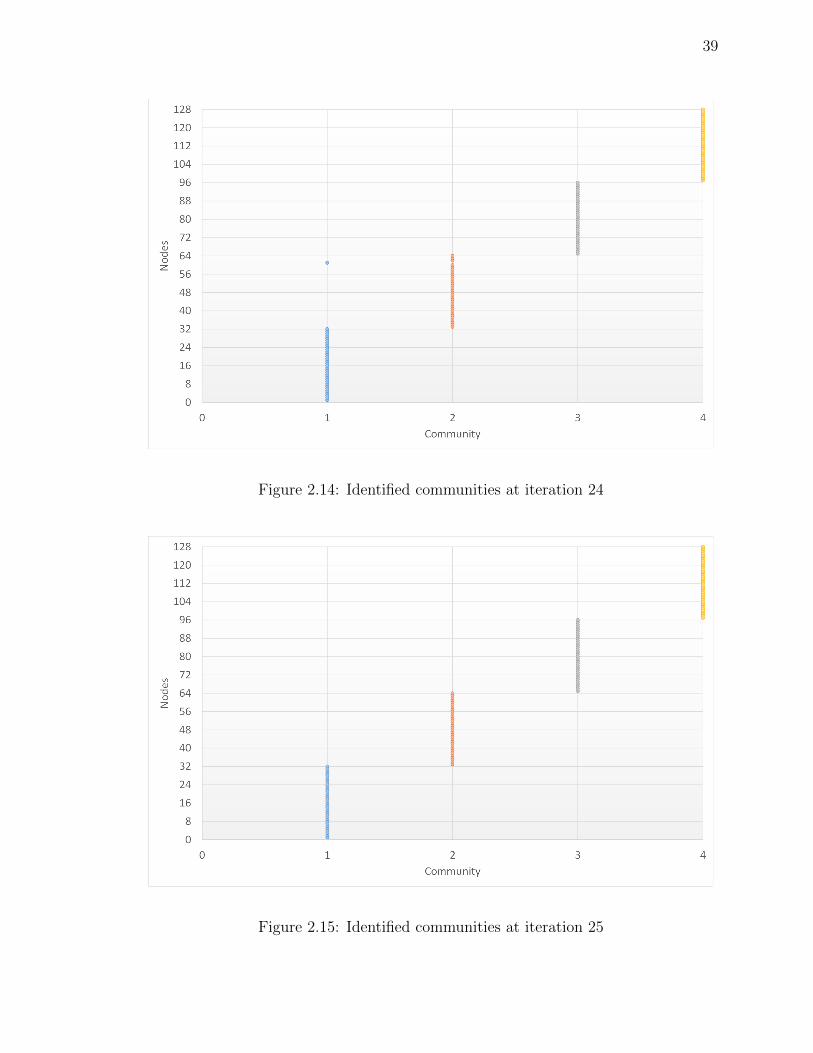
39
Figure 2.14: Identified communities at iteration 24
Figure 2.15: Identified communities at iteration 25
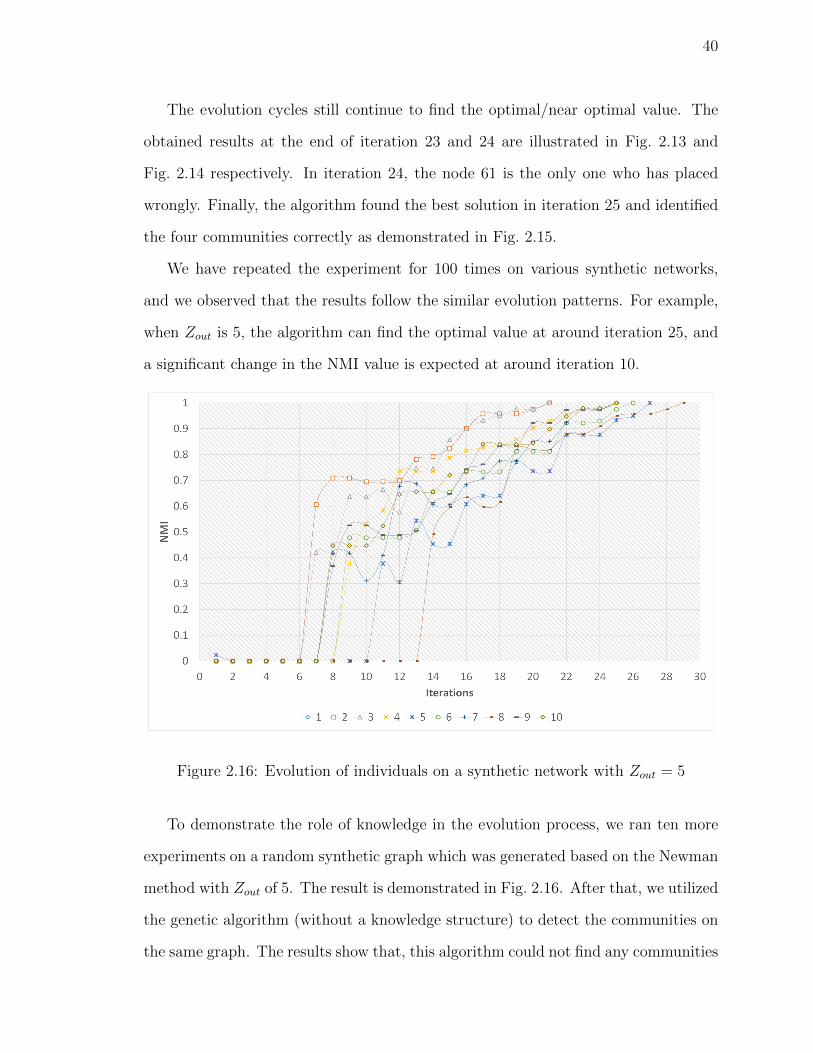
40
The evolution cycles still continue to find the optimal/near optimal value. The
obtained results at the end of iteration 23 and 24 are illustrated in Fig. 2.13 and
Fig. 2.14 respectively. In iteration 24, the node 61 is the only one who has placed
wrongly. Finally, the algorithm found the best solution in iteration 25 and identified
the four communities correctly as demonstrated in Fig. 2.15.
We have repeated the experiment for 100 times on various synthetic networks,
and we observed that the results follow the similar evolution patterns. For example,
when Zout is 5, the algorithm can find the optimal value at around iteration 25, and
a significant change in the NMI value is expected at around iteration 10.
Figure 2.16: Evolution of individuals on a synthetic network with Zout = 5
To demonstrate the role of knowledge in the evolution process, we ran ten more
experiments on a random synthetic graph which was generated based on the Newman
method with Zout of 5. The result is demonstrated in Fig. 2.16. After that, we utilized
the genetic algorithm (without a knowledge structure) to detect the communities on
the same graph. The results show that, this algorithm could not find any communities
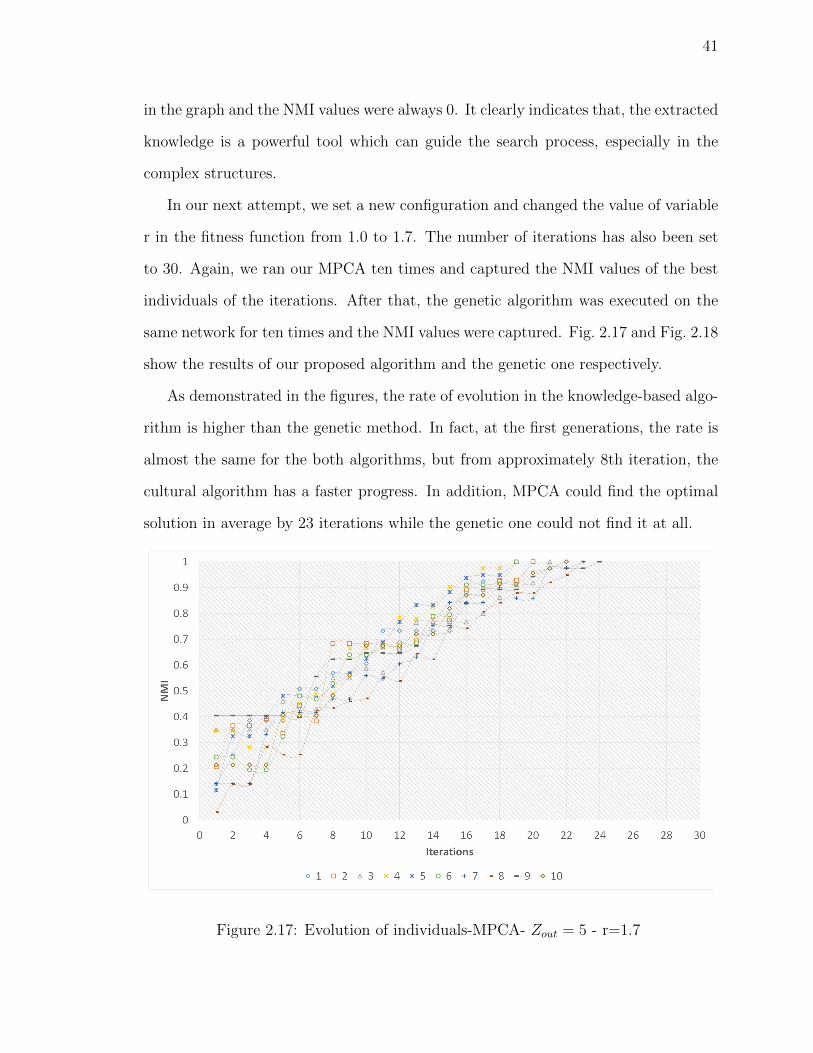
41
in the graph and the NMI values were always 0. It clearly indicates that, the extracted
knowledge is a powerful tool which can guide the search process, especially in the
complex structures.
In our next attempt, we set a new configuration and changed the value of variable
r in the fitness function from 1.0 to 1.7. The number of iterations has also been set
to 30. Again, we ran our MPCA ten times and captured the NMI values of the best
individuals of the iterations. After that, the genetic algorithm was executed on the
same network for ten times and the NMI values were captured. Fig. 2.17 and Fig. 2.18
show the results of our proposed algorithm and the genetic one respectively.
As demonstrated in the figures, the rate of evolution in the knowledge-based algo-
rithm is higher than the genetic method. In fact, at the first generations, the rate is
almost the same for the both algorithms, but from approximately 8th iteration, the
cultural algorithm has a faster progress. In addition, MPCA could find the optimal
solution in average by 23 iterations while the genetic one could not find it at all.
Figure 2.17: Evolution of individuals-MPCA- Zout = 5 - r=1.7
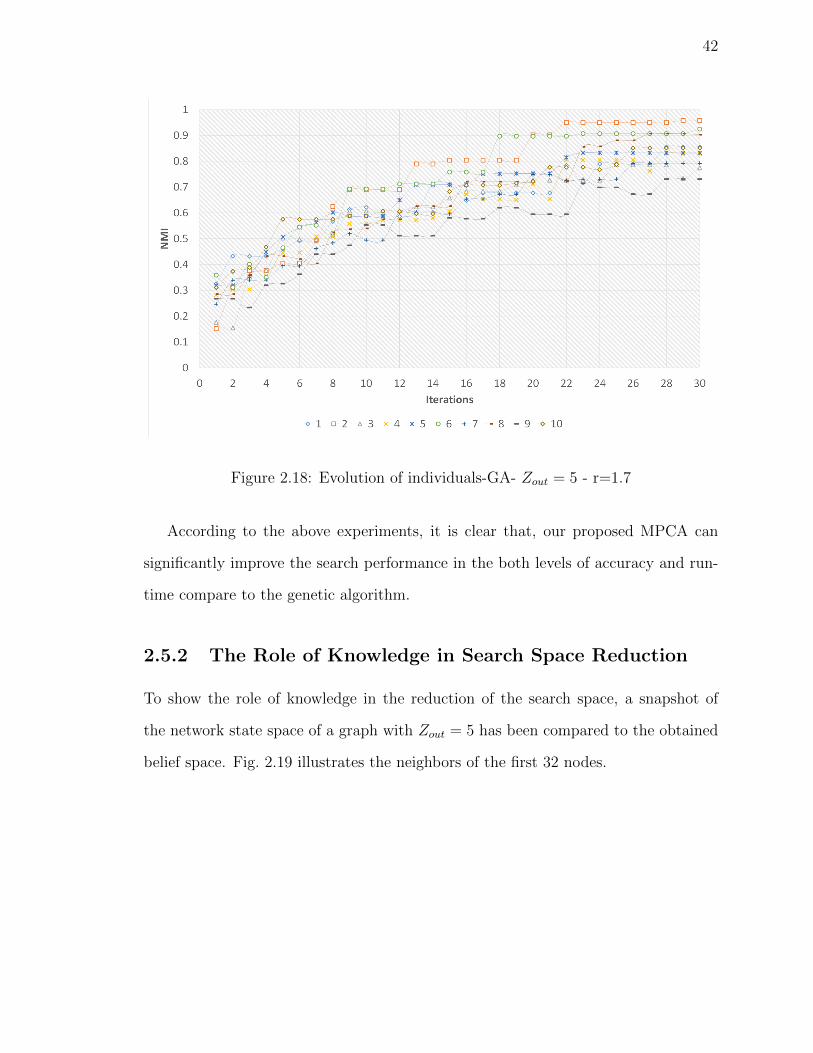
42
Figure 2.18: Evolution of individuals-GA- Zout = 5 - r=1.7
According to the above experiments, it is clear that, our proposed MPCA can
significantly improve the search performance in the both levels of accuracy and run-
time compare to the genetic algorithm.
2.5.2 The Role of Knowledge in Search Space Reduction
To show the role of knowledge in the reduction of the search space, a snapshot of
the network state space of a graph with Zout = 5 has been compared to the obtained
belief space. Fig. 2.19 illustrates the neighbors of the first 32 nodes.
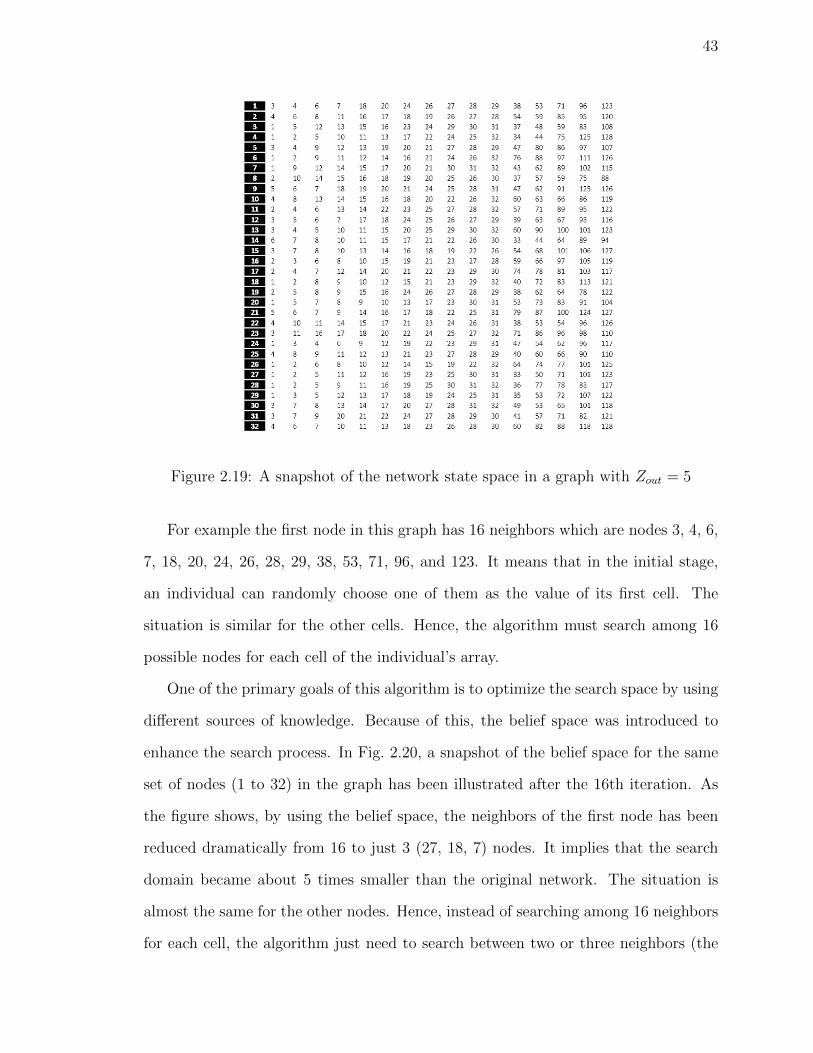
43
Figure 2.19: A snapshot of the network state space in a graph with Zout = 5
For example the first node in this graph has 16 neighbors which are nodes 3, 4, 6,
7, 18, 20, 24, 26, 28, 29, 38, 53, 71, 96, and 123. It means that in the initial stage,
an individual can randomly choose one of them as the value of its first cell. The
situation is similar for the other cells. Hence, the algorithm must search among 16
possible nodes for each cell of the individual’s array.
One of the primary goals of this algorithm is to optimize the search space by using
different sources of knowledge. Because of this, the belief space was introduced to
enhance the search process. In Fig. 2.20, a snapshot of the belief space for the same
set of nodes (1 to 32) in the graph has been illustrated after the 16th iteration. As
the figure shows, by using the belief space, the neighbors of the first node has been
reduced dramatically from 16 to just 3 (27, 18, 7) nodes. It implies that the search
domain became about 5 times smaller than the original network. The situation is
almost the same for the other nodes. Hence, instead of searching among 16 neighbors
for each cell, the algorithm just need to search between two or three neighbors (the
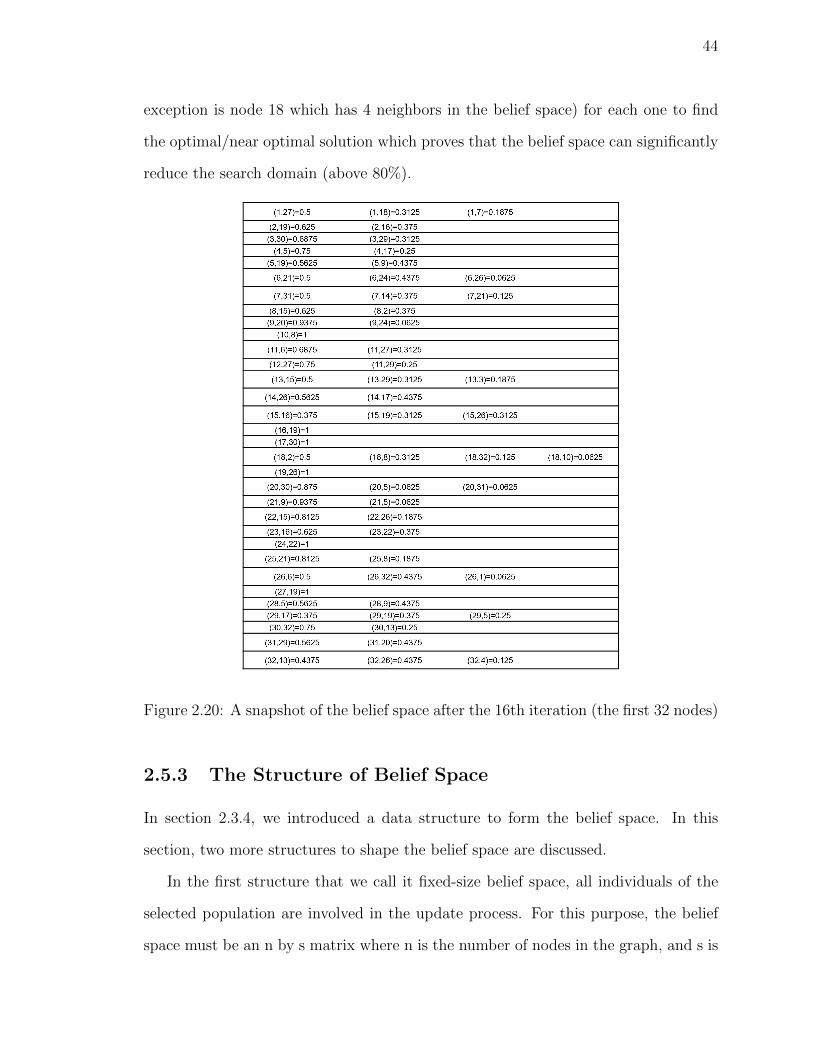
44
exception is node 18 which has 4 neighbors in the belief space) for each one to find
the optimal/near optimal solution which proves that the belief space can significantly
reduce the search domain (above 80%).
Figure 2.20: A snapshot of the belief space after the 16th iteration (the first 32 nodes)
2.5.3 The Structure of Belief Space
In section 2.3.4, we introduced a data structure to form the belief space. In this
section, two more structures to shape the belief space are discussed.
In the first structure that we call it fixed-size belief space, all individuals of the
selected population are involved in the update process. For this purpose, the belief
space must be an n by s matrix where n is the number of nodes in the graph, and s is
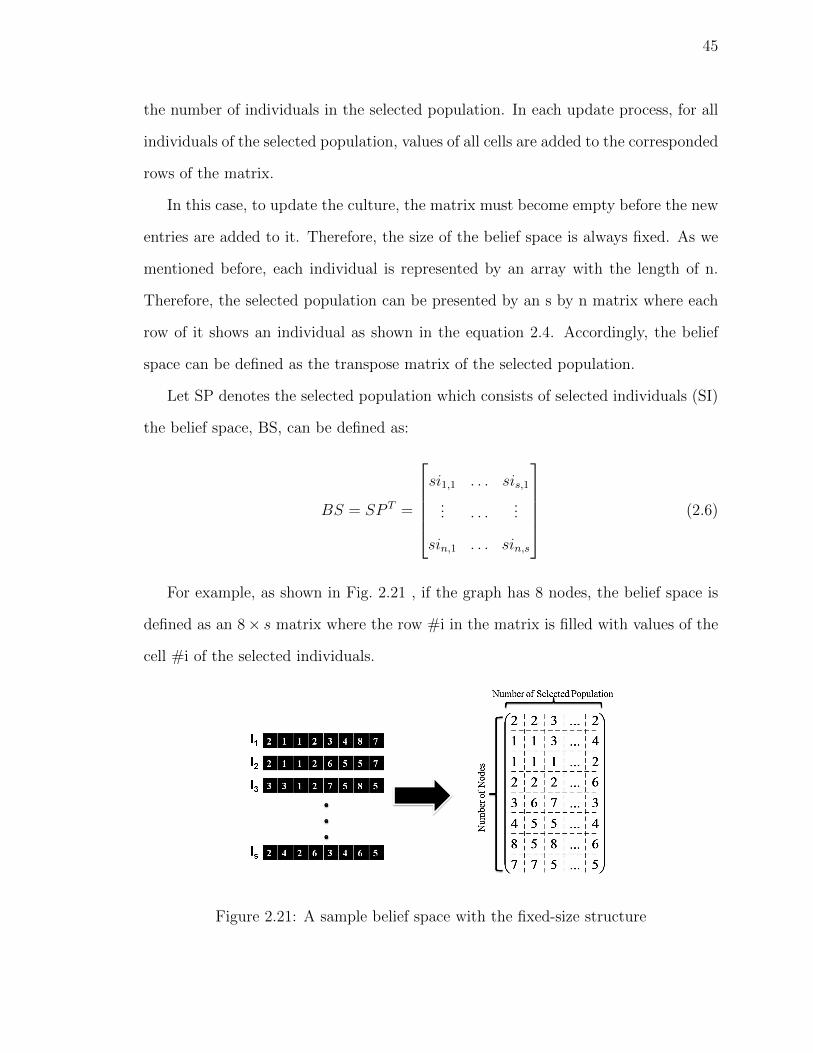
45
the number of individuals in the selected population. In each update process, for all
individuals of the selected population, values of all cells are added to the corresponded
rows of the matrix.
In this case, to update the culture, the matrix must become empty before the new
entries are added to it. Therefore, the size of the belief space is always fixed. As we
mentioned before, each individual is represented by an array with the length of n.
Therefore, the selected population can be presented by an s by n matrix where each
row of it shows an individual as shown in the equation 2.4. Accordingly, the belief
space can be defined as the transpose matrix of the selected population.
Let SP denotes the selected population which consists of selected individuals (SI)
the belief space, BS, can be defined as:
BS = SP T =
si1,1 . . . sis,1
... . . ....
sin,1 . . . sin,s
(2.6)
For example, as shown in Fig. 2.21 , if the graph has 8 nodes, the belief space is
defined as an 8× s matrix where the row #i in the matrix is filled with values of the
cell #i of the selected individuals.
Figure 2.21: A sample belief space with the fixed-size structure
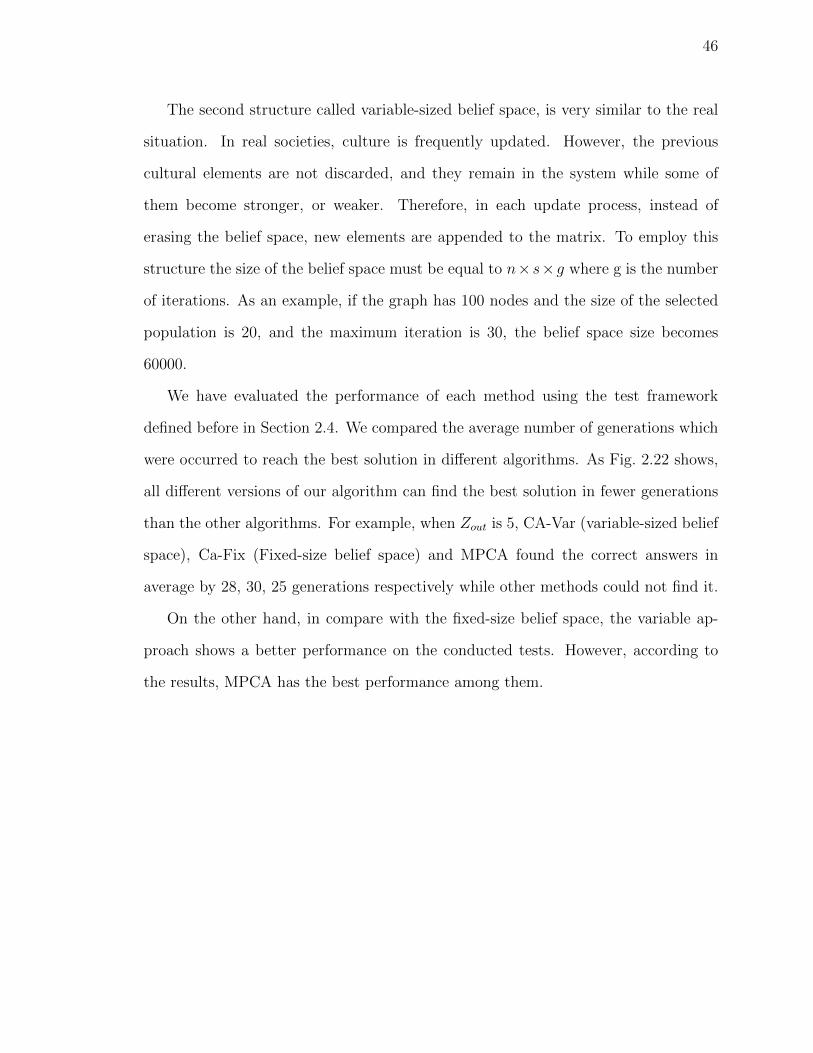
46
The second structure called variable-sized belief space, is very similar to the real
situation. In real societies, culture is frequently updated. However, the previous
cultural elements are not discarded, and they remain in the system while some of
them become stronger, or weaker. Therefore, in each update process, instead of
erasing the belief space, new elements are appended to the matrix. To employ this
structure the size of the belief space must be equal to n×s×g where g is the number
of iterations. As an example, if the graph has 100 nodes and the size of the selected
population is 20, and the maximum iteration is 30, the belief space size becomes
60000.
We have evaluated the performance of each method using the test framework
defined before in Section 2.4. We compared the average number of generations which
were occurred to reach the best solution in different algorithms. As Fig. 2.22 shows,
all different versions of our algorithm can find the best solution in fewer generations
than the other algorithms. For example, when Zout is 5, CA-Var (variable-sized belief
space), Ca-Fix (Fixed-size belief space) and MPCA found the correct answers in
average by 28, 30, 25 generations respectively while other methods could not find it.
On the other hand, in compare with the fixed-size belief space, the variable ap-
proach shows a better performance on the conducted tests. However, according to
the results, MPCA has the best performance among them.
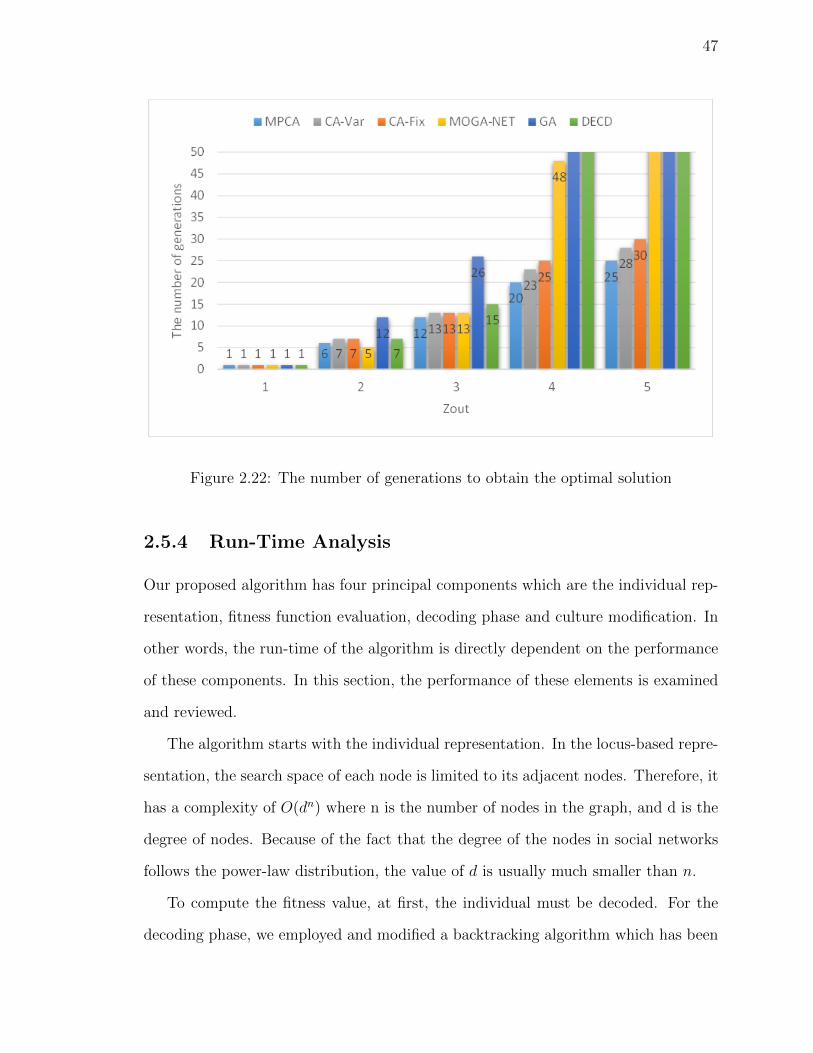
47
Figure 2.22: The number of generations to obtain the optimal solution
2.5.4 Run-Time Analysis
Our proposed algorithm has four principal components which are the individual rep-
resentation, fitness function evaluation, decoding phase and culture modification. In
other words, the run-time of the algorithm is directly dependent on the performance
of these components. In this section, the performance of these elements is examined
and reviewed.
The algorithm starts with the individual representation. In the locus-based repre-
sentation, the search space of each node is limited to its adjacent nodes. Therefore, it
has a complexity of O(dn) where n is the number of nodes in the graph, and d is the
degree of nodes. Because of the fact that the degree of the nodes in social networks
follows the power-law distribution, the value of d is usually much smaller than n.
To compute the fitness value, at first, the individual must be decoded. For the
decoding phase, we employed and modified a backtracking algorithm which has been

48
proposed in [22] and demonstrated in Algorithm. 4. This algorithm can decode a
given individual in a linear time with the complexity of O(n). Moreover, the fitness
function is the most critical and time-consuming component of this model which must
be run for all generated individuals and has the complexity of O(m) where m is the
number of edges in the network. In addition, the complexity of culture modification
is almost constant and ignorable.
Hence, the run time complexity of each iteration in our proposed algorithm is
O(m+n), where n is usually much smaller than m. For the whole algorithm, the time
complexity can be represented as O(gs(m+n)) where g is the number of iterations,
and s is the size of the population.
Algorithm 4 Decoding
1: procedure Decode(Individual)
2: n← size(I) . n = the number of nodes
3: Current community ← 1 . # of found community
4: Community assign(1 : n)← −1 . Initialize the array
5: for i← 1 to n do . Start the Loop
6: Ctr ← 1 . Community index
7: if Community assign(i) = −1 then . If this node does not have a
community
8: Community assign(i)← Current Community . Assign a
Community number to the node # i
9: Neighbor ← I(i) . The entry(i) from the Individual Array becomes
neighbor of node # i
10: Previous(Ctr)← i . Save the previous community index (used in
backtrack process)
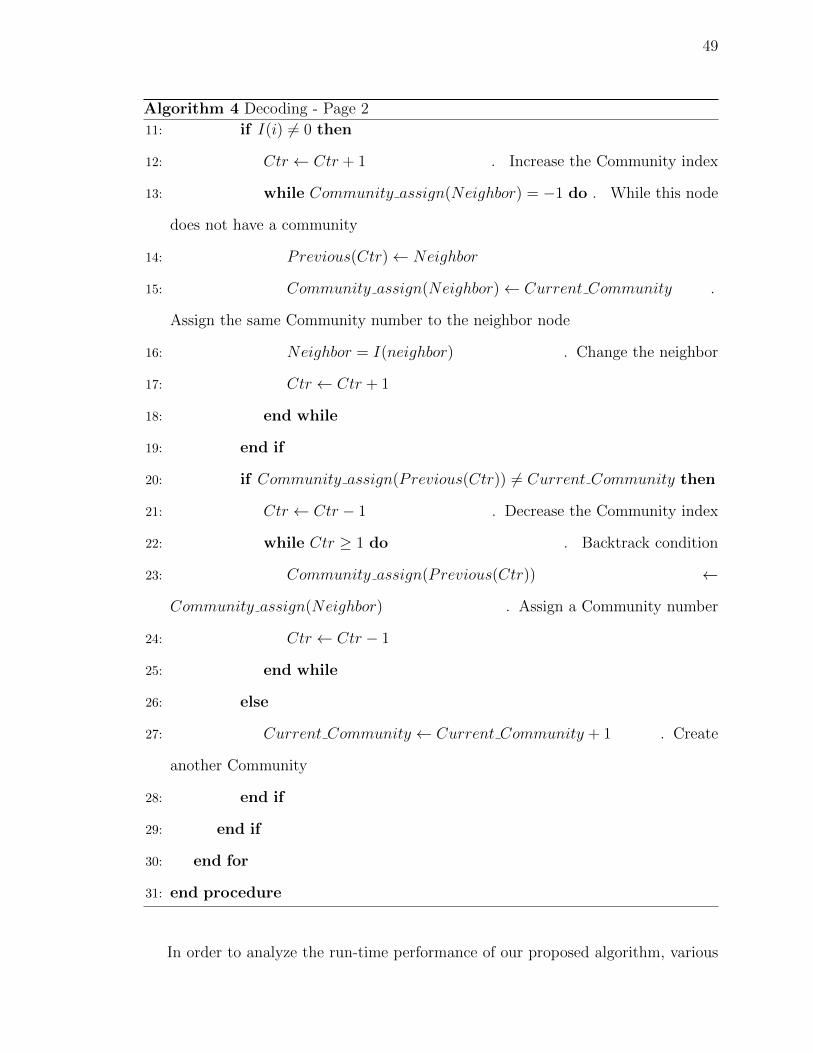
49
Algorithm 4 Decoding - Page 2
11: if I(i) 6= 0 then
12: Ctr ← Ctr + 1 . Increase the Community index
13: while Community assign(Neighbor) = −1 do . While this node
does not have a community
14: Previous(Ctr)← Neighbor
15: Community assign(Neighbor)← Current Community .
Assign the same Community number to the neighbor node
16: Neighbor = I(neighbor) . Change the neighbor
17: Ctr ← Ctr + 1
18: end while
19: end if
20: if Community assign(Previous(Ctr)) 6= Current Community then
21: Ctr ← Ctr − 1 . Decrease the Community index
22: while Ctr ≥ 1 do . Backtrack condition
23: Community assign(Previous(Ctr)) ←
Community assign(Neighbor) . Assign a Community number
24: Ctr ← Ctr − 1
25: end while
26: else
27: Current Community ← Current Community + 1 . Create
another Community
28: end if
29: end if
30: end for
31: end procedure
In order to analyze the run-time performance of our proposed algorithm, various
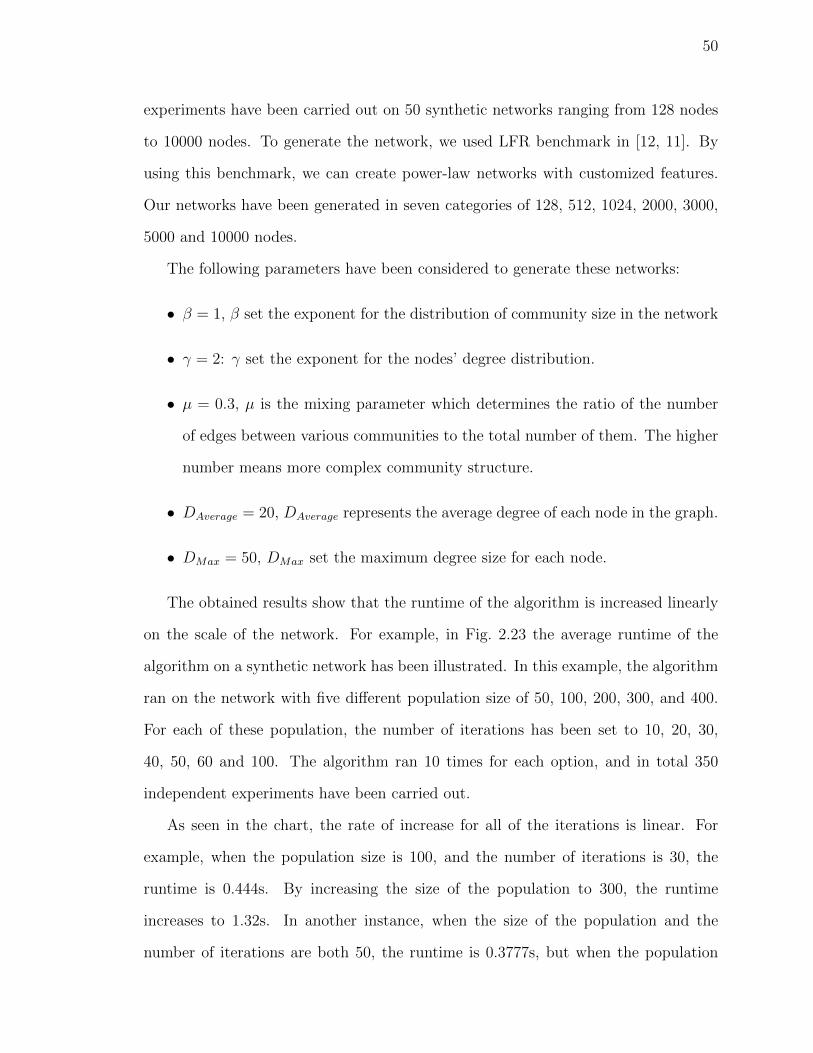
50
experiments have been carried out on 50 synthetic networks ranging from 128 nodes
to 10000 nodes. To generate the network, we used LFR benchmark in [12, 11]. By
using this benchmark, we can create power-law networks with customized features.
Our networks have been generated in seven categories of 128, 512, 1024, 2000, 3000,
5000 and 10000 nodes.
The following parameters have been considered to generate these networks:
• β = 1, β set the exponent for the distribution of community size in the network
• γ = 2: γ set the exponent for the nodes’ degree distribution.
• µ = 0.3, µ is the mixing parameter which determines the ratio of the number
of edges between various communities to the total number of them. The higher
number means more complex community structure.
• DAverage = 20, DAverage represents the average degree of each node in the graph.
• DMax = 50, DMax set the maximum degree size for each node.
The obtained results show that the runtime of the algorithm is increased linearly
on the scale of the network. For example, in Fig. 2.23 the average runtime of the
algorithm on a synthetic network has been illustrated. In this example, the algorithm
ran on the network with five different population size of 50, 100, 200, 300, and 400.
For each of these population, the number of iterations has been set to 10, 20, 30,
40, 50, 60 and 100. The algorithm ran 10 times for each option, and in total 350
independent experiments have been carried out.
As seen in the chart, the rate of increase for all of the iterations is linear. For
example, when the population size is 100, and the number of iterations is 30, the
runtime is 0.444s. By increasing the size of the population to 300, the runtime
increases to 1.32s. In another instance, when the size of the population and the
number of iterations are both 50, the runtime is 0.3777s, but when the population
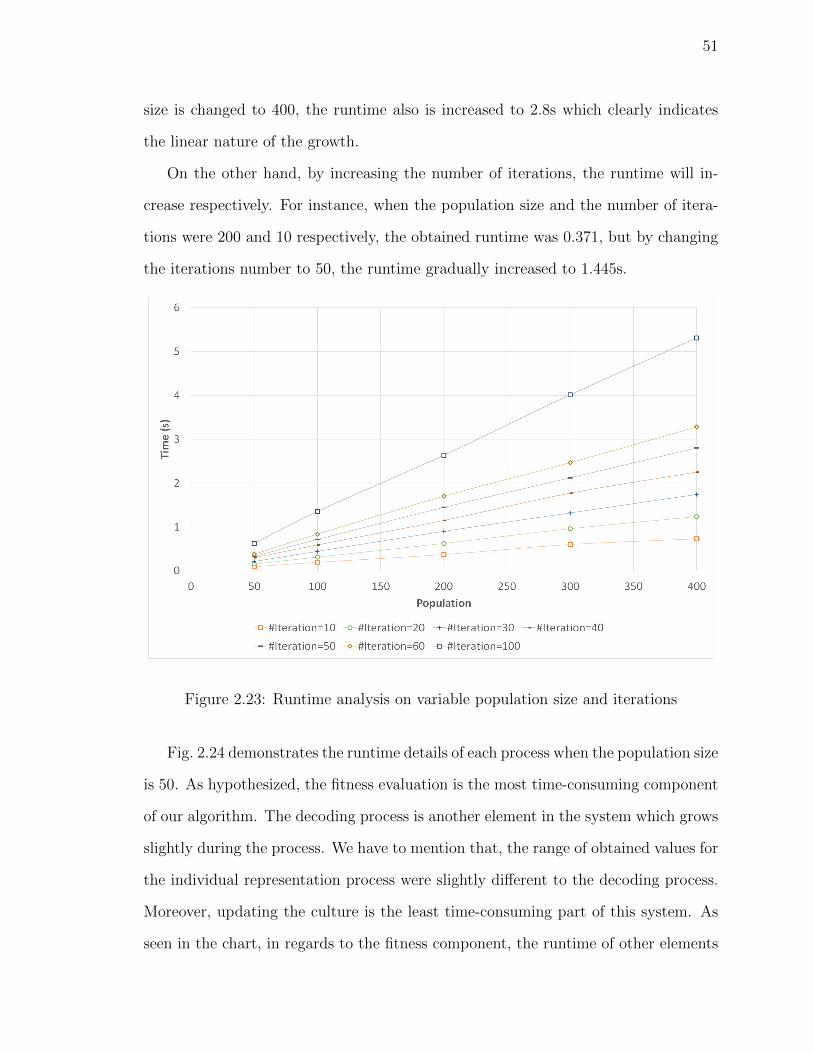
51
size is changed to 400, the runtime also is increased to 2.8s which clearly indicates
the linear nature of the growth.
On the other hand, by increasing the number of iterations, the runtime will in-
crease respectively. For instance, when the population size and the number of itera-
tions were 200 and 10 respectively, the obtained runtime was 0.371, but by changing
the iterations number to 50, the runtime gradually increased to 1.445s.
Figure 2.23: Runtime analysis on variable population size and iterations
Fig. 2.24 demonstrates the runtime details of each process when the population size
is 50. As hypothesized, the fitness evaluation is the most time-consuming component
of our algorithm. The decoding process is another element in the system which grows
slightly during the process. We have to mention that, the range of obtained values for
the individual representation process were slightly different to the decoding process.
Moreover, updating the culture is the least time-consuming part of this system. As
seen in the chart, in regards to the fitness component, the runtime of other elements
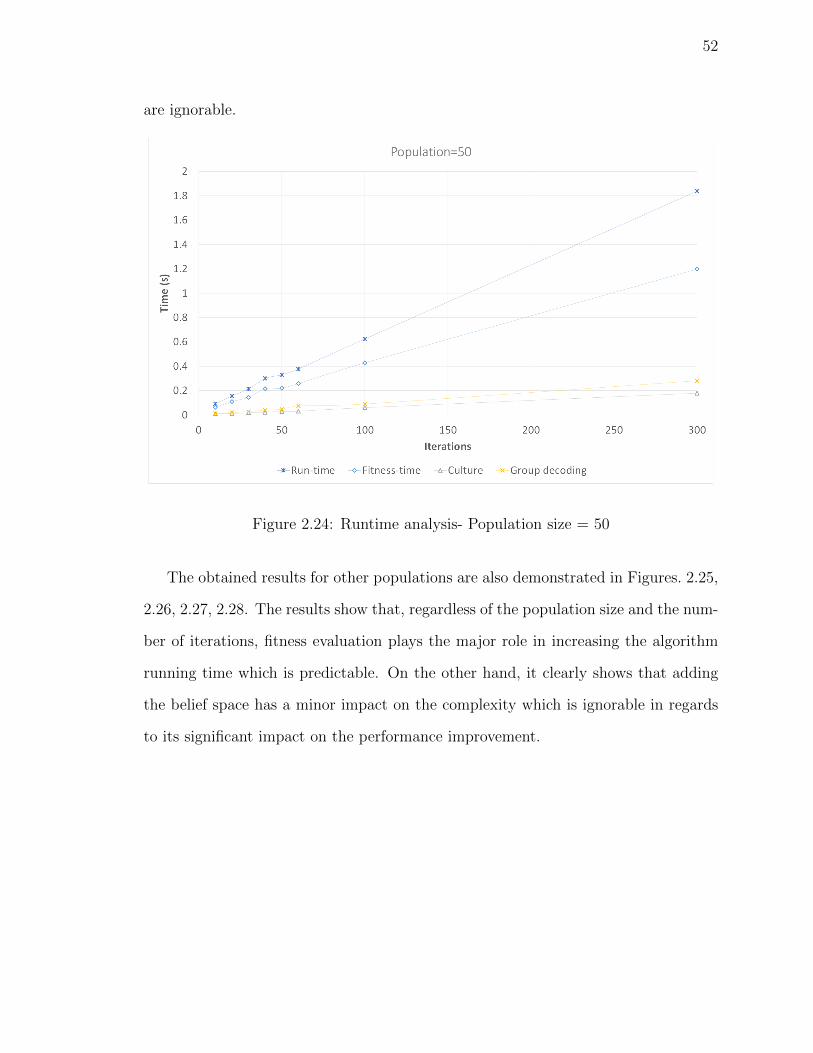
52
are ignorable.
Figure 2.24: Runtime analysis- Population size = 50
The obtained results for other populations are also demonstrated in Figures. 2.25,
2.26, 2.27, 2.28. The results show that, regardless of the population size and the num-
ber of iterations, fitness evaluation plays the major role in increasing the algorithm
running time which is predictable. On the other hand, it clearly shows that adding
the belief space has a minor impact on the complexity which is ignorable in regards
to its significant impact on the performance improvement.
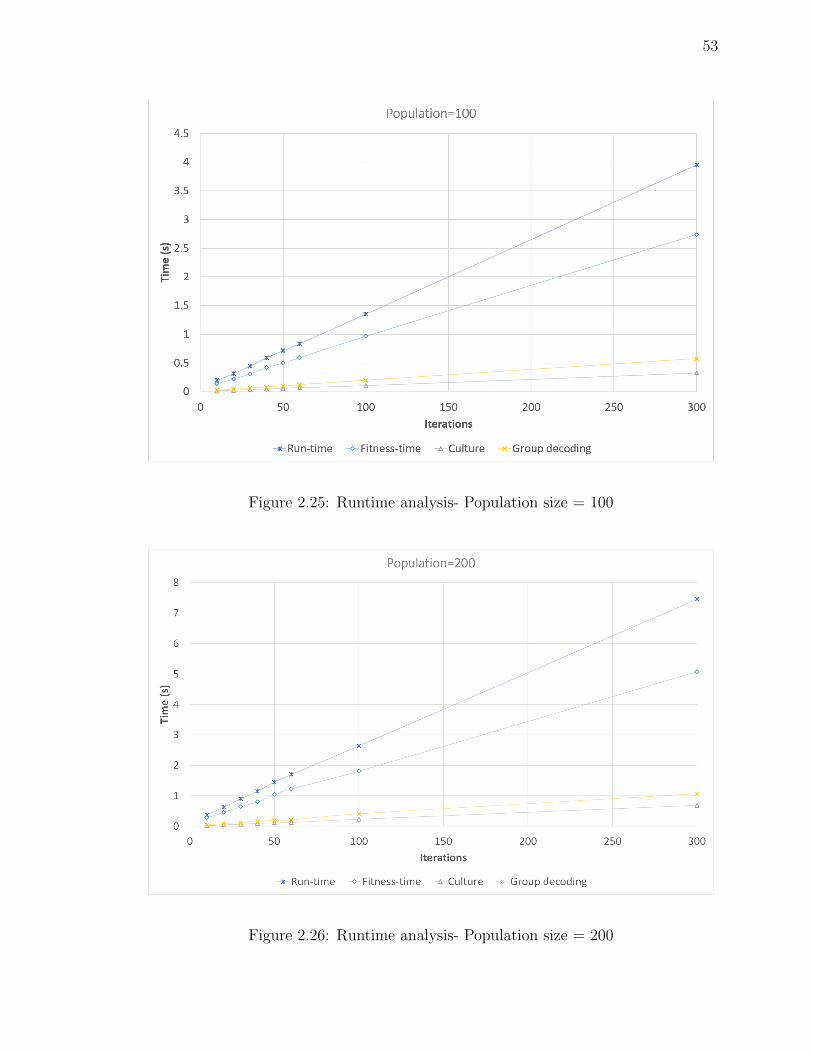
53
Figure 2.25: Runtime analysis- Population size = 100
Figure 2.26: Runtime analysis- Population size = 200
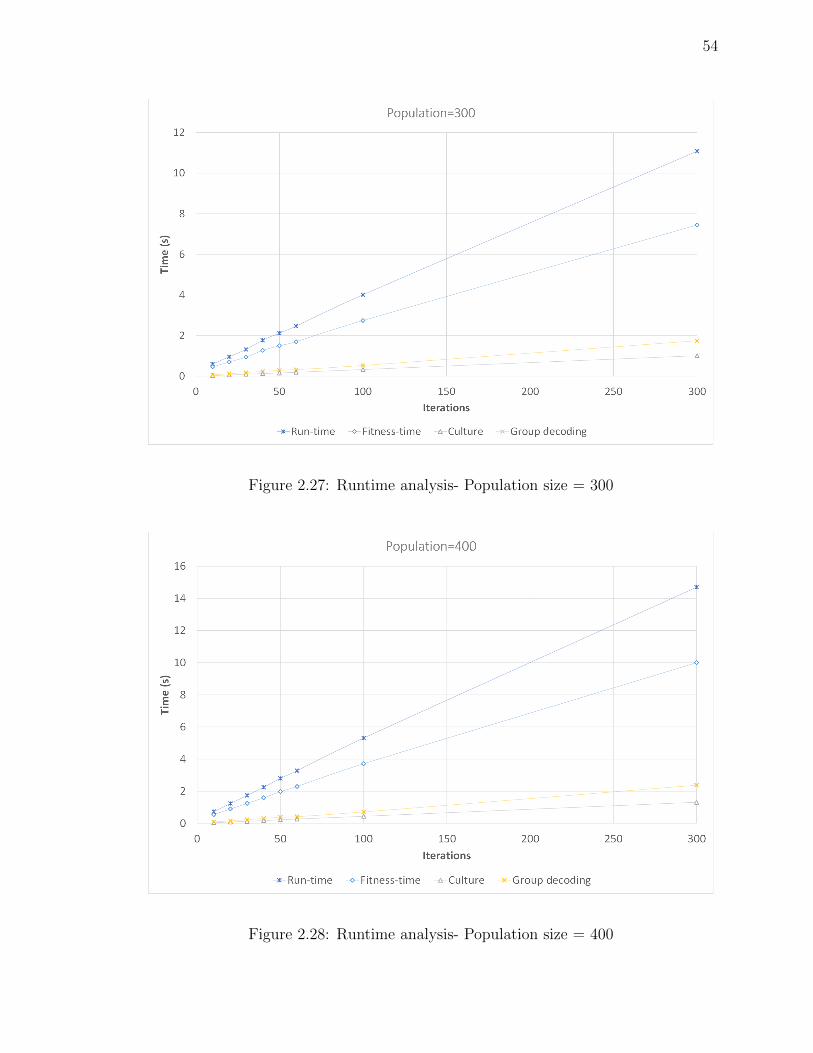
54
Figure 2.27: Runtime analysis- Population size = 300
Figure 2.28: Runtime analysis- Population size = 400
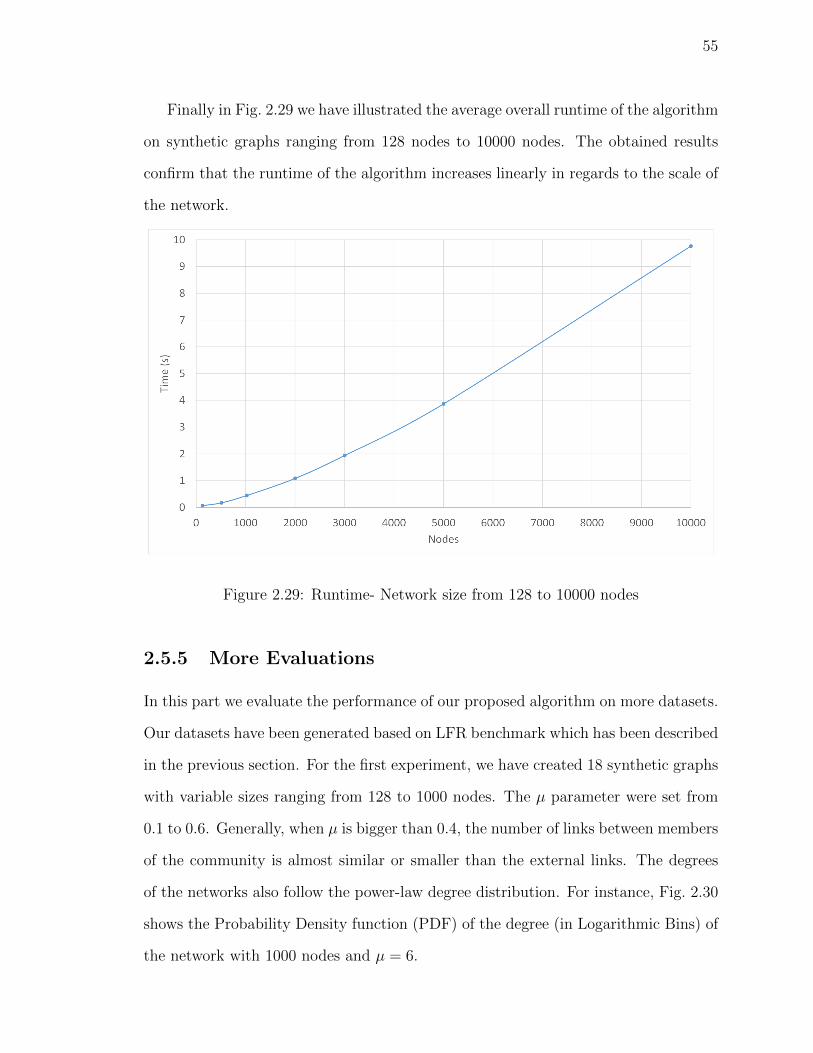
55
Finally in Fig. 2.29 we have illustrated the average overall runtime of the algorithm
on synthetic graphs ranging from 128 nodes to 10000 nodes. The obtained results
confirm that the runtime of the algorithm increases linearly in regards to the scale of
the network.
Figure 2.29: Runtime- Network size from 128 to 10000 nodes
2.5.5 More Evaluations
In this part we evaluate the performance of our proposed algorithm on more datasets.
Our datasets have been generated based on LFR benchmark which has been described
in the previous section. For the first experiment, we have created 18 synthetic graphs
with variable sizes ranging from 128 to 1000 nodes. The µ parameter were set from
0.1 to 0.6. Generally, when µ is bigger than 0.4, the number of links between members
of the community is almost similar or smaller than the external links. The degrees
of the networks also follow the power-law degree distribution. For instance, Fig. 2.30
shows the Probability Density function (PDF) of the degree (in Logarithmic Bins) of
the network with 1000 nodes and µ = 6.
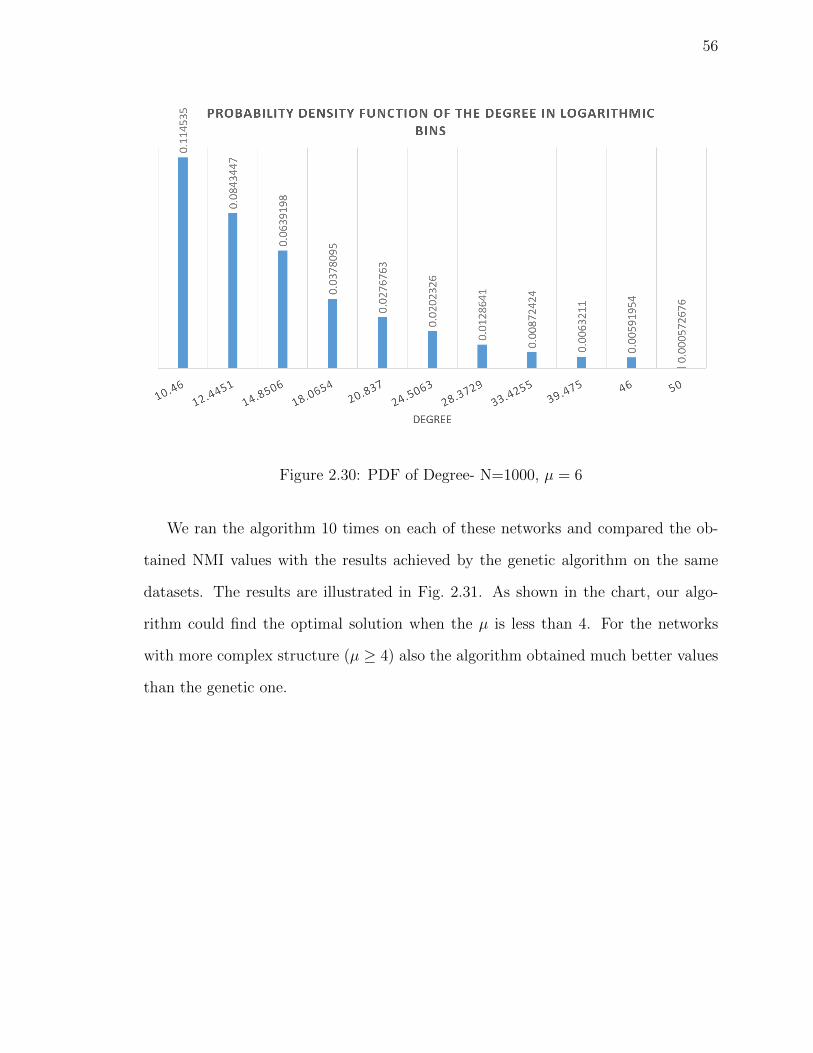
56
Figure 2.30: PDF of Degree- N=1000, µ = 6
We ran the algorithm 10 times on each of these networks and compared the ob-
tained NMI values with the results achieved by the genetic algorithm on the same
datasets. The results are illustrated in Fig. 2.31. As shown in the chart, our algo-
rithm could find the optimal solution when the µ is less than 4. For the networks
with more complex structure (µ ≥ 4) also the algorithm obtained much better values
than the genetic one.
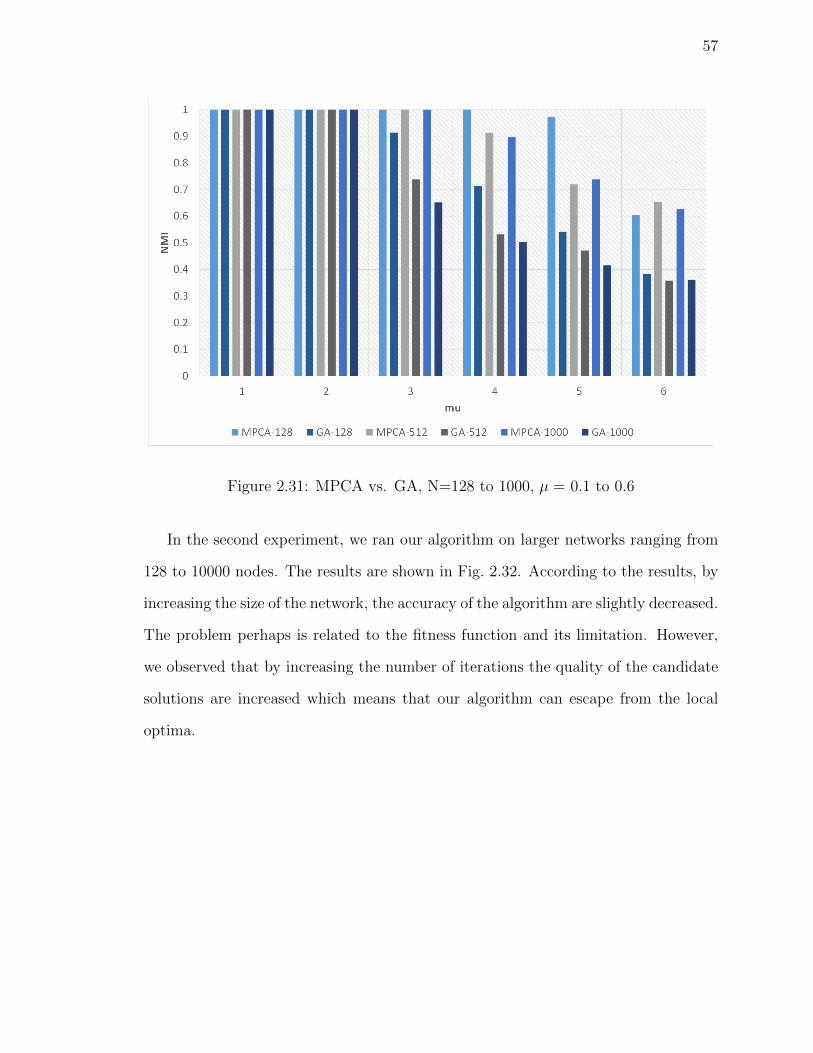
57
Figure 2.31: MPCA vs. GA, N=128 to 1000, µ = 0.1 to 0.6
In the second experiment, we ran our algorithm on larger networks ranging from
128 to 10000 nodes. The results are shown in Fig. 2.32. According to the results, by
increasing the size of the network, the accuracy of the algorithm are slightly decreased.
The problem perhaps is related to the fitness function and its limitation. However,
we observed that by increasing the number of iterations the quality of the candidate
solutions are increased which means that our algorithm can escape from the local
optima.

58
Figure 2.32: MPCA- N=128 to 10000
In another experiment, we have collected some data from Twitter on 4th of Nov.
2015 at 3:00 PM. Based on our extracted data, we identified the following list which
represents the 10 top trend concepts at that time in Canada.
• #PM23
• #NationalStressAwarenessDay
• Minister
• Jody Wilson-Raybould
• Catherine McKenna’
• #KidsToWork
• #EveryEntrepreneur
• #BeyondMarketing
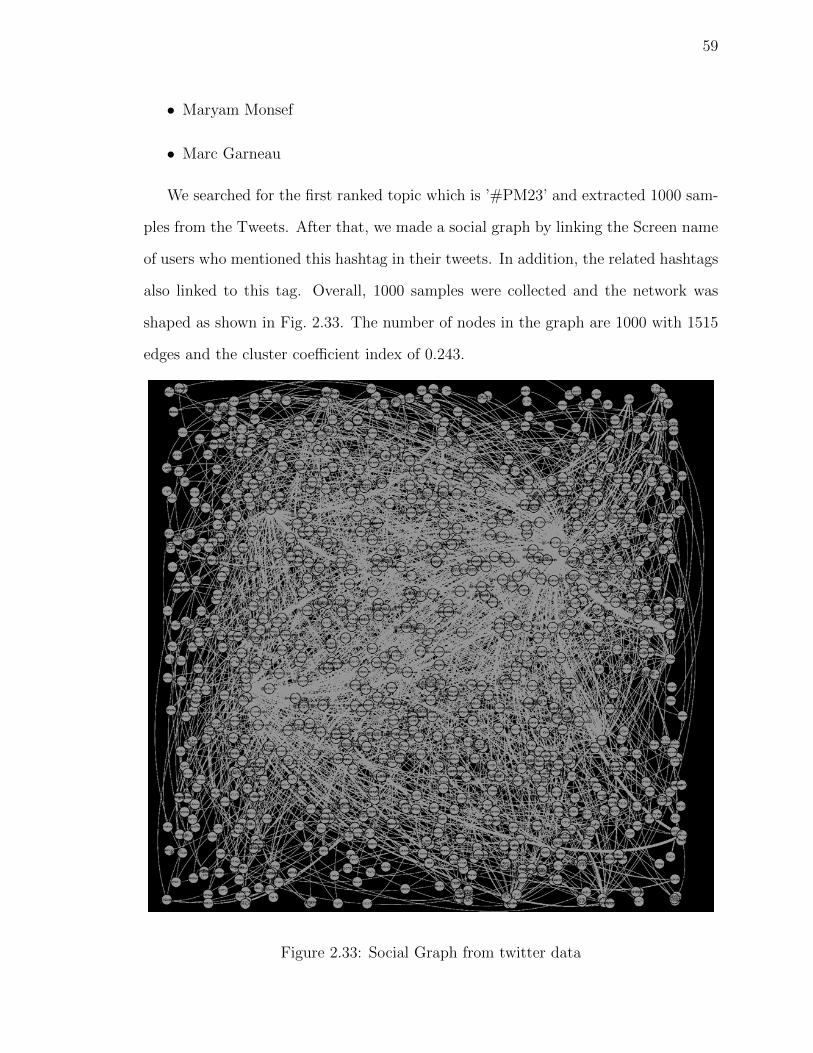
59
• Maryam Monsef
• Marc Garneau
We searched for the first ranked topic which is ’#PM23’ and extracted 1000 sam-
ples from the Tweets. After that, we made a social graph by linking the Screen name
of users who mentioned this hashtag in their tweets. In addition, the related hashtags
also linked to this tag. Overall, 1000 samples were collected and the network was
shaped as shown in Fig. 2.33. The number of nodes in the graph are 1000 with 1515
edges and the cluster coefficient index of 0.243.
Figure 2.33: Social Graph from twitter data
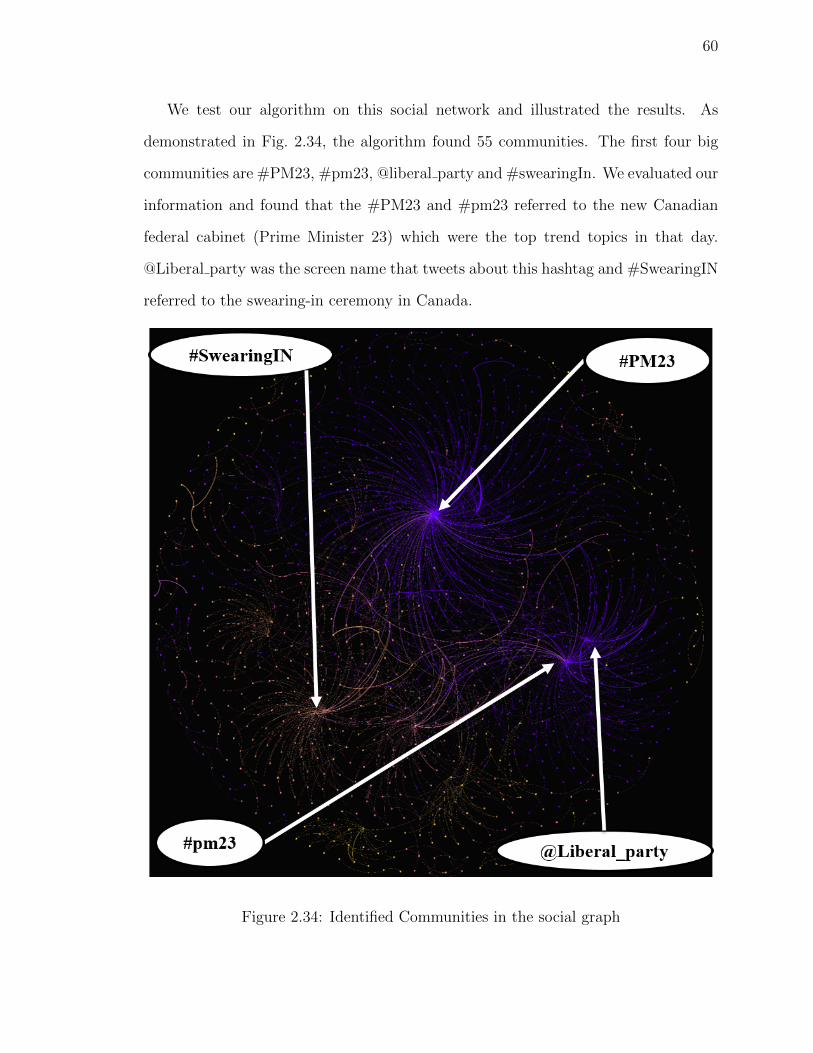
60
We test our algorithm on this social network and illustrated the results. As
demonstrated in Fig. 2.34, the algorithm found 55 communities. The first four big
communities are #PM23, #pm23, @liberal party and #swearingIn. We evaluated our
information and found that the #PM23 and #pm23 referred to the new Canadian
federal cabinet (Prime Minister 23) which were the top trend topics in that day.
@Liberal party was the screen name that tweets about this hashtag and #SwearingIN
referred to the swearing-in ceremony in Canada.
Figure 2.34: Identified Communities in the social graph
61
2.5.6 Conclusion
In this chapter, we have extensively reviewed the problem of community detection in
social networks. We also introduced a novel multi-population cultural algorithm to
deal with the problem. The core of the algorithm is belief space which determines
the range of the feasible solutions and guides the search direction towards finding the
optimal/near optimal solution during the search process.
The performance, runtime, scalability and accuracy of the proposed model have
been examined thoroughly on real-life and synthetic networks. The synthetic net-
works were generated in variable sizes based on Newman and LFR benchmarks. The
results show that the proposed algorithm can find the real communities with a high
accuracy even when the graph has a very complex and dense structure. Meanwhile,
in comparison with other well-known evolutionary approaches in the field, it achieved
much better results in fewer evolution cycles. The functionality of our algorithm was
also demonstrated on the real-life data extracted from Twitter.
In addition, a comprehensive study has been performed to shed light on the role of
knowledge in the evolution process. The obtained results confirm that the extracted
knowledge can significantly enhance the process in both levels of accuracy and pro-
cessing time. In fact, the search space can be reduced dramatically by 80% as a result
of using our approach. The runtime analysis also shows that adding the belief space
has few impact on the overall complexity of the algorithm. Moreover, in compare to
the genetic method, the algorithm has better performance in all the experiments.
On the other hand, we proposed two more structures to shape the belief space. A
study has been carried out to compare the performance of these proposed structures.
According to the results, the probability based matrix has the better performance in
comparison to the other methods.

62
In summary, the major contributions of our proposed approach can be listed as fol-
lows:
• Introduce a unique method to define, extract, and represent Normative and
Domain knowledge sources from a snapshot of the network to determine the
range of the optimal solution.
• Introduce a novel data structure based on a probability matrix to store the
normative knowledge.
• Introduce a method for utilizing the extracted knowledge to guide the search
direction.
63
References
[1] Babak Amiri, Liaquat Hossain, and John W Crawford. An efficient multiobjec-
tive evolutionary algorithm for community detection in social networks. In 2011
IEEE Congress of Evolutionary Computation (CEC), pages 2193–2199. IEEE,
2011.
[2] Guoqiang Chen, Yuping Wang, and Jingxuan Wei. A new multiobjective evolu-
tionary algorithm for community detection in dynamic complex networks. Math-
ematical problems in engineering, 2013, 2013.
[3] Andries P Engelbrecht. Computational intelligence: an introduction. John Wiley
& Sons, 2007.
[4] Francesco Folino and Clara Pizzuti. An evolutionary multiobjective approach for
community discovery in dynamic networks. IEEE Transactions on Knowledge
and Data Engineering, 26(8):1838–1852, 2014.
[5] Michelle Girvan and Mark EJ Newman. Community structure in social and bio-
logical networks. Proceedings of the national academy of sciences, 99(12):7821–
7826, 2002.
[6] Mao-Guo Gong, Ling-Jun Zhang, Jing-Jing Ma, and Li-Cheng Jiao. Community
detection in dynamic social networks based on multiobjective immune algorithm.
Journal of Computer Science and Technology, 27(3):455–467, 2012.
64
[7] Guanbo Jia, Zixing Cai, Mirco Musolesi, Yong Wang, Dan A Tennant, Ralf JM
Weber, John K Heath, and Shan He. Community detection in social and biolog-
ical networks using differential evolution. In Learning and Intelligent Optimiza-
tion, pages 71–85. Springer, 2012.
[8] Jin Kim, Inwook Hwang, Yong-Hyuk Kim, and Byung-Ro Moon. Genetic ap-
proaches for graph partitioning: a survey. In Proceedings of the 13th annual con-
ference on Genetic and evolutionary computation, pages 473–480. ACM, 2011.
[9] Keehyung Kim, Robert Ian McKay, and Byung-Ro Moon. Multiobjective evolu-
tionary algorithms for dynamic social network clustering. In Proceedings of the
12th annual conference on Genetic and evolutionary computation, pages 1179–
1186. ACM, 2010.
[10] Ziad Kobti et al. Heterogeneous multi-population cultural algorithm. In 2013
IEEE Congress on Evolutionary Computation, pages 292–299. IEEE, 2013.
[11] Andrea Lancichinetti and Santo Fortunato. Community detection algorithms: a
comparative analysis. Physical review E, 80(5):056117, 2009.
[12] Andrea Lancichinetti, Santo Fortunato, and Filippo Radicchi. Benchmark graphs
for testing community detection algorithms. Physical review E, 78(4):046110,
2008.
[13] Yu-Ru Lin, Yun Chi, Shenghuo Zhu, Hari Sundaram, and Belle L Tseng.
Facetnet: a framework for analyzing communities and their evolutions in dy-
namic networks. In Proceedings of the 17th international conference on World
Wide Web, pages 685–694. ACM, 2008.
[14] Fa-Sheng Liu and Yan-Rong Luo. Community structure discovery in complex
networks based on multi-population genetic algorithm. Jisuanji Yingyong Yan-
jiu, 29(4):1237–1240, 2012.
65
[15] Jingjing Ma, Jie Liu, Wenping Ma, Maoguo Gong, and Licheng Jiao.
Decomposition-based multiobjective evolutionary algorithm for community de-
tection in dynamic social networks. The Scientific World Journal, 2014, 2014.
[16] Mark EJ Newman and Michelle Girvan. Finding and evaluating community
structure in networks. Physical review E, 69(2):026113, 2004.
[17] YoungJa Park and ManSuk Song. A genetic algorithm for clustering problems.
In Proceedings of the third annual conference on genetic programming, pages
568–575, 1998.
[18] Clara Pizzuti. Ga-net: A genetic algorithm for community detection in social
networks. In International Conference on Parallel Problem Solving from Nature,
pages 1081–1090. Springer, 2008.
[19] Clara Pizzuti. A multiobjective genetic algorithm to find communities in com-
plex networks. IEEE Transactions on Evolutionary Computation, 16(3):418–430,
2012.
[20] Jiangtao Qiu and Zhangxi Lin. D-hocs: an algorithm for discovering the hierar-
chical overlapping community structure of a social network. Journal of Intelligent
Information Systems, 42(3):353–370, 2014.
[21] Robert G Reynolds. An introduction to cultural algorithms. In Proceedings of the
third annual conference on evolutionary programming, volume 131139. Singapore,
1994.
[22] Chuan Shi, Yi Wang, Bin Wu, and Cha Zhong. A new genetic algorithm for
community detection. In International Conference on Complex Sciences, pages
1298–1309. Springer, 2009.

66
[23] Wayne W Zachary. An information flow model for conflict and fission in small
groups. Journal of anthropological research, pages 452–473, 1977.
[24] Pooya Moradian Zadeh and Ziad Kobti. Community detection in social networks
by cultural algorithm. In Collaboration Technologies and Systems (CTS), 2015
International Conference on, pages 319–325. IEEE, 2015.
67
Chapter 3
Population Adaptation in Social
Networks based on Knowledge
Migration
Social networks can be analyzed from different aspects- micro and macro. If we
assume that the main asset of each network is its population and the key difference
between populations is their knowledge, then it is the knowledge that drives the
evolution of any network.
In this chapter, the behavior and status of a network will be analyzed in a case
where a population from one network migrates to another similar network and trans-
fers its knowledge to it. In fact, we are going to find how a migrated population will
adapt itself to a new environment with similar characteristics based on the knowledge
that it has learned from the previous network and what is the role of this prior knowl-
edge in its evolution. For this purpose, different scenarios are modeled by employing
a cultural algorithm with various networks and populations on two different cases: a
population with migrated knowledge and a population without it.
68
The results clearly show that when the changes in the structure of networks are
less than 25%, trained population can adapt itself with the new network very fast but
when the difference is higher, in the best case they perform like a random population
without any training.
As the case study of this research is community detection in social networks,
the obtained results confirm that our proposed community detection algorithm can
adapt itself very fast to the various snapshots of dynamic systems if the topological
difference between two consecutive snapshots of the network is less than 15%. It can
lead to a remarkable reduction in the search time and space throughout the dynamic
social network analysis.
3.1 Introduction
Social networks can be defined as collaborative, open and diverse environments which
consist of associated entities. Due to their interactive nature, information and knowl-
edge can be shared among all of their members which can be used to accelerate their
evolution process. In a general view, a network consists of two essential layers- struc-
ture and content. These two layers are directly under the influence of each other and
co-evolve themselves [18, 1, 5, 6]. The structure usually consists of members of the
network and their relations. On the other hand, the content layer typically contains
information which is transmitted between the network members. In some types of
networks, members of the network just transmit data from one point to another, such
as computer networks. In some other networks, members of the network not only
transmit the information but also generate and produce the content. Consequently,
the network member can be considered as the source of information. Examples could
be found in networks such as social networks and the Web. In general terms, knowl-
edge and information are the driving engines which guide the evolution of this type
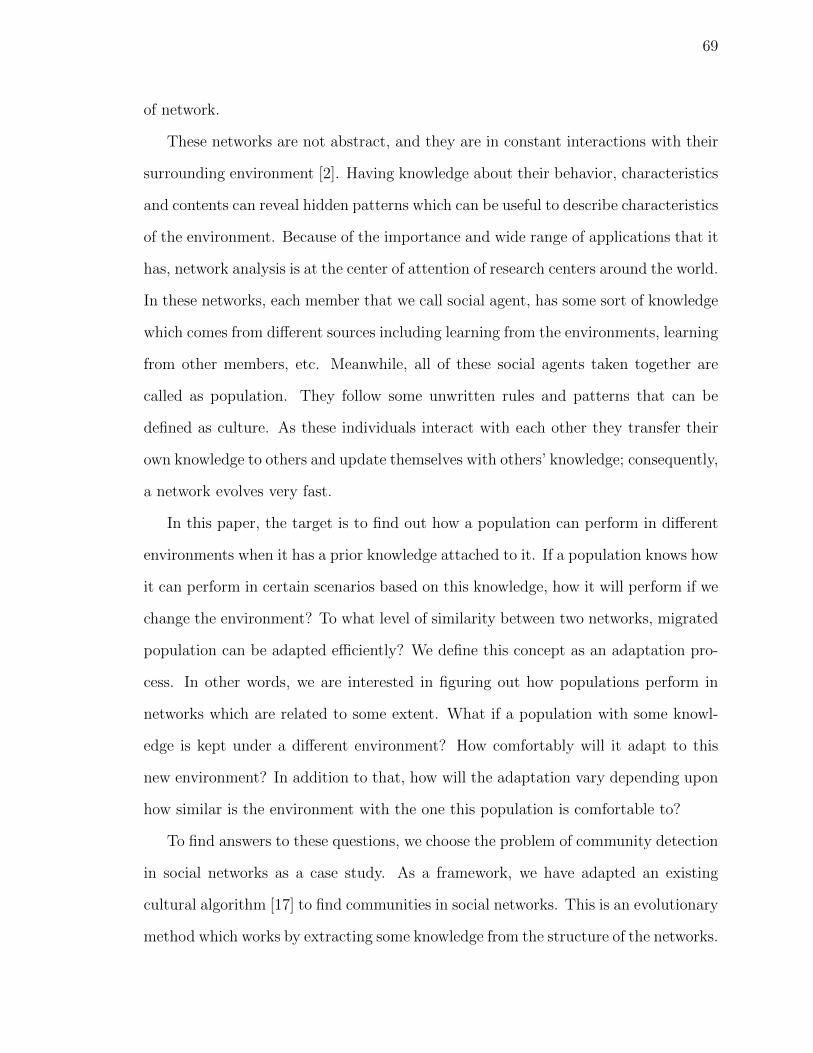
69
of network.
These networks are not abstract, and they are in constant interactions with their
surrounding environment [2]. Having knowledge about their behavior, characteristics
and contents can reveal hidden patterns which can be useful to describe characteristics
of the environment. Because of the importance and wide range of applications that it
has, network analysis is at the center of attention of research centers around the world.
In these networks, each member that we call social agent, has some sort of knowledge
which comes from different sources including learning from the environments, learning
from other members, etc. Meanwhile, all of these social agents taken together are
called as population. They follow some unwritten rules and patterns that can be
defined as culture. As these individuals interact with each other they transfer their
own knowledge to others and update themselves with others’ knowledge; consequently,
a network evolves very fast.
In this paper, the target is to find out how a population can perform in different
environments when it has a prior knowledge attached to it. If a population knows how
it can perform in certain scenarios based on this knowledge, how it will perform if we
change the environment? To what level of similarity between two networks, migrated
population can be adapted efficiently? We define this concept as an adaptation pro-
cess. In other words, we are interested in figuring out how populations perform in
networks which are related to some extent. What if a population with some knowl-
edge is kept under a different environment? How comfortably will it adapt to this
new environment? In addition to that, how will the adaptation vary depending upon
how similar is the environment with the one this population is comfortable to?
To find answers to these questions, we choose the problem of community detection
in social networks as a case study. As a framework, we have adapted an existing
cultural algorithm [17] to find communities in social networks. This is an evolutionary
method which works by extracting some knowledge from the structure of the networks.
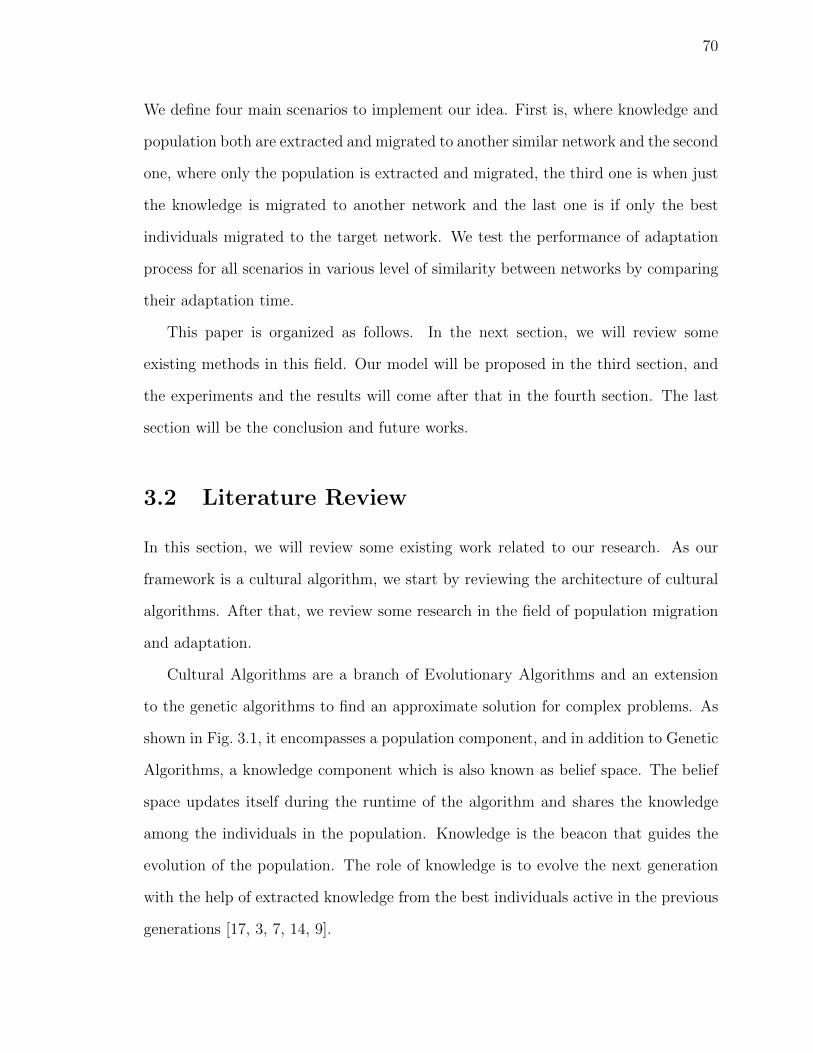
70
We define four main scenarios to implement our idea. First is, where knowledge and
population both are extracted and migrated to another similar network and the second
one, where only the population is extracted and migrated, the third one is when just
the knowledge is migrated to another network and the last one is if only the best
individuals migrated to the target network. We test the performance of adaptation
process for all scenarios in various level of similarity between networks by comparing
their adaptation time.
This paper is organized as follows. In the next section, we will review some
existing methods in this field. Our model will be proposed in the third section, and
the experiments and the results will come after that in the fourth section. The last
section will be the conclusion and future works.
3.2 Literature Review
In this section, we will review some existing work related to our research. As our
framework is a cultural algorithm, we start by reviewing the architecture of cultural
algorithms. After that, we review some research in the field of population migration
and adaptation.
Cultural Algorithms are a branch of Evolutionary Algorithms and an extension
to the genetic algorithms to find an approximate solution for complex problems. As
shown in Fig. 3.1, it encompasses a population component, and in addition to Genetic
Algorithms, a knowledge component which is also known as belief space. The belief
space updates itself during the runtime of the algorithm and shares the knowledge
among the individuals in the population. Knowledge is the beacon that guides the
evolution of the population. The role of knowledge is to evolve the next generation
with the help of extracted knowledge from the best individuals active in the previous
generations [17, 3, 7, 14, 9].
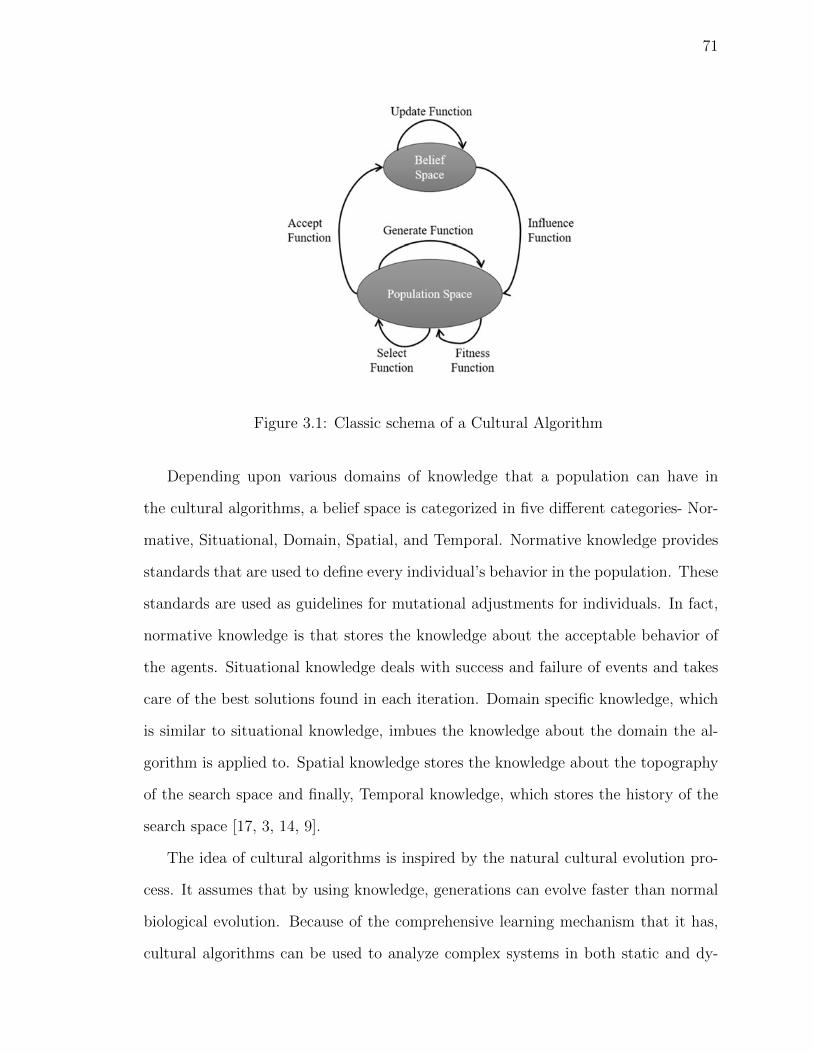
71
Figure 3.1: Classic schema of a Cultural Algorithm
Depending upon various domains of knowledge that a population can have in
the cultural algorithms, a belief space is categorized in five different categories- Nor-
mative, Situational, Domain, Spatial, and Temporal. Normative knowledge provides
standards that are used to define every individual’s behavior in the population. These
standards are used as guidelines for mutational adjustments for individuals. In fact,
normative knowledge is that stores the knowledge about the acceptable behavior of
the agents. Situational knowledge deals with success and failure of events and takes
care of the best solutions found in each iteration. Domain specific knowledge, which
is similar to situational knowledge, imbues the knowledge about the domain the al-
gorithm is applied to. Spatial knowledge stores the knowledge about the topography
of the search space and finally, Temporal knowledge, which stores the history of the
search space [17, 3, 14, 9].
The idea of cultural algorithms is inspired by the natural cultural evolution pro-
cess. It assumes that by using knowledge, generations can evolve faster than normal
biological evolution. Because of the comprehensive learning mechanism that it has,
cultural algorithms can be used to analyze complex systems in both static and dy-
72
namic environments [17, 3, 14]. The dual-inheritance feature of Cultural Algorithms
allows the system to both learn and adapt the best features of any population. A
belief space stores the knowledge it gains during the runtime of a cultural algorithm.
This updated belief space then influences the next population generation process.
This next generated population, in return, updates the belief space with the help of
best individuals. Furthermore, a fitness function is used to evaluate each individual’s
performance [17, 3, 7, 14, 9].
Like most of the evolutionary algorithms, the cultural algorithm process starts by
generating a random population. The quality of generated individuals is evaluated
by the fitness function in the next step, and the group of them that have higher
fitness values are selected to be candidates for updating the belief space. Based on
the problem, some criteria may be set by the accept function which is used to give
permission to some of the selected individuals to update the belief space. In the next
step, the knowledge is extracted from the individuals and the update function revises
the belief space based on them. After that, the new generation of the population is
generated based on the rules which are defined in the influence function. The process
continues until the predefined stop criteria is met by the algorithm [17, 3, 7, 14, 9].
To decrease the processing time and increase the efficiency in multi-agent systems
recent work has been done on Multi-Population Cultural algorithms (MPCA) which
are an extension to the Cultural Algorithms [17, 7, 9, 8, 10]. As shown in Fig. 3.2, in
MPCA, a population is divided into many sub-populations, and each one of them is
assigned a global belief space common to all of them [17, 9].
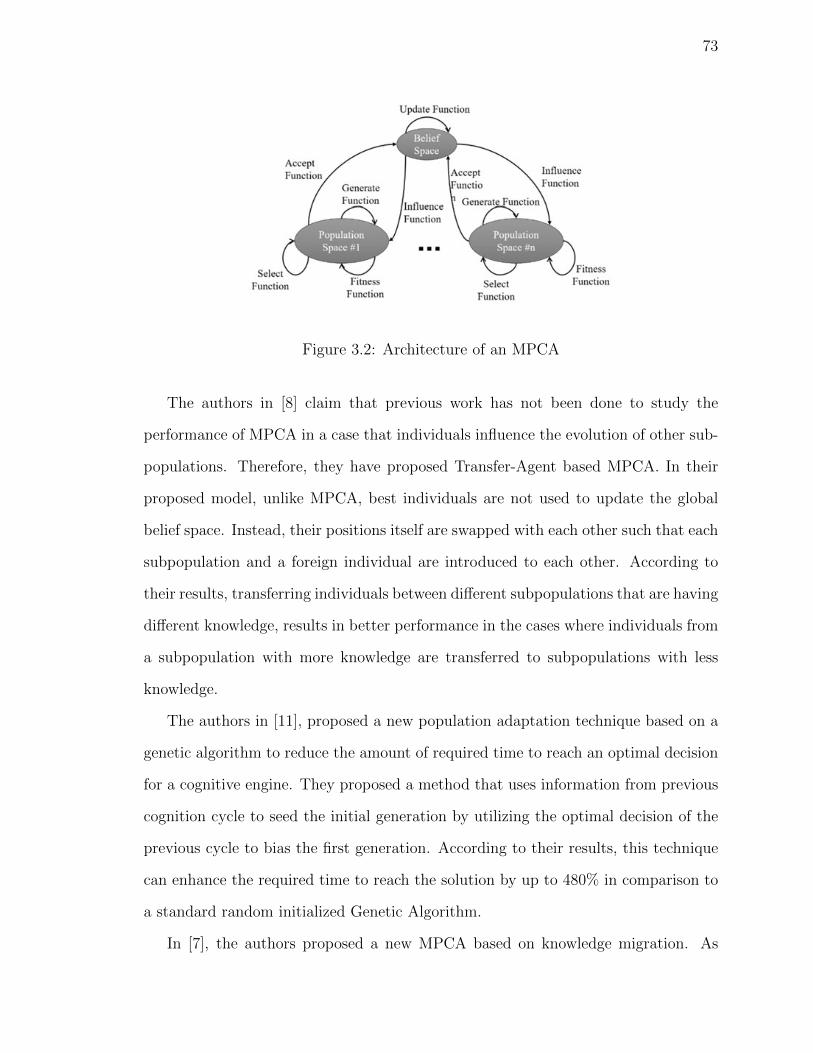
73
Figure 3.2: Architecture of an MPCA
The authors in [8] claim that previous work has not been done to study the
performance of MPCA in a case that individuals influence the evolution of other sub-
populations. Therefore, they have proposed Transfer-Agent based MPCA. In their
proposed model, unlike MPCA, best individuals are not used to update the global
belief space. Instead, their positions itself are swapped with each other such that each
subpopulation and a foreign individual are introduced to each other. According to
their results, transferring individuals between different subpopulations that are having
different knowledge, results in better performance in the cases where individuals from
a subpopulation with more knowledge are transferred to subpopulations with less
knowledge.
The authors in [11], proposed a new population adaptation technique based on a
genetic algorithm to reduce the amount of required time to reach an optimal decision
for a cognitive engine. They proposed a method that uses information from previous
cognition cycle to seed the initial generation by utilizing the optimal decision of the
previous cycle to bias the first generation. According to their results, this technique
can enhance the required time to reach the solution by up to 480% in comparison to
a standard random initialized Genetic Algorithm.
In [7], the authors proposed a new MPCA based on knowledge migration. As
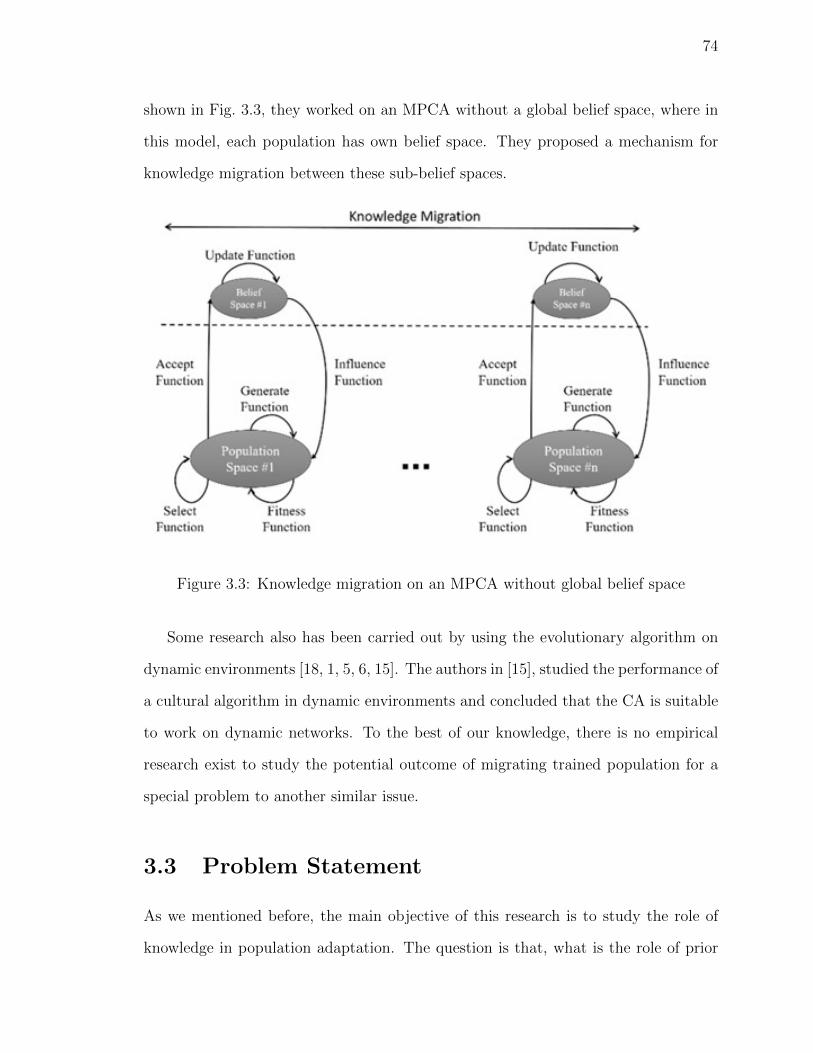
74
shown in Fig. 3.3, they worked on an MPCA without a global belief space, where in
this model, each population has own belief space. They proposed a mechanism for
knowledge migration between these sub-belief spaces.
Figure 3.3: Knowledge migration on an MPCA without global belief space
Some research also has been carried out by using the evolutionary algorithm on
dynamic environments [18, 1, 5, 6, 15]. The authors in [15], studied the performance of
a cultural algorithm in dynamic environments and concluded that the CA is suitable
to work on dynamic networks. To the best of our knowledge, there is no empirical
research exist to study the potential outcome of migrating trained population for a
special problem to another similar issue.
3.3 Problem Statement
As we mentioned before, the main objective of this research is to study the role of
knowledge in population adaptation. The question is that, what is the role of prior
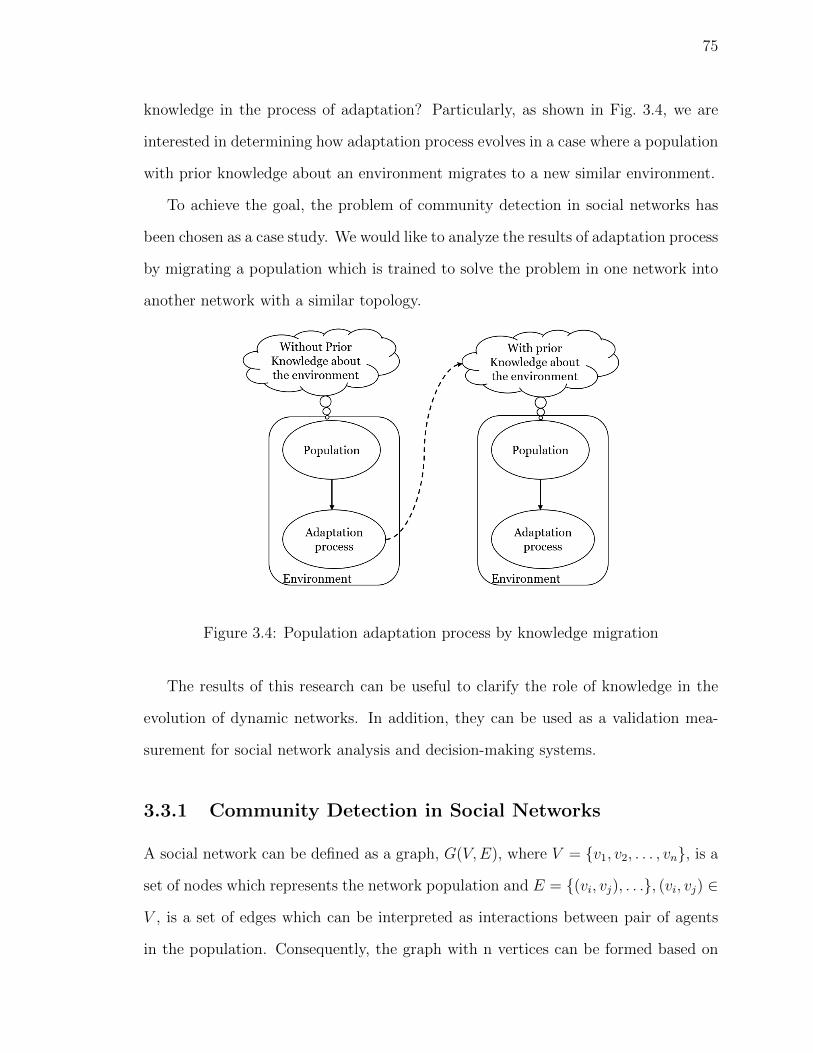
75
knowledge in the process of adaptation? Particularly, as shown in Fig. 3.4, we are
interested in determining how adaptation process evolves in a case where a population
with prior knowledge about an environment migrates to a new similar environment.
To achieve the goal, the problem of community detection in social networks has
been chosen as a case study. We would like to analyze the results of adaptation process
by migrating a population which is trained to solve the problem in one network into
another network with a similar topology.
Figure 3.4: Population adaptation process by knowledge migration
The results of this research can be useful to clarify the role of knowledge in the
evolution of dynamic networks. In addition, they can be used as a validation mea-
surement for social network analysis and decision-making systems.
3.3.1 Community Detection in Social Networks
A social network can be defined as a graph, G(V,E), where V = {v1, v2, . . . , vn}, is a
set of nodes which represents the network population and E = {(vi, vj), . . .}, (vi, vj) ∈
V , is a set of edges which can be interpreted as interactions between pair of agents
in the population. Consequently, the graph with n vertices can be formed based on
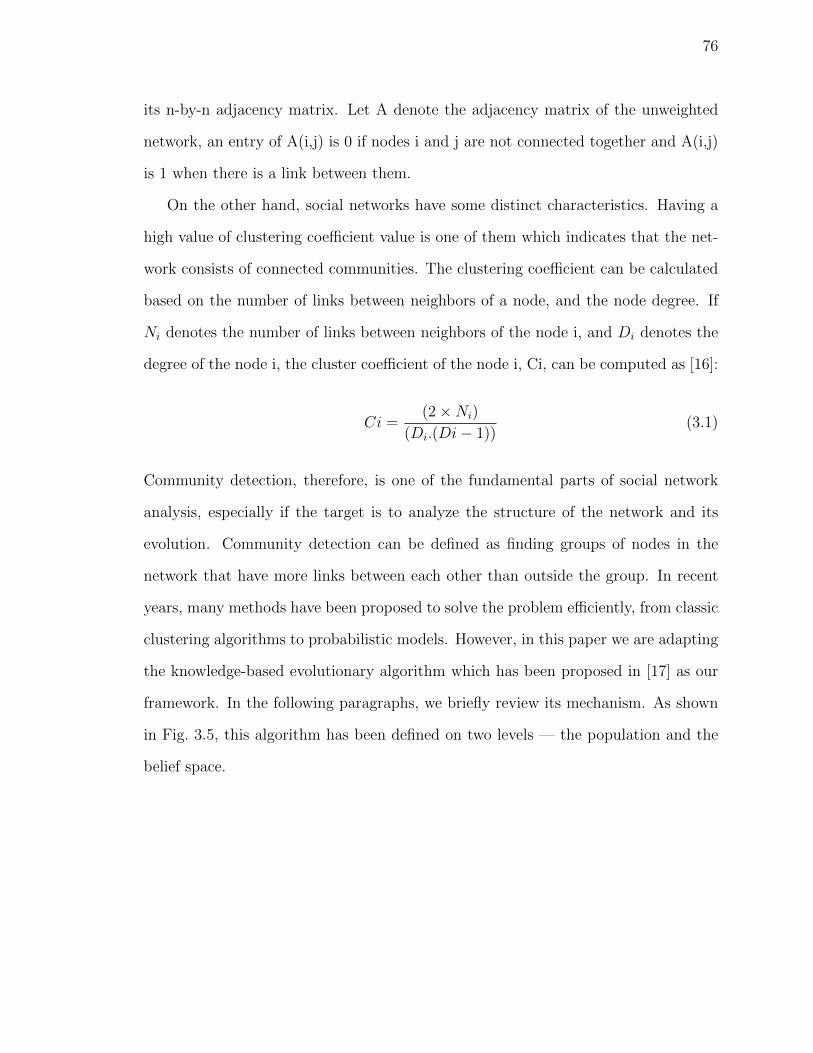
76
its n-by-n adjacency matrix. Let A denote the adjacency matrix of the unweighted
network, an entry of A(i,j) is 0 if nodes i and j are not connected together and A(i,j)
is 1 when there is a link between them.
On the other hand, social networks have some distinct characteristics. Having a
high value of clustering coefficient value is one of them which indicates that the net-
work consists of connected communities. The clustering coefficient can be calculated
based on the number of links between neighbors of a node, and the node degree. If
Ni denotes the number of links between neighbors of the node i, and Di denotes the
degree of the node i, the cluster coefficient of the node i, Ci, can be computed as [16]:
Ci =(2×Ni)
(Di.(Di− 1))(3.1)
Community detection, therefore, is one of the fundamental parts of social network
analysis, especially if the target is to analyze the structure of the network and its
evolution. Community detection can be defined as finding groups of nodes in the
network that have more links between each other than outside the group. In recent
years, many methods have been proposed to solve the problem efficiently, from classic
clustering algorithms to probabilistic models. However, in this paper we are adapting
the knowledge-based evolutionary algorithm which has been proposed in [17] as our
framework. In the following paragraphs, we briefly review its mechanism. As shown
in Fig. 3.5, this algorithm has been defined on two levels — the population and the
belief space.
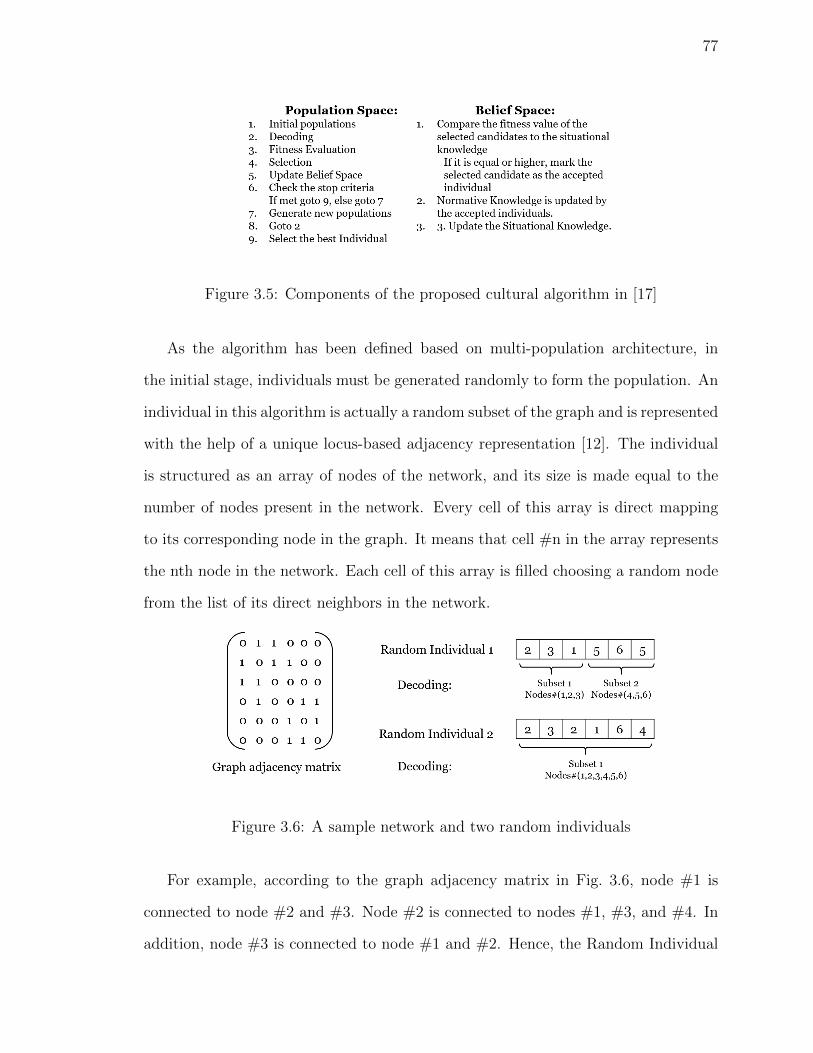
77
Figure 3.5: Components of the proposed cultural algorithm in [17]
As the algorithm has been defined based on multi-population architecture, in
the initial stage, individuals must be generated randomly to form the population. An
individual in this algorithm is actually a random subset of the graph and is represented
with the help of a unique locus-based adjacency representation [12]. The individual
is structured as an array of nodes of the network, and its size is made equal to the
number of nodes present in the network. Every cell of this array is direct mapping
to its corresponding node in the graph. It means that cell #n in the array represents
the nth node in the network. Each cell of this array is filled choosing a random node
from the list of its direct neighbors in the network.
Figure 3.6: A sample network and two random individuals
For example, according to the graph adjacency matrix in Fig. 3.6, node #1 is
connected to node #2 and #3. Node #2 is connected to nodes #1, #3, and #4. In
addition, node #3 is connected to node #1 and #2. Hence, the Random Individual
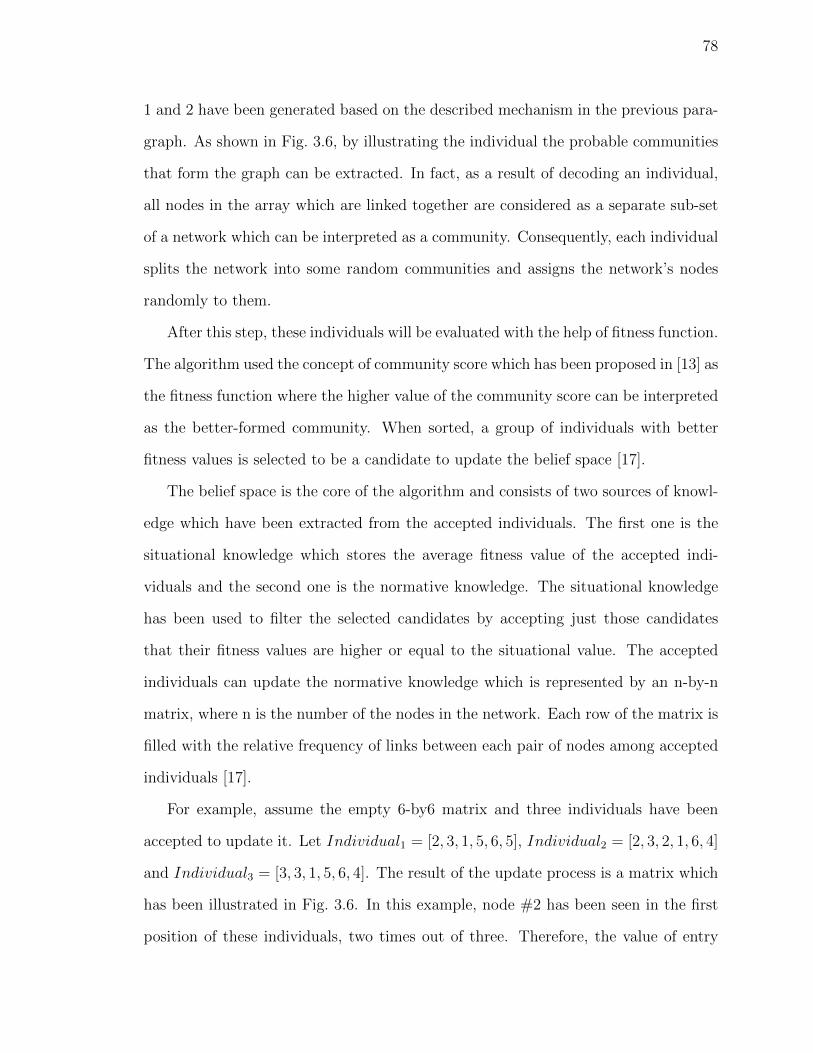
78
1 and 2 have been generated based on the described mechanism in the previous para-
graph. As shown in Fig. 3.6, by illustrating the individual the probable communities
that form the graph can be extracted. In fact, as a result of decoding an individual,
all nodes in the array which are linked together are considered as a separate sub-set
of a network which can be interpreted as a community. Consequently, each individual
splits the network into some random communities and assigns the network’s nodes
randomly to them.
After this step, these individuals will be evaluated with the help of fitness function.
The algorithm used the concept of community score which has been proposed in [13] as
the fitness function where the higher value of the community score can be interpreted
as the better-formed community. When sorted, a group of individuals with better
fitness values is selected to be a candidate to update the belief space [17].
The belief space is the core of the algorithm and consists of two sources of knowl-
edge which have been extracted from the accepted individuals. The first one is the
situational knowledge which stores the average fitness value of the accepted indi-
viduals and the second one is the normative knowledge. The situational knowledge
has been used to filter the selected candidates by accepting just those candidates
that their fitness values are higher or equal to the situational value. The accepted
individuals can update the normative knowledge which is represented by an n-by-n
matrix, where n is the number of the nodes in the network. Each row of the matrix is
filled with the relative frequency of links between each pair of nodes among accepted
individuals [17].
For example, assume the empty 6-by6 matrix and three individuals have been
accepted to update it. Let Individual1 = [2, 3, 1, 5, 6, 5], Individual2 = [2, 3, 2, 1, 6, 4]
and Individual3 = [3, 3, 1, 5, 6, 4]. The result of the update process is a matrix which
has been illustrated in Fig. 3.6. In this example, node #2 has been seen in the first
position of these individuals, two times out of three. Therefore, the value of entry
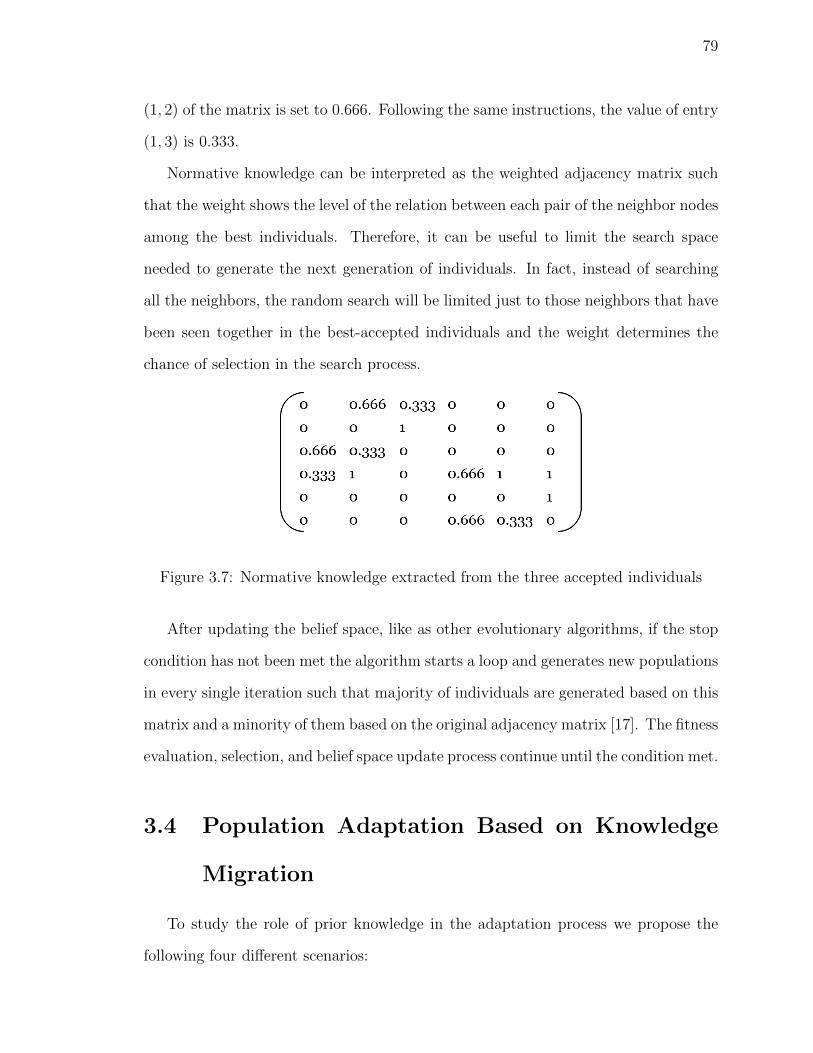
79
(1, 2) of the matrix is set to 0.666. Following the same instructions, the value of entry
(1, 3) is 0.333.
Normative knowledge can be interpreted as the weighted adjacency matrix such
that the weight shows the level of the relation between each pair of the neighbor nodes
among the best individuals. Therefore, it can be useful to limit the search space
needed to generate the next generation of individuals. In fact, instead of searching
all the neighbors, the random search will be limited just to those neighbors that have
been seen together in the best-accepted individuals and the weight determines the
chance of selection in the search process.
Figure 3.7: Normative knowledge extracted from the three accepted individuals
After updating the belief space, like as other evolutionary algorithms, if the stop
condition has not been met the algorithm starts a loop and generates new populations
in every single iteration such that majority of individuals are generated based on this
matrix and a minority of them based on the original adjacency matrix [17]. The fitness
evaluation, selection, and belief space update process continue until the condition met.
3.4 Population Adaptation Based on Knowledge
Migration
To study the role of prior knowledge in the adaptation process we propose the
following four different scenarios:
80
• Transferring the adapted populations and their knowledge from a random social
network to another network,
• Transferring knowledge obtained during adaptation process to another popula-
tion which deals with a different network,
• Transferring the adapted population from one network to another,
• Transferring the best individuals of the adapted population to another network.
Before describing the scenarios, the training environment must be defined. To
train populations, as we mentioned in the previous section, the community detec-
tion algorithm proposed in [17] has been chosen to find the network communities.
The input of it, is a random social network graph, and as the outputs, normative
knowledge matrix, best individuals and the number of executed iterations to find the
correct communities will be extracted. This algorithm starts with generating random
populations and stops when the predefined number of iterations has been reached. At
first, the belief space is empty, so an individual is generated completely random based
on the network adjacency matrix by using the mechanism which has been discussed
in the last section. Fig. 3.8 illustrates this process.
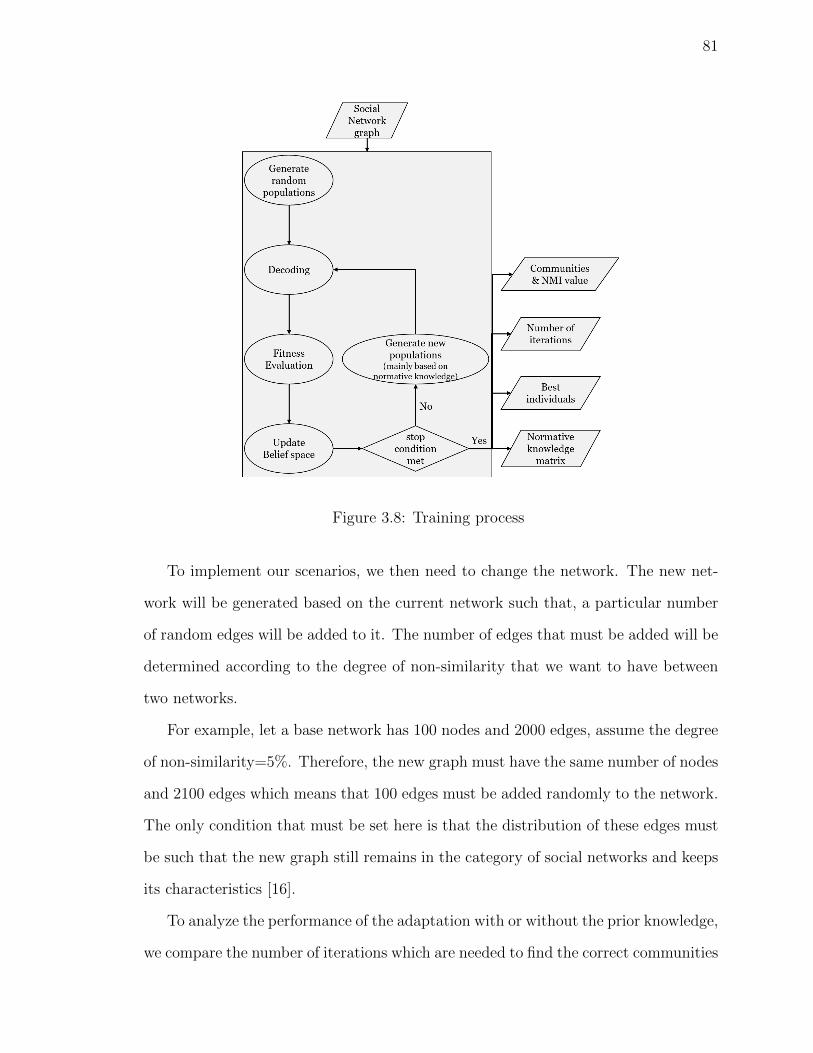
81
Figure 3.8: Training process
To implement our scenarios, we then need to change the network. The new net-
work will be generated based on the current network such that, a particular number
of random edges will be added to it. The number of edges that must be added will be
determined according to the degree of non-similarity that we want to have between
two networks.
For example, let a base network has 100 nodes and 2000 edges, assume the degree
of non-similarity=5%. Therefore, the new graph must have the same number of nodes
and 2100 edges which means that 100 edges must be added randomly to the network.
The only condition that must be set here is that the distribution of these edges must
be such that the new graph still remains in the category of social networks and keeps
its characteristics [16].
To analyze the performance of the adaptation with or without the prior knowledge,
we compare the number of iterations which are needed to find the correct communities
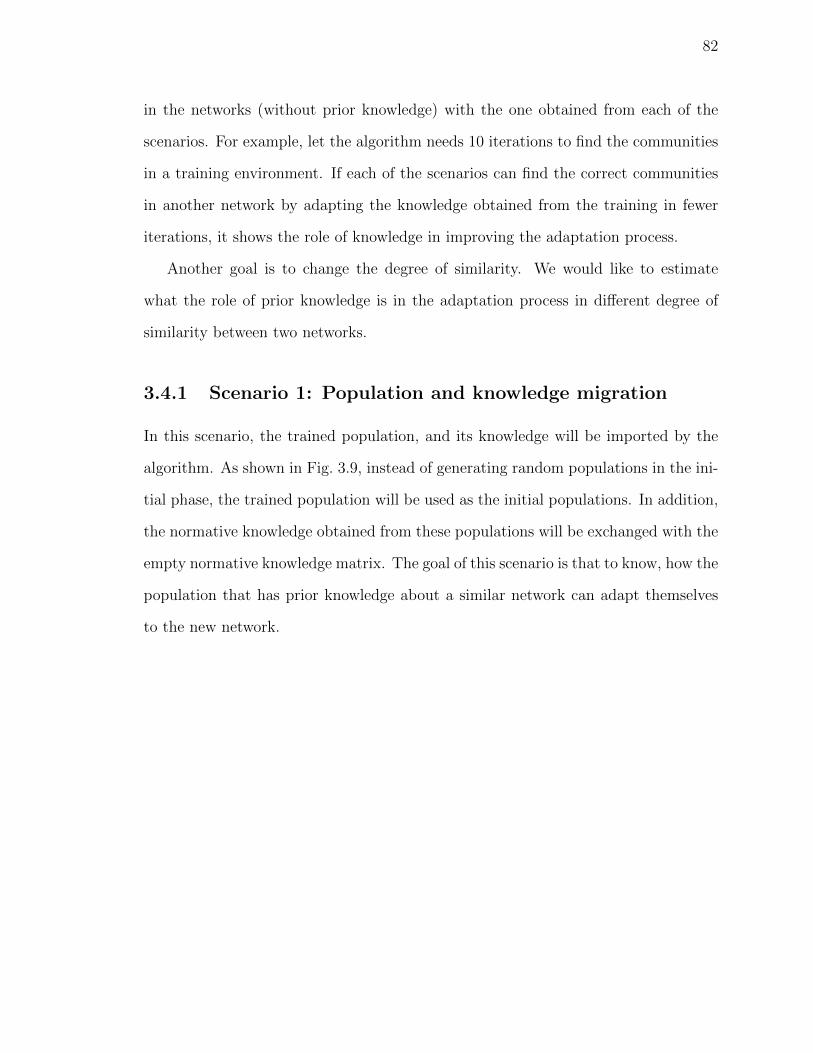
82
in the networks (without prior knowledge) with the one obtained from each of the
scenarios. For example, let the algorithm needs 10 iterations to find the communities
in a training environment. If each of the scenarios can find the correct communities
in another network by adapting the knowledge obtained from the training in fewer
iterations, it shows the role of knowledge in improving the adaptation process.
Another goal is to change the degree of similarity. We would like to estimate
what the role of prior knowledge is in the adaptation process in different degree of
similarity between two networks.
3.4.1 Scenario 1: Population and knowledge migration
In this scenario, the trained population, and its knowledge will be imported by the
algorithm. As shown in Fig. 3.9, instead of generating random populations in the ini-
tial phase, the trained population will be used as the initial populations. In addition,
the normative knowledge obtained from these populations will be exchanged with the
empty normative knowledge matrix. The goal of this scenario is that to know, how the
population that has prior knowledge about a similar network can adapt themselves
to the new network.
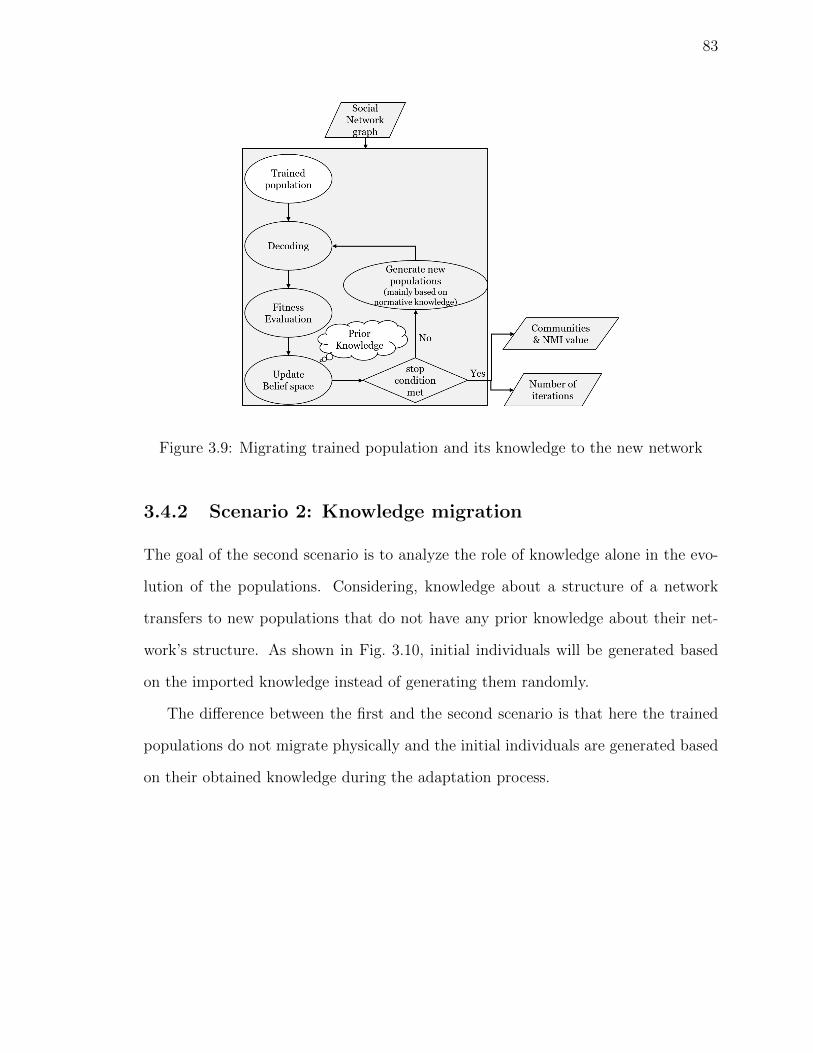
83
Figure 3.9: Migrating trained population and its knowledge to the new network
3.4.2 Scenario 2: Knowledge migration
The goal of the second scenario is to analyze the role of knowledge alone in the evo-
lution of the populations. Considering, knowledge about a structure of a network
transfers to new populations that do not have any prior knowledge about their net-
work’s structure. As shown in Fig. 3.10, initial individuals will be generated based
on the imported knowledge instead of generating them randomly.
The difference between the first and the second scenario is that here the trained
populations do not migrate physically and the initial individuals are generated based
on their obtained knowledge during the adaptation process.
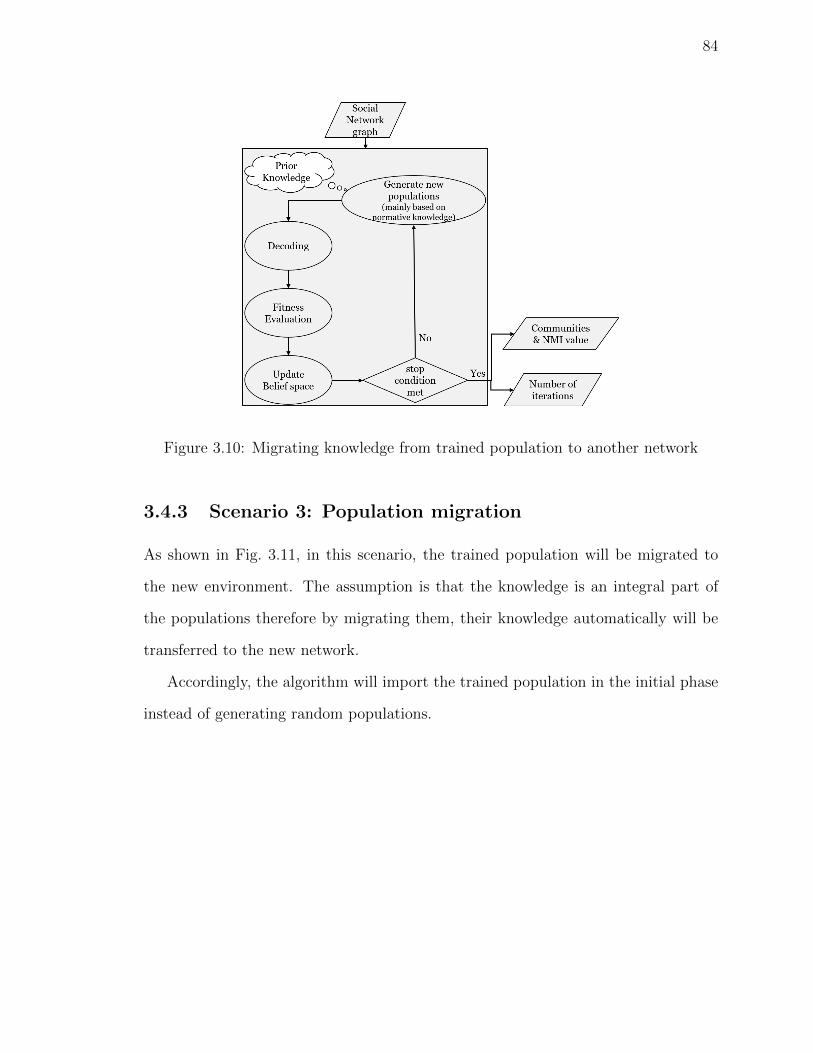
84
Figure 3.10: Migrating knowledge from trained population to another network
3.4.3 Scenario 3: Population migration
As shown in Fig. 3.11, in this scenario, the trained population will be migrated to
the new environment. The assumption is that the knowledge is an integral part of
the populations therefore by migrating them, their knowledge automatically will be
transferred to the new network.
Accordingly, the algorithm will import the trained population in the initial phase
instead of generating random populations.
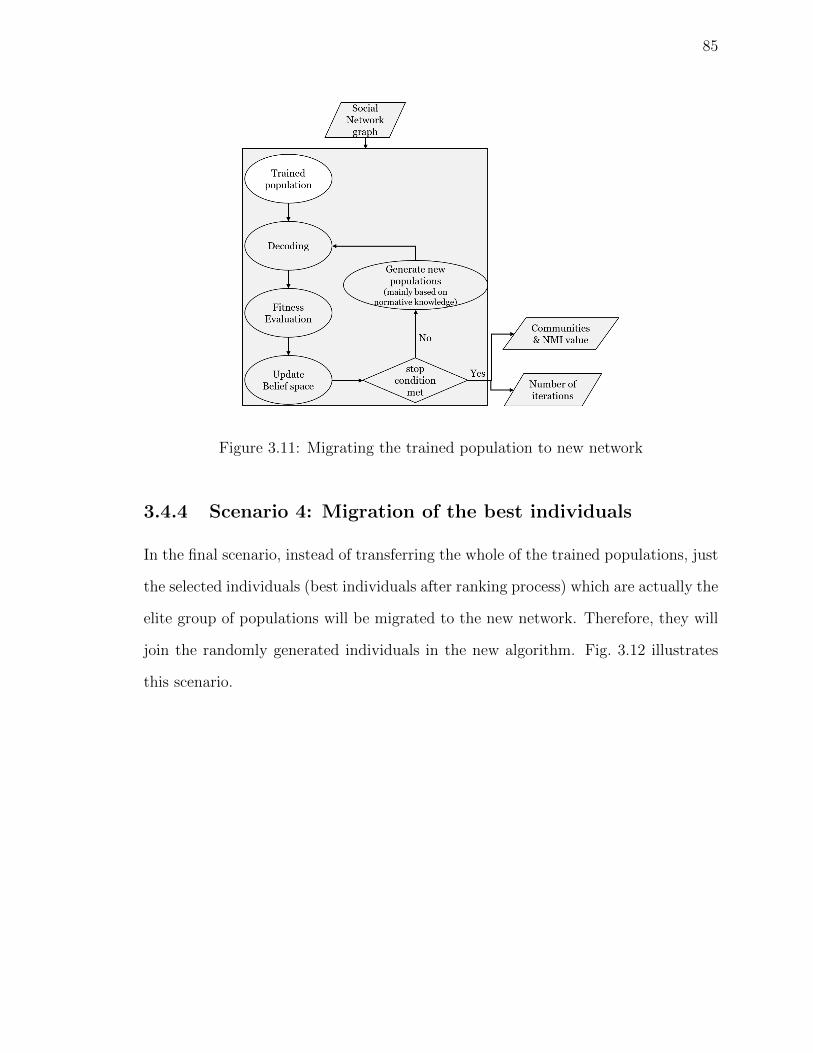
85
Figure 3.11: Migrating the trained population to new network
3.4.4 Scenario 4: Migration of the best individuals
In the final scenario, instead of transferring the whole of the trained populations, just
the selected individuals (best individuals after ranking process) which are actually the
elite group of populations will be migrated to the new network. Therefore, they will
join the randomly generated individuals in the new algorithm. Fig. 3.12 illustrates
this scenario.
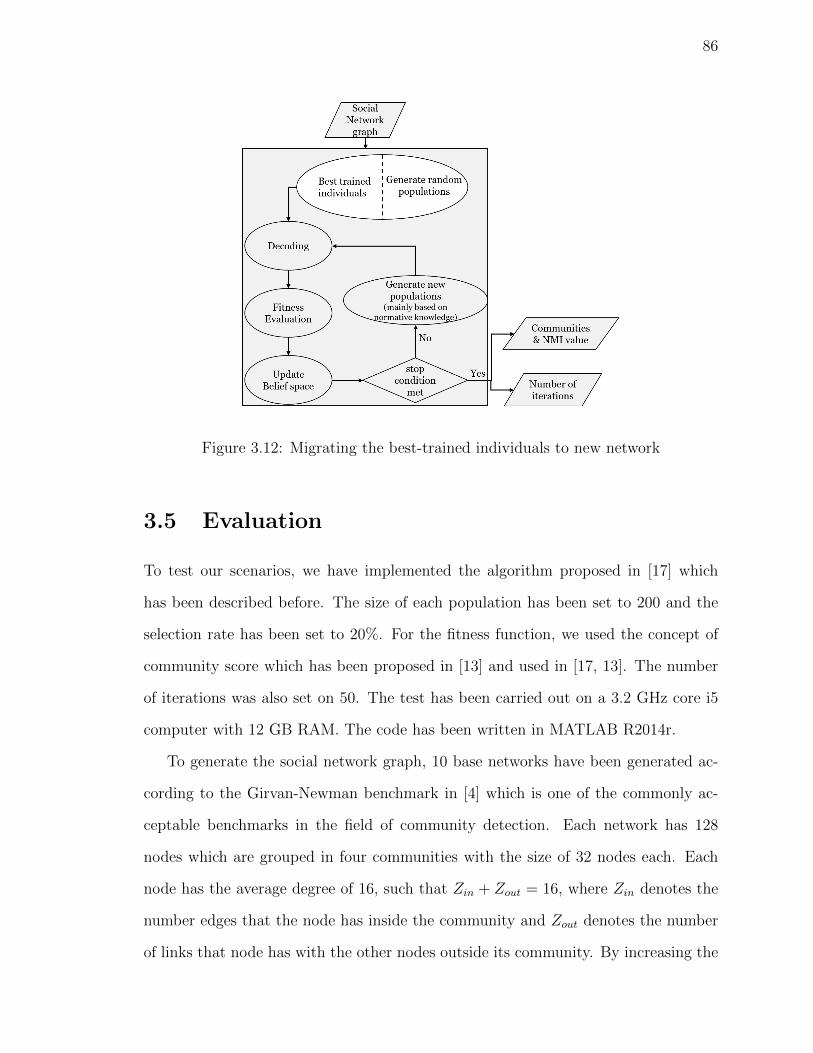
86
Figure 3.12: Migrating the best-trained individuals to new network
3.5 Evaluation
To test our scenarios, we have implemented the algorithm proposed in [17] which
has been described before. The size of each population has been set to 200 and the
selection rate has been set to 20%. For the fitness function, we used the concept of
community score which has been proposed in [13] and used in [17, 13]. The number
of iterations was also set on 50. The test has been carried out on a 3.2 GHz core i5
computer with 12 GB RAM. The code has been written in MATLAB R2014r.
To generate the social network graph, 10 base networks have been generated ac-
cording to the Girvan-Newman benchmark in [4] which is one of the commonly ac-
ceptable benchmarks in the field of community detection. Each network has 128
nodes which are grouped in four communities with the size of 32 nodes each. Each
node has the average degree of 16, such that Zin + Zout = 16, where Zin denotes the
number edges that the node has inside the community and Zout denotes the number
of links that node has with the other nodes outside its community. By increasing the
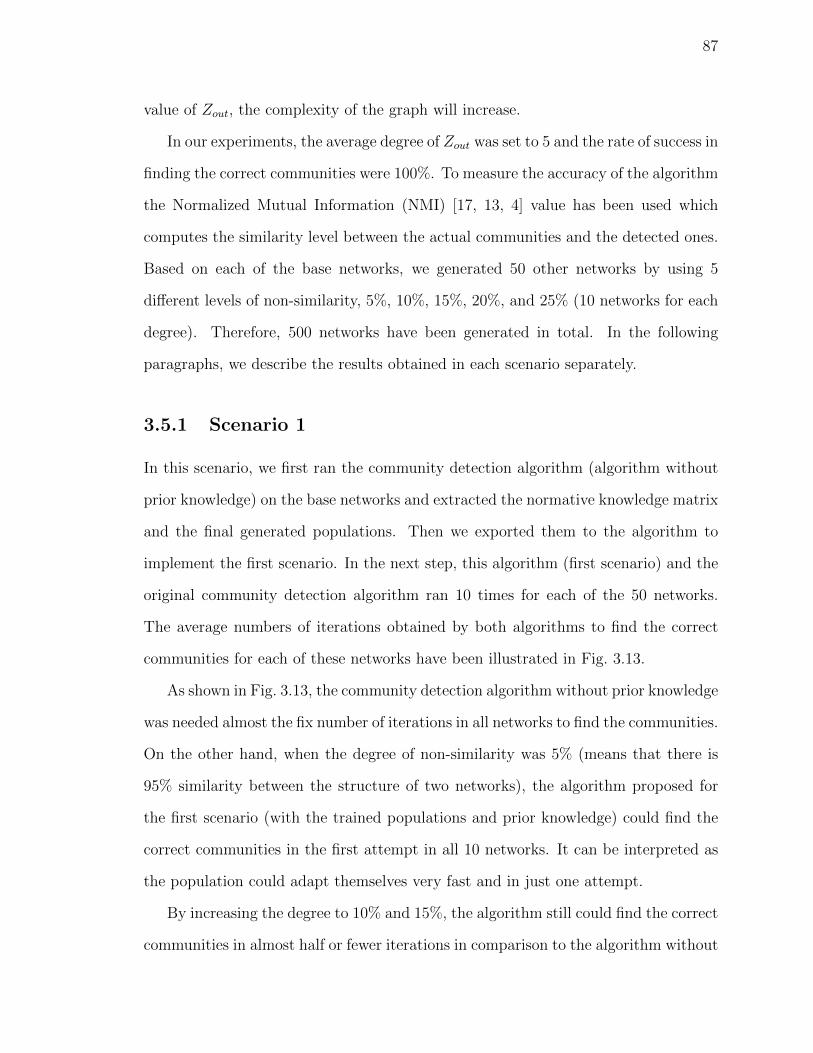
87
value of Zout, the complexity of the graph will increase.
In our experiments, the average degree of Zout was set to 5 and the rate of success in
finding the correct communities were 100%. To measure the accuracy of the algorithm
the Normalized Mutual Information (NMI) [17, 13, 4] value has been used which
computes the similarity level between the actual communities and the detected ones.
Based on each of the base networks, we generated 50 other networks by using 5
different levels of non-similarity, 5%, 10%, 15%, 20%, and 25% (10 networks for each
degree). Therefore, 500 networks have been generated in total. In the following
paragraphs, we describe the results obtained in each scenario separately.
3.5.1 Scenario 1
In this scenario, we first ran the community detection algorithm (algorithm without
prior knowledge) on the base networks and extracted the normative knowledge matrix
and the final generated populations. Then we exported them to the algorithm to
implement the first scenario. In the next step, this algorithm (first scenario) and the
original community detection algorithm ran 10 times for each of the 50 networks.
The average numbers of iterations obtained by both algorithms to find the correct
communities for each of these networks have been illustrated in Fig. 3.13.
As shown in Fig. 3.13, the community detection algorithm without prior knowledge
was needed almost the fix number of iterations in all networks to find the communities.
On the other hand, when the degree of non-similarity was 5% (means that there is
95% similarity between the structure of two networks), the algorithm proposed for
the first scenario (with the trained populations and prior knowledge) could find the
correct communities in the first attempt in all 10 networks. It can be interpreted as
the population could adapt themselves very fast and in just one attempt.
By increasing the degree to 10% and 15%, the algorithm still could find the correct
communities in almost half or fewer iterations in comparison to the algorithm without
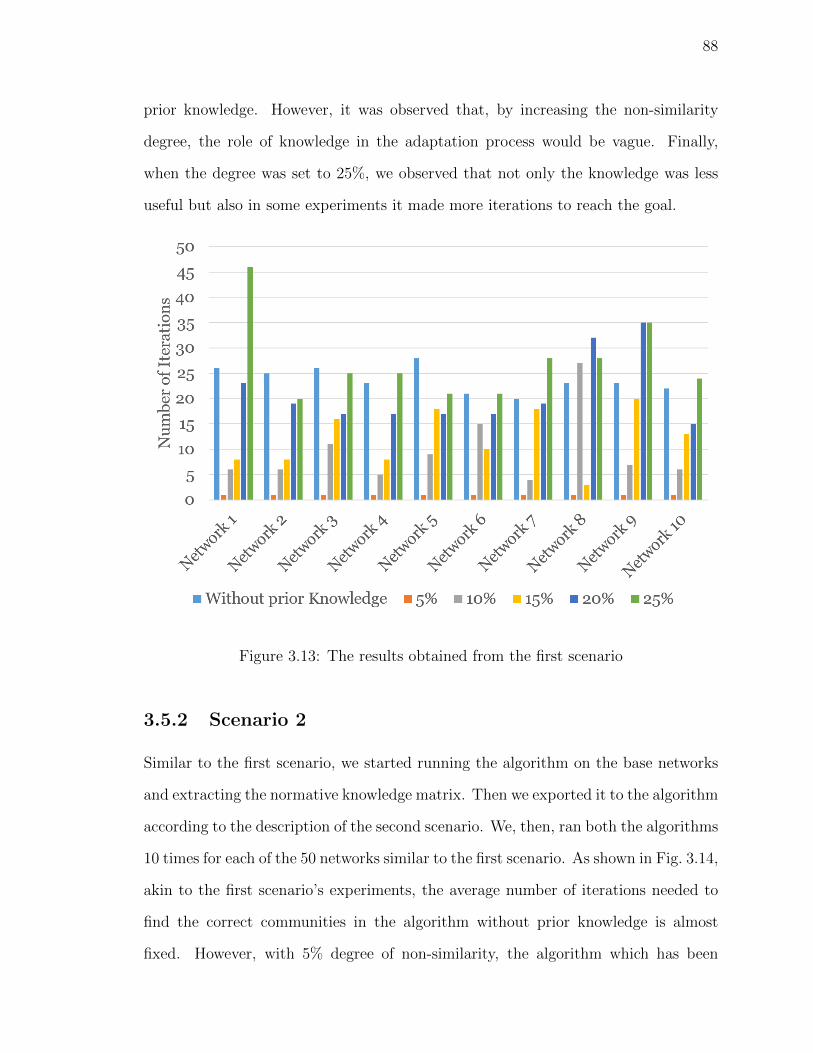
88
prior knowledge. However, it was observed that, by increasing the non-similarity
degree, the role of knowledge in the adaptation process would be vague. Finally,
when the degree was set to 25%, we observed that not only the knowledge was less
useful but also in some experiments it made more iterations to reach the goal.
Figure 3.13: The results obtained from the first scenario
3.5.2 Scenario 2
Similar to the first scenario, we started running the algorithm on the base networks
and extracting the normative knowledge matrix. Then we exported it to the algorithm
according to the description of the second scenario. We, then, ran both the algorithms
10 times for each of the 50 networks similar to the first scenario. As shown in Fig. 3.14,
akin to the first scenario’s experiments, the average number of iterations needed to
find the correct communities in the algorithm without prior knowledge is almost
fixed. However, with 5% degree of non-similarity, the algorithm which has been
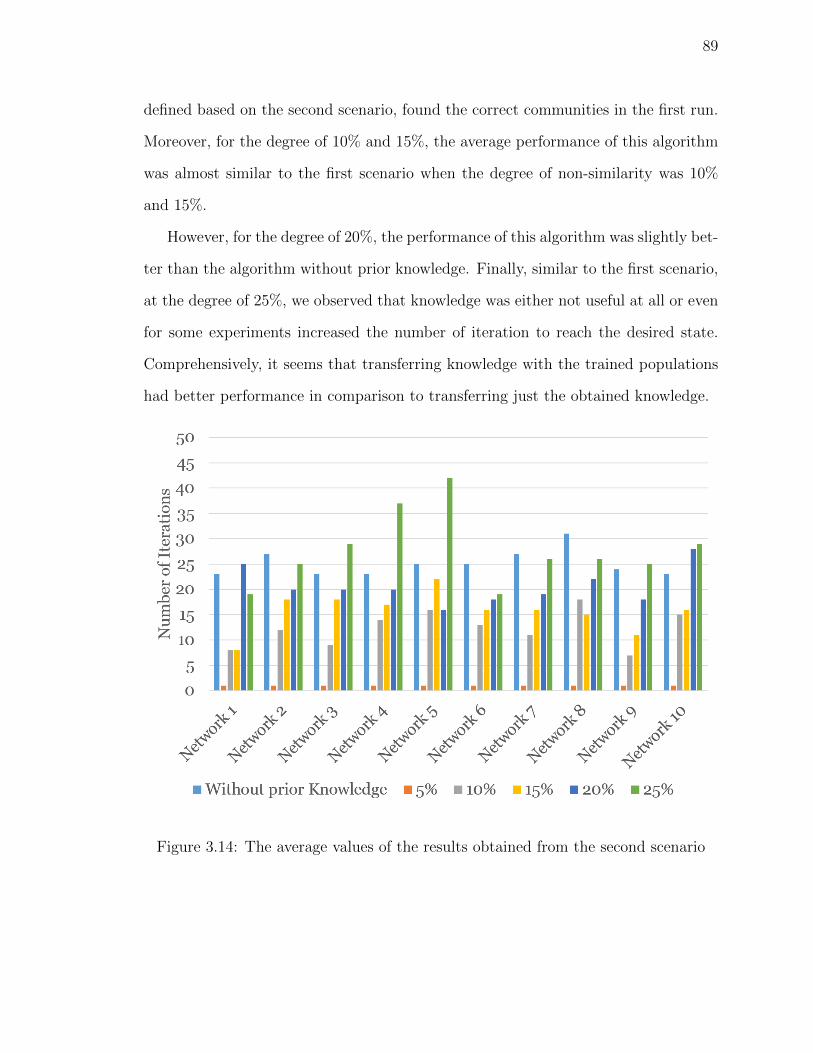
89
defined based on the second scenario, found the correct communities in the first run.
Moreover, for the degree of 10% and 15%, the average performance of this algorithm
was almost similar to the first scenario when the degree of non-similarity was 10%
and 15%.
However, for the degree of 20%, the performance of this algorithm was slightly bet-
ter than the algorithm without prior knowledge. Finally, similar to the first scenario,
at the degree of 25%, we observed that knowledge was either not useful at all or even
for some experiments increased the number of iteration to reach the desired state.
Comprehensively, it seems that transferring knowledge with the trained populations
had better performance in comparison to transferring just the obtained knowledge.
Figure 3.14: The average values of the results obtained from the second scenario
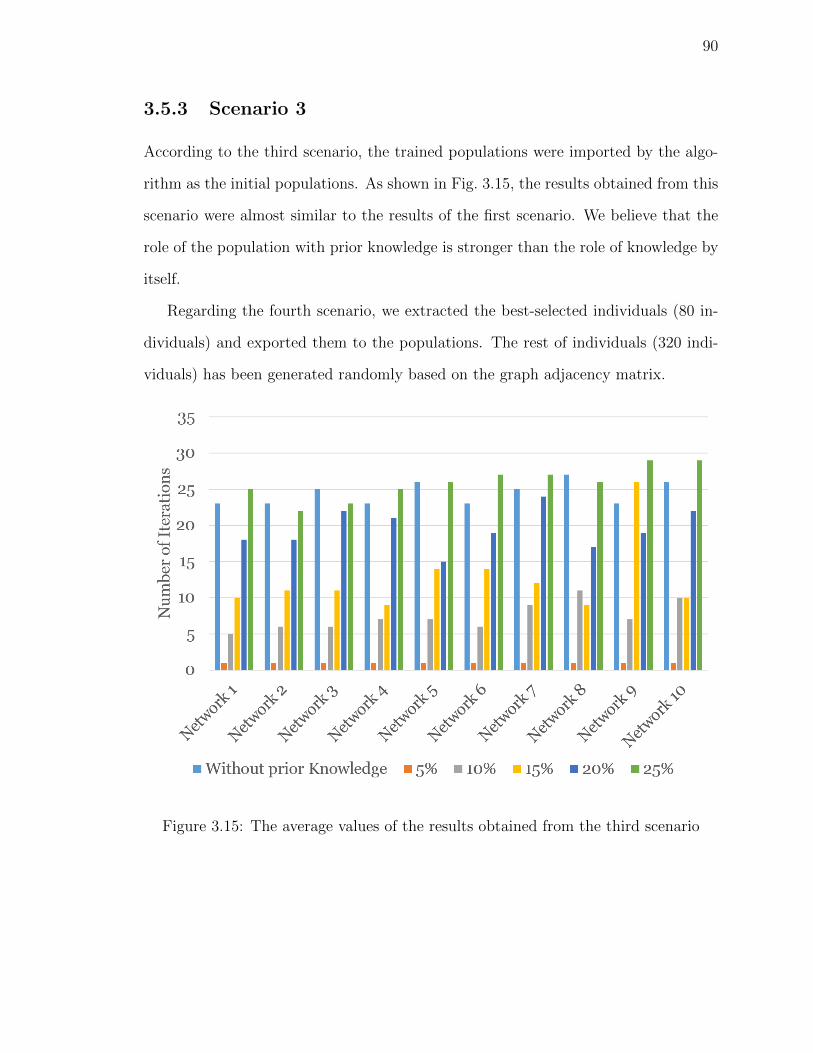
90
3.5.3 Scenario 3
According to the third scenario, the trained populations were imported by the algo-
rithm as the initial populations. As shown in Fig. 3.15, the results obtained from this
scenario were almost similar to the results of the first scenario. We believe that the
role of the population with prior knowledge is stronger than the role of knowledge by
itself.
Regarding the fourth scenario, we extracted the best-selected individuals (80 in-
dividuals) and exported them to the populations. The rest of individuals (320 indi-
viduals) has been generated randomly based on the graph adjacency matrix.
Figure 3.15: The average values of the results obtained from the third scenario
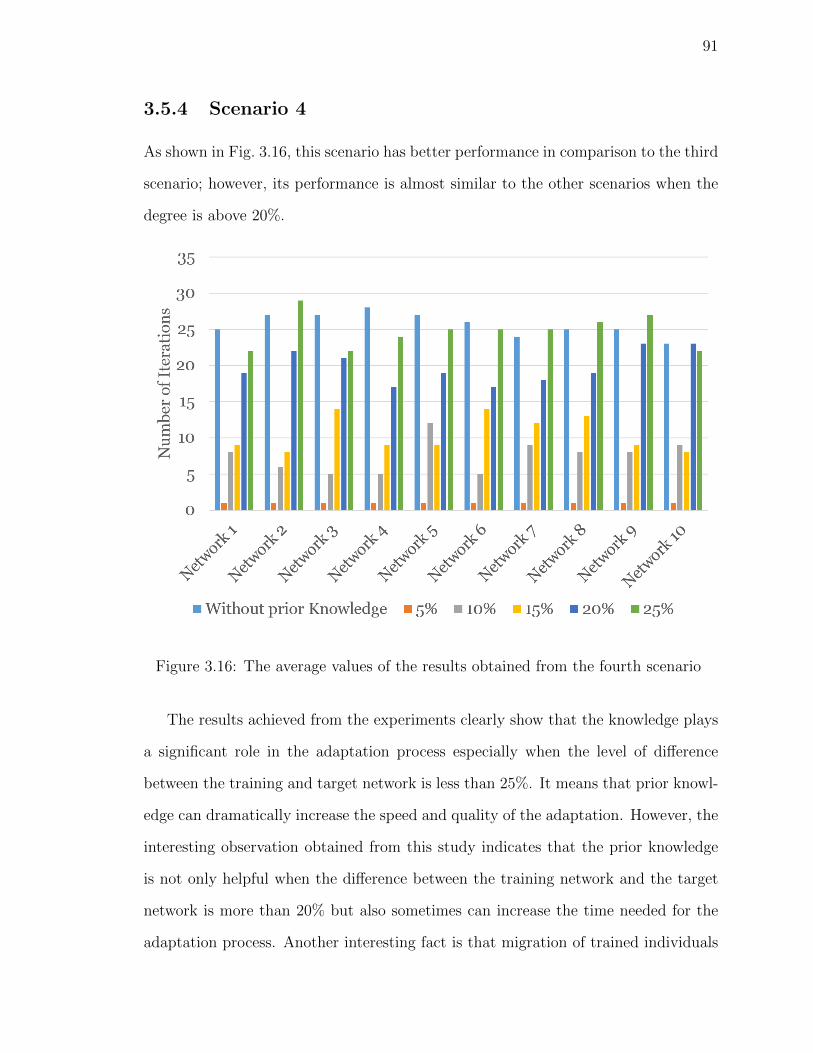
91
3.5.4 Scenario 4
As shown in Fig. 3.16, this scenario has better performance in comparison to the third
scenario; however, its performance is almost similar to the other scenarios when the
degree is above 20%.
Figure 3.16: The average values of the results obtained from the fourth scenario
The results achieved from the experiments clearly show that the knowledge plays
a significant role in the adaptation process especially when the level of difference
between the training and target network is less than 25%. It means that prior knowl-
edge can dramatically increase the speed and quality of the adaptation. However, the
interesting observation obtained from this study indicates that the prior knowledge
is not only helpful when the difference between the training network and the target
network is more than 20% but also sometimes can increase the time needed for the
adaptation process. Another interesting fact is that migration of trained individuals
92
has a better impact on the adoption process rather than transferring the obtained
knowledge.
3.6 Conclusion and Future Work
In recent years, a lot of work has been carried out on social network analysis and
population migration, but most of them have not considered the role of knowledge
migration in the population adaptation process. In this research we proposed to an-
alyze the role of knowledge migration in population adaptation, taking community
detection in social networks as our case study. We have shown how knowledge, as-
sociated with any population, can play a significant role in its adaptation process
in social networks with the help of multi-population cultural algorithms. To study
the role of prior knowledge, we have proposed the following four different scenarios
for transferring knowledge and the trained population from one network to another
network.
• Transferring the adapted populations and their knowledge from a random social
network to another network,
• Transferring knowledge obtained during adaptation process to another popula-
tion which deals with a different network,
• Transferring the adapted population from one network to another,
• Transferring the best individuals of the adapted population to another network.
According to the results, we can observe that if two networks are similar to some
extent, knowledge can play a very crucial role in the population adaptation process.
According to our results, if the degree of non-similarity is less than 25% the influence
of knowledge on population adaptation is very significant, but if it is more than 25%
93
not only its impact will be minimal, but also it may act as an obstacle and make the
adaptation process complex.
Another main observation of this research is that the first and the third scenarios
had better performances in comparison with the other scenarios. It can be interpreted
that, transferring just a source of knowledge from one network to another by itself
has less impact on the adaptation process in contrast to transferring the trained
individuals.
The significance of this contribution in dynamic social networks is that it allows
us to use the obtained knowledge from a previous analysis, stored in the belief space,
to identify new communities by eliminating the need for a new search, if the similarity
of two consecutive network snapshots is within 85%. This method can be generalized
to accelerate the search performance in complex and dynamic social networks.
In the future, we would like to extend our work on the real world problems in-
cluding single and multiplex networks and implement it to more experimental envi-
ronments. Our target is to add a variety of complex scenarios to the framework and
evaluate the outcome. Studying the role of different types of knowledge in the adap-
tation process, particularly domain knowledge would be one extension to our future
work.
94
References
[1] Demetris Antoniades and Constantine Dovrolis. Co-evolutionary dynamics in
social networks: A case study of twitter. Computational Social Networks, 2(1):1,
2015.
[2] RIM Dunbar, Valerio Arnaboldi, Marco Conti, and Andrea Passarella. The
structure of online social networks mirrors those in the offline world. Social
Networks, 43:39–47, 2015.
[3] Andries P Engelbrecht. Computational intelligence: an introduction. John Wiley
& Sons, 2007.
[4] Michelle Girvan and Mark EJ Newman. Community structure in social and bio-
logical networks. Proceedings of the national academy of sciences, 99(12):7821–
7826, 2002.
[5] Thilo Gross and Bernd Blasius. Adaptive coevolutionary networks: a review.
Journal of the Royal Society Interface, 5(20):259–271, 2008.
[6] Thilo Gross and Hiroki Sayama. Adaptive networks. In Adaptive Networks, pages
1–8. Springer, 2009.
[7] Yi-nan Guo, Jian Cheng, Yuan-yuan Cao, and Yong Lin. A novel multi-
population cultural algorithm adopting knowledge migration. Soft computing,
15(5):897–905, 2011.

95
[8] Andrew William Hlynka and Ziad Kobti. Knowledge sharing through agent
migration with multi-population cultural algorithm. In FLAIRS Conference,
2013.
[9] Ziad Kobti et al. Heterogeneous multi-population cultural algorithm with a
dynamic dimension decomposition strategy. In Canadian Conference on Artificial
Intelligence, pages 345–350. Springer, 2014.
[10] Felicitas Mokom and Ziad Kobti. Improving artifact selection via agent migration
in multi-population cultural algorithms. In Swarm Intelligence (SIS), 2014 IEEE
Symposium on, pages 1–8. IEEE, 2014.
[11] Timothy R Newman, Rakesh Rajbanshi, Alexander M Wyglinski, Joseph B
Evans, and Gary J Minden. Population adaptation for genetic algorithm-based
cognitive radios. Mobile networks and applications, 13(5):442–451, 2008.
[12] YoungJa Park and ManSuk Song. A genetic algorithm for clustering problems.
In Proceedings of the third annual conference on genetic programming, pages
568–575, 1998.
[13] Clara Pizzuti. Ga-net: A genetic algorithm for community detection in social
networks. In International Conference on Parallel Problem Solving from Nature,
pages 1081–1090. Springer, 2008.
[14] Robert G Reynolds and Bin Peng. Cultural algorithms: computational modeling
of how cultures learn to solve problems: an engineering example. Cybernetics
and Systems: An International Journal, 36(8):753–771, 2005.
[15] Saleh Saleem and Robert Reynolds. Cultural algorithms in dynamic environ-
ments. In Evolutionary Computation, 2000. Proceedings of the 2000 Congress
on, volume 2, pages 1513–1520. IEEE, 2000.

96
[16] Duncan J Watts and Steven H Strogatz. Collective dynamics of small-
worldnetworks. nature, 393(6684):440–442, 1998.
[17] Pooya Moradian Zadeh and Ziad Kobti. A multi-population cultural algorithm
for community detection in social networks. Procedia Computer Science, 52:342–
349, 2015.
[18] Elena Zheleva, Hossam Sharara, and Lise Getoor. Co-evolution of social and
affiliation networks. In Proceedings of the 15th ACM SIGKDD international
conference on Knowledge discovery and data mining, pages 1007–1016. ACM,
2009.
97
Chapter 4
Link Prediction in Social Networks
Social networks have a dynamic nature, so their structures frequently change over
time. In this chapter, we propose a new community-oriented knowledge-based evo-
lutionary method to predict the state of a network in the near future by extracting
knowledge from its current structure. This method is based on the fact that social
networks consist of interconnected communities and their members tend to join these
communities. By observing the current state of a given network, the method calcu-
lates the probability of a relationship between each pair of individuals who are not
directly connected to each other and estimate the chance of being linked in the next
time slot.
A unique mapping function and a novel computational model based on the weighted
graph have been defined for the estimation process. We have tested and compared
the method on various synthetic networks and real datasets. Results show that our
method can predict the next state of a network with a notably high rate of accuracy.
98
4.1 Introduction
People use social networks to interact with others. Regardless of the content, these
interactions can reveal valuable information about real societies and individuals. This
information can be useful to identify the structure and topology of these networks,
which makes it possible to track their evolutions and predict the next state. Nat-
urally, these networks are extremely dynamic, and their rate of evolution is very
high. Consequently, their structure changes frequently. Since these networks reflect
real life events, having knowledge about their next state can be applied to various do-
mains such as recommendation systems, decision making, marketing and risk analysis
[11, 5, 32, 7, 16, 18].
For example, in online social networks, it can be used to recommend new friends or
products to the users [14, 2]. Meanwhile, in social media and the stock market, it acts
as a powerful tool to predict the upcoming trends, events and behaviors [34, 39, 10,
22, 25]. In professional and academic networks it is helpful to find possible teams of
experts for particular tasks [36, 31, 37]. In political science, predicting the outcome
of elections or political decisions are challenging tasks which can become possible
with the help of this knowledge [6, 13]. In crime networks, it can be seen as a tool
which can shed light on the criminal system analysis [3]. In health science, predicting
disease and its spread and outbreak are another applications of this important topic
[12, 17, 26, 34].
In the field of social network analysis, this problem is known as Link Prediction,
which can be defined as estimating the likelihood of a connection between two dis-
connected entities in a network in the near future [7, 16, 18]. The main idea behind
this problem is, the future state of a network is not random and has a dependency
on the current state. Therefore, the target is to find the level of dependency and the
main factors affecting it.
Social Networks as a subset of complex networks have some particular charac-

99
teristics such as power-law distribution, the high value of cluster coefficient, and
homophily phenomenon. The power-law distribution in social networks means that
there exist relatively few nodes in the network with a high degree of connectivity
which are called hubs and many nodes with low degree [1]. Identifying the hubs is an
important task in analyzing the evolution of social networks.
Cluster coefficient measures another important characteristic of a network which
can be interpreted as the tendency of nodes to cluster together. It is defined as:
C =(3×#triangles)
(#connected triplets in the network)(4.1)
Having a high level of cluster coefficient in the network indicates the strong tendency
of users to join communities. Meanwhile, regarding the homophily phenomenon, users
are willing to join the communities through their circle of friends. Accordingly, in
this paper we propose a knowledge-based community-oriented evolutionary framework
based on these properties to estimate the state of a network in the near future just
by having one snapshot of the network.
Our proposed model is defined based on the similarity approach with two main
assumptions. The first is that an individual in a network tends to join a community.
The second is that, each individual joins a community through their friends. Hence,
the similarity measurement here is defined as having a common community. For
example, if a person in a network has 6 friends and 5 of them are members of a
community with 30 people, the probability of a friendship between this person and
members of the community in the near future is higher than other cases, and the level
of this similarity can be estimated approximately.
To estimate this likelihood, a knowledge-based structure which is called belief
space has been adapted from the evolutionary cultural algorithm which has been
proposed for the community detection problem in [41]. Cultural algorithms are a
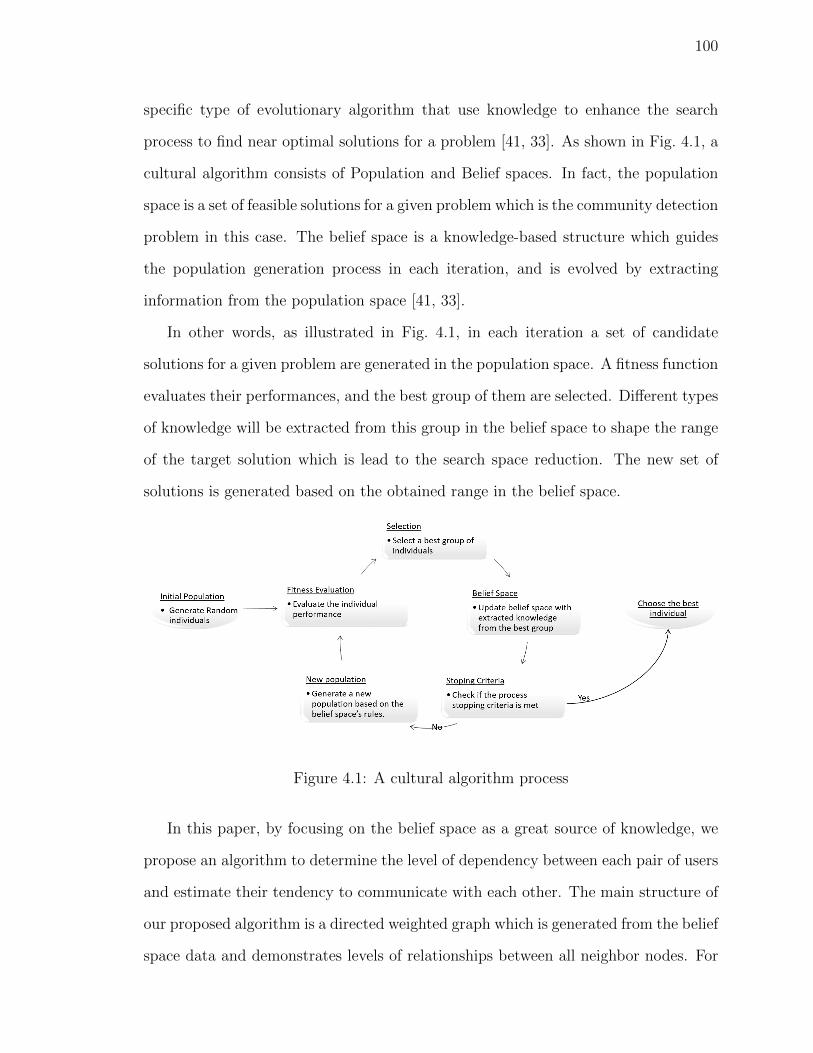
100
specific type of evolutionary algorithm that use knowledge to enhance the search
process to find near optimal solutions for a problem [41, 33]. As shown in Fig. 4.1, a
cultural algorithm consists of Population and Belief spaces. In fact, the population
space is a set of feasible solutions for a given problem which is the community detection
problem in this case. The belief space is a knowledge-based structure which guides
the population generation process in each iteration, and is evolved by extracting
information from the population space [41, 33].
In other words, as illustrated in Fig. 4.1, in each iteration a set of candidate
solutions for a given problem are generated in the population space. A fitness function
evaluates their performances, and the best group of them are selected. Different types
of knowledge will be extracted from this group in the belief space to shape the range
of the target solution which is lead to the search space reduction. The new set of
solutions is generated based on the obtained range in the belief space.
Figure 4.1: A cultural algorithm process
In this paper, by focusing on the belief space as a great source of knowledge, we
propose an algorithm to determine the level of dependency between each pair of users
and estimate their tendency to communicate with each other. The main structure of
our proposed algorithm is a directed weighted graph which is generated from the belief
space data and demonstrates levels of relationships between all neighbor nodes. For

101
predictions, a mathematical model is proposed to estimate the likelihood of having a
relationship between each unconnected pair of nodes. This model has been defined
based on two main concepts, the number of paths between each unconnected pair of
nodes and the length of these paths. Having more paths and shorter distances implies
a higher chance of connection in the next time slot. Finally, our algorithm calculates
the probability of a relation between pairs of nodes which are not directly connected
and ranks them.
The main contributions of this research can be summarized into the following
categories:
• Introducing a novel concept of observing the quality of links between pairs of
nodes. By observing a snapshot of the social graph, an evolutionary approach
has been used to determine the level of dependency between each connected
pairs of nodes and make a weighted network.
• Proposing a mathematical method to extract information from the structure of
a given network as a similarity index.
• Proposing a unique knowledge-based computational model for analyzing the
evolution of social systems and estimating the state of the network in the next
time slot.
The rest of the paper is organized as follows: In the next section, the problem
definition and related works will be reviewed. The detailed description of our model
has been presented in section 4.3. After that, in section 4.4 the evaluation of the
model will be studied and discussed. Conclusions are presented in the last section.
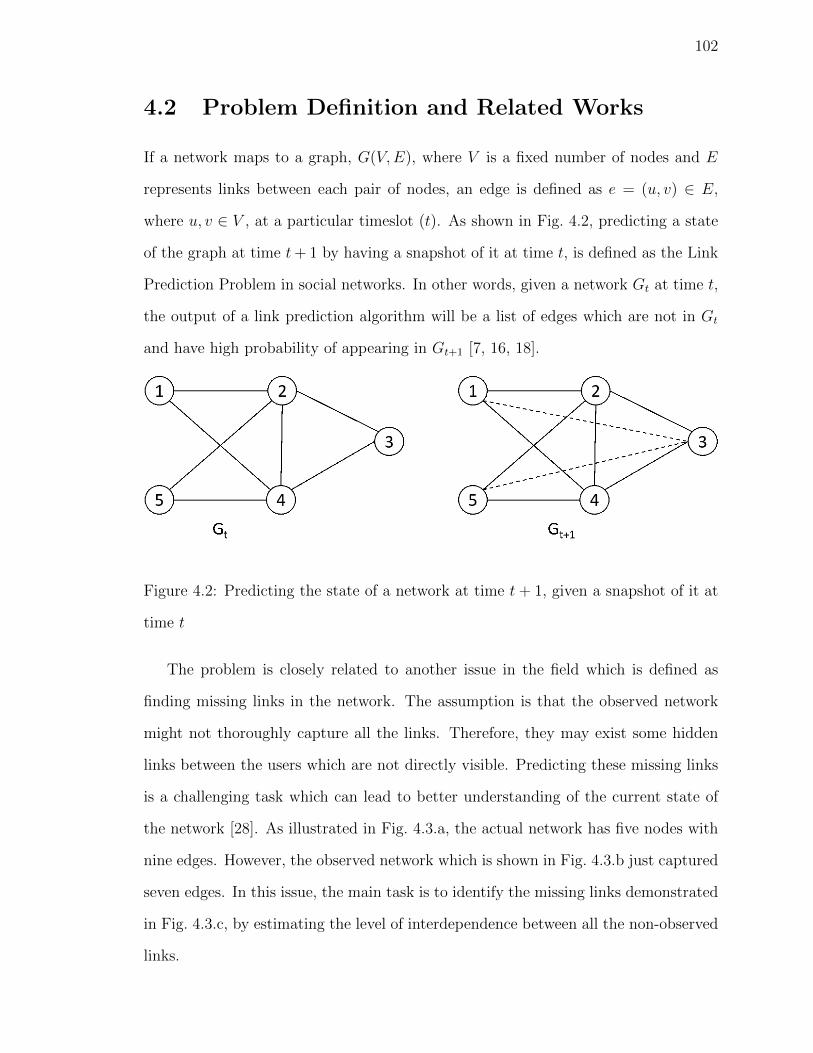
102
4.2 Problem Definition and Related Works
If a network maps to a graph, G(V,E), where V is a fixed number of nodes and E
represents links between each pair of nodes, an edge is defined as e = (u, v) ∈ E,
where u, v ∈ V , at a particular timeslot (t). As shown in Fig. 4.2, predicting a state
of the graph at time t+ 1 by having a snapshot of it at time t, is defined as the Link
Prediction Problem in social networks. In other words, given a network Gt at time t,
the output of a link prediction algorithm will be a list of edges which are not in Gt
and have high probability of appearing in Gt+1 [7, 16, 18].
Figure 4.2: Predicting the state of a network at time t+ 1, given a snapshot of it at
time t
The problem is closely related to another issue in the field which is defined as
finding missing links in the network. The assumption is that the observed network
might not thoroughly capture all the links. Therefore, they may exist some hidden
links between the users which are not directly visible. Predicting these missing links
is a challenging task which can lead to better understanding of the current state of
the network [28]. As illustrated in Fig. 4.3.a, the actual network has five nodes with
nine edges. However, the observed network which is shown in Fig. 4.3.b just captured
seven edges. In this issue, the main task is to identify the missing links demonstrated
in Fig. 4.3.c, by estimating the level of interdependence between all the non-observed
links.
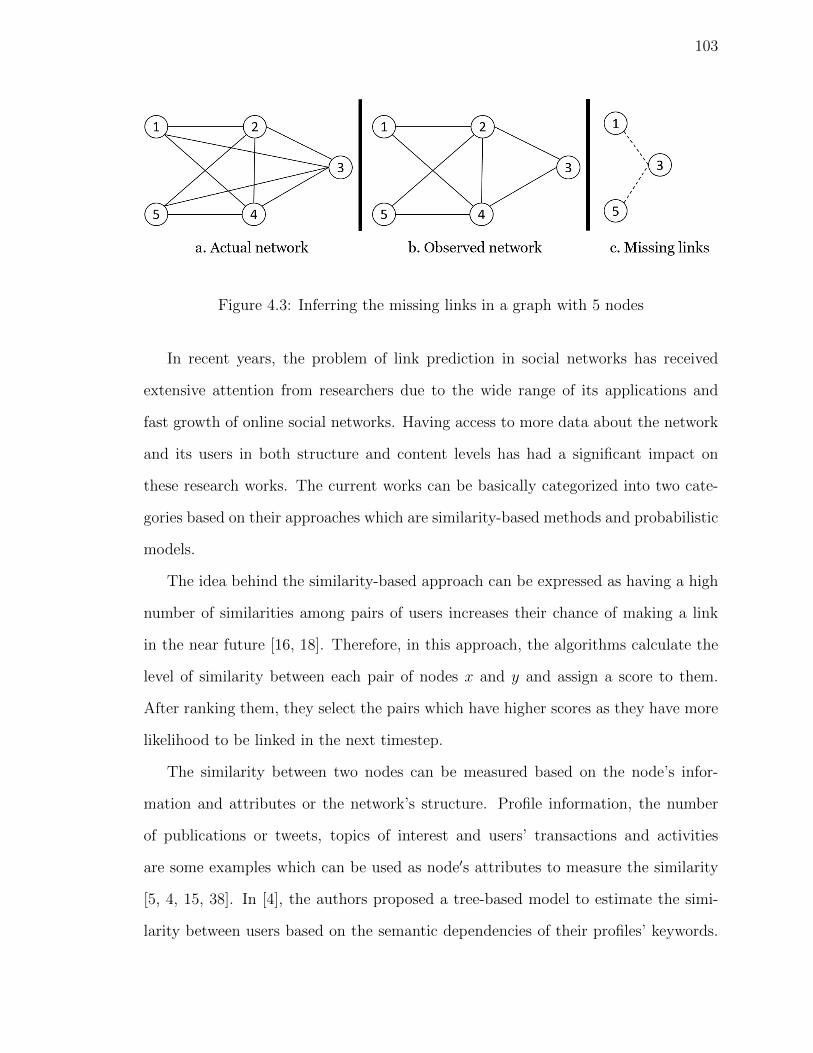
103
Figure 4.3: Inferring the missing links in a graph with 5 nodes
In recent years, the problem of link prediction in social networks has received
extensive attention from researchers due to the wide range of its applications and
fast growth of online social networks. Having access to more data about the network
and its users in both structure and content levels has had a significant impact on
these research works. The current works can be basically categorized into two cate-
gories based on their approaches which are similarity-based methods and probabilistic
models.
The idea behind the similarity-based approach can be expressed as having a high
number of similarities among pairs of users increases their chance of making a link
in the near future [16, 18]. Therefore, in this approach, the algorithms calculate the
level of similarity between each pair of nodes x and y and assign a score to them.
After ranking them, they select the pairs which have higher scores as they have more
likelihood to be linked in the next timestep.
The similarity between two nodes can be measured based on the node’s infor-
mation and attributes or the network’s structure. Profile information, the number
of publications or tweets, topics of interest and users’ transactions and activities
are some examples which can be used as node′s attributes to measure the similarity
[5, 4, 15, 38]. In [4], the authors proposed a tree-based model to estimate the simi-
larity between users based on the semantic dependencies of their profiles’ keywords.
104
To find the semantic similarities between the keywords, they proposed a forest model
which consists of multiple trees. In this model, each keyword is mapped to a node
and will be linked to another node if there is a relation between the corresponding
keywords. The hierarchical architecture of the model is used to calculate the distance
between the pairs of nodes. They used WordNet to obtain the list of related keywords
as the core of their model. After that, they defined two concepts of Weak and Strong
similarities to estimate the level of similarity between users.
In another work [15], the authors proposed a model to combine the network struc-
ture and node attributes to deal with the problem. They extended the existing model
which they called it Social-Attribute Network (SAN) and employed various link pre-
diction algorithms. Their result demonstrated that integrating the both concepts can
improve the performance and lead to the more accurate prediction.
There exist many research works which are concentrated on node’s attributes to
solve the link prediction problem [5, 18, 16, 4, 15, 38]. However, due to lack of access
to the users’ information, extracting the attributes is a big challenge in this approach.
Meanwhile, as the main focus of this paper is using structural information to tackle
the problem, the topology-based methods will be reviewed in the next paragraphs.
The unsupervised methods for the link prediction mainly rely on the structural
similarity of the nodes [11, 16, 18]. Many similarity indexes have been proposed
such as the Jaccard similarity coefficient, Katz, Common Neighbors, Leicht-Holme-
Newman. Some of these indexes calculate the similarity between a pair of nodes
based on their number of common neighbors. Some others are global and compute
the similarity based on the existing paths between two nodes [16, 18, 38].
The Common Neighbors index counts the number of shared neighbors of nodes x
and y. It is formally define as:
C(x, y) = |Γ(x) ∩ Γ(y)| (4.2)
105
where Γ(x) and Γ(y) are the lists of neighbors of nodes x and y, respectively. The
assumption is that the likelihood of a friendship between two unconnected nodes in
a network become higher by increasing the number of their shared friends.
The Jaccard similarity coefficient is another important neighbor-based index which
measures the number of shared neighbors between two nodes over number of their all
unique neighbors. The index is defined as:
J(x, y) =|Γ(x) ∩ Γ(y)||Γ(x) ∪ Γ(y)|
(4.3)
This index gives a higher similarity score to the nodes which have more common
neighbors and less private ones.
Leicht-Holme-Newman is also an neighbor-based index which determines the simi-
larity by calculating the number of common neighbors between nodes x and y relative
to the product of their degrees. It assigns a high similarity score to a pair of nodes that
have many common neighbors compared to the expected number of such neighbors
[21].
L(x, y) =|Γ(x) ∩ Γ(y)|d(x)d(y)
(4.4)
where d(x) and d(y) are the degrees of nodes x and y, respectively.
The Resource Allocation Index is another neighbor-based index which performs
well on real networks. Consider the situation where node x sends some resources to
node y through its mutual neighbors. The similarity between x and y is then defined
as the amount of resources received by node y. The index is formulated as:
RA(x, y) =∑
z∈Γ(x)∩Γ(y)
1
|Γ(z)|(4.5)
Academic-Adar Coefficient (AA) is a neighbor-based index which was initially
proposed to estimate the level of similarity of a pair of web pages. The index assigns
106
more weight to the rare features in comparison to the common ones. The assumption
is that the rare items are more valuable than the ordinary ones. Consequently, more
weight is assigned to the common nodes with lower degrees. The metric is defined as:
AA(x, y) =∑
z∈Γ(x)∩Γ(y)
1
log|Γ(z)|(4.6)
Preferential Attachment (PA) is another neighbor-based index which gives a higher
similarity score to a pair nodes that have more degrees. The assumption is that the
likelihood of a connection between high-degree nodes is greater than low-degree ones.
The index has the lowest computational complexity and is defined as:
PA(x, y) = |Γ(x)|.|Γ(y)| (4.7)
In [24, 42], the authors have comprehensively compared some of the indexes on
many real networks. According to the results, the resource allocation index has better
performance in comparison to the other metrics. However, despite the existence of
many neighbor-based indexes, none of them can be used as an absolute universal
solution for all types of networks. However, the main challenge in this approach is
the issue of scalability. Therefore, a suitable metric must be chosen based on the
characteristics of a given social networks [16, 18].
As mentioned before, another approach to calculate the similarity relies on the role
of existing paths between a pair of nodes. Consequently, global structural information
is required in this approach. Katz and Friend Link are examples of this approach
which are reviewed in the following paragraphs [16, 18, 38, 29].
Katz is an important path-based index which estimates the similarity based on
the number of paths between two nodes and their distances. The idea is that the
more paths between two nodes and the shorter distance imply the higher probability
of connection between them. The index counts all paths between a pair of nodes and
107
assigns more weights to the shorter paths. It is defined as:
Katz(x, y) =∞∑l=1
βl.|pathlx,y| (4.8)
where β is a parameter to regulate the path’s weights and pathlx,y is the set of all
paths between nodes x and y with the length of l.
FriendLink is a path-based index which measures the similarity between two nodes
x and y, by counting the number of paths of varying length between them. The
assumption is that all the paths regardless of their lengths must be considered in the
estimation process. The index is defined as:
FL(x, y) =l∑
i=2
1
i− 1.|pathix,y|∏ij=2 (n− j)
(4.9)
Where n is the number of nodes in the network,l is the maximum length of a path,
1/(i − 1) is the parameter to regulate the paths’ weights based on their length, and
pathix,y is the number of all length-i paths between the nodes.
In addition, maximum likelihood and probabilistic models approaches which are
supervised methods are also used to solve the link prediction problem. In [8], the
authors proposed a maximum likelihood method for prediction of missing links in
networks. Their assumption is that the network has a hierarchical structure. They
proposed a method to identify the hierarchical fabric of the network to make a den-
drogram called hierarchical random graph. They introduced a method to assign a
probability of connection between a pair of nodes in the dendrogram by using sam-
pling. Their ultimate target is to find the dendrogram that best fits the observed
network and predict the missing links in such network. Compare to simple similarity
indexes, these models can predict the links more accurately, but by increasing the
size of the network (|network| > 104), they become impractical because of their time
complexity [16, 18, 38].
108
Evolutionary and swarm-based approaches are also used to solve the problem
that have been proposed in recent years [5, 32, 7, 35]. In [5], the authors have used
the Covariance Matrix Adaption Evolutionary Strategy (CMA-ES) to optimize the
prediction accuracy. They suggested a linear model for combining common neighbor’s
similarity indexes and nodes specific information by assigning a weight to each index.
They mentioned that the limitation of their work is that the optimal model may not
be linear. On the other hand, the model does not need any prior information about
the network which is the main advantage of this model. In addition, their proposed
model can be applied to various networks regardless of the types.
In [7], the authors proposed an algorithm based on ant colony optimization to solve
the problem. The model relies on the subgraph evolution. Random walk strategy has
been implemented in their algorithm to select paths. The probability is assigned to
an edge to help an artificial ant select a better edge. In each iteration, the quality of
the paths is evaluated to update the probabilities for the next iterations. Finally, the
path with higher quality is selected as a link which has more likelihood to appear.
The optimization part consists of three main steps. First, the probability of traversal
of an ant from node x to node y in the graph must be computed. The second is
releasing the pheromone on the traversed path from the home to the food source
(destination). The final step is pheromone evaporation which is essential to find the
shortest path in the network.
In [9], the authors proposed a prediction model to estimate the missing links in the
network using the obtained information from the community structure. The model,
extract the community structures and compute the number of times that a pair of
nodes appeared together a community under different resolutions. The likelihood of
a connection between them then will be calculated.
Since the future has not come yet, validation and verification of the link prediction
algorithms is a challenging task. Therefore, to test and evaluate the performance
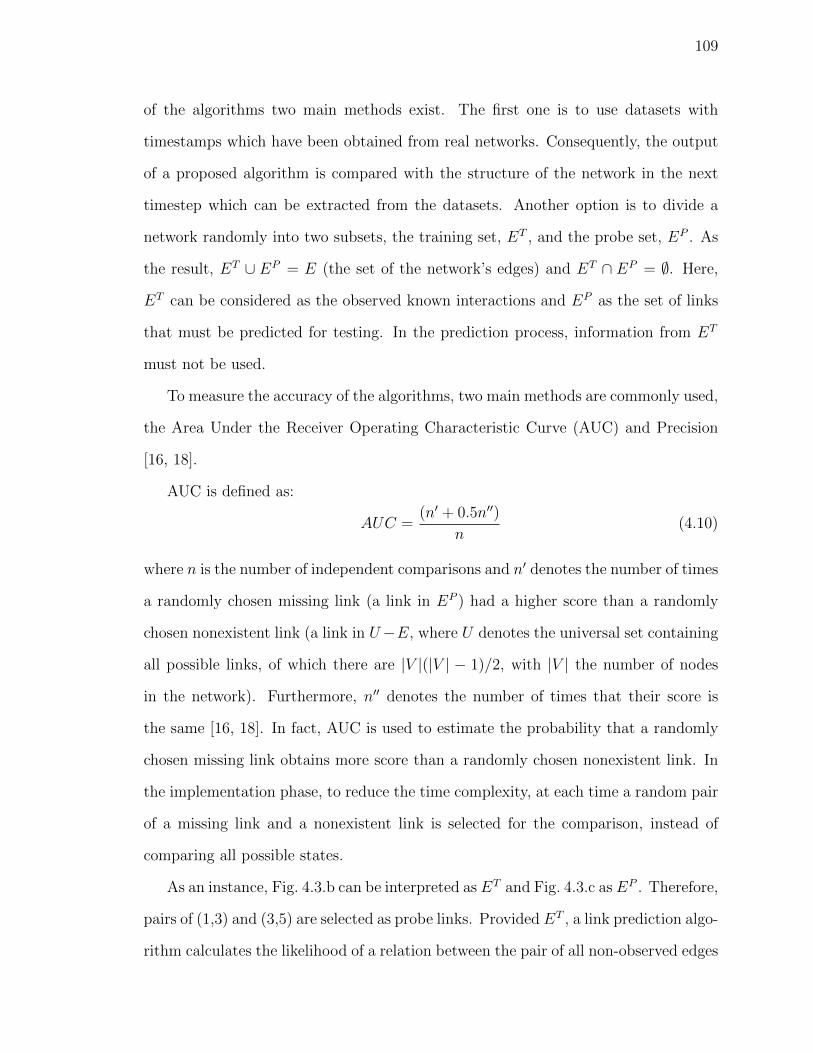
109
of the algorithms two main methods exist. The first one is to use datasets with
timestamps which have been obtained from real networks. Consequently, the output
of a proposed algorithm is compared with the structure of the network in the next
timestep which can be extracted from the datasets. Another option is to divide a
network randomly into two subsets, the training set, ET , and the probe set, EP . As
the result, ET ∪ EP = E (the set of the network’s edges) and ET ∩ EP = ∅. Here,
ET can be considered as the observed known interactions and EP as the set of links
that must be predicted for testing. In the prediction process, information from ET
must not be used.
To measure the accuracy of the algorithms, two main methods are commonly used,
the Area Under the Receiver Operating Characteristic Curve (AUC) and Precision
[16, 18].
AUC is defined as:
AUC =(n′ + 0.5n′′)
n(4.10)
where n is the number of independent comparisons and n′ denotes the number of times
a randomly chosen missing link (a link in EP ) had a higher score than a randomly
chosen nonexistent link (a link in U−E, where U denotes the universal set containing
all possible links, of which there are |V |(|V | − 1)/2, with |V | the number of nodes
in the network). Furthermore, n′′ denotes the number of times that their score is
the same [16, 18]. In fact, AUC is used to estimate the probability that a randomly
chosen missing link obtains more score than a randomly chosen nonexistent link. In
the implementation phase, to reduce the time complexity, at each time a random pair
of a missing link and a nonexistent link is selected for the comparison, instead of
comparing all possible states.
As an instance, Fig. 4.3.b can be interpreted as ET and Fig. 4.3.c as EP . Therefore,
pairs of (1,3) and (3,5) are selected as probe links. Provided ET , a link prediction algo-
rithm calculates the likelihood of a relation between the pair of all non-observed edges
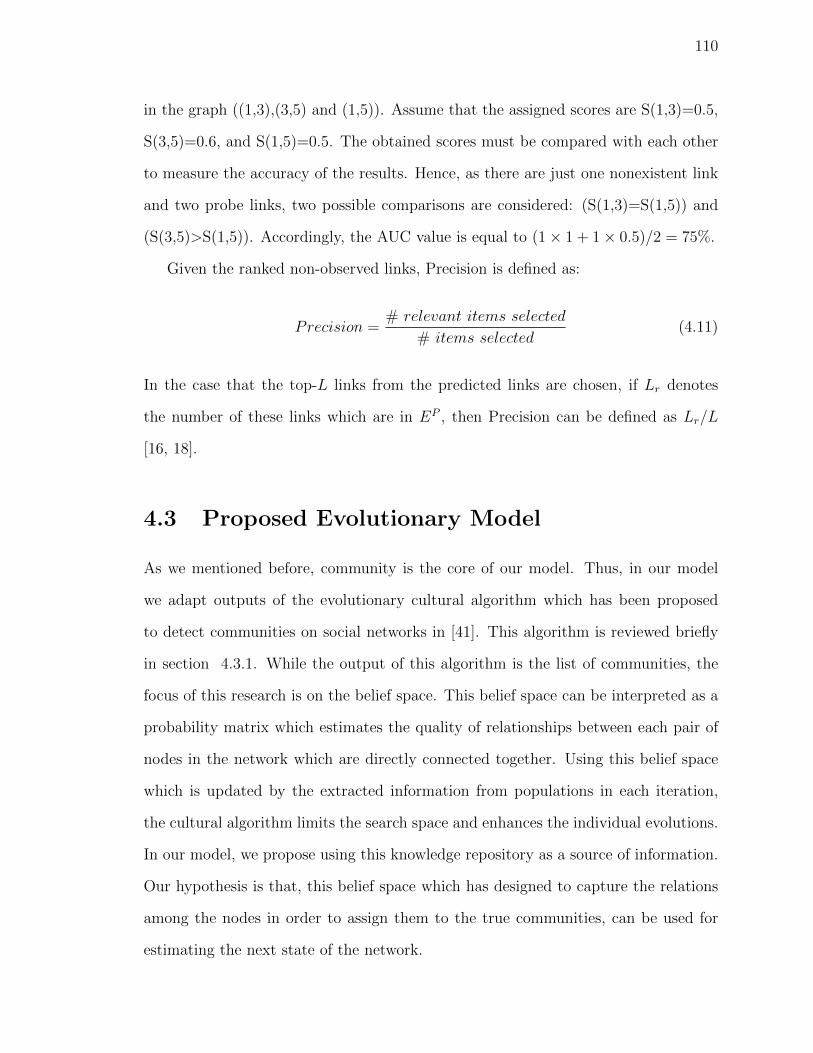
110
in the graph ((1,3),(3,5) and (1,5)). Assume that the assigned scores are S(1,3)=0.5,
S(3,5)=0.6, and S(1,5)=0.5. The obtained scores must be compared with each other
to measure the accuracy of the results. Hence, as there are just one nonexistent link
and two probe links, two possible comparisons are considered: (S(1,3)=S(1,5)) and
(S(3,5)>S(1,5)). Accordingly, the AUC value is equal to (1× 1 + 1× 0.5)/2 = 75%.
Given the ranked non-observed links, Precision is defined as:
Precision =# relevant items selected
# items selected(4.11)
In the case that the top-L links from the predicted links are chosen, if Lr denotes
the number of these links which are in EP , then Precision can be defined as Lr/L
[16, 18].
4.3 Proposed Evolutionary Model
As we mentioned before, community is the core of our model. Thus, in our model
we adapt outputs of the evolutionary cultural algorithm which has been proposed
to detect communities on social networks in [41]. This algorithm is reviewed briefly
in section 4.3.1. While the output of this algorithm is the list of communities, the
focus of this research is on the belief space. This belief space can be interpreted as a
probability matrix which estimates the quality of relationships between each pair of
nodes in the network which are directly connected together. Using this belief space
which is updated by the extracted information from populations in each iteration,
the cultural algorithm limits the search space and enhances the individual evolutions.
In our model, we propose using this knowledge repository as a source of information.
Our hypothesis is that, this belief space which has designed to capture the relations
among the nodes in order to assign them to the true communities, can be used for
estimating the next state of the network.
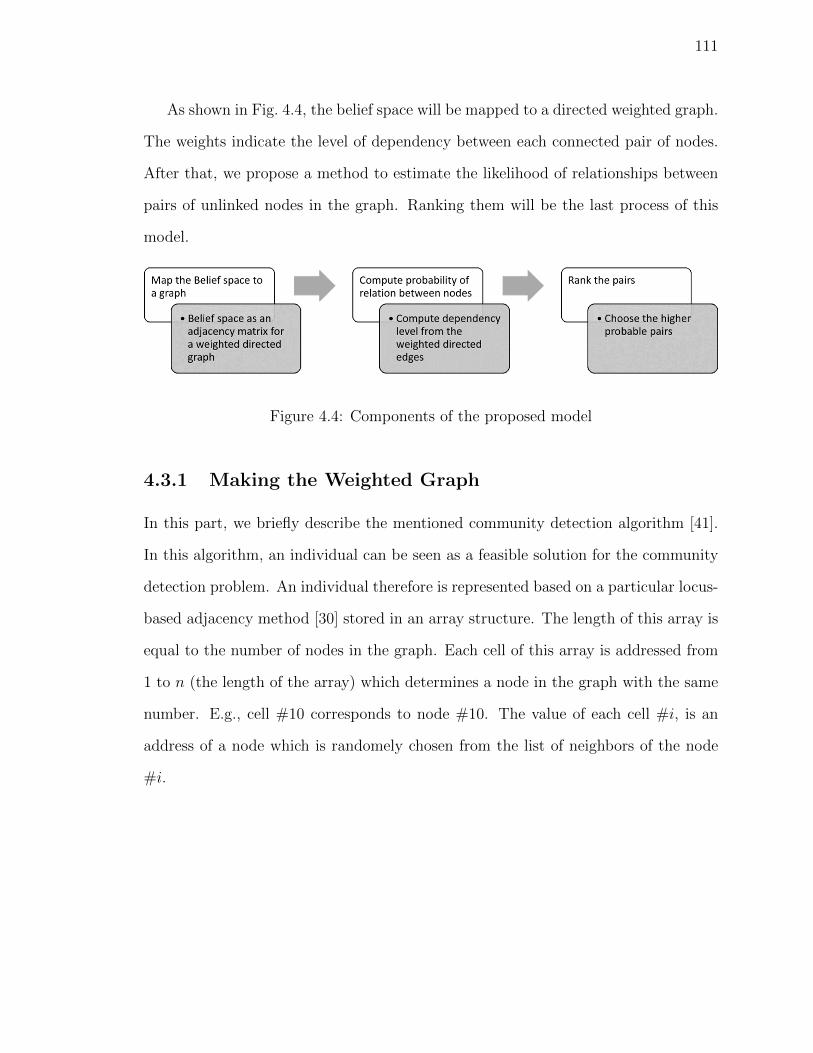
111
As shown in Fig. 4.4, the belief space will be mapped to a directed weighted graph.
The weights indicate the level of dependency between each connected pair of nodes.
After that, we propose a method to estimate the likelihood of relationships between
pairs of unlinked nodes in the graph. Ranking them will be the last process of this
model.
Figure 4.4: Components of the proposed model
4.3.1 Making the Weighted Graph
In this part, we briefly describe the mentioned community detection algorithm [41].
In this algorithm, an individual can be seen as a feasible solution for the community
detection problem. An individual therefore is represented based on a particular locus-
based adjacency method [30] stored in an array structure. The length of this array is
equal to the number of nodes in the graph. Each cell of this array is addressed from
1 to n (the length of the array) which determines a node in the graph with the same
number. E.g., cell #10 corresponds to node #10. The value of each cell #i, is an
address of a node which is randomely chosen from the list of neighbors of the node
#i.
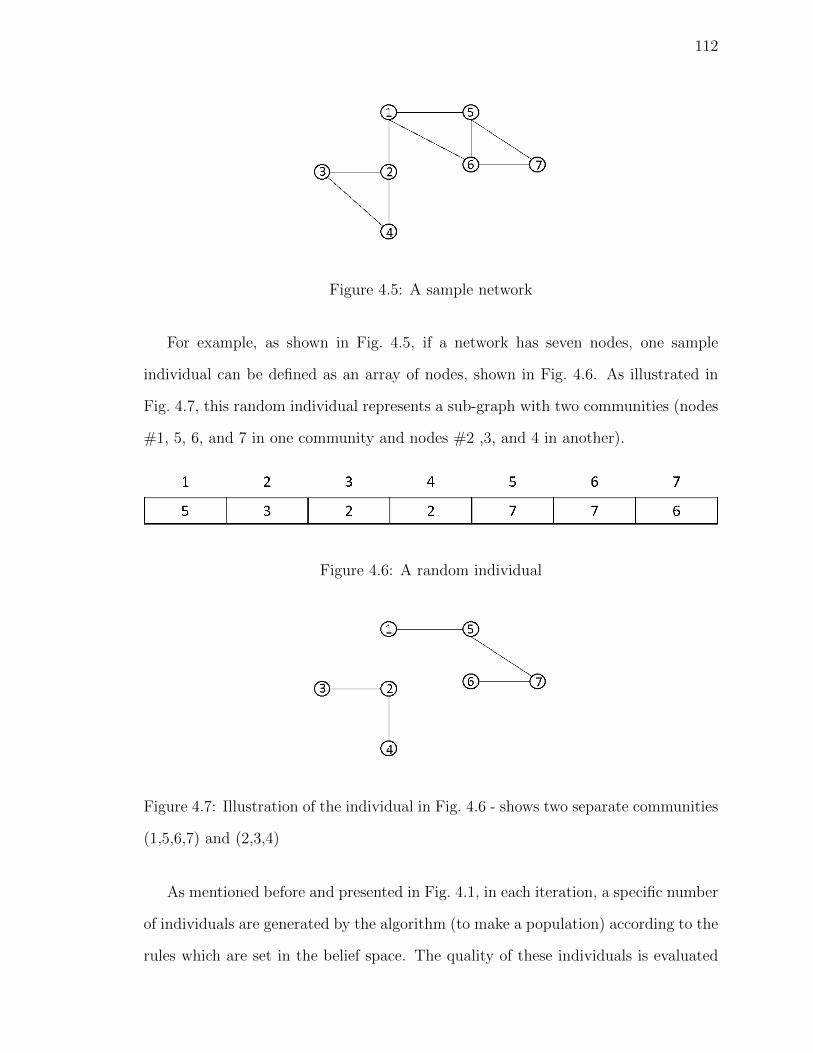
112
Figure 4.5: A sample network
For example, as shown in Fig. 4.5, if a network has seven nodes, one sample
individual can be defined as an array of nodes, shown in Fig. 4.6. As illustrated in
Fig. 4.7, this random individual represents a sub-graph with two communities (nodes
#1, 5, 6, and 7 in one community and nodes #2 ,3, and 4 in another).
Figure 4.6: A random individual
Figure 4.7: Illustration of the individual in Fig. 4.6 - shows two separate communities
(1,5,6,7) and (2,3,4)
As mentioned before and presented in Fig. 4.1, in each iteration, a specific number
of individuals are generated by the algorithm (to make a population) according to the
rules which are set in the belief space. The quality of these individuals is evaluated
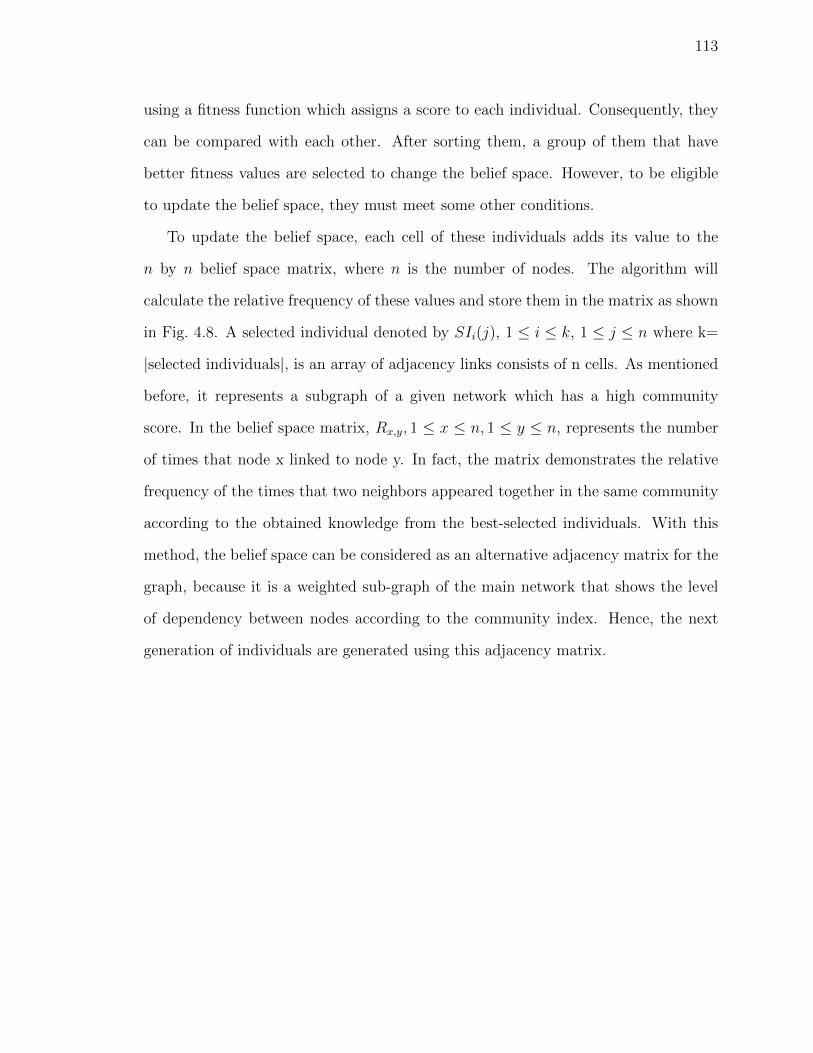
113
using a fitness function which assigns a score to each individual. Consequently, they
can be compared with each other. After sorting them, a group of them that have
better fitness values are selected to change the belief space. However, to be eligible
to update the belief space, they must meet some other conditions.
To update the belief space, each cell of these individuals adds its value to the
n by n belief space matrix, where n is the number of nodes. The algorithm will
calculate the relative frequency of these values and store them in the matrix as shown
in Fig. 4.8. A selected individual denoted by SIi(j), 1 ≤ i ≤ k, 1 ≤ j ≤ n where k=
|selected individuals|, is an array of adjacency links consists of n cells. As mentioned
before, it represents a subgraph of a given network which has a high community
score. In the belief space matrix, Rx,y, 1 ≤ x ≤ n, 1 ≤ y ≤ n, represents the number
of times that node x linked to node y. In fact, the matrix demonstrates the relative
frequency of the times that two neighbors appeared together in the same community
according to the obtained knowledge from the best-selected individuals. With this
method, the belief space can be considered as an alternative adjacency matrix for the
graph, because it is a weighted sub-graph of the main network that shows the level
of dependency between nodes according to the community index. Hence, the next
generation of individuals are generated using this adjacency matrix.
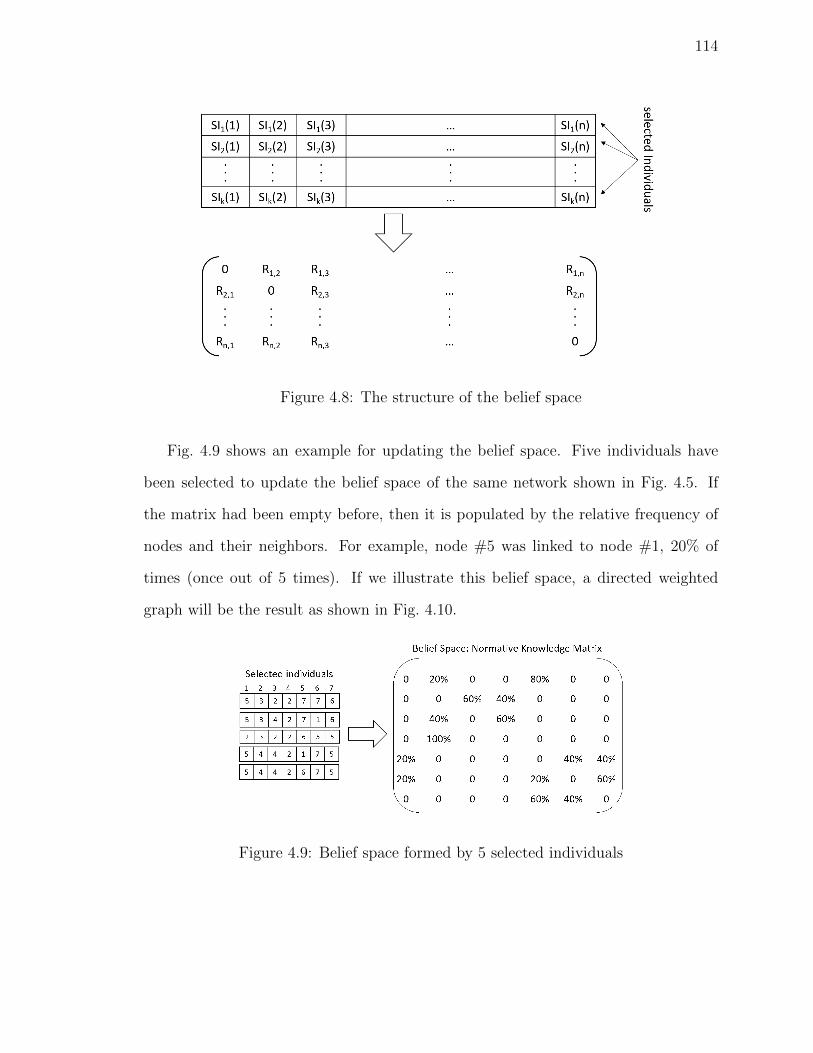
114
Figure 4.8: The structure of the belief space
Fig. 4.9 shows an example for updating the belief space. Five individuals have
been selected to update the belief space of the same network shown in Fig. 4.5. If
the matrix had been empty before, then it is populated by the relative frequency of
nodes and their neighbors. For example, node #5 was linked to node #1, 20% of
times (once out of 5 times). If we illustrate this belief space, a directed weighted
graph will be the result as shown in Fig. 4.10.
Figure 4.9: Belief space formed by 5 selected individuals
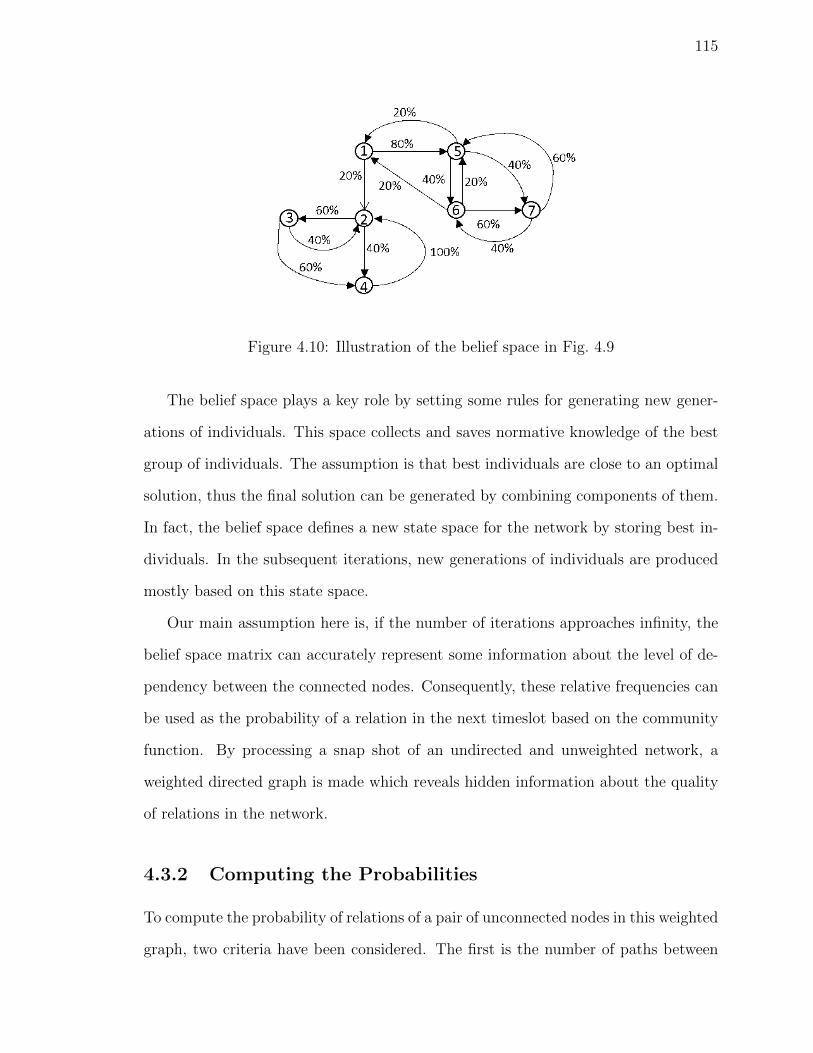
115
Figure 4.10: Illustration of the belief space in Fig. 4.9
The belief space plays a key role by setting some rules for generating new gener-
ations of individuals. This space collects and saves normative knowledge of the best
group of individuals. The assumption is that best individuals are close to an optimal
solution, thus the final solution can be generated by combining components of them.
In fact, the belief space defines a new state space for the network by storing best in-
dividuals. In the subsequent iterations, new generations of individuals are produced
mostly based on this state space.
Our main assumption here is, if the number of iterations approaches infinity, the
belief space matrix can accurately represent some information about the level of de-
pendency between the connected nodes. Consequently, these relative frequencies can
be used as the probability of a relation in the next timeslot based on the community
function. By processing a snap shot of an undirected and unweighted network, a
weighted directed graph is made which reveals hidden information about the quality
of relations in the network.
4.3.2 Computing the Probabilities
To compute the probability of relations of a pair of unconnected nodes in this weighted
graph, two criteria have been considered. The first is the number of paths between
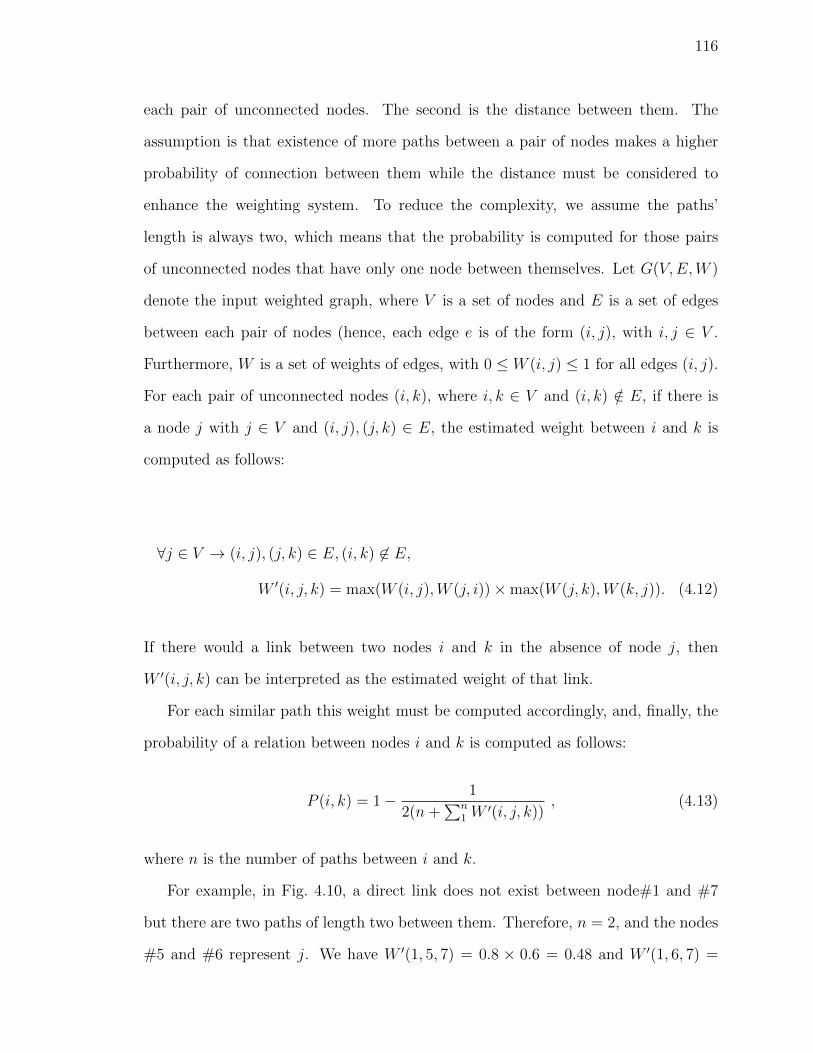
116
each pair of unconnected nodes. The second is the distance between them. The
assumption is that existence of more paths between a pair of nodes makes a higher
probability of connection between them while the distance must be considered to
enhance the weighting system. To reduce the complexity, we assume the paths’
length is always two, which means that the probability is computed for those pairs
of unconnected nodes that have only one node between themselves. Let G(V,E,W )
denote the input weighted graph, where V is a set of nodes and E is a set of edges
between each pair of nodes (hence, each edge e is of the form (i, j), with i, j ∈ V .
Furthermore, W is a set of weights of edges, with 0 ≤ W (i, j) ≤ 1 for all edges (i, j).
For each pair of unconnected nodes (i, k), where i, k ∈ V and (i, k) /∈ E, if there is
a node j with j ∈ V and (i, j), (j, k) ∈ E, the estimated weight between i and k is
computed as follows:
∀j ∈ V → (i, j), (j, k) ∈ E, (i, k) 6∈ E,
W ′(i, j, k) = max(W (i, j),W (j, i))×max(W (j, k),W (k, j)). (4.12)
If there would a link between two nodes i and k in the absence of node j, then
W ′(i, j, k) can be interpreted as the estimated weight of that link.
For each similar path this weight must be computed accordingly, and, finally, the
probability of a relation between nodes i and k is computed as follows:
P (i, k) = 1− 1
2(n+∑n
1 W′(i, j, k))
, (4.13)
where n is the number of paths between i and k.
For example, in Fig. 4.10, a direct link does not exist between node#1 and #7
but there are two paths of length two between them. Therefore, n = 2, and the nodes
#5 and #6 represent j. We have W ′(1, 5, 7) = 0.8 × 0.6 = 0.48 and W ′(1, 6, 7) =

117
0.2× 0.6 = 0.12, and P (1, 7) = 1− (1/(2× (2 + 0.6)) = 0.6153.
4.3.3 Ranking the Probabilities
After calculating all the probabilities, the predicted pairs must be ranked based on
their probabilities. Finally, the top-L of them will be selected as the final predicted
edges. This process is shown in the following algorithm:
Algoritm CA-LP (G,A,B,L)
Input:
G: an undirected and unweighted graph, G(V,E)
A: adjacency matrix of G
B: Belief Space matrix
L: desired number of top predicted links
Output:
O: n*n matrix of L probabilities where
O(i,j)=P(i,j), ( i,j are members of V)
Main:
1: Map Belief space to a weighted directed Graph
2: Compute P(i,k) by extracting weights from B according to
(12) and (13), for all pairs where A(i,k)=0 and A(i,j), A(j,k)=1
3: Store probabilities in a array
4: Sort the array
5: Choose the top-L and store in O where O(i,k)=P(i,k)
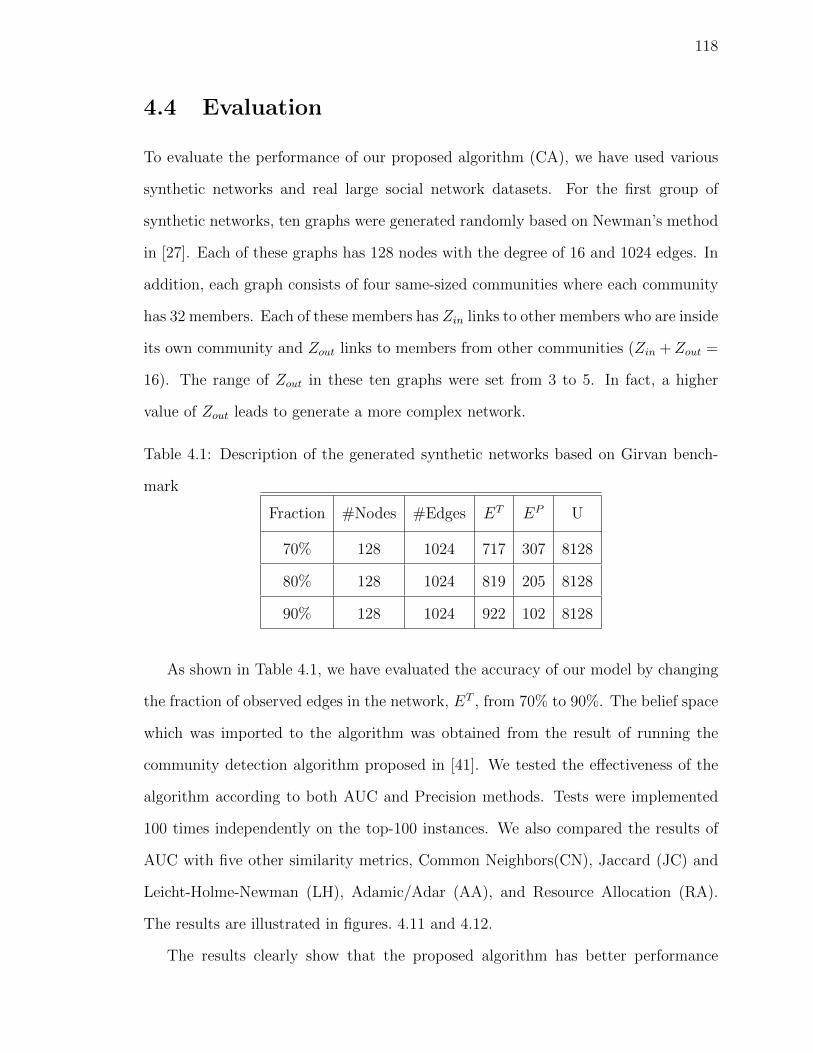
118
4.4 Evaluation
To evaluate the performance of our proposed algorithm (CA), we have used various
synthetic networks and real large social network datasets. For the first group of
synthetic networks, ten graphs were generated randomly based on Newman’s method
in [27]. Each of these graphs has 128 nodes with the degree of 16 and 1024 edges. In
addition, each graph consists of four same-sized communities where each community
has 32 members. Each of these members has Zin links to other members who are inside
its own community and Zout links to members from other communities (Zin +Zout =
16). The range of Zout in these ten graphs were set from 3 to 5. In fact, a higher
value of Zout leads to generate a more complex network.
Table 4.1: Description of the generated synthetic networks based on Girvan bench-
mark
Fraction #Nodes #Edges ET EP U
70% 128 1024 717 307 8128
80% 128 1024 819 205 8128
90% 128 1024 922 102 8128
As shown in Table 4.1, we have evaluated the accuracy of our model by changing
the fraction of observed edges in the network, ET , from 70% to 90%. The belief space
which was imported to the algorithm was obtained from the result of running the
community detection algorithm proposed in [41]. We tested the effectiveness of the
algorithm according to both AUC and Precision methods. Tests were implemented
100 times independently on the top-100 instances. We also compared the results of
AUC with five other similarity metrics, Common Neighbors(CN), Jaccard (JC) and
Leicht-Holme-Newman (LH), Adamic/Adar (AA), and Resource Allocation (RA).
The results are illustrated in figures. 4.11 and 4.12.
The results clearly show that the proposed algorithm has better performance
119
in comparison with other metrics on this group of synthetic networks. However,
by reducing the number of observed edges, the accuracy of the algorithm reduced
significantly. The main reason for this issue is that the community detection algorithm
can not find the true communities when the system is very noisy. In fact, by removing
a considerable amount of edges from the network randomly, the community structure
which is the base of this model will be affected.
Another interesting observation is that, by increasing the complexity of the net-
work (Zout > 4) the performance of the algorithm reduced significantly. We believe
the cause to be the increasing rate of errors in the community detection algorithm
when Zout becomes larger.
In addition to Precision, we also compared the top-l predicted links calculated
by the algorithm, l = |EP |, with the probe set, EP . As a result, in average 78.28%
of the predicted links were among the probe set when the fraction of the observed
network was 90%. It was 77.85% and 75.14% when the fraction were 80% and 70%
respectively. It means that the algorithm could predict the correct links with an
accuracy of more than 75%.
We have also evaluated the performance of our algorithm on another group of
synthetic networks. The previous benchmark is useful to create a network with 128
nodes but does not have a mechanism to generate bigger network. Therefore, we
have generated various networks based on LFR benchmark in [20, 19]. By using
this benchmark, we can generate power-law networks with customized features. We
generated two groups of 1000 and 3000 nodes graphs. For each group, three graphs
have been generated at different levels of complexity. In total, six more synthetic
networks have been generated based on the LFR benchmark as shown in Table 4.2.
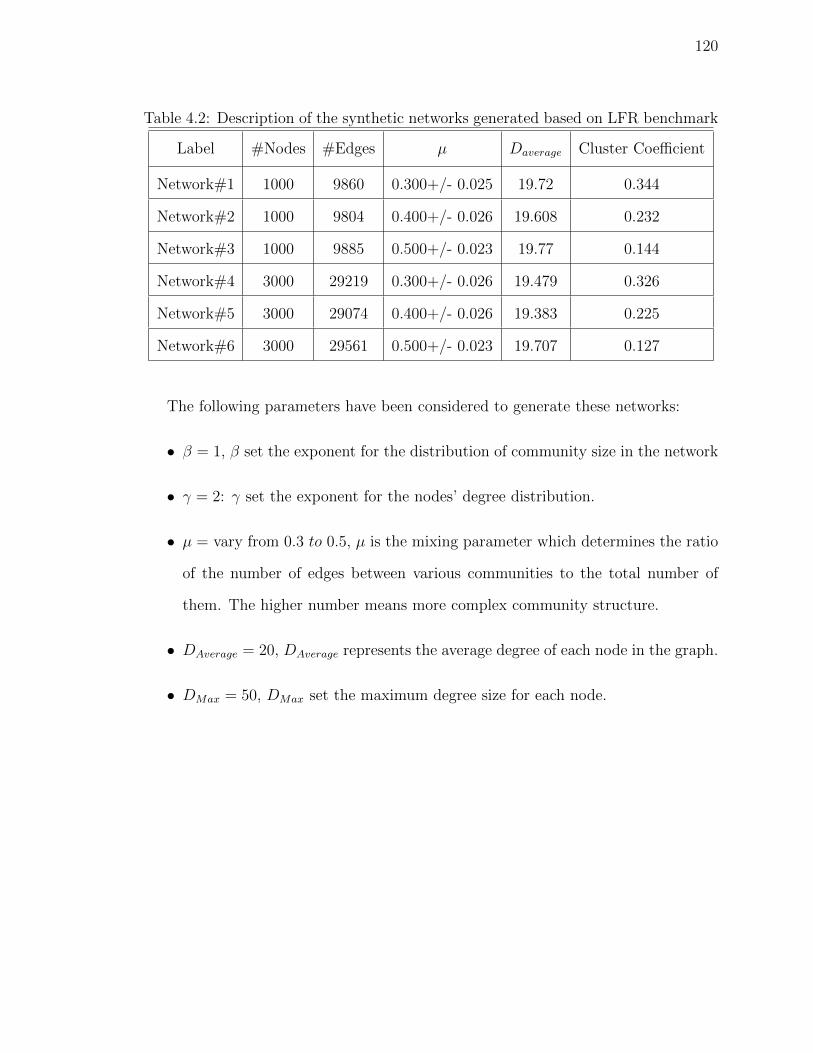
120
Table 4.2: Description of the synthetic networks generated based on LFR benchmark
Label #Nodes #Edges µ Daverage Cluster Coefficient
Network#1 1000 9860 0.300+/- 0.025 19.72 0.344
Network#2 1000 9804 0.400+/- 0.026 19.608 0.232
Network#3 1000 9885 0.500+/- 0.023 19.77 0.144
Network#4 3000 29219 0.300+/- 0.026 19.479 0.326
Network#5 3000 29074 0.400+/- 0.026 19.383 0.225
Network#6 3000 29561 0.500+/- 0.023 19.707 0.127
The following parameters have been considered to generate these networks:
• β = 1, β set the exponent for the distribution of community size in the network
• γ = 2: γ set the exponent for the nodes’ degree distribution.
• µ = vary from 0.3 to 0.5, µ is the mixing parameter which determines the ratio
of the number of edges between various communities to the total number of
them. The higher number means more complex community structure.
• DAverage = 20, DAverage represents the average degree of each node in the graph.
• DMax = 50, DMax set the maximum degree size for each node.
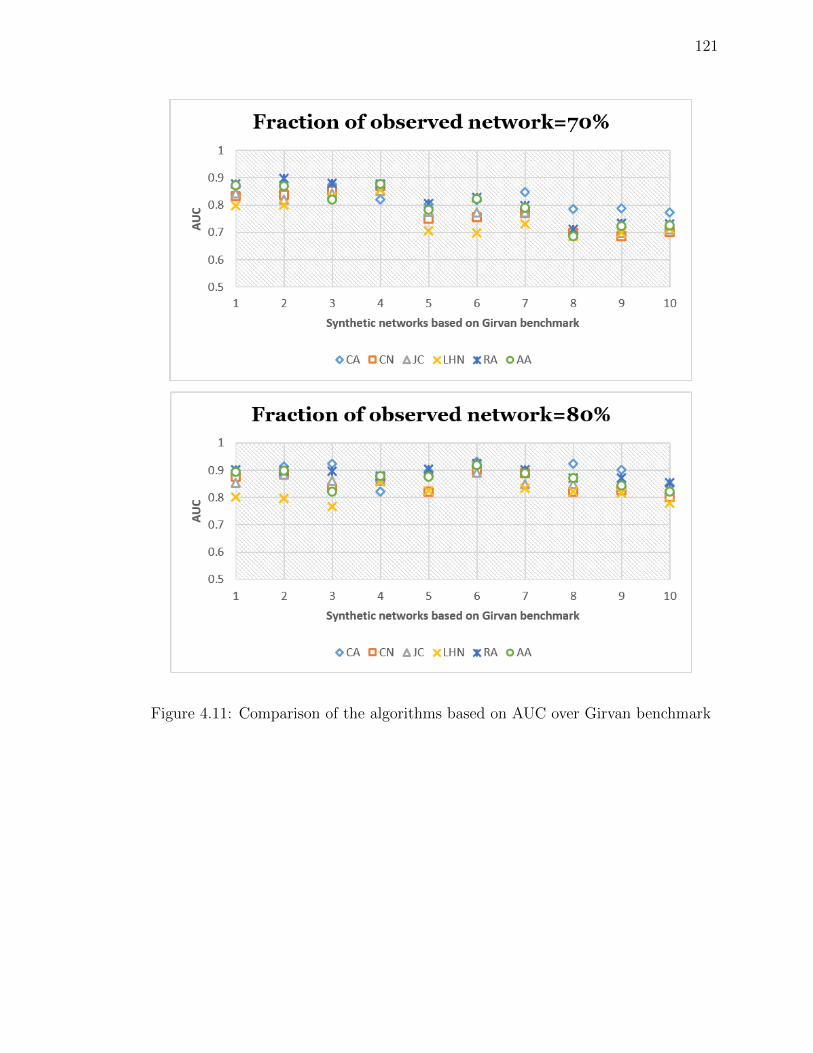
121
Figure 4.11: Comparison of the algorithms based on AUC over Girvan benchmark
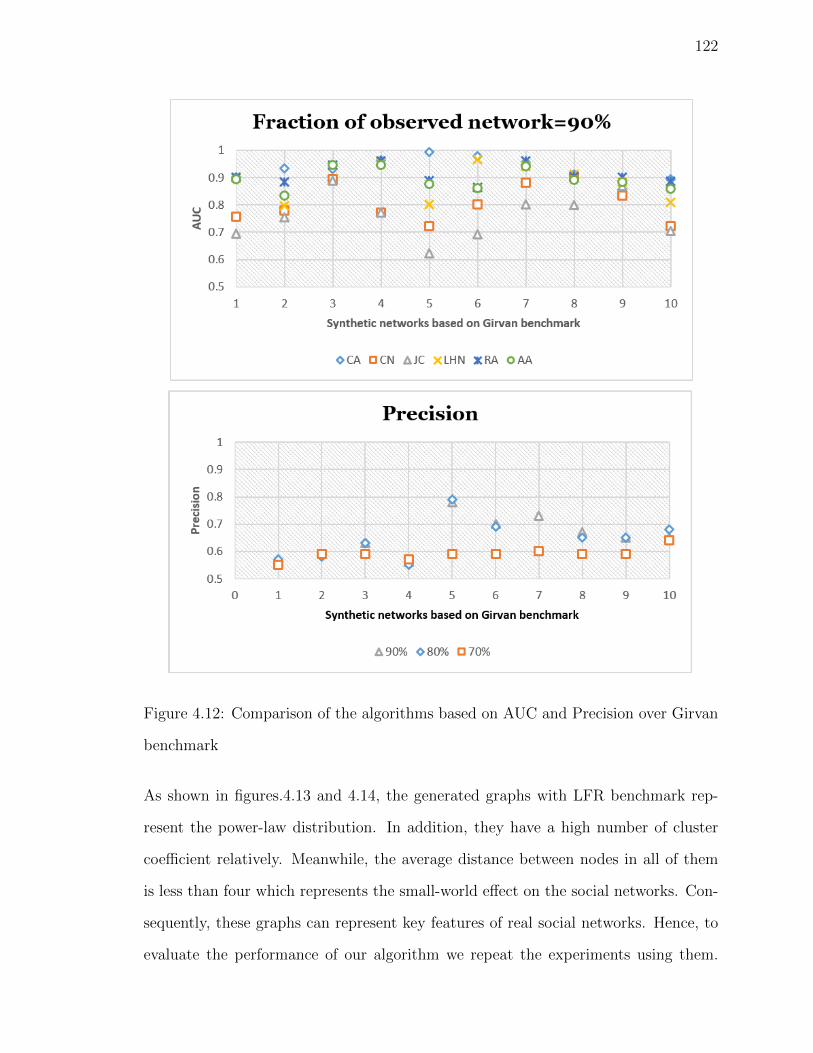
122
Figure 4.12: Comparison of the algorithms based on AUC and Precision over Girvan
benchmark
As shown in figures.4.13 and 4.14, the generated graphs with LFR benchmark rep-
resent the power-law distribution. In addition, they have a high number of cluster
coefficient relatively. Meanwhile, the average distance between nodes in all of them
is less than four which represents the small-world effect on the social networks. Con-
sequently, these graphs can represent key features of real social networks. Hence, to
evaluate the performance of our algorithm we repeat the experiments using them.
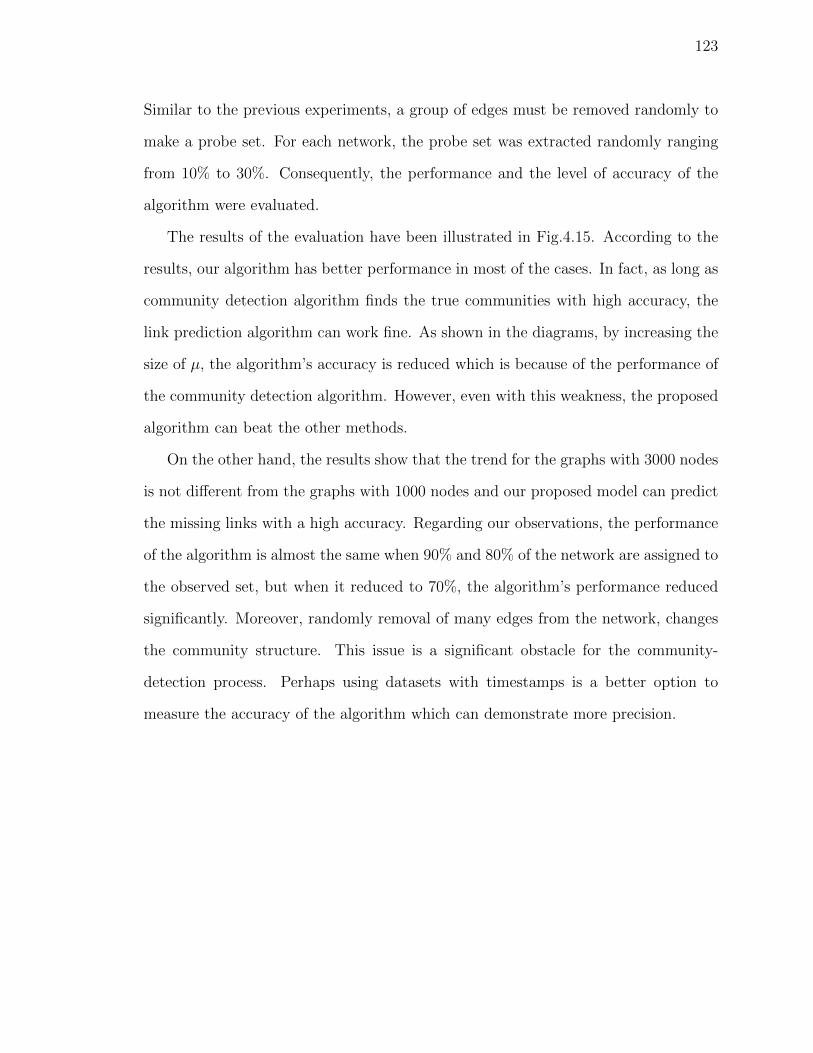
123
Similar to the previous experiments, a group of edges must be removed randomly to
make a probe set. For each network, the probe set was extracted randomly ranging
from 10% to 30%. Consequently, the performance and the level of accuracy of the
algorithm were evaluated.
The results of the evaluation have been illustrated in Fig.4.15. According to the
results, our algorithm has better performance in most of the cases. In fact, as long as
community detection algorithm finds the true communities with high accuracy, the
link prediction algorithm can work fine. As shown in the diagrams, by increasing the
size of µ, the algorithm’s accuracy is reduced which is because of the performance of
the community detection algorithm. However, even with this weakness, the proposed
algorithm can beat the other methods.
On the other hand, the results show that the trend for the graphs with 3000 nodes
is not different from the graphs with 1000 nodes and our proposed model can predict
the missing links with a high accuracy. Regarding our observations, the performance
of the algorithm is almost the same when 90% and 80% of the network are assigned to
the observed set, but when it reduced to 70%, the algorithm’s performance reduced
significantly. Moreover, randomly removal of many edges from the network, changes
the community structure. This issue is a significant obstacle for the community-
detection process. Perhaps using datasets with timestamps is a better option to
measure the accuracy of the algorithm which can demonstrate more precision.
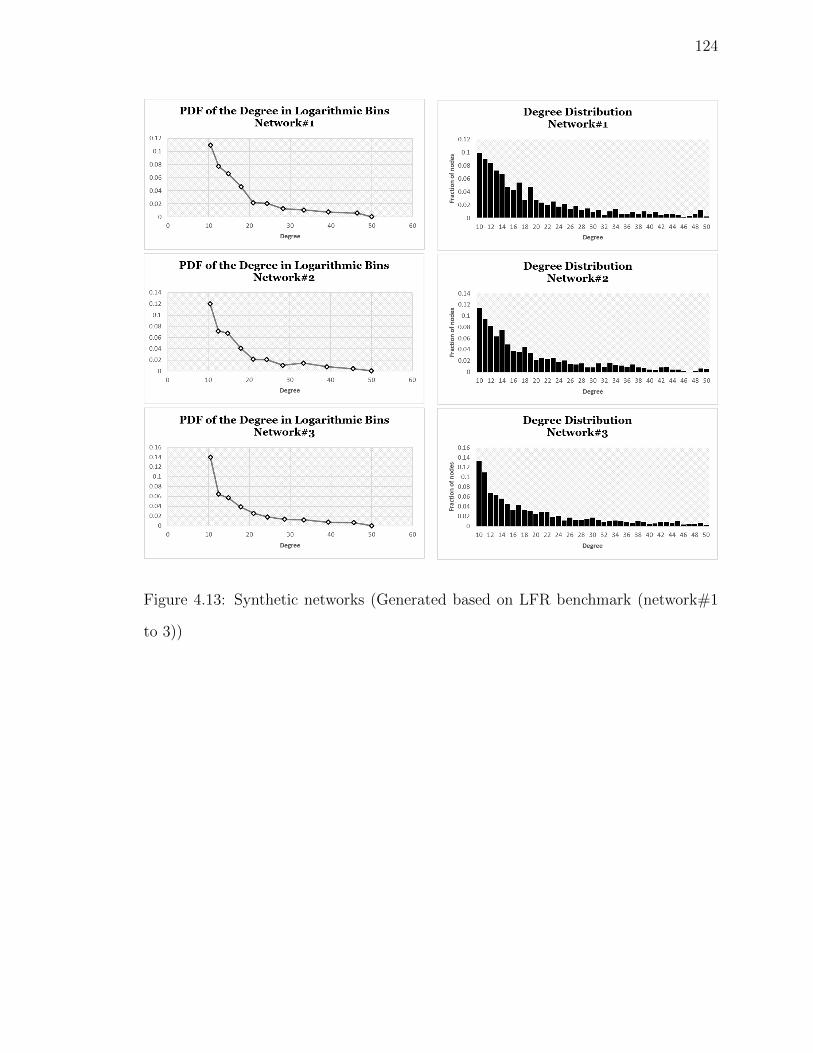
124
Figure 4.13: Synthetic networks (Generated based on LFR benchmark (network#1
to 3))
125
Figure 4.14: Synthetic networks (Generated based on LFR benchmark (network#4
to 6))

126
Figure 4.15: Comparison of the algorithms based on AUC over LFR benchmark
We also tested the performance of our proposed algorithm on a real-world big
dataset, Orkut, with 117,185,083 edges [40]. The dataset obtained from the Stanford
Large Network Dataset Repository [23] is a benchmark dataset used by researchers
in social network analysis. Another reason for selecting this dataset is that it is
a network with ground-truth communities which make us possible to validate our
results. Information about this dataset is represented in Table 4.3.
Table 4.3: Orkut Dataset Specification
#Nodes #Edges Cluster Coefficient ET EP U
3072441 117185083 0.1666 105466575 11718508 4719945313020
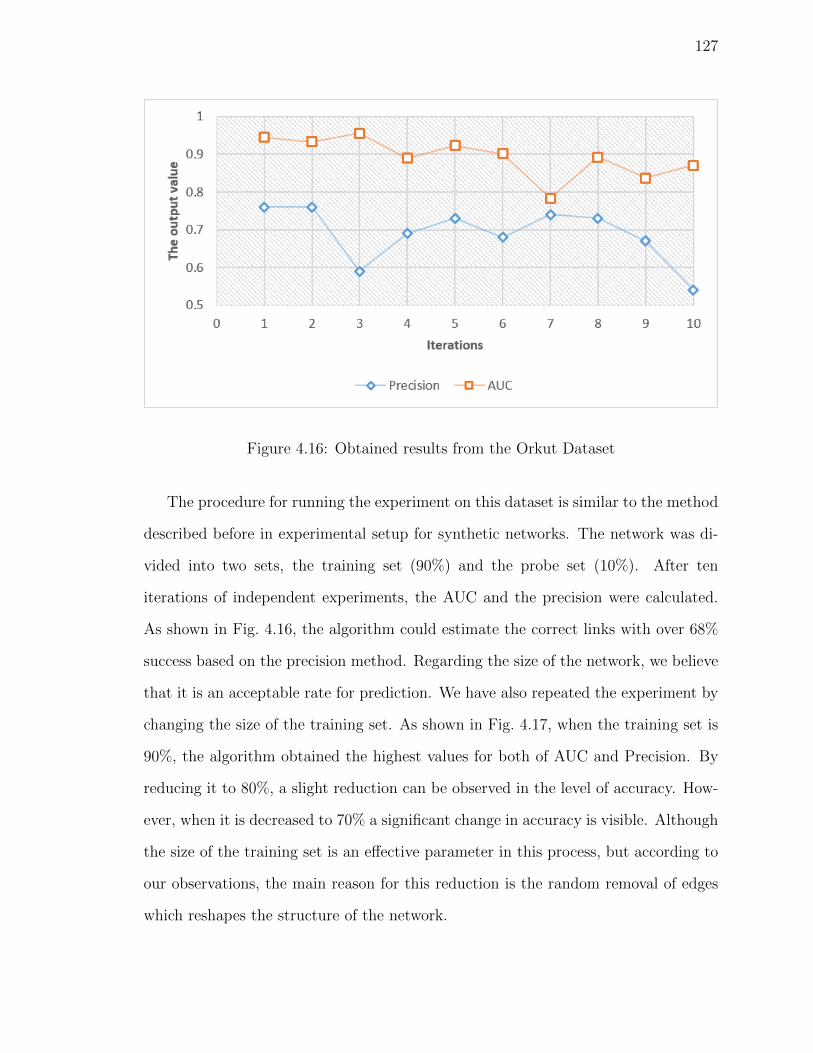
127
Figure 4.16: Obtained results from the Orkut Dataset
The procedure for running the experiment on this dataset is similar to the method
described before in experimental setup for synthetic networks. The network was di-
vided into two sets, the training set (90%) and the probe set (10%). After ten
iterations of independent experiments, the AUC and the precision were calculated.
As shown in Fig. 4.16, the algorithm could estimate the correct links with over 68%
success based on the precision method. Regarding the size of the network, we believe
that it is an acceptable rate for prediction. We have also repeated the experiment by
changing the size of the training set. As shown in Fig. 4.17, when the training set is
90%, the algorithm obtained the highest values for both of AUC and Precision. By
reducing it to 80%, a slight reduction can be observed in the level of accuracy. How-
ever, when it is decreased to 70% a significant change in accuracy is visible. Although
the size of the training set is an effective parameter in this process, but according to
our observations, the main reason for this reduction is the random removal of edges
which reshapes the structure of the network.
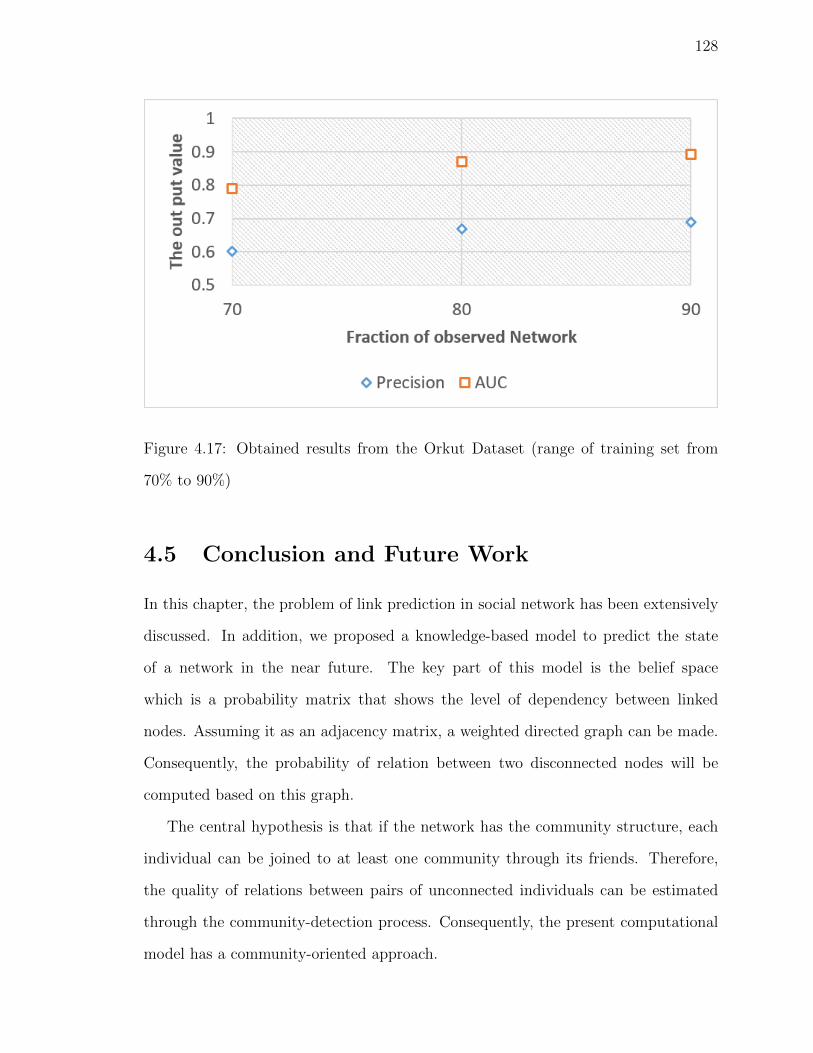
128
Figure 4.17: Obtained results from the Orkut Dataset (range of training set from
70% to 90%)
4.5 Conclusion and Future Work
In this chapter, the problem of link prediction in social network has been extensively
discussed. In addition, we proposed a knowledge-based model to predict the state
of a network in the near future. The key part of this model is the belief space
which is a probability matrix that shows the level of dependency between linked
nodes. Assuming it as an adjacency matrix, a weighted directed graph can be made.
Consequently, the probability of relation between two disconnected nodes will be
computed based on this graph.
The central hypothesis is that if the network has the community structure, each
individual can be joined to at least one community through its friends. Therefore,
the quality of relations between pairs of unconnected individuals can be estimated
through the community-detection process. Consequently, the present computational
model has a community-oriented approach.

129
We evaluated the performance of our algorithm on various synthetic networks and
real-world datasets and compared it with three other metrics. AUC (Area under
the curve) and Precision measurements have been used to evaluate the performance
of the model against several well-known other methods. The results show that our
method can predict the next state of the network with approximately 80% accuracy.
The comparisons show that the proposed method has better performance in respect
of the performance of other methods.
However, we believe that by increasing the number of iterations in the evolutionary
model, the quality of prediction will be improved. Meanwhile, since the size of the
belief space is fixed to the number of nodes, the complexity of the algorithm will not
change based on the number of iterations or the number of edges.
The main contributions of this research can be summarized in the following items:
• Proposing a method for estimating the quality of links between a pair of nodes
in the network
• Introducing a novel method to use the concept of community as a similarity
index.
• Employing the cultural algorithm as a knowledge-based evolutionary algorithm
for the link prediction problem in social networks.
In the future, we would like to observe the performance of the algorithm in different
types of social networks and extend our work to multiple networks. Currently, we have
tested the algorithm using the common standard procedure of dividing the training
and probe set randomly in the ratio of 70-90% and 10-30%, in the future we would
like to test the performance on different rates to find the optimal training size.
130
References
[1] Lada A Adamic, Rajan M Lukose, Amit R Puniyani, and Bernardo A Huberman.
Search in power-law networks. Physical review E, 64(4):046135, 2001.
[2] Luca Maria Aiello, Alain Barrat, Rossano Schifanella, Ciro Cattuto, Benjamin
Markines, and Filippo Menczer. Friendship prediction and homophily in social
media. ACM Transactions on the Web (TWEB), 6(2):9, 2012.
[3] Giulia Berlusconi, Francesco Calderoni, Nicola Parolini, Marco Verani, and Carlo
Piccardi. Link prediction in criminal networks: A tool for criminal intelligence
analysis. PloS one, 11(4):e0154244, 2016.
[4] Prantik Bhattacharyya, Ankush Garg, and Shyhtsun Felix Wu. Analysis of user
keyword similarity in online social networks. Social Network Analysis and Min-
ing, 1(3):143–158, 2011.
[5] Catherine A. Bliss, Morgan R. Frank, Christopher M. Danforth, and Peter Sheri-
dan Dodds. An evolutionary algorithm approach to link prediction in dynamic
social networks. J. Comput. Science, 5(5):750–764, 2014.
[6] Pete Burnap, Rachel Gibson, Luke Sloan, Rosalynd Southern, and Matthew
Williams. 140 characters to victory?: Using twitter to predict the {UK} 2015
general election. Electoral Studies, 41:230 – 233, 2016.
131
[7] Bolun Chen and Ling Chen. A link prediction algorithm based on ant colony
optimization. Appl. Intell., 41(3):694–708, 2014.
[8] Aaron Clauset, Cristopher Moore, and Mark EJ Newman. Hierarchical structure
and the prediction of missing links in networks. Nature, 453(7191):98–101, 2008.
[9] Jingyi Ding, Licheng Jiao, Jianshe Wu, Yunting Hou, and Yutao Qi. Predic-
tion of missing links based on multi-resolution community division. Physica A:
Statistical Mechanics and its Applications, 417:76–85, 2015.
[10] Yuxiao Dong, Jie Tang, Sen Wu, Jilei Tian, Nitesh V Chawla, Jinghai Rao,
and Huanhuan Cao. Link prediction and recommendation across heterogeneous
social networks. In 2012 IEEE 12th International Conference on Data Mining,
pages 181–190. IEEE, 2012.
[11] Michael Fire, Lena Tenenboim, Ofrit Lesser, Rami Puzis, Lior Rokach, and Yu-
val Elovici. Link prediction in social networks using computationally efficient
topological features. In PASSAT/SocialCom 2011, Privacy, Security, Risk and
Trust (PASSAT), 2011 IEEE Third International Conference on and 2011 IEEE
Third International Conference on Social Computing (SocialCom), Boston, MA,
USA, 9-11 Oct., 2011, pages 73–80, 2011.
[12] Francesco Folino and Clara Pizzuti. Link Prediction Approaches for Disease
Networks, pages 99–108. Springer Berlin Heidelberg, Berlin, Heidelberg, 2012.
[13] Manish Gaurav, Amit Srivastava, Anoop Kumar, and Scott Miller. Leveraging
candidate popularity on twitter to predict election outcome. In Proceedings of
the 7th Workshop on Social Network Mining and Analysis, SNAKDD ’13, pages
7:1–7:8, New York, NY, USA, 2013. ACM.
132
[14] Eric Gilbert and Karrie Karahalios. Predicting tie strength with social media. In
Proceedings of the SIGCHI conference on human factors in computing systems,
pages 211–220. ACM, 2009.
[15] Neil Zhenqiang Gong, Ameet Talwalkar, Lester Mackey, Ling Huang, Eui
Chul Richard Shin, Emil Stefanov, Elaine (Runting) Shi, and Dawn Song. Joint
link prediction and attribute inference using a social-attribute network. ACM
Trans. Intell. Syst. Technol., 5(2):27:1–27:20, April 2014.
[16] Mohammad Al Hasan and Mohammed J. Zaki. A survey of link prediction in
social networks. In Charu C. Aggarwal, editor, Social Network Data Analytics,
pages 243–275. Springer, 2011.
[17] Buket Kaya and Mustafa Poyraz. Age-series based link prediction in evolving
disease networks. Computers in Biology and Medicine, 63:1 – 10, 2015.
[18] Linyuan L and Tao Zhou. Link prediction in complex networks: A survey.
Physica A: Statistical Mechanics and its Applications, 390(6):1150–1170, 2011.
[19] Andrea Lancichinetti and Santo Fortunato. Community detection algorithms: a
comparative analysis. Physical review E, 80(5):056117, 2009.
[20] Andrea Lancichinetti, Santo Fortunato, and Filippo Radicchi. Benchmark graphs
for testing community detection algorithms. Physical review E, 78(4):046110,
2008.
[21] Elizabeth A Leicht, Petter Holme, and Mark EJ Newman. Vertex similarity in
networks. Physical Review E, 73(2):026120, 2006.
[22] Kristina Lerman, Suradej Intagorn, Jeon-Hyung Kang, and Rumi Ghosh. Us-
ing proximity to predict activity in social networks. In Proceedings of the 21st
International Conference on World Wide Web, pages 555–556. ACM, 2012.
133
[23] J. Leskovic and A. Krevl. SNAP Datasets. SNAP Datasets: Stanford Large
Network Dataset Collection, http://snap.stanford.edu/data.
[24] David Liben-Nowell and Jon Kleinberg. The link-prediction problem for social
networks. Journal of the American society for information science and technol-
ogy, 58(7):1019–1031, 2007.
[25] Xingjie Liu, Qi He, Yuanyuan Tian, Wang-Chien Lee, John McPherson, and
Jiawei Han. Event-based social networks: Linking the online and offline social
worlds. In Proceedings of the 18th ACM SIGKDD International Conference on
Knowledge Discovery and Data Mining, KDD ’12, pages 1032–1040, New York,
NY, USA, 2012. ACM.
[26] Naoki Masuda and Petter Holme. Predicting and controlling infectious disease
epidemics using temporal networks. F1000 prime reports, 5:6, 2013.
[27] M.E.J. Newman. Detecting community structure in networks. The European
Physical Journal B - Condensed Matter and Complex Systems, 38(2):321–330,
2004.
[28] Liming Pan, Tao Zhou, Linyuan Lu, and Chin-Kun Hu. Predicting missing links
and identifying spurious links via likelihood analysis. Scientific reports, 6, 2016.
[29] Alexis Papadimitriou, Panagiotis Symeonidis, and Yannis Manolopoulos. Fast
and accurate link prediction in social networking systems. Journal of Systems
and Software, 85(9):2119–2132, 2012.
[30] YoungJa Park and ManSuk Song. A genetic algorithm for clustering problems.
In John R. Koza, Wolfgang Banzhaf, Kumar Chellapilla, Kalyanmoy Deb, Marco
Dorigo, David B. Fogel, Max H. Garzon, David E. Goldberg, Hitoshi Iba, and
Rick Riolo, editors, Genetic Programming 1998: Proceedings of the Third An-
134
nual Conference, Madison, WI, July 22–25, 1998, pages 568–575, University of
Wisconsin, Madison, Wisconsin, USA, 1998. Morgan Kaufmann.
[31] Milen Pavlov and Ryutaro Ichise. Finding experts by link prediction in co-
authorship networks. In Proceedings of the 2nd International Conference on
Finding Experts on the Web with Semantics-Volume 290, pages 42–55. CEUR-
WS. org, 2007.
[32] Baojun Qiu, Qi He, and John Yen. Evolution of node behavior in link predic-
tion. In Wolfram Burgard and Dan Roth, editors, Proceedings of the Twenty-
Fifth AAAI Conference on Artificial Intelligence, AAAI 2011, San Francisco,
California, USA, August 7-11, 2011, 2011.
[33] Robert G. Reynolds. An introduction to cultural algorithms. In Anthony V.
Sebald and Lawrence J. Fogel, editors, Evolutionary Programming—Proceedings
of the Third Annual Conference, San Diego, CA, February 24–26, 1994, pages
131–139. World Scientific Press, 1994.
[34] Charles W Schmidt. Using social media to predict and track disease outbreaks.
Environmental health perspectives, 120(1):A31, 2012.
[35] Ehsan Sherkat, Maseud Rahgozar, and Masoud Asadpour. Structural link pre-
diction based on ant colony approach in social networks. Physica A: Statistical
Mechanics and its Applications, 419:80–94, 2015.
[36] Virinchi Srinivas and Pabitra Mitra. Applications of Link Prediction, pages 57–
61. Springer International Publishing, Cham, 2016.
[37] Yizhou Sun, Rick Barber, Manish Gupta, Charu C Aggarwal, and Jiawei Han.
Co-author relationship prediction in heterogeneous bibliographic networks. In
Advances in Social Networks Analysis and Mining (ASONAM), 2011 Interna-
tional Conference on, pages 121–128. IEEE, 2011.
135
[38] Peng Wang, BaoWen Xu, YuRong Wu, and Xiaoyu Zhou. Link prediction in so-
cial networks: the state-of-the-art. Science China Information Sciences, 58(1):1–
38, 2015.
[39] Weiai Wayne Xu, Yoonmo Sang, Stacy Blasiola, and Han Woo Park. Predicting
opinion leaders in twitter activism networks the case of the wisconsin recall
election. American Behavioral Scientist, page 0002764214527091, 2014.
[40] Jaewon Yang and Jure Leskovec. Defining and evaluating network communities
based on ground-truth. Knowl. Inf. Syst., 42(1):181–213, 2015.
[41] Pooya Moradian Zadeh and Ziad Kobti. A multi-population cultural algorithm
for community detection in social networks. Procedia Computer Science, 52:342–
349, 2015.
[42] Tao Zhou, Linyuan Lu, and Yi-Cheng Zhang. Predicting missing links via local
information. The European Physical Journal B, 71(4):623–630, 2009.
136
Chapter 5
Conclusions
In this dissertation, a new knowledge-based approach for social network analysis has
been proposed and extensively reviewed. Introducing new methods for representation,
extraction, and utilization of knowledge from the structure of social networks are the
main contributions of this research work. Throughout this study, the emphasis was
on the role of knowledge in the evolution of societies and solutions. According to the
experimental results, utilizing the knowledge has a remarkable impact on enhancing
the search process to find the optimal/near optimal solution for the problems, and it
is significantly effective and robust.
In addition, we found that MPCA has a tremendous potential to model the social
systems. It has derived from the real social systems and has a great capacity to
be applied to social network analysis. Therefore, we proposed various models and
algorithms based on this idea to deal with some major problems in this research field.
Community detection, link prediction and knowledge and population migration in
social networks were addressed through our proposed approach in this dissertation.
In the community detection problem, the core question was to find the underlying
interconnected structure of a given network. The results indicated that the proposed
algorithm and methods profoundly improved the accuracy and the run-time of the
137
search process. Interestingly, while the target of the algorithm was to find the near-
optimal solution, the evaluation results show that the algorithm can find the optimal
solutions for a variety of complex social structures in fewer evolution cycles compare to
the other evolutionary methods. Reduction of the search space by 80% and enhancing
the accuracy by up to 30% in comparison with the genetic algorithms are the major
achievements of this approach. The run-time analysis also shows that the proposed
method has a negligible impact on the complexity.
In the link prediction problem, the target was to estimate the evolution of a
given network in the next time step. Our community-oriented approach could get
competitive results in this field while the most significant contribution of it, is to
define a method for measuring the quality of connections between pairs of actors in
the system. In other words, given a snapshot of a undirected, unweighted network,
the proposed algorithm estimates the quality of connections between pairs of nodes
and represents them as a directed weighted graph. Introducing a new community-
oriented similarity index to calculate the likelihood of a relationship between a pair
of unconnected nodes is our another contribution. The results demonstrated that
the proposed model is capable of predicting the next state of a given network by the
average level of 80% accuracy.
The new concept of migration in the both level of knowledge and population and
its role in the process of population adaption has been studied in this field. To the
best of our knowledge, it is the first research which addresses these problems. The
experimental results show that having prior knowledge about a problem or environ-
ment can help an individual to adapt faster to the similar situations if the difference
level between two cases is less than 25%. If it is higher, not only knowledge is not
helpful, but also it may decrease the performance.
To conclude, an integrated knowledge-based computational model has been intro-
duced in this research study using MPCA and based on the community structure of

138
the social systems to describe the evolution of complex dynamic social networks. The
results clearly demonstrate that this model can significantly increase the efficiency
and effectiveness of social network analysis in a variety of tasks and problems. The
proposed approach not only can be applied to address the classic problems in the
field but also it can be employed to cope with the new challenges and issues such as
knowledge migration and population adaptation. This proposed model can be used in
a broad range of applications including recommendation systems, resource allocation
and organizational and social analysis.
We believe that by employing our proposed approach and techniques, social net-
work analysis can be carried out from a new perspective by focusing on the role of
knowledge as the primary asset of the system.
In the future, we would like to employ different sources of knowledge to deal
with more social issues through this approach. Co-evolution of networks in multi-
layer systems, layer selection strategies and the formation of belief space are our
next research targets. Measuring the impact of these sources of knowledge on the
adaptation process and enhancing its functionality are also our future works in the
field.
In addition, we are going to apply this approach to more real-life datasets extracted
from online social networks for business and research-oriented projects such as team
formation, group identification, and organizational resource optimization.

139
Vita Auctoris
Name: Pooya Moradian Zadeh
Place of Birth: Esfahan, Iran
Year of Birth: 1982
Education: Sharif University of Technology, M.Sc, Iran, 2008
University of Windsor, Ph.D, Canada, 2014-2017


![Performance Comparison of Evolutionary Algorithms for ... · [22] proposed the use of cultural algorithms which incorporate knowledge to the algorithm to solve UCTP instances; they](https://img.pdfslide.us/doc/110x75/5e75f92637b178152c276232/performance-comparison-of-evolutionary-algorithms-for-22-proposed-the-use.jpg)