Embed Size (px)
Citation preview

Social Network Analysis
KSE 652 Social Computing Systems:Design and Analysis
Uichin LeeOct. 16, 2013
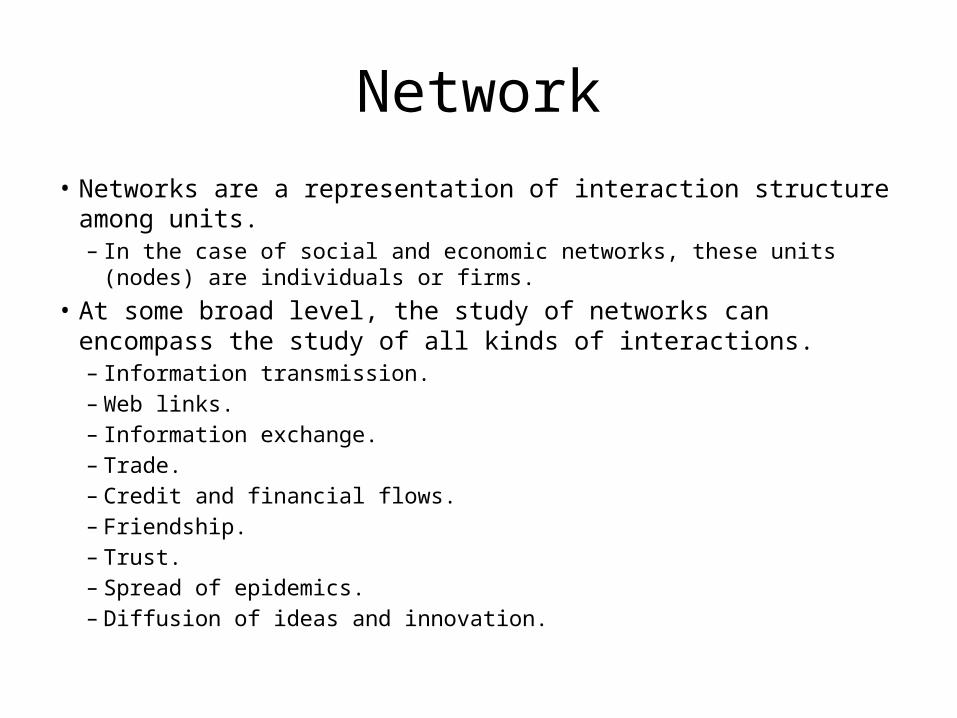
Network• Networks are a representation of interaction structure among units.
– In the case of social and economic networks, these units (nodes) are individuals or firms.
• At some broad level, the study of networks can encompass the study of all kinds of interactions.– Information transmission.– Web links.– Information exchange.– Trade.– Credit and financial flows.– Friendship.– Trust.– Spread of epidemics.– Diffusion of ideas and innovation.
Themes
• Graph theory (e.g., strong/weak ties, 6 degrees of separation, structural balance)
• Game theory (e.g., group interaction modeling, auction)
• Markets and strategic interaction on networks• Information network (e.g., web, blogging, search
engine)• Network dynamics – Population effects (social practice/network effects)– Structural effects (social contagion/cascading effects)
Visual Example – 1
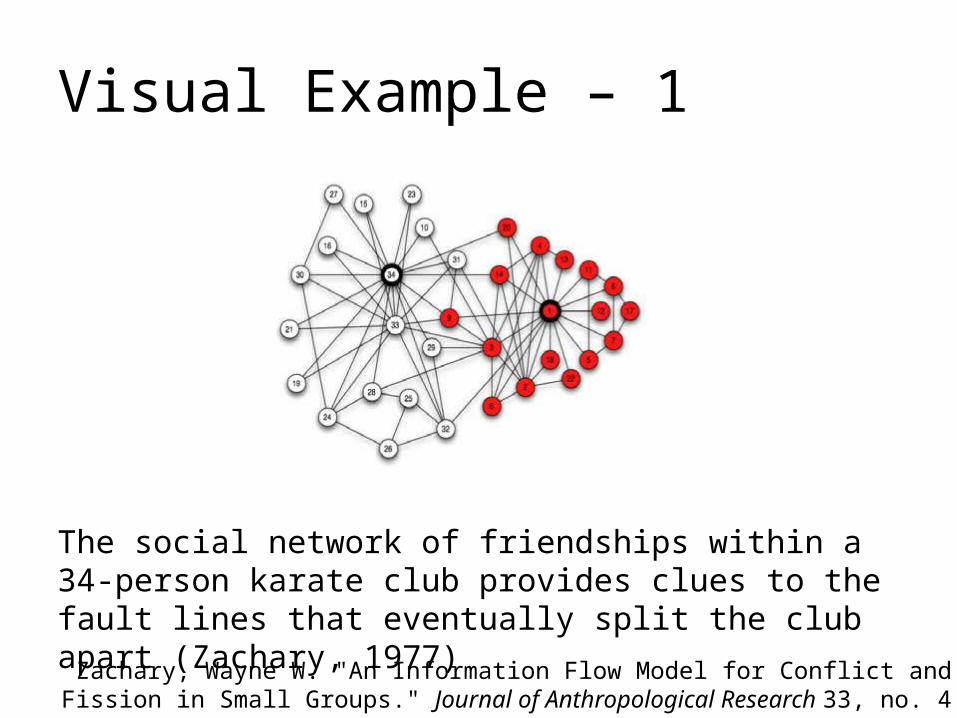
The social network of friendships within a 34-person karate club provides clues to the fault lines that eventually split the club apart (Zachary, 1977)
Zachary, Wayne W. "An Information Flow Model for Conflict and Fission in Small Groups." Journal of Anthropological Research 33, no. 4 (1977): 452-473.

Visual Example – 2
The network of loans among financial institutions can be used to analyze the roles that different participants play in the financial system, and how the interactions among these roles affect the health of individual participants and the system as a whole (Bech and Atalay 2008)
The Topology of the Federal Funds Market." European Central Bank Working Paper Series No. 986, December 2008
Visual Example – 3
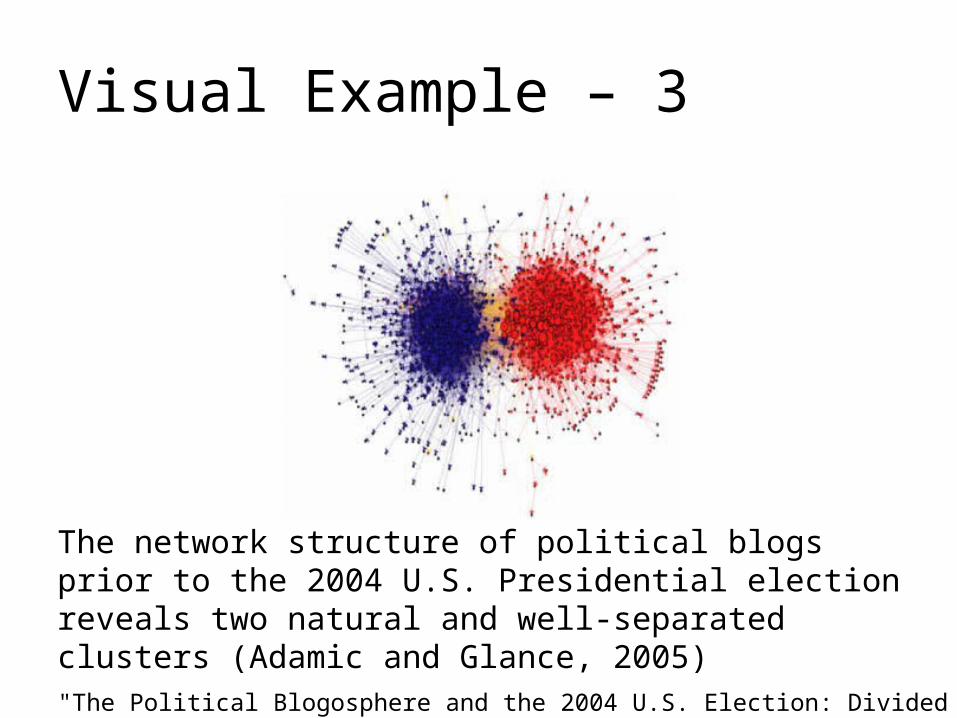
The network structure of political blogs prior to the 2004 U.S. Presidential election reveals two natural and well-separated clusters (Adamic and Glance, 2005)
"The Political Blogosphere and the 2004 U.S. Election: Divided They Blog.“ KDD 2005

Visual Example – 4
In some settings, such as this map of Medieval trade routes, physical networks constrain the patterns of interaction, giving certain participants an intrinsic economic advantage based on their network position.
In a network representing international trade, one can look for countries thatoccupy powerful positions and derive economic benefits from these positions
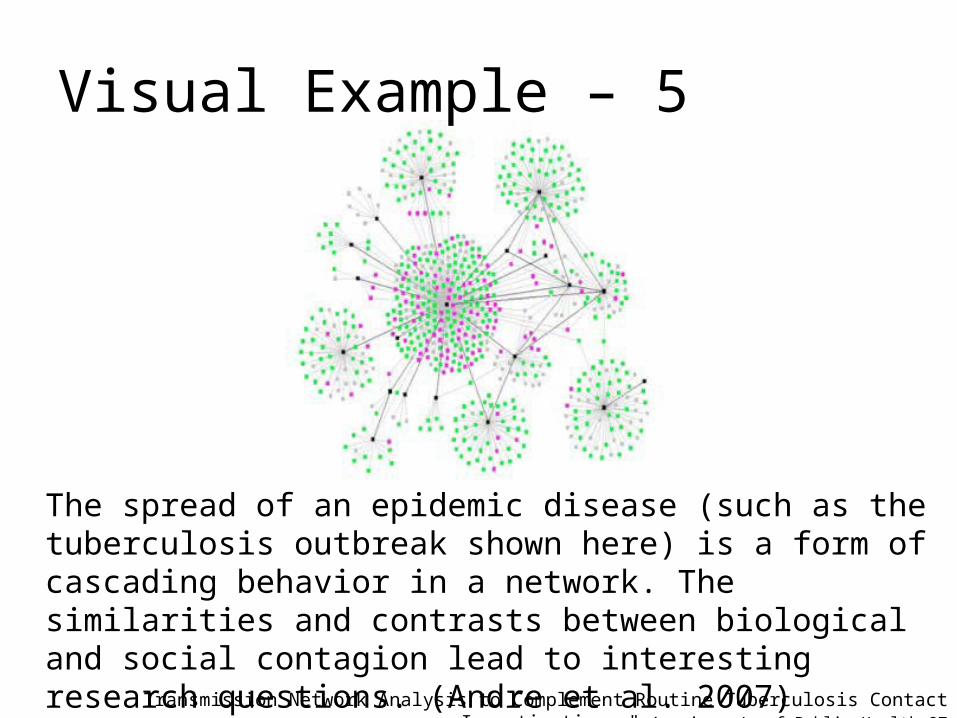
Visual Example – 5
The spread of an epidemic disease (such as the tuberculosis outbreak shown here) is a form of cascading behavior in a network. The similarities and contrasts between biological and social contagion lead to interesting research questions. (Andre et al. 2007)
Transmission Network Analysis to Complement Routine Tuberculosis Contact Investigations." American J. of Public Health 97

Visual Example – 6
Social networks based on communication and interaction can be constructed from the traces left by on-line data. In this case, the pattern of email communication among 436 employees of HP Research Lab is superimposed on the official organizational hierarchy

Visual Example – 7
• When people are influenced by the behaviors of their neighbors in the network, the adoption of a new product or innovation can cascade through the network structure.
• Here, e-mail recommendations for a Japanese graphic novel spread in a kind of informational or social contagion. (Leskovec 2007)
"The Dynamics of Viral Marketing." ACM Transactions on the Web 2007
Graphs
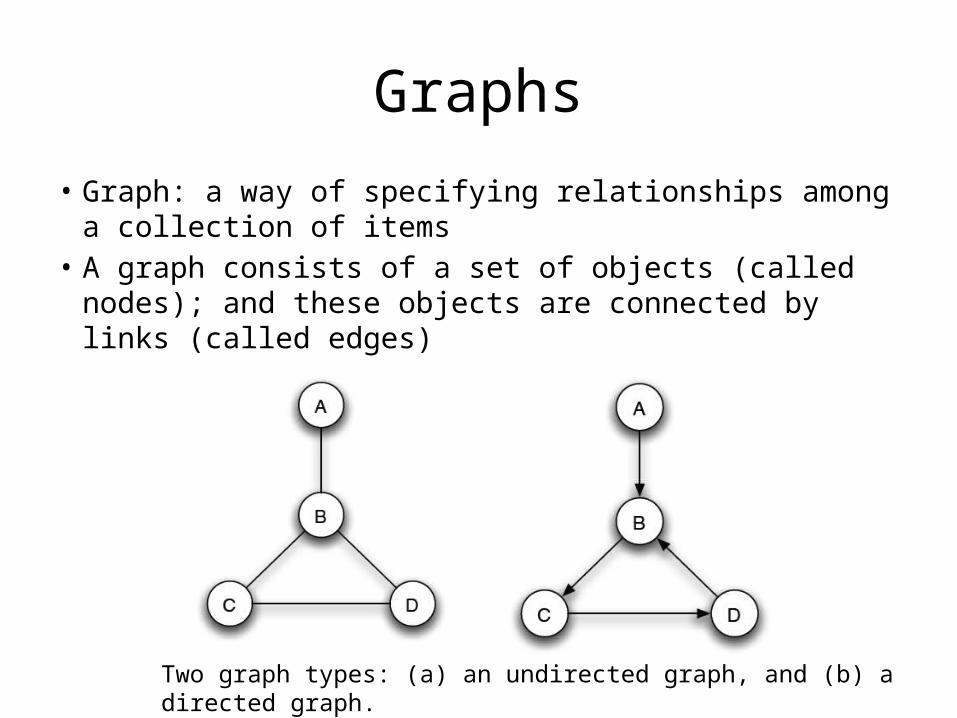
• Graph: a way of specifying relationships among a collection of items
• A graph consists of a set of objects (called nodes); and these objects are connected by links (called edges)
Two graph types: (a) an undirected graph, and (b) a directed graph.
Graphs
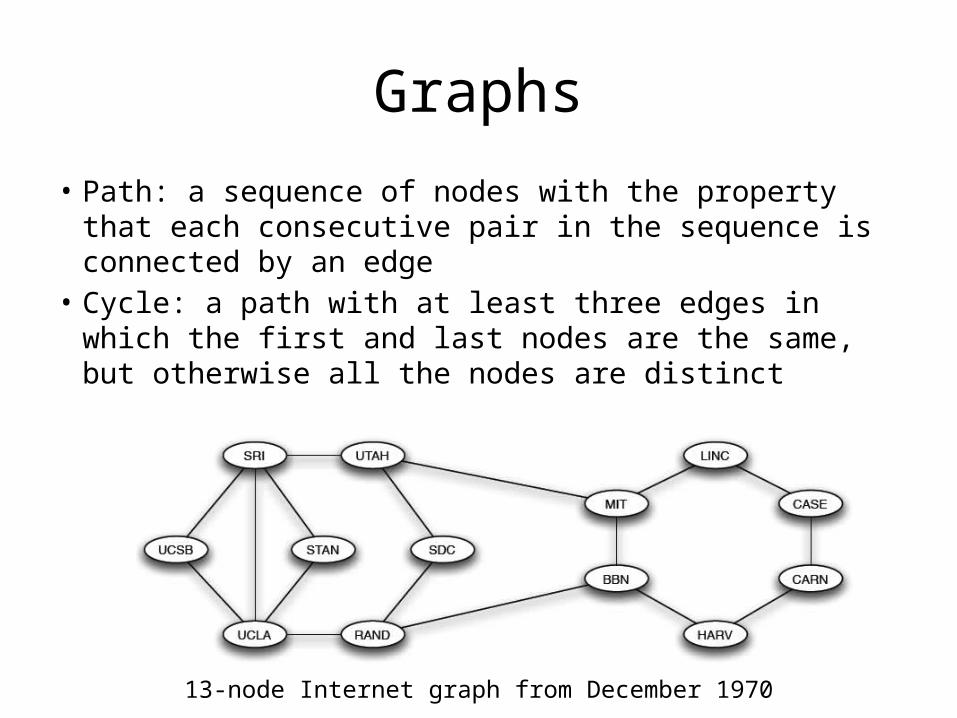
• Path: a sequence of nodes with the property that each consecutive pair in the sequence is connected by an edge
• Cycle: a path with at least three edges in which the first and last nodes are the same, but otherwise all the nodes are distinct
13-node Internet graph from December 1970
Graphs
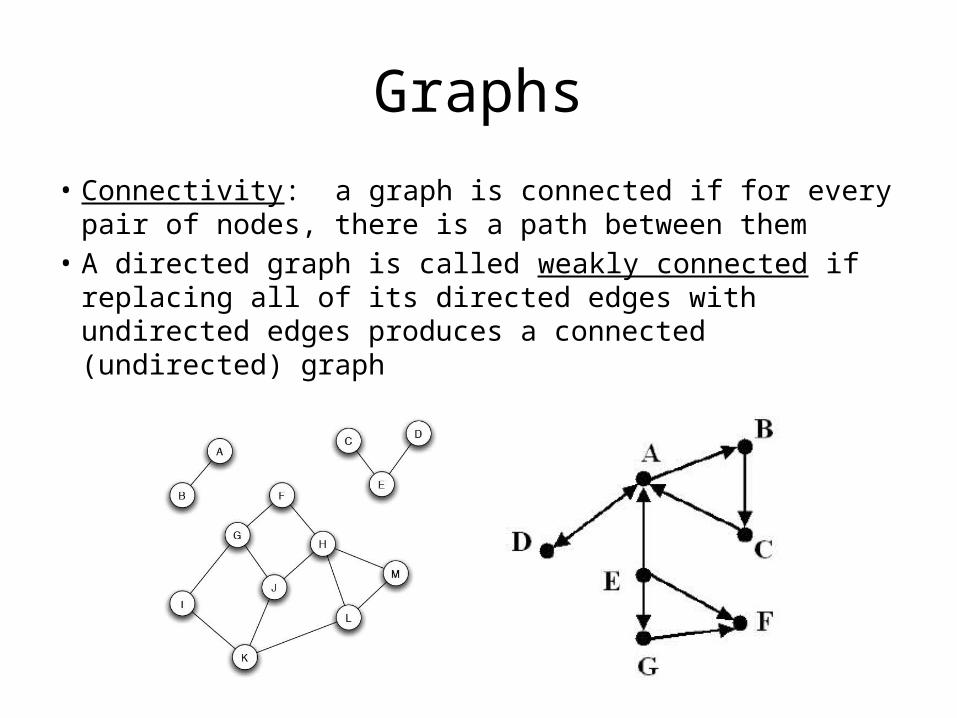
• Connectivity: a graph is connected if for every pair of nodes, there is a path between them
• A directed graph is called weakly connected if replacing all of its directed edges with undirected edges produces a connected (undirected) graph
Graphs
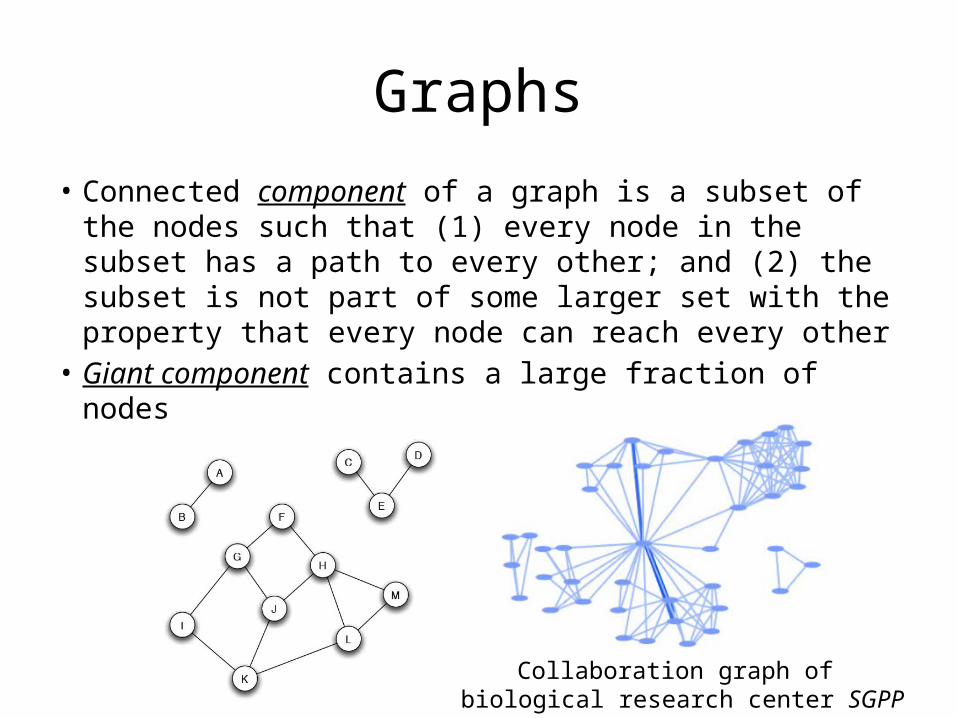
• Connected component of a graph is a subset of the nodes such that (1) every node in the subset has a path to every other; and (2) the subset is not part of some larger set with the property that every node can reach every other
• Giant component contains a large fraction of nodes
Collaboration graph of biological research center SGPP
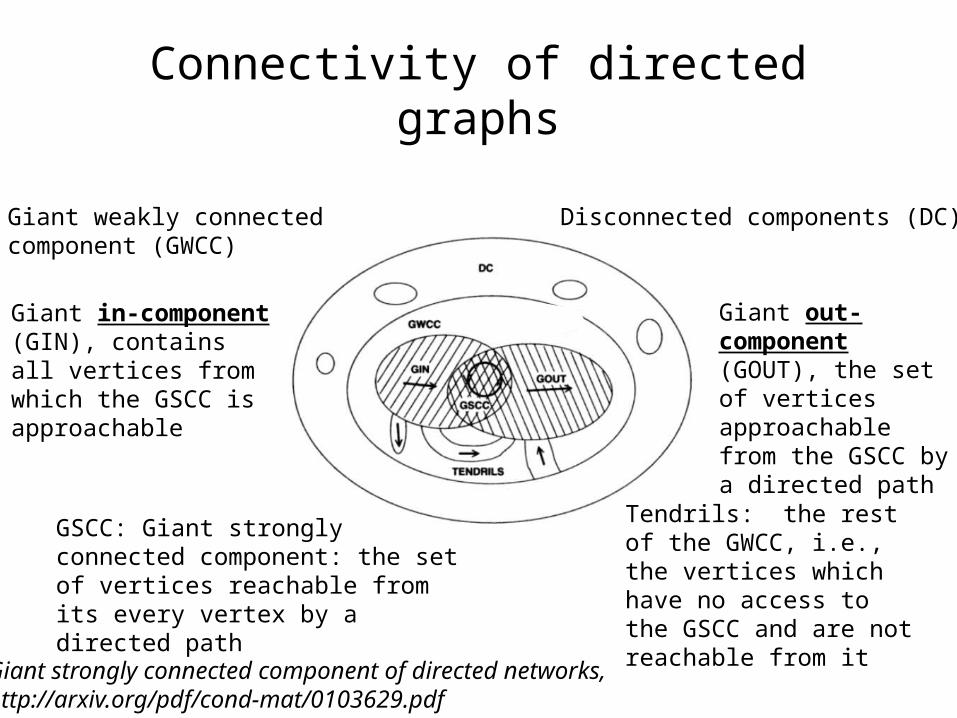
Connectivity of directed graphs
GSCC: Giant strongly connected component: the set of vertices reachable from its every vertex by a directed path
Giant in-component (GIN), contains all vertices from which the GSCC is approachable
Giant out-component (GOUT), the set of vertices approachable from the GSCC by a directed path
Tendrils: the rest of the GWCC, i.e., the vertices which have no access to the GSCC and are not reachable from it
Giant weakly connected component (GWCC) Disconnected components (DC)
Giant strongly connected component of directed networks, http://arxiv.org/pdf/cond-mat/0103629.pdf
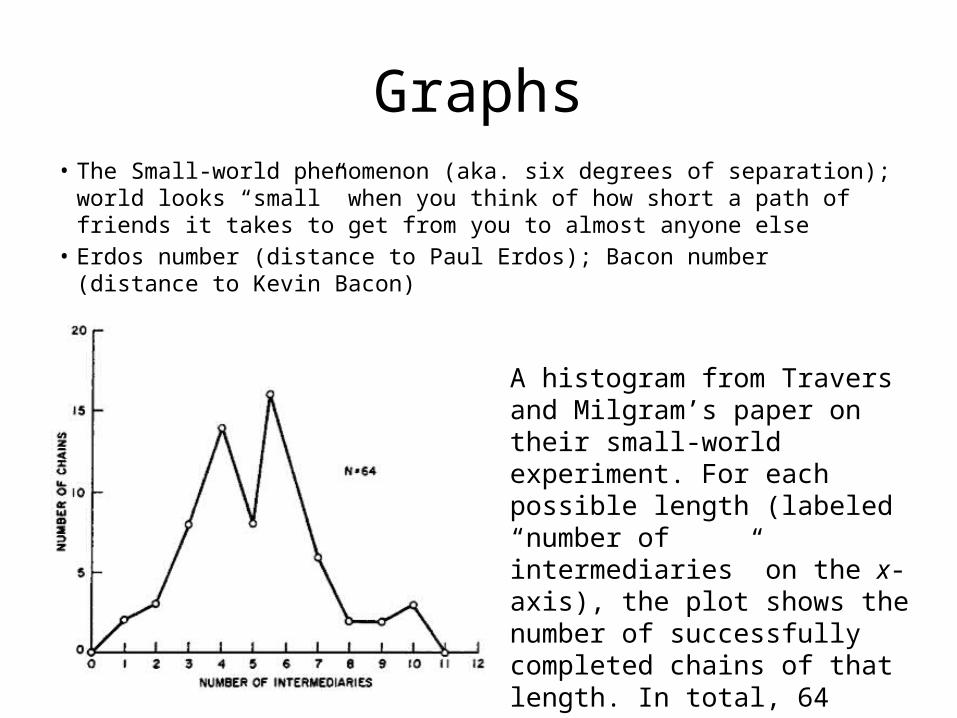
Graphs• The Small-world phenomenon (aka. six degrees of separation); world looks
“small” when you think of how short a path of friends it takes to get from you to almost anyone else
• Erdos number (distance to Paul Erdos); Bacon number (distance to Kevin Bacon)
A histogram from Travers and Milgram’s paper on their small-world experiment. For each possible length (labeled “number of intermediaries” on the x-axis), the plot shows the number of successfully completed chains of that length. In total, 64 chains reached the target person, with a median length of six.
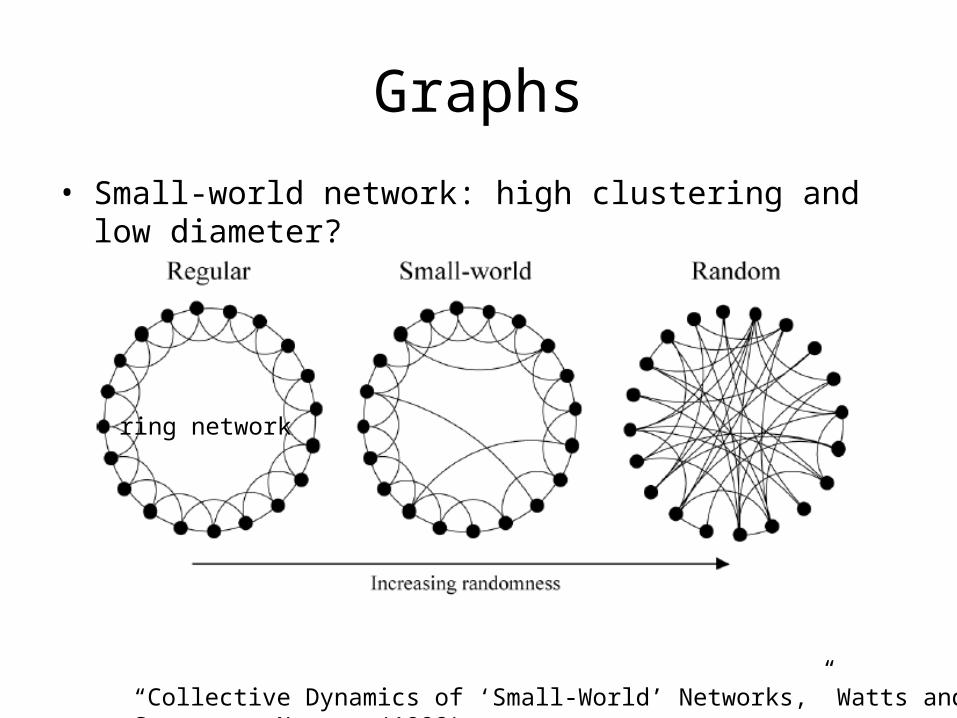
Graphs
• Small-world network: high clustering and low diameter?
“Collective Dynamics of ‘Small-World’ Networks,” Watts and Strogatz, Nature (1998)
ring network
Strong and Weak Ties
• Granovetter’s work on “strength of weak ties”
• Issues: – How does information flow through a social
network? – How can different nodes play structurally distinct
roles in this process?– How these structural considerations shape the
evolution of the network itself over time?
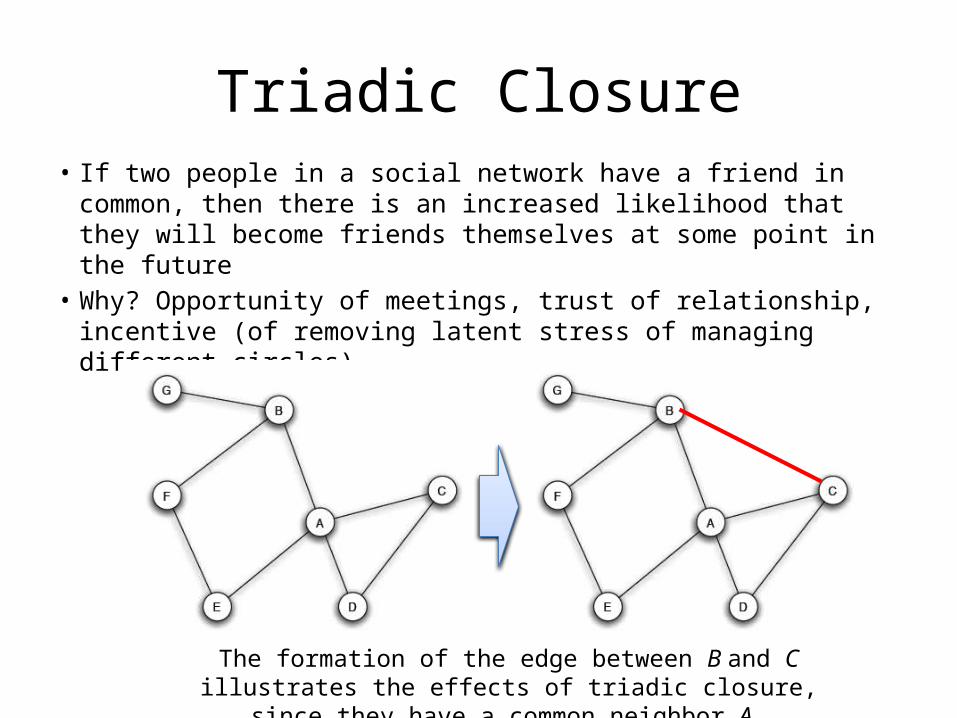
Triadic Closure• If two people in a social network have a friend in common,
then there is an increased likelihood that they will become friends themselves at some point in the future
• Why? Opportunity of meetings, trust of relationship, incentive (of removing latent stress of managing different circles)
The formation of the edge between B and C illustrates the effects of triadic closure, since they have a common neighbor A.
Clustering Coefficient
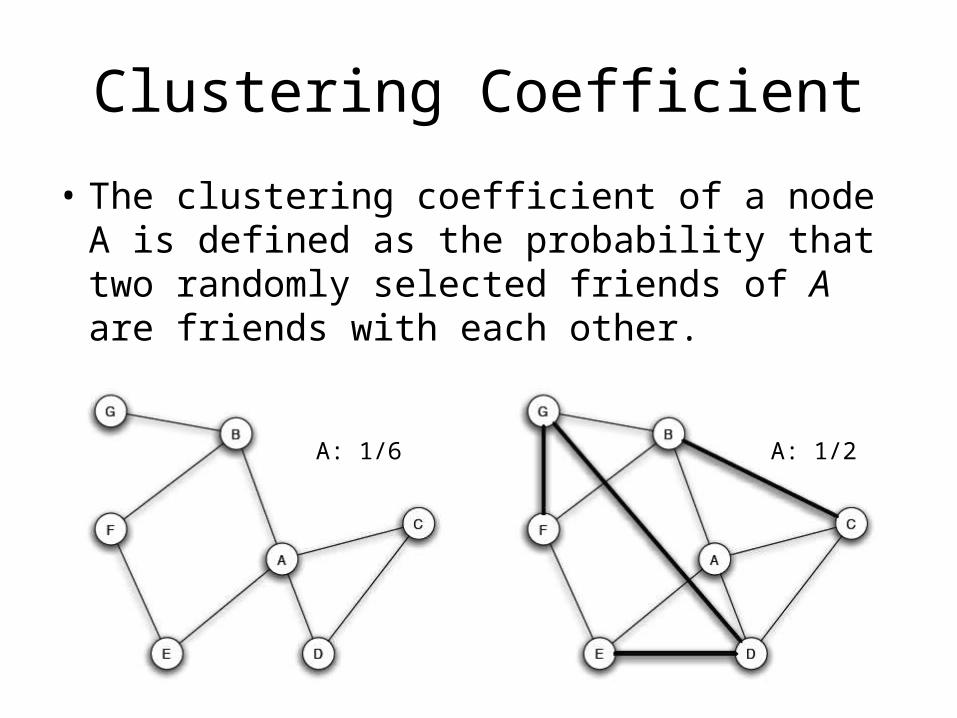
• The clustering coefficient of a node A is defined as the probability that two randomly selected friends of A are friends with each other.
A: 1/6 A: 1/2
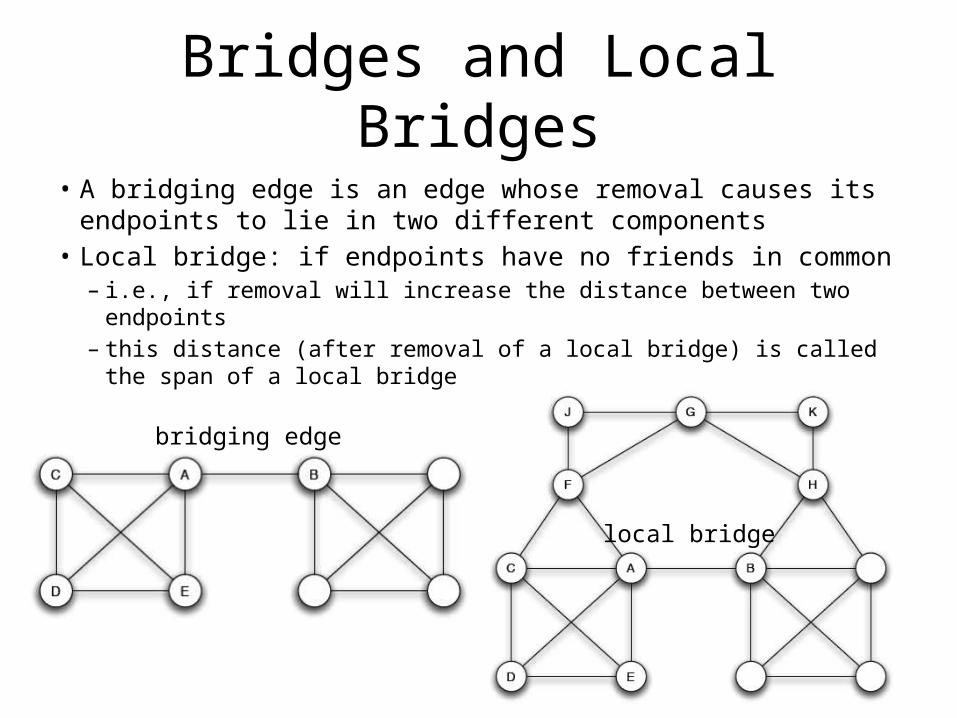
Bridges and Local Bridges• A bridging edge is an edge whose removal causes its endpoints to
lie in two different components • Local bridge: if endpoints have no friends in common
– i.e., if removal will increase the distance between two endpoints– this distance (after removal of a local bridge) is called the span of a
local bridge
bridging edge
local bridge

Strong Triadic Closure• Each edge of the social network is labeled here as either a strong tie (S) or a weak
tie (W), to indicate the strength of the relationship. • The labeling in the figure satisfies the Strong Triadic Closure Property at each
node: if the node has strong ties to two neighbors, then these neighbors must have at least a weak tie between them
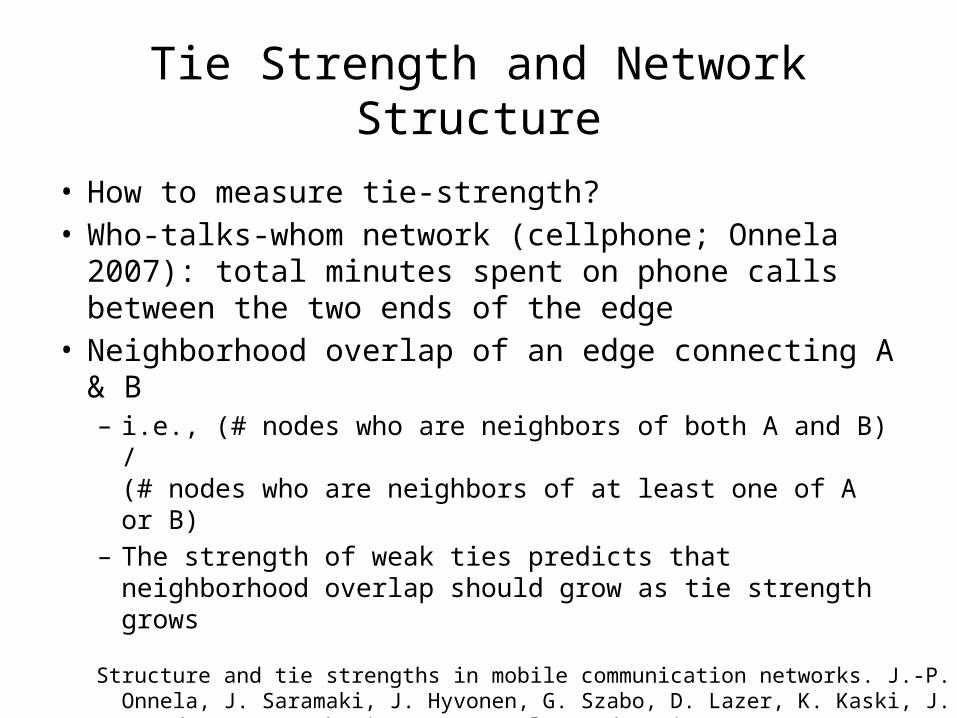
Tie Strength and Network Structure
• How to measure tie-strength? • Who-talks-whom network (cellphone; Onnela 2007):
total minutes spent on phone calls between the two ends of the edge
• Neighborhood overlap of an edge connecting A & B – i.e., (# nodes who are neighbors of both A and B) /
(# nodes who are neighbors of at least one of A or B)– The strength of weak ties predicts that neighborhood
overlap should grow as tie strength grows
Structure and tie strengths in mobile communication networks. J.-P. Onnela, J. Saramaki, J. Hyvonen, G. Szabo, D. Lazer, K. Kaski, J. Kertesz, and A.-L. Barabasi. Proc. Natl. Acad. Sci. USA, 104:7332–7336, 2007.
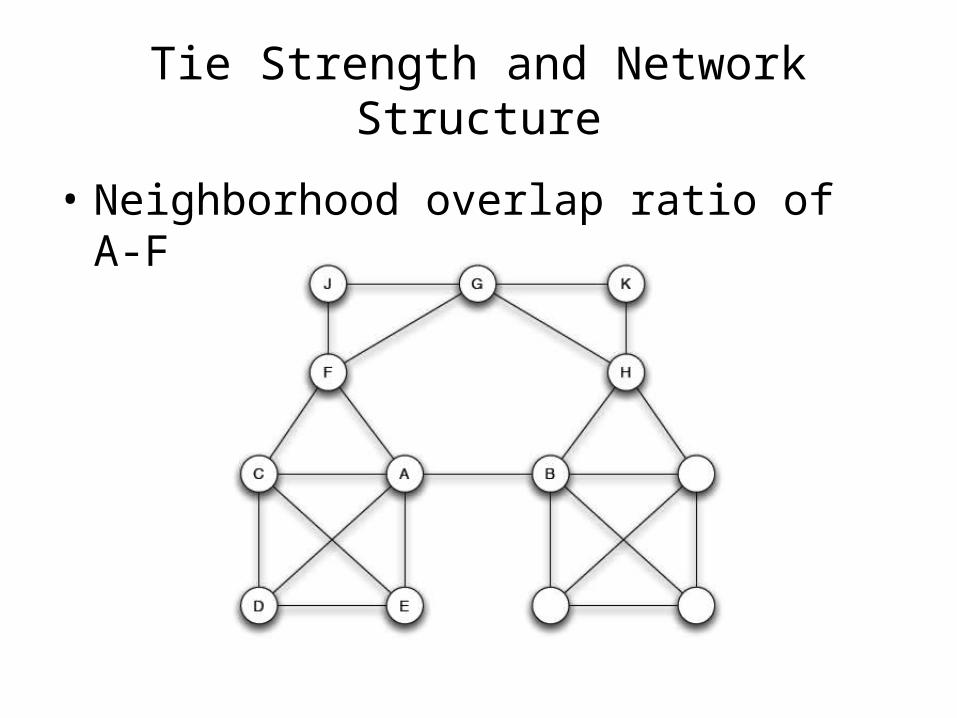
Tie Strength and Network Structure
• Neighborhood overlap ratio of A-F
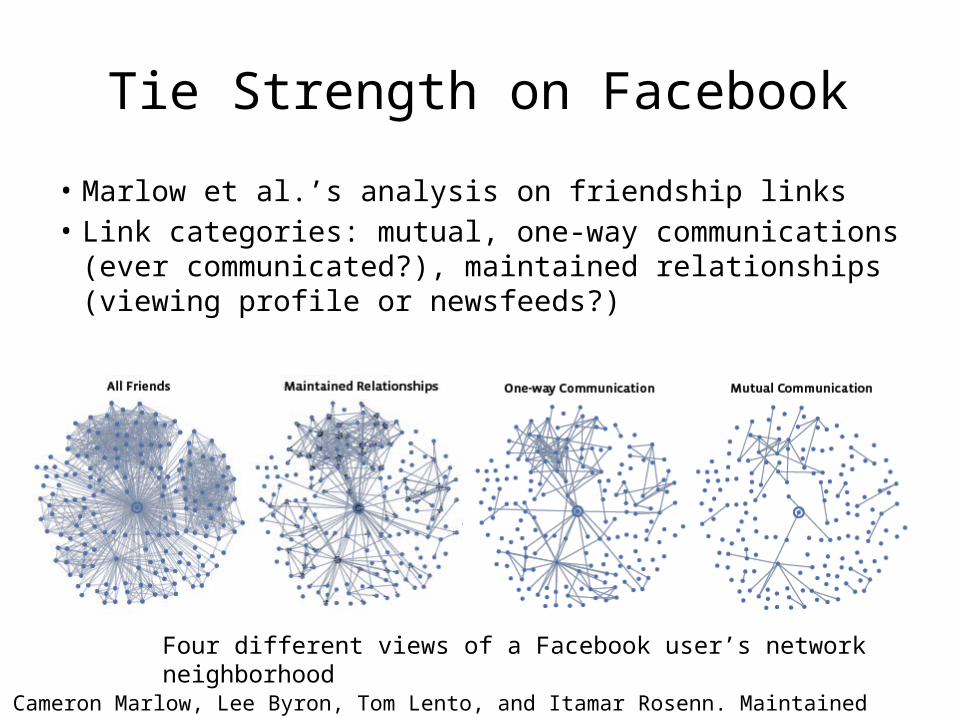
Tie Strength on Facebook
• Marlow et al.’s analysis on friendship links• Link categories: mutual, one-way communications (ever
communicated?), maintained relationships (viewing profile or newsfeeds?)
Four different views of a Facebook user’s network neighborhood
Cameron Marlow, Lee Byron, Tom Lento, and Itamar Rosenn. Maintained relationships on Facebook, 2009.
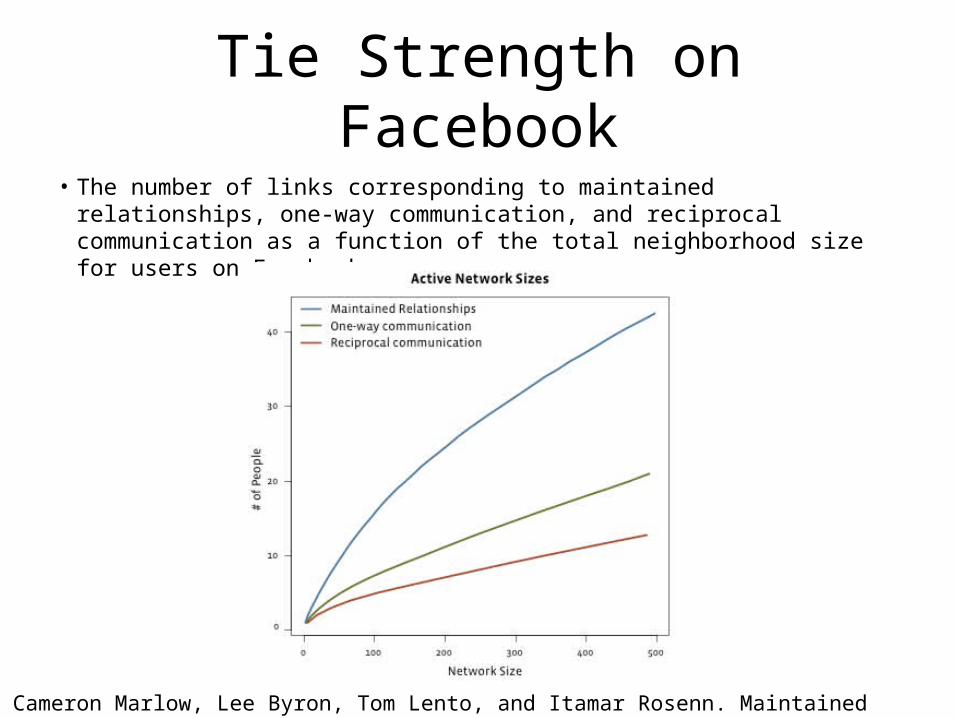
Tie Strength on Facebook• The number of links corresponding to maintained relationships,
one-way communication, and reciprocal communication as a function of the total neighborhood size for users on Facebook
Cameron Marlow, Lee Byron, Tom Lento, and Itamar Rosenn. Maintained relationships on Facebook, 2009.

Tie Strength on Facebook
Eric Gilbert and Karrie Karahalios , Predicting Tie Strength With Social Media CHI 2009
Self-report tie-strength (of each friend) Usage data
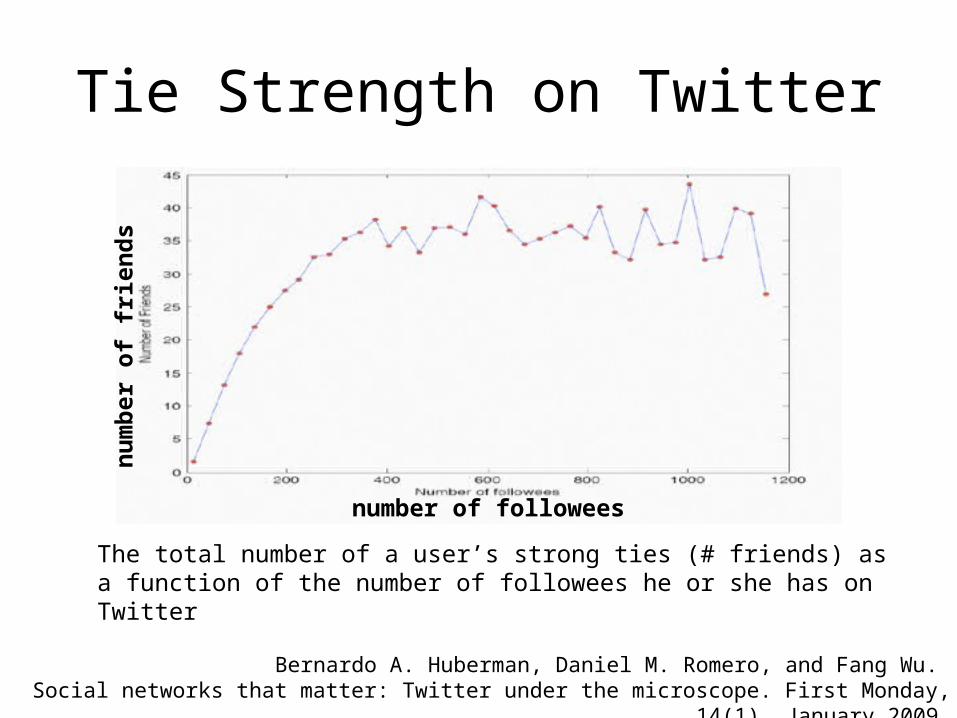
Tie Strength on Twitter
The total number of a user’s strong ties (# friends) as a function of the number of followees he or she has on Twitter
Bernardo A. Huberman, Daniel M. Romero, and Fang Wu. Social networks that matter: Twitter under the microscope. First Monday, 14(1), January 2009.
number of followees
num
ber o
f frie
nds
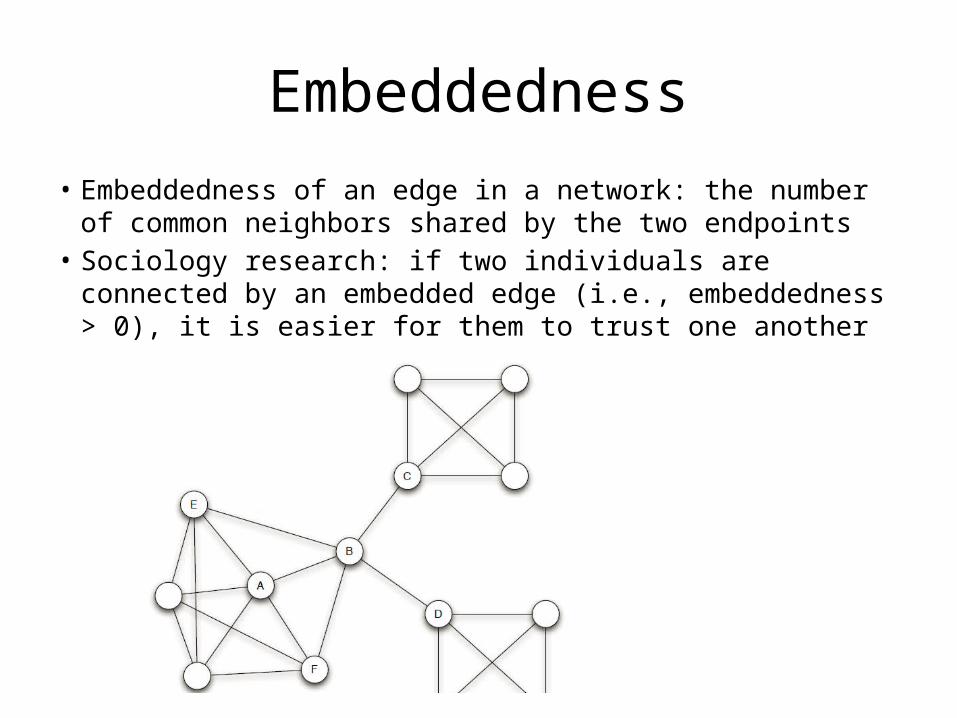
Embeddedness• Embeddedness of an edge in a network: the number of common
neighbors shared by the two endpoints• Sociology research: if two individuals are connected by an embedded
edge (i.e., embeddedness > 0), it is easier for them to trust one another
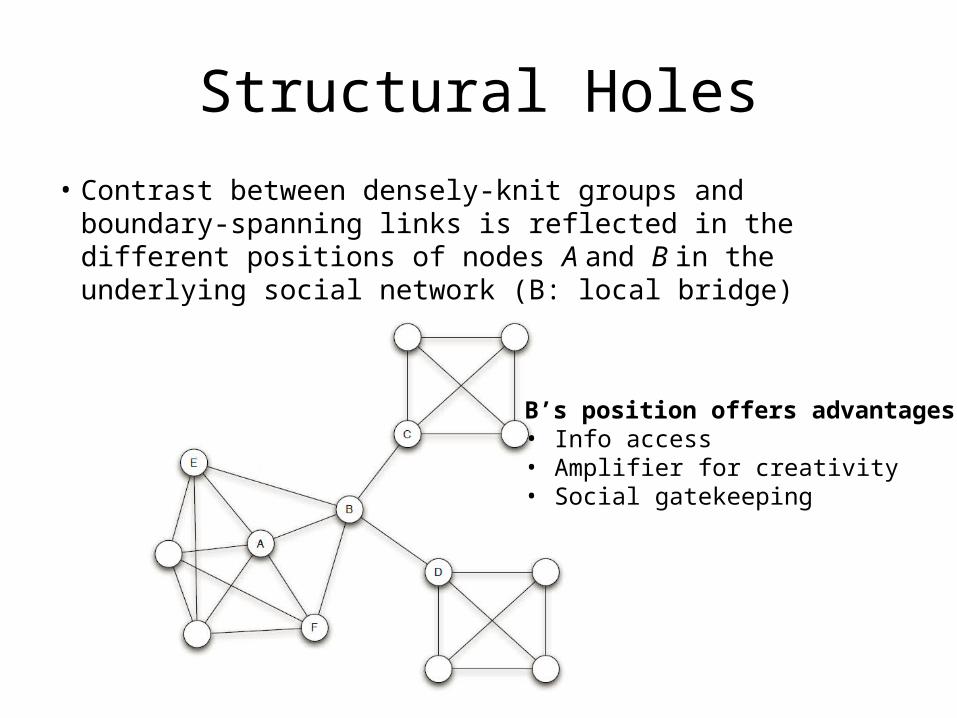
Structural Holes
• Contrast between densely-knit groups and boundary-spanning links is reflected in the different positions of nodes A and B in the underlying social network (B: local bridge)
B’s position offers advantages: • Info access• Amplifier for creativity• Social gatekeeping
Social Capital
• Somewhat difficult to define, but “Consensus is growing in the literature that social capital stands for the ability of actors to secure benefits by virtue of membership in social networks/social structure” (Alejandro Porte 1998)
• Just as a screwdriver (physical capital) or a university education (cultural capital or human capital) can increase productivity (both individual and collective), so do social contacts affect the productivity of individuals and groups (Putnam 2000)
• Social capital as a tension between closure (groups) and brokerage (interactions) [Burt 2000], relating to “bonding” and “bridging” social capital, respectively [Putnam 2000]Alejandro Portes. Social capital: Its origins and applications in modern sociology. Annual Review of Sociology, 24:1–24, 1998.Stephen P. Borgatti, Candace Jones, and Martin G. Everett. Network measures of social capital. Connections, 1998.
Ronald S. Burt. The network structure of social capital. Research in Organizational Studies, 22:345–423, 2000.Robert D. Putnam. Bowling Alone: The Collapse and Revival of American Community. Simon & Schuster, 2000.
Betweenness Measure and Graph Partitioning
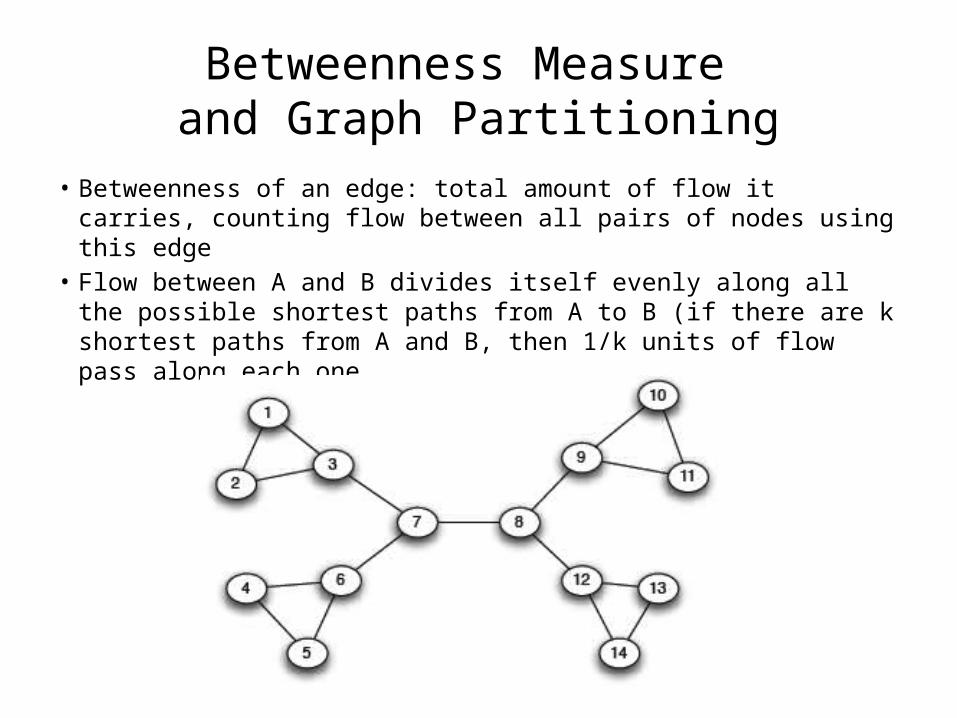
• Betweenness of an edge: total amount of flow it carries, counting flow between all pairs of nodes using this edge
• Flow between A and B divides itself evenly along all the possible shortest paths from A to B (if there are k shortest paths from A and B, then 1/k units of flow pass along each one

Betweenness Measure and Graph Partitioning
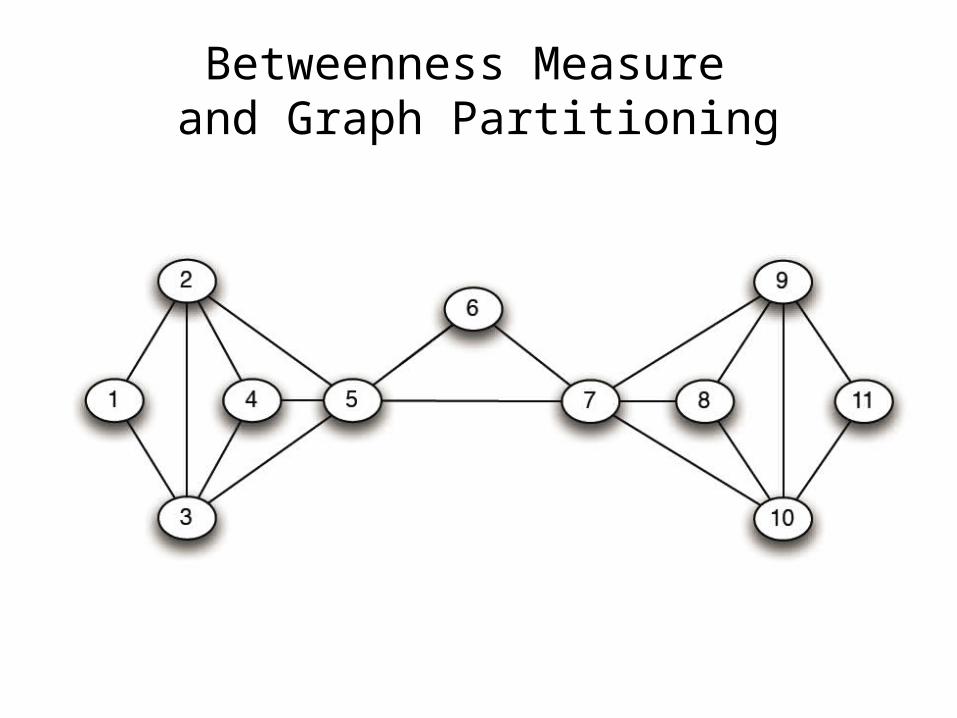
• Breaking a network down into a set of tightly-knit regions with sparser interconnections between the regions
• General approaches to graph partitioning– Divisive: identifying/removing “spanning links” between
densely-connected regions– Agglomerative: gluing nodes together into regions (bottom up)
• Girvan and Newman’s divisive method (greedily removing an edge with highest edge betweeness)
Betweenness Measure and Graph Partitioning
Homophily
• Homophily– Tendency of being similar to our friends; birds of a feather flock
together!• Understanding possible link formation:
– Intrinsic (structural) factors: a friendship formed as two people are introduced through a common friend• Related to “triadic closure” properties; increased opportunities, trust of
relationship, incentives of facilitating relationship
– Contextual factors (or social context): a friendship formed as two people attended the same school or work for the same company• How a network’s surrounding contexts can drive the formation of its
links?
Homophily
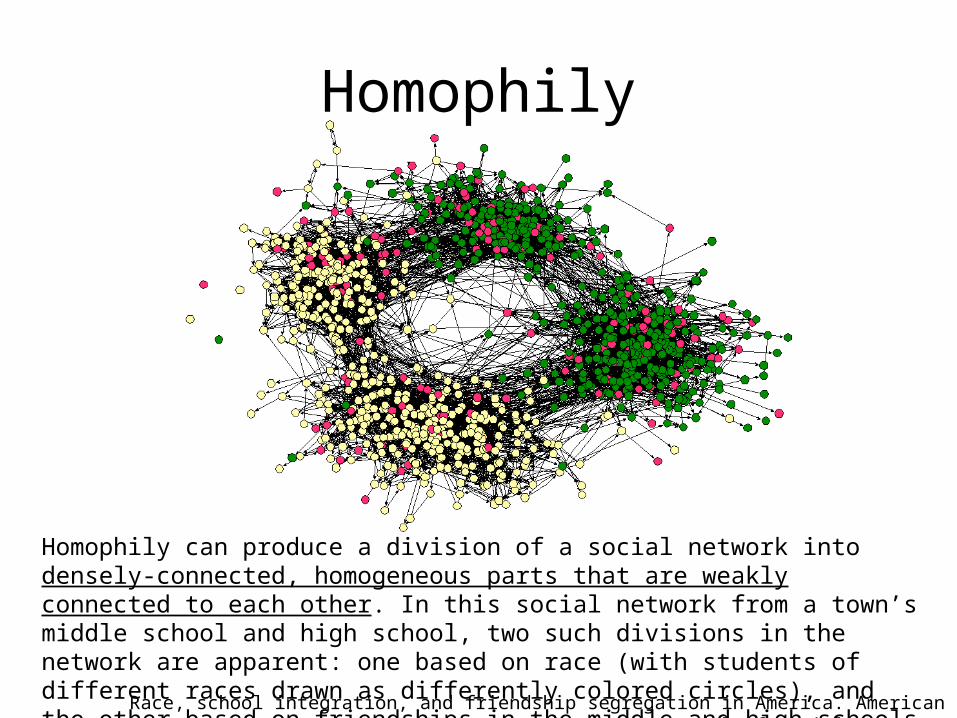
Homophily can produce a division of a social network into densely-connected, homogeneous parts that are weakly connected to each other. In this social network from a town’s middle school and high school, two such divisions in the network are apparent: one based on race (with students of different races drawn as differently colored circles), and the other based on friendships in the middle and high schools respectively
Race, school integration, and friendship segregation in America. American Journal of Sociology, 2001
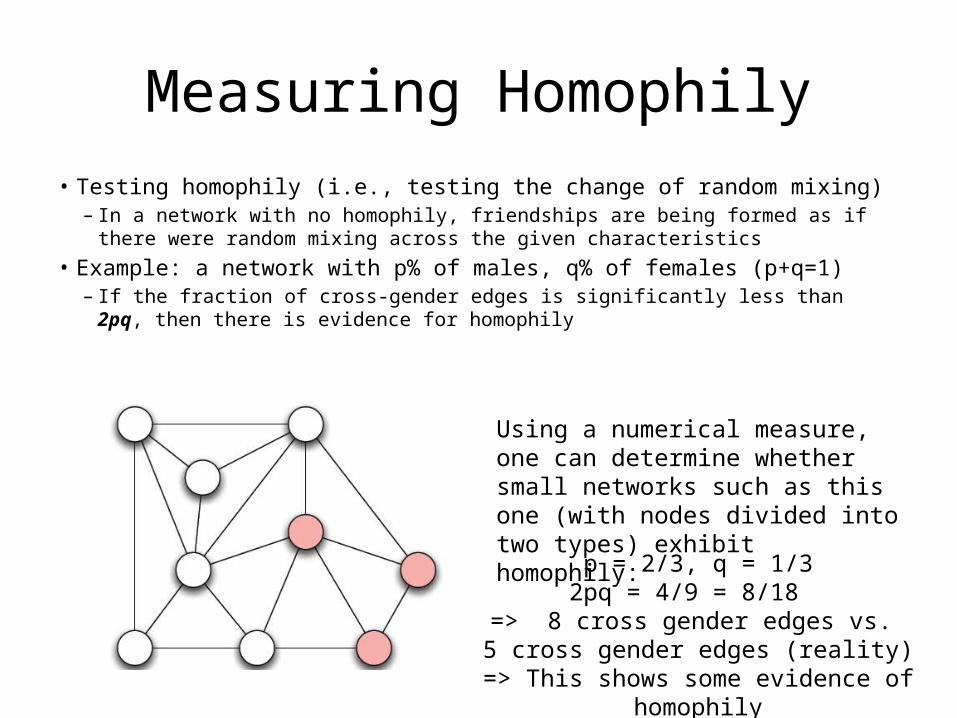
Measuring Homophily• Testing homophily (i.e., testing the change of random mixing)
– In a network with no homophily, friendships are being formed as if there were random mixing across the given characteristics
• Example: a network with p% of males, q% of females (p+q=1) – If the fraction of cross-gender edges is significantly less than 2pq, then there is
evidence for homophily
Using a numerical measure, one can determine whether small networks such as this one (with nodes divided into two types) exhibit homophily:
p = 2/3, q = 1/32pq = 4/9 = 8/18
=> 8 cross gender edges vs. 5 cross gender edges (reality)
=> This shows some evidence of homophily
Mechanisms Underlying Homophily
• Selection: individual characteristics drive the formation of links
• Social influence: existing links in the network serve to shape people’s (mutable) characteristics
• Interplay of selection and social influence– Ex) teenage friends: teenagers seek out social circles
composed of people like them + peer pressure causes them to conform to behavioral patterns within their social circles
Nicholas A. Christakis and James H. Fowler. The spread of obesity in a large social network over 32 years. New England Journal of Medicine, 357(4):3700–379, July 2007.
Homophily and Health
• Longitudinal study (32 years) of ~12K people, – Obesity status: BMI (body mass index) = weight / height^2– Social network structure: list of friends, siblings, spouse,
neighbors• Results: non-obese people clustered in the network in
a fashion consistent with homophily • Why? Selection (friending w/ similar obesity status),
social influence (i.e., behavioral influence among friends), confounding effects (homophily vs. other factors than obesity)

Homophily and Spatial Segregation
• Global patterns of spatial segregation can arise from the effect of homophily operating at a local level (Schelling model)
Chicago, 1960Chicago, 1940
The tendency of people to live in racially homogeneous
neighborhoods produces spatial patterns of segregation that are
apparent both in everyday life and when superimposed on a
map — as here, in these maps of Chicago from 1940 and 1960. In
blocks colored yellow and orange the percentage of African-
Americans is below 25, while in blocks colored brown and black
the percentage is above 75.
Markus M. M¨obius and Tanya S. Rosenblat. The process of ghetto formation: Evidence from Chicago, 2001.
Affiliation
• Being part of a group (e.g., company, organization); frequenting a particular place; pursuing a particular hobby or interest
• These are all activities that (when shared between two people) tend to increase the likelihood that they will interact and hence form a link in the social network
• Such activities are called “foci”, i.e., focal points of social interaction, constituting “social, psychological, legal, or physical entities around which joint activities are organized (e.g., workplaces, voluntary organizations, hangouts, etc.)”

Affiliation Network
• An affiliation network is a bipartite graph that shows which individuals are affiliated with which groups or activities.
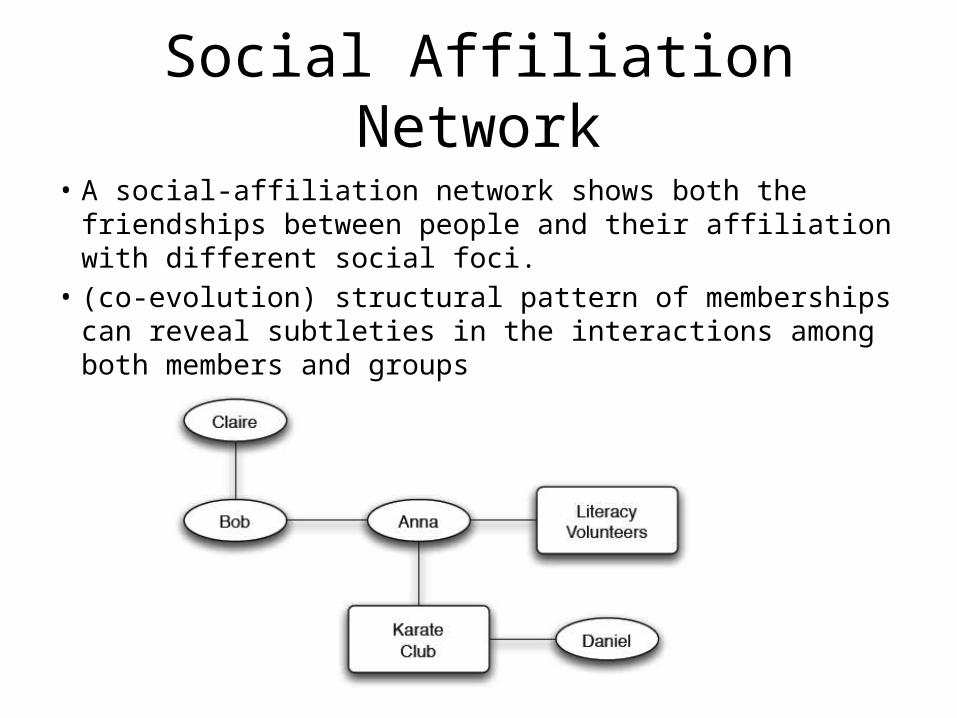
• Here, Anna participates in both of the social foci on the right, while Daniel participates in only one.
Social Affiliation Network
• A social-affiliation network shows both the friendships between people and their affiliation with different social foci.
• (co-evolution) structural pattern of memberships can reveal subtleties in the interactions among both members and groups
Social Affiliation Network
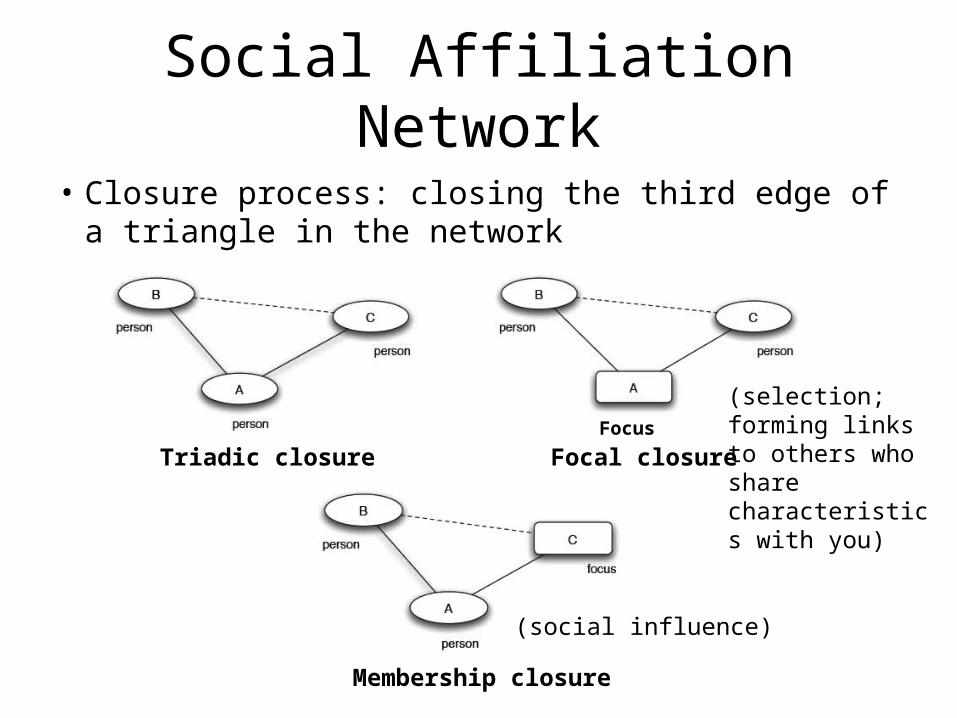
• Closure process: closing the third edge of a triangle in the network
(social influence)
Membership closure
Focal closureTriadic closureFocus
(selection; forming links to others who share characteristics with you)
Tracking Closure Process Online
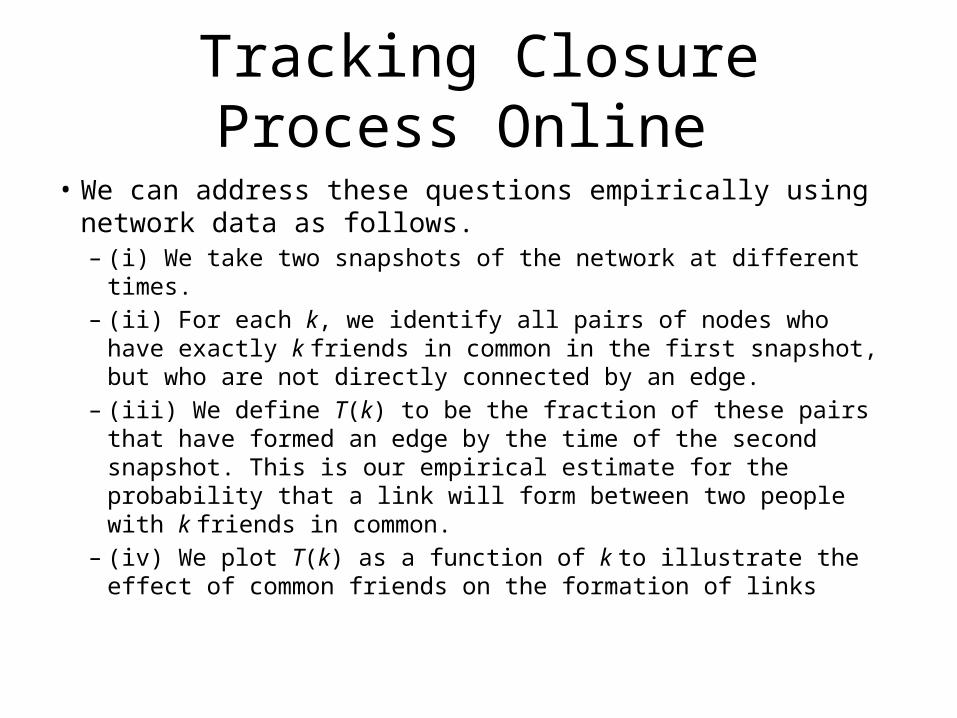
• We can address these questions empirically using network data as follows.– (i) We take two snapshots of the network at different times.– (ii) For each k, we identify all pairs of nodes who have exactly k
friends in common in the first snapshot, but who are not directly connected by an edge.
– (iii) We define T(k) to be the fraction of these pairs that have formed an edge by the time of the second snapshot. This is our empirical estimate for the probability that a link will form between two people with k friends in common.
– (iv) We plot T(k) as a function of k to illustrate the effect of common friends on the formation of links

Tracking Closure Process Online
• T(0) is the rate at which link formation happens when it does not close a triangle, while the values of T(k) for larger k determine the rate at which link formation happens when it does close a triangle.
• Comparison between T(0) and these other values addresses the most basic question about the power of triadic closure.

Tracking Closure Process Online: Triadic closure
Suppose that for some small probability p, each common friend that two people have gives them an independent probability p of forming a link. So if two people have k friends in common, the probability they fail to form a link on any given day is (1−p)^k
Empirical analysis of an evolving social network. Science, 311:88–90, 2006.
Number of common friends
T’(k) = 1-(1-p)^k-1
T(k) = 1-(1-p)^k
Quantifying the effects of triadic closure in an e-mail dataset
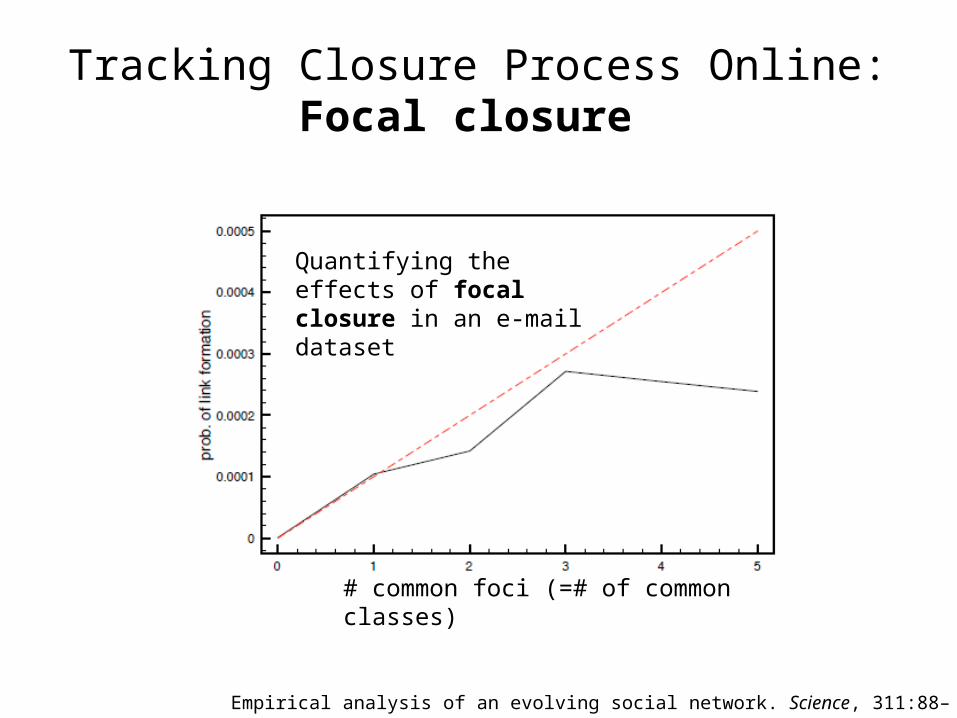
Tracking Closure Process Online:Focal closure
Empirical analysis of an evolving social network. Science, 311:88–90, 2006.
# common foci (=# of common classes)
Quantifying the effects of focal closure in an e-mail dataset
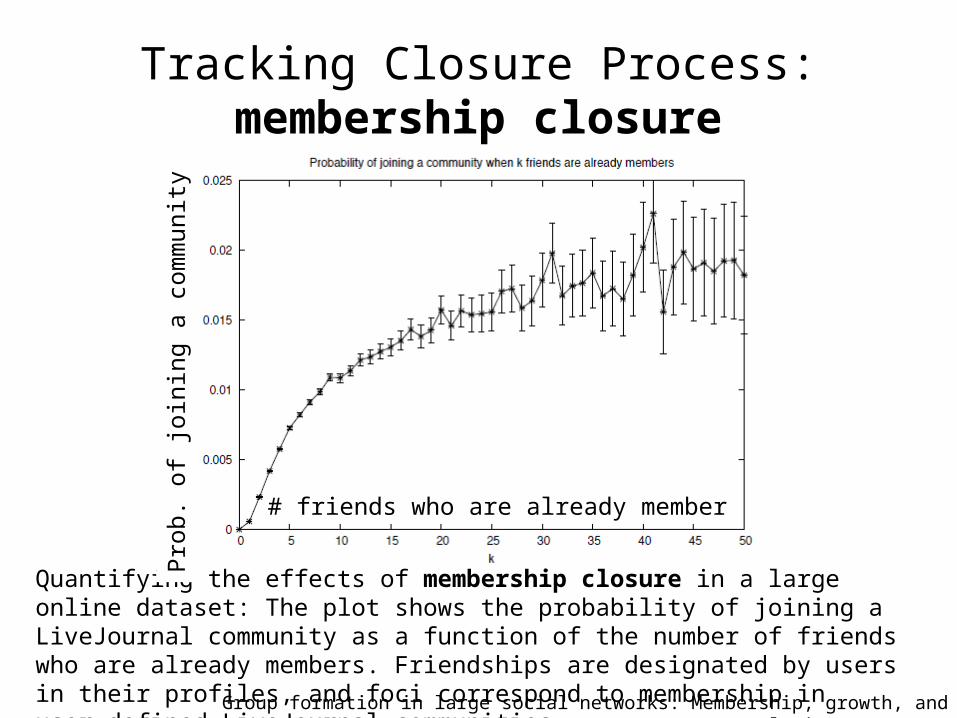
Tracking Closure Process:membership closure
Quantifying the effects of membership closure in a large online dataset: The plot shows the probability of joining a LiveJournal community as a function of the number of friends who are already members. Friendships are designated by users in their profiles, and foci correspond to membership in user-defined LiveJournal communities
Group formation in large social networks: Membership, growth, and evolution, KDD 2006
# friends who are already memberProb
. of j
oini
ng a
com
mun
ity

The average similarity of two editors on Wikipedia, relative to the time (0) at which they first communicated. Each unit corresponds to a single Wikipedia action taken by either of the two editors. The curve increases both before and after the first contact at time 0, indicating that both selection and social influence play a role; the increase in similarity is steepest just before time 0.
Tracking Closure Process: Interplay• Similarity in Wikipedia: if editor A has edited the Wikipedia articles on
Ithaca NY and Cornell University, and editor B has edited the articles on Cornell University and Stanford University, then their similarity under this measure is 1/3, since they have jointly edited one article (Cornell) out of three that they have edited in total (Cornell, Ithaca, and Stanford).
Feedback effects between similarity and social influence in online communities, KDD 2008# of edits after first communication
Sim
ilarit
y
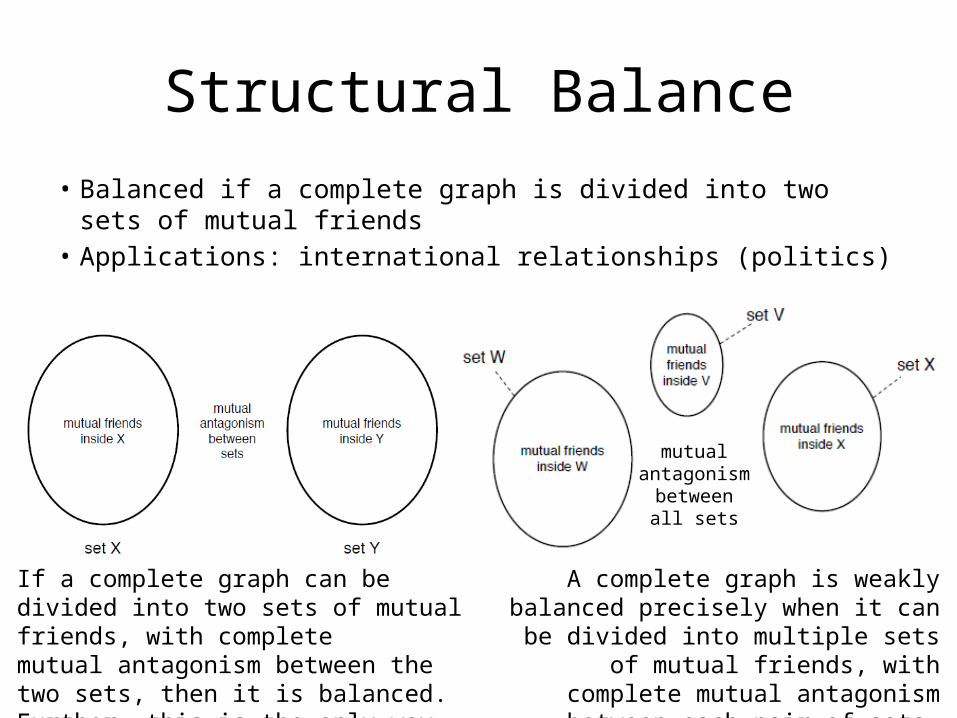
Structural Balance
• Balanced if a complete graph is divided into two sets of mutual friends
• Applications: international relationships (politics)
A complete graph is weakly balanced precisely when it can be divided into multiple sets of
mutual friends, with complete mutual antagonism between each pair of sets.
If a complete graph can be divided into two sets of mutual friends, with completemutual antagonism between the two sets, then it is balanced. Further, this is the only way for a complete graph to be balanced.
mutualantagonism
betweenall sets

Summary
• Graphs: connectivity, component, giant component, small-world phenomenon
• Strong/weak ties: triadic closure, clustering coefficients, bridges/local bridges, strong triadic closure, social capital, graph partitioning (betweenness)
• Homophily: testing, underlying mechanisms, implications (health, spatial segregation)
• Affiliation: social affiliation network; closure process• Structural balance