Embed Size (px)
Citation preview

Social Network Analysis: ‘How to guide’
January 2016

Social Network Analysis: ‘How to’ guide 2
Contents
Table of Contents
What is social network analysis? .................................................................................................................. 3
What can social network analysis do for me? ................................................................................................ 3
What will I get at the end of it? .................................................................................................................... 3
What are the limitations? ............................................................................................................................. 5
What do I need to complete the analysis?..................................................................................................... 6
Approach ..................................................................................................................................................... 7
Resource A: Possible data collection process ................................................................................................. 9
Resource B: Possible analytical approach .................................................................................................... 13
Disclaimer: ‘The views expressed in this report are those of the authors, not necessarily those
of the Home Office (nor do they represent Government policy).’

Social Network Analysis: ‘How to’ guide 3
This guide is intended to help local areas and police forces use intelligence data to undertake
social network analysis of their local gang issues.
What is social network analysis?
The aim of social network analysis is to understand a community by mapping the relationships
that connect them as a network, and then trying to draw out key individuals, groups within the
network (‘components’), and/or associations between the individuals.
A network is simply a number of points (or ‘nodes’) that are connected by links. Generally in
social network analysis, the nodes are people and the links are any social connection between
them – for example, friendship, marital/family ties, or financial ties.
What can social network analysis do for me?
Social network analysis can provide information about the reach of gangs, the impact of gangs,
and gang activity. The approach may also allow you to identify those who may be at risk of
gang-association and/or being exploited by gangs.
Network analysis can be completed ‘qualitatively’ – that is, with diagrams drawn by hand. This
guide details a more systematic approach to network analysis. Particular benefits of this include:
Practicality: The approach provides an objective, replicable representation of the
community which is described in the intelligence data. It does not need those
undertaking it to have knowledge of a gang or extensive analytical training.
Wider applications: It also provides a systematic understanding of local gang issues
and the relationship with those who may be seen as gang-associated. This has potential
applications for producing community impact statements and particular interventions
(e.g. gang injunctions).
Targeting responses: The process of mapping a gang may allow action to be more
closely tailored to specific individuals – for example, differentiating between ‘core’ gang
members and peripheral members. This may increase the effectiveness of work to
tackle gangs and gang culture.
Multiple uses: The data collection process can be completed centrally and the overall
network analysis provided to local teams. The networks can then be examined /
manipulated to answer particular local questions as required. This may be more efficient
than producing different analytical products for each local issue.
What will I get at the end of it?
The technique will generate diagrams that will show the relationships between individuals that
are contained in your data, this could include: criminal links, social links, potential feuds, etc.
Figure 1 below gives an example – to note the diagrams can include names, pictures and
further details of individuals as required.
Social Network Analysis: ‘How to’ guide 4
Figure 1: Example output (note: numbers here indicate individuals).
It is also possible to produce statistical analysis of the networks which can help you to define a
problem, and to explore the roles of particular individuals in the networks (see table 1 for some
key statistics). This can be completed automatically by the social network analysis software.

Social Network Analysis: ‘How to’ guide 5
Table 1: Key network statistics
Statistic Shows Explanation
Size
Number of nodes - the people in the network
Size of the network Number of individuals in the network
Number of links - social connections/relationships between nodes (e.g. friendship, family ties)
How ‘busy’ the network in total Number of relationships between individuals in the network (in total)
Number of unique links How ‘busy’ the network is, taking out relationships that are duplicated
Number of relationships between individuals in the network, with duplicates removed
Cohesiveness
Number of components – distinct groups in the network
Whether there may be sub-groups in the network
Number of discrete groups in the network
Density
The extent to which nodes are interconnected – lower density networks have fewer links between nodes
The proportion of all links that are actually present
Diameter Size of the network Greatest number of steps between any pair of nodes
Mean average distance between nodes How ‘close’ (in network terms) the nodes are to each other
Average number of steps needed to go from one node to any other
Centrality
Mean degree How central (on average) nodes in the network are
Average number of links that pass through the nodes
Mean betweeness How central (on average) nodes in the network are
Average number of unique paths that pass through the nodes
What are the limitations?
The analysis is based on intelligence data, which have the potential to be incomplete,
inaccurate or untimely. The results may be most usefully considered in combination with other
sources of information, and operational experience.
The approach described here does not limit itself to identifying gang members. This means that
not all those identified in the analysis will necessarily recognise themselves or be recognised by
others as being in a gang.

Social Network Analysis: ‘How to’ guide 6
What do I need to complete the analysis?
Software
To complete the social network analysis, software packages will be needed to complete the
following tasks:
Data collection – E.g. Spreadsheet software;
Data analysis – E.g. Social network analysis software;
Data visualisation – E.g. Network visualisation software.
Some packages may encompass all three. Packages used to create the analysis in this guide
were UCINET1 and Node XL2 package for Microsoft Excel3.
Resources
The time and number of people required to complete the data collection and analysis will
depend on the amount of intelligence that needs to be coded and the speed / familiarity of those
undertaking the approach. As a rough rule of thumb, coding intelligence data using the method
set out in this guidance should take around 10-15 minutes per intelligence log.
1 Borgatti, S.P., Everett, M.G. & Freeman, L.C. (2002). Ucinet for Windows: Software for Social Network Analysis. Harvard, MA: Analytic Technologies.
2 Social Media Research Foundation, <http://nodexl.codeplex.com/>
3 For UCINET, the collected data was converted into a format that could be read by the software via a Blitzbasic routine (See
http://www.blitzbasic.com/ ). The networks produced were then visualised in NetDraw (See
<https://sites.google.com/site/netdrawsoftware/download>. This was not needed for Node XL, which is able to read in data that
is not in matrix form.

Social Network Analysis: ‘How to’ guide 7
Approach
Step 1: Define your focus
In completing a network analysis, it is beneficial to set your focus. This will involve considering
various elements of the analysis:
Element Issue Considerations
The gang you will focus on
The decision on what gang you will focus on may be driven by operational need, or consideration of impact or geographical area
Social network analysis may be most reliably applied to a relatively small area, for which data is likely to be more complete
The individuals within the gang you will focus on
A gang as a whole may be too large to focus on with available resources
Are there key individuals within this gang you want to know about?
The time period you want to look at
Looking at a longer time period may provide a more detailed picture, but takes time to do
Has the picture changed over time?
The size of catchment you are aiming for
The catchment will influence how long the process takes4
Is this wide enough for the issue you are looking to address?
Step 2: Decide what data you will use
Social network analysis can be applied to any data that highlights relationships between things
(e.g. individuals, objects, events, etc.). When looking at gangs, the approach works best with
data that can capture non-criminal as well as criminal links, since a lot of useful information is
contained in social links. Because of this, intelligence data may be particularly relevant.
However, it can be applied to purely criminal data (e.g. arrests).
If using police intelligence data, a decision may need to be made about the grading level of the
intelligence that will be included in analysis. The decision will depend on the amount of data
held and the reliability of the data, and should be made in consultation with intelligence analysts.
Step 3: Collect data
Resource A provides a process for data collection using police intelligence data. In summary,
intelligence logs will need to be searched for the names of individuals, and the logs coded
according to set categories. The information is inputted onto a spreadsheet which then forms
the core dataset for the network analysis. An important aspect of the data collection is being
sure not to include individuals twice – for example, due to slight differences in names.
Step 4: Analyse your findings
Social network analysis entails exploring the networks you create to investigate particular
questions you want to answer. Therefore, there is no set way of undertaking the analysis.
4 The approach detailed in this guide follows a 2-step process.

Social Network Analysis: ‘How to’ guide 8
However, some questions you might want to ask are provided in Resource B. Statistical
analysis of the networks may help you to answer these questions (see table 1 for a selection of
the statistics available).
By plotting the network’s centrality scores (degree and betweeness, see table 1), you can also
examine the role / characteristics of the nodes in the network relative to the others in that
network (e.g. by comparing them against the mean average scores). These can be summarised
as follows:
Role
Betweeness (Unique links to
others in the network)
Degree (Connected to
many individuals)
Characteristics
Gatekeepers
Higher
Lower
May play an important role in activity, but not much information is held on them
Removal may fragment networks
Highly visible figures
Lower
Higher
May have information about many others in the network
May be involved in lots of activity in the network, but do not play a unique role
Central figures
Higher
Higher
Very visible and central role
Key figures that may be focused on to fragment networks and to gather information
Step 5: Validate your findings
Social network analysis can only tell you what the intelligence data shows, and will not give you
all the context / details around the data. The intelligence picture may be incomplete or
misleading in places and certain gang activities may be more visible than others, thus skewing
the picture. For example, drug dealing may be more visible than sexual exploitation but both
activities may well be occurring. For this reason it is important to validate findings against
operational experience. Examples of the types of questions to ask include:
Do the findings match what is known?
Is there anything that seems unusual?
Can any unusual results be explained by issues with the data e.g. the quality or the
content of the intelligence log?
Validating the data in this way not only helps to quality assure the findings but can also throw up
interesting aspects of the data for further exploration.
Social Network Analysis: ‘How to’ guide 9
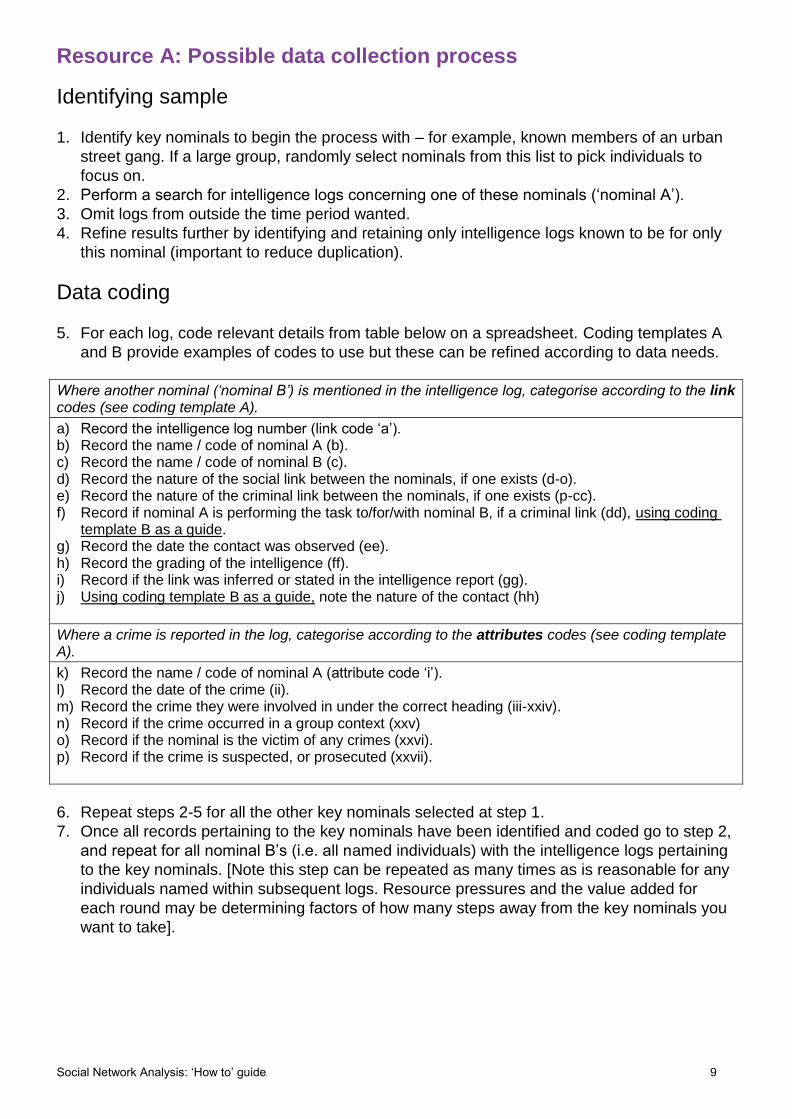
Resource A: Possible data collection process
Identifying sample
1. Identify key nominals to begin the process with – for example, known members of an urban
street gang. If a large group, randomly select nominals from this list to pick individuals to
focus on.
2. Perform a search for intelligence logs concerning one of these nominals (‘nominal A’).
3. Omit logs from outside the time period wanted.
4. Refine results further by identifying and retaining only intelligence logs known to be for only
this nominal (important to reduce duplication).
Data coding
5. For each log, code relevant details from table below on a spreadsheet. Coding templates A
and B provide examples of codes to use but these can be refined according to data needs.
Where another nominal (‘nominal B’) is mentioned in the intelligence log, categorise according to the link codes (see coding template A).
a) Record the intelligence log number (link code ‘a’). b) Record the name / code of nominal A (b). c) Record the name / code of nominal B (c). d) Record the nature of the social link between the nominals, if one exists (d-o). e) Record the nature of the criminal link between the nominals, if one exists (p-cc). f) Record if nominal A is performing the task to/for/with nominal B, if a criminal link (dd), using coding
template B as a guide. g) Record the date the contact was observed (ee). h) Record the grading of the intelligence (ff). i) Record if the link was inferred or stated in the intelligence report (gg). j) Using coding template B as a guide, note the nature of the contact (hh)
Where a crime is reported in the log, categorise according to the attributes codes (see coding template A).
k) Record the name / code of nominal A (attribute code ‘i’). l) Record the date of the crime (ii). m) Record the crime they were involved in under the correct heading (iii-xxiv). n) Record if the crime occurred in a group context (xxv) o) Record if the nominal is the victim of any crimes (xxvi). p) Record if the crime is suspected, or prosecuted (xxvii).
6. Repeat steps 2-5 for all the other key nominals selected at step 1.
7. Once all records pertaining to the key nominals have been identified and coded go to step 2,
and repeat for all nominal B’s (i.e. all named individuals) with the intelligence logs pertaining
to the key nominals. [Note this step can be repeated as many times as is reasonable for any
individuals named within subsequent logs. Resource pressures and the value added for
each round may be determining factors of how many steps away from the key nominals you
want to take].

Social Network Analysis: ‘How to’ guide 10
Coding template A: links and attributes
The codes below can form the basis of a spreadsheet which constitutes the data for social network analysis. Unless the code is italicised, a 0 or a 1 is used to indicate respectively that the log either does not or does indicate this.
1. Link codes a. Intelligence log number b. Nominal A name / code c. Nominal B name / code
Social d. Unknown relationship e. Acquaintance / friend f. Business g. Romantic h. Family i. Financial j. Member of same gang k. Member of different gang l. ‘A’ perpetrated crime against ‘B’ m. ‘A’ is victim of crime by ‘B’ n. Feud/dispute o. Other (e.g. social services)
Criminal p. Legitimate relationship q. Antisocial behaviour r. Drugs s. Firearms access t. Firearms supply u. Violent crime without injury v. Violent crime with injury w. Crime involving the use of a weapon x. Theft with force or threat of force y. Theft without force or threat of force z. Sexual offence aa. Financial offence bb. Driving-related offence cc. Other criminal activity
Causality of criminal dd. To/For/With
Other information ee. Data of contact ff. Intelligence grade gg. (1) Link inferred by intel (2) Link inferred
by analyst hh. Nature of contact
2. Attributes codes (if applicable) i. Name / code of nominal A ii. Date
Crime iii. Violence against the person with injury iv. Violence against the person with injury v. Threat of violence vi. Homicide vii. Firearms possession viii. Firearms offences ix. Knife or sharp instrument possession x. Knife or sharp instrument offences xi. Robbery xii. Other theft xiii. Burglary xiv. Fraud xv. Antisocial behaviour xvi. Causing public fear or distress xvii. Vehicle offences xviii. Arson xix. Vandalisms and criminal damage xx. Drug possession with intent to supply xxi. Drug possession without intent to supply xxii. Most serious sexual offences xxiii. Other sexual offences xxiv. Other non-notifiable crime Other information xxv. Incident occurred as a whole group activity
(1=yes, 2=no) xxvi. (1) Victim of crime (2) Perpetrator of crime (3)
present at crime xxvii. (1) Suspected (2) Prosecuted

Social Network Analysis: ‘How to’ guide 11
Coding template B: Nature of contact
To For With
Criminal (general)
Assaults ✓ ✓
Intimidates ✓ ✓
Kills ✓ ✓
Drives ✓ ✓
Performs monetary task ✓ ✓
Performs weapons storage ✓ ✓
Provides phone use ✓ ✓
Provides protection ✓ ✓
Vandalises ✓ ✓
Sexually offends ✓ ✓
Carries weapon ✓ ✓
Provides weapon ✓ ✓
Steals ✓ ✓
Recruits gang members ✓ ✓
Provides gang members ✓ ✓
Disturbs the peace ✓
Displays delinquent / anti-social behaviour ✓
Supports other criminal business dealings ✓ ✓
Provides other criminal service ✓ ✓
Provides vehicle for other criminal activity ✓ ✓
Supplies illegal goods ✓ ✓ ✓
Involved in supply of illegal goods ✓
Involved in other criminal task ✓
Involved in other criminal activity ✓
Drugs
Assaults (drug-related) ✓ ✓
Intimidates (drug-related) ✓ ✓
Buys drugs ✓ ✓
Sells drugs ✓ ✓ ✓
Carries drugs ✓ ✓
Carries drugs money ✓ ✓
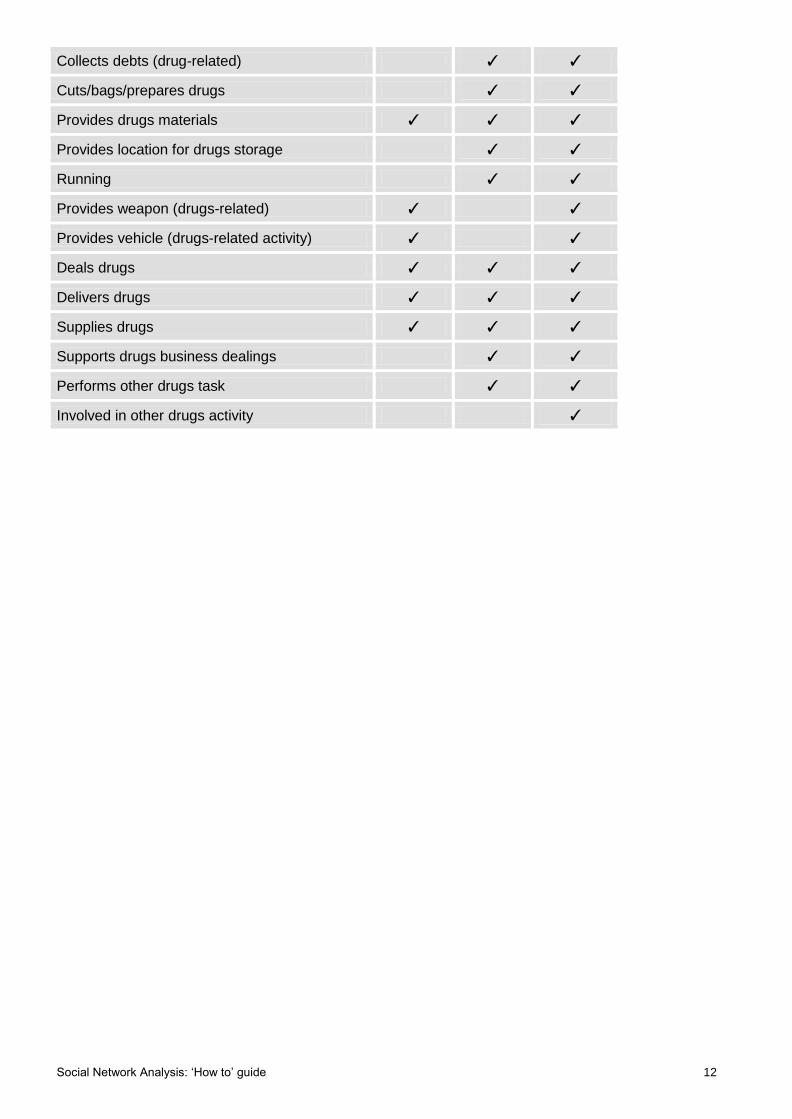
Social Network Analysis: ‘How to’ guide 12
Collects debts (drug-related) ✓ ✓
Cuts/bags/prepares drugs ✓ ✓
Provides drugs materials ✓ ✓ ✓
Provides location for drugs storage ✓ ✓
Running ✓ ✓
Provides weapon (drugs-related) ✓ ✓
Provides vehicle (drugs-related activity) ✓ ✓
Deals drugs ✓ ✓ ✓
Delivers drugs ✓ ✓ ✓
Supplies drugs ✓ ✓ ✓
Supports drugs business dealings ✓ ✓
Performs other drugs task ✓ ✓
Involved in other drugs activity ✓

Social Network Analysis: ‘How to’ guide 13
Resource B: Possible analytical approach
Area of interest Questions to explore with the networks Validation questions
1. Understanding a particular issue (e.g. drugs)
Which individuals are linked together in the network? How are they linked?
Do results match what I know? What seems unusual? Could unusual results be explained by an issue with the data? Who knows the picture on the ground? What do they think?
Who is peripheral to the network and who is central?
Who turns up in some networks and not others? Why is this?
2. Disrupting activity
Can any hierarchy be seen in the gang (e.g. leaders)?
Are there any clear opportunities to fragment the networks (e.g. focusing on ‘gatekeepers’)?
Are some networks more / less densely packed (and therefore potentially more / less difficult to disrupt)?
3. Identifying vulnerable individuals
Who may be vulnerable to increased involvement in gang activity (e.g. who is linked to gang nominals / crime)?
Who already looks involved? Could they potentially draw others in?
4. Targeting interventions
What role do individuals play in the networks?
Who is connected to lots of others?
Who is uniquely connected to lots of others?
Who is a ‘gatekeeper’?
If an intervention was delivered to individuals, what impact would it have on the network?

ISBN: 978-1-78655-066-8
ISSN: 1756-3666
© Crown copyright 2016
This publication is licensed under the terms of the Open Government Licence v3.0
except where otherwise stated. To view this licence, visit
nationalarchives.gov.uk/doc/open-government-licence/version/3 or write to the
Information Policy Team, The National Archives, Kew, London TW9 4DU, or email:
Where we have identified any third party copyright information you will need to obtain
permission from the copyright holders concerned.


![B6500 Network Guide> 2 - OKI Supportmy.okidata.com/mandown.nsf/f3a03a23b5aac07f8525725d006ba226... · B6500 Network Guide> 2 ... -C, [Parameter], [Parameter] ... B6500 Network Guide>](https://img.pdfslide.us/doc/110x75/5c8af2c209d3f207658c8cbb/b6500-network-guide-2-oki-b6500-network-guide-2-c-parameter-parameter.jpg)