Embed Size (px)
Citation preview

Running head: TEACHER-STUDENT RELATIONSHIPS
1
Social motivation in the secondary classroom: Assessing teacher-student relationships from both perspectives
Hunter Gehlbach, Maureen E. Brinkworth, Anna Harris Harvard University
April, 2011
Author Note
Hunter Gehlbach, Harvard Graduate School of Education, Harvard University; Maureen E. Brinkworth, Harvard Graduate School of Education, Harvard University; and Anna Harris, Harvard Graduate School of Education, Harvard University. This research was supported by generous funding through a grant from the Spencer Foundation and an Early Career Research Award by Division 15 of the American Psychological Association to Hunter Gehlbach. The authors are particularly grateful for the generous assistance of the six participating schools. Special thanks also go to Mike Hurwitz, Stephanie Jones, and John Willett for their methodological insights and to Caitlin Elliot and Maria Mikadze for their helpful comments on an earlier draft. Rebecca Zazove provided invaluable assistance in helping to collect these data. Please address all correspondence to Hunter Gehlbach: [email protected]. Please cite as: Gehlbach, H., Brinkworth, M. E., & Harris, A. D. (2011, April). Social motivation in the secondary classroom: Assessing teacher-student relationships and student outcomes. Paper presented at the American Educational Research Association, New Orleans.
Running head: TEACHER-STUDENT RELATIONSHIPS
2
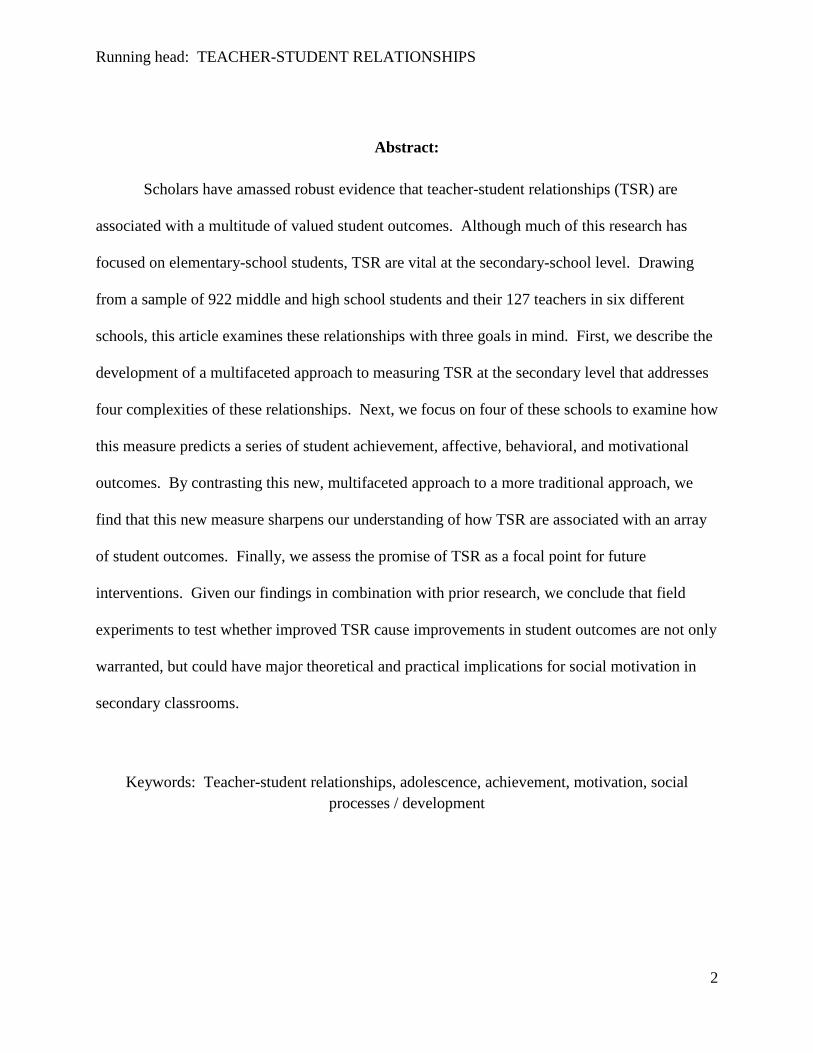
Abstract:
Scholars have amassed robust evidence that teacher-student relationships (TSR) are
associated with a multitude of valued student outcomes. Although much of this research has
focused on elementary-school students, TSR are vital at the secondary-school level. Drawing
from a sample of 922 middle and high school students and their 127 teachers in six different
schools, this article examines these relationships with three goals in mind. First, we describe the
development of a multifaceted approach to measuring TSR at the secondary level that addresses
four complexities of these relationships. Next, we focus on four of these schools to examine how
this measure predicts a series of student achievement, affective, behavioral, and motivational
outcomes. By contrasting this new, multifaceted approach to a more traditional approach, we
find that this new measure sharpens our understanding of how TSR are associated with an array
of student outcomes. Finally, we assess the promise of TSR as a focal point for future
interventions. Given our findings in combination with prior research, we conclude that field
experiments to test whether improved TSR cause improvements in student outcomes are not only
warranted, but could have major theoretical and practical implications for social motivation in
secondary classrooms.
Keywords: Teacher-student relationships, adolescence, achievement, motivation, social processes / development

Running head: TEACHER-STUDENT RELATIONSHIPS
3
Social motivation in the secondary classroom: Assessing teacher-student relationships from both perspectives
“Successful relationships, more than any other factor, are the key to human happiness.” -- Daniel Gilbert, host of This Emotional Life
Scholars have identified relationships not only as the key to happiness, but as a core
psychological need and a critical motivator of human behavior (Ryan & Deci, 2000). They
buffer against stress, facilitate social/emotional development, and play a critical role in schooling
outcomes for students (Martin & Dowson, 2009). Within classroom contexts, relationships
between teachers and students are especially significant. Despite the preponderant focus on
teacher-student relationships (TSR) at the elementary level, TSR are especially important for
adolescents. As students at this developmental stage increasingly strive for autonomy from their
parents, they often look to other adults for important relationships (Eccles et al., 1993). The
relative health of these relationships has the potential to impact a tremendous array of
educational outcomes including students’ academic achievement, affect, behavior, and
motivation (Juvonen, 2006). Pianta and Allen (2008) note that at the secondary school level
“positive relationships with adults are perhaps the single most important ingredient promoting
positive youth development” (p. 24).
Because TSR are associated with such a wide array of student outcomes, they hold
tremendous potential as a locus for interventions if these associations are causally linked. Even
if causal associations emerge between TSR and only a quarter of the student outcomes
documented by the literature, interventions that improve TSR would be a great boon to
education. However, before researchers invest in developing interventions, scholars need to
understand and accurately measure TSR despite their complex nature – we cannot know whether
we are improving TSR unless we can measure them accurately.
Running head: TEACHER-STUDENT RELATIONSHIPS
4
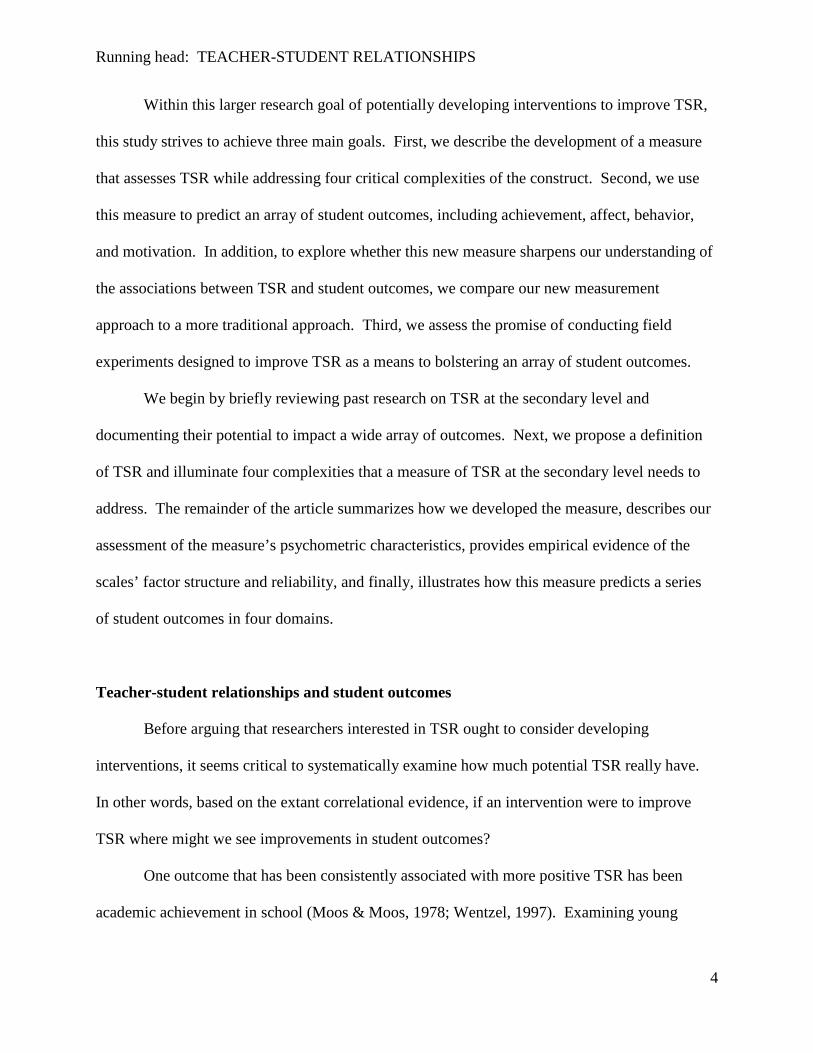
Within this larger research goal of potentially developing interventions to improve TSR,
this study strives to achieve three main goals. First, we describe the development of a measure
that assesses TSR while addressing four critical complexities of the construct. Second, we use
this measure to predict an array of student outcomes, including achievement, affect, behavior,
and motivation. In addition, to explore whether this new measure sharpens our understanding of
the associations between TSR and student outcomes, we compare our new measurement
approach to a more traditional approach. Third, we assess the promise of conducting field
experiments designed to improve TSR as a means to bolstering an array of student outcomes.
We begin by briefly reviewing past research on TSR at the secondary level and
documenting their potential to impact a wide array of outcomes. Next, we propose a definition
of TSR and illuminate four complexities that a measure of TSR at the secondary level needs to
address. The remainder of the article summarizes how we developed the measure, describes our
assessment of the measure’s psychometric characteristics, provides empirical evidence of the
scales’ factor structure and reliability, and finally, illustrates how this measure predicts a series
of student outcomes in four domains.
Teacher-student relationships and student outcomes
Before arguing that researchers interested in TSR ought to consider developing
interventions, it seems critical to systematically examine how much potential TSR really have.
In other words, based on the extant correlational evidence, if an intervention were to improve
TSR where might we see improvements in student outcomes?
One outcome that has been consistently associated with more positive TSR has been
academic achievement in school (Moos & Moos, 1978; Wentzel, 1997). Examining young
Running head: TEACHER-STUDENT RELATIONSHIPS
5
adolescents in math classes, Midgley, Feldlaufer, & Eccles (1989) found that students who
experienced more teacher support exhibited higher achievement in mathematics on a statewide
standardized test. Goodenow’s (1993) study of middle school students found that teacher
support also significantly predicted end-of-year grades in English classes. Wentzel (2002) found
that teachers’ high expectations also predicted middle school students’ end-of-year grades in the
subject taught by that teacher. Studies of younger students have found associations between
TSR and an even wider array of achievement outcomes, such as better concept development
(Pianta, Nimetz, & Bennett, 1997) and visual and language skills (Birch & Ladd, 1996, 1997).
In addition, other studies of younger students have linked early TSR and academic competence
longitudinally (Birch & Ladd, 1997; Hamre & Pianta, 2001; Pianta & Nimetz, 1991; Pianta,
Steinberg, & Rollins, 1995). Thus, more positive TSR are associated with student achievement
(conceptualized in a variety of ways) and these associations can persist over time.
TSR are also associated with students’ affect towards school. Students whose teachers
are more supportive have more positive attitudes toward school (Roeser, Midgley, & Urdan,
1996; Ryan, Stiller, & Lynch, 1994) and their subject matter (Midgley, et al., 1989). Even after
accounting for parental and peer support, Wentzel (1998) found that young adolescents’
perceptions of support from their teachers were independently related to their class- and school-
related interests. Wentzel (2002) also found that teachers’ high expectations also predicted
middle school students’ interest in class. Conversely, when students lack a bond with a teacher
or have a negative TSR, they are more likely to be disengaged or feel alienated (Murdock, 1999).
Evidence indicates that TSR may have a lasting impact on students’ future plans as well.
Murdock, Anderman, and Hodge (2000) found that students’ views of their teachers’
expectations of them in seventh grade were a better predictor of their future college plans than

Running head: TEACHER-STUDENT RELATIONSHIPS
6
students’ own perceptions of their academic abilities. Longitudinal examinations of middle
school students have found that changes in perceived teacher regard predicted changes in
adolescents’ self-esteem, as well as declines in their anger and depressive symptoms (Reddy,
Rhodes, & Mulhall, 2003; Roeser & Eccles, 1998). Given this evidence, it remains plausible that
improvements in TSR might cause improvements in affective outcomes within and beyond the
classroom.
Links between TSR and students’ (positive and negative) behavior have also been well-
documented. For instance, students who view their teachers as more caring are more willing to
pay attention in class (Wentzel, 1997). Conversely, Wentzel (2002) found that when students
perceived more negative feedback from their teachers, they engaged in significantly less
prosocial behavior in the classroom. In another study, Murdock (1999) found that adolescents’
who perceived more disinterest and/or criticism from their teachers were more likely to cause
discipline problems for their teachers. TSR may play a role in more major, life-changing
behaviors too. According to Rumberger (1995), adolescents with more positive TSR are less at
risk of dropping out of school, even after controlling for other attitudes and background
characteristics. Scholars have also discovered associations between TSR and adolescent risk
behaviors outside of the classroom. Data from the National Longitudinal Study of Adolescent
Health (Add Health) indicates that when students feel more connected to their school (including
feeling more positively about their teachers), they are less likely to engage in violence, abuse
drugs, or drink alcohol (Resnick et al., 1997). Thus, TSR are associated with a wide range of
student behaviors, many of which are crucially important for their academic development.
Finally, TSR may impact students’ motivation. Given the foundational nature of
relationships in human motivation (Ryan & Deci, 2000), the robust associations between TSR
Running head: TEACHER-STUDENT RELATIONSHIPS
7
and adolescents’ academic motivation are intuitive. Studies indicate that adolescents’
perceptions of teacher support and caring predict student effort as reported by both teachers
(Goodenow, 1993; Murdock & Miller, 2003) and students (Wentzel, 1997). Murdock and Miller
(2003) found that perceived teacher caring was also associated with students’ academic self-
efficacy and intrinsic valuing of education. The association between TSR and motivation also
emerges in longitudinal data. For students transitioning to high school, TSR in middle school
predict ninth-grade motivation, even after controlling for middle school motivation and
achievement (Murdock, et al., 2000). Thus, it is also plausible that improving TSR might have
positive consequences for students’ academic motivation.
Conceptualizing and measuring teacher-student relationships
The aforementioned literature has contributed greatly to our understanding of the
potential impact of TSR on students’ academic achievement, motivation, affect, and behaviors.
Part of the strength of these studies as a whole is that they operationalize TSR in very different
ways – teacher supportiveness, having high expectations of students, teacher caring, and so on.
However, it also raises questions as to how we should think about TSR – is it some of these? All
of them? Do we care about the teachers’ perceptions of these characteristics or the students’?
In defining TSR, we draw from Pianta’s (1999) work. These relationships are clearly
dyadic, consisting of students’ and teachers’ interpersonal interactions, feelings, and beliefs.
However, the relationships also encompass teachers’ and students’ perceptions of those
interactions, feelings and beliefs. TSR are dynamic and reciprocal (Howes & Ritchie, 2002);
both teachers and students constantly contribute to and are impacted by their relationships with
each other. In a sense, TSR are the aggregation of teachers’ and students’ interactions which are

Running head: TEACHER-STUDENT RELATIONSHIPS
8
stored in each party’s memory as perceptions of one another and then serve to guide future
interactions with the other party.
To translate this construct from a concept to a measure, several challenges emerge. As
implied above, a primary obstacle to assessing TSR is that these relationships are comprised of a
myriad of factors. For example, trust, respect, and learning seem as critical as supportiveness,
expectations, and caring. Previous research on TSR has provided invaluable information about
these discrete factors. However, strengths in certain areas of a TSR presumably compensate for
weaknesses in others. Consequently, the association between a discrete facet of TSR and student
outcomes might differ markedly from the association between the overall relationship and those
same outcomes. Thus, a new measure that conceptualizes these relationships holistically offers a
valuable contribution to the literature. Furthermore, if the ultimate goal of this line of research is
to develop interventions to improve TSR overall, then a more holistic measure is warranted.
A second challenge is ascertaining whose perception of TSR is of interest. TSR are two-
way streets; teachers and students construct these relationships together. Thus, members of the
TSR dyad make up a ‘relational unit’ that may not be fully understood by tapping the perceptions
of a single party. Simply because a student reports liking a teacher, does not mean that those
feelings are reciprocated. Measuring only one perception of the relationship may miss crucial
information. However, most studies of TSR at the secondary level have focused on students’
perceptions, “Missing from the literature is a description of the same child-teacher relationship
from its two participants,” (Pianta, Hamre, & Stuhlman, 2003, p. 218). Thus, a new measure of
TSR should follow the lead of scholars such as Muller (2001) to incorporate both teachers’ and
students’ perceptions. This more complete view of the TSR may provide a better understanding
Running head: TEACHER-STUDENT RELATIONSHIPS
9
of how each party’s views relate to student outcomes and signal where it might make most sense
to intervene (i.e., with teachers or with students).
A third challenge to assessing TSR is that these relationships may be positive, negative,
neither, or both. In other words, simply because a relationship is very positive in some ways
does not preclude the possibility that it may be very negative in other ways. The love-hate
relationships of romance could certainly have classroom analogs. A student may feel that a
teacher holds high academic expectations but simultaneously feel that the teacher is personally
disrespectful. In the study of attitudes, we know that theoretical opposites are not always neatly
arrayed along a single continuum once the data are examined (Cacioppo & Berntson, 1994). We
might reasonably expect the same trend to extend to teachers’ and students’ attitudes towards one
another. Thus, a new measure of TSR might benefit from separate assessments of the
relationship’s positivity and negativity.
Fourth, challenges arise from asymmetries in TSR. Because teachers and students fulfill
different roles, they have different needs and are likely to value different features of the
relationship. This is not to say that all aspects of the TSR are asymmetric – to be sure, some
facets of the relationship will be comparably important for both parties. Respect and friendliness
are likely to matter equally for teachers and students. However, learning from the other party
seems much more important for students than for teachers; following instructions might be a big
issue for teachers but a non-issue for students. Thus, to measure TSR from both perspectives
will likely require items that account for both symmetric and asymmetric aspects of the
relationship.
In sum, the present study built from the impressive foundation of literature indicating the
importance of TSR at the secondary level. We strove to assess TSR holistically and from both

Running head: TEACHER-STUDENT RELATIONSHIPS
10
teachers’ and students’ perspectives; we aimed to account for the positive and negative aspects of
TSR independently while acknowledging the symmetries and asymmetries of these relationships.
Measuring TSR in this way could sharpen our understanding of the role of TSR in student
outcomes.
Scale Development
In addition to addressing these challenges in measuring TSR, we hoped to imbue our
scale with other attributes as well. To optimize its utility for classroom research, we wanted to
keep the scale short. Length seemed particularly critical because we assumed teachers would
frequently need to complete the survey for multiple students. Because we hoped it could assess
TSR longitudinally, we needed the scale to be applicable and relevant across all levels of middle
and high school. Furthermore, the language needed to be simple enough for 6th graders without
sounding patronizing to teachers. Finally, we wanted to make the forms directly comparable
such that a high score from a student and a low score from that student’s teacher signaled
different perceptions of the relationship (rather than being an artifact of different measures). To
address all these constraints, we employed a particularly rigorous process in designing our
parallel scales for teachers and students. We summarize the process as a whole; details of the
individual steps in the process are described in Gehlbach and Brinkworth (manuscript under
review).
First, we reviewed relevant literature to assemble conceptualizations of TSR and existing
instruments from which potential items might be borrowed or adapted. This step provided us
with the definition described above, a working knowledge of the major characteristics that the
previous literature had identified as being important to TSR, and a sample of potential items to

Running head: TEACHER-STUDENT RELATIONSHIPS
11
adapt for our scale. Second, we conducted open-ended interviews and focus groups with 18
teachers and 26 students to learn how they conceptualized these constructs. Because the
academic literature often conceptualizes and prioritizes attributes of teachers and students
differently than teachers and students actually do, we wanted more data on how they thought
about their relationships. Third, we then compared responses from these interviews and focus
groups against the results of the literature review to determine points of overlap, divergence, and
disparities in terminology. By the end of these three initial steps, we had a list of indicators we
felt confident were key ingredients in TSR.
Fourth, we developed items in accordance with the key elements of the latent constructs
suggested by the literature while using language and examples that resonated with the
participants. For example, what the prior literature labeled as teachers’ “emotional
responsiveness” was described by students as “the kind of teacher who you would go to for
advice.” Fifth, to ensure that the items still corresponded to the construct of TSR, we subjected
our items to an expert validation procedure. Scholars familiar with the social interactions
between teachers and students assessed items on their clarity and construct validity (McKenzie,
Wood, Kotecki, Clark, & Brey, 1999; Rubio, Berg-Weger, Tebb, Lee, & Rauch, 2003). Nine
experts evaluated the student form and 11 evaluated the teacher form of the survey. This expert
validation procedure led to the elimination of five items, improved the wording of several others,
and targeted three items for further investigation (during Step 6). Sixth, we employed a
cognitive pretesting procedure with secondary students (N = 20) and teachers (N = 8) to ensure
that the items were comprehended as we intended (see Karabenick et al., 2007 for a description
of cognitive pretesting). This procedure led to additional wording changes. For example, by
asking students to repeat the item “How many times does this teacher make you feel upset in an
Running head: TEACHER-STUDENT RELATIONSHIPS
12
average week?” in their own words, we found that students interpreted the word “upset” in
multiple ways. Some thought of being upset as a consequence of being disciplined or
embarrassed by their teacher. Others mentioned contexts like receiving a bad grade or
disappointing their teacher. Based on this information we narrowed the focus of the question to
“How often does this teacher say something that offends you?” Finally, we piloted the measure
in several classrooms to assess the item means and distributions as well as the inter-item
correlations.
Methods
At the completion of this preliminary scale-development work, we administered the TSR
scale to students and teachers across a range of secondary schools. Specifically, we assigned
each student to report on one of their teachers (selected at random) and teachers to subsequently
report on each student who had reported on them. Through this approach, we wanted to test
whether our hypothesized TSR positivity and negativity scales fit the data for a population of
students and for a population of teachers. In addition, we wanted to assess the reliability of the
resultant scales. Finally, we wished to ascertain how well these new measures of TSR predicted
a host of student outcomes.
Participants
Students and teachers from six different participating schools completed the TSR scale.
We chose a diverse array of schools in order to ascertain whether our scale effectively predicted
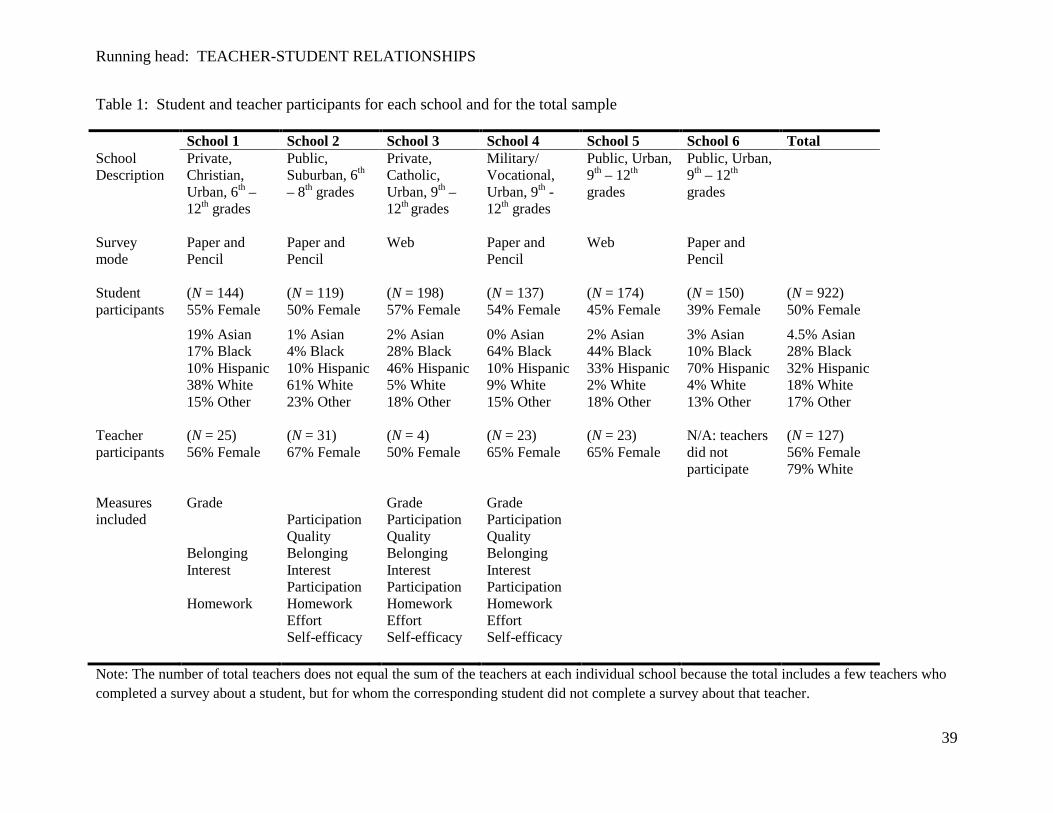
outcomes across a variety of settings – see the summary demographic characteristics of each
institution in Table 1. The overall totals describe the population of the aggregated data sets that

Running head: TEACHER-STUDENT RELATIONSHIPS
13
we used to examine the factor structure of the scales. For our second goal of understanding the
associations between TSR and student outcomes, we used data from the first four schools listed
in Table 1. The remaining two schools were not included in the second analyses because of
substantial missing data for teachers and students (in the case of School 5) and because we were
unable to collect teacher data (in the case of School 6).
***************************
Insert Table 1 about here
***************************
For these four schools, we first computed total participation rate1
(Hoynoski, Link, &
Frankel, 2009). In other words, we calculated the fraction of students who participated out of all
the students at each school. Participation rates were 69% (School 1), 23% (School 2), 67%
(School 3), and 42% School 4). In terms of racial composition, the students in our sample
appeared to be generally representative of their larger student bodies. The percentages of White
students in our samples versus their respective school populations were as follows: 38% versus
34% (School 1), 61% versus 71% (School 2), 5% versus 6% (School 3), and 9% versus 8%
(School 4). In those instances where the percentages in our sample differed markedly from the
larger school population (e.g., in School 3 our sample reported as 28% Black/African American
whereas the school reports a 53% Black population), we have some confidence that it was due to
our participants choosing more specific categories (e.g., many students from School 3 wrote in
“Haitian” in the “other” category).
1 Total participation rate was preferred to response rate because response rate fails to account for portions of the sampling frame that were omitted (e.g., students who were absent on the day that the consent forms were sent home).

Running head: TEACHER-STUDENT RELATIONSHIPS
14
Measures
In each school, students and teachers completed parallel versions of our TSR measures.
Appendix A lists each item for both versions. The psychometric properties of these scales are
described in the first part of the results section.
In the four focal schools we examined an array of student outcomes by obtaining two
indicators each of: achievement, affect, behavior, and motivation. These student outcome
measures are summarized below, and full details are provided in Appendix B. Due to different
time constraints for the survey administration and our efforts to tailor results to the interests of
the schools, we collected slightly different measures (and occasionally different forms of the
same measure) at each school.
Academic achievement. We assessed academic achievement through two measures.
First, we examined students’ grade in the class that they had with the teacher of interest.
Second, after teachers assessed students’ class participation (see the “behavior” measures
below), they rated the contribution quality of those instances when the student participated.
Affect. To measure students’ overall affect towards school, we assessed their sense of
belongingness at school. We borrowed the 4-item scale used by Roeser, Midgley, and Urdan
(1996) in which students’ rated statements such as “I feel like I matter in this school.”
Reliabilities were α = .77 (School 1), α = .74 (School 2), α = .76 (School 3), and α = .76 (School
4). To balance this global sense of how students fit in at their school, we also investigated their
level of interest in their subject matter. At School 1, we simply asked students “How interesting
is the subject this teacher teaches?” At Schools 2 and 4 we added to this item to create a brief 3-
item scale. The reliabilities at Schools 2 and 4 were α = .73 in both cases. At School 3 we
created a similar 3-item scale with slightly different item formats (e.g., a ranking item and an
Running head: TEACHER-STUDENT RELATIONSHIPS
15
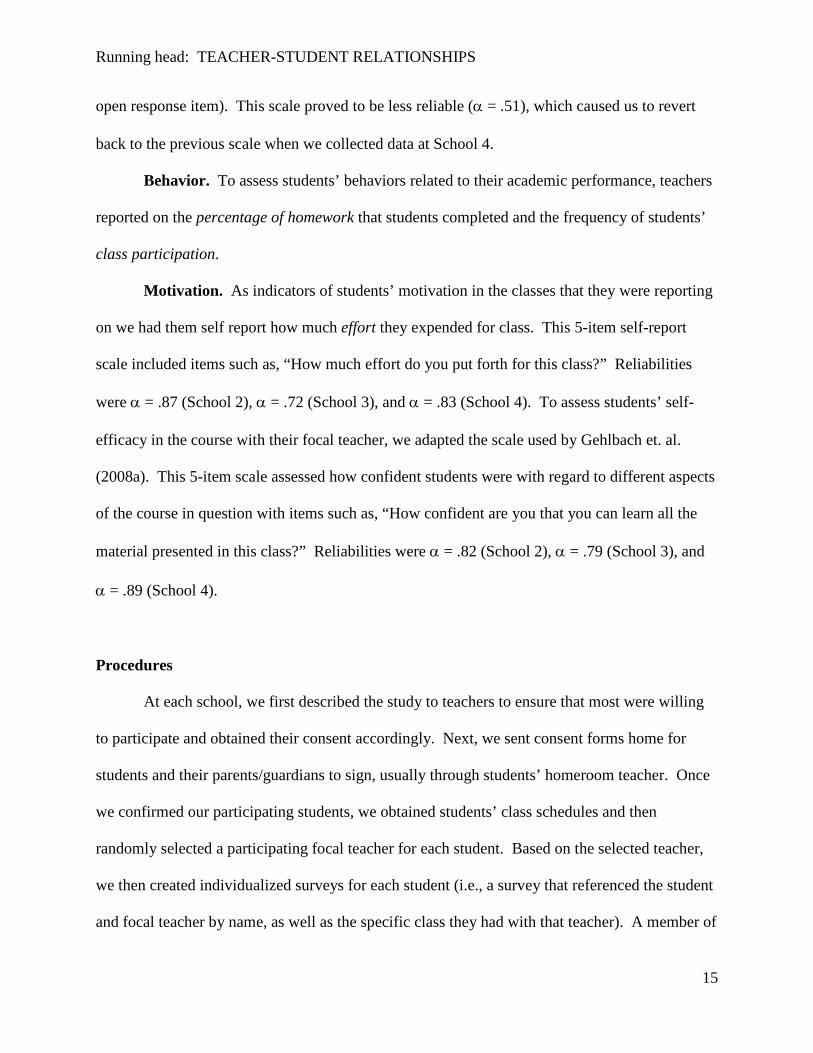
open response item). This scale proved to be less reliable (α = .51), which caused us to revert
back to the previous scale when we collected data at School 4.
Behavior. To assess students’ behaviors related to their academic performance, teachers
reported on the percentage of homework that students completed and the frequency of students’
class participation.
Motivation. As indicators of students’ motivation in the classes that they were reporting
on we had them self report how much effort they expended for class. This 5-item self-report
scale included items such as, “How much effort do you put forth for this class?” Reliabilities
were α = .87 (School 2), α = .72 (School 3), and α = .83 (School 4). To assess students’ self-
efficacy in the course with their focal teacher, we adapted the scale used by Gehlbach et. al.
(2008a). This 5-item scale assessed how confident students were with regard to different aspects
of the course in question with items such as, “How confident are you that you can learn all the
material presented in this class?” Reliabilities were α = .82 (School 2), α = .79 (School 3), and
α = .89 (School 4).
Procedures
At each school, we first described the study to teachers to ensure that most were willing
to participate and obtained their consent accordingly. Next, we sent consent forms home for
students and their parents/guardians to sign, usually through students’ homeroom teacher. Once
we confirmed our participating students, we obtained students’ class schedules and then
randomly selected a participating focal teacher for each student. Based on the selected teacher,
we then created individualized surveys for each student (i.e., a survey that referenced the student
and focal teacher by name, as well as the specific class they had with that teacher). A member of

Running head: TEACHER-STUDENT RELATIONSHIPS
16
the research team administered the survey to students in paper and pencil format or via the web;
no teachers were present during the administration. After receiving the student surveys, we sent
each teacher a parallel form of the survey to complete at their own convenience and return to us
within two weeks. For Schools 1 and 2, data were collected as early in the year as possible while
making sure that teachers would know all their students (late September and late October,
respectively). To examine the pattern of associations between TSR and academic outcomes after
the TSR were more firmly established, we collected data in January just before the end of the
first semester at Schools 3 and 4. At Schools 1 and 2 we were also able to collect follow-up data
from students just before the end of the school year to assess our measure’s test-retest reliability.
Results
We present our results in two parts – first, we describe the psychometric properties of the
TSR scale. Second, we examine how this new approach to assessing TSR might manifest
different associations with an array of student outcomes by contrasting our approach against a
more traditional approach.
Factor Structure and Scale Properties
For both the teacher and student samples, we assessed the structure of the TSR scale
through confirmatory factor analysis, hypothesizing that a model which grouped our items into
positivity and negativity subscales would fit our data. Because several items had conceptual
similarities, we correlated error terms (12 in total) for items that formed the following thematic
clusters: instructional support, positive emotional support, negative behaviors, and negative
emotional support. See Figure 1. We did not investigate variations in factor structure between
Running head: TEACHER-STUDENT RELATIONSHIPS
17
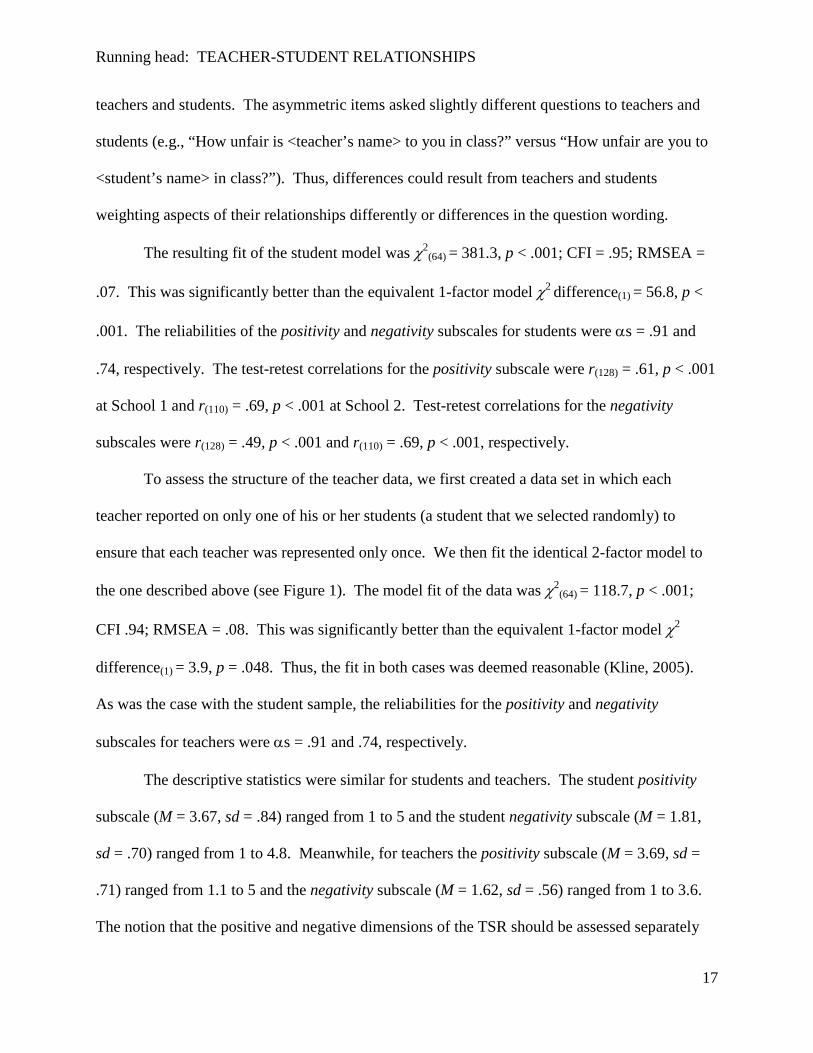
teachers and students. The asymmetric items asked slightly different questions to teachers and
students (e.g., “How unfair is <teacher’s name> to you in class?” versus “How unfair are you to
<student’s name> in class?”). Thus, differences could result from teachers and students
weighting aspects of their relationships differently or differences in the question wording.
The resulting fit of the student model was χ2(64) = 381.3, p < .001; CFI = .95; RMSEA =
.07. This was significantly better than the equivalent 1-factor model χ2 difference(1) = 56.8, p <
.001. The reliabilities of the positivity and negativity subscales for students were αs = .91 and
.74, respectively. The test-retest correlations for the positivity subscale were r(128) = .61, p < .001
at School 1 and r(110) = .69, p < .001 at School 2. Test-retest correlations for the negativity
subscales were r(128) = .49, p < .001 and r(110) = .69, p < .001, respectively.
To assess the structure of the teacher data, we first created a data set in which each
teacher reported on only one of his or her students (a student that we selected randomly) to
ensure that each teacher was represented only once. We then fit the identical 2-factor model to
the one described above (see Figure 1). The model fit of the data was χ2(64) = 118.7, p < .001;
CFI .94; RMSEA = .08. This was significantly better than the equivalent 1-factor model χ2
difference(1) = 3.9, p = .048. Thus, the fit in both cases was deemed reasonable (Kline, 2005).
As was the case with the student sample, the reliabilities for the positivity and negativity
subscales for teachers were αs = .91 and .74, respectively.
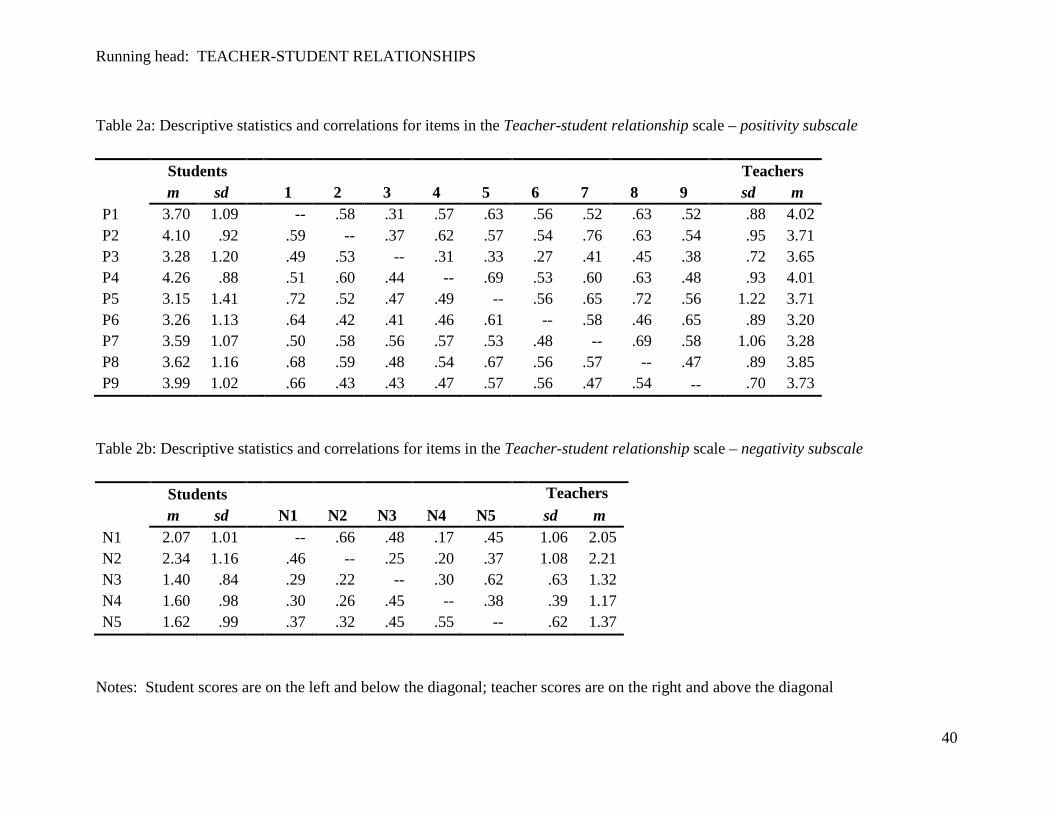
The descriptive statistics were similar for students and teachers. The student positivity
subscale (M = 3.67, sd = .84) ranged from 1 to 5 and the student negativity subscale (M = 1.81,
sd = .70) ranged from 1 to 4.8. Meanwhile, for teachers the positivity subscale (M = 3.69, sd =
.71) ranged from 1.1 to 5 and the negativity subscale (M = 1.62, sd = .56) ranged from 1 to 3.6.
The notion that the positive and negative dimensions of the TSR should be assessed separately
Running head: TEACHER-STUDENT RELATIONSHIPS
18
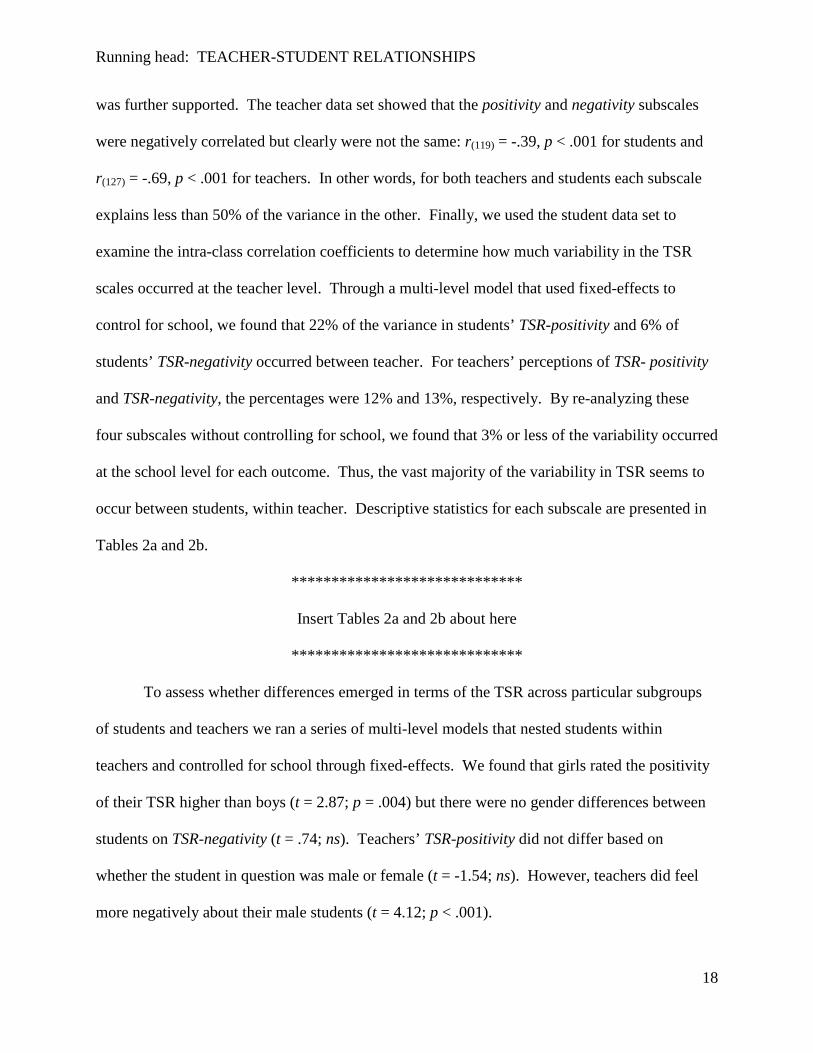
was further supported. The teacher data set showed that the positivity and negativity subscales
were negatively correlated but clearly were not the same: r(119) = -.39, p < .001 for students and
r(127) = -.69, p < .001 for teachers. In other words, for both teachers and students each subscale
explains less than 50% of the variance in the other. Finally, we used the student data set to
examine the intra-class correlation coefficients to determine how much variability in the TSR
scales occurred at the teacher level. Through a multi-level model that used fixed-effects to
control for school, we found that 22% of the variance in students’ TSR-positivity and 6% of
students’ TSR-negativity occurred between teacher. For teachers’ perceptions of TSR- positivity
and TSR-negativity, the percentages were 12% and 13%, respectively. By re-analyzing these
four subscales without controlling for school, we found that 3% or less of the variability occurred
at the school level for each outcome. Thus, the vast majority of the variability in TSR seems to
occur between students, within teacher. Descriptive statistics for each subscale are presented in
Tables 2a and 2b.
*****************************
Insert Tables 2a and 2b about here
*****************************
To assess whether differences emerged in terms of the TSR across particular subgroups
of students and teachers we ran a series of multi-level models that nested students within
teachers and controlled for school through fixed-effects. We found that girls rated the positivity
of their TSR higher than boys (t = 2.87; p = .004) but there were no gender differences between
students on TSR-negativity (t = .74; ns). Teachers’ TSR-positivity did not differ based on
whether the student in question was male or female (t = -1.54; ns). However, teachers did feel
more negatively about their male students (t = 4.12; p < .001).

Running head: TEACHER-STUDENT RELATIONSHIPS
19
Compared to non-White students, White students felt just as positive (t = -.53; ns) about
their teachers. However, White students may have felt slightly less negatively (t = -1.92; p =
.06) about their teachers than their non-White counterparts. Teachers felt no more positively
towards White as compared to non-White students (t = -1.14; ns). However, teachers did feel
less negatively towards their White students as compared to their non-White classmates (t = -
2.09; p = .04).
Neither teacher gender nor teacher race showed any association with any of the four TSR
subscales. In other words, students did not have better (or worse) relationships teachers of a
particular gender or race; teachers of a particular gender or race did not rate their TSR more
highly than other teachers.
Because students’ (but not teachers’) gender and race were associated with TSR, we
included only those student two variables as covariates in the analyses that follow.
Using TSR measure to predict student outcomes
Next, we sought to learn more about TSR as predictors of student outcomes and thus,
their potential as a possible point of intervention for future experimental research. We analyzed
our data using multi-level models with maximum likelihood estimation (using Stata’s xtmixed
procedure) to examine two outcomes in each of the following domains: achievement, affect,
behavior, and motivation. Each model controlled for students’ gender (female = 0, male = 1) and
race (non-White = 0, White = 1) and contained the following predictors: students’ perceptions of
TSR-positivity and TSR-negativity and teachers’ perceptions of TSR-positivity and TSR-
negativity. We were particularly interested in whether our multi-faceted conception of TSR
provided different information than a more traditional approach to measuring TSR. Typically,
Running head: TEACHER-STUDENT RELATIONSHIPS
20
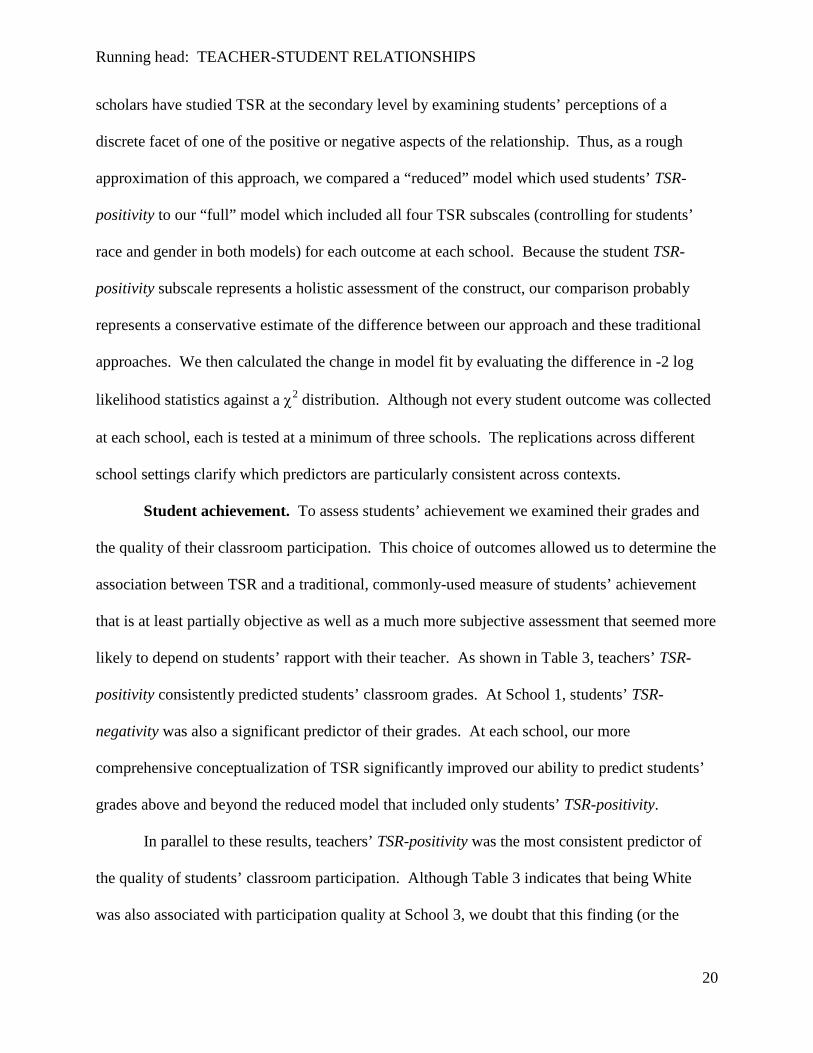
scholars have studied TSR at the secondary level by examining students’ perceptions of a
discrete facet of one of the positive or negative aspects of the relationship. Thus, as a rough
approximation of this approach, we compared a “reduced” model which used students’ TSR-
positivity to our “full” model which included all four TSR subscales (controlling for students’
race and gender in both models) for each outcome at each school. Because the student TSR-
positivity subscale represents a holistic assessment of the construct, our comparison probably
represents a conservative estimate of the difference between our approach and these traditional
approaches. We then calculated the change in model fit by evaluating the difference in -2 log
likelihood statistics against a χ2 distribution. Although not every student outcome was collected
at each school, each is tested at a minimum of three schools. The replications across different
school settings clarify which predictors are particularly consistent across contexts.
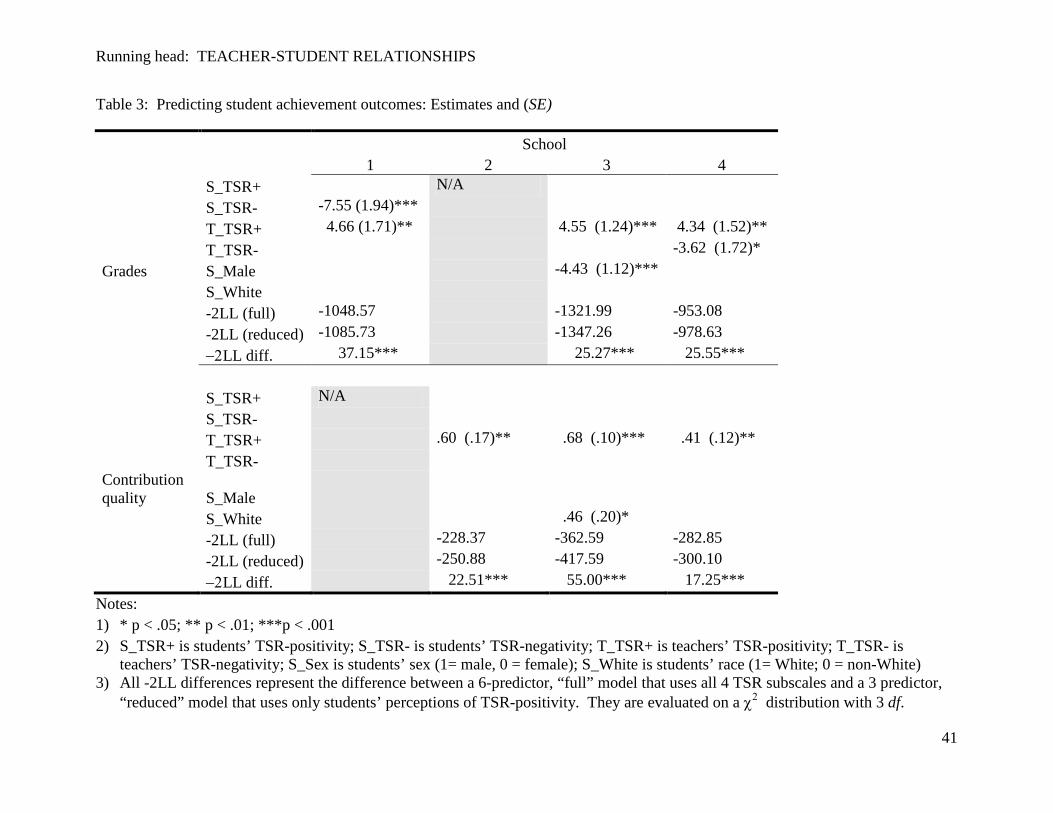
Student achievement. To assess students’ achievement we examined their grades and
the quality of their classroom participation. This choice of outcomes allowed us to determine the
association between TSR and a traditional, commonly-used measure of students’ achievement
that is at least partially objective as well as a much more subjective assessment that seemed more
likely to depend on students’ rapport with their teacher. As shown in Table 3, teachers’ TSR-
positivity consistently predicted students’ classroom grades. At School 1, students’ TSR-
negativity was also a significant predictor of their grades. At each school, our more
comprehensive conceptualization of TSR significantly improved our ability to predict students’
grades above and beyond the reduced model that included only students’ TSR-positivity.
In parallel to these results, teachers’ TSR-positivity was the most consistent predictor of
the quality of students’ classroom participation. Although Table 3 indicates that being White
was also associated with participation quality at School 3, we doubt that this finding (or the
Running head: TEACHER-STUDENT RELATIONSHIPS
21
significant finding regarding interest below) warrants serious consideration given that it is based
on only 10 White students. As before, these three models provided a significant improvement in
model fit over the reduced model.
*****************************
Insert Table 3 about here
*****************************
Affect. In assessing students’ affect (see Table 4), we first examined their overall sense
of belonging in school on the assumption that students who feel more connected to their teachers
should feel more socially comfortable in their schools. Because we assessed their relationship
with only a single teacher (and most secondary students have at least six different teachers), and
because peers likely exert a particularly strong effect on students’ sense of belonging, we
anticipated only a modest association between sense of belonging and TSR. We found that
students’ perceptions of their relationships with teachers (TSR-positivity at the first three Schools
and TSR-negativity at School 4) consistently predicted their sense of belonging across all four
schools. Our full model (as compared to the reduced model) explained significantly more of the
variability in students’ sense of belonging at Schools 1 and 2.
As a different type of affect that was much more localized to the classroom level, we also
examined students’ interest in the specific subject matter taught by their teacher. For this
outcome we thought it plausible that students who got along better with their teachers might
enjoy the subject matter more as a result; conversely students who were particularly interested in
a certain subject might be predisposed to teachers of that subject more favorably. Students’ TSR-
positivity was the most consistent predictor of their interest in the subject matter, although all
three other predictors showed a significant association at one of the schools. At School 3, we

Running head: TEACHER-STUDENT RELATIONSHIPS
22
were surprised to find that the more negatively teachers reported feeling about their students, the
more interested those students seemed to be. Further exploration revealed this to be a suppressor
effect (Rosenberg, 1968). A model that includes only teachers’ TSR-negativity shows that it is
unrelated to interest (t = -.03; ns). In other words, only after controlling for students’ TSR-
positivity (and race), is it the case that increases in teachers’ TSR-negativity are associated with
increases in students’ interest. Our full model explained more of the variability in students’
interest than the reduced model in half of the schools.
*****************************
Insert Table 4 about here
*****************************
Behavior. We focused our assessment of students’ behaviors on those behaviors that we
thought would be particularly germane to their academic performance. In examining the
frequency of students’ participation in classroom discussions, we expected a close association
with TSR. It is hard to imagine that students who have a strained relationship with their teacher
would be excited to participate in class frequently. However, rather than finding a close
relationship between students’ TSR and their participation, across all three schools only teacher’s
perceptions of the TSR were linked to this outcome. Specifically, we found very strong
associations between students’ participation and teachers’ perceptions of the positivity of their
relationship. The effect sizes were particularly notable for teachers’ TSR-positivity for this
outcome (Cohen’s d = 2.4 for School 2; d = 2.5 for School 3; and d = 1.2 for School 3). Similar
to the interest model at School 3, Schools 2 and 3 showed some ostensibly surprising results that
Running head: TEACHER-STUDENT RELATIONSHIPS
23
turned out to be other suppressor effects (Rosenberg, 1968). A model that includes only
teachers’ TSR-negativity is unrelated to participation (t = -.63; ns at School 2; t = -.95; ns at
School 3). Thus, only after one controls for teachers’ TSR-positivity, does teachers’ TSR-
negativity correspond with students’ participation.
As another student behavior that is critical to academic performance, we examined the
percentage of homework that students’ completed. Because homework is a less overtly social
act than class participation, we expected that this outcome might have a weaker association with
TSR. Across all four schools, teachers’ TSR-positivity predicted this outcome. Teachers’ TSR-
negativity was also significant at three other schools. For both behavioral outcomes, the full
model provided significantly more predictive power than the reduced model at each school. See
Table 5.
*****************************
Insert Table 5 about here
*****************************
Motivation. In examining students’ effort, we assumed that most students might try
harder for those teachers with whom they have a closer relationship – perhaps so as not to let the
teacher down. With regard to students’ self-efficacy for the class, it also seemed plausible that
students might appreciate teachers who helped them feel more confident in their abilities to
succeed in class and, as a consequence, develop a more positive relationship with those teachers.
As shown in Table 6, we found that students’ and teachers’ ratings of TSR-positivity were both
consistent predictors of these student outcomes in all but one case (where students’ TSR-
positivity and negativity predicted students’ self-efficacy at School 2). For both motivation
Running head: TEACHER-STUDENT RELATIONSHIPS
24
outcomes, the full model added important additional explanatory information over the reduced
model in all but one of our six comparisons.
*****************************
Insert Table 6 about here
*****************************
Additional analyses
One aspect of particular interest that these analyses do not provide is a clear sense of how
much predictive power this new measure of TSR provides. In other words, does this measure of
TSR predict closer to 5% of the variance in these outcomes or more like 50%? We took
advantage of the high student-to-teacher ratio at School 3 and examined how much variance our
four predictors of TSR (without either of our demographic controls) explained in each outcome
through ordinary least squares with fixed effects for teacher2
2 Because the other schools had so many more teachers, we lacked sufficient power to replicate this analysis on the other schools.
. These analyses indicated that TSR
accounted for 17% of the variance in students’ grades and 30% of the variation in the quality of
their classroom participation. TSR explained less of the variability in our measures of students’
affect (6% for sense of belonging, and 15% for interest). In examining students’ behaviors, TSR
accounted for 45% of the variation in how frequently students participated and 18% of the
variation in the percentage of homework they completed. Finally, our measure of TSR explained
26% and 22% of the variation in students’ effort and self-efficacy, respectively. For certain
outcomes, such as students’ sense of belonging and interest in subject matter, simply using
students’ TSR-positivity would have explained just as much variation in the outcome. However,
for other outcomes such as students’ participation frequency, assessing TSR with only a measure
of students’ TSR-positivity would have explained just 16% of the variation in the outcome. In

Running head: TEACHER-STUDENT RELATIONSHIPS
25
other words, in this instance, the more comprehensive measure of TSR helped explain an
additional 29% of the variability in the outcome.
Discussion
The present research builds on a robust literature that has examined multiple aspects of
TSR and multiple student outcomes of those relationships. In adding to this literature, we sought
to achieve three basic goals. First, we attempted to capture key complexities inherent in TSR
through a new, multi-faceted measurement approach. Second, we speculated that using this
measure might sharpen our understanding of TSR and their associations with different student
outcomes. Finally, given this potentially sharpened understanding of the associations between
TSR and student outcomes, we wished to assess the promise of developing interventions to
improve TSR.
A New Approach to Measuring TSR
We began our investigation of TSR by first developing a measure that mirrored the
complexity of the construct. Our rigorous development process resulted in a scale that:
1) provides an overall sense of the relationship rather than focusing only on discrete
aspects of these relationships – i.e., it assesses TSR holistically,
2) accounts for both teachers’ and students’ perspectives,
3) distinguishes positive and negative aspects of the relationship through different
subscales, and
4) includes and accounts for symmetric and asymmetric characteristics of the
relationship.

Running head: TEACHER-STUDENT RELATIONSHIPS
26
Individually, each characteristic is rare in the work on TSR; this measure is the first to combine
all four. Our subscales had respectable reliabilities for both teachers and students, despite
minimizing the number of items in each subscale. The factor structure adhered to the two
hypothesized subscales (subscales which allowed for lack of positive affect to be disentangled
from active dislike).
Much of our work to ensure the scale’s validity occurred through the systematic
development of the scale. During the process, content experts helped to ensure that each item
had high construct relevance and that we did not leave important aspects of the construct
unrepresented. We also used teachers and students to ensure items’ face validity and that the
language of each item resonated with participants. Furthermore, the second part of the study
provides preliminary indications of concurrent and convergent validity in the sense that we
replicated several common associations between TSR to student outcomes (Juvonen, 2006).
Several of the scale’s descriptive statistics are interesting in their own right. For
example, teachers perceiving their relationships with boys as being more negative than with girls
coheres with other findings such as boys’ reputations for being harder to manage in schools
(Beaman, Wheldall, & Kemp, 2006). In addition, it may seem intuitive that students’
perceptions of the relationship were by no means synonymous with teachers’ perceptions.
However, it is less obvious that positive aspects of TSR are so distinct from the negative aspects
(e.g., each subscale accounted for less than 50% of the variance in the other).
However, the most exciting aspect of the scale may be the range of research questions
that it could address in the future. Examining differences in TSR between subgroups of students
could extend beyond race or gender to include class, religious affiliation, or political outlook –
each of which could be especially important in certain schools, parts of the country, or subject
Running head: TEACHER-STUDENT RELATIONSHIPS
27
areas (e.g., political outlook might matter more in social studies than in mathematics).
Conversely, the scale could help ascertain variability in TSR between populations of teachers.
E.g., do younger teachers connect with their students better than their older colleagues? The
scale could also be used longitudinally to see how TSR develop over time – do students’
relationships with their teachers tend to follow the same downward trajectory (particularly in
middle school) that so many motivational and affective constructs of interest do (Eccles, et al.,
1993)? Do teachers’ TSR get better the longer they teach? The importance of match/mismatch
might also be examined through a measure like this one. For example, do Earnest and Eve,
whose teacher holds them in the same high regard, do equally well if Earnest likes his teacher but
Eve does not? How important is perceived similarity between teachers and students?
Researchers who study teachers might also use this measure to assess the impact of student
relationships on teachers and teacher outcomes (e.g., longevity in the profession). Across each
illustration, this measure seems like an appropriate tool to shed light on the research question of
interest.
Despite these contributions to measuring TSR at the secondary level, this measure can
(and hopefully will) be improved further. Assessing TSR holistically, from both teachers’ and
students’ perspectives while fulfilling our other criteria necessitated trade-offs. First, some items
did not achieve as much variance as we had hoped, particularly on the TSR-negativity subscales.
For example, the item asking teachers how “unfair” they were to students received little
endorsement (i.e., most teachers marked “not unfair at all”). However, this same item
demonstrated greater variability from students, represented the critical concept of fairness, and
allowed for examination of important discrepancies in perceptions (e.g., students who perceive
unfairness that their teachers do not). Second, some may feel that important facets of TSR are

Running head: TEACHER-STUDENT RELATIONSHIPS
28
omitted in our scale. For example, no item addresses teachers having high expectations for
students. However, ultimately the merit of this scale is not a question of whether we have
included an item for every facet of TSR (even the lengthiest scales inevitably omit some aspects
of the construct in question). Rather, the question is whether we have represented the construct
fairly. Because the scale does contain items about teachers’ respecting, encouraging, motivating,
and promoting the learning of students, we have most likely captured much of the same
variability that would have been captured by an item about teacher expectations. Third, although
we do have evidence of content and construct validity from the survey design process and from
the associations with the eight student outcomes we examined, validation is an ongoing process
(Messick, 1995). To the extent that more data could be collected on discriminant validity, how
the scale works at different grade levels and with different populations of students, it would help
us better identify when the scale is appropriate to use.
Prediction of Student Outcomes
In examining the associations between TSR and student outcomes, our more
comprehensive approach to assessing TSR appeared to sharpen our understanding of these
associations in several ways. To provide a sense of the benefits of this approach, we examined
the associations between TSR and student outcomes by fitting a “full” model that included all
four TSR subscales while controlling for students’ race and gender. We compared these results
to a “reduced” model that only included students’ TSR-positivity and the demographic controls.
Through this approach, we first found evidence that our full-model predicted significantly more
of the variability in our achievement, affective, behavioral, and motivational outcomes.

Running head: TEACHER-STUDENT RELATIONSHIPS
29
Specifically, we found that our model explained more variability in outcomes than the reduced
model in 24 out of 27 of our analyses.
Second, we gained knowledge about whose perspective was associated with each
outcome. In assessing students’ grades, interest, effort, and self-efficacy there was at least one
school in which students’ and teachers’ perceptions of the TSR were significant predictors of the
outcome. Without measuring both perceptions (e.g., through our reduced model), we might have
been tempted to make one of two problematic conclusions in different situations. For example,
we might have concluded that TSR were unrelated to certain outcomes – at School 4, the reduced
model indicated there was no association between TSR and students’ achievement. Alternatively
we might have assumed that the wrong party’s TSR was driving the association. At School 3,
the full-model indicates that teachers’ but not students’ perceptions of TSR are related to both
achievement outcomes. However, in our reduced model, it appears that students’ TSR-positivity
is significantly related to both outcomes. Thus, our approach provides clarity on whose
perceptions of the TSR are associated with student outcomes.
Third, although the positivity subscales were often more strongly associated with
students’ outcomes, there were several outcomes for which it was clearly important to include
the negativity subscales. For example, teachers’ TSR-negativity was a significant predictor in
five of the seven models examining students’ behavioral outcomes. Future improvements in the
reliability of the negativity subscale might find even stronger associations between TSR and
student outcomes.
A final way that our more comprehensive approach sharpens our understanding of TSR’s
association with outcomes, is that we gain information about potential causal patterns within our
correlational data. In the absence of experiments, we cannot know the causal link underlying
Running head: TEACHER-STUDENT RELATIONSHIPS
30
these associations with complete certainty. However, in some instances our approach may shed
light on the likelihood of certain causal explanations. For example, we assumed that students
might decide whether or not to participate in class, based in part on whether they like their
teacher. However, our data indicate that students’ perceptions of their TSR are not a significant
predictor of this outcome. The teachers’ perceptions of the TSR appear most closely associated
with students’ classroom participation. This finding diminishes the likelihood that students’ TSR
are a direct cause of their classroom participation. Other explanations such as, teachers shaping
their perceptions of their relationships with students based upon students’ classroom
contributions, may be more plausible.
As with the development of the scale itself, our investigation of the associations between
TSR and student outcomes had limitations. The study would have benefitted from an
examination of a broader array of student outcomes, especially some teacher outcomes.
Furthermore, it would have been particularly interesting to understand the role of the reporter of
each outcome. In other words, would we have found the same pattern of associations with
regard to the frequency of students’ class participation if students (rather than teachers) had
reported this outcome. A future study that collected the same outcomes from teachers and
students would be particularly valuable. Our examination also would have benefitted from a
longitudinal approach to test whether TSR predict student outcomes over time. In particular,
longitudinal data would allow for comparisons of students whose perceptions of their TSR
improve over the course of the year with students whose TSR perceptions decline.

Running head: TEACHER-STUDENT RELATIONSHIPS
31
The promise of TSR interventions
The present study is situated within a larger research agenda designed to ascertain the
viability of TSR as a potential focus for interventions to improve student outcomes (and possibly
develop such interventions). The goal of this research was to take preliminary steps within this
agenda by developing a more comprehensive measure of TSR and examining its associations
with an array of student outcomes. The results of the study reinforce the potential of TSR that
prior research had established. Theoretically, intervening at a fundamental, social level seems
particularly promising because the social aspects of the classroom are so fundamental to
students’ learning, affect, behavior, and motivation (Gehlbach, 2010). Other scholars focusing
on this social level, albeit within other social/motivational domains, have found dramatic results
from certain interventions (e.g., Cohen, Garcia, Purdie-Vaughns, Apfel, & Brzustoski, 2009).
Within the scholarship examining TSR at the secondary level, many have found connections
between facets of TSR and an array of student outcomes (Juvonen, 2006).
To this theoretical and empirical foundation, the present study contributes an unusually
strong set of associations between TSR and students’ achievement, affective, behavioral, and
motivational outcomes. Perhaps the power of these associations emerges most clearly in the
additional analyses at School 3 where we generated adjusted-R2 values for each model. In
predicting outcomes such as student’s participation in class, TSR accounted for almost half of
the variability. Most other models accounted for between 15% and 30% of the variability in the
outcome from the four TSR predictors. Within social science, accounting for that much variance
across such a wide array of outcomes from just one construct is noteworthy.
The explanatory power of these models certainly indicates that TSR are worth the
attention of educational and psychological researchers. Even if causal relationships only emerge
Running head: TEACHER-STUDENT RELATIONSHIPS
32
between TSR and a fraction of these outcomes and the effects are only half as strong as we might
hope for based on the adjusted-R2 values, interventions that improved TSR would still be
immensely beneficial for students. Furthermore, small interventions occurring early in the year
which set forth positive cycles of interactions between teachers and students might have potent,
long-lasting effects. Two future directions will be important to explore within this broader
research agenda. First, it seems essential that scholars begin to develop a range of different field
experiments to see whether TSR can be improved – by intervening at either the student or
teacher levels. Second, whether scholars use short-term manipulations or more protracted
interventions, following-up with students and teachers to assess the long-term effects of these
experiments will be particularly important if there is to be a real impact on student outcomes.
We feel that this broader research agenda has tremendous potential. At the theoretical
level, understanding the direction of causality between TSR and student outcomes like those in
the present study will help us understand how social, academic, affective, behavioral, and
motivational phenomena interact in the classroom. At the practical level, further development of
this research area may help to improve a wide-array of student outcomes. We hope that
measures like ours contribute to research that improves these relationships for teachers and
students.

Running head: TEACHER-STUDENT RELATIONSHIPS
33
References
Gehlbach, H. (2010). The social side of school: Why teachers need social psychology.
Educational Psychology Review, 22(3), 349-362.
Gehlbach, H., & Brinkworth, M. E. (manuscript under review). Seven steps for highly effective
survey scales.
Gehlbach, H., Brown, S. W., Ioannou, A., Boyer, M. A., Hudson, N., Niv-Solomon, A., et al.
(2008a). Increasing interest in social studies: Social perspective taking and self-efficacy
in stimulating simulations. Contemporary Educational Psychology, 33(4), 894-914.
Gehlbach, H., Brown, S. W., Ioannou, A., Boyer, M. A., Hudson, N., Niv-Solomon, A., et al.
(2008b). Increasing interest in social studies: Stimulating simulations, self-efficacy, and
social perspective taking. Contemporary Educational Psychology, 33(4), 894-914.
Beaman, R., Wheldall, K., & Kemp, C. (2006). Differential teacher attention to boys and girls in
the classroom. Educational Review, 58(3), 339-366.
Birch, S. H., & Ladd, G. W. (1996). Interpersonal relationships in the school environment and
children's early school adjustment: The role of teachers and peers. In J. Juvonen & K. R.
Wentzel (Eds.), Social motivation: Understanding children's school adjustment. (pp. 199-
225). New York, NY US: Cambridge University Press.
Birch, S. H., & Ladd, G. W. (1997). The teacher-child relationship and children's early school
adjustment. Journal of School Psychology, 35(1), 61-79.
Cacioppo, J. T., & Berntson, G. G. (1994). Relationship between attitudes and evaluative space:
A critical review, with emphasis on the separability of positive and negative substrates.
Psychological Bulletin, 115(3), 401-423.
Running head: TEACHER-STUDENT RELATIONSHIPS
34
Cohen, G. L., Garcia, J., Purdie-Vaughns, V., Apfel, N., & Brzustoski, P. (2009). Recursive
processes in self-affirmation: Intervening to close the minority achievement gap. Science,
324(5925), 400-403.
Eccles, J. S., Midgley, C., Wigfield, A., Buchanan, C. M., Reuman, D., Flanagan, C., et al.
(1993). Development during adolescence: The impact of stage-environment fit on young
adolescents' experiences in schools and in families. Special Issue: Adolescence.
American Psychologist, 48(2), 90-101.
Goodenow, C. (1993). Classroom belonging among early adolescent students: Relationships to
motivation and achievement. The Journal of Early Adolescence, 13(1), 21-43.
Hamre, B. K., & Pianta, R. C. (2001). Early teacher-child relationships and the trajectory of
children's school outcomes through eighth grade. Child Development, 72(2), 625-638.
Howes, C., & Ritchie, S. (2002). A matter of trust: Connecting teachers and learners in the early
childhood classroom. New York: Teachers College Press.
Hoynoski, B., Link, M., & Frankel, M. (2009). Measuring total participation: An alternative
metric to response rate. Paper presented at the 64th Annual Conference of the American
Association for Public Opinion Research.
Juvonen, J. (2006). Sense of belonging, social bonds, and school functioning. In P. A. Alexander
& P. H. Winne (Eds.), Handbook of educational psychology. (pp. 655-674). Mahwah, NJ,
US: Lawrence Erlbaum Associates Publishers.
Karabenick, S. A., Woolley, M. E., Friedel, J. M., Ammon, B. V., Blazevski, J., Bonney, C. R.,
et al. (2007). Cognitive processing of self-report items in educational research: Do they
think what we mean? Educational Psychologist, 42(3), 139-151.

Running head: TEACHER-STUDENT RELATIONSHIPS
35
Kline, R. B. (2005). Principles and practice of structural equation modeling (2nd ed.). New
York: Guilford Press.
Martin, A. J., & Dowson, M. (2009). Interpersonal relationships, motivation, engagement, and
achievement: Yields for theory, current issues, and educational practice. Review of
Educational Research, 79(1), 327-365.
McKenzie, J. F., Wood, M. L., Kotecki, J. E., Clark, J. K., & Brey, R. A. (1999). Establishing
content validity: Using qualitative and quantitative steps. American Journal of Health
Behavior, 23(4), 311-318.
Messick, S. (1995). Validity of psychological assessment: Validation of inferences from persons'
responses and performances as scientific inquiry into score meaning. American
Psychologist, 50(9), 741-749.
Midgley, C., Feldlaufer, H., & Eccles, J. S. (1989). Student/teacher relations and attitudes toward
mathematics before and after the transition to junior high school. Child development,
60(4), 981.
Moos, R. H., & Moos, B. S. (1978). Classroom social climate and student absences and grades.
Journal of Educational Psychology, 70(2), 263-269.
Muller, C. (2001). The role of caring in the teacher-student relationship for at-risk students.
Sociological Inquiry, 71(2), 241-255.
Murdock, T. B. (1999). The social context of risk: Status and motivational predictors of
alienation in middle school. Journal of Educational Psychology, 91(1), 62-75.
Murdock, T. B., Anderman, L. H., & Hodge, S. A. (2000). Middle-grade predictors of students'
motivation and behavior in high school. Journal of Adolescent Research, 15(3), 327-351.
Running head: TEACHER-STUDENT RELATIONSHIPS
36
Murdock, T. B., & Miller, A. (2003). Teachers as sources of middle school students'
motivational identity: Variable-centered and person-centered analytic approaches. The
Elementary School Journal, 103(4), 383-399.
Pianta, R. C. (1999). Enhancing relationships between children and teachers: American
Psychological Association.
Pianta, R. C., & Allen, J. P. (2008). Building capacity for positive youth development in
secondary school classrooms: Changing teachers' interactions with students. In M. Shinn
& H. Yoshikawa (Eds.), Toward positive youth development: Transforming schools and
community programs. (pp. 21-39). New York, NY US: Oxford University Press.
Pianta, R. C., Hamre, B., & Stuhlman, M. (2003). Relationships between teachers and children.
In W. M. Reynolds & G. E. Miller (Eds.), Handbook of psychology: Educational
psychology (Vol. 7, pp. 199-234). Hoboken, NJ: John Wiley & Sons, Inc.
Pianta, R. C., & Nimetz, S. L. (1991). Relationships between children and teachers: Associations
with classroom and home behavior. Journal of Applied Developmental Psychology,
12(3), 379-393.
Pianta, R. C., Nimetz, S. L., & Bennett, E. (1997). Mother-child relationships, teacher-child
relationships, and school outcomes in preschool and kindergarten. Early Childhood
Research Quarterly, 12(3), 263-280.
Pianta, R. C., Steinberg, M. S., & Rollins, K. B. (1995). The first two years of school: Teacher-
child relationships and deflections in children's classroom adjustment. Development and
psychopathology, 7(2), 295-312.
Running head: TEACHER-STUDENT RELATIONSHIPS
37
Reddy, R., Rhodes, J. E., & Mulhall, P. (2003). The influence of teacher support on student
adjustment in the middle school years: A latent growth curve study. Development and
Psychopathology, 15(1), 119-138.
Resnick, M. D., Bearman, P. S., Blum, R. W., Bauman, K. E., Harris, K. M., Jones, J., et al.
(1997). Protecting adolescents from harm: Findings from the national longitudinal study
on adolescent health. JAMA, 278(10), 823-832.
Roeser, R. W., & Eccles, J. S. (1998). Adolescents' perceptions of middle school: Relation to
longitudinal changes in academic and psychological adjustment. Journal of Research on
Adolescence, 8(1), 123-158.
Roeser, R. W., Midgley, C., & Urdan, T. C. (1996). Perceptions of the school psychological
environment and early adolescents' psychological and behavioral functioning in school:
The mediating role of goals and belonging. Journal of Educational Psychology, 88(3),
408-422.
Rosenberg, M. (1968). The logic of survey analysis. New York, Basic Books.
Rubio, D. M., Berg-Weger, M., Tebb, S. S., Lee, E. S., & Rauch, S. (2003). Objectifying content
validity: Conducting a content validity study in social work research. Social Work
Research, 27(2), 94-104.
Rumberger, R. W. (1995). Dropping out of middle school: A multilevel analysis of students and
schools. American Educational Research Journal, 32(3), 583-625.
Ryan, R. M., & Deci, E. L. (2000). Self-determination theory and the facilitation of intrinsic
motivation, social development, and well-being. American Psychologist, 55(1), 68-78.

Running head: TEACHER-STUDENT RELATIONSHIPS
38
Ryan, R. M., Stiller, J. D., & Lynch, J. H. (1994). Representations of relationships to teachers,
parents, and friends as predictors of academic motivation and self-esteem. The Journal of
Early Adolescence, 14(2), 226-249.
Wentzel, K. R. (1997). Student motivation in middle school: The role of perceived pedagogical
caring. Journal of Educational Psychology, 89(3), 411-419.
Wentzel, K. R. (1998). Social relationships and motivation in middle school: The role of parents,
teachers, and peers. Journal of Educational Psychology, 90(2), 202.
Wentzel, K. R. (2002). Are effective teachers like good parents? Teaching styles and student
adjustment in early adolescence. Child Development, 73(1), 287.
Running head: TEACHER-STUDENT RELATIONSHIPS
39
Table 1: Student and teacher participants for each school and for the total sample
School 1 School 2 School 3 School 4 School 5 School 6 Total School Description
Private, Christian, Urban, 6th – 12th grades
Public, Suburban, 6th – 8th grades
Private, Catholic, Urban, 9th – 12th grades
Military/ Vocational, Urban, 9th -12th grades
Public, Urban, 9th – 12th grades
Public, Urban, 9th – 12th grades
Survey mode
Paper and Pencil
Paper and Pencil
Web Paper and Pencil
Web Paper and Pencil
Student participants
(N = 144) 55% Female
19% Asian 17% Black 10% Hispanic 38% White 15% Other
(N = 119) 50% Female
1% Asian 4% Black 10% Hispanic 61% White 23% Other
(N = 198) 57% Female
2% Asian 28% Black 46% Hispanic 5% White 18% Other
(N = 137) 54% Female
0% Asian 64% Black 10% Hispanic 9% White 15% Other
(N = 174) 45% Female
2% Asian 44% Black 33% Hispanic 2% White 18% Other
(N = 150) 39% Female
3% Asian 10% Black 70% Hispanic 4% White 13% Other
(N = 922) 50% Female
4.5% Asian 28% Black 32% Hispanic 18% White 17% Other
Teacher participants
(N = 25) 56% Female
(N = 31) 67% Female
(N = 4) 50% Female
(N = 23) 65% Female
(N = 23) 65% Female
N/A: teachers did not participate
(N = 127) 56% Female 79% White
Measures included
Grade Belonging Interest Homework
Participation Quality Belonging Interest Participation Homework Effort Self-efficacy
Grade Participation Quality Belonging Interest Participation Homework Effort Self-efficacy
Grade Participation Quality Belonging Interest Participation Homework Effort Self-efficacy
Note: The number of total teachers does not equal the sum of the teachers at each individual school because the total includes a few teachers who completed a survey about a student, but for whom the corresponding student did not complete a survey about that teacher.
Running head: TEACHER-STUDENT RELATIONSHIPS
40
Table 2a: Descriptive statistics and correlations for items in the Teacher-student relationship scale – positivity subscale
Students Teachers
m sd 1 2 3 4 5 6 7 8 9 sd m P1 3.70 1.09 -- .58 .31 .57 .63 .56 .52 .63 .52 .88 4.02 P2 4.10 .92 .59 -- .37 .62 .57 .54 .76 .63 .54 .95 3.71 P3 3.28 1.20 .49 .53 -- .31 .33 .27 .41 .45 .38 .72 3.65 P4 4.26 .88 .51 .60 .44 -- .69 .53 .60 .63 .48 .93 4.01 P5 3.15 1.41 .72 .52 .47 .49 -- .56 .65 .72 .56 1.22 3.71 P6 3.26 1.13 .64 .42 .41 .46 .61 -- .58 .46 .65 .89 3.20 P7 3.59 1.07 .50 .58 .56 .57 .53 .48 -- .69 .58 1.06 3.28 P8 3.62 1.16 .68 .59 .48 .54 .67 .56 .57 -- .47 .89 3.85 P9 3.99 1.02 .66 .43 .43 .47 .57 .56 .47 .54 -- .70 3.73
Table 2b: Descriptive statistics and correlations for items in the Teacher-student relationship scale – negativity subscale
Students Teachers
m sd N1 N2 N3 N4 N5 sd m N1 2.07 1.01 -- .66 .48 .17 .45 1.06 2.05 N2 2.34 1.16 .46 -- .25 .20 .37 1.08 2.21 N3 1.40 .84 .29 .22 -- .30 .62 .63 1.32 N4 1.60 .98 .30 .26 .45 -- .38 .39 1.17 N5 1.62 .99 .37 .32 .45 .55 -- .62 1.37
Notes: Student scores are on the left and below the diagonal; teacher scores are on the right and above the diagonal
Running head: TEACHER-STUDENT RELATIONSHIPS
41
Table 3: Predicting student achievement outcomes: Estimates and (SE)
School
1 2 3 4
S_TSR+
N/A
S_TSR- -7.55 (1.94)***
T_TSR+ 4.66 (1.71)**
4.55 (1.24)*** 4.34 (1.52)**
T_TSR-
-3.62 (1.72)*
Grades S_Male
-4.43 (1.12)***
S_White
-2LL (full) -1048.57
-1321.99 -953.08
-2LL (reduced) -1085.73
-1347.26 -978.63
−2LL diff. 37.15***
25.27*** 25.55***
S_TSR+ N/A
S_TSR-
T_TSR+
.60 (.17)** .68 (.10)*** .41 (.12)**
T_TSR-
Contribution quality S_Male
S_White
.46 (.20)*
-2LL (full)
-228.37 -362.59 -282.85
-2LL (reduced)
-250.88 -417.59 -300.10
−2LL diff.
22.51*** 55.00*** 17.25***
Notes: 1) * p < .05; ** p < .01; ***p < .001 2) S_TSR+ is students’ TSR-positivity; S_TSR- is students’ TSR-negativity; T_TSR+ is teachers’ TSR-positivity; T_TSR- is
teachers’ TSR-negativity; S_Sex is students’ sex (1= male, 0 = female); S_White is students’ race (1= White; 0 = non-White) 3) All -2LL differences represent the difference between a 6-predictor, “full” model that uses all 4 TSR subscales and a 3 predictor,
“reduced” model that uses only students’ perceptions of TSR-positivity. They are evaluated on a χ2 distribution with 3 df.

Running head: TEACHER-STUDENT RELATIONSHIPS
42
Table 4: Predicting student affective outcomes: Estimates and (SE)
School
1 2 3 4
S_TSR+ .26 (.11) * .24 (.10)* .27 (.12)*
S_TSR-
-.33 (.13)*
T_TSR+
T_TSR- Sense of
belonging S_Male -.34 (.13)** -.38 (.14)**
S_White
-2LL (full) -312.94 -217.57 -533.31 -340.16
-2LL (reduced) -322.88 -233.19 -535.75 -347.83
−2LL diff. 9.94* 15.61*** 2.43 7.67
S_TSR+ .43 (.16)** .52 (.10)*** .37 (.12)** .52 (.10)***
S_TSR- -.57 (.19)**
T_TSR+
.42 (.14)**
T_TSR-
.31 (.15)*
Interest S_Male -.37 (.17)* .49 (.14)**
S_White
.77 (.30)**
-2LL (full) -397.24 -204.65 -513.53 -335.61
-2LL (reduced) -417.47 -234.38 -517.60 -343.84
−2LL diff. 20.23*** 29.74*** 4.08 8.24*
Notes: 1) * p < .05; ** p < .01; ***p < .001 2) S_TSR+ is students’ TSR-positivity; S_TSR- is students’ TSR-negativity; T_TSR+ is teachers’ TSR-positivity; T_TSR- is teachers’ TSR-negativity; S_Sex is students’ sex (1= male, 0 = female); S_White is students’ race (1= White; 0 = non-White)
Running head: TEACHER-STUDENT RELATIONSHIPS
43
3) All -2LL differences represent the difference between a 6-predictor, “full” model that uses all 4 TSR subscales and a 3 predictor, “reduced” model that uses only students’ perceptions of TSR-positivity. They are evaluated on a χ2 distribution with 3 df.

Running head: TEACHER-STUDENT RELATIONSHIPS
44
Table 5: Predicting student behavioral outcomes: Estimates and (SE)
School
1 2 3 4
S_TSR+ N/A
S_TSR-
T_TSR+
1.36 (.19)*** 1.51 (.15)*** .86 (.15)***
T_TSR-
.52 (.21)* .63 (.15)***
Participation frequency S_Male
S_White
-2LL (full)
-252.91 -503.24 -333.44
-2LL (reduced)
-291.59 -592.28 -364.29
−2LL diff.
38.68*** 89.04*** 30.85***
S_TSR+
S_TSR-
T_TSR+ 4.16 (1.76)* 16.39 (3.30)*** 4.83 (1.62)** 13.95 (4.64)**
T_TSR- -3.87 (1.93)* -13.66 (3.78)** -3.85 (1.58)*
Homework submission S_Male
-7.16 (1.47)*** -13.63 (4.16)**
S_White
1.98*
-2LL (full) -1042.08 -604.83 -1426.83 -1241.39
-2LL (reduced) -1067.67 -648.94 -1459.28 -1250.85
−2LL diff. 25.59*** 44.11*** 32.45*** 9.47*
Notes: 1) * p < .05; ** p < .01; ***p < .001 2) S_TSR+ is students’ TSR-positivity; S_TSR- is students’ TSR-negativity; T_TSR+ is teachers’ TSR-positivity; T_TSR- is teachers’ TSR-
negativity; S_Sex is students’ sex (1= male, 0 = female); S_White is students’ race (1= White; 0 = non-White)
Running head: TEACHER-STUDENT RELATIONSHIPS
45
3) All -2LL differences represent the difference between a 6-predictor, “full” model that uses all 4 TSR subscales and a 3 predictor, “reduced” model that uses only students’ perceptions of TSR-positivity. They are evaluated on a χ2 distribution with 3 df.

Running head: TEACHER-STUDENT RELATIONSHIPS
46
Table 6: Predicting student motivational outcomes: Estimates and (SE)
School
1 2 3 4
S_TSR+ N/A .28 (.09)** .30 (.07)*** .31 (.08)***
S_TSR-
-.28 (.12)*
T_TSR+
.36 (.13)** .28 (.09)** .37 (.11)***
T_TSR-
Effort S_Male
S_White
-.52 (.20)*
-2LL (full)
-184.62 -314.41 -267.06
-2LL (reduced)
-217.61 -323.08 -280.07
−2LL diff.
32.99*** 8.67* 13.02***
S_TSR+ N/A .35 (.10)** .31 (.08)*** .32 (.09)***
S_TSR-
-.26 (.13)*
T_TSR+
.25 (.11)* .29 (.13)*
T_TSR-
Self-efficacy S_Male
S_White
-2LL (full)
-204.87 -368.28 -313.39
-2LL (reduced)
-223.06 -373.66 -321.55
−2LL diff.
18.18*** 5.38 8.16*
Notes: 1) * p < .05; ** p < .01; ***p < .001 2) S_TSR+ is students’ TSR-positivity; S_TSR- is students’ TSR-negativity; T_TSR+ is teachers’ TSR-positivity; T_TSR- is teachers’ TSR-
negativity; S_Sex is students’ sex (1= male, 0 = female); S_White is students’ race (1= White; 0 = non-White)

Running head: TEACHER-STUDENT RELATIONSHIPS
47
3) All -2LL differences represent the difference between a 6-predictor, “full” model that uses all 4 TSR subscales and a 3 predictor, “reduced” model that uses only students’ perceptions of TSR-positivity. They are evaluated on a χ2 distribution with 3 df.
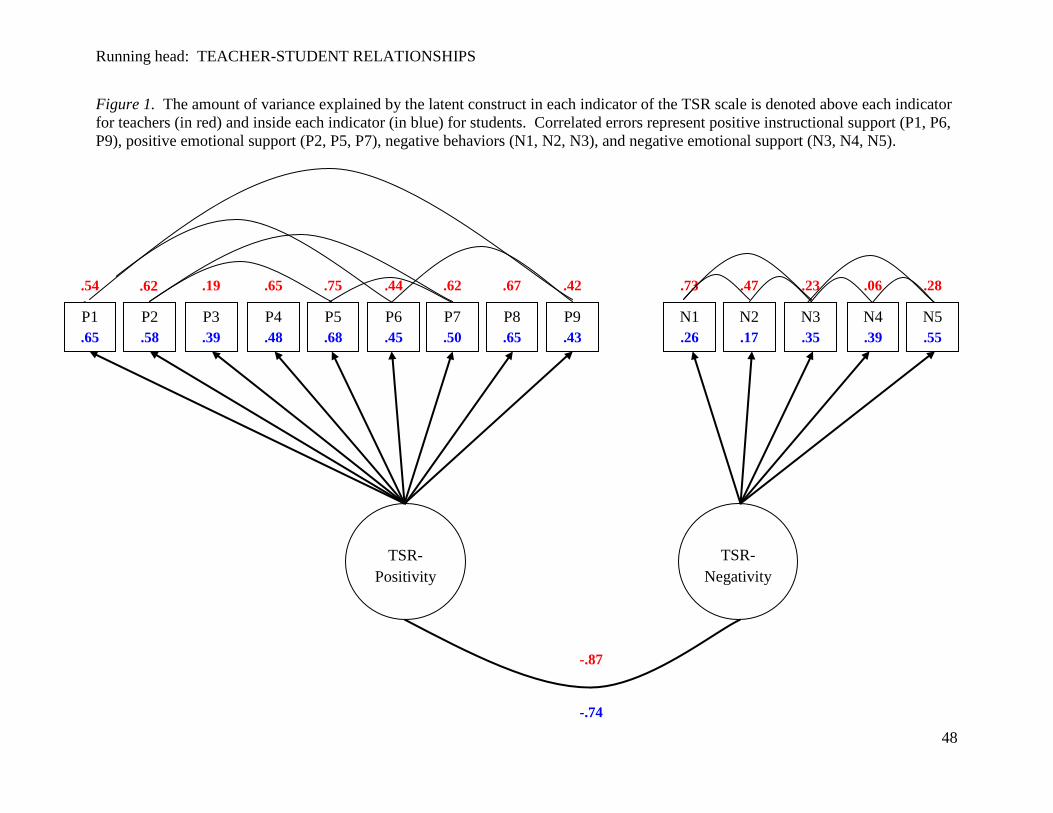
Running head: TEACHER-STUDENT RELATIONSHIPS
48
Figure 1. The amount of variance explained by the latent construct in each indicator of the TSR scale is denoted above each indicator for teachers (in red) and inside each indicator (in blue) for students. Correlated errors represent positive instructional support (P1, P6, P9), positive emotional support (P2, P5, P7), negative behaviors (N1, N2, N3), and negative emotional support (N3, N4, N5).
TSR-
Positivity
TSR-
Negativity
P1 .65
P7 .50
P8 .65
P9 .43
P6 .45
P5 .68
P4 .48
P3 .39
P2 .58
N1 .26
N5 .55
N4 .39
N3 .35
N2 .17
.54 .62 .19 .65 .75 .44 .62 .67 .42 .73 .47 .23 .06 .28
-.87
-.74
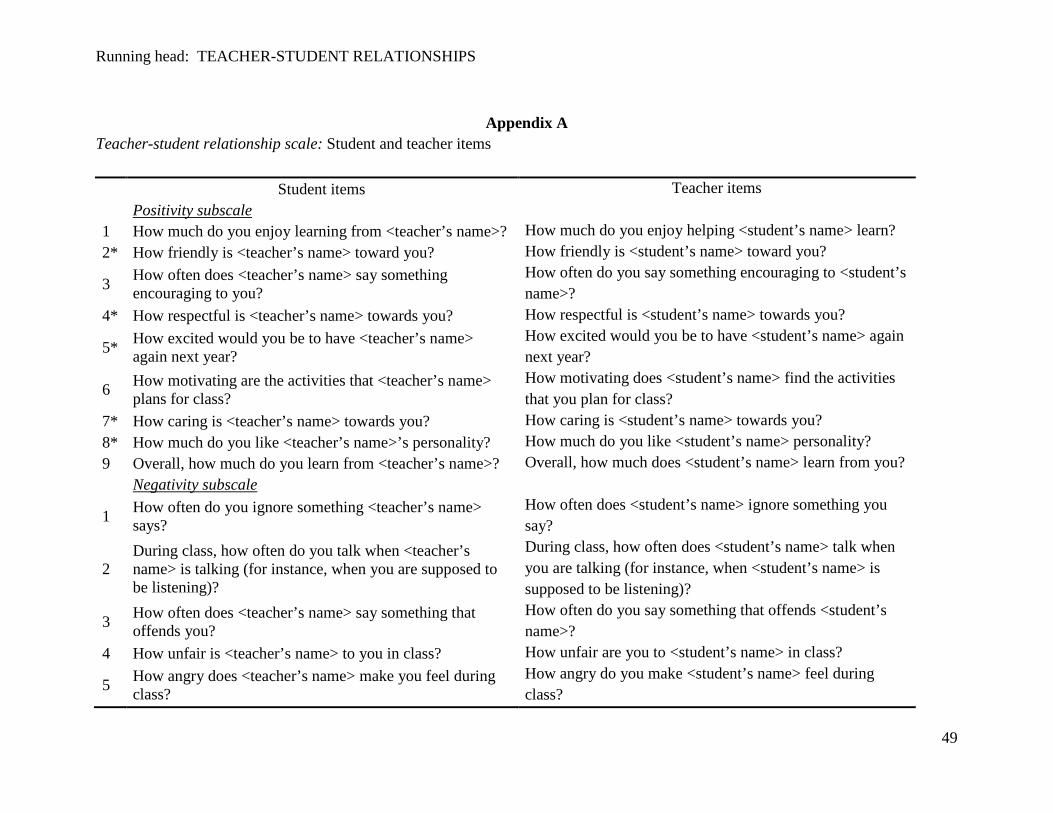
Running head: TEACHER-STUDENT RELATIONSHIPS
49
Appendix A
Teacher-student relationship scale: Student and teacher items Student items Teacher items Positivity subscale 1 How much do you enjoy learning from <teacher’s name>? How much do you enjoy helping <student’s name> learn? 2* How friendly is <teacher’s name> toward you? How friendly is <student’s name> toward you?
3 How often does <teacher’s name> say something encouraging to you?
How often do you say something encouraging to <student’s name>?
4* How respectful is <teacher’s name> towards you? How respectful is <student’s name> towards you?
5* How excited would you be to have <teacher’s name> again next year?
How excited would you be to have <student’s name> again next year?
6 How motivating are the activities that <teacher’s name> plans for class?
How motivating does <student’s name> find the activities that you plan for class?
7* How caring is <teacher’s name> towards you? How caring is <student’s name> towards you? 8* How much do you like <teacher’s name>’s personality? How much do you like <student’s name> personality? 9 Overall, how much do you learn from <teacher’s name>? Overall, how much does <student’s name> learn from you? Negativity subscale
1 How often do you ignore something <teacher’s name> says?
How often does <student’s name> ignore something you say?
2 During class, how often do you talk when <teacher’s name> is talking (for instance, when you are supposed to be listening)?
During class, how often does <student’s name> talk when you are talking (for instance, when <student’s name> is supposed to be listening)?
3 How often does <teacher’s name> say something that offends you?
How often do you say something that offends <student’s name>?
4 How unfair is <teacher’s name> to you in class? How unfair are you to <student’s name> in class?
5 How angry does <teacher’s name> make you feel during class?
How angry do you make <student’s name> feel during class?

Running head: TEACHER-STUDENT RELATIONSHIPS
50
Notes: Response anchors were arrayed along five points. For example: Not at all/Slightly/Somewhat/Quite a bit/A tremendous amount; Not at all friendly/Slightly friendly/Somewhat friendly/Quite friendly/Extremely friendly; Almost never/Once in a while/Sometimes/Frequently/Almost all the time; or Almost nothing/A little bit/Some/Quite a bit/A great deal. * denotes the symmetric items

Running head: TEACHER-STUDENT RELATIONSHIPS
51
Appendix B: Student Outcome Measures
Academic Achievement 1) Student grades: Collected at Schools 1, 3, and 4 a. School 1 – student self report b. School 3 – teacher reported c. School 4 – teacher reported 2) Teacher ratings of the quality of students’ class participation: Collected at Schools 2, 3, and 4 When Student X participates in class, how would you rate the quality of his/her contributions? Response anchor:
Far below average
Below average
Average
Above average
Far above average
Affect 3) Sense of belonging: Collected at all 4 schools I feel like I belong in this school. I feel like I am successful in this school. I feel like I matter in this school. I do not feel like I am important in this school. (reversed) Response anchor:
Not at all true of me
Slightly true of me
Somewhat true of me
Quite true of me
Extremely true of me
Note: Scale taken from Roeser, Midgley, and Urdan (1996). 4) Interest in subject matter: Collected at all 4 schools (using different approaches) School 1: How interesting is the subject this teacher teaches? Response anchor:
Not at all interesting
Slightly interesting
Somewhat interesting
Quite interesting
Extremely interesting
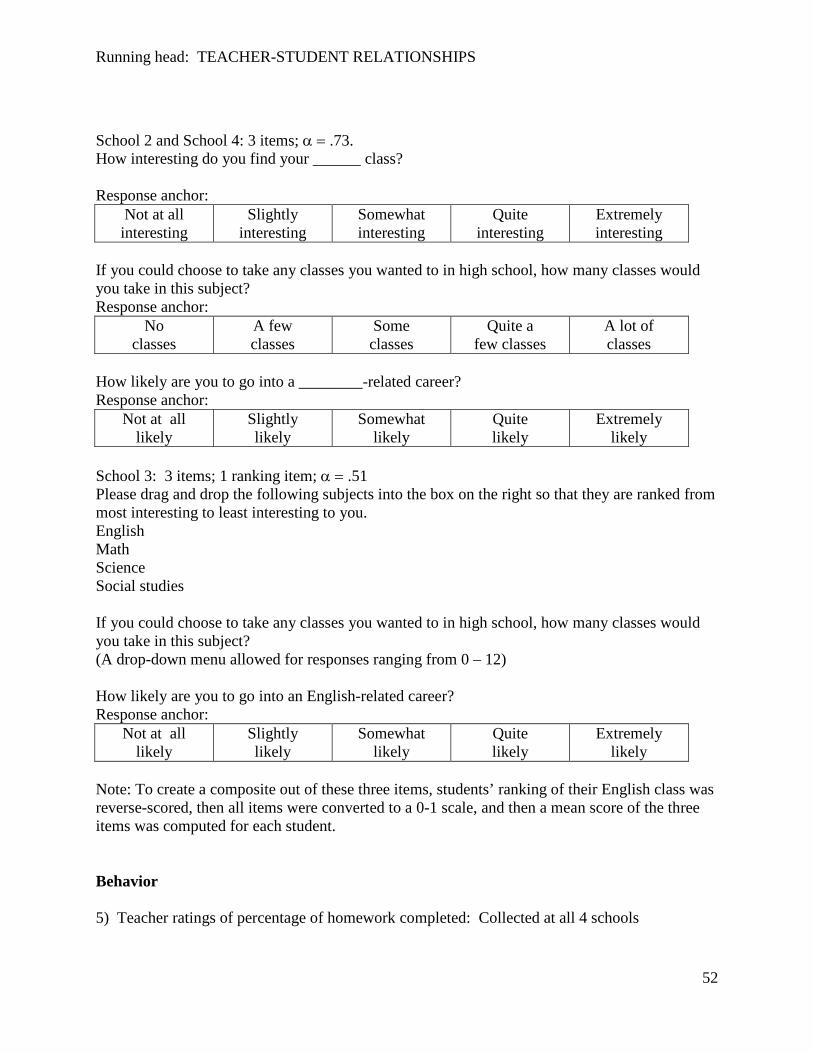
Running head: TEACHER-STUDENT RELATIONSHIPS
52
School 2 and School 4: 3 items; α = .73. How interesting do you find your ______ class? Response anchor:
Not at all interesting
Slightly interesting
Somewhat interesting
Quite interesting
Extremely interesting
If you could choose to take any classes you wanted to in high school, how many classes would you take in this subject? Response anchor:
No classes
A few classes
Some classes
Quite a few classes
A lot of classes
How likely are you to go into a ________-related career? Response anchor:
Not at all likely
Slightly likely
Somewhat likely
Quite likely
Extremely likely
School 3: 3 items; 1 ranking item; α = .51 Please drag and drop the following subjects into the box on the right so that they are ranked from most interesting to least interesting to you. English Math Science Social studies If you could choose to take any classes you wanted to in high school, how many classes would you take in this subject? (A drop-down menu allowed for responses ranging from 0 – 12) How likely are you to go into an English-related career? Response anchor:
Not at all likely
Slightly likely
Somewhat likely
Quite likely
Extremely likely
Note: To create a composite out of these three items, students’ ranking of their English class was reverse-scored, then all items were converted to a 0-1 scale, and then a mean score of the three items was computed for each student. Behavior 5) Teacher ratings of percentage of homework completed: Collected at all 4 schools

Running head: TEACHER-STUDENT RELATIONSHIPS
53
Approximately what percentage of the assigned homework does Student X complete fully? _____ 6) Teacher ratings of frequency of class participation: Collected at Schools 2, 3, 4 How frequently does Student X participate in class? Response anchor:
Almost never
Once in a while
Sometimes
Frequently
Almost all the time
Motivation 7) Students’ self report of their effort: Collected at Schools 2, 3, 4 How much effort do you put forth for this class? When Teacher X is speaking, how much effort do you put into trying to pay attention? How much effort do you put into getting involved in class discussions? How much effort do you put into your homework for this class? How much effort do you put into in-class activities? Response anchor:
Almost no effort
A little bit of effort
Some effort
Quite a bit of effort
A great deal of effort
8) Students’ self report of their self-efficacy: Collected at Schools 2, 3, 4 How confident are you that you can do the hardest work that is assigned in this class? How confident are you that you can learn all the material presented in this class? When complicated ideas are presented in this class, how confident are you that you can understand them? How confident are you that you will remember what you learned in this class next year? How confident are you that you can complete all the work that is assigned in this class? Response anchor:
Not at all confident
Slightly confident
Somewhat confident
Quite confident
Extremely confident
Note: Scale adapted from (Gehlbach et al., 2008b).