Embed Size (px)
Citation preview
SOCIAL MEDIA TOOLS INFLUENCING CUSTOMER PURCHASING BEHAVIOUR
IN THE RETAIL ENVIRONMENT
By
Reynardt Scholtz
Submitted in fulfilment of the requirements for the degree of
MASTER OF COMMERCE
To be awarded at the Nelson Mandela Metropolitan University
April 2014
Supervisor: Dr. C. Rootman

DEDICATION
This dissertation is dedicated to my parents, Kenneth and Christelle Scholtz. I hope I
have made you proud.

ACKNOWLEDGEMENTS AND DECLARATION
I would like to thank the following people and institutions for their contributions
towards this study.
My supervisor, Doctor Chantal Rootman, for her patience, guidance and
motivation. Without whom, I could not have completed this study.
Doctor Jacques Pietersen for conducting the statistics in this study.
The National Research Foundation for funding this study.
Doctor Judy Dyer, for her assistance with the language editing and
proofreading of this dissertation.
All of the retail customers who participated in this study. Their contribution is
greatly appreciated.
Lastly and most importantly, My Redeemer, for providing me with the
opportunity, skills and abilities to complete this dissertation.

ii
I, Reynardt Scholtz, 209095039, hereby certify that the dissertation, Social media
tools influencing customer purchasing behaviour in the retail environment for the
degree of Master of Commerce, is my own work, and that it has not previously been
submitted for assessment or completion of any postgraduate qualification to another
university or for another qualification.
REYNARDT SCHOLTZ
PORT ELIZABETH
April 2014

iii
ABSTRACT
Given the importance of a business being able to create a positive brand image in
the minds of customers and influencing customer purchasing behaviour, there is a
lack of attention given to the research of the role that social media tools can play in
the success of retailers. Numerous research studies have focussed on determining
the advantages of and impact that social media tools can have on the success of
businesses, however, the impact of social media tools on the creation of a positive
brand image, and influencing customer purchasing behaviour is less evident. Thus,
the primary objective of this study is to investigate the influence of social media tools
on the brand image of retailers and how it affects customer purchasing behaviour.
A full literature review was conducted on the retail environment and its importance,
as well as on social media as a marketing communication tool. Thereafter,
independent variables (Official websites, Facebook and Twitter) were identified as
possibly influencing the intervening variable (Brand image) and dependent variable
(Customer purchasing behaviour).
Three independent variables were selected and used to construct a hypothetical
model and research hypothesis. The purpose of these independent variables was to
determine whether the use of social media tools could lead to a positive brand image
and ultimately improve customer purchasing behaviour.
An empirical investigation was undertaken to be able to establish the influence of
social media tools on the brand image and customer purchasing behaviour of retail
customers. The measuring instrument used for this study, a questionnaire, was
constructed from secondary literature sources. The convenience sampling technique
was used to identify respondents. The usable questionnaires that were gathered from
respondents were examined through statistical analyses. Exploratory factor analysis
(EFA) and the calculation of Cronbach’s alpha coefficients were used to confirm the
validity and reliability of the measuring instrument.
Descriptive statistics, as part of the data analyses, were calculated to summarise and
allow interpretation of the sample data. Furthermore, Pearson’s Product Moment
Correlations were calculated to determine correlations among variables used in this

iv
study. Multiple regression analysis was the primary statistical procedure used for
testing the significance of relationships hypothesised between the independent,
intervening and dependent variables of this study. The empirical investigation was
concluded by a the calculation of a t-test and Analysis of Variance (ANOVA), for the
purpose of determining the influence of selected demographic variables on
respondents’ perceptions with regard to the independent, intervening and dependent
variables. In addition, post-hoc Tukey tests were conducted to determine significant
differences among individual mean scores, and the degree of practical significance
was determined by calculated Cohen’s d values.
Based on the results of the empirical investigation, significant relationships were
found among the independent variables (Official websites, Facebook and Twitter),
the intervening variable (Brand image) and the dependent variable (Customer
purchasing behaviour). The empirical investigation revealed that the age of
respondents has a significant impact on how their image of a brand and purchasing
behaviour are influenced by retailers’ use of social media tools.
This study has made a contribution to the shortage of literature on the impact of
social media tools on retailers. The hypothetical model developed for this study
assisted in understanding the impact that retailers’ use of social media tools have on
the brand image of retailers and customers’ purchasing behaviour. As a result, this
study provides recommendations and suggestions for retailers to ensure a positive
brand image in the minds of customers, and to ultimately use social media tools to
positively influence the purchasing behaviour of customers.
KEYWORDS:
Social media, Brand image, Customer purchasing behaviour, retailers.

v
TABLE OF CONTENTS
PAGE
ACKNOWLEDGEMENTS AND DECLARATION i
ABSTRACT iii
TABLE OF CONTENTS v
LIST OF FIGURES x
LIST OF TABLES xi
CHAPTER 1 INTRODUCTION TO THE STUDY
1.1 INTRODUCTION AND BACKGROUND TO THE STUDY 1
1.2 BRIEF LITERATURE OVERVIEW 4
1.2.1 The retail environment and its importance 4
1.2.2 Social media as a marketing communication tool 8
1.2.2.1Official websites 9
1.2.2.2Facebook 10
1.2.2.3Twitter 10
1.2.2.4Brand image and Customer purchasing behaviour 11
1.3 PROBLEM STATEMENT 14
1.4 PURPOSE OF THE STUDY, RESEARCH QUESTIONS AND RESEARCH
OBJECTIVES 15
1.4.1 Research questions 15
1.4.2 Primary research objective 16
1.4.3 Secondary research objectives 16
1.5 RESEARCH HYPOTHESES 17
1.6 RESEARCH DESIGN AND METHODOLOGY 18
1.6.1 Secondary study 18
1.6.2 Primary study 19
1.6.2.1Research paradigm 19
1.6.2.2Sampling and data collection 20
1.6.2.3Data analysis 21
1.7 SCOPE AND DEMARCATION OF THE STUDY 23
1.8 SIGNIFICANCE OF THE STUDY 24

vi
TABLE OF CONTENTS (CONTINUED)
PAGE
1.9 STRUCTURE OF THE RESEARCH 25
CHAPTER 2 THE RETAIL ENVIRONMENT AND ITS IMPORTANCE
2.1 INTRODUCTION 27
2.2 DEFINITION OF A RETAILER 27
2.3 IMPORTANCE OF RETAILERS
2.4 DIFFERENT TYPES OF RETAILERS 28
2.5 RECENT DEVELOPMENTS IN THE SOUTH AFRICAN RETAIL
ENVIRONMENT 37
2.6 SOUTH AFRICAN RETAILERS 44
2.6.1 Pick n Pay Holdings Limited 44
2.6.2 Woolworths Holdings Limited 46
2.6.3 The Spar Group Limited 47
2.6.4 Shoprite Holdings Limited 48
2.7 BRAND IMAGE IN PERSPECTIVE 48
2.8 CUSTOMER PURCHASING BEHAVIOUR 53
2.8.1 Five-stage model of Customer purchasing behaviour 54
2.8.2 E-retailing 58
2.9 SUMMARY 62
CHAPTER 3 SOCIAL MEDIA AS A MARKETING COMMUNICATIONS TOOL
3.1 INTRODUCTION 64
3.2 DEFINING MARKETING 64
3.3 TYPES OF ADVERTISING TOOLS 70
3.3.1 Newspaper advertising 71
3.3.2 Magazine advertising 71
3.3.3 Broadcast advertising 72
3.3.4 Outdoor advertising 74
3.3.5 Direct mail advertising 74
3.3.6 Internet advertising 75

vii
TABLE OF CONTENTS (CONTINUED)
PAGE
3.4 DEFINING SOCIAL MEDIA 76
3.4.1 Advantages of social media 78
3.4.2 Social media tools 85
(a) Official websites 85
(b) Facebook 90
(c) Twitter 97
3.5 SUMMARY 101
CHAPTER 4 RESEARCH METHODOLOGY AND DESIGN
4.1 INTRODUCTION 102
4.2 RESEARCH PARADIGM AND METHOD 103
4.3 HYPOTHETICAL MODEL 107
4.4 DATA COLLECTION 110
4.4.1 Population and sample 110
4.4.2 Measuring instrument 112
4.4.3 Ethical considerations 114
4.4.4 Administration of questionnaires 114
4.4.5 Sample size and response rate 114
4.4.6 Missing data 115
4.5 DATA ANALYSIS 116
4.5.1 Validity of the measuring instrument 116
4.5.2 Reliability of the measuring instrument 120
4.5.3 Descriptive statistics 121
4.5.4 An analysis of the relationships of the independent, intervening and
dependent variables 122
4.5.5 An analysis of the effect of the demographic variables 124
4.6 SUMMARY 124

viii
TABLE OF CONTENTS (CONTINUED)
PAGE
CHAPTER 5 EMPIRICAL RESULTS
5.1 INTRODUCTION 126
5.2 DESCRIPTIVE STATISTICS ON DEMOGRAPHIC INFORMATION 126
5.3 RESULTS OF THE VALIDITY AND RELIABILTIY ANALYSIS FOR
THE INDEPENDENT VARIABLES 131
5.3.1 Independent variables 132
(a) Official websites 133
(b) Facebook 134
(c) Twitter 136
5.4 RESULTS OF THE VALIDITY AND RELIABILITY ANALYSIS FOR
THE INTERVENING VARIABLE AND DEPENDENT VARIABLE 138
5.4.1 Intervening variable 139
(a) Brand image 139
5.4.2 Dependent variable 142
(a) Customer purchasing behaviour 142
5.5 EMPIRICAL RESULTS ON THE VARIABLE RELATIONSHIPS 144
5.5.1 Descriptive statistics on variables 144
5.5.2 Pearson’s Product Moment Correlations 146
5.5.3 Results of the multiple regression analysis 148
5.6 RESULTS OF THE DEMOGRAPHIC DATA T-TEST AND ANOVA 150
5.6.1 Results of the t-test 151
5.6.2 Results of the Analysis of Variance 152
(a) Demographic variable – age 153
5.7 SUMMARY 156

ix
TABLE OF CONTENTS (CONTINUED)
PAGE
CHAPTER 6 SUMMARY, CONCLUSIONS AND RECOMMENDTIONS
6.1 INTRODUCTION 158
6.2 OVERVIEW OF THE RESEARCH 158
6.3 MAIN EMPIRICAL FINDINGS WITH RECOMMENDATIONS 165
6.3.1 Official websites 165
6.3.2 Facebook 166
6.3.3 Twitter 168
6.3.4 Brand image 169
6.3.5 Demographic variables 170
6.4 CONTRIBUTIONS OF THE STUDY 172
6.5 LIMITATIONS OF THE STUDY AND RECOMMENDATIONS FOR
FUTURE RESEARCH 173
6.6 CONCLUDING REMARKS 174
REFERENCES 176
ANNEXURE A: QUESTIONNAIRE 231
ANNEXURE B: ETHICS FORM 238

x
LIST OF FIGURES
PAGE
Figure 1.1: Hypothetical model for study 17
Figure 2.1: Five-stage model of customer purchasing behaviour 54
Figure 4.1: Hypothetical model for the study 107
Figure 6.1: Summary of relationships from the multiple regression
analyses 163

xi
LIST OF TABLES
PAGE
Table 4.1: The independent, intervening and dependent
variables used to investigate the influence of social
media tools and brand image on purchasing behaviour 109
Table 4.2: Response rate of questionnaires 115
Table 4.3: Guideline for determining factor loading significance 119
Table 5.1: Demographic information pertaining to the
respondents as individuals 127
Table 5.2: Demographic information pertaining to the number
of years respondents have been using the Internet 128
Table 5.3: Social media tools used by respondents (N=177) 128
Table 5.4: Information relating to the social media tools of
Pick n Pay used by respondents (N=180) 129
Table 5.5: Information relating to the social media tools of Woolworths
used by respondents (N=180) 129
Table 5.6: Information relating to the social media tools of Spar
used by respondents (N=180) 129
Table 5.7: Information relating to the social media tools of Shoprite
used by respondents (N=180) 130
Table 5.8: Information pertaining to the retailer from which
respondents purchase most 130
Table 5.9: Factor structure – independent variables 132
Table 5.10: Validity and reliability of Official websites (OFFWEB) 133
Table 5.11: Validity and reliability of Facebook (FACE) 135
Table 5.12: Validity and reliability of Twitter (TWIT) 137
Table 5.13: Factor structure – intervening variable 138
Table 5.14: Factor structure – dependent variable 139
Table 5.15: Validity and reliability of Brand image 140
Table 5.16: Validity and reliability of Customer purchasing
behaviour (CPB) 143
Table 5.17: Descriptive statistics on variables (N=180) 145
Table 5.18: Pearson’s correlations coefficients 147

xii
LIST OF TABLES
PAGE
Table 5.19: Influence of the independent variables on Brand image 148
Table 5.20: Influence of the intervening variable on Customer
purchasing behaviour 149
Table 5.21: Influence of the independent variables on Customer
purchasing behaviour 149
Table 5.22: The influence of gender on the perceptions
regarding the independent, intervening and dependent
variables 152
Table 5.23: The ANOVA results for the age demographic variable 153

CHAPTER 1 INTRODUCTION TO THE STUDY
1.1 INTRODUCTION AND BACKGROUND TO THE STUDY
According to Jue, Marr and Kassotakis (2009:2), the main objective of any business
is to achieve its goals and objectives, and to build a positive brand image. Brand
image is a term that refers to the overall impression that a business communicates to
its customers and shareholders through its business activities. The image of a
retailer’s brand is made up of the public’s opinions and attitudes towards its
products/services (Glynn & Woodside 2009:214).
A positive brand image creates the opportunity for a business to ensure brand loyalty
(Oh & Pizam 2008:96). Brand loyalty can be defined as a process in which a
customer purchases the same business’s products/services on a regular basis, and
excludes competitors’ products/services (O’Guinn, Allen & Semenik 2009:24). For a
business to achieve brand loyalty, it should establish a customer base. It is important
for a business to manage and ensure satisfaction of its customer base, in order to
ensure high sales levels and to attract potential customers into purchasing the
business’s products/services. (Singla 2010:15). Furthermore, Anandan (2009:159)
states that brand loyalty is achieved when customers do not switch to different
brands as a result of extra product attributes or benefits, and when customers are
less price-sensitive to a specific business’s products/services. Brand-loyal customers
tend to pay more for a specific preferred brand, as customers perceive that specific
brand to provide a unique form of value, which no other brand is able to provide
(Chaudhuri & Holbrook 2001:81; Shugan 2005:185). According to Singla (2010:15),
the satisfaction of a business’s customer base is directly linked to high profit making
as satisfied customers are generally more likely to purchase a business’s
products/services and to become brand loyal. Thus, brand loyalty has the potential to
influence customer purchasing behaviour.
However, operating in the business environment has become increasingly difficult
(Jue et al. 2009:2), and achieving set goals and objectives has become more of a
challenge. Businesses are also constantly struggling to create a positive brand

2
image in the minds of customers. Businesses’ marketing strategies are regularly
challenged due to the pressures of the external business environment, and the ever
changing industry structure. Increased levels of competition among retailers and
constant changes in the business environment have led to retailers having to
continuously find new and innovative ways of ensuring good quality customer service
and high sales levels. (Jue et al. 2009:2). Businesses and retailers find it hard to
keep up with the fast pace at which change occurs in the business environment, and
therefore struggle to survive and remain successful and competitive (Jue et al.
2009:2; Kennerley & Neely 2003:213). Adewunmi (2012), states that these changes
in the industry are due to macro-economic factors, including the constant growth in
South Africa’s population, the growth of the economy and expansion. Changes in
technology, climate changes and natural disasters can also contribute to the
marketing challenges that businesses face. When these crises arise, a business is
required to change its shape, to adapt, or to struggle through these phases (Gretzel,
Fesenmaier, Formica & O’Leary 2006:116; Kennerley & Neely 2003:213).
The difficulty of operating efficiently in the retail environment is a result of the fast
rate at which change occurs in the business environment. For any business to
survive in this fast changing and complex environment, operating swiftly and with
excellence is the only answer. (Jue et al. 2009:2). One way in which this can be
achieved, is for a business to effectively make use of the Internet and social media
(Asur & Huberman 2010:1).
Social media can be defined as an online platform which provides users with the
opportunity to upload content and to share information (Asur & Huberman 2010:1).
Social media provides an environment that allows users to find entertainment and to
interact with like-minded communities (Agichtein, Castillo, Donato, Gionis & Mishne
2008:184). In other words, social media is a medium which allows users to
communicate and to socialise with friends, family and businesses in an online
environment. To date, Facebook has more than 250 million users, and Twitter almost
300 million users (R.O.I Media 2013). Obee (2012:8) states that social media is also
referred to as social networking or Web 2.0.

3
According to Rangaswamy and van Bruggen (2005:5), customers are becoming
familiar with the use of social media to interact and communicate with businesses.
Since the introduction of the Internet and social media, the business world has
changed dramatically. Businesses and economists claim that the introduction of the
Internet has created a new economic age and has changed the business world. This
can be seen as a major contributor to changing customer behaviour. (Simon
2010:19).
According to Meyerson (2010:86), social media and online communities are used by
both individuals and businesses to allow face-to-face interaction with friends and
customers respectively. A business that has not engaged or made use of social
media to date is losing a significant number of possible customers. Zarrella (2010:1),
states that social media is the answer to modern day businesses’ marketing
shortcomings (Simon 2010:19). The modern world is fast paced and does not allow
for many opportunities to interact with people and customers on a personal level. It is
important for a business to make use of the social media opportunity as it has the
potential to establish strong business-customer relationships (Capuzzi & Stauffer
2012:272).
Many businesses, especially retailers, have realised the potential advantages and
benefits that social media tools can have for a business. Therefore, these
businesses have adopted social media and online interaction methods to market and
advertise products/services. Social media can be used by businesses, including
highly competitive South African retailers, to interact with customers, to market
products/services and to provide new business information on a daily basis. (Zarella
2010:1).
Social media can offer a business a number of potential advantages. Some of these
advantages include improving brand recognition and exposure among customers
(Walsh, Rudd, Moeykens & Moloney 1993:107), increased traffic to the official
website of a business (Riese, Pennisi & Major 2010:2), creation of new relationships
(Smith & Zook 2011:9), new marketing strategies, fewer marketing expenses and
providing the target market with more knowledge of the business and business
activities (Jue et al. 2009:2; Riese, Pennisi & Major 2010:2).

4
Furthermore, products/services can be purchased from social media websites. This
form of purchasing, often referred to as online shopping, is very convenient and
saves customers time and effort (Rao 2006). Taprial and Kanwar (2012:39) and
Kietzmann, Hermkens, McCarthy and Silvestre (2011:242) state that social media
tools allow businesses to reach out and interact more closely with customers. Closer
interaction provides businesses with the ability to receive new customer information
and feedback. More regular close business-customer interaction has the potential to
create strong business-customer relationships. Strong business-customer
relationships can be created through the effective use of social media tools. Strong
business-customer relationships in turn provide a business with the opportunity of
creating a positive brand image in the minds of customers, which is ultimately a very
important objective of any business (Jue et al. 2009:2; R.O.I Media 2013). Thus,
social media is a marketing tool which can, if used effectively, create a positive brand
image that will influence customer purchasing behaviour, which can possibly lead to
increased business performance.
1.2 BRIEF LITERATURE OVERVIEW
In the section that follows, an overview of the literature on the importance of retailers,
social media as a marketing tool, the brand image of retailers and customer
purchasing behaviour is provided.
1.2.1 The retail environment and its importance
The word retailer is derived from the French word “retail”. In French, the word retail
means to sell products/services in small quantities. A retailer generally buys large
quantities of products from wholesalers, and sells smaller quantities to the customer.
(Puranik 2012). According to Kuechler, Vaishnavi and Kuechler (2001:365), a retailer
can be defined as any person or business which sells products/services to final
customers. The retailer is the final link in the distribution chain. A retailer is different
from wholesalers and suppliers in the sense that these businesses sell
products/services to other businesses. Retailers usually buy and sell general
products or a variety of merchandise. (Newman & Cullen 2002:12; Puranik 2012).

5
The South African retail environment is “on the rise” (Treasury 2012:1). It is evident
from the increase of retail space and the number of retail shopping centres that the
South African retail industry is growing. The retail industry grew, on average, by
three percent annually over the past eight years and the levels of retail sales have
consistently increased. The South African online retail sales levels increase, on
average, by twenty nine percent per year (Treasury 2012:1). The retail industry
contributed 0.4 percentage points to the growing South African Gross Domestic
Product (GDP) figure of 2013 (Odendaal 2013).
South Africa has a total of twenty eight retailing businesses which are listed on the
Johannesburg Stock Exchange. The South African retailing industry is divided into
two categories: namely, general retailers and food and drug retailers. ADvTECH
Limited, African and Overseas Enterprises Limited, Cashbuild Limited, Combined
Motor Holdings Limited, Curro Holdings Limited, Holdsport Limited, Italtile Limited,
JD Group Limited, Lewis Group Limited, Massmart Holdings Limited, Mr Price Group
Limited, Nictus Limited, Rex Trueform Clothing Company Limited, Taste Holdings
Limited, The Foschini Group Limited, Truworths International Limited, Verimark
Holdings Limited and Woolworths Holdings Limited form part of the general retailers
sector of South Africa. (Sharedata 2013 a). The retailers that fall under the Food and
Drug retailers category of South Africa include Clicks Group Limited, Pick n Pay
Holdings Limited, Pick n Pay Stores limited, Shoprite Holdings Limited and The
SPAR Group Limited (Sharedata 2013 b). In South Africa sales in the retail business
sector are unpredictable, periodic and have a major impact on the overall economy
of the country (Trading Economics 2012). Retailers employ the largest percentage of
the South African workforce, and retailers are the third largest contributor to the
South African Gross Domestic Product (GDP). Retailers contribute 13.4 percent to
the South African GDP (Mthunzi 2009:8; Trading Economics 2012).
However, although the South African retail industry is growing, the actual sales
growth rate is slow. According to Durham (2011:33), South African customers are
very pessimistic. The sales growth rate of retailers is declining yearly. At the end of
the 2009 financial year, the sales in the South African retail industry grew by 14.6
percent. This figure decreased dramatically at the end of 2010, as the growth figure
was calculated at 3.3 percent. Durham (2011:33), states that a major contributor to

6
the changing purchasing patterns of customers is the constant change in the price of
petrol. This ultimately negatively affects the sales levels of retailers, as customers
are less willing to spend money, and are more concerned about saving money.
Retailers’ sales figures will therefore decrease, which will ultimately lead to lower
levels of business performance.
Although it is evident that a number of challenges exist, Hirsch (2012) states that
retail businesses in South Africa have the ability to increase business success and
performance through effective marketing, due to the constant rising in population
numbers. South African retailers have the opportunity and resources necessary to be
successful and to maintain high sales figures and continuous business growth.
This study will focus on the following retailers: Pick n Pay Holdings Limited,
Woolworths Holdings Limited, Shoprite Holdings Limited and The SPAR Group
Limited as these retailers are the most well-known in South Africa, and are also very
successful in the industry (Sharedata 2013 a; Sharedata 2013 b). Each of the above
retailers is briefly introduced next.
Pick n Pay Holdings Limited is a South African retailer that was established in 1967
by Raymond Ackerman (Sutcliffe 2007). Pick n Pay Holdings Limited operates in the
food and drug retailing sector, and at the end of the 2012 financial year, had the
second highest market capitalisation rate among all South African retailers operating
in this industry (Sharedata 2013 d). This provides evidence that Pick n Pay Holdings
Limited is one of South Africa’s largest retailers operating in the food and drug retail
sector (Sharedata 2013 c).
Woolworths Holdings Limited was founded in 1929 and is classified as one of South
Africa’s largest retailers. The business is listed on the Johannesburg Stock
Exchange and is made up of a number of retail stores which operate under the
Woolworths brand (Emerging Markets Information Service 2013). At the end of 2012,
Woolworths had the highest market capitalisation figure, providing evidence that
Woolworths Holdings Limited is the largest and most successful among general
retailers within South Africa (Sharedata 2013 c).
7
Woolworths Holdings Limited and Pick n Pay Holdings Limited place high importance
on the use of social media tools and make use of a number of these tools, such as
Official websites, Facebook and Twitter.
The Spar Group Limited was established in 1963 when a group of eight wholesalers
were given the right to operate under the Spar name and brand. Spar started doing
business through five hundred small retail outlets. The business grew and in 2004 it
was listed on the Johannesburg Stock Exchange for the first time. Currently, Spar
Group Limited is classified as a food and drug retailer and operates through six
distribution centres and one Build It distribution centre, which is responsible for
providing more than a thousand Spar stores with products/services across South
Africa. The Spar Group Limited states that the business continuously focusses on
providing the highest possible quality products/services to customers. The
business’s main objective is to satisfy the needs and wants of customers in a caring
environment. (Spar 2013 a; Spar 2013 b; Sharedata 2013 b).
Shoprite is one of the most trusted brands of South Africa. The business has been
voted the best supermarket in the Sunday Times Best Brands Survey for six
consecutive years. Shoprite Holdings Limited was established in 1979 and has
grown to a business operating with more than two thousand stores across sixteen
countries. The Shoprite Holdings Limited supermarkets operate under the food- and
drug retailer sector and strive to provide convenience to customers by selling basic
food- and household items at low and affordable prices. The business claims that
through its unique product offerings, it has acquired the status of the brand of choice
among the majority of South African customers. (Sharedata 2013 b; Shoprite
Holdings Limited 2013 a).
The following retailers: Pick n Pay Holdings Limited, Woolworths Holdings Limited,
Shoprite Holdings Limited and The Spar Group Limited, make use of social media
tools to market products/services, to interact with customers, to create loyalty
programmes, to provide new business information regularly and to ultimately
influence the purchasing behaviours of customers (Facebook 2013 a; Facebook
2013 b; Facebook 2013 c; Facebook 2013 d; Pick n Pay 2013 a; Twitter 2013 a;
Twitter 2013 b; Twitter 2013 c; Woolworths 2013 a).

8
1.2.2 Social media as a marketing communication tool
Sullivan and Adcock (2002:26) define marketing as all of the activities undertaken by
retailers to ensure customer satisfaction, and satisfying customer needs and wants.
Keefe (2004:17), states that marketing is a set of procedures used by a business to
create, communicate and deliver value to its customers. Marketing is used to
develop customer relationships in such a way that it will be beneficial to both the
business and its shareholders. Traditional advertising mediums, such as radio,
television, newspaper and billboards, can be defined as one-way advertising. The
potential customer has no ability to interact with the business or its advertisements.
A traditional marketing practice is a process which involves an active sender, the
marketer, and a passive receiver, the customer. This is what makes social media
marketing different. (Andersen 2001:169; Baekdal 2009).
Social media can be described as any website that provides the user with the ability
to interact with other users online (Meyerson 2010:327). According to Donovan and
Henley (2010:354), social media tools can be defined as electronic programs,
applications and technologies which allow users to exchange content and
communicate interactively. Any website which allows a user to make a comment, to
make a status update, to “like” or “share” other comments or photos or to mingle with
other online users, can be classified as a social media website. The popular and
most used social media tools used by both customers and businesses are
Facebook, Twitter, LinkedIn, Pinterest, MySpace, Google Plus+ (The eBusiness
Knowledgebase 2013), Bebo, Friendster, Hi5, Habbo and Tagged (Jain 2012).
Social media is also referred to as online socialisation. Any online interaction, more
than simply reading, is described as using a social media website. Online
socialisation refers to online interaction, and the opportunity to socialise with friends
online. (Obee 2012:7-8).
Social media tools are used to connect and to allow interaction between Internet
users based on common interests, political views or specific activities (Boyd &
Ellison 2010:16). This provides evidence that social media tools can be used by
businesses to market their products/services, to interact with their customers and to
provide new business information on a regular basis. Zarrella (2010:1) states that to

9
make use of social media for advertising and marketing of products/services will not
hinder any business financially, and is not difficult to get started or to use.
Social media tools, if used effectively, can provide a business with a number of
advantages and possibilities. Social media provides a business with the ability to
market product/services to final customers. Social media tools allow a business to
market its products/services interactively, which allows customer-business
interaction. Social media tools allow the customer to interact with the business
online, at any time, and virtually at any place (Zarrella 2010:3). Thus, social media
can be used as a tool for creating and maintaining good business-customer
relationships (Gordon 2013:108). Based on the above information, it is evident that if
a business uses social media tools effectively, it may have a positive influence on
the brand image and purchasing behaviour of customers.
The effectiveness of Official websites, Facebook and Twitter, the most commonly
used and popular social media tools (Barker, Barker, Bormann & Neher 2013), on
the creation of a positive retailer brand image, and whether a positive brand image
influences customer purchasing behaviour, will be investigated in the retail industry.
1.2.2.1Official websites
A website can provide a business with a number of marketing opportunities. A
business’s website can be the first contact point that a customer has with the
business, and every business should ensure that its website creates a good first
impression. A high-quality interactive website should allow interaction between the
business and its customers. Good interaction will provide a business with the
opportunity of answering frequently asked questions, and marketing
products/services. (Clark 2013).
Vasi (2013), states that for a business to have an official website is very
advantageous. Official websites open doors for a business and provide an
opportunity to expand and operate universally. Official websites allow online
shoppers to view products/services from different countries, from the comfort of their
homes and offices. Products/services of different countries that are purchased

10
online, can be delivered to the customers’ doorstep. Customers are increasingly
using social media and businesses’ Official websites as a purchasing tool (Accenture
2013).
According to Rao (2006), an interactive website will allow a business to be open and
to stay connected for twenty four hours a day, seven days a week. The doors of a
business operating online never close, which therefore maximises the business’
sales potential. Official websites allow a business to reach new markets and to
improve customer satisfaction through more personal interaction.
1.2.2.2Facebook
Zarrella (2010:2) states that to date Facebook has more than 250 million users.
Facebook was established by Mark Zuckerberg in 2004. Zuckerberg’s initial reason
for creating Facebook was simply for university students to find and interact with
friends online. Facebook describes its function as a social utility that can be used to
interact with friends, workers and family in an online environment. A user starts off by
creating a profile, providing information based on gender, interests, hobbies and
education. (McClard & Anderson 2008:10-11).
A business that makes use of the Facebook as a social media tool to interact with
customers has the ability to build and improve business-customer relationships. The
business will be able to reach new groups of customers and will possibly increase
sales and business performance (Facebook 2013 e).
1.2.2.3Twitter
Twitter is a form of social media that connects its users to the latest news, stories
and information which is most important to the user (Twitter 2013 d). Twitter was
established in 2006 (Weinberg 2009:125) in San Francisco, and is used by
individuals and businesses around the world. Twitter, to date, has more than 14
million registered users (Zarrella 2010:1). Twitter states that making use of its social
media tool will provide the fastest and easiest way for a user to stay connected to

11
everything that the user cares about. Twitter allows its users to upload photos, video
clips, and allows online communication with other Twitter users (Twitter 2013 e).
Twitter provides a business with a number of opportunities. One of these
opportunities includes being able to connect with its customers at any time. New
product/service information can be shared, feedback can be received from
customers, and customer relationships can be built (Twitter 2013 a).
Social media tools allow a business to interact with customers on a more regular
basis. A business is able to communicate frequently, provide product/service
information and to inform customers of new business activities. Social media tools
allow a business to position its brand accurately, and to create a desired brand
image in the minds of customers. If a business is able to create a positive brand
image, it will possibly have an effect on the purchasing behaviour of customers,
which will ultimately lead to increased business performance. (Kapferer 2008:230;
Lawrence & Kleinman 2012:90).
1.2.2.4Brand image and Customer purchasing behaviour
Kapferer (2008:174) provides a clear definition of brand image by stating that a
brand image is created by a business through its products/services, customer
service and daily business activities. The image of a brand can be described as the
way in which a business’s target market relates to its products/services (Bygrave &
Zacharaksi 2009:106). Franzen and Moriarty (2008:19) state that the image of a
brand is the way in which the community perceives a particular brand, and the
impression which is created in the mind of a customer. Based on this information, it
is evident that the image of a brand can be defined as the way in which a brand is
positioned in the minds of customers created through all of the activities of a
business.
It is important for South African retailers to create an effective and accurate brand
image in the minds of its target markets through the use of marketing tools. It is also
of utmost importance for retailers to create a brand image which is positive, as a
negative brand image will lead to customers being disloyal to the brand, or simply
changing brand preferences. A positive brand image can influence the purchasing

12
behaviour of customers, which will have an effect on the performance of a business
(Chaudhuri & Holbrook 2001:81).
According to Belén del Río, Vázquez and Iglesias (2001:413) a positive brand image
will make a number of different advantages possible to a business. A positive brand
image has the ability to lead customers from awareness into purchasing (Kumar
2008:192). A positive brand image will ensure business performance through the
assurance of high sales and profits, and will ensure growth potential. When a
positive brand image is created in the minds of customers, word-of-mouth
advertising will be to the benefit of the business. A positive brand image will also
ensure brand loyalty and a competitive advantage. (Kirby & Marsden 2006).
The use of social media for marketing is perceived to be an effective way of creating
a positive brand image in the minds of customers. When social media has created a
positive brand image, it may lead to customer’s actually purchasing and making use
of the retailers’ products/services. A positive brand image provides a business with
the potential to positively influence purchasing behaviour and its business
performance. (Ginn 2013; McKee & O’Driscoll 2009).
Business performance excellence is something that all businesses strive for. There
are many factors that contribute to the success and performance of businesses, and
although no clear definition of excellent business performance exists, it can only be
reached once a business has the ability to use its financial, capital and human
resources in such a way that it maximises its level of profitability (Luftig 1998).
According to Kapferer (2008:12) business performance can be increased by
ensuring that a brand is attractive, effectively communicated and experienced by the
target audience in a number of different ways on a regular basis.
Businesses should know which factors contribute to their success and increased
performance as many factors contribute to the success and performance of
businesses. Businesses are required to set their own goals and business objectives,
and benchmarks of what business performance entail. (Vom Brocke & Roseman
2010:122). However, as a general guideline, business performance relates to a
business’s return on investment figure, growth rate of sales, growth of employment,

13
market share, new product success, customer retention ratio, global presence,
profitability, efficient resources, decreased costs and labour turnover rates (CPA
Australia 2011:3; Glebbeek & Bax 2002:4; Singh 2004:70; Westall & Cowling
1999:38). As sales, market share and customer retention links to business
performance it is evident that a business’s customer purchasing behaviour is
important.
Customer purchasing behaviour
Customer purchasing behaviour can be defined as how individuals decide on
spending available resources, such as time and money, on products/services.
Customer purchasing behaviour, according to Kengthon (2011:2), can be defined as
the way in which customers evaluate, purchase or dispose products/services
according to specific needs and wants. Customer purchasing behaviour
demonstrates the totality of customer decisions regarding the purchasing, usage and
disposition of products/services (Hoyer & Macinnis 2010:3). Hoyer and Macinnis
(2010:3) also state that customer purchasing behaviour involves more than the
process of purchasing tangible products. Customer purchasing behaviour involves
customer’s decisions regarding the use of services, experiences, actions and ideas.
The preferences of customers change regularly, and it is important for marketing
managers to be aware of these changes and to adapt marketing strategies
accordingly. Effective marketing communication strategies have the ability to
influence customer purchasing behaviour. (Lamb, Hair & McDaniel 2009:140).
According to König, Dengel and Hinkelmann (2011:295), if a business is able to
positively influence a customer’s purchasing behaviour, the potential for increased
sales levels exists, which has been proved to increase the performance of a
business. Increased sales levels due to positively influenced customer purchasing
behaviours are perceived by many businesses as a form of business performance.
Increased sales levels provide an indication that the purchasing behaviour of
customers has been positively influenced. (Rayner 2012:199).
Increased sales, and thus improved customer purchasing may be realised with the
more effective use of social media. Social media provides businesses with the ability
to interact with customers regularly. Regular business-customer interaction provides

14
the business with the ability to establish and maintain strong relationships (Brink &
Berndt 2004:27). Pati (2002:320) states that strong business-customer relationships
exist when a business is able to establish a positive brand image in the minds of
customers. Thus, a positive brand image influences the purchasing behaviour of
customers (Trehan & Trehan 2007:197). By making use of social media tools, a
business has the opportunity of creating a desired and accurate brand image and
increased purchasing behaviour (Mangold & Faulds 2009:358).
1.3 PROBLEM STATEMENT
Following the introduction and the brief literature review to this study, it is now
possible to highlight the problem statement of the study. Retailers are important, as
the level of sales of retailers provides a clear indication of a country’s economic
state. The state of the economy depends on the success of retailers, and this
provides evidence that customer spending is a key driver of the economy. If
customers decide not to purchase products/services from retailers, the retailers’
business performance declines and the economy slows down.
Retailers are affected by economic, social and technological changes on a regular
basis. Changes and pressures from the external business environment and the
industry and changing customer behaviour have resulted in retailers having to
increase work levels to maintain high sales levels and to ensure business success.
Due to the constant changes in the business environment and changing customer
purchasing behaviours, retailers maintaining high sales levels and profit to remain
successful have become more of a challenge. The fast changing business and
economic environment is causing retailers’ sales levels to decline, which negatively
affects business performance, and results in retailers struggling to survive.
The behaviour and spending patterns of customers are changing and retailers are
required to change and adapt their marketing processes and strategies accordingly.
Traditional marketing tools such as television, radio and newspapers are not as
effective as in the past, and retailers should focus on drawing the attention and
marketing products/services in new and innovative ways. One way of doing this is for
a retailer to make use of the Internet. Customers make use of the Internet and social

15
media, to collect product/service information and to make final purchasing decisions.
Retailers have the opportunity of making use of social media tools as part of
marketing communication strategies. Social media tools such as the Official websites
of businesses’, Facebook and Twitter allow businesses to interact with customers on
a regular basis, to market products/services and to share new business information
in an online environment. Many retailers have adopted the use of social media tools
to engage in more frequent online customer interaction. The existence of a
relationship between the use of social media tools and the creation of a positive
brand image remains an uncertainty among retailers. In addition, the relationship
between brand image and customer purchasing in the retail industry is still to be
measured.
Therefore, more research needs to be done to investigate the influence of social
media tools on the brand image of retailers, and the effect of brand image on the
purchasing behaviour of customers.
1.4 PURPOSE OF THE STUDY, RESEARCH QUESTIONS AND RESEARCH
OBJECTIVES
The purpose of the study is to investigate the influence of social media tools on the
brand image of retailers and the relationship between brand image and the
purchasing behaviour of customers in the retail industry.
The influence of three social media tools: namely Official websites, Facebook and
Twitter on retailers’ brand image will be identified. In addition, the influence of brand
image on retail customers’ purchasing will be investigated.
1.4.1 Research questions
Given the purpose of this study, the following research questions are presented:
Is social media an effective marketing tool to use for creating a positive brand
image?

16
Does a positive brand image influence the purchasing behaviour of customers?
The research questions have been converted into primary and secondary research
objectives.
1.4.2 Primary research objective
The primary objective of this study is to investigate the influence of social media
tools on the brand image of retailers and how it affects customer purchasing
behaviour
1.4.3 Secondary research objectives
In order to address the primary objective of this study, the following secondary
objectives have been created:
To develop and undertake a detailed theoretical investigation of the nature of
social media tools, the brand image of retailers and the purchasing behaviour of
customers.
To develop a hypothetical model to test the relationships between social
media tools, the brand image of retailers and the purchasing behaviour of customers.
To empirically test the influence of three social media tools (Official websites,
Facebook and Twitter) as independent variables on the brand image (intervening
variable) of retailers and the purchasing behaviour of retail customers (dependent
variable).

17
To provide recommendations, based on the empirical results generated in this
study on how social media tools can be used by retailers to create a positive brand
image which will positively influence customer purchasing behaviour.
Using the primary and secondary research objectives, research hypotheses can be
constructed for this study.
1.5 RESEARCH HYPOTHESES
The main purpose of this study is to investigate the influence of social media tools on
the brand image of retailers, and the influence of brand image on customer
purchasing behaviour. A framework will be developed and used to support this study.
The framework will include the necessary variables which have been collected
through the use of secondary sources of information.
The variables that have been identified to be used in the framework will be
characterised into three categories. The categories are made up of independent
variables, intervening variables and dependent variables. The Official websites,
Facebook and Twitter, the three social media tools, will be used as independent
variables. Brand image will be used as the intervening variable. Customer
purchasing will be used as the dependent variable in the framework. For this study,
these variables will be used to determine the influence of social media tools on the
brand image of retailers, and the influence of brand image on customer purchasing
behaviour. Figure 1.1 graphically represents the hypothetical model to be evaluated
in this study.

18
Figure 1.1: Hypothetical model for study
Brand image
H1
H2
H3
H4
Official
websites
Customer
purchasing
behaviour
As seen in Figure 1.1, hypotheses have been developed to test the relationships in
the proposed theoretical framework.
H1: There is a significant positive relationship between Facebook and Brand image.
H2: There is a significant positive relationship between Twitter and Brand image.
H3: There is a significant positive relationship between Official websites and Brand
image.
H4: There is a significant positive relationship between Brand image and Customer
purchasing behaviour.
This proposed hypothetical model will be tested, following a specific research design
and methodology.
1.6 RESEARCH DESIGN AND METHODOLOGY
As mentioned, the purpose of this study is to investigate the influence of social
media tools on the brand image of retailers, and the influence of brand image on
customer purchasing behaviour. To achieve these objectives and to test the
proposed hypotheses, secondary and primary research will be done.

19
1.6.1 Secondary research
Secondary research can be defined as any data available for use in a study, but
which is not collected and used for the current research study. Secondary research
is the process of collecting and summarising data that already exists. Secondary
data include published journal articles, newspaper reports and information from the
Internet. (Jugenheimer, Bradley, Kelley & Hudson 2010:29; Nargundkar 2003:14).
A complete literature review will be conducted to reach the research objectives of
this study. Research will be done on the retail environment and the importance of
retailers. The different social media tools used by retailers will be identified and
discussed. Thereafter, the brand image of retailers and purchasing behaviour of
customers will be investigated.
For the secondary study, various databases will be used to collect data. Databases
that will be used include EBSCO host and Emerald, as these databases are freely
available to NMMU students. The Nelson Mandela Metropolitan University will be
used to collect data from national and international sources.
1.6.2 Primary research
Primary research can be defined as the process of collecting data that does not
already exist. Primary research is the collection of data for the use of a specific
study. A primary researcher seeks to answer research questions by observing
behaviour. (Jugenheimer, et al. 2010:29; Nargundkar 2003:14; Nykiel 2007:25). The
primary research of this study will be an empirical investigation on customers’
perceptions on retailers’ social media tools, brand image and customers’ purchasing
behaviour. The following section provides information on the research paradigm,
sampling and data analysis that will be used to complete the empirical investigation.
1.6.2.1Research paradigm and method
Ovretveit (2002:202) states that two types of research paradigms exist, namely the
positivistic and phenomenological paradigms. The phenomenological research
paradigm uses relevant information of individuals and social groups as information
about subjective meanings. This research paradigm attempts to make reference

20
between the way that an intervention works, and the perceptions that individuals
have. Research is based on subjective experiences and perceptions of individuals.
According to Everard, Morris and Wilson (2004:35), to effectively use a
phenomenological research paradigm, the researcher should be able to view a
situation in a new way or differently to understand the reality of the situation. The
phenomenological research paradigm is used to collect qualitative data (Maykut &
Morehouse 1994:3). Qualitative research methods make use of descriptions to
interpret findings and results. Qualitative research methods are focussed on
achieving objectives through techniques used to support interpretations. Qualitative
research methods achieve objectives through techniques and methods other than
numerical methods. (Ritchie & Lewis 2003:3).
According to Maykut and Morehouse (1994:3), positivistic research is a process that
should focus on predicting and explaining observed events. A positivistic
researcher’s main objective is to predict, explain and to provide proof of a specific
event or experience. The positivistic research will furthermore make use of research
methods to test, support or reject a specific theory (Wimmer & Dominick 2011:116).
The positivistic research paradigm focusses on collecting quantitative data (Maykut
& Morehouse 1994:3). Wild and Diggines (2009:86) clarify that quantitative research
involves the gathering of primary data from large respondent groups and samples.
Furthermore, quantitative research makes use of numbers, measurements and
mathematical calculations to resolve issues (Cassell & Symon 2004:48; Wild &
Diggines 2009:86). According to Kasi (2009:95), for a positivistic researcher, the
world is knowable. Cohen, Manion and Morrison (2007:148) state that the reliability
of quantitative research studies is high and the validity tends to be low.
A positivistic research paradigm will be used in this study as statistics and
quantitative analysis will be used to investigate collected data. An empirical study will
be conducted to test the theoretical framework and hypothesised relationships. The
empirical research will focus on retail customers within the Eastern Cape.
1.6.2.2Sampling and data collection
According to Pawar (2004:3), research cannot be done without data. Data is
collected from a group of participants to achieve the objectives of a study, and to
answer the research question. In this study, the population will consist of customers

21
in the Eastern Cape region and questionnaires will be distributed to no less than 300
retailer customers, in order to have sufficient numbers necessary to conduct the
empirical data analysis. No sample frame exists, thus for the purpose of this study a
non-probability sampling technique will be used to select a sample of a minimum of
125 customers from the entire population. According to Gravetter and Forzano
(2012:151), convenience sampling is defined as a sampling method in which
researchers use participants that are not difficult to reach. Respondents are selected
based on willingness and degree of availability. Due to the large sample size that will
be used in this study, convenience sampling will be the most efficient way of
collecting data from customers.
As mentioned before, a quantitative method of research will be used to conduct this
study. The measuring instrument that will be used to collect data will be in the form
of a questionnaire. Questionnaires will be developed and distributed to retail
customers in the Eastern Cape. The questionnaires will assist in identifying the
relationships between the independent, intervening and dependent variables. The
questionnaire will be self-developed and will be distributed to no less than 300 retail
customers. The language of the questionnaire will be English. The questionnaire will
be made up of three sections: namely, Section A, Section B and Section C. Section
A of the questionnaire will collect the biographical and demographical information of
the respondents. Biographical and demographical data will include information
regarding the age, gender and employment status of retail customers.
Section B of the questionnaire will consist of a number of statements which are
based on the literature review concerning the social media tools used by retailers.
This section will make use of a five-point Likert-type scale. The five-point Likert-type
scale will range from (1) “strongly disagree” to (5) “strongly agree”.
The next section, Section C, will also be a five-point Likert-type scale which will
range from (1) “strongly disagree” to (5) “strongly agree”. Section C will focus on
collecting data on retailers’ brand image, and the purchasing behaviour of
customers.

22
To ensure that the questionnaire used is valid and reliable, a comprehensive
analysis of the data will be conducted. The computer programmes Microsoft Excel
and Statistica will be used to statistically analyse the collected data.
1.6.2.3Data analysis
A data analysis procedure will be used to examine the data collected from
respondents. Descriptive statistics will be calculated and interpreted. According to
Babbie (2010:467), descriptive statistics can be used to interpret and summarise
data into more practicable forms. Descriptive statistics is a collection of statistical
techniques that can be used to summarise the observations of a sample group
(Babbie 2010:467).
The face validity of the measuring instrument used in this study will be ensured, as
experts in the field of retail marketing will assist with the design of the questionnaire.
Furthermore, to ensure the validity of the measuring instrument, a pilot study will be
conducted. A pilot study is a process in which a pre-test questionnaire, which will
have to be completed, is distributed to a small group of respondents. (Blessing &
Chakrabarti 2009:114). The results of the pre-test questionnaire will be analysed,
and if necessary, changes will be made to the original questionnaire to ensure a
good understanding of all items by respondents. Thereafter, ethical clearance was
obtained from the Business and Economic Sciences’ Faculty RTI Committee of the
Nelson Mandela Metropolitan University.
In addition, an exploratory factor analysis (EFA) will be conducted to ensure the
validity of the measuring instrument. A factor analysis is an effective way of
determining whether the researchers’ interpretation of the constructs, are consistent
with the actual meanings of the constructs (Kock 2010:275). According to Child
(2006:1), factor analysis is a mathematical procedure which focusses on ordering
and simplifying interconnected measures. The mathematical process attempts to
prove generalisations.
Cronbach Alpha coefficients will be calculated to test the reliability and the
consistency of the measuring instrument, namely the questionnaire. The Cronbach
Alpha, when calculated, provides a coefficient of correlations between items used in

23
the questionnaire. The Cronbach Alpha provides the degree of consistency among
items in the questionnaire. (Cohen et al. 2007:148). Furthermore, to determine
correlations between different variables used for this study, Pearson’s Product
Moment Correlations will be determined.
According to Bruce, Pope and Stanistreet (2008:243), multiple linear regression
analysis is a process used to find a relationship and to determine a dependent
variable based on a number of independent variables. This study will make use of
multiple linear regression analysis to investigate the influence that two or more
independent variables have on one dependent variable. The multiple linear
regression will be used to determine whether the social media tools, namely Official
websites, Facebook and Twitter influence the intervening variable brand image. It will
also determine the influence that brand image has on customer purchasing
behaviour. Furthermore, t-tests and an Analysis of Variance (ANOVA) will be
conducted.
The complete research methodology of this study will be discussed thoroughly in
Chapter 4.
1.7 SCOPE AND DEMARCATION OF THE STUDY
Previous research studies have proved that many factors contribute to business
performance, the creation of positive retailer brand images and positive customer
purchasing behaviours (O’Guinn, Allen & Semenik 2009:24; Osterman 2007:1).
Brønn and Vrioni (2001:215-219) did a study on the corporate social responsibility
and cause-related marketing efforts of businesses. The authors (Brønn & Vrioni
2001:215-219) stated that customer relationship management through effective
marketing efforts increased the levels of sales, created a positive brand image and a
motivated workforce. Businesses that survive in a fast changing business
environment are the ones that are able to manage customer relationships and
uphold a positive brand image. For a business to strengthen customer relationships
through the use of marketing communication tools, it is essential that a business is
aware of how customers perceive the business, and the impression that customers
have of the business. (Brønn & Vrioni 2001:215-219).

24
A study by Kaplan and Haenlein (2010:59) stated that many businesses are starting
to realise the benefits of social media as a marketing communication tool. Marketers
and decision makers of businesses are making efforts towards finding profitable
ways of using social media tools for marketing. Kaplan and Haenlein (2010:62),
stated that the use of social media tools for marketing communication provides a
business with a number of challenges and opportunities, and that it is essential for a
business to make use of social media tools to keep up to date with the fast changing
business environment.
As mentioned above, previous studies have shown that for a business to be able to
increase sales levels, it is important to create a positive brand image. A positive
brand image positively influences purchasing behaviour, which in turn increases
sales levels. Many businesses are starting to make use of social media tools to
create a positive brand image. The literature review conducted in this study will
investigate three independent variables: namely, Official websites, Facebook and
Twitter, and how effective these social media tools are for creating a positive brand
image, and how brand image may influence customer purchasing. The empirical
research of this study will focus on retailers and customers within the Eastern Cape.
Many other factors may contribute to the success of retailers and the creation of a
positive brand image, but these will not be tested in this study. The geographical
area will be limited to the Eastern Cape, and the sample size will be limited to 300
customers.
1.8 SIGNIFICANCE OF THE STUDY
Social media tools have been adopted by many retailers within the Eastern Cape,
but the significance of this type of marketing has yet to be determined. This study will
attempt to make a contribution by determining the effectiveness of the use of social
media tools by retailers.
Marketing is an integral part of any type of business, and finding ways of effectively
reaching, informing and convincing customers to purchase its products is ultimately
what provides a business with success. This study attempts to investigate the
influence of social media tools on the brand image of retailers, and the influence of
brand image on customer purchasing behaviour. If the purchasing behaviour of

25
customers is positively influenced by the brand image of a retailer, sales will increase
and the business performance of retailers will improve.
It has already been proven that a positive brand image leads to increased business
performance (Funk 2012:10; Milosevic, Martinelli & Waddell 2007:64). This study will
attempt to determine whether a link between all three aspects (social media tools,
brand image, customer purchasing behaviour) exists, specifically in the South
African retail industry.
Focus will be on addressing the shortage of literature, in South Africa, on social
media tools and the influence that it has on the brand image and purchasing
behaviour of customers. The results from the empirical investigation will add to the
field of social media tools, related to the retail environment.
This study will provide retailers in the Eastern Cape with in-depth knowledge of the
efficiency of social media as a marketing tool. When the influence of social media
tools on the brand image of retailers and the purchasing behaviour of customers is
understood, it can identify strategic interventions to increase business performance,
thereby adding to the body of knowledge of retailers in the Eastern Cape.
1.9 STRUCTURE OF THE RESEARCH
The structure of the research will be as follows:
Chapter 1 introduced the study by providing a background of the topic investigated.
The introduction was followed by the problem statement, the purpose of the study
and the research questions of the study. A hypothetical model and research
hypotheses was proposed. This chapter also included the secondary and primary
research objectives of the study. The research objectives were followed by the scope
and demarcation of the study, as well as the contribution of the proposed research.
This chapter was concluded with an overview of the structure and contents of this
study.
Chapter 2 will provide a background of the South African retail environment. This
chapter will discuss the importance of retailers in the South African context. The

26
economic contributions made by retailers will be discussed and emphasised. This
will be followed by a discussion of the factors that contribute to the success of
retailers, as well as challenges that retailers face in South Africa. The chapter will
conclude with a discussion of brand image and customer purchasing related to
retailers.
Chapter 3 will focus on the concept of social media as a marketing communication
tool. This chapter will determine the importance of social media tools, as well as
Official websites, Facebook and Twitter as tools of social media, which will be used
for this study.
Chapter 4 will provide an overview of the research methodology to be used in this
study. The population that will be investigated, the sampling technique and the
measuring instrument to be used will be provided and discussed. The method to
collect data and strategies to be used to administer the measuring instrument will be
mentioned. A discussion of the data analysis process and statistical techniques to be
used in this study will conclude chapter 4.
Chapter 5 will provide the empirical results of the validity and reliability analyses of
this study’s measuring instrument. The results of the influence of social media tools
on the brand image of retailers and the purchasing behaviour of customers will be
discussed. This chapter will conclude with a discussion on the influence of the
demographic variables on the variables used in this study.
Chapter 6 will conclude the research with a presentation of the contents of the
previous five chapters. This chapter will provide a conclusion based on the literature
review and the empirical results. The contributions made and limitations of this study
will be provided, as well as suggestions and recommendations for further research.
This chapter will conclude with a provision of recommendations for retailers on the
use of social media tools to create a positive brand image, and if a positive brand
image influences the purchasing behaviour of customers.

27
CHAPTER 2 THE RETAIL ENVIRONMENT AND ITS IMPORTANCE
2.1 INTRODUCTION
The main focus of this study is to investigate the influence of social media tools on
the brand image of retailers, and the effect of brand image on the purchasing
behaviour of customers. Considering that the study investigates relationships in the
retail environment, it is important to discuss retailers in detail.
The purpose of this chapter is to describe retailers and their importance in the South
African context. This chapter will be divided into seven sections. The first section will
define a retailer. The second section will describe the importance of retailers by
focussing on retailers’ dominant role in the supply chain, the influence of retailers on
the economy and GDP, the employment offered by retailers and retailers’
contribution to sustainability. This will be followed by the third section which will
describe the different types of retailers: namely, store-based retailers and non-store
based retailers. The fourth section will provide a discussion regarding recent
developments in the South African retail environment. Section five will provide a
discussion on four successful South African retailers (Pick n Pay Holdings Limited,
Woolworths Holdings Limited, the Spar Group Limited and Shoprite Holdings
Limited). The sixth section will discuss the brand image of a business, which will be
followed by a discussion on customer purchasing behaviour.
2.2 DEFINITION OF A RETAILER
For any business to be classified as a retailer, more than half of its total profits
should be generated from selling products/services to final customers. According to
Varley (2013:4), the main purpose of a retailer is to sell finished products/services to
final customers. A retailer is defined as any person or business, which satisfy the
needs and wants of customers by selling final products. A retailer buys products in
large quantities and sells these products in smaller quantities to the public. (Barrett &
Gow 1997:13). Furthermore, Skjøtt-Larsen, Schary, Mikkola and Kotzab (2007:149)
state that the process of retailing that is selling products/services to the public,

28
entails partaking and fulfilling a set of functions to add value to final customers.
Retailers are the link between the manufacturers of products/services and the final
customer, and create the environment in which customer transactions take place.
(Cant 2005:4; Mathur 2010:198). Thus, retailers partake in the final stage of
economic activity (Pradhan 2009:4).
Based on the above mentioned information, a retailer can be classified as a person
or business which buys final products/services from wholesalers to sell to the public
to fulfil customer needs and wants. Retailer products are not purchased by
customers with the purpose of it being resold.
2.3 IMPORTANCE OF RETAILERS
Factors that provide evidence to the fact that the importance of retailers are
constantly growing include: retailers’ dominant role in supply chain control, the
influence of retailers on the economy and their contribution to GDP, the amount of
employment opportunities that retailers offer and retailers’ contribution to
sustainability. (Londhe 2006:1.2; Young & Tilley 2006:402). Each of these are briefly
addressed in the following chapters.
Retailers’ dominant role in supply chain control
Dunne and Lusch (2008:139) define a supply chain as a group of institutions
responsible for distributing products from the place of production to the point of
purchase. A supply chain, according to Mentzer (2001:2), is a group of three or more
businesses linked together by more than one upstream or downstream flow of
products/services, finances and information to final customers. Tompkins and
Harmelink (2004:1) state that a supply chain is the relationship or link between
trading businesses. According to Barrett and Gow (1997:13) and Londhe (2006:1.2),
suppliers provide manufacturers with the raw materials needed to produce these
products. A product is produced in a factory by manufacturers. The wholesalers fulfil
the next step in the supply chain and are responsible for buying finished products
from the manufacturers and selling them to retailers. Retailers complete the last
phase in the supply chain selling final products to customers.

29
It is evident that the term supply chain is used for the process of the flow of
products/services and information from the raw material form through the stages of
processing, development, distribution, consumption and disposal. Each of these
levels or stages is interrelated by a link, and these links form the supply chain.
(Tompkins & Harmelink 2004:1). Furthermore, Shah (2009:4) states that supply
chain management includes all of the activities performed to convert raw materials to
the final stage, when products/services reach final customers. Supply chain
management is a process focussed on the planning, designing and controlling of the
flow of raw materials, information and finance along the supply chain, with the
purpose of delivering superior value to final customers (Shah 2009:4). Effective
supply chain management, according to Coyle, Langley, Gibson, Novack and Bardi
(2009:6), is essential for achieving success and performance in a competitive
business environment. Therefore, retailers’ important role in the supply chain is
evident.
The importance of retailers is constantly growing and retailers no longer only play an
integral role and vital part in the marketing channel, but also form an important link
between final customers and manufacturers (Trehan & Trehan 2011:290). In other
words, retailers form the last link in the supply chain.
A retailer is the closest of all institutions in the supply chain to the final customer
(Leonard 1997:9). Thus, a retailer is responsible for the final step in the supply chain,
and is responsible for ensuring that products/services from producers are
transported and delivered to final customers. Barret and Gow (1997:13) state that
retailers are a central point for all customers, and can save customers time and
money. Retailers collect and sell the products of many different manufacturers. This
saves customers the effort of having to visit different manufacturers to buy specific
products. Retailers are responsible for adding value to final products/services, and
according to Pradhan (2009:140) it is important for a retailer to build and maintain
long-term relationships with customers. This added value ensures customer
satisfaction by fulfilling needs and wants. (Cant 2005:4; Londhe 2006:1.2).
Furthermore, a retailer is required to provide a wholesaler with valuable knowledge
and information regarding the anticipated level of sales, and must be aware of the

30
needs and wants of customers. A retailer provides a wholesaler with the required
knowledge of how the quality of products/services can be improved to better satisfy
final customers. (Farahani, Rezapour & Kardar 2011:268; Zentes, Morschett &
Schramm-Klein 2011:7). This puts a retailer in an advantageous position as the
business is able to develop activities and products/services to satisfy the needs and
wants of customers (Govil & Proth 2002:57; Leonard 1997:9).
The success of a retail supply chain depends on how efficiently a retailer is able to
distribute the right products/services to the right place at the right time (Thomas,
Esper & Stank 2010:386). According to Thomas et al. (2010:386), the business
environment is constantly changing and evolving, and it is essential for a retailer to
develop highly responsive supply chains. Highly responsive supply chains allow a
retailer to satisfy market demands efficiently. Mahadevan (2007:40) states that
increased competition and the growing need for operational effectiveness and
customer satisfaction has led to retailers demanding higher quality resources from
supply chain partners to ensure high retail competitiveness in the business
environment. The importance of retailer-supplier relationships and interaction has
increased as the need for high quality resources is essential for ensuring retailer
success and competitiveness. Ganesan et al. (2009:84) state that this process,
retailers demanding higher quality resources, has led to numerous improvements in
retailer brand image, reputation, sales levels, profit margins and customer
relationships.
Influence of retailers on the economy and GDP
Another factor that proves a retailer’s growing importance is its major contribution to
the country’s economies and GDPs. The economy is defined as all activities and
processes used to produce and distribute products/services in a particular country or
geographical region. The economy of a country indicates the efficient use of
available resources. (Investor Words 2013). The economy of a country is defined as
the organised system and process of all human activities necessary in the processes
of production, consumption, exchange and distribution of final products/services
(Investing Answers 2013). According to Bullmore and Sporns (2012:337), a country
with a strong economy is one in which economic sectors add value to raw materials
31
to increase the value of final products/services and thereby increase the selling price
to more than the price of production. The GDP figure of a country provides an
indication of the state of a country’s economy (Pailwar 2008:74). According to
Carayannis, Varblane and Roolaht (2012:22) the GDP figure is a reasonable
indication of the size of a country’s economy.
GDP, according to Arnold (2008:152), is defined as the total market value of
products/services manufactured within the borders of a country. Mankiw (2009:517)
states that the GDP is calculated for the purpose of determining how effectively the
overall economy of a country is performing. Furthermore, Agarwal (2010:22) states
that GDP is calculated as the total value of products/services at constant prices.
Thus, the GDP is a process used to determine the health of an economy (Brentani
2004:106).
A country’s GDP figure reflects the economy’s production of products/services during
a specific time period, and in turn reflects the economy’s ability to satisfy the needs
and wants of a population (Mankiw & Taylor 2006:475). According to Grover (2013),
a high GDP figure indicates that the production of a country is high, which indicates
that customers have money to purchase products/services. Brentani (2004:106)
states that a high GDP figure provides evidence that the economy of a country is
growing rapidly, which in turn may be evident of businesses operating in that specific
economy have increased sales levels and profits. As customers purchase
products/services and increase sales levels in the country’s primary sectors, a
country’s GDP increases. As customers’ purchasing needs/behaviours in these
business sectors change, the GDP figure changes accordingly. (GPS-Business
2013).
Various primary sectors of the economy contribute to the GDP of South Africa.
These primary sectors include agriculture, mining, manufacturing, electricity and
water, construction, transport, storage and communication, finance, real estate and
business services, government services, personal services and wholesale, retail and
motor trade. The GDP of South Africa is made up of the combined performance of
these primary sectors (Media Club South Africa 2013). At the end of 2012, these

32
primary sectors contributed the following to the GDP of South Africa (South Africa
Info 2013):
• Agriculture: 2.2%
• Mining: 10%
• Manufacturing: 12.3%
• Electricity and water: 2.6%
• Construction: 3.9%
• Transport, storage and communication: 9%
• Finance, real estate and business services: 21.2%
• Government services: 16.7%
• Personal services: 5.9%
• Wholesale, retail and motor trade: 16.2%
From the above figures, it is evident that retailers contribute a significant part to
South Africa’s GDP. According to Londhe (2006:1.2), a retailer contributes largely to
the state of its country’s economy, and forms and shapes the “economic structure” of
the society. In recent years, the process of retailing has become a more specialised
activity.
Retailers are becoming more competitive as surviving in the business environment
depends on higher levels of sales compared to competitors. This has led to the
increased importance of retailers to the state of the economy. Retailers’
products/services and brand image influence the social lives of the society. The retail
industry is constantly showing signs of its increasing importance to the society and
economy. (Londhe 2006:1.2). Based on the above information, the wholesale, retail
and motor trade sector was the third highest contributor to the GDP of South Africa
in 2012. This provides evidence that the retail environment plays an important role in
the state of South Africa’s economy and GDP figure.
Employment offered by retailers
According to Dickinson (2013), the retail industry is a major source of employment
for countries. Dunne, Lusch and Carver (2011:4) state that approximately twenty
percent of the world’s labour force is working in the retail environment. The

33
significance of the retail industry is not only dependent on the contribution to a
country’s economy, but also by the level of employment that it generates (Pradhan
2009:8). The number of individuals employed in the retail industry is constantly
increasing, due to the changing business environment and the need for retailers to
expand and grow (Wallace 2001:890).
According to Kearney (2006:1), the fast pace at which the retail environment is
growing is causing retailers to enter new markets, to increase the size of the
customer base and to produce new products/services in new and innovative ways.
As retailers grow and expand, the size of the business increases accordingly. This
has led to the structure of retail businesses becoming increasingly complex (Krafft &
Mantrala 2010:67). Thus, for retailers to enter into new markets, to increase the size
of the customer base and to produce new ranges of products/services, new
employees will need to be employed to improve the skills and workload capabilities
of the workforce.
A country with a strong economy generally has a large degree of employment
opportunities. Countries with vast employment opportunities provide the population
members with the opportunity of earning salaries and improving their standard of
living. This, in turn, reduces the unemployment rate of that specific country. A strong
economy provides a favourable environment in which customers have, and are
willing to spend money and therefore opportunities arise for the creation of new
businesses, and already successful businesses can increase profits even more.
(Gerber, Delvare, Mabutho & Ntulini 2007:7; Simon 2010:17). A weak economy
results in people losing jobs, resulting in less favourable standards of living. The
South African unemployment rate is calculated to be twenty five percent, which is
relatively high compared to other countries. (Roos 2011; Trading Economics 2013).
In South Africa, Pick n Pay Holdings Limited, Woolworths Holdings Limited, Shoprite
Holdings Limited and The Spar Group Limited are four of the most well-known and
successful businesses operating in the retail industry (Sharedata 2013 a; Sharedata
2013 b). Pick n Pay Holdings Limited was listed on the Johannesburg Stock
Exchange (JSE) in 1968 and employs roughly 42 400 employees (Fastmoving 2013
a). In 1936, Woolworths Holdings Limited was listed on the JSE and has an
employment number of approximately 24 649 employees (Fastmoving 2013 b;
34
Thomas 2012). Shoprite Holdings Limited was listed on the JSE in 1986, and
employs roughly 100 000 employees (Fastmoving 2013 c; Shoprite 2013 d). The
Spar Group Limited was listed on the JSE in 2005, and has a total number of
approximately 2 698 employees (Fastmoving 2013 d). At the start of 2013, a total
number of 13.58 million people were employed in the South African workforce
(Department of Finance: Mpumalanga 2013).
It is evident that the retail environment is responsible for a large degree of the South
African workforce and employment. Furthermore, the South African retail
environment is constantly growing and expanding, and the total sales figure of
retailers will continue to grow (PriceWaterhouseCoopers 2012:1-2). Thus,
continuous growth and increases in sales figures and new business propositions in
the retail environment have the potential to increase employment opportunities in the
future.
Retailers’ contribution to sustainability
As mentioned, retailers are constantly growing and expanding. The retail
environment has developed into the heartbeat of modern day customers. (Federal
Ministry for the Environment, Nature Conservation and Nuclear Safety 2006:6). A
retailer serves as a link between the customer and manufacturer (Pradhan 2009:6),
a purchasing point (Burrow 2012:379) and a value creation and needs satisfying
process (Finne & Sivonen 2009:136). Thus, retailers’ regular customer interaction
provides these businesses with the important responsibility of making customers,
and the public, aware of sustainability and sustainable purchasing practices (Federal
Ministry for the Environment, Nature Conservation and Nuclear Safety 2006:6;
United Nations environment programme 2005:1-68).
Sustainability is defined as the process of satisfying a generations current needs and
wants without jeopardising future generations’ ability to satisfy their needs and wants
(Wankel & Stoner 2009:140). Business sustainability, according to Hume (2010:356),
is defined as a process of satisfying basic needs and wants while balancing time and
monetary expenses, avoiding resource depletion and thereby ensuring a resourceful
future for future generations. Hitchcock and Willard (2009:9) state that sustainability

35
is a process that requires individuals, households and businesses to live within the
limits of nature and consume natural resources sparingly. Sustainability is a process
focussed on developing a strong economy, building and improving the environment,
preserving natural resources and emphasising the importance of social development
(Hitchcock & Willard 2009:9).
Individuals, households and businesses depend largely on energy resources and
material resources extracted from the natural environment to fulfil basic needs and
wants. However, as these resources are used they are returned in a useless,
degraded form of waste to the ecosphere. (Rees & Wackernagel 2012:225).
According to Schneider, Kallis and Martinez-Alier (2010:516) the constant growth of
the economy is increasing environmental liabilities and is accelerating the rate at
which natural resources are being depleted and exhausted. Businesses unlimited
consumption of natural resources has the ability to lead to environmental, social and
economic deterioration (Hume 2010:356). Schneider et al. (2010:512) state that
economic growth and business efficiency requires new physical consumptions,
leading to resource depletion. The strong economic growth and increased demand
for products/services, according to Rees and Wackernagel (2012:225), has led to
businesses depending largely on natural resources, and has created the mindset of
nature being a provider of free natural goods. Sustainability and businesses
implementing sustainable practices have become a concern, due to the fast rate at
which natural resources are being exhausted (McVoy, Nelson, Krekeler, Kolb &
Gritsavage 2010:3).
Implementing sustainable practices and changing lifestyles to encourage and
contribute to sustainability is the responsibility of individuals, households and
businesses (Hume 2010:356). According to Ehrenfeld (2005:23), a retailer should
focus on incorporating sustainable practises and behaviour into its retailing activities.
A retailer should find ways of satisfying the needs and wants of customers, while
reducing the negative impact on the natural environment and resources. A retail
business has the important task of addressing the sustainability concern in such a
way that would not negatively affect current business processes and performance
(Wankel & Stoner 2009:140). Retailers should consider sustainable degrowth, a
process in which the business decreases production and consumption to increase

36
the well-being of populations and to improve ecological conditions (Schneider et al.
2010:512). For a retailer to successfully contribute to the state of sustainability, it
should focus on the three main areas of sustainability: namely, the economic,
environmental, social and sustainability aspects (Wu, Huang, Kuo & Wu 2010:520).
South African retailers are making valuable contributions to the state of sustainability
in the country, and are becoming a part of the global process of improving
sustainability and implementing sustainable practices (Environmental Affairs and
Tourism 2008:3). Retailers of South Africa are regularly reporting on their social,
economic and environmental performance, otherwise known as the Triple Bottom
Line (Rossouw 2010).
Woolworths Holdings Limited, in conjunction with the Marine Stewardship Council
(MSC), is allowing customers with the ability to be aware of all steps in the supply
chain of fish sold by the business. Woolworths is aware of the problem of over-
exploited fish species caused by illegal fishing practices, and has launched the
“hooked on sustainable fishing” campaign. This campaign makes customers aware
of the problem, and ensures customers that all fish-products purchased from
Woolworths Holdings Limited do not form part of the over-exploited fish stocks, and
were captured within the set laws and regulations. (SASSI 2010).
Pick n Pay Holdings Limited is focussed on ensuring a sustainable future and
reducing the negative impact of the business’s activities. Sustainability is an
important focus area of the business, and mutual sustainability goals are shared
among managers of all business departments. Pick n Pay Holdings Limited is
working closely with suppliers, to ensure that products delivered to the business
have not been gathered through illegal methods and the business refuses to sell
products facing a threat of extinction. (Pick n Pay 2010:18). Thus, it is clear that Pick
n Pay Holdings Limited is aware of the urgent need for sustainable development,
and is making valuable contributions to this initiative.
The Spar Group Limited is focussed on considering the impact of business decisions
and practices on the natural environment. The business considers the environment,
its shareholders and economic factors as the main contributors to sustainability. The
business has modified business strategies and practices in such a way to reduce its

37
environmental footprint, making customers aware of sustainable practices,
integrating with suppliers to reduce their environmental footprint and to raise
awareness and encourage sustainable practices throughout the business. (Spar
2013 c). It is evident, from the above information, that The Spar Group Limited is
aware of the problem of over-exploited natural resources, and is making a valuable
contribution to the state of sustainability in South Africa.
Shoprite Holdings Limited places high importance on the process of promoting
sustainability and sustainable development, and is focussed on helping the world’s
environment, economy and society, to ensure that current needs and wants are
satisfied to ensure a resourceful future. The business regularly sets new
sustainability goals and objectives, and reports on sustainable practices in annual
reports. The business participates in sustainable practices ensuring efficient use of
energy, waste production, recycling and reducing transport emissions. (Shoprite
Holdings Limited 2013 b). Thus, it is clear that Shoprite Holdings Limited is changing
and modifying business activities and mind-sets to be able to positively contribute to
sustainability.
Thus, it is evident from the above discussion that sustainability and the process of
adapting sustainable practices is a concept that is important to South African
retailers. These retail businesses have the potential to positively contribute to the
overall state of sustainability in South Africa.
Based on the above information it is evident that retailers play an integral part in
supply chain control, the economy, the state of a country’s GDP, employment and
sustainability.
2.4 DIFFERENT TYPES OF RETAILERS
According to Cant (2005:5), retailers can be categorised into many different types:
namely supermarkets, pharmacies, club stores, convenience stores, on-premise,
institutional accounts, vending and international retailers (Kotler & Armstrong
2010:389; Olson & López 2009:229). One way of further categorising retailers is by
focusing on the level of “purchase-experience control” and the amount of different
38
product categories that the retailer sells. The purchase-experience control level can
be defined as the amount of control that a retailer has on the customer purchasing
experience. When the purchase-experience control level is high, it indicates that the
retailer manages its business environment closely. Low and middle levelled
purchase-experience control levels indicate some customer purchasing variables
that are not managed by the retail business. (Cant 2005:5; Gupta & Randhawa
2008:23). Cant (2005:5), states that retailers with high purchase-experience control
levels usually operate in a store-based environment, while retailers with low to
moderate levels of purchase-experience control tend to operate in non-store based
environments. Thus, this provides evidence that all retailers operate in different
ways, and not all retailers make use of the same strategies and activities to achieve
goals and objectives. Store-based retailers and non-store based retailers will be
discussed in the following chapters.
Store-based retailers
A store-based or shop-based retailer, which is generally referred to as a brick and
mortar retailer, operates from a permanent store location (Dunne et al. 2011:230).
Brick and mortar retailers can further be identified through the type of products that
they sell, or the way in which they perform business activities. Store-based retailers
allow customers to compare products, to touch, feel and test products, to ask for
advice and to engage in a purchasing environment (Dent 2011:247). Store-based
retailers, unlike non-store based retailers, have to find ways to ensure that
customers remain interested and visit the store on a regular basis. Thus, store-based
retailers have to make sure that the actual store, the service provided and the
products distributed to customers are of high quality and that these are sufficient.
(Varley 2001:178). Customers are required to travel to the store to view and
purchase products/services (Ray & Walker 2004:1; Sullivan & Adcock 2002:212).
Retailers, operating in a store-based environment, should ensure that customers feel
the need to visit the store on a regular basis. To ensure that customers visit the shop
regularly, retailers have the difficult task of ensuring that the store, its services and
the products offered are of high quality (Pradhan 2006:60). According to Ray and
Walker (2004:1), store-based retailers are becoming aware of the benefits that the

39
Internet and social media tools, as used by non-store based retailers, can hold for
the business. This has resulted in store-based retailers developing different retail
forms to increase the target market size and to ensure growth of sales levels (Ray &
Walker 2004:1).
Non-store based retailers
Non-store based retailers provide customers with the opportunity of purchasing
products/services without having to visit the actual brick and mortar retailer. Retailers
that operate in a non-store based environment, through the use of the Internet, have
the ability to engage with customers at home, work or any other location without
having to interact personally. (Ray & Walker 2004:1).
Forms of non-store based retailers include automatic vending, direct retailing, direct
marketing and electronic marketing (Lamb, Hair & McDaniel 2011:442). Selling
products/services online and through social media tools, a form of electronic media,
can hold benefits for retailers. (Ståhlberg & Maila 2010:202). Non-store retailers,
compared to store-based retailers, are able to provide customers with higher levels
of convenience These increased levels of convenience is a result of customers being
able to view product/service offerings, communicate with the business and purchase
products/services via the Internet. Retailers are investing large amounts of money
and resources into developing and maintaining online purchasing systems (O’Cass &
Fenech 2003:82). Ray and Walker (2004:2), state that retailers making use of the
Internet to sell products/services and to interact with customers will experience the
greatest growth in years to come.
South African retailers are aware of the changing needs and wants of customers,
and are undergoing many changes to better satisfy these needs and wants.
2.5 RECENT DEVELOPMENTS IN THE SOUTH AFRICAN RETAIL ENVIRONMENT
South Africa is classified as being a developing country with emerging customer
markets (Karpilo 2010). In 2009, South Africa entered into an economic recession for
the first time since 1992 (Stiftung 2009:1). Stiftung (2009:1) states that the crisis of

40
the global economy negatively influenced major contributors to growth such as the
trade investment, mining and manufacturing industries.
According to Hirsch (2012:83), the National Consumer Protection Act, which came
into action before the worldwide economic recession which began in 2007 (Jones
2009:1), protected South African retailers. The retailers’ sales have decreased
slightly, but this can be due to other factors such as the unstable Rand (Boesler
2013), changing crude oil prices (Matsho 2010:1) and the state of the world
economy. Thus, the sales levels of South African retailers remained high, despite the
fact that the country faced a number of changes and problems. The future of South
African retail stores looks promising. The country has a healthy supply of mineral
resources and farmlands provide good quality food. (Hirsch 2012:83).
Cities of Africa, Asia and Europe were the top performers on the worldwide Cost of
Living survey (Mercer 2011), indicating that these cities are the world’s most
expensive cities for expatriates. Cost of living, according to Doyle (2013), is the costs
associated with upholding a standard of living. Sperling and Sander (2007:68) state
that the cost of living is one of the main elements determining the standard of living
and type of lifestyle of an individual and/or household. The cost of living generally
depends on the state of the specific country’s economy (Doyle 2013). Maciejewski
(2002:517) state that the cost of living is a result of economic growth, and is an
indication of welfare and quality of life. This survey measures the cost of living of
major cities. Rankings among the Cost of Living survey are determined by the
strength of a country’s currency and price movements over a twelve month period.
(Mercer 2011). In 2011, the cost of living for South African customers increased
dramatically when the price of most food products, electricity and water increased
substantially (Maimane 2012). Although the economic recession is something of the
past, countries are still feeling its impact and are recovering at a slow rate. The
economic recession resulted in customers being hesitant and cautious when
spending money, generally only spending money on necessities (Euromonitor
International 2012; Mohamed 2011).
In 2011, due to the increased costs of electricity and water supplies, the prices of
general commodities continued to rise, and customers were determined to find long-

41
term solutions to the high living costs. Customers started to make use of private
labelled products. At the time, private labelled products were lower priced than the
non-private labelled products. (Durham 2011). Woolworths, a well-known South
African retailer, was able to increase its sales of non-grocery products in 2011, as
this business made an attempt to provide customers with low priced private labelled
products. More South African retailers were expected to adopt this strategy, lowering
the price of private labelled products, to attract more customers. (Euromonitor
International 2012).
During the economic recession, Shoprite was able to take advantage of the situation
by lowering the prices of products. The low prices of Shoprite attracted many low-
and middle level income customers. Shoprite was able to constantly increase the
size of its customer base, due to the fact that the business made continuous
investments in the setting up of countrywide supply centres. This strategy was
beneficial to Shoprite as it increased sales in a time of decreasing customer
purchasing power. Less transport was needed, and this allowed Shoprite to lower its
operational costs, which in turn provided the business with the opportunity of
reducing the prices of products. This therefore provided Shoprite with an advantage
over its competitors. (Carte 2009; Euromonitor International 2012).
During 2011, the South African unemployment rate was at twenty five percent (Roos
2011) and there were concerns as to whether enough employment opportunities
would be created (The Citizen 2011). The South African economic growth would be
hindered if large portions of the population were unemployed, as a large degree of
human resources would be lost as a result of the incapability to employ, which could
have produced wealth and profits for the country (Muthethwa 2012:2). The
employment number in South African retailers also decreased in 2011, and more
retrenchments were expected for coming years. As a result of operational
requirements, Pick n Pay Holdings Limited retrenched more than 3 000 employees in
2011 (Sowetan 2011). ABSA, South Africa’s largest retailing bank, also had to
retrench employees in 2011 (SABC News 2012).
In 2011, store-based retailing businesses around the world were expected to
gradually make use of social media tools, as the use and efficiency of Internet

42
retailing was growing at a rapid rate (Turner 2012). The sales growth rate of store-
based retailers was to decrease, as more customers were to participate in online
retailing. Due to the cost of using the Internet becoming affordable, the use of social
media tools by both retailers and customers was expected to increase (Euromonitor
International 2012; Straubhaar, LaRose & Davenport 2012:252).
In 2012, the objectives of retailers were to attract new target markets and to improve
operational performance within existing markets, as well as enter new markets
(Stores 2012). Retailers learned that to be successful in emerging market
environments, market models and the products offered should be modified to such
an extent that they would continue to satisfy the changing needs and wants of
customers (Pike & Gibbs 2012).
The cost of living for South Africans remained high during 2012, as the cost of fuel,
electricity, food and public transport increased on a regular basis. This high cost of
living was believed to increase, as tax rates were to increase, e-tolling was to come
into effect (Labuschagne 2009:403) and the cost of water was to increase (Malmane
2012). The high cost of living means that individuals and households incur more
expenses, and thus need to spend more money on settling debt and purchasing
necessary products/services. This means that population members would have had
less money available for purchasing products/services other than necessities.
According to Cant (2005:7), South Africa’s retail environment is viewed as one of the
most interesting and exciting, due to the constant growth of the industry (Treasury
2012). According to Hirsh (2012:82), South Africa is seen as the new land of “milk
and honey”. South Africa’s retail environment holds potential and numerous
opportunities. For the year 2012, a sales growth rate of five percent was predicted
for formal South African retailers (Property 24 2012). Thus, increased sales levels
provided South African retailers with the ability to grow and expand even further.
In 2012, retailers made attempts to enter new markets, to increase the number of
channels in which they operate and to increase the use of technology and social
media. The data collected from technology and social media mediums was to be
used to understand customer preferences better. (Pike & Gibbs 2012). South African

43
customers no longer need to travel overseas to view the latest fashion trends,
technologies or motor vehicles. Hirsh (2012:82) states that this is no longer
necessary, as the South African retail environment is up to date compared to
countries around the world. The Internet has provided South Africa with this
opportunity.
In 2012, retailers were to be more “aggressive” in their use of online shopping and
social media. The growing use of online shopping and social media provided
retailers with an opportunity to make use of another channel for informing customers
of new product offerings and discounted prices (Cant & van Heerden 2010:397; Pike
& Gibbs 2012). Of all of the technology used by customers, the smartphone is the
most dominant and influential (Pike & Gibbs 2012). A smartphone, according to
Rittinghouse and Ransome (2010:236), is defined as a mobile device that provides
users with more accessories and features than a traditional mobile phone.
Furthermore, Yuan (2005:1) states that a smartphone is a mobile device that
provides users with computer functionalities. This knowledge provided retailers with
the opportunity of developing smartphone “applications” which could be used to
provide customers with new product information and a purchasing option, via mobile
phones (Pike & Gibbs 2012).
However, retailers should not overlook the influence that the actual store has on a
customer and its purchasing behaviour. The retail store is the “core of retail”. The
customer experience and journey remains the most important, and not the final
purchasing transaction (Pike & Gibbs 2012). Thus, the purchasing experience
created by a business, and the way in which customers are treated is more important
than selling the product/service.
Following these changes, the major South African retailers showed improvement in
the rankings of the global Top 250. The global Top 250 list shows/ranks the top 250
businesses in the world based on a number of factors contributing to business
success. Steinhoff International, a South African retailer focused on producing and
exporting furniture and household goods to Europe, entered the global Top 250 list
for the first time in 2012. In 2012, Shoprite Holdings Limited remained at the top of
the ranking list compared to eight Middle East and African retailers. Massmart

44
Holdings Limited, Pick n Pay Holdings Limited, The Spar Group Limited and
Steinhoff, which are all retailing businesses operating in South Africa, featured on
the global Top 250 ranking list. (Pike & Gibbs 2012).
Based on the above information, it is evident that change in the retail environment
occurs rapidly, and that South African retailers have managed to keep up to date
with changing customer preferences, strategies and technology. It is also evident
that the South African retail environment holds a lot of potential and various business
opportunities exist.
2.6 SOUTH AFRICAN RETAILERS
The retail environment is undergoing many changes (Dunne et al. 2011:4). Customer
purchasing behaviour is continuously influenced by the changing social and natural
environment (Ferrell & Hartline 2010:161). To remain successful and to ensure high
levels of sales, retailers have to regularly adapt and modify their strategies to fit the
ever changing needs and wants of customers (Londhe 2006:2.1).
South African retail businesses are divided into two main groups: namely, general-
and food- and drug retailers. Woolworths Holdings Limited, a South African general-
retailer, has the highest market capitalisation figure (R 54 856 million) compared to
other retailers in the general-retailer category (Sharedata 2013 b). Pick n Pay
Holdings Limited, Shoprite Holdings Limited and the Spar Group Limited, which are
categorised as food and drug retailers, also have very high market capitalisation
figures. These figures are R 8 752 million, R 99 282 million and R 19 508 million
respectively. (Sharedata 2013 a). Market capitalisation can be defined as the market
value of a business at a specific point in time. This figure is calculated by multiplying
the price of the business’s shares, by the number of shares outstanding (Horowitz
2010; Ranganatham & Madhumathi 2006:148). When referring to market
capitalisation figures, Pick n Pay Holdings Limited, Woolworths Holdings Limited,
Shoprite Holdings Limited and the Spar Group Limited can be classified as four of
South Africa’s leading, most successful and well-known retailers.

45
2.6.1Pick n Pay Holdings Limited
Pick n Pay (PnP) Holdings Limited is classified as one of the largest and most
popular retailers in South Africa. The business is consistently successful and is a
retailer of food, clothing and general merchandise. (Pick n Pay 2013 b). PnP was
established in 1967 by Raymond Ackerman. Ackerman bought four small store
outlets in the Western Cape, and as a family business sold food to the public. In
1968, the business was listed on the Johannesburg Stock Exchange as PnP Stores
Limited. During the year of 1969, PnP was listed in the Sunday Times Top 100
businesses. This was a result of the fast growth rate in popularity and the high
quality of products/services. (Fastmoving 2013 a). PnP has a little less than eight
hundred stores, which consist of Supermarkets, Hypermarkets and Family Stores
(Pick n Pay 2013 b).
In 2012, an average of more than fifty million customer transactions were processed
by PnP per month (Business Report 2012), and more than forty two thousand new
people were employed (Fastmoving 2013 a). At the end of the 2012 financial year,
the PnP Group generated an annual turnover of R55.3 billion (Fastmoving 2013 a).
PnP states that one of its main objectives is to be a worldwide competitor as the
business focusses on providing customers with high quality products/services at the
best prices. The business goes out of its way to satisfy special needs and wants of
customers, by offering additional services. (Fastmoving 2013 a). PnP is focussed on
staying up to date with new marketing techniques and creative ways of interacting
with customers and places high value on the use of social media tools to interact
with customers by providing new product/service information and information on
business activities.
In 2012, PnP strived to become the number one preferred retailer of choice across
South African customers (Fastmoving 2013 a). PnP has developed a program to
benefit its buyers, namely the Smart Shopper initiative. PnP states that the Smart
Shopper initiative earns customers rewards every time products/services are
purchased. When a product is bought from any PnP retail outlet, the customer shows
his/her Smart Shopper card to the sales person who swipes it, and the customer
then earns points. Vouchers are awarded which are then handed in at the till and the

46
corresponding amount is deducted from the total purchase. PnP provides customers
with additional benefits, such as earning bonus points on products that are on
promotion. PnP makes use of social media to further encourage customers to make
use of the Smart Shopper points system. The process is called Smart Shopper
Online, in which customers earn points when products are purchased on the PnP
website. (Pick n Pay 2013 c).
2.6.2 Woolworths Holdings Limited
Woolworths Holdings Limited is a business which holds investments, and is listed in
the top one hundred most successful businesses on the Johannesburg Stock
Exchange. The main objective of Woolworths is to provide retail and financial
services to middle and higher income customer groups. Woolworths operates mainly
in South Africa, but has retail outlets in Africa, New Zealand and Australia.
(Fastmoving 2013 b).
In 1931, Max Sonnenberg opened the doors of Woolworths Holdings Limited in Cape
Town (Luiz, Bowen & Beswick 2011:1). Sonnenberg believed that the success of any
business depended on the provision of high quality products to customers, at
relatively low prices. This belief has lead Woolworths to being a leading South
African retailing business. Woolworths’ strategy is focussed on excellence in four
main areas: namely, its customers, its operations, its people and its “Our Good
Journey” initiative. The Woolworths Good Journey initiative is focussed on increasing
the use of sustainable farming, reducing the businesses’ negative impact on water,
and energy, to increase social development and transformation (Money Web 2011;
Woolworths Holdings Limited 2012:5). The business believes that if these four
aspects are managed effectively, business success and performance will be ensured
(Fastmoving 2013 b).
The Group places high value and importance on the process of sustainability and
social responsibility (Money Web 2011; Woolworths Limited 2007:1-32).
Sustainability can be defined as the process in which the natural environment and its
resources are protected and maintained to ensure future social and economic
operations (Young 2008:1). Individuals and businesses should be able to satisfy

47
current needs and wants, without jeopardising future generations’ opportunities
(Environmental Protection Agency 2013). The Woolworths Group, its people,
suppliers, shareholders and customers, place high value on the process of ensuring
sustainability. The growth of the business is limited to the degree of responsible
retailing it can pursue. The Group have set goals and objectives regarding this
process, and the initiative is called “Our Good Journey”. The business has engaged
in sustainable farming, in which the Group attempts to reduce the negative impacts
that farming and fishing have on bio-diversity. The Group is focussed on reducing
the usage of electricity and water, and managing waste water effectively. The
business has made it clear that all packaging used by Woolworths will be recyclable
from 2015, and customers will be able to make use of recycling facilities at any
Woolworths outlet across the country (Fastmoving 2013 b). In 2012, the Woolworths
Group won the award for International Responsible Retailer of the Year. This award
recognises the commitment and efforts made by the Group in being sustainable and
for ensuring and participating in sustainable practices. This is the third time that
Woolworths has been awarded this prestigious award. (Woolworths 2013 b).
Woolworths has integrated the use of social media tools into its marketing
communication strategy (Dos Santos, Svensson & Padin 2013:104-108). The
business is constantly focussing on creating a multichannel retailing world. The
Group believes that its brand is positioned well enough for it to effectively use
multichannel retailing. The Group invested heavily in the improvement and
development of its online shopping website and intends to further invest and improve
on its online product offerings, the provision of new product information, services and
product delivery options. To improve customer convenience, the Group claims that it
will create “social commerce platforms” which will improve social media marketing
activities. (Fastmoving 2013 b; Woolworths Limited 2011).
2.6.3 The Spar Group Limited
The Spar Group Limited was established in 1932 by Adriaan van Well (Kwik
Convenience 2013). In English the Dutch-word “Spar” means fir tree, and hence the
symbol and logo of the business. Van Well had the idea of wholesalers and retailers
operating together and achieving more than the individual businesses could each

48
have achieved on their own. Spar’s wholesalers and retailers work in conjunction
and have grown strong partnerships and relationships. Since 1932, the business has
shown constant growth, and the business believes that continuous success is a
result of this Spar Partnership model. (Spar 2013 d).
Spar believes that the business’s development and success is a result of a group of
set core values and beliefs. The business states that this set of values has guided
daily activities since its establishment in 1932. This set of core values includes
providing each customer with fresh products, great service and also satisfying
individual needs and wants. The business is focussed on providing customers with
good quality products/services at respectable prices. (Spar 2013 e).
2.6.4 Shoprite Holdings Limited
According to the business, Shoprite Holdings Limited is Africa’s largest food retailer
(Moorad 2013; Shoprite Holdings Limited 2013 a). The business was established in
1979, when a chain of eight supermarkets was bought. In 1986 the business was
listed on the Johannesburg Stock Exchange for the first time (Cairns 2010). The
Corporate Research Foundation voted Shoprite Holdings Limited one of the 49 best
businesses to work for, as well as one of the 50 most promising businesses in South
Africa for 1998. (Shoprite Holdings Limited 2013 c). The business is made up of
more than 1 400 corporate outlets and 400 franchise outlets across 17 different
countries situated in Africa and the Indian Ocean Islands. The primary objective of
the business is to provide fresh food and household products to customers of any
level of income. (Shoprite Holdings Limited 2013 d).
Within their operations these South African retail businesses: Pick n Pay Holdings
Limited, Woolworths Holdings Limited, the Spar Group Limited and Shoprite
Holdings Limited, place high importance on creating and maintaining positive brand
images in the minds of their customers.

49
2.7 BRAND IMAGE IN PERSPECTIVE
Brand image is a term that refers to the overall impression that a retailer
communicates through business activities to customers and shareholders. The
image of a retailer’s brand is made up of opinions and attitudes towards
products/services of the public. (Franzen & Moriarty 2009:262; Glynn & Woodside
2009:214; Turner 2006:212-213). Furthermore, Kazmi (2008:299) states that brand
image is the sum total of impressions created in the minds of customers by the
business. Brand image, according to Kumar (2008:192), is defined as the way in
which customers perceive a brand and how customers associate with the brand.
Kumar (2008:192) states that a brand image is created by the business’s marketing
and brand-related activities.
Businesses have the objective of creating a desired self-image in the minds of
customers (Batra & Homer 2004:318). The brand image of a business can be
created and influenced by many factors (Londhe 2006:4.6). According to De Mooij
(2009:275), elements that influence the image of a brand include the product, price,
distribution and business-customer communication. Social media tools provide
businesses with the ability to improve the quality and regularity of customer
communication (Funk 2011:18), an element necessary for the creation of a positive
brand image. The image of a brand has the potential to influence the purchasing
behaviour of customers and create brand loyalty (Kapferer 2008:11; Michman,
Mazze & Greco 2003:28). According to Kapferer (2012:39), the image of a retailer ’s
brand is directly linked to high sales and the success of a business as a whole.
According to Shimp (2010:46), a positive brand image leads to brand loyalty. Brand
loyalty is essential for ensuring long-term business growth and success, as well as
high sales levels which ultimately creates higher profitability. Furthermore, a strong
positive retailer brand image will lead to a sustainable advantage over competitors. A
competitive advantage will have a positive effect on the sales and revenues of a
retailer, which will ultimately increase business performance (Kim, Fiore & Kim
2011:82). Thus, a positive brand image has a direct influence on the profitability and
performance of a retailer. Therefore, the possibility that a positive brand image may
lead to improved customer purchasing behaviour exists.

50
Based on the above information, brand image can therefore be defined as the
process of a retailer creating a desired impression of itself and its products/services
in the minds of customers, with the goal of ultimately influencing the purchasing
behaviour of customers. The importance of a positive brand image, social media for
creating a positive brand image and South African retailers and brand image are
discussed in the following sections.
Importance of a positive brand image
Customers form product/service associations in a number of different ways. The past
experiences that a customer has had with the retailer (Kincaid 2003:25) and word-of-
mouth communication from other customers is used by customers to form
associations with a particular brand (Xu 2005:170). A positive brand image can be
created and influenced by a number of different factors, some of which include
retailers’ marketing campaigns, packaging and websites (Donald & Gammack
2007:47; Tibbs 2010:53).
Customers make use of previous experiences and knowledge of the brand, as well
as their expectations of, attitudes towards the brand and satisfaction that the brand
has provided to create a certain perception of the brand in their minds. These
perceptions will have an influence on the purchasing behaviour of customers. (Chan-
Olmsted 2006:62; Kapferer 2012:35). It is therefore of utmost importance that the
perceptions and attitudes created by retailers in the minds of their customers is
positive.
Retailers that have been successful in creating positive brand images in the minds of
target audiences are able to sell products/services at higher prices than similar
products/services sold by competitors. A positive brand image can result in
customers paying high prices for preferred products/services, prices that are higher
than the actual value of a product/service, and prices that exceed the attributes of
those specific products/services (Bygrave & Zacharakis 2009:106). According to
Thomas (2013), a brand image is the element that distinguishes a retailer from its
competitors. A positive brand image allows a retailer to set high prices, and still be

51
able to achieve high sales levels. Thomas (2013), states that successful retailers
study the needs and wants of its customer group, and adapt their products/services
accordingly. Customers purchase products/services not only for the purpose that
they fulfil, but also for what the product/service means to the customer. (Gitman &
McDaniel 2008:295). According to Cress (2007:190), a retailer’s business activities
contribute to the creation of a brand image in the minds of customers.
A retailer should focus on ultimately creating a positive brand image by meeting the
expectations that customers have of the business’s products/services and all other
activities (Cress 2007:190).
A successful retail business is one that is able to satisfy the specific needs and
wants of customers on a regular basis. Retailers that are able to satisfy their
customers on a regular basis through products/services generally provide customers
with better quality, prices and service. A positive retailer brand image is created
when a customer is regularly provided with good quality products/services which
satisfy exact needs and wants. Ultimately, a positive brand image allows retailers to
be able to have an advantage over competitors. (Burrow 2012:99; Park, Jaworski &
MacInnis 1986:135).
According to De Mooij (2009:275), the marketing campaigns of a retailer play an
integral part in the creation of a desired brand image. A retailer’s marketing
campaign can take on many different forms and can include activities such as
organising an event, distributing printed advertisements to customers and the public
or direct marketing efforts (Strauss 2010:205). Marketing campaigns are an effective
way for businesses to remind customers of the brand and its products/services, and
have the ability to refresh or enhance the image of a brand in the minds of customers
(Lamb, Hair & McDaniel 2008:476; Smith 2008:120).
The packaging of a business’s products serves a number of purposes namely:
protecting the product from damages, the package identifies the business selling the
product and it markets and communicates the brand to customers (Pride & Ferrell
2012:411). The packaging that a retailer uses for its products/services is a visual
identity created by the business for its customers. The unique packaging used by a

52
retailer can be an effective way of allowing customers to recognise a particular
retailer’s product/services, and furthermore remind customers of the retailer’s values,
features and image. (Klimchuk & Krasovec 2012:48).
Social media for creating a positive brand image
According to Brown (2006:8), for any business to be successful and to have a
competitive advantage, marketing through the use of the Internet and social media
tools is a necessity. Brown (2006:8), states that the Internet provides a retailer with
the ability to communicate and interact with thousands of customers across the
world. The Internet, according to Lee (2001:37), provides a business with all of the
necessary material needed to create a desired brand image. A well designed,
effective website provides a retailer with the ability to create and enhance its brand
image. The image of a brand can be created and communicated more thoroughly
through the use of social media tools, such as Facebook and Twitter. The content
supplied on social media sites by both the business and customers has a major
influence on the image of a brand (Tuten 2008:164). According to Agichtein, Castillo,
Donato, Gionis and Mishne (2008:183), the content uploaded by social media users
can be viewed by thousands of other users. This provides evidence that a retailer is
able to communicate its business activities and product/service information to a large
group of users directly. This constant customer-retailer interaction allows a retailer to
establish a desired brand image in the minds of customers.
According to Gommans, Krishnan and Scheffold (2001:45) traditionally, brand loyalty
established through the creation of a positive brand image would have been
established by retailers through the use of mass media communication efforts. Social
media tools allow retailers to interact closely with customers and to provide more
personalised product/service information, which has a greater influence on the brand
image of retailers. (Gommans et al. 2001:45).

53
South African retailers and brand image
A recent study by Goldstruck and Wronski (2012) revealed that 95 percent of
successful South African retailers make use of some form of social media. However,
these retailers are uncertain as to whether the use of social media tools to interact
with customers positively influences the business. Of these retailers, 51 percent
believe that Facebook positively affect the business’s performance, and 33 percent
of retailers believe that efforts made towards the use of Twitter also benefit the
business. (Goldstruck & Wronski 2012).
At the start of 2013, it was evident that South African retailers were becoming more
aware of the benefits that the Internet can have on the success and performance of
the business, and retailers were starting to invest and make use of social media tools
to interact with customers. At the beginning of 2013, more than 6 000 000 South
Africans were registered on Facebook, and more than 1 000 000 were registered on
Twitter. (Meier 2013). This large number of South African Facebook and Twitter
users provided retailers with an opportunity to interact more closely with a specific
niche of customers.
In the past, marketing has been used to provide target markets with product/service
information, and to position the brand in the minds of customers (Jayachandran
2004:183). This was done by making use of traditional, non-interactive marketing
efforts. However, South African retailers have looked into the process of making use
of social media tools for marketing communication, and are continuously investing in
this new process. South African retailers have realised that by making use of social
media tools, a brand’s image can be more effectively created and altered, if
necessary, in the minds of its customers. (Cant & Van Heerden 2010:421).
According to Cant and Van Heerden (2010:422), social media tools have shortened
the distance between the seller and the buyer. Social media tools have created an
opportunity for South African retailers to stay up to date with the concerns of their
target market, as well as to be able to stay up to date with the business views and
discussions that customers have and participate in with one another. Once a retailer
is up to date with the profile of its customer, social media allow the business to

54
influence its customers’ image of the brand, through close interaction. Thus, efforts
made through the use of social media tools create a positive brand image in the
minds of customers, and could influence customers’ purchasing behaviour.
2.8 CUSTOMER PURCHASING BEHAVIOUR
What a customer buys, where a customer buys, how a customer buys and how often
a customer buys form a customer’s purchasing behaviour (Sarangapani 2009:54).
Customer purchasing behaviour, according to Cant (2010:102) and De Mooij
(2010:93), is the way in which individuals, groups and businesses choose, purchase,
use and dispose of products/services, ideas or experiences in order to satisfy unique
needs and wants. Bourlakis and Weightman (2004:42) state that customer
purchasing behaviour is defined as the study of all of the activities required to obtain,
purchase and dispose of products/services, including the decision making process
required in addition to these activities. Furthermore, Kengthon (2011:2) states that
customer purchasing behaviour involves the manner in which a customer makes
decisions on how to spend resources such as money, time and effort on
products/services. Thus, customer purchasing behaviour can be defined as all of the
activities undertaken by a customer to make the final purchasing decision. According
to Tyagi and Kumar (2004:55), customers progress through five different steps when
purchasing a product. These steps are categorised in the Five-stage model of
Customer purchasing behaviour.
2.8.1Five-stage model of Customer purchasing behaviour
Customers progress through the five-stage model of customer purchasing behaviour.
These stages are (a) problem recognition, (b) information search, (c) evaluation
alternatives, (d) purchasing decision and (e) post-purchase behaviour. (Tyagi &
Kumar 2004:55). Figure 2.1 represents the five stages through which customers
progress when purchasing a product/service.

55
Figure 2.1: Five-stage model of Customer purchasing behaviour
Source: Adapted from Tyagi and Kumar (2004:55).
(a) Problem Recognition
The problem recognition stage, according to Pride and Ferrell (2012:192), is defined
as the stage at which a customer recognises a difference between a preferred state
and the actual state. Furthermore, Jansen and Schuster (2011:3) state that the
during the problem recognition stage, a customer becomes aware of a certain need,
followed by a desire to satisfy this need with a particular product/service. According
to Moore, Petty, Palich and Longenecker (2008:360), before purchasing behaviour
can begin, the customer needs to recognise and be aware of the desire.
Tyagi and Kumar (2004:56) state that it is important for a marketer to be able to
identify specific conditions and situations that trigger a particular need in the minds of
customers. Marketers, according to Pride and Ferrell (2010:193), make use of sales
employees, advertising and packaging to activate a particular need in the minds of
customers. After a customer has become aware of the problem or desire for a
specific product/service, the information search stage follows.
(b) Information Search
The second stage in the customer purchasing behaviour model involves searching
for information. According to Moore et al. (2008:361), this stage involves customers
collecting and evaluating appropriate information. Furthermore, Jansen and Schuster
(2011:3) state that the information search stage involves the customer seeking
information to satisfy his/her specific need or want, which includes identifying the
correct product/service by considering factors such as product/service affordability
and the benefits that the specific product/service will hold for the customer.
Furthermore, Moore et al. (2008:361) state that the information search stage is used

56
by the customer to determine product/service characteristics and features to
ultimately compare product/services of different brands.
According to Tyagi and Kumar (2004:57), the major information sources used by
customers to make a purchasing decision include:
Personal sources: Customers value the opinions and comments made by
family, friends and acquaintances.
Commercial sources: Customers will consider advertising campaigns,
salespersons and packaging.
Public sources: Customers will consider mass media and customer rating
organisations.
Experiential sources: Customers will consider experiences such as handling,
examining and using the product/service.
(c) Evaluating Alternatives
Once a customer has collected all the necessary product/service information he/she
enters the stage in which the product/service alternatives will be evaluated and
analysed. In this stage, according to Canzer (2006:185), a customer will consider the
advantages and disadvantages, as well as the functional and psychological benefits
of each alternative. Furthermore, according to Boyett and Boyett (2003:173), in this
stage, customers will eliminate alternatives, there by narrowing down their various
purchasing options.
According to Chantilly (2010), a recent study revealed that 97% of customers make
use of online media tools to evaluate different products/services. Furthermore,
Chantilly (2010) states that the Internet has become a major source for customers
evaluating alternatives and making purchasing decisions.

57
According to Rao (2009:397), social factors influence each individual’s everyday life
and also influence his/her opinion of the products/services that he/she purchases.
Social factors include reference groups, family, social roles and responsibilities and
statuses and influence customer evaluation of products/services (Asch & Wolfe
2001:23; Doole & Lowe 2008:72).
According to (Cvijikj, Cetin, Karpischek & Michahelles 2010:23), customers are more
likely to accept and believe comments and recommendations, with regard to
products/services, made by family members and friends. Customers purchase
products/services not only to satisfy material needs and wants, but also to satisfy
social needs such as prestige and status desires. According to Laja (2013),
customers read product/service reviews and take these reviews into consideration
when purchasing products/services. Laja (2013) states that comments made by
other customers and critics influence the purchasing decisions made by customers.
Thus, social factors play an integral part in the process of a customer evaluating
products/services. Social factors, according to Lamb, Hair, McDaniel, Kapoor, Klaise
and Appleby (2009:33), influence the products that individuals purchase, the amount
of money they are willing to spend and the effectiveness of marketing promotions.
From the above information it is evident that customers consider a number of factors
to evaluate and compare different possible products/services to be purchased. The
purchasing decision stage follows the evaluating alternatives stage.
(d) Purchasing Decision
According to Shah and D’Souza (2009:171), after evaluating and considering various
product/service possibilities, the customer should be able to identify the
product/service that would best satisfy his/her need or want. During the purchasing
decision stage, according to Lantos (2011:69), the customer is able to decide on a
specific product/service from the alternatives. Furthermore, during the purchasing
decision stage, the customer should decide whether or not the identified
product/service should be purchased (Shah & D’Souza 2009:171).
Kotler (2000:100) states that during the purchasing decision stage a customer is
influenced by two factors: namely, the attitudes of others and unanticipated

58
situational factors. The attitudes of family members, friends and critics, according to
Kotler (2000:100), have the ability to influence a customer’s preferred
product/service. The degree to which a customer is influenced by other’s attitudes
depends largely on the intensity of these attitudes toward the specific
product/service, and the degree to which a customer accepts and considers these
attitudes of others (Kotler 2000:100). Unanticipated situational factors, such as job
loss, may influence a customer’s intention to purchase a specific product/service.
Furthermore, Pride and Ferrell (2014:216) state that in the purchasing decision
stage, the customer decides on a product/service to be purchased, and the actual
purchasing transaction takes place. Once the product/service has been purchased, a
customer will progress through the post-purchase behaviour stage.
(e) Post-Purchase Behaviour
According to Sharma and Singh (2006:127), after the final product/service has been
purchased, the customer will experience feelings of either satisfaction or
dissatisfaction. During the post-purchase behaviour stage, according to Kazmi
(2008:194), customers evaluate the purchased product/service based on pre-
purchase expectations (as formed by marketing tools), with regard to the level of
product/service performance.
According to Grabianowski (2013), when customer purchasing levels decrease, retail
sales levels are negatively affected. The retailing industry represents a large degree
of the economy. Many factors can influence customer purchasing behaviour namely:
interest rates, the price of housing, the levels of customer confidence, the
opportunity for borrowing money and tax rates. If unfavourable, these factors can
lead to customers spending less and rather saving money. (Lipsey & Chrystal
2007:397; Pettinger 2011). The business growth and operations of retailers depend
largely on the level of spending of customers (Dunne et al. 2011:4). Customer
behaviour changes as income levels, lifestyle and technological changes occur
(Londhe 2006:2.1). Reduced customer spending leads to increased business
pressure, as it becomes difficult to maintain high levels of sales. Competition among
retailers increases and retailers are required to improve products/services and

59
marketing techniques to ensure that customers remain loyal to that specific retailer.
(Groucutt, Leadley & Forsyth 2004:43). Arguably, the best technique to be used by
all different types of retailers to ensure customer loyalty is social media tools. Social
media tools allow constant interaction, which creates a platform for strong business-
customer relationships, which can ultimately assure high sales levels in times of
economic crises. (Miller 2012).
Businesses are constantly looking for new and innovative ways of attracting the
attention of customers, improving the brand image and increasing customer
purchasing. E-retailing is considered a new way of marketing and interacting with
customers.
2.8.2 E-retailing
Retailers can influence the purchasing behaviour of customers in a number of
different ways. Retailers have the opportunity of marketing and selling
products/services to customers in an online environment, a process referred to as e-
retailers. According to Trehan and Trehan (2007:107), as well as Dennis, Fenech
and Merrilees (2004:2), retailers advertising and selling products/services on the
Internet are referred to as e-retailers. E-retailing can be defined as a process in
which products/services are sold through the Internet or any other electronic or
online channel, for the use and consumption of final customers. E-retailing is not only
focussed on selling products/services. According to Londhe (2006:2.1) as well as
Hansen, Mowen and Guan (2009:57), ever since the introduction of the Internet,
customers’ preferred locations for purchasing products/services have changed, and
retailers are required to adapt to these changes.
E-retailing, also referred to as e-marketing (Sandhusen 2008:520), can also be used
provide information and to promote a brand and its image. E-retailing is a process
that is growing, and the use of this process by retailers is continuously increasing.
The number of Internet users is constantly increasing, and therefore the population
of online customers is growing. (Dennis et al. 2004:2; Kotler et al. 2010:519). Thus,
more Internet users provide retailers with the ability to interact with a wider range of
people, which has the ability to ultimately increase retailers’ online sales.

60
Benefits of e-retailing
The process of e-retailing, if used effectively, can provide a retailer with a number of
advantages and sales increasing opportunities (Dennis et al. 2004:3). Retailers used
to believe that the location of their business played an integral part to their success
and business performance. This belief resulted in the prices of well situated locations
being very high. Developments in the business environment have led to retailers
having the opportunity to sell products/services and earn profits via e-retailing,
similarly to preferred located retailers. (Dennis et al. 2004:3). This provides evidence
that the Internet, for many customers, has evolved into an online retail shop.
A small retail business making use of e-retailing has the ability to compete with large
retailers as it can reach larger groups of customers and can be open 24 hours per
day. For an online retailing business, e-retailing can lower its expenses, as sales
people and physical infrastructure is not needed. However, an online retailing
business will incur other expenses, such as Internet connection costs, product
packaging and delivery.
E-retailing provides a retailer with the opportunity to integrate with customer
relationship management systems. This process allows a business to interact with a
customer individually and to provide the customer with new product information. The
process of selling up and cross-selling becomes a reality and an opportunity when e-
retailing is effective and successful (Dennis et al. 2004:4). An important aspect of
effective customer relationship marketing is cross-selling. Cross-selling is a process
of being able to sell products/services to customers when customers are in the
process of purchasing other products. Cross-selling is a process that is focussed on
increasing the number of products/services sold to a specific customer. Increasing
the purchases that one customer makes, reduces the business’s operating costs of
having to acquire a new customer. Businesses that deliver a wide range of
products/services to customers believe that this increased interaction can strengthen
the business-customer relationship. (Dyché 2002:31; Kamakura, Wedel, De Rosa &
Mazzon 2003:46).

61
Dunne et al. (2011:6) state that e-retailing has not destroyed brick and mortar
retailers. According to Varley (2006:178), brick and mortar retailers have the ability to
create a shop environment that would ensure enthusiastic customers who would be
willing to buy products/services.
Therefore, despite the fact that e-retailing and social media tools provide retailers
with a number of advantages, retailers and customers are still unsure as to whether
the process should be made use of on a regular basis (Meyers & Gerstman
2001:32). Customers tend to be more cautious when purchasing products online, as
no evaluative criteria are available. This cautious approach to purchasing
products/services through the use of social media tools can be the result of a
number of different factors. According to Hoffenberg (2011:21), customers tend to be
cautious and sceptical when purchasing products/services online. These customers
fear that personal credit card details will be used for criminal purposes.
Strong customer relationships and trust needs to be created by a business before
products/services can be effectively sold via the use of social media tools.
Relationships reduce the feelings of risk when customers purchase
products/services online. The most important aspects for a business to focus on
when attempting to build customer relationships to enable online purchasing are to
build customer loyalty, to ensure customer satisfaction and to build trust (Hallam
2013; Procopio, Spielvogel & Thomson 2012:86).
For a retailing business to make use of social media tools to sell products/services
on a regular basis, the business should have the necessary human resources, which
can incur extra costs for the business. The design of the retailers’ official website and
social media tools should be attractive to the customer. Customers tend to distrust
websites that are designed poorly, as this creates doubt in the minds of customers
as to whether products/services should be purchased online. Forty two percent of
Internet users that purchase products/services online do not trust poorly designed
websites (Berardi, Katawazi & Bellinaso 2009:34). For a retailer to constantly update
its website and social media tools’ look and feel can be time consuming and costly.
Online purchasing from social media tools allows no customer services, as no sales
person is involved in the purchasing process. Customers have the responsibility of

62
doing their own research on the intended products/services to be purchased. The
process of selling a product online, e-selling, is less powerful and influential than a
face-to-face interactive selling process. Marketers participating in promotional or in-
store activities have the ability to interact with potential customers in a face-to-face
and personal environment. Marketers believe that these processes have a more
influential impact on customers. E-retailing allows a business to sell products abroad,
but this makes after-sales interaction, to ensure that customers are satisfied with the
purchase, difficult. (Dennis et al. 2004:3).
Businesses place high value in the process of selling products/services in an face-to-
face environment, as personal interaction allows a business to convince customers
of the benefits and value of its products, thereby eliminating any doubts that the
customer has about the specific product (Dennis et al. 2004:2; Roggio 2011).
An efficient e-retailing system requires a large investment. Set-up costs can be
expensive, and the complexity and efficiency of a website is determined by the
amount of money that a retailer is prepared to pay. According to Dennis et al.
(2004:2), many retailers are spending more money on on-going costs, than on
creating new and fresh websites. Legal problems can have an effect on the use of e-
retailing. Legal problems occur when a customer purchases a product from a retailer
based in a different country. The problems that may arise in this situation include
conflicting taxation and laws between the two countries.
Based on the above discussion it is evident that e-retailing is a form through which
customer purchasing can take place. Social media tools, such as the Official
websites, Facebook and Twitter, can be used by retailers to partake in the process of
e-retailing, and to influence the purchasing behaviour of customers.
Furthermore, according to Tyagi and Kumar (2004:5), customers progress through
five stages when purchasing a product/service. The five-stage model of customer
purchasing behaviour will be discussed.

63
2.9 SUMMARY
The main purpose of this chapter was to focus on the nature of retailers in South
Africa. The focus was on how important retailers are and how they contribute to the
economy of a country. For the purpose of this study, a retailer was defined as any
person or business that buys final products/services from wholesalers and sells to
the public, to fulfil customer needs and wants.
The first section introduced the chapter. Section two defined a retailer as a person or
business that buys final products/services from wholesalers and sell to the public, to
fulfil customer needs and wants. Retailer products are not purchased with the
purpose of being resold. Section three focussed on the importance of retailers, by
focussing on a retailer’s important role in supply chain control, the economy, GDP,
employment and sustainability. Section four discussed the different types of retailers:
namely, store-based retailers and non-store based retailers. This was followed by
section five, a discussion on the recent developments in the South African retail
environment. Section six focussed on four South African retailers, namely Pick n Pay
Holdings Limited, Woolworths Holdings Limited, the Spar Group Limited and
Shoprite Holdings Limited. Section seven defined brand image, discussed the
importance of a positive brand image to a business, the use of social media to create
a brand image and the way in which South African retailers maintain a positive brand
image. Section eight concluded the chapter and focussed on customer purchasing
behaviour. Customer purchasing behaviour was investigated by focussing on steps
influencing the customer purchasing behaviour of customers.
Chapter 3 will continue the literature review by discussing the different social media
tools.

64
CHAPTER 3 SOCIAL MEDIA AS A MARKETING COMMUNICATIONS TOOL
3.1 INTRODUCTION
Chapter 2 highlighted the retail environment and the importance of retailers. As this
study focusses on the influence of social media tools on the brand image of retailers
and the customer purchasing behaviour of customers, the objective of this chapter is
to investigate the concept of social media in detail.
The first section of this chapter defines marketing, the 4 P’s of marketing and the
benefits of marketing for a business. The second section will provide an in-depth
discussion of various marketing tools used by businesses, as well as the benefits of
each individual tool. The advertising tools to be discussed include newspaper
advertising, magazine advertising, broadcast advertising, outdoor advertising, direct
mail advertising and Internet advertising. Section three will define social media and
will provide a discussion on the marketing advantages that these social media tools
can hold for a business. Social media as a customer interaction tool for a business, a
tool for allowing communication among customers, a tool for a business to interact
with a large group of customers and social media as a marketing tool will be
discussed. Section four will identify the social media tools to be used in this study
(Official websites, Facebook and Twitter), and will discuss the manner in which four
South African retailers (Pick n Pay Holdings Limited, Woolworths Holdings Limited,
Spar Group Limited and Shoprite Holdings Limited) use these social media tools.
3.2 DEFINING MARKETING
At first, marketing was viewed simply as the process of distributing and exchanging
products/services for money (Talloo 2008:187). Marketing, according to Pride and
Ferrell (2010:4), is defined as all the processes necessary to create, distribute,
promote, and price products/services and ideas in order to satisfy the exchange
relationships among customer groups. Silk (2006:3) states that marketing entails all
the activities of a business used to create value to customers. The effectiveness of
marketing techniques, according to Donovan and Henley (2010:282), depends

65
largely on how a marketing manager focusses on the 4 P’s of marketing. The 4 P’s
of marketing: price, product, place and promotion, provide a marketing manager with
core factors to focus on when creating marketing strategies (Donovan & Henley
2010:282). The main objective of marketing, according to Cant, Strydom, Jooste and
du Plessis (2006:2), is to satisfy the exchange needs and wants between parties.
Furthermore, marketing can be defined as a process in which decisions, regarding
strategies to reach customer groups, are made in relation to the activities of a
business, with the main objective of ensuring satisfaction of the business’s target
market. Marketing is a process focussed on strategies relating to the product, place,
price and promotions of a business. Marketing, according to Cant et al. (2006:1), is
necessary for performance and achievement of goals and objectives of any
business, and includes survival, profitability and growth. Marketing plays an integral
part in a business’s operations, and consists of a number of different activities. The
process of marketing, according to Burrow (2012:4), is necessary to ensure retailer-,
manufacturer- and any other type of business’ success. Effective marketing
strategies are developed in such a way that they respond to the needs and wants of
customers, and result in satisfied customers. Satisfied customers, in turn, result in
customer loyalty. (Burrow 2012:4). Efficient marketing campaigns have the ability to
excite and inspire the minds, values and emotional states of a group of customers.
(Ellis, Fitchett, Higgins, Jack, Lim, Saren & Tadajewski 2011:5; Vargo & Lusch
2004:1).
Based on the above information, it is evident that marketing is a process that is
focussed on reaching a business’s target market and ensuring customer satisfaction
through the distribution of products/services and business information.
Marketing has the potential to influence an entire society. This is a result of the fact
that marketing strategies influence the decisions made by buyers and sellers. All
marketing decisions and strategies should be based on the needs, wants and
aspirations of a business’s target market (Hisrich 2000:1). However, before any
marketing strategies can be planned, marketers should identify the target market.
According to Pride and Ferrell (2012:40), selecting a target market is one of the most
important decisions that a business has to make. A target market can be defined as
the process in which marketers identify the needs, wants and characteristics of a

66
specific group of customers, and create marketing strategies to best satisfy these
customers (Abrams 2003:89; Pride & Ferrel 2012:40). Businesses identify a target
market and create strategies to ensure high levels of customer value and
satisfaction. The main objective of identifying target markets and creating marketing
strategies is to improve the performance of the business. (Slater, Hult & Olsen
2007:5).
One of the main objectives of marketing is to focus on the customer, to identify
needs and wants, and to produce products/services to satisfy specific customer
needs and wants. To achieve this objective, it is important for a business’s marketing
manager to focus on the 4 P’s of marketing. The 4 P’s of marketing are a strategy
used by marketers in which the focus is on areas and strategies such as the price,
place, product and promotion elements of a business’s products/services. The
marketing manager has the important task of combining the 4 P’s in such a way that
they will provide customers with high levels of satisfaction and increased business
performance (Jayachandran 2004:63). The marketing mix, also known as the 4P’s, is
also used to provide a specific target market with high levels of value. If the 4 P’s are
combined by a marketer for a specific target customer group, it is known as the
business’s marketing mix for those specific customers. (Bootwala, Lawrence & Mali
2009:3.1; Gitman, & McDaniel 2008:295). The 4 P’s are discussed in the following
sections.
Product strategy
A business’s product offering is generally the starting point of a marketing mix
strategy. Thus, a marketing mix strategy depends on the business’s products, and is
product orientated (Constantinides 2006:416). Lamb et al. (2008:47) state that it is
difficult to design and implement a place or promotion strategy before deciding on an
effective product strategy. A product is not defined only by the materials used to
produce it. The term “product” refers to the physical unit, as well as the packaging,
guarantee, brand name, after-sales services and added value that it delivers (Lamb
et al. 2008:47). A product’s packaging, brand name, logo, colour and the type of
customers purchasing the product influence possible customers’ perceptions of a
brand and the image (Loudon & Wrenn 2006:165). The attributes of a business’s

67
products, created by marketer efforts, have the potential to influence business
performance and to create a competitive advantage for a business (O’Cass & Julian
2003:3). According to Loudon and Wrenn (2006:165), a product can be defined as
the total amount “physiological, psychological, aesthetic, and spiritual satisfactions”
and rewards delivered by a business’s offering to the users.
For a retailer, the product strategy entails selecting the right group of products to
achieve the objectives of the business (Longenecker, Moore, Petty & Palich
2008:318). Marketers have the responsibility of making decisions regarding new or
existing business products. The product strategy requires marketers to make
decisions regarding a business’s product line, packaging and branding. (Loudon &
Wrenn 2006:165). Customers purchase products not only for what the product does,
but also for what the product means to the customer, the level of quality as well as
the image and status that the product creates for the customer. Marketers have the
responsibility of creating a product and product attributes that will best satisfy the
needs and wants of their customer target market.
Pricing strategy
The price of a product/service, according to Morschett, Schramm-Klein and Zentes
(2009:371), includes all of the monetary and non-monetary resources that an
individual needs to spend in order to acquire the benefits offered by the
product/service. The pricing strategy is a process of setting specific prices based on
the demand levels for specific products/services and the total costs of production
(Gitman & McDaniel 2008:295).
The pricing strategy for a retailer entails setting prices for final customers (Cheng,
Kotler & Lee 2011:22). Marketers have the responsibility of setting prices which will
attract customers to the business. In some cases, marketers have the freedom to
use creative pricing strategies, such as price cuts, to attract customers. The prices of
a business’s products/services tend to influence the way in which customers behave,
and have an influence on how customers perceive a business. (Gitman & McDaniel
2008:295; Ruskin-Brown 2006:168).

68
Place strategy
The place strategy, or distribution strategy, is the channel through which final
products flow to end customers (Gitman & McDaniel 2008:295). The place strategy,
according to Cheng et al. (2011:22), is focussed on identifying where and when
customers will be encouraged to purchase products/services associated with the
business. Thus, the place strategy is focussed on identifying distribution channels for
products/services to reach final customers.
For a retailer, the place strategy entails deciding on where and how products will be
presented to final customers (Cheng et al. 2011:22). Marketers have the
responsibility of making products/services available where and when they are
requested by customers. Deciding on the distribution channels for a business’
products/services is a great responsibility for marketers. Other responsibilities
include deciding on which stores will sell the business’s products, and how many
wholesalers and retailers will be involved in the selling of the business’s products in
a specific geographical area. According to Doole and Lowe (2008:346), it is
important for marketers to create an efficient supply chain to markets. These supply
chains should be effectively managed vertical integrated marketing systems which is
used in such a way to satisfy the needs and requirements of both manufacturers and
suppliers. (Doole & Lowe 2008:346; Gitman & McDaniel 2008:295; Lamb et al.
2008:45).
Promotion strategy
According to McDonald (2007:576) as well as Barker and Angelopulo (2006:140),
the promotion strategy is focussed on informing and persuading the business’s
customer group into purchasing products/services. According to Trehan and Trehan
(2011:32), the success of a business’s marketing strategy depends largely on how
promotional tools are integrated with the other elements of the marketing mix. The
promotion strategy is used to communicate business messages to a business’s
target audience. According to Gitman and McDaniel (2008:296), the promotion
strategy covers a number of different processes: namely, personal selling, public

69
relations, sales promotions and advertising. All of these activities are combined to
create a promotional strategy.
Personal selling is a form of marketing communication, which involves face-to-face
interaction with customers. Face-to-face selling, a two-way form of communication,
tends to be more persuasive than other media communication tools. Customers who
are engaged in face-to-face interactions tend to pay careful attention to the
product/service message that the seller is communicating. The product/service
message communicated by the marketer can be tailored to best suit the specific
customer. Face-to-face interaction results in immediate feedback, which provides
marketers with an answer as to whether the specific communication message is
efficient. Personal selling has the potential to build strong business/customer
relationships, as a retail store provides sellers with the opportunity of interacting with
customers personally, which is important for ensuring business success.
(Koekemoer 2004:222; McDonald 2007:577). Personal selling occurs, for example,
when an employee of a business is able to communicate and interact with customers
in a retail outlet.
Businesses are concerned about how they are perceived and viewed by their target
market. Therefore, businesses tend to spend large amounts of money on finding
ways to build and maintain a positive brand image in the minds of customers. The
public relations strategy is used by businesses to evaluate the attitudes of customers
towards the business, find ways in which the business can engage more regularly
with customers and generate ways in which the business can be understood and
accepted by the public. Public relations are a strategy responsible for communication
between the business and customers, suppliers, employees and the community.
Public relations efforts are used by marketers to inform the public and customers on
the business’s goals as well as to provide new business- and product/service
information to various stakeholders. (Lamb et al. 2011:246). Business
communication differs from public relations campaigns in that business
communication, according to Krizan, Merrier, Logan and Williams (2011:4), also
includes the process of creating a general understanding between members of a
business. Furthermore, Kushal (2011:2) states that business communication entails
the process of transferring information between different departments and people

70
within a business. Based on the definitions of public relations and business
communication, it is evident that public relations entails the external communication
between a business- and customers, while business communication includes a
business’s internal text communication.
According to Lee and Johnson (2005:341), sales promotion is a strategy used by
marketers to convince customers into purchasing a particular product/service. Sales
promotion is a strategy used by marketers to stimulate the purchasing behaviour of
customers and to increase the effectiveness of the seller. The process of sales
promotions is a short-term process that is generally used by marketers to generate
instant rises in the level of demand. Sales promotions generally take many different
forms, such as free samples, premiums, trade shows and coupons. Marketers can
use the sales promotion strategy to improve the efficiency of the other elements of
the promotional mix, such as advertising and personal selling. (Lamb et al.
2011:247).
Advertising is defined as paid-for impersonal business communication used to
influence customer behaviour (Yeshin 2006:1). According to Yoo, Donthu and Lee
(2000:199), advertising is an effective way of creating a positive brand image in the
minds of customers. The main objective of advertisers is to find ways of increasing
sales levels by attracting the attention of customers (Petley 2003:4). Trehan and
Trehan (2011:32) state that advertising is a form of non-personal target market
interaction. The product/service message is generally communicated through the
use of mass media tools. Many forms of advertising are used by marketers to gain
the attention of customers, to communicate new product/service information and to
increase levels of sales. Advertising tools include newspaper advertising, magazine
advertising, broadcast advertising, outdoor advertising, direct mail advertising and
Internet advertising. The different forms of advertising will be discussed in the
following section.
3.3 TYPES OF ADVERTISING TOOLS
Advertising tools are used by a business to deliver product/service messages to the
target market (Lamb et al. 2011:267). Businesses make use of advertising tools in

71
many different ways, and seek to achieve different results. Some advertising tools
are used by businesses to obtain immediate responses from customers, and other
tools are used to create a positive brand image in the minds of customers. (Trehan &
Trehan 2007:53). Advertising tools include all of the activities used by a business to
communicate an advertising message to customers. The advertising tool is defined
as the communication channels used to deliver an advertising message from the
sender to the receiver. For a business to achieve success through the use of
advertising tools, it is important to communicate the right message to the right people
at the right time. (Trehan & Trehan 2010:138). As mentioned, advertising tools
include newspaper advertising, magazine advertising, broadcast advertising, outdoor
advertising, direct mail advertising and Internet advertising.
3.3.1 Newspaper advertising
Various types of advertising tools exist, and it is therefore important for a business to
effectively combine these advertising tools to communicate its message best. Print
media, or press media, are traditional forms of advertising in which the business
message is communicated through the use of magazines and newspapers.
Newspapers, according to Shah and D’Souza (2009:680), are a trusted, accepted
and sought-after information source for customers. Dunne and Lusch (2008:370)
state that newspapers are the most regularly used form of retail advertising.
Newspapers are used by marketers to include local-, national- and classified
advertisements. People are in the right mental state to process new product/service
information and special product/service offerings when observing newspaper
advertisements. Newspapers provide flexibility to advertisers and they therefore
have the opportunity to advertise detailed information. (Chitty, Barker, Valos & Shimp
2012:195; Shimp 2010:362; Trehan & Trehan 2010:132). It is evident that
newspapers provide marketers with the ability to advertise detailed
products’/services’ information to a specific customer group.
3.3.2 Magazine advertising
Magazine advertising is a technique used by businesses to create and establish a

72
particular image or mood via the use of visual and verbal relationships and
interactions. Magazine advertisements provide advertisers with the unique
advantage of the advertised product demonstrating characteristics and results
through the use of images and words. (Blakeman 2005:128).
Marketers have the opportunity to make use of magazines to market
products/services. Magazines are an effective advertising tool, as magazine
advertisements are observed and experienced at a time when customers are
mentally free and relaxed. Magazine advertisements have the ability to reach
specific groups of audiences. Thus, magazines are highly selective. The age,
interests, income and occupation of a reader have an influence on the type of
magazine that will be purchased. (Lamb et al. 2011:503; Trehan & Trehan
2010:132). For example, sport enthusiasts would be interested in reading magazines
such as the “Sports Illustrated” or “Golfer’s Digest”. However, individuals interested
in the business and corporate world would be interested in reading magazines such
as “Forbes Africa” or “SA Franchise Warehouse” (Magazines 2013 a;
W3newspapers 2013). It is therefore important for a business to place the right
advertisements in the right magazines to be able to reach the desired customers.
3.3.3 Broadcast advertising
Broadcast advertising includes advertising efforts made by a business via television
and radio channels (Peacock, Purvis & Hazlett 2011:578; Shah & D’Souza
2009:727). According to Trehan and Trehan (2010:135), television and radio are the
most persuasive forms of broadcast advertising.
Television advertising
According to Trehan and Trehan (2010:133), television coverage is growing at a
rapid rate. Advertising via television is usually either in the form of sponsorship or
participation. Sponsorship television advertising is a process in which the advertiser
sponsors a particular television programme. Participation television advertising is a
process in which the advertiser pays the particular television programme to telecast
an advertisement during a commercial break. (Trehan & Trehan 2010:133).

73
Television advertising allows a marketer to communicate product/service information
through a combination of sight, sound and movement (Trehan & Trehan
2010:133).Television advertisements create long lasting impressions of the business
and products/services in the minds of customers (Sharma & Singh 2006:351). The
reason for customers remembering television advertisements for long periods of time
is that these advertisements make use of both audio and visual stimulating
techniques. Television advertisements have the ability to cover a wide geographical
range of customers with attractive marketing communication messages. (Trehan &
Trehan 2010:134). Product/service messages can be very persuasive, as television
advertising provides marketers with the ability to create attractive advertisements by
making use of music, images and effects (Sharma & Singh 2006:351). From the
above information it is evident that television advertising is an advertising technique
used by businesses to stimulate both sight and visual senses of customers.
Radio advertising
Radio advertising, according to Bootwala et al. (2007:3.31), is a form of word-of-
mouth advertising used for mass communication, which appeals to customers’
hearing through sound.
Radio advertising is a marketing tool used by businesses to communicate a
message to customers using the spoken word. Radio advertising allows businesses
the ability to cover a wide geographical range, and there are no high costs involved
in radio advertisements. Radio advertisements are focussed on using creative, easy
to remember messages. However, Koekemoer (2004:170) states that creating
creative radio advertising mediums is very challenging as radio advertising does not
allow for any visual stimulation. Creative radio advertisements are created by the
efficient use of slogans, music and sound effects (Trehan & Trehan 2007:102-103).
Bootwala et al. (2007:3.31) state that radio advertising is highly selective, flexible,
can cover a large geographical area and is low-cost. The main objective for
businesses making use of the radio as an advertising tool, according to Koekemoer
(2004:170), is to create visual images in the minds of customers through the use of
voices, music and sounds.

74
3.3.4 Outdoor advertising
Advertisers, according to Dahl (2007:166), have the luxury of deciding from among
numerous forms of outdoor advertising. Outdoor advertising, according to Dahl
(2007:166), is defined as an advertising form used to draw the attention of customers
in a matter of seconds, to persuade and to generate positive customer responses via
the use of creative content. Hisrich (2000:266) states that outdoor advertising is an
efficient method for ensuring and maintaining connotations between a business’s
product, package and brand name. Based on the above information, it is evident that
various forms of outdoor advertising can be used for advertising. Outdoor advertising
is used to capture customers’ attention and remind them of a brand’s
products/services.
Outdoor advertising is usually displayed near roadsides and generally takes the form
of billboards, signboards, paintings, posters or banners (Onkvisit & Shaw 2009:551).
Outdoor advertisements are an effective way of reminding passers-by of the brand
and their product/service message. The messages communicated by outdoor
advertising tools should be short, to the point, attractive and striking, and should be
placed in high-traffic zones. Customers that are exposed to a brand on a regular
basis, tend to become familiar with the brand, which ultimately influences brand
preference and customer purchasing. (Trehan & Trehan 2007:103-104).
3.3.5 Direct mail advertising
Direct mail, according to Lancaster and Reynolds (2002:104), is defined as an
advertising tool in which information or other promotional material is sent via a postal
service to selected customers. Tyagi and Kumar (2004:148) state that direct mail
advertising is defined as any mail used to advertise a business’s products/services
or activities. Direct advertising can be used in various forms: namely, post cards,
leaflets, booklets and catalogues. Advertising via the use of direct mail, according to
Tyagi and Kumar (2004:148), provides an advertiser with the ability to explain and
demonstrate the features of a product, and to explain the method of using the
products. Based on the above information, it is evident that direct mail is an

75
advertising method in which product/service information is sent to customers by the
business in the form of postage mail.
Direct mail is highly selective, as advertisers have the ability to choose customers
who are to receive direct mail (Ennew, Watkins & Wright 2012:185). Direct mail
communication techniques tend to be highly influential and informative. This form of
advertising allows advertisers to provide customers with detailed product/service
information at low costs. (Trehan & Trehan 2007:106-107). Thus, direct mail is an
efficient method for advertisers to communicate product/service information at a low
cost, to specifically selected customers.
3.3.6 Internet advertising
The Internet, according to Levine, Young and Baroudi (2007:9), is defined as the
largest computer network. The Internet is made up of a number of different networks,
known as Autonomous Systems, which are operated by Internet Service Providers,
businesses and universities (Feld, Perrei, Pohlmann & Schupp 2011:1). Weinberg
(2009:2), states that Tim Berners-Lee created the Internet and the World Wide Web.
This program was initially designed for the use by physicians, to use in their field of
work. According to Dalton (2001:7) the World Wide Web is commonly referred to as
the “information superhighway”, and is used by millions of computer-users
worldwide. The Internet connects people, allows users to upload any information,
and thereby makes large quantities of new and up to date news and information
available (Berners-Lee 2010:80-85). The Internet can be used by any computer
owner, and provides users with the opportunity to engage in communication
throughout the world. At first, the Internet was merely used to collect and distribute
information. (Weinberg 2009:2) However, the Internet is increasingly being used as a
communication tool, and this has changed the way in which individuals interact.
(Weinberg 2009:2). The Internet is becoming increasingly social, and Weinberg
(2009:2) states that it has grown into a “social web”, which connects users with
similar interests and requirements. The Internet allows users to be part of online
communities, in which the user has the ability to express opinions and beliefs, and
participate in debates and conversations at any point in time.

76
Internet advertising, according to Kotler and Armstrong (2010:518) as well as Trehan
and Trehan (2007:107), is the fastest growing form of direct marketing, and is also a
form of broadcast media. This is due to the rapid rate at which technological
advances occur. The growth of the use of the Internet and other technological
devices has influenced customers and marketers in various ways. The Internet is the
only form of advertising which allows a customer to read, watch, respond, save
information and buy products/services (Trehan and Trehan 2007:107). The Internet
has provided businesses and marketers with a new and creative way of interacting
with customers and building strong customer-business relationships. Thus, the
process of Internet advertising and online purchasing has been adopted by many
successful retailers (Kotler and Armstrong 2010:518-519).
Advertising on the Internet can be done in a number of different ways. World Wide
Web pages provide basic business- and product/service information. It also provides
customers with useful information regarding prices, places where products/services
are available and business contact details. (Trehan & Trehan 2007:108). Many
businesses’ Official websites, Facebook and Twitter pages offer customers the
opportunity of purchasing products online. According to Kotler and Armstrong
(2010:519), at the end of 2010, approximately 27 percent of all retail sales were
influenced by the Internet. This provides evidence that the Internet is growing as a
platform for businesses selling products/services.
Based on the above information, it is evident that the Internet provides retailers with
an opportunity of interacting with and selling products/services online to final
customers. The mediums used by retailers to engage with customers in an online
environment are called social media tools. Social media tools will be discussed in the
next section.
3.4 DEFINING SOCIAL MEDIA
Social media, according to Asur and Huberman (2010:492), is an online environment
in which users can create and upload, share and save content at an exceptional rate.
Social media, according to Brunty and Helenek (2012:20), is a medium that allows
users to create a self-profile within a website and to create a list of users to interact

77
and connect with. Social media users have the opportunity to engage in like-minded
online communities (Gleave, Welser, Lento & Smith 2009:2). Wankel, Marovich and
Stanaityte (2010:242) state that social media allows users, or groups of users, to
create, organise, edit, comment and share self-uploaded content, or content of other
users.
Social media can be used by a business to promote its official websites, advertise
products/services and to interact with customers in an online environment, through
the use of the Internet (Weinberg 2009:3). The process is also used by businesses
to communicate with customers, and allows businesses to engage with a new and
larger group of customers, which would not have been made available by making
use of traditional marketing tools. Social media focusses on a group of customers,
rather than on an individual. (Weinberg 2009:3). Based on the above information, for
the purpose of this study, social media is defined as an interactive utility that allows
users to interact with other parties in an online environment.
Social media is not a new topic contrary to belief. Social media originated in 1998,
when an online blogging community site was started, namely “Open Diary”. Users
were able to keep an online personal diary, which could have been kept private
between friends, or shown publically. (Facebook 2013 l). Since the availability and
affordability of high-speed Internet service improved, new social networking websites
such as Facebook and Twitter have been created.
According to Kaplan and Haenlein (2010:59), in 2008, more than 75 percent of all
people who made use of the Internet, were participating in some form of social
media. The growth of social media participation is not only limited to teenagers, as
many Generation X members are also engaging in the use of social media. The
introduction of social media has created a revolutionary new trend and this should be
the main focus point of any business (Kaplan & Haenlein 2010:59; Mabweazara,
Mudhai & Whittaker 2014:21). According to Kaplan and Haenlein (2010:64-65),
social media is a dynamic and fast-moving process. Something new and interesting
on social media has the potential to become old and out-of-date in an instant. This is
a result of the fast rate at which new content and information is uploaded and shared
78
by social media users. The advantages of use of social media tools are discussed in
the following section.
3.4.1 Advantages of social media
Due to the uncomplicated use-, the speed and reach of social media tools, it is
changing society and setting new trends in categories such as environmental
concerns, politics, technology, the entertainment industry and the business
environment (Asur & Huberman 2010:492). This is a result of the ease of
communication and availability of information created by social media tools. Mangold
and Faulds (2009:361), state that businesses have the opportunity to create their
own social media tools to interact with customers.
Social media tools provide a business with a number of different advantages namely,
regular customer interaction (Hansen, Shneiderman & Smith 2011:14), positive
word-of-mouth communication (Cornwall, Vang & Hartman 2013:186), the ability to
interact with a much larger audience to what traditional marketing tools allowed
(Folorunso 2013:193) and the ability to market products/services (Maya 2012:40).
Furthermore, social media provides customers with the ability to interact with other
customers, to share business experiences and product/service information.
Social media as a business-customer interaction tool
Social media, according to Hoffman and Fodor (2010:41), has changed the way in
which customers interact with a business. Furthermore, Mangold and Faulds
(2009:357-358) state that social media has changed the traditional strategies and
tools used by businesses to communicate with customers. According to Kaplan and
Haenlein (2010:59), social media has created a revolutionary new trend that should
be of interest to businesses intending to sell and interact with customers in an online
environment. The first role of social media, consistent with that of integrated
marketing communication strategies, is that it allows a business to interact with
customers. Social media tools, according to Harrison and Erpelding (2012:143), can
be used for sharing and discussing information. Furthermore, Harrison and Erpelding
(2012:143) state that social media tools allow individuals and businesses the

79
opportunity to interact regularly and instantaneously with other users. Social media
tools provide users with a two-way dialogue which allows for regular interaction and
communication. Official websites, according to Brown (2006:9), allow a business to
communicate product/service offerings and business information. Facebook,
according to O’Leary, Sheehan and Lentz (2011:55), provides a business and
customers with the opportunity to post content and to make comments. Vasan and
Przybylo (2013:277) state that Twitter allows users to “tweet”. “Tweet” is the term
used for businesses and users writing messages and commenting on other
messages. It is evident that social media tools allow for regular and frequent
business-customer communication and interaction.
Brink and Berndt (2004:27) state that every time a business interacts with a
customer, and the customer is satisfied more than with the previous business-
customer interaction, a customer’s loyalty towards the business will continue to
increase. Regular customer interaction, according to Schellong (2008:19), is an
essential element of the customer relationship management of a business. Winer
(2001:3) states that social media tools provide businesses with the opportunity to
build lasting business-customer relationships as social media provides businesses
with the ability to interact with customers regularly, to respond to customer requests
and to customise experiences. Social media provides businesses with the ability to
create and maintain long-term customer relationships (Winer 2001:3). Thus, social
media allows regular business-customer interaction, which is necessary for
establishing brand loyalty.
According to Brink and Berndt (2004:27), a business interacting with a customer to
determine satisfaction levels of a business’s products/services is necessary to be
aware and up to date with customer needs and wants. Any feedback, including
criticism, compliments or suggestions is welcome in social media (Mangold & Faulds
2009:357-358). This interaction allows a business with the opportunity to improve
products/services and to better satisfy customers (Brink & Berndt 2004:27).
Customers providing feedback feel a sense of belonging and of being part of a
community. These online communities allow a customer to be honest, to
communicate openly, and to engage with other customers (Mangold & Faulds

80
2009:357-358). Customers experience a feeling of engagement with a business
when it can provide after-sales feedback (Smith & Zook 2011:18).
Based on the above information, it is evident that social media tools allow a business
to interact with customers on a regular basis, which is necessary to establish strong
business-customer relationships.
Social media as a customer-customer interaction tool
The second role that social media plays in the promotion mix, which traditional media
does not allow, is that social media provides customers with the opportunity to
interact and communicate with one another (Smith & Zook 2011:10). According to
(Hallam 2013:xiii), the manner in which customers communicate with one another
with regard to an business’s brand and products/services is changing drastically, and
it is therefore of utmost importance that a business change the way in which it
communicates with customers accordingly. Social media tools, according to Jansen,
Zhang, Sobel and Chowdury (2009:2169), have the potential to largely impact word-
of-mouth branding, which in turn has the ability to positively influence business-
customer relationships.
The process of customers being able to communicate with one another is an addition
to the traditional form of word-of-mouth communication. Word-of-mouth, according to
Jansen et al. (2009:2169) involves the process of conveying information from one
individual to another. Furthermore, Malhotra (2010:99) states that word of mouth is a
one-to-one process that involves the exchange of product/service information from a
user to a non-user. A good customer experience is essential for ensuring long-term
customer loyalty to a business. A poor customer experience has the potential to
create bad word-of-mouth advertising, which can be harmful to a business’s sales
levels and performance. (Gamble, Tapp, Marsella & Stone 2007:60).
Social media word-of-mouth communication allows customers to express their
purchasing and product experiences with thousands of online customers (Mangold &
Faulds 2009:359). Customers making use of social media have become more
aware, are changing their way of gathering product/service and business

81
information, have changed opinions, attitudes and purchasing behaviours. Social
media has also provided customers with an ability to communicate after-sales
experiences to other parties, which were never possible using traditional forms of
marketing. Social media has influenced all forms of customer behaviour, and
provides customers with increased purchasing power. (Mangold & Faulds 2009:360).
Mangold and Faulds (2009:359), claim that social media as a marketing
communication tool combines integrated marketing communication tools, which
allows a business to communicate with customers through the creation of word-of-
mouth communication. Social media has increased the importance of ensuring
positive customer word-of-mouth communication (Hallam 2013:137). According to
Strauss and Frost (2009:332), it is important for businesses to regulate and monitor
the conversations in online communities, as customers are free to discuss the
business’s brand, its activities, the employees and the quality of customer service.
Mangold and Faulds (2009:361), state that a business should provide customers
with platforms for networking. Customers find pleasure in interacting with others
which have the same interests and needs. Businesses can accommodate these
groups by creating and setting up communities of these “like-minded” customers.
Each community can group customers with similar needs and values. According to
Mangold and Faulds (2009:357), social media has made it possible for a single
person to communicate a business’s product/service information to thousands of
other people. Social media allows users to discover new pieces of information and to
spread this across the website (Weinberg 2009:4). Thus, this social media user-
interaction has created a platform for businesses to create word-of-mouth
communication.
Mangold and Faulds (2009:358-359), state that social media plays an important part
in the promotion mix of a business. The use of social media has created an
environment in which a business can communicate with customers indirectly, as well
as an environment in which customers can communicate with other customers
directly. Marketing managers should be aware of the degree of power that customers
communicating with each other through social media has on the brand image of a
business. Marketers have less direct control over these online conversations (Ihlen,
Bartlett & May 2011:370). However, methods exist which can be used by businesses
to influence and guide these customer interactions and discussions. These

82
influencing and guiding techniques should be used to ensure that the word-of-mouth
advertising of customers is in line with the business’s goals and objectives (Mangold
& Faulds 2009:361).
Weinberg (2009:26), states that if social media marketing is used effectively, it can
have a profound influence on the awareness of a brand. A brand’s participation in
social media is directly correlated with customers’ reputation of the brand, as a
business is able to regularly interact with customers and to shape the image of the
brand in the minds of customers. Customers making use of social media to
communicate with businesses and customers, have the ability to speak both
positively and negatively of the brand and its products/services. This creates a new
opportunity for businesses, as they have the ability to turn social media customers
into brand ambassadors, customers who can promote and advertise the brand
positively online. An online brand ambassador can benefit a business’s social media
efforts immensely. Before a product/service is purchased, customers tend to do
online research to gather as much information as possible. Customers tend to be
sceptic about the product/service messages that businesses portray online, but are
prepared to listen and consider the opinions of friends and peers. Customer
interaction with peers and relatives provides feelings of trust. Brand ambassadors
are able to communicate and market a business’s products/services online positively
and effectively, as a brand ambassador is a mere customer and not part of the
business itself (Weinberg 2009:26-27). Therefore, potential customers often trust
these customers more easily.
Social media has reduced the degree of control which businesses have over the
availability of business information (Kaplan & Haenlein 2010:59-60). Kaplan and
Haenlein (2010:60), state that historically, a business had the ability to control and
regulate the information that was available of the business and its activities. Social
media has rendered a business the ability to control the time, content and frequency
of social media communication among customers. Thus, managers should ensure
that social media communication is in line with the business’s goals and objectives
(Weinberg 2009:4).
Traditional marketing activities provide businesses with high degrees of control and
regulation ability, as well as the ability to create a new-, or modify an existing brand

83
image (Pike 2008:200). Control and regulation can be accomplished through well
thought out press releases and announcements, as well as the actions of public
relations managers. Since the introduction of social media, this advantage has been
taken away from businesses, and businesses are viewed as mere observers of
social media actions among customers. Kaplan and Haenlein (2010:60) state that
social media has taken away the ability of businesses to change or adjust comments
made by customers.
Based on the above information, it is evident that social media communication and
activities are largely controlled by customers, rather than marketers (Hoffman &
Fodor 2010:43). A business has little control over the customer-customer
conversations regarding the business, but has the ability to positively influence
customers, which can ultimately lead to positive word-of-mouth communication
among customers.
The reach of social media
A business has the opportunity of making use of various social media tools, and if
used effectively, can increase the customer “reach” of the business (Kaplan &
Haenlein 2010:65). This means that if a business is to effectively use social media
tools, the opportunity arises to interact with a larger group of customers and potential
customers. A business has the ability to promote its websites, products/services and
interact with customers through the use of social media tools. The process is also
used to communicate with customers, and allows users to engage with a new and
larger group of customers, which would not have been made possible with the use of
traditional marketing tools. Social media focusses on a group of customers, rather
than on an individual (Weinberg 2009:3). Kaplan and Haenlein (2010:65), state that
a business should choose the right forms of social media that will most benefit the
business. The number of social media tools available are increasing daily, and it is
impossible for a business to operate each of these tools effectively (Kaplan &
Haenlein 2010:65).
The type of social media to be used by a business depends on the target market and
message that the business wants to communicate. Each type of social media tool

84
appeals to a different group of individuals and customers. A business should be able
to identify their target group, the type of social media used by that specific group,
and should participate in and be active in that social media tool. If more than one
social media tool is to be used, it is essential that all of the social media activities
pursued by the business are effectively aligned. It is important for a business to
ensure that all employees are able to access and use their social media tools, or a
group of employees should be employed with the primary objective of managing the
business’s social media tools. When one message is communicated by all social
media tools, customer confusion and uncertainty will be avoided. (Kaplan & Haenlein
2010:65). Businesses should also ensure that the media plan, which includes the
use of social media as well as traditional media, is integrated and aligned. According
to Kaplan and Haenlein (2010:65), a business’s image is created by the way it
utilises social and traditional media tools.
Social media as a marketing communication tool
Social media marketing, according to Tuten (2008:55), is a marketing technique
used that is based in and around online social communities. Thus, social media
marketing is a technique used to market products/services to online customers via
the use of social media tools. Furthermore, social media marketing is defined as a
promotional activity in which a business is able to target a group of customers
through social media tools in order to increase sales levels, establish brand loyalty or
achieve business goals and objectives (Wilson 2010).
Mangold and Faulds (2009:357) state that social media marketing has created a
number of new sources for collecting online product/service information. Social
media tools allow customers to share this product/service information among each
other in an online environment. This online information, created by a business, is
used by customers to educate one another of new products/services (Mangold &
Faulds 2009:357-358). Product/service information distributed by businesses and
collected by online customers is viewed as online marketing.
Despite the large number of advantages and opportunities that the use of social
media can provide a business, not all businesses are overly excited and eager to

85
make use of this strategy. Social media allows users to speak their minds, and to
provide honest opinions and experiences, sometimes in anonymous form. (Kaplan &
Haenlein 2010:59-60). According to Mangold and Faulds (2009:358), marketing
managers have little advice for effectively using social media as a marketing tool, as
a shortage of educational literature and other helpful sources exists. Thus, the
process of interactive social media marketing is yet to be the most favourable form of
marketing among businesses, and not all include it in their integrated marketing
communication strategy.
Based on the above information, it is evident that social media has provided
businesses with a new tool to interact and communicate with customers. Various
social media tools exist.
3.4.2 Social media tools
Social media has already been defined as a process which allows individuals and
businesses to interact with various parties in an online environment. The social
media websites such as the Official websites of businesses, Facebook and Twitter,
are constantly growing in popularity. Internet users are no longer viewing the Internet
as a one-way information medium, but are engaging, uploading and sharing data
and information (Harris & Rae 2009:24). Businesses have the opportunity to market
products/services, interact with customers, provide new product/service information
and sell products/services online (Weinberg 2009:3). Many social media tools exist
(Jain 2012; The eBusiness Knowledgebase 2013). However, for the purpose of this
study, the focus will be on the use of Official websites, Facebook and Twitter of retail
businesses.
(a) Official websites
A website, according to Dochartaigh (2007:73), is defined as all of the materials
used, and the manner in which these materials are arranged together, on the
Internet by an individual, project or business. A website is created by connecting a
number of web pages, online documents, into one online page (Coughlin-Smith
2007:9: Free servers 2013; Smith & Bebak 2007:10). Online documents can include
86
text, images, videos and any multimedia flies (NTC Hosting 2013). According to
Dalton (2002:5) a website consists of everything that the user can see, and
everything that makes that specific website work. Furthermore, Dalton (2002:6)
states that a website is a form of communication. The elements necessary for
website communication include the author (sender of the message), the message
and the audience (receiver of the message).
Fedorak (2009:49) states that the Internet has changed the way in which individuals,
customers and businesses communicate. The Internet has changed all traditional
ways of how businesses operate, interact with customers and sell products/services.
According to Tsai (2003:162), a business operating in an online environment has the
ability to create customer value and centricity, as the business is able to closely
interact with customers. Close and regular customer interaction is necessary for
establishing business-customer relationships, which in turn is required by a business
in order to best satisfy customer needs and wants. The Internet has influenced and
changed the business-customer relationships, as the Internet allows regular
interaction (Gao 2005:9). The potential and advantages that operating online offers
businesses will change and influence the design and infrastructure of businesses of
the future.
Mitchell (2006:65) states that for a business to sell products/services via an official
website, the business should list all of the products/services for sale, should provide
online shoppers with the ability to add selected products/services to an interactive
shopping cart and should ultimately provide online shoppers with a means to pay for
the selected products/services.
Kotler and Armstrong (2010:518), state that a large degree of business operations
take place via the Internet, which connects businesses to suppliers and customers.
According to Kauffman and Wang (2002:100), selling and buying via the Internet and
through business websites has increased drastically in recent years. This is due to
the convenience, the variety of products available and the ability to easily compare
products and their benefits. The Internet has transformed into a leading channel for
businesses to sell products/services to final customers. (Potts 2007:2).

87
For a business selling products/services online, it is important to place high
importance on the design and usability of their website as online customers have
little patience for ineffective websites (Potts 2007:2). It is clear that businesses and
retailers have realised the potential that the use of websites have for increasing
sales, and therefore success. The use of Official websites by Pick n Pay,
Woolworths, Spar and Shoprite are discussed in the following section.
Pick n Pay Official website
On PnP’s official website page, the business offers customers the luxury of
purchasing products in the comfort of their own homes. The PnP online shopping
campaign allows customers to buy any fresh produce or products, which will be
delivered to the customers’s houses. The PnP Fresh Living magazine can also be
bought online. The PnP online shopping store requires the customer to register on
the PnP website, to specify where ordered products should be delivered to and to
book a time at which products should be delivered. Once this has been done, the
customer will be able to purchase items on the PnP online shopping webpage.
Payments can be made by credit and debit card, and Smart Shopper cards can be
used to earn points. (Pick n Pay 2013 d).
The PnP online shopping store allows the user to search for products in a number of
different categories: namely, groceries, baby products, health and beauty products,
home and garden products, sport and leisure products, stationery as well as wine
and liquor. Featured products, which are the products advertised on the PnP online
shopping store, are the products for which prices have been reduced (Pick n Pay
2013 e).
In 2007, PnP entered a rebranding phase. New relationships were created by PnP to
assist in this phase. John Brown Media was provided with the objective of improving
business-customer interactions, increasing customer loyalty and increasing the
number of products purchased by customers. John Brown Media had the idea of
creating a monthly PnP magazine, and was recruited as the editor of PnP’s Fresh
Living magazines. (John Brown Media 2013).

88
As discussed earlier, magazines are highly selective, create brand awareness and
can be used to target specific groups of customers (Applegate 2005:98; O’Guinn,
Allen & Semenik 2011:469). The Fresh Living magazine has allowed PnP to
increase and improve the quality of engagement with customers. PnP admits that the
Fresh Living magazine has become an important part of their marketing strategy.
Since the release of Fresh Living, PnP has been able to see increases in the sales
levels of magazine-advertised products. The Fresh Living magazines are displayed
at high-traffic locations within PnP stores, and together with the magazine’s content
being informative and interesting, became the best-selling food and lifestyle
magazine in South Africa. This was achieved in a time span of only eight months.
(John Brown Media 2013).
The purpose of the magazine is to showcase the products that PnP has to offer to
customers. Fresh Living is a monthly food and lifestyle magazine that provides
readers with simple and new recipes and food ideas (Magazines 2013 b). The
magazine also offers possible solutions and advice on matters such as beauty,
health and fitness, children, gardening and pets. The social media marketing team
also plays a part in the Fresh Living campaign. The team has set up a blog site
which allows readers to interact with the editor of the PnP Fresh Living magazine,
ask questions and share experiences. The blog site also provides video clips, special
recipes and an “e-zine” version of the Fresh Living magazine. “E-zine” is an initiative
run by the social media team of PnP, and is an online version of the Fresh Living
magazine. The online version provides readers with a shortened preview version of
the following months’ Fresh Living magazine. The preview will provide readers with a
brief overview of that specific month’s featured recipes and tips, video clips, website
links and images. (Pick n Pay 2013 f).
Woolworths Official website
The official Woolworths website provides a user with a slideshow of images featuring
new products and special product offers. The website provides the user with a
number of links that can be followed to other pages on the Woolworths website:
namely, food and household, women, men, kids and baby, brands, beauty, home,
gifts, florist, father’s day and financial services. (Woolworths 2013 a). The website

89
allows users to go to the Woolworths Facebook and Twitter pages via the official
website.
The official Woolworths website provides followers with an opportunity of purchasing
flowers online. The initiative is called “Online Florist”, and enables customers to
order fresh flowers, which have been arranged by the Woolworths florists. When
flowers are ordered online, the flowers will be delivered, a greeting card with a
personalised message will be included and a seven-day quality guarantee will be
provided. (Woolworths 2013 c).
Spar Official website
The official Spar website is well-designed and updated on a regular basis. When the
website link is opened, the user is directed to the websites’ home page. The home
page provides users with the latest news regarding Spar business activities, new
recipe ideas, business stories, special product offers, as well as a number of links
that the user can follow. The page provides users with a number of different links,
including new recipe ideas, health tips, business stories, sporting events sponsored
by Spar, special product offers, competitions and an overview of the business and its
achievements. The website also provides users with ideas regarding food, health,
family, household tasks and the natural environment. (Spar 2013 f).
The website has a “Store Finder”, which can be used by customers to find the Spar
outlet closest to them. The business also provides users with a “Contact Us” link,
which enables customers to interact with the business. The customer is provided
with an online form to submit questions to the business. The business states that it
will answer all questions as soon as possible. (Spar 2013 f).
It is clear that Spar is focussed on interacting with customers through the business’s
official website. It is evident from the website that Spar is focussed on regular
customer interaction.

90
Shoprite Official website
The Shoprite official website displays an interactive slideshow that provides the user
with information on new products/services, special product offers and competitions.
The website contains a number of different links, which can either direct the user to
information about the business, products being offered, customer services, customer
centre information, community network information, promotions and a link that
enables users to contact the business directly.
(b) Facebook
Facebook, according to Heer (2008:174), McClard and Anderson (2008:10) as well
as Zarrella and Zarrella (2011:113) is defined as an online social utility used to
communicate more efficiently with friends, peers and customers. Valenzuela, Park
and Kee (2009:875) state that Facebook is one of the most popular social media
tools, and it influences the behaviours and attitudes of users, which in turn,
influences the users’ social capital. Social capital, according to Svendsen and
Svendsen (2009:266), is defined as the degree of social trust or trust in other people.
Facebook, according to Lenhart, Purcell, Smith and Zickuhr (2010:159) is the most
commonly used social media tool. According to Ellison, Steinfield and Lampe
(2007:1144), Facebook was established in 2004 by Mark Zuckerberg. Zuckerberg,
as a Harvard student studying towards a degree in psychology, created Facebook at
the age of 23. Facebook was initially created by Zuckerberg solely for the purpose of
interacting with friends in an online environment (Phillips 2007). This social media
tool grew and by 2007 Facebook had more than 21 million registered users. Ellison
et al. (2007:1144) state that the typical user operates on Facebook for approximately
20 minutes per day, to stay in touch with friends and relatives, to maintain
relationships and to socialise online.
Facebook is a social media tool which allows users to express themselves in an
online environment. Users are able to create a profile, to make friends, to make
comments and to view other Facebook users’ profile pages (Ellison et al.
2007:1143). Registered users are able to post new personal information, upload
images and videos, write messages to friends and provide links to external websites

91
for others to follow (Raacke & Bonds-Raacke 2008:170). Businesses have the
opportunity to create business Facebook profiles, and by doing so create the
opportunity to participate in e-retailing.
According to Ellison et al. (2007:1143), Facebook users have the opportunity to
engage in online communities. These communities are formed based on common
interests, needs, wants and characteristics. This allows users to get to know one
another better, as interaction among like-minded people is encouraged by Facebook.
According to Harris and Rae (2009:24), social media tools, such as Facebook, have
increased the success rates of marketing and the selling of products/services, the
building of positive brand images and the maintaining of strong customer
relationships. Harris and Rae (2009:24) state that social media tools, such as
Facebook, will have a major influence on future marketing strategies. It is therefore
of utmost importance that retailers make use of Facebook to interact with customers,
as it can have a positive influence on business performance in the long-run. The use
of Facebook by Pick n Pay, Woolworths, Spar and Shoprite are discussed in the
following section.
Pick n Pay Facebook page
Pick n Pay has created a Facebook page which enables customers to follow the
business interactively. The business states that their Facebook page is an online
community, and it provides customers with news, special product prices and recipes
on a daily basis. By “liking” the PnP Facebook page, the customer agrees to receive
business information and updates in the form of status updates, photo albums,
images and events that will be placed on the user’s Facebook Home Page
(Facebook 2013 b).
In July 2011, the PnP Facebook page was awarded the Face Twit’s SME-star of the
month award. This is awarded to the business which displayed social media
excellence in a specific month. The PnP Facebook page displays etiquette (The
Face Twit 2011). This is evident, as the employees responsible for operating the
page, do so effectively. The page responds quickly to any customer’s questions or
queries. The responses given by the employees managing the Facebook page are

92
to-the-point, polite and considerate. The Facebook page is used to follow up sales
and to generate customer feedback. (The Face Twit 2011). The business has
worked hard to “humanise” their brand, and the Facebook page is operated in such a
way that customers would experience feelings of respect and satisfaction towards
the business.
PnP’s Facebook page is active, and continuously draws the attention of followers
with new high quality content and graphics. The employees responsible for operating
PnP’s Facebook page makes sure that followers are constantly attracted to
something new on the Facebook page. (The Face Twit 2011). The page is used by
PnP to advertise and market special product deals, discounted offers and
competitions that the business is running. The followers of the PnP Facebook page
are protected by the National Consumer Protection Act, and PnP ensures followers
that the Facebook page will abide by the rules set out in this act. Followers are
provided with the opportunity to “dislike” the page, which will enable them to stop
receiving information or any other details from PnP, if they wish so (The Face Twit
2011).
The PnP marketing team launched a new marketing and social media campaign in
2012, namely Like Bike. PnP worked with SABC3’s Expresso presenter, Liezel van
der Westhuizen. PnP provided van der Westhuizen with a custom-built bicycle that
was “powered by social media”. (Aquaonline 2013).
The public was to be responsible for getting van der Westhuizen across the finish
line of the Cape Argus PnP cycle race. On the day of the race, each “Like” on the
PnP Facebook page enabled van der Westhuizen to ride ten metres. The public was
expected to log onto the PnP Facebook page, and to “like” it. Each “like” brought van
der Westhuizen closer to the finish line. Each individual was only allowed to “like” the
PnP Facebook page once. An Apple iPad was placed on the handlebars of van der
Westhuizen’s bicycle, which she used to take photos during the race. These photos
were placed on the PnP Facebook and Twitter page during the race. The “Like”
button allows users to share information, images and videos on Facebook
(Facebook Developers 2013). When a Facebook page is “liked”, it also enables the
users to interact with one another at any given time. PnP was encouraging social

93
interaction and engagement with customers and potential customers. When the PnP
Facebook page was “liked” on the race day, PnP were able to, from that day
onwards, communicate new product information and events to customers via
Facebook. (Arrive Alive 2012; Aquaonline 2013; Facebook Developers 2013; My
Digital Life 2012).
The reason for the PnP marketing team launching this campaign was to live up to
PnP’s culture of giving back to the community. By “liking” the PnP Facebook page on
race day, a contribution was made to the PnP Velokhaya Life Cycling Academy. This
initiative is focussed on providing previously disadvantaged children with bicycles.
Each year, a cycling team from the Velokhaya Life Cycling Academy takes part in
the Cape Argus PnP Race Tour. For every ten metres that van der Westhuizen
completed in the Cape Argus Race Tour of 2013, PnP donated a brand new bicycle
to the Velokhaya Life Cycling Academy. Van der Westhuizen completed the race
and eleven bicycles were donated to the Academy as the race distance was one
hundred and ten kilometres. (Aquaonline 2013; My Digital Life 2012; Youtube 2013).
During its Like Bike campaign in 2012, PnP placed a number of stationary bicycles in
and around the Knysna Oyster Festival venue. The public was encouraged to get
onto these stationary bicycles and to contribute to the number of kilometres
completed. For every one hundred kilometres completed, a brand new bicycle was
donated to the Knysna Sport School. (Pick n Pay 2012).
Each participant was allowed a three minute session on the stationary bicycle. In
these three minutes, the participant was to accumulate as many kilometres as
possible. After the completion of the three minutes, a picture and details of the
participant were taken. Participants were then encouraged to regularly consult the
PnP Facebook and Twitter page to see the Like Bike leader board. (Pick n Pay
2012).
The PnP Group used social media to encourage people, absent from the Knysna
Oyster Festival, to take part in the Like Bike campaign. On the PnP Facebook page,
a button “Add 100m Now”, could be clicked and a bicycle were to be donated for
every one hundred kilometres accumulated. (Pick n Pay 2012).
94
Woolworths Facebook page
The Woolworths Facebook page is a relevant way for the business to interact, inform
and connect with followers and customers (Facebook 2013 h). Woolworths states
that their Facebook page is an “online community”, and is a place for customers to
interact and celebrate the business. The business states that any feedback is
appreciated and that they strive to make followers feel comfortable. Woolworths
states the purpose of their Facebook page is to allow followers with the opportunity
of gathering product/service information, and interacting with the business on a
regular basis. (Facebook 2013 h).
On the Woolworths Facebook page, the business allows customer and follower
interaction. The business clearly states that if customers experience any problems,
or have any concerns, that the business will assist those customers individually and
any compliments, concerns and suggestions will be considered and responded to.
Woolworths provides users with online “General Enquiry” forms which can be
completed by users. These forms are sent to the relevant Woolworths employees,
and the business responds as soon as possible. (Facebook 2013 f). Thus, the
business uses Facebook, a social media tool, as a form of customer care and to
ensure customer satisfaction.
The Woolworths Facebook page also provides followers with external links, which
will direct users to YouTube. YouTube is a social media video communication
website in which users can upload video clips for viewing (Kitchener 2010:16-22).
The website allows any Internet user to view the uploaded videos. Any videos can be
uploaded from amateur homemade videos to professional clips. (Feldman 2007).
These links provide users with the opportunity to view short video clips, uploaded by
Woolworths. These videos include Woolworths’ sustainable farming practices, water
and waste management activities, social development activities and energy saving
processes. (Facebook 2013 g). From the above discussion it is clear that
Woolworths makes use of Facebook to make customers and followers aware of
business activities.

95
The Woolworths Facebook page also allows users to buy products online. All of the
clothing items offered in a Woolworths’ retail outlet are displayed on the Facebook
webpage in the form of images. Users are able to click on a specific clothing image,
to select a size and colour, and to pay online. Thereafter, the items purchased on the
Facebook webpage will be delivered to the customer’s place of residence.
(Facebook 2013 i).
The Woolworths Facebook page encourages followers to be socially responsible,
and to make a contribution to the fight against global warming. Woolworths provides
followers with the opportunity to work in conjunction with the business in reducing
rhino poaching, and to be part of the anti-poaching initiative. Customers are
encouraged, by Facebook advertisements, to apply for a MyPlanet card. The
MyPlanet card enables shoppers to support animal welfare or environmental
organisations, through shopping at Woolworths. When products are bought from
Woolworths, and the customer’s MyPlanet card is present, the customer will raise
valuable funds which will go towards helping the rhino anti-poaching initiative.
(Facebook 2013 j). The MyPlanet card can also be used by customers to make a
contribution to climate changing initiatives (Facebook 2013 k). It is evident that
Woolworths uses social media to make followers and customers aware of
environmental problems, and to encourage followers to positively contribute to
awareness campaigns.
Woolworths has introduced a new product, namely the Taste magazine, which can
be purchased by customers in-store or from the Woolworths website. A new Taste
magazine is printed every month, and includes articles on new Woolworths food
ideas, recipes and health tips. The magazine also includes articles of and interviews
with well-known South African chefs and celebrities. The official website allows
readers to subscribe to the magazine, to pay, and then to receive Taste magazines
every month throughout the year. The Taste magazine encourages readers to share
recipes. In the March 2013 Taste magazine edition, readers were encouraged to
share fifteen minute recipes, by posting them on the Woolworths Facebook page.
(Taste Magazine 2013). Based on the above information, Woolworths is making
efforts to integrate aspects of the Taste magazine with social media tools.
96
The Spar Facebook page
Spar has a Facebook page, namely MySpar. The page is “liked” by almost 150 000
Facebook users. On the MySpar Facebook page, the business states that through
the use of this social media tool the business is permanently online and ready to
interact with any customer. The business’s Facebook page is focussed on creating a
feeling of an “online community” in which users can socialise and interact with the
business informally. The MySpar Facebook page provides users with daily business
news and information, images, videos and allows customers to interact with one
another. (Facebook 2013 c; Facebook 2013 o).
The business encourages users to provide the business with new business ideas,
tips and suggestions. Users are also able to upload images and videos relevant to
Spar. The MySpar Facebook page is used by the business to provide users with
event information and is used as a platform for hosting competitions. The Facebook
page is then also used to inform the winners of competitions. (Facebook 2013 c;
Facebook 2013 o).
The MySpar Facebook page provides users with the ability to subscribe to the Spar
Savour Magazine. The Facebook page provides users with short video clips and
short abstracts from articles of the latest month’s magazine edition to draw the
attention of customers. The Facebook page has a link that users can follow to
subscribe to the Spar Savour Magazine online. (Facebook 2013 n).
On the MySpar Facebook page, the business has created a link “My Spar’s Notes”.
The business regularly informs users of important business activities in which the
business is engaging. The latest update made by the business is to inform users of
the business’s commitment to the Southern African Sustainable Seafood Initiative
(SASSI) program. The business made use of their Facebook page to inform users of
their relationship with this initiative. (Facebook 2013 m). It is clear that the business
uses Facebook to interact with customers and to create a positive brand image in the
minds of customers.

97
The Shoprite Facebook page
Shoprite is the business’s retailer responsible for selling fresh food and produce to
the public. Shoprite make use of a Facebook page to provide followers with the
business’s latest deals, new product information and lifestyle ideas. The Facebook
page is followed by more than 60 000 users. The business updates its Facebook
page on an hourly basis by posting new images, video clips and information on new
business activities. The business also uses Facebook to provide users with a brief
background and history of the business and achievements. (Facebook 2013 d;
Facebook 2013 p).
The Shoprite Facebook page has a YouTube link that users can follow. This link
directs users to video clips of a chef demonstrating ways of how Shoprite’s food and
vegetables can be best cooked and presented. The page provides a link that will
direct users to an entry form, that when completed, will provide users with monthly
information on promotional offers and business newsletters. (Facebook 2013 q). A
number of different links are placed on the Facebook page by the business, which
provides users with ways of experiencing the business in new and different ways.
This form of customer-business interaction has the potential to influence the brand
image in the minds of customers.
(c) Twitter
Twitter, a social media tool, was established in 2006 by Jack Dorsey and Biz Stone
(Mashable 2013). Twitter is a form of social media that connects its users to the
latest news, stories and information which is most important to the user (Brunty &
Helenek 2012:22; Dixon 2012:45; Twitter 2013 d). Furthermore, Kwak, Lee, Park
and Moon (2010:591) state that Twitter is a form of social media generally referred to
as a “microblogging service”. Twitter is an online service that allows users to connect
and communicate through quick, frequent messages and answers (Mojave
Interactive 2009). At the end of July 2009, Twitter had more than 41 million
registered users, and this number is continuously increasing.

98
Generally, Twitter users follow, or are followed by other users. “Follow” is a term
used by Twitter users and which means to receive regular updates made by the
party followed. Registered Twitter users have the ability to upload statuses,
commonly referred to as “tweets”. Twitter followers can view these tweets and have
the opportunity to comment on them. Celebrities, politicians, journalists and
businesses generally have a large number of followers. (Mashable 2013). Tweets
can be made on any topic, and can be a message of up to 140 characters (Kwak et
al. 2010:591). Registered users not only have the opportunity to tweet, but can also
upload images and videos (Twitter 2013 a). According to Kwak et al. (2010:591),
unlike other social media tools such as Facebook, a relationship between Twitter
followers needs no regular interaction. Followers receive all the messages, or
tweets, posted by the user being followed.
Twitter can be used as a medium for connecting businesses to customers.
Businesses have the luxury of communicating new product/service information with
regular- and potential customers, collecting market information as well as building
and maintaining strong customer- and supplier relationships. Twitter is an effective
way for businesses to create and uphold a positive brand image in the minds of
customers through processes of successful customer relationship management
activities. (Twitter 2013 a). Based on the above information, it is evident that Twitter
is a social media tool that holds potential for retailers.
The Pick n Pay Twitter page
The PnP Twitter page is used to provide followers with news and information on
special offers, new recipes, food ideas and other “fun” activities. The Twitter page
allows PnP to make comments to which users, following PnP on Twitter, are able to
view and respond to. PnP is also able to upload images, videos and other interactive
media items. The PnP Twitter page is followed by more than 17 000 Internet users
and customers. (Twitter 2013 a).
It is evident that PnP uses Twitter to interact with customers on a regular basis and
to create strong customer-business relationships.

99
The Woolworths Twitter page
The Woolworths Twitter page is followed by more than 50 000 customers and
Internet users. Woolworths makes use of its Twitter page to make followers and
customers aware of the fact that it is a passionate South African retailer, and is
committed to delivering customers with superior quality, style and exceptional value.
(Twitter 2013 c).
The Woolworths Twitter page is used to enable customer-business interaction, and
to thereby build strong customer-business relationships. The Twitter page allows
Woolworths to respond to questions asked by followers quickly, to provide new
product/service information and to upload images or video clips. Woolworths also
makes use of Twitter to announce special events that the business is hosting and to
inform customers on new business activities. (Twitter 2013 c).
The Spar Twitter page
Spar has a Twitter page which is followed by almost 500 customers on a daily basis.
The business uses the Twitter page to interact with their customer base on a regular
basis. The MySpar Twitter page provides a brief background of the business, an
overview and description of the business. The business regularly uploads new
images, videos, new product information and information on daily Spar business
activities. The pages’ “followers” are able to interact with the business, as questions
asked are answered swiftly by the business. (Twitter 2013 b).
It is evident that Spar has placed high importance on the use of Twitter as a social
media tool to interact with customers.
The Shoprite Twitter page
The Shoprite Twitter page is updated daily with new images, videos and comments
from the business. New business activities and projects are communicated to
100
followers through the use of regular Twitter updates. The business regularly and
swiftly answers questions or queries of customers regarding the business or
products/services. The Shoprite Twitter page is followed by more than 4 000
Shoprite customers per day. (Shoprite Holdings Limited 2013 e).
Links are uploaded by the business that enable followers to view all of the images
and videos that Shoprite has uploaded onto the Twitter page. (Shoprite Holdings
Limited 2013 d). These images and videos are generally of new product items and
offerings, as well as business activities that the business participates in. Through the
use of the Shoprite Twitter page, followers are able to stay up to date with the latest
Shoprite product/service offerings, Shoprite business activities and have the
business answer questions or queries.
From the above information, it is clear that Woolworths Holdings Limited, Pick n Pay
Holdings Limited, Shoprite Holdings Limited and the Spar Group Limited have placed
high importance on the use of social media tools for interacting with customers. The
businesses make use of a number of different social media tools: namely, official
websites, Facebook and Twitter, to sell products/services and to provide customers
with new product and business information. It is evident that these businesses are
focussed on strengthening customer relationships through the use of social media
tools, and by doing this creating a positive brand image in the minds of customers
and possibly increase customer purchasing behaviour.
From the above section, it is evident that successful South African retailers are
making use of social media tools as part of their marketing communication mix to
interact with customers. The success of retailers is dependent on the creation of a
positive brand image in the minds of customers. (Pike 2011:291), and the potential of
social media tools for creating a positive brand image should not be overlooked by
retailers (Dvorak 2010:92-93). Ultimately, the possible influence of social media tools
on brand image and positive- or increased customer purchasing behaviour should be
considered.

101
3.5 SUMMARY
In this chapter, the importance of retailers making use of social media tools for
interacting with customers was highlighted. It is evident that social media tools offer
retailers a number of advantages and benefits. However, the use of social media
tools by retailers can be challenging and a degree of uncertainty exists among
retailers as to how effective these tools are as part of a marketing communication
mix. One of the main causes of customers being hesitant to purchase
products/services online is the lack of trust in the business.
This chapter focussed on providing a discussion of the term marketing, as well as
the 4 P’s strategy of marketing. This was followed by a discussion on the different
types of advertising strategies used in marketing campaigns: namely, newspaper
advertising, magazine advertising, broadcast advertising, outdoor advertising, direct
mail advertising and Internet advertising. This was followed by a definition of the
term social media. The advantages of social media as a business-customer
interaction tool, a customer-customer interaction tool, a tool for increasing customer
reach and as a marketing tool were discussed.
Social media tools were examined and discussed in this chapter. For the purpose of
this study, the applicable social media tools were identified as the Official websites of
businesses, Facebook and Twitter. The chapter was concluded by a discussion on
the uses of these social media tools by the four South African retailers used in this
study namely, Pick n Pay, Woolworths, Spar and Shoprite.
Chapter 4 will explain the research methodology to be used for the empirical
investigation of the study.

102
CHAPTER 4 RESEARCH METHODOLOGY AND DESIGN
4.1 INTRODUCTION
Chapter 3 continued investigating the theoretical aspects linked to the primary
objective of this study. Chapter 3 defined the term marketing, as well as the 4 P’s
(product, pricing, place and promotion) strategy used by marketing managers. The
different forms of advertising were discussed. This was followed by a definition of
social media, as well as a discussion on social media as a customer interaction tool,
social media as a customer-customer interaction tool, social media for increasing the
number of customers communicated to and social media as a marketing tool. The
four South African retailers used in this study (Pick n Pay Holdings Limited,
Woolworths Holdings Limited, the Spar Group and Shoprite Holdings Limited), and
their use of social media tools (Official websites, Facebook and Twitter) were
examined and discussed.
As the primary objective of this study is to investigate the influence of social media
tools on the brand image of retailers and how it affects customer purchasing
behaviour, it is important to focus on the empirical investigation used to achieve this
primary objective. Chapter 4 provides a description of the research methodology and
design used in this study.
Chapter 4 will provide an overview of the research paradigm used for this study, and
will be followed by a discussion regarding the constructed hypothetical model with
hypotheses. The next section will provide a discussion regarding the manner in
which data was collected by focussing on the population studied, the sampling
technique and measuring instrument used. This will be followed by a complete
discussion regarding the data analysis procedure used. This section will be followed
by a discussion regarding the descriptive statistics used to summarise the sample
data. An explanation of the statistical analyses performed to test the validity and
reliability of the measuring instrument will be presented. To determine correlations
between different variables used for this study, Pearson’s Product Moment
Correlations will be determined. This will be followed by a discussion on the

103
statistical technique of multiple regressions used to test the hypothetical model.
Chapter 4 will conclude with a discussion on the use of a t-test and Analysis of
Variance (ANOVA) tests calculated to determine whether or not the perceptions of
respondents were influenced by any demographic variables.
4.2 RESEARCH PARADIGM AND METHOD
A research paradigm can broadly be defined as the method used to conduct
research (Kasi 2009:95). Kumar (2010:13) states that there are two main research
paradigms, namely the positivistic and phenomenological research paradigms. The
positivistic research paradigm is beneficial to researchers to whom the world can be
defined, understood, fixed, proved, explored and explained. Positivistic researchers
are focused on making casual and informal statements. Thus, the focus in positivistic
research studies is generally more focused on providing explanations, rather than
determining clear understandings. (Kasi 2009:95). Positivistic researchers seek to
objectively prove or falsify social science research efforts through the use of
scientific methods (Johnson & Onwuegbuzie 2004:15). A positivistic research
paradigm collects data through the use of quantitative, structured measurements
(Kumar 2005:12). According to Andrews, Mason and Silk (2005:6), the positivistic
research paradigm makes use of standardised and formally recognised measures to
analyse collected data. Thus, the positivistic research paradigm attempts to discover
causes and facts of certain events or occurrences. It attempts to state the logic and
prove the truth through the testing of hypotheses. The positivistic research paradigm
can also be referred to as quantitative, empiricism or experimental research
paradigms (Fitzpatrick & Kazer 2011). The positivistic research paradigm generates
quantitative data collected from large samples. The positivistic research approach is
generally considered to produce low validity and high reliability. (Ponterotto
2005:128; Wilson 2010:10; Woodside 2010:47).
Mertens (2009:235) states that the phenomenological research paradigm is focussed
on highlighting the subjective experience of individuals, and attempts to describe the
point of view of the researched individual. According to Kutlu (2007:62), a
phenomenological research study’s reality is completely subjective and open to
discussion. Birkholz (2004:21) states that the phenomenological research paradigm

104
uses qualitative data and is a paradigm commonly used by social researchers.
Buchner (2008:75) states that phenomenological researchers are focussed on
studying and investigating everyday life events from an internal perspective: the way
in which the studied individual experiences these events. Furthermore, Buchner
(2008:75) states that a phenomenological research approach is advantageous when
a new or fresh consideration of a topic or event is required.
Each research paradigm offers a number of different research methods to be used.
Wiid and Diggines (2009:86) clarify that quantitative research involves the gathering
of primary data from large respondent groups and samples. Quantitative research
believes that social views should serve as entities (Johnson & Onwuegbuzie
2004:14). Quantitative research makes use of numbers, measurements and
mathematical calculations to resolve issues. Quantitative research makes use of a
structured approach to analyse collected data, and this approach enables large
sample groups to be researched. Methods used in quantitative research make use of
numerical and statistical measuring techniques to interpret findings, while qualitative
research methods use descriptions to interpret incidents or occurrences (Cassell &
Symon 2004:48; Wild & Diggines 2009:86). Daymon and Holloway (2011:210) state
that quantitative research methods for collecting data are strict and rigid compared to
qualitative research methods.
Quantitative methods seek to achieve research objectives through the use of
empirical assessments. These empirical research methods make use of numerical
and analytical procedures (Zikmund & Babin 2013:99). However, qualitative research
methods are focussed on achieving objectives through techniques used to support
interpretations. Qualitative research methods achieve objectives through techniques
and methods other than numerical methods (Ritchie & Lewis 2003:3). According to
Zikmund and Babin (2013:99), quantitative research methods have the ability to
achieve certain outcomes and objectives which qualitative research methods cannot,
and vice versa.
Johnson and Christensen (2010:34-35), provide a number of differences in
characteristics with regard to quantitative and qualitative research methods.

105
Scientific method: in quantitative research methods, the researcher tests the
hypotheses with data. In qualitative research methods, the researcher builds and
produces hypotheses and knowledge from data collected through research and
investigation.
Data collection: Quantitative research methods collect quantitative data
through the use of accurate measurements and structured data collection tools.
Qualitative research methods collect qualitative data through less structured
collection tools such as interviews.
Data analysis: Quantitative research methods attempt to find statistical and
numerical relationships among variables. Qualitative research methods make use of
descriptive data to identify patterns and unique features to find differences and
variations.
Nature of observation: Quantitative research methods study behaviour under
monitored and controlled circumstances. Qualitative research methods study
individuals and groups in natural environments.
Results: Quantitative research methods result in generalisable findings and
results. Qualitative research methods generate particular findings and results from
the perspective of an insider.
Qualitative research is appropriate new theory development and generation, while
quantitative research is more useful for testing the reliability and accurateness of
theories (Patton 2002:125). Quantitative research methods seek to find regularity
and frequency of a specific occurrence, to find and understand relationships between
measured variables and to make generalities about results generated through
research (Longino 2009:82; Srivastava & Rego 2011:2.14).
For the purpose of this study, a positivist research paradigm was used as statistics
and quantitative analyses were used. As this study attempts to investigate the
influence of social media tools on the brand image of retailers, and the effect that

106
brand image has on the purchasing behaviour of customers, it has been decided that
the quantitative research method will be used for this study. A large sample will be
identified for the empirical investigation, and relationships among variables will be
determined. The quantitative research method is appropriate for this study as
hypotheses are to be tested.
Despite the fact that careful consideration needs to be given to the research
paradigm and research methods when planning a research project, it is important to
decide on the information to be collected for the research (Peck, Olsen & Devore
2011:6). Both new information and existing data can be used for research, and these
are generally referred to as primary and secondary data respectively.
According to Morgan and Summers (2005:109), secondary data can be defined as
data already collected and used as part of another research project. Secondary data
offers the advantage of gathering and analysing data quickly. Secondary data can be
collected swiftly, and is more cost-effective than primary data collection methods, as
secondary data can be obtained from sources such as newspapers, journals, books
and the Internet (Pawar 2004:47). Secondary data collection methods do not require
the same high skill levels necessary for primary data collection methods (Morgan &
Summers 2005:110). For the purpose of this study, a variety of databases were
used, such as EBSCO host and Emerald to gather secondary data. The library
facilities of the Nelson Mandela Metropolitan University were used to gather both
national and international data. Secondary data was sourced to perform the literature
overview on topics relating to the retail environment and social media tools.
According to Morgan and Summers (2005:109), primary data is data developed or
generated by the researcher for the purpose of answering the research question.
Primary data can be collected in a number of different ways, namely: by means of
questionnaires, structured interviews or personal observations. This study collected
primary data through distributing questionnaires to customers of retailers to gather
data on social media tools, retailer brand image and customer purchasing behaviour.
The data collection methods will be explained later in the chapter.

107
According to Struwig and Stead (2001:80-81), secondary data may be easier to
access than primary data. However, the possibility exists that secondary data can be
outdated, and that the data could have been acquired for a different purpose than
that of the researcher. This provides evidence that it is important to combine
secondary and primary data. As mentioned, this study made use of secondary and
primary data. The secondary data was used to conduct the literature review, and the
primary data was collected through the use of questionnaires. The primary data
collected through the use of questionnaires were used to test the hypothetical
relationships in this study.
4.3 HYPOTHETICAL MODEL
For the purpose of this study, a hypothetical model was used to investigate the
influence of social media tools on the brand image of retailers, and the effect brand
image has on the purchasing behaviour of customers. To ensure efficient
functionality, Figure 1.1 is duplicated as Figure 4.1.
Figure 4.1: Hypothetical model for the study
Brand image
H1
H2
H3
H4
Official
websites
Customer
purchasing
behaviour
As evident in Figure 4.1, the following hypotheses were created to test the
relationships in the proposed hypothetical model:

108
H1: There is a significant positive relationship between Official websites and Brand
image.
H2: There is a significant positive relationship between Facebook and Brand image.
H3: There is a significant positive relationship between Twitter and Brand image.
H4: There is a significant positive relationship between Brand image and Customer
purchasing behaviour.
The definitions of the independent, intervening and dependent variables generated
and used for this study will be presented in Table 4.1. These definitions are derived
from existing literature sources which was also used in the literature chapters two
and three.

109
Table 4.1: Independent, intervening and dependent variables investigating the influence of
social media tools and brand image on purchasing behaviour
Independent variables Source Number of
Statements
Official websites
A website is defined as all of the materials used, and the
manner in which these materials are arranged together on the
Internet by an individual, project or business. A website is
created by connecting a number of web pages and online
documents into one online page
Dochartaigh 2007;
Coughlin-Smith 2007;
Free servers 2013;
Smith & Bebak 2007 9
Facebook is a social utility that can be used to interact with
friends, workers and family in an online environment.
Heer 2008; McClard
& Anderson 2008;
Zarrella & Zarrella
2011
12
Twitter is a form of social media that connects users to the
latest news, stories and information which is most important
to the user.
Brunty & Helenek
2012; Dixon 2012;
Twitter 2013 d
10
Intervening variable Source Number of
Statements
Brand image
Brand image is a term that refers to the overall impression
that a retailer communicates, through business activities, to
customers and shareholders. The image of a retailer’s brand
is formed by the opinions and attitudes of customers towards
a business’s products/services.
Franzen & Moriarty
2009; Glynn &
Woodside 2009;
Turner 2006
12
Dependent variable Source Number of
Statements
Customer purchasing behaviour
What a customer buys, where a customer buys, how a
customer buys and how often a customer buys forms a
customer’s purchasing behaviour. Furthermore, customer
purchasing behaviour is the way in which individuals, groups
and businesses choose, purchase, use and dispose of
products/services, ideas or experiences in order to satisfy
unique needs and wants.
Sarangapani 2009;
Cant 2010; De Mooij
2010
7
Source: Construction of the researcher.

110
Table 4.1 provides insight into the hypothetical model constructed and used to
measure the influence social media tools have on the brand image of retailers, and
the effect brand image has on the purchasing behaviour of customers. The
hypothetical model is made up of the independent, intervening and dependent
variables. Table 4.1 furthermore provides the sources used to describe the variables,
as well as provide the number of statements used for each variable in the measuring
instrument for the empirical investigation.
4.4 DATA COLLECTION
In this section, an overview of the population, the sampling technique and the
measuring instrument used to conduct this study will be provided and explained. This
will be followed by a discussion on ethics considered, the administration of
questionnaires, sample size and response rate of this study’s measuring instrument
and in which way missing data was handled.
4.4.1 Population and sample
A population can be defined as a group to which a researcher applies results, and is
identified by specific characteristics and interests (Houser 1998:98). McNabb
(2002:119), states that a population can be made up of customers, businesses,
individuals, products or anything in which the researcher has an interest.
A sample frame can be defined as the list of individuals and respondents in the
population, from which the sample is drawn. A sample frame is usually a listing of
population elements, and the sample is generally created through the collection of
information from a group of members of a population. (Smith & Albaum 2005:505).
According to Herbst and Coldwell (2004:74), a sample takes the form of a small part
of the entire population studied and investigated.
According to Sim and Wright (2000:111), the accessible population of a study is the
percentage of the entire target population that can be accessed by the researcher,
and that is in line with the purpose of the study. A sample is generally drawn from the
accessible population group. Gratton and Jones (2010:110) state that it is easier to

111
investigate a sample of the entire population, as a sample provides the researcher
with valuable information more quickly and with much less effort.
Two main types of sampling methods exist, namely probability sampling and non-
probability sampling, and the researcher has the responsibility of selecting the
sampling method to be used for a particular study (Connaway & Powell 2010:117).
Probability sampling can be defined as the process of the researcher selecting
elements from the total population group which represent that specific population
group accurately and efficiently. According to Connaway and Powell (2010:117),
probability sampling can be seen as the more systematic and beneficial method of
sampling. The process of probability sampling provides each individual element in
the total population group with a known probability for it to be included in the study’s
sample. As with non-probability sampling, samples are selected according to the
judgement of the researcher, and the researcher is unable to state the probabilities
of individual elements. (Connaway & Powell 2010:117).
The population of this study consisted of all customers of the four selected retail
groups in the Eastern Cape region, and the sample size was a minimum of 125
respondents. It should be stressed that no sample frame existed for this study, as no
list of all Eastern Cape customers was available to the researcher. Thus, for the
purpose of this study, a non-probability sampling method, convenient sampling, was
used to select the sample of customers from the total population. According to
Gravetter and Forzano (2012:151), convenience sampling is a method used in which
the researcher identifies and makes use of individuals who can easily be contacted
and interacted with. Convenience sampling makes use of units or individuals that are
most convenient to gather data from, and refers to identifying and selecting a sample
that is convenient to the researcher at that specific point in time. For the purpose of
this study, convenience sampling was identified as the best method for collecting
data about the perceptions of retail customers on the use of social media tools,
retailer brand image and customer purchasing behaviour. The researcher, with the
help of fieldworkers, distributed and collected structured questionnaires to customers
within the Eastern Cape.

112
4.4.2 Measuring instrument
As mentioned, this study made use of the quantitative research method. Thus, a
questionnaire was created and used as the measuring instrument to collect data
from customers as respondents. The questionnaires used had the purpose of
identifying the degree of relationships among the independent, intervening and
dependent variables. The measuring instrument collected data on the customers’
perceptions regarding retailer social media tools, brand image and customer
purchasing behaviour. According to Gratton and Jones (2010:126), a questionnaire
can easily be defined as a group of questions used to gain knowledge and
information from a particular group, or on a specific subject. Questionnaires are
advantageous when large sample groups are used by researchers. Questionnaires
can be distributed across a large geographical area at a low cost and can be
completed anonymously by respondents, which will provide the researcher with more
in-depth knowledge. This is due to respondents being able to complete
questionnaires more accurately, as they are aware that the researcher will not be
able to identify and refer to individual respondents when data is analysed. However,
the use of questionnaires as a measuring instrument also provides a number of
disadvantages. Researchers have little control over who completes questionnaires,
and difficult questions may cause problems to respondents. (Gratton & Jones
2010:128-129).
For the purpose of this study, a self-constructed and self-administered questionnaire
was developed to use as the measuring instrument. The questionnaire was
distributed to retail customers in the Eastern Cape. A questionnaire was created,
along with a covering letter. The covering letter was used to describe the purpose of
the study to all retail customers who were willing to participate in the study. The
communication language was English, and the questionnaire was made up of three
sections. The biographical data and demographical data of respondents were
captured in Section A. The biographical data and geographical data collected
consisted of retail customers’ gender, age and employment status. Section B of the
questionnaire was made up of statements based on the literature review regarding
the three social media tools (Official websites, Facebook and Twitter). The

113
questionnaire concluded for Section C was made up of statements relating to the
brand image of retailers and customers’ purchasing behaviour.
The Likert-type scale is an attitude measuring and determining technique used by
researchers. This measuring technique requests respondents to state the degree to
which they agree or disagree with a particular statement (Breckler, Olson & Wiggins
2006:206). A Likert-type scale consists of a number of points, generally between five
and seven (Struwig & Stead 2001:94). Kothari (2008:86) provides a number of
advantages for the use of a Likert-type scale. Likert-type scales are relatively easy to
set up compared to other measuring scales, and are regarded as more consistent
and reliable. The process of setting up and creating a Likert-type scale is time-
efficient and generally respondents find it easy to use.
However, a number of disadvantages and limitations exist for incorporating the
Likert-type scale in questionnaires. The total score of a respondent’s questionnaire
has little clear meaning to the researcher. Respondents may answer questions in
accordance to what they think they feel, rather than what they really feel.
Respondents can also answer questions in such a way as to what they think the
researcher expects of them. The collected data may take long periods of time to
interpret and analyse. (Kothari 2008:86).
A five-point Likert-type scale was used in this study. The Likert-type scale ranged
from ‘strongly disagree’ (1), to ‘strongly agree’ (5). Section B of the questionnaire
used a Likert-type scale to collect data on customer perceptions of social media.
Section C of the questionnaire also took the form of a Likert-type scale, which also
ranged from ‘strongly disagree’ (1) to ‘strongly agree’ (5), and was used to collect
data on the brand image of retailers and customer purchasing behaviour. Annexure
A provides an example of the measuring instrument used in this study. The computer
programmes, Microsoft Excel and Statistica (version 10) will be used to statistically
analyse collected data.

114
4.4.3 Ethical considerations
The primary objective of this study is to investigate the influence of social media
tools on the brand image of retailers and how it affects customer purchasing
behaviour. A questionnaire was used to determine customers’ perceptions of the
social media tools (Official websites, Facebook and Twitter) used by four South
African retailers (Pick n Pay Holdings Limited, Woolworths Holdings Limited, the
Spar Group and Shoprite Holdings Limited). Furthermore, the questionnaire
measured the perceptions of customers on the brand image of these retailers, and
on customer purchasing behaviours. A pro forma ethics clearance was completed
and submitted to the NMMU Business and Economic Sciences’ Faculty RTI, as the
information was not of a private or personal nature.
4.4.4 Administration of questionnaires
The convenience sampling technique was used to identify retail customers, and they
were approached in person during the months of July, August and September 2013.
Respondents were provided with questionnaires by hand, and respondents were to
deliver completed questionnaires back to the researcher either by hand or fax. The
purpose of the study was explained to respondents by a cover letter. The cover letter
also explained the type of information to be collected and assured respondents of
confidentiality of answers and information provided. The cover letter provided
respondents with an email address if respondents were to return completed
questionnaires via email.
4.4.5 Sample size and response rate
The ratio of an observation-to-independent variable ratio should not fall below 5:1.
(Swanson & Holton 2005:129). However, ratios of 10:1 are encouraged (Sprenkle &
Piercy 2005:396). To avoid an observation-to-independent variable ratio problem,
Nemati and Barko (2004:197) state that a limit should be set on the number of
variables included in a discriminant procedure.

115
For the purpose of this study, considering these recommendations and guidelines,
the following were considered. This study has five variables and a minimum of five
statements per item is used. The multiplication of the five variables, with the five
statements and the five respondents produces a minimum sample size of 125. The
response rate, according to Rumsey (2011:258), is defined as the number of
completed questionnaires collected from respondents, divided by the number of
individuals asked to participate in the study. Table 4.2 provides the response rate
figure of the questionnaires used in this study.
Table 4.2: Response rate of questionnaires
Number of respondents
Total number of questionnaires
distributed 300
Total number of questionnaires returned
by respondents 192
Total number of useable questionnaires
returned by respondents 180
Response rate 60%
The sample in this study consisted of 300 retail customers. In total, 192
questionnaires were returned by respondents of which 180 questionnaires were
used for statistical analyses. Therefore, a response rate of 60% is evident for this
study.
4.4.6 Missing data
If respondents return questionnaires in which some statements have no responses
this is classified as missing data. As respondents returned questionnaires to the
researcher they were examined for missing data. The examination revealed that
several questionnaires had missing data. If the missing data could not be found, all
of the responses from all questionnaires were used to calculate a mean score to
represent that particular item. According to Outhwaite and Turner (2007:217), the
mean-substitution approach is used when data is missing from an independent

116
variable to replace the missing scores with a mean score calculated from all of the
valid responses (Leimeister 2010:130). The mean-substitution approach is
beneficial to this study as the levels of missing data are relatively low.
4.5 DATA ANALYSIS
A data analysis procedure was used to examine the data collected from
respondents. In the following section, the manner in which descriptive statistics were
calculated, as well as the manner in which the data analysis procedure was used to
measure the validity and reliability of the measuring instrument will be discussed.
This will be followed by a discussion on the statistical techniques of Pearson’s
Product Moment Correlations and multiple regressions used in this study. The effect
of the demographic variables of respondents on their perceptions regarding brand
image and purchasing behaviour will be analysed.
4.5.1 Validity of the measuring instrument
The term validity can be defined as the accurateness by which a measuring
instrument measures what it is expected and designed to measure. Validity refers to
how accurately or convincingly the variables have been operationalised (Hill
2001:45). According to Cooper, Hedges and Valentine (2009:130), validity can be
described as the inexact or approximate truth of an implication about a relationship.
Validity, according to Kemp and Mosqueda (2012), is the degree to which a
measuring instrument will produce similar or the same results and scores when used
in different locations by different respondents and in varying circumstances.
Based on the above information, it is evident that validity refers to the degree to
which a measuring instrument measures what it is expected to measure, and
whether the results generated remain consistent when circumstances vary. Lewis-
Beck, Bryman and Liao (2004:163), McBurney and White (2009:174-176), Blanch,
Durrheim and Painter (2006:148) and Planty and Carlson (2010:44), have identified
a number of types of validity associated with quantitative research.

117
Content validity: content validity refers to the degree to which the measuring
instrument captures all of the dimensions and characteristics of the concept that is
defined.
Criterion-related validity: can be described as the degree to which a new
measure of an idea integrates with an existing idea.
Construct validity: relates to whether the results generated by the measuring
instrument support the theory of the research.
Internal validity: internal validity refers to the reason of the relationship among
independent and dependent variables of the study.
External validity: refers to whether the results generated in a study can be
generalised to different situations.
Predictive validity: refers to the effectiveness of the measuring instrument
predicting a future event.
Statistical validity: refers to whether the values presented in the study were
generated using the most applicable statistical procedure.
Experts in the fields of social media and the retail environment assisted in the design
and efficiency of the questionnaire, and this ensured the content or face validity of
the measuring instrument. Furthermore, a pilot study was conducted among retail
customers to pre-test the validity of the questionnaire. Based on the results of the
pilot study, the necessary adjustments were made to the questionnaire to ensure
that all items in the questionnaire were interpreted correctly by respondents.
This study made use of a factor analysis to ensure validity. According to Zikmund,
Babin, Carr & Griffin (2013:595), factor analysis can be defined as a technique used
to identify a reduced number of factors from a large number of measured variables.
Fabrigar and Wegener (2012:3-4) and Reineccius (1998:777) provide a number of

118
reasons why a factor analysis should be used, and why a factor analysis is beneficial
to a study:
Factor analyses assist researchers to determine the total number of
constructs from a set of variables.
Factor analyses provide researchers with a method for explaining variations
among variables through the use of new variables.
Factor analyses provide clarity to the meaning of constructs.
According to Martella, Nelson and Morgan (2013:227), the purpose of factor analysis
is to identify variables and factors to explain and motivate results and scores, and to
summarise scores into a smaller number of factors. Two types of factor analyses
exist, according to Gatignon (2003:38), namely exploratory factor analysis (EFA) and
confirmatory factor analysis (CFA).
CFA is used by a researcher when a structure is proposed in which the observed
and quantifiable variables replicate only some unobserved constructs (Gatignon
2003:38). CFA is a statistical method used to measure and test the researcher’s
understanding of constructs of interest, and to validate the factor structure of a set of
observed variables (Kumar & Petersen 2012:65). CFA is a measure used to test the
research hypothesis, either of the underlying factors or variables or underlying
constructs (McNabb 2009:214). Harrington (2009:3), states that CFA’s generally has
four major purposes:
To psychometrically evaluate measures;
To create validation;
To test the effectiveness of methods used; and
To test the invariance of the measurement used.
EFA is used when the researcher is unsure of the number of factors that may exist in
a set of variables. The use of an EFA is an effective measure when the relationship
between the observed variables and underlying factors are unclear or unknown.

119
(Fernández-Ballesteros 2003:399; Zikmund et al. 2013:595). Whitley and Kite
(2013:341) state that EFA can be used for:
Data reduction: EFA can be used to summarise large amounts of variables
into fewer, smaller groups of variables. This allows data to be simplified.
Scale development: EFA can be used to develop scales to measure
hypothetical constructs.
For the purpose of this study, an EFA was used to ensure that the researcher’s
understanding of the constructs was consistent with the nature and actual meaning
of the constructs. This study had a sample of 180, and therefore minimum factor
loadings of 0.40 were accepted. Table 4.2 can be used as a guideline to determine
whether factor loadings are significant:
Table 4.3: Guideline for determining factor loading significance
Sample size
Minimum factor
loading regarded
significant
50 0.75
60 0.70
70 0.65
85 0.60
100 0.55
120 0.50
150 0.45
200 0.40
250 0.35
350 0.30
Source: Hair, Black, Babin, Anderson and Tatham (2006:128).

120
The term, factor loading, can be defined as the correlation and relationship among
the variable and the factor (Rubin 2010:263). Factor analysis is a statistical
technique or measure used for item selection, generally used in relation to item-total
correlations. This technique is efficient in identifying the items most closely related to
the underlying measure to what it is designed to measure (Hayes 2008:72). Higher
factor loadings are better, and factor loadings below 0.30 are not interpreted.
Generally, factor loadings above 0.71 are exceptional, 0.63 are very good, 0.55 are
good, 0.45 are fair and 0.32 are poor. (Harrington 2009:23).
4.5.2 Reliability of the measuring instrument
The term reliability refers to the stability and consistency of a measure (Zeanah
2009:243). Furthermore, Waltz, Strickland and Lenz (2010:66) state that reliability
refers to the extent to which a measure is free from random errors. An inverse
relationship exists between the total random errors produced by a measurement and
the reliability of that specific measurement. Thus, measurements with high reliability
produce few random errors. Reliability, according to Polit and Beck (2008:196), can
be defined as the consistency and accuracy of data collected by a specific
measurement. According to Waltz et al. (2010:66) a measurement is reliable if it
generates the same results on repeated measurements of the same attribute.
Furthermore, Neuendorf (2002:113) states that reliability contributes to validity.
The internal consistency of a measure is defined as the degree of reliability, with
regard to the individual items of a measurement measuring the same construct.
Thus, if internal consistency exists, the individual items of a measurement are highly
correlated. (Weiner, Freedheim & Graham 2003:55).
Cronbach’s alpha will be used to test the reliability and internal consistency of the
measuring instrument (Andrew, Pederson & McEvoy 2011:202). Gliner and Morgan
(2000:316) state that Cronbach’s alpha is a method used to calculate inter-item
reliability and consistency. Cronbach’s alpha, according to Olagbemi (2011:60), can
be defined as a statistical test to determine how well the items of a measuring scale
correlate and integrate with one another.

121
Reliability estimates below 0.60 are unacceptable, between 0.60 and 0.65 are
undesirable and between 0.65 and 0.70 are acceptable (Sharma & Petosa
2012:111). A reliability coefficient of more than 0.70 suggests internal consistency
and good reliability (Kreitler, Ben-Arush & Martin 2012:279). Reliability estimates
between 0.70 and 0.80 are good, and between 0.80 and 0.90 are very good (Sharma
& Petosa 2012:111).
Descriptive statistics and inferential statistics are the two statistical methods used to
analyse data. A part of the statistics procedure used to analyse data in this study has
already been discussed in the section covering the validity and reliability of the
measuring instrument. The data analysis process is made up of a number of steps,
and therefore some descriptive statistics were to be calculated.
4.5.3 Descriptive statistics
Descriptive statistics, according to Lee, Lee and Lee (2000:4), is the statistical
process used for the organising and presenting of collected data. Goodwin
(2010:141) refers to descriptive statistics as a statistical process used to convert a
large amount of numbers which is difficult to comprehend into a smaller set of
numbers that can be understood easily. Descriptive statistics is a process that
makes use of statistical techniques to describe quantitative data (Anderson,
Sweeney & Williams 2009:18).
Descriptive statistics are used to summarise and describe numerical data (Lee et al.
2000:4). According to Lee et al. (2000:4), descriptive statistics involves measuring a
central tendency (such as the mean and median) and measures of dispersion (such
as standard deviation and the range). For the purpose of this study, descriptive
statistics in the form of mean, standard deviation and frequency distributions were
used to summarise and interpret data collected from Section A of the questionnaire.
As mentioned, Section A of the questionnaire was made up of the respondents’
demographic information including the gender, age and population group.
Descriptive statistics were also used to summarise and interpret data collected from
Section B and Section C, which were made up of the social media tools, brand
image of retailers and the purchasing behaviour of customers.

122
4.5.4 An analysis of the relationships of the independent, intervening and dependent
variables
As mentioned, two types of statistical techniques exist, namely descriptive statistics
and inferential statistics. Inferential statistics, according to Black (2010:6), can be
defined as a process in which the researcher makes use of the statistics calculated
from collected data to make conclusions about an entire population from which the
sample was taken. Inferential statistics is an effective technique for reaching
generalisations about a larger group (Black 2010:6). Furthermore, inferential
statistics are also used to test hypotheses of relationships in a population, using data
generated from the sample (Landy & Conte 2010:70).
The data analysis procedure of this study included inferential statistics such as
Pearson’s Product Moment Correlations, as well as the multiple linear regression
analyses.
Pearson’s Product Moment Correlations
According to Paler-Calmorin and Calmorin (2006:125), Pearson’s Product Moment
Correlation is a linear correlation coefficient (r) used to determine the degree of the
association of two sets of variables. Pearson’s product moment correlation is a
technique used to measure the degree to which one variable is correlated with
changes in another variable (MacDaniel & Gates 1998:405). The correlation
coefficient can range from -1 to +1 (Brown & Suter 2012:167). According to Franzen
(2000:17), a correlation coefficient of 0 indicates that no relationship exists between
the two sets of observations. A correlation coefficient of 1 provides evidence that the
values of one set increase, while the values of another set increase consequently. A
correlation coefficient of -1 provides evidence that as the values of one set increase,
the values of another set decrease accordingly. (Franzen 2000:17).
Kornbrot (2005) established guidelines to enable efficient interpretation of a
Pearson’s Product Moment Correlation Coefficient. A Pearson’s Product Moment
Correlation Coefficient of:

123
-1.0 to -0.5 indicates a strong negative relationship;
-0.5 to -0.3 indicates a moderate negative relationship;
-0.3 to -0.1 indicates a weak negative relationship;
-0.1 to 0.1 indicates no or a very weak relationship;
0.1 to 0.3 indicates a weak positive relationship;
0.3 to 0.5 indicates a moderate positive relationship; and
0.5 to 1.0 indicates a strong positive relationship.
For this study, Pearson’s Product Moment Correlation coefficients were calculated to
identify correlations between the independent (Official websites, Facebook and
Twitter), intervening (Brand image) and dependent (Customer purchasing behaviour)
variables.
Multiple regression analysis
Multiple linear regressions were conducted for the purpose this study, in addition to
Pearson’s Product Moment Correlations. According to Bruce, Pope and Stanistreet
(2008:243), multiple regressions are used to summarise and interpret the
simultaneous relationship between an outcome variable and a number of
explanatory variables. Thus, the purpose of multiple regression analysis for this
study is to simultaneously investigate the effects of the independent variables,
(Official websites, Facebook and Twitter) on the single dependent variable
(Customer purchasing behaviour). Furthermore, Mun (2006:376) states that multiple
regression analyses are used when the dependent variable depends on independent
variables. Furthermore Freund, Wilson and Sa (2006:73) state that multiple linear
regression analyses are used to determine the relationship between the independent
variable, intervening variable and the dependent variable.
Multiple regression analysis was conducted to determine whether the social media
tools, namely, Official websites, Facebook and Twitter influence the intervening
variable Brand image, and ultimately the dependent variable, Customer purchasing
behaviour.

124
4.5.5 An analysis of the effect of the demographic variables
The primary objective of this study is to investigate the influence of social media
tools on the brand image of retailers and how it affects customer purchasing
behaviour. An assessment will be done to determine whether perceptions and
insights of respondents were influenced by selected demographic variables. To
determine this, a t-test and Analysis of Variance (ANOVA) tests will be conducted.
A t-test is a statistical test used to compare scores collected from two groups of
respondents (Sharkey & Gaskill 2006:272). ANOVA is used to test the significance of
differences of sample means used in a study. Furthermore, ANOVA is used to
simultaneously test or compare the difference of two or more population means. (Lee
et al. 2000:486). For the purpose of this study, a Tukey Honestly Significant
Difference (HSD) test will be constructed. A Tukey HSD test, according to Gravetter
and Wallnau (2011:398), allows the researcher to calculate a single value that
expresses the smallest difference between treatment means essential for
significance. In addition, for the purpose of this study, Cohen’s d values will be
calculated to determine the degree of practical significance of the identified
relationships. According to Gravetter and Wallnau (2007:258), Cohen d values of
greater than 0 but less than 0.2 indicate small practical significance, values greater
than 0.2 but less than 0.8 indicate medium practical significance and values greater
than 0.8 indicate large practical significance.
4.6 SUMMARY
The purpose of chapter 4 was to describe the research design and research
methodology used for this study. Each variable of the hypothetical model was
described in brief along with definitions. The population studied, and the sampling
technique used was described. The measuring instrument was described in detail.
Furthermore, the statistical analysis used to present the descriptive and to prove the
validity and reliability of the measuring instrument was described. Pearson’s Product
Moment Correlations and multiple regressions to be used to determine the influence
of independent variables on the intervening and dependent variables were discussed
in brief. The statistical techniques, t-test and ANOVA tests, were described and

125
which are to be used to investigate whether relationships exists between
demographic variables and various factors under investigation. Chapter 4 was
concluded with a description of the post-hoc Tukey tests to be used to assess
statistical significance, and Cohen’s d values to be used to assess practical
significance.
Chapter 5 will present and discuss the empirical results of the different statistical
analyses performed during the empirical investigation.

126
CHAPTER 5 EMPIRICAL RESULTS
5.1 INTRODUCTION
An overview of the research design and methodology to be used in this study to
investigate the influence of social media tools on the brand image of retailers and
customer’s purchasing behaviour was provided in chapter 4. Chapter 4 provided a
discussion on the population studied, the sampling technique used, the measuring
instrument used, as well as the methods used to analyse the data. The statistical
techniques used in this study to determine the validity and reliability of the measuring
instrument were stated and discussed. The data analysis process used to generate
the descriptive statistics and to determine the relationships among demographic
variables and the investigated variables were discussed. Chapter 5 will present the
empirical findings of the statistical analyses undertaken.
Specifically, the demographic information of respondents that participated in this
study will be presented in chapter 5. This will be followed by a summary of the
validity and reliability assessments. The descriptive statistics calculated (means,
standard deviations and frequency distributions) will be displayed in a table to
summarise the sample data. This will be followed by a discussion on the Pearson’s
Product Moment Correlations. Thereafter, the results generated by multiple
regression analyses, displaying the influence of the social media tools, namely
Official websites, Facebook and Twitter on the intervening variable Brand image, and
consequently the dependent variable, Customer purchasing behaviour will be
provided. Lastly, the results generated by the t-test and the ANOVA tests will be
given and discussed. These tests were used to assess the influence of selected
demographic variables of respondents on their responses with regard to the
independent, intervening and dependent variables.
5.2 DESCRIPTIVE STATISTICS ON DEMOGRAPHIC INFORMATION
Section A of the questionnaire used in this study consisted of various items
regarding the demographic information of respondents and the social media tools

127
these respondents use. Table 5.1 provides a summary of all the demographic
information pertaining to the respondents as individuals.
Table 5.1: Demographic information pertaining to the respondents as
individuals
Gender Frequency Percentage
Male 70 38.89
Female 110 61.11
Total 180 100.00
Age Frequency Percentage
<20 36 20.00
20 – 29 64 35.56
30 – 39 29 16.11
40 – 49 30 16.67
50 – 59 19 10.56
60+ 2 1.11
Total 180 100.00
Ethnicity Frequency Percentage
Asian 4 2.22
Black 62 34.44
Coloured 21 11.67
White 89 49.44
Not willing to say 4 2.22
Total 180 100.00
Table 5.1 indicates that there were more females (61.11%) than males (38.89%)
who participated in this study. The majority of respondents were aged between 20
and 29 years (35.56%), and younger than 20 years (20.00%), followed by
respondents between the ages of 40 and 49 years (16.67%). The remaining
respondents were between the ages of 30 and 39 years (16.11%), 50 and 59 years
(10.56%) and older than 60 years (1.11%). With regard to ethnicity, most of the
respondents were White (49.44%), followed by Black (34.44%), Coloured (11.67%)
and Asian (2.22%).

128
Table 5.2 provides information with regard to the total number of years that
respondents have been using the Internet.
Table 5.2: Demographic information pertaining to the number of years
respondents have been using the Internet
Valid N Mean Minimum Maximum Std. Dev.
Years 180 9.95 0 24 4.42
With regard to the number of years that respondents have been using the Internet, a
mean score of 9.95 years was reported. The maximum number of years of Internet
usage reported was 24 years.
Table 5.3 presents a summary of the social media tools used by respondents.
Table 5.3: Social media tools used by respondents (N=177)
Social media tools Frequency Percentage of cases
Official websites 147 83.05
Facebook 157 88.70
Twitter 70 39.55
Total 374 211.30
Table 5.3 shows that from the 177 respondents that answered this question, 83.05%
stated that they use Official websites: 88.70% use Facebook and 39.55% use
Twitter. The total percentage of cases (211.30%) was recorded as respondents were
able to indicate the use of more than one social media tool in the questionnaire.
Tables 5.4, 5.5, 5.6 and 5.7 show the social media tools of retailers that are used by
respondents. Although the measuring instrument used a five-point Likert-type scale,
for the sake of brevity, ‘disagree’ was used to categorise the frequency distribution
responses for the categories ‘strongly disagree’ (1) and ‘disagree’ (2). Furthermore,
the response categories ‘strongly agree’ (5) and ‘agree’ (4) were categorised
together as ‘agree’.

129
Table 5.4: Information relating to the social media tools of Pick n Pay used
by respondents (N=180)
Independent variables Disagree% Neutral% Agree%
Official websites 73.333 13.334 13.333
Facebook 82.222 6.111 11.667
Twitter 96.667 0.555 2.778
The majority of respondents, 73.333%, 82.222% and 96.667% disagreed that they
regularly make use of Pick n Pay’s Official websites, Facebook or Twitter pages
respectively.
Frequency table:
PNP_TWIT
Count Percent
Disagree 169 93.89
2 5 2.78
3 1 0.56
4 2 1.11
Agree 3 1.67
Table 5.5: Information relating to the social media tools of Woolworths used
by respondents (N=180)
Independent variables Disagree% Neutral% Agree%
Official website 62.778 16.111 21.111
Facebook 81.111 7.788 1.111
Twitter 91.667 1.666 6.667
With regard to respondents’ use of Woolworths’s Official website, Facebook- and
Twitter pages, the majority of respondents, 62.778%, 81.111% and 91.667%
respectively, disagreed that they regularly make use thereof.
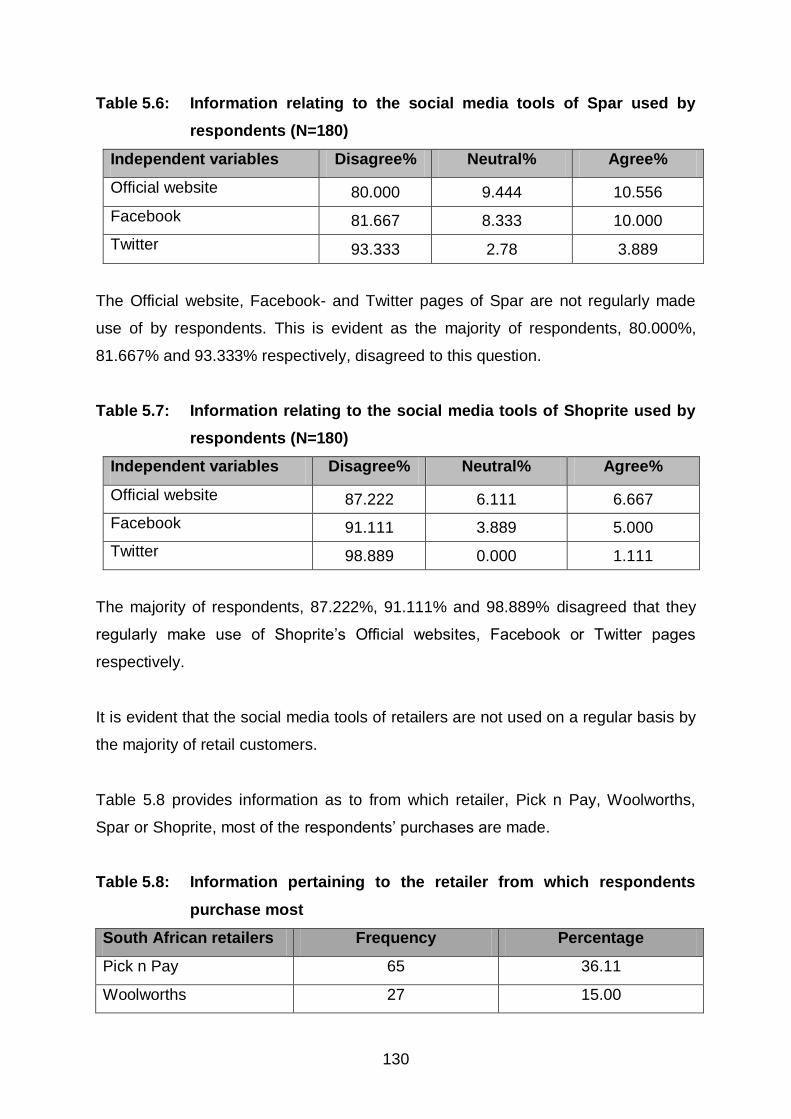
130
Table 5.6: Information relating to the social media tools of Spar used by
respondents (N=180)
Independent variables Disagree% Neutral% Agree%
Official website 80.000 9.444 10.556
Facebook 81.667 8.333 10.000
Twitter 93.333 2.78 3.889
The Official website, Facebook- and Twitter pages of Spar are not regularly made
use of by respondents. This is evident as the majority of respondents, 80.000%,
81.667% and 93.333% respectively, disagreed to this question.
Table 5.7: Information relating to the social media tools of Shoprite used by
respondents (N=180)
Independent variables Disagree% Neutral% Agree%
Official website 87.222 6.111 6.667
Facebook 91.111 3.889 5.000
Twitter 98.889 0.000 1.111
The majority of respondents, 87.222%, 91.111% and 98.889% disagreed that they
regularly make use of Shoprite’s Official websites, Facebook or Twitter pages
respectively.
It is evident that the social media tools of retailers are not used on a regular basis by
the majority of retail customers.
Table 5.8 provides information as to from which retailer, Pick n Pay, Woolworths,
Spar or Shoprite, most of the respondents’ purchases are made.
Table 5.8: Information pertaining to the retailer from which respondents
purchase most
South African retailers Frequency Percentage
Pick n Pay 65 36.11
Woolworths 27 15.00

131
Spar 63 35.00
Shoprite 25 13.89
Total 180 100
From Table 5.8 it is evident that a large number of the respondents most often
purchase their products/services from Pick n Pay (36.11%) and Spar (35.00%).
Fewer respondents purchased most of their products/services from Woolworths
(15.00%) and Shoprite (13.89%).
5.3 RESULTS OF THE VALIDITY AND RELIABILTIY ANALYSIS FOR THE
INDEPENDENT VARIABLES
Validity, according to Kaplan and Saccuzzo (2005:134), can be defined as the
degree of relevance between the results of a test or measure compared to what it is
supposed to measure. Furthermore, Kaplan and Saccuzzo (2005:134) state that
validity can be assured by determining whether a measuring instrument is measuring
what it is supposed to measure. According to Neelankavil (2007:206), validity is a
determinant of the accuracy and precision of a measuring instrument. Reliability is
an effective indicator of the internal consistency and stability of a measure. Reliability
can be determined by the extent to which individual items on a scale reflect the same
construct. (Zeenah 2009:243). According to Zikmund and Babin (2013:257), a
measure is reliable when multiple attempts at measuring a construct generate the
same outcomes or results.
As mentioned, to ensure the content or face validity of the measuring instrument,
experts in the field of marketing assisted with the design of the questionnaire.
Furthermore, a pilot study was conducted among three retail customers to test the
validity of the questionnaire, and to determine if they understood the questionnaire
items. Consequently, the wording of some of the questionnaire items was adjusted.
An EFA was done for the independent, intervening and dependent variables, in order
to determine the validity of the measuring instrument. According to Dörnyei and
Schmidt (2001:247), EFA is an efficient way of identifying the number of unique

132
concepts within a large set of variables. EFA, according to Gopalan and Sivaselvan
(2009:17), is used to identify the number of common factors that influence a
particular set of measures, and to determine the strength of the relationship between
each factor and observed measure. Higher factor loadings are better, and factor
loadings below 0.40 are eliminated. Generally, factor loadings of approximately 0.40
are considered fair and meet the standards for significance in a study (Harrington
2009:23).
5.3.1 Independent variables
The results of the EFA on the independent variables, Official websites, Facebook
and Twitter are discussed in the following section and the factor structure is
presented in Table 5.9.
Table 5.9: Factor structure – independent variables
Items Official websites Facebook Twitter
OFFWEB1 0.80 0.04 0.05
OFFWEB2 0.86 0.15 0.05
OFFWEB3 0.78 0.03 0.02
OFFWEB5 0.40 0.33 0.02
OFFWEB8 0.50 0.05 0.14
OFFWEB9 0.70 0.23 0.02
FACE1 0.06 0.75 0.07
FACE2 0.09 0.78 0.08
FACE3 0.11 0.78 0.06
FACE4 0.10 0.80 0.11
FACE5 0.05 0.81 0.02
FACE6 0.15 0.89 0.01
FACE7 0.04 0.79 0.06
FACE9 0.07 0.84 0.05
FACE10 0.06 0.85 0.01
FACE11 0.04 0.69 0.14
FACE12 0.02 0.72 0.19
TWIT1 0.01 0.02 0.84
TWIT2 0.01 0.07 0.97
TWIT3 0.03 0.02 0.96
TWIT4 0.01 0.04 0.94
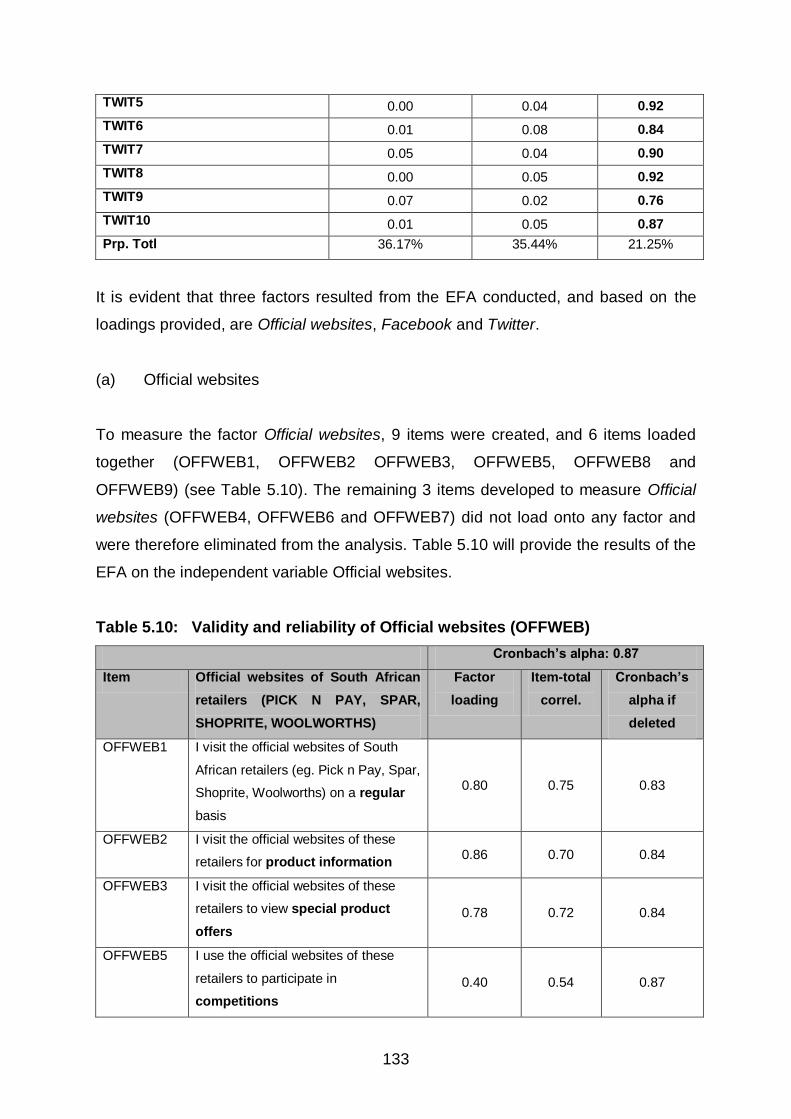
133
TWIT5 0.00 0.04 0.92
TWIT6 0.01 0.08 0.84
TWIT7 0.05 0.04 0.90
TWIT8 0.00 0.05 0.92
TWIT9 0.07 0.02 0.76
TWIT10 0.01 0.05 0.87
Prp. Totl 36.17% 35.44% 21.25%
It is evident that three factors resulted from the EFA conducted, and based on the
loadings provided, are Official websites, Facebook and Twitter.
(a) Official websites
To measure the factor Official websites, 9 items were created, and 6 items loaded
together (OFFWEB1, OFFWEB2 OFFWEB3, OFFWEB5, OFFWEB8 and
OFFWEB9) (see Table 5.10). The remaining 3 items developed to measure Official
websites (OFFWEB4, OFFWEB6 and OFFWEB7) did not load onto any factor and
were therefore eliminated from the analysis. Table 5.10 will provide the results of the
EFA on the independent variable Official websites.
Table 5.10: Validity and reliability of Official websites (OFFWEB)
Cronbach’s alpha: 0.87
Item Official websites of South African
retailers (PICK N PAY, SPAR,
SHOPRITE, WOOLWORTHS)
Factor
loading
Item-total
correl.
Cronbach’s
alpha if
deleted
OFFWEB1 I visit the official websites of South
African retailers (eg. Pick n Pay, Spar,
Shoprite, Woolworths) on a regular
basis
0.80 0.75 0.83
OFFWEB2 I visit the official websites of these
retailers for product information 0.86 0.70 0.84
OFFWEB3 I visit the official websites of these
retailers to view special product
offers
0.78 0.72 0.84
OFFWEB5 I use the official websites of these
retailers to participate in
competitions
0.40 0.54 0.87
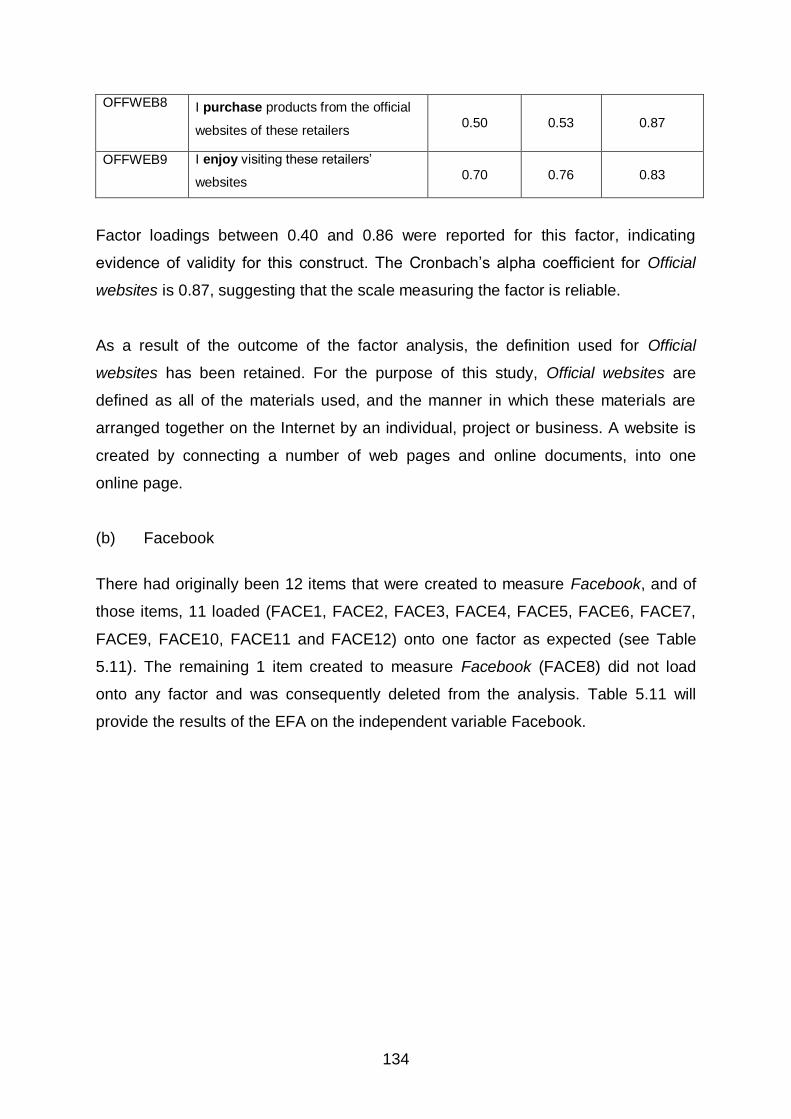
134
OFFWEB8 I purchase products from the official
websites of these retailers 0.50 0.53 0.87
OFFWEB9 I enjoy visiting these retailers’
websites 0.70 0.76 0.83
Factor loadings between 0.40 and 0.86 were reported for this factor, indicating
evidence of validity for this construct. The Cronbach’s alpha coefficient for Official
websites is 0.87, suggesting that the scale measuring the factor is reliable.
As a result of the outcome of the factor analysis, the definition used for Official
websites has been retained. For the purpose of this study, Official websites are
defined as all of the materials used, and the manner in which these materials are
arranged together on the Internet by an individual, project or business. A website is
created by connecting a number of web pages and online documents, into one
online page.
(b) Facebook
There had originally been 12 items that were created to measure Facebook, and of
those items, 11 loaded (FACE1, FACE2, FACE3, FACE4, FACE5, FACE6, FACE7,
FACE9, FACE10, FACE11 and FACE12) onto one factor as expected (see Table
5.11). The remaining 1 item created to measure Facebook (FACE8) did not load
onto any factor and was consequently deleted from the analysis. Table 5.11 will
provide the results of the EFA on the independent variable Facebook.

135
Table 5.11: Validity and reliability of Facebook (FACE)
Cronbach’s alpha: 0.95
Item Facebook websites of South African
retailers (PICK N PAY, SPAR,
SHOPRITE, WOOLWORTHS)
Factor
loading
Item-total
correl.
Cronbach’s
alpha if
deleted
FACE1 I have “liked” Facebook pages of
South African retailers (eg. Pick n Pay,
Spar, Shoprite, Woolworths)
0.75 0.75 0.95
FACE2 I visit the Facebook pages of these
retailers for product information 0.78 0.80 0.95
FACE3 I visit the Facebook pages of these
retailers to view special product
offers
0.78 0.80 0.95
FACE4 I use Facebook to communicate with
these retailers 0.80 0.76 0.95
FACE5 I visit the Facebook pages of these
retailers to participate in competitions 0.81 0.80 0.95
FACE6 I visit the Facebook pages of these
retailers to view the activities
participated in by these businesses
0.89 0.77 0.95
FACE7 I visit the Facebook pages of these
retailers to view images and videos
uploaded by the businesses or
followers
0.79 0.77 0.95
FACE9 I enjoy visiting the Facebook pages of
these retailers 0.84 0.84 0.95
FACE10 I use Facebook to view the
comments of other customers on
the products/ services and actions of
these retailers
0.85 0.86 0.94
FACE11 I use Facebook to communicate with
other customers with regard to these
retailers
0.69 0.75 0.95

136
FACE12 When I’m on the Facebook pages of
these retailers feel as if I’m part of a
community
0.72 0.79 0.95
Factor loadings of between 0.69 and 0.89 were returned for Facebook, which
provides evidence of validity for this construct. The Cronbach’s alpha coefficient of
0.95 was returned for the factor Facebook, providing evidence that the measuring
scale used for this factor is reliable.
For the purpose of this study, the definition used of Facebook has been retained and
refers to Facebook as a social utility that can be used to interact with friends,
workers and family in an online environment.
(c) Twitter
All of the 10 items (TWIT1, TWIT2, TWIT3, TWIT4, TWIT5, TWIT6, TWIT7, TWIT8,
TWIT9 and TWIT10) formulated to measure the construct Twitter loaded together
onto one construct (see Table 5.12). Table 5.12 will provide the results of the EFA on
the independent variable Twitter.

137
Table 5.12: Validity and reliability of Twitter (TWIT)
Cronbach’s alpha: 0.98
Item Twitter pages of South African
retailers (PICK N PAY, SPAR,
SHOPRITE, WOOLWORTHS)
Factor
loading
Item-total
correl.
Cronbach’s
alpha if
deleted
TWIT1 I “follow” South African retailers (eg.
Pick n Pay, Spar, Shoprite,
Woolworths) on Twitter
0.84 0.85 0.97
TWIT2 I visit the Twitter pages of these
retailers for product information 0.97 0.93 0.97
TWIT3 I visit the Twitter pages of these
retailers to view special product
offers
0.96 0.93 0.97
TWIT4 I use Twitter to communicate with
these retailers 0.94 0.91 0.97
TWIT5 I visit the Twitter pages of these
retailers to view the activities
participated in by these businesses
0.92 0.93 0.97
TWIT6 I visit the Twitter pages of these
retailers to view images and videos
uploaded by the businesses or
followers
0.84 0.86 0.97
TWIT7 I enjoy reading these retailers’ tweets 0.90 0.89 0.97
TWIT8 I use Twitter to view the comments of
other customers on the
products/services and actions of these
retailers
0.92 0.92 0.97
TWIT9 I use Twitter to communicate with
other customers with regard to these
retailers
0.76 0.77 0.98

138
TWIT10 When I’m on the Twitter pages of
these retailers I feel as if I’m part of a
community
0.87 0.87 0.97
Factor loadings of between 0.76 and 0.97 were returned for Twitter, which indicates
evidence of validity for this factor. The Cronbach’s alpha coefficient returned for
Twitter is 0.98, implying reliability of the scale used to measure this construct.
The definition of Twitter used in this study, a form of social media that connects
users to the latest news, stories and information which is most important to the user,
has remained unchanged as a result of the factor analysis.
5.4 RESULTS OF THE VALIDITY AND RELIABILITY ANALYSIS FOR THE
INTERVENING VARIABLE AND DEPENDENT VARIABLE
Two separate EFA’s were conducted for the intervening variable and dependent
variable. The factor structure of the analysis for the intervening variable Brand image
is presented in Table 5.13.
Table 5.13: Factor structure – intervening variable
Items Brand image
BRAND1 0.66
BRAND2 0.73
BRAND3 0.55
BRAND4 0.56
BRAND5 0.71
BRAND6 0.61
BRAND7 0.74
BRAND8 0.84
BRAND9 0.65
BRAND10 0.78
BRAND11 0.85
BRAND12 0.65

139
Prp. Totl 48.90%
It is evident that one factor resulted from the EFA and, based on the loadings, is
named Brand Image. Table 5.14 presents the factor structure of the analysis for the
dependent variable Customer purchasing behaviour.
Table 5.14: Factor structure – dependent variable
Items Customer purchasing
behaviour
CPB1 0.72
CPB2 0.81
CPB3 0.77
CPB4 0.72
CPB5 0.76
CPB6 0.54
CPB7 0.46
Prp. Totl 47.90%
From Table 5.14 it is evident that one factor resulted from the EFA and, based on the
loadings, is named Customer purchasing behaviour.
5.4.1 Intervening variable
The results of the EFA on the intervening variable Brand image are tabled and
discussed below.
(a) Brand image
All of the 12 items that were initially created to measure the factor Brand image
loaded together onto a single construct (see Table 5.15).
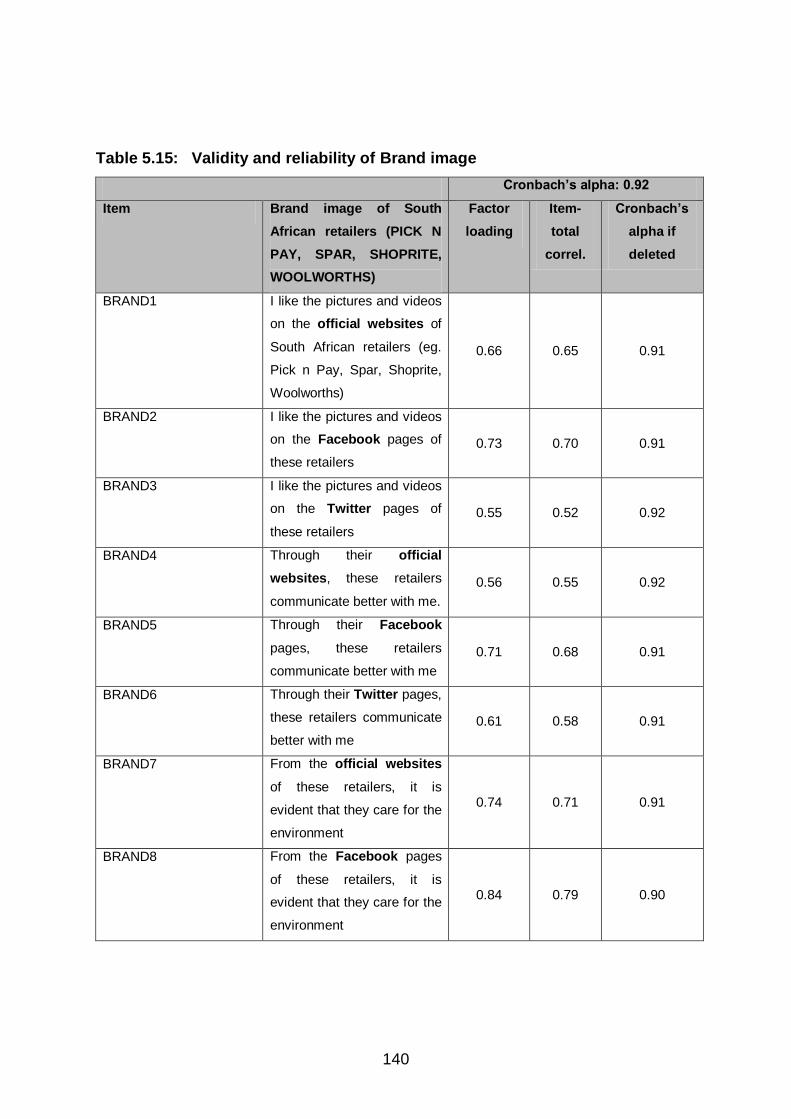
140
Table 5.15: Validity and reliability of Brand image
Cronbach’s alpha: 0.92
Item Brand image of South
African retailers (PICK N
PAY, SPAR, SHOPRITE,
WOOLWORTHS)
Factor
loading
Item-
total
correl.
Cronbach’s
alpha if
deleted
BRAND1 I like the pictures and videos
on the official websites of
South African retailers (eg.
Pick n Pay, Spar, Shoprite,
Woolworths)
0.66 0.65 0.91
BRAND2 I like the pictures and videos
on the Facebook pages of
these retailers
0.73 0.70 0.91
BRAND3 I like the pictures and videos
on the Twitter pages of
these retailers
0.55 0.52 0.92
BRAND4 Through their official
websites, these retailers
communicate better with me.
0.56 0.55 0.92
BRAND5 Through their Facebook
pages, these retailers
communicate better with me
0.71 0.68 0.91
BRAND6 Through their Twitter pages,
these retailers communicate
better with me
0.61 0.58 0.91
BRAND7 From the official websites
of these retailers, it is
evident that they care for the
environment
0.74 0.71 0.91
BRAND8 From the Facebook pages
of these retailers, it is
evident that they care for the
environment
0.84 0.79 0.90
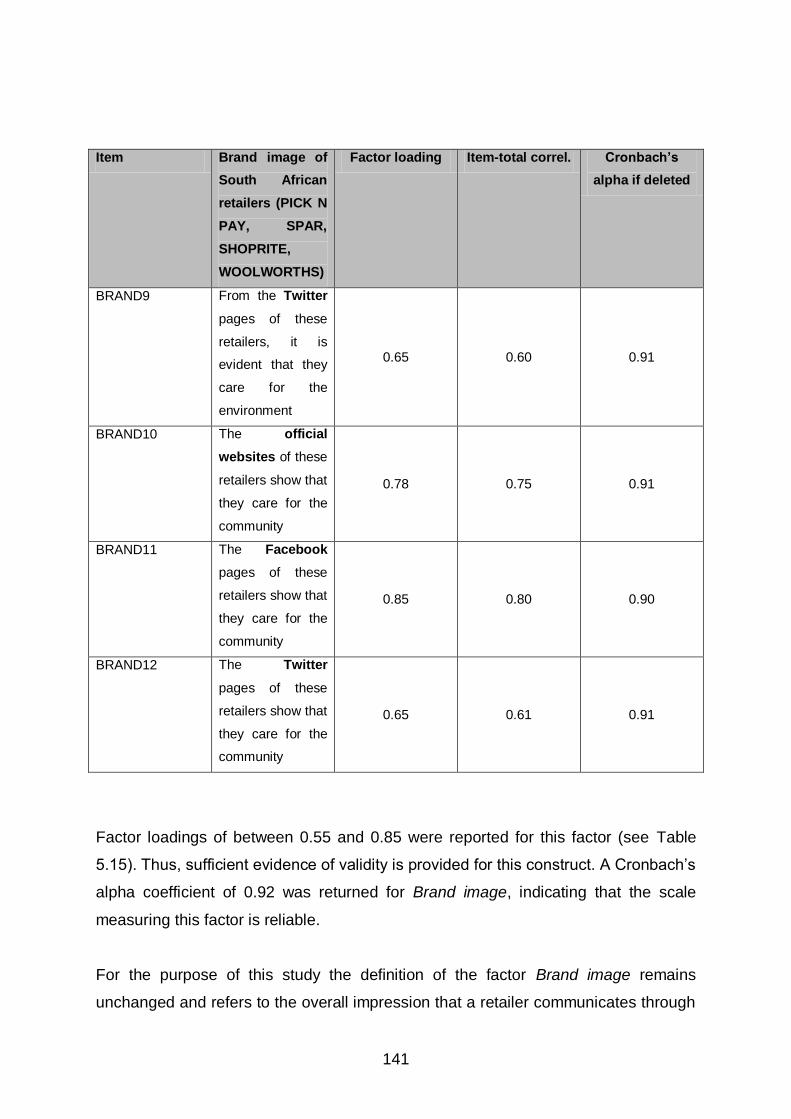
141
Item Brand image of
South African
retailers (PICK N
PAY, SPAR,
SHOPRITE,
WOOLWORTHS)
Factor loading Item-total correl. Cronbach’s
alpha if deleted
BRAND9 From the Twitter
pages of these
retailers, it is
evident that they
care for the
environment
0.65 0.60 0.91
BRAND10 The official
websites of these
retailers show that
they care for the
community
0.78 0.75 0.91
BRAND11 The Facebook
pages of these
retailers show that
they care for the
community
0.85 0.80 0.90
BRAND12 The Twitter
pages of these
retailers show that
they care for the
community
0.65 0.61 0.91
Factor loadings of between 0.55 and 0.85 were reported for this factor (see Table
5.15). Thus, sufficient evidence of validity is provided for this construct. A Cronbach’s
alpha coefficient of 0.92 was returned for Brand image, indicating that the scale
measuring this factor is reliable.
For the purpose of this study the definition of the factor Brand image remains
unchanged and refers to the overall impression that a retailer communicates through

142
business activities to customers and shareholders. Furthermore, the image of a
retailers’ brand is formed by the opinions and attitudes of customers towards a
business’s products/services.
5.4.2 Dependent variable
The results of the EFA on the dependent variable Customer purchasing behaviour is
tabled and discussed in the following section.
(a) Customer purchasing behaviour
A total of 7 items were originally created to measure the construct Customer
purchasing behaviour, and all 7 items (CPB1, CPB2, CPB3, CPB4, CPB5, CPB6 and
CPB7) loaded onto one construct, as expected (see Table 5.16).

143
Table 5.16: Validity and reliability of Customer purchasing behaviour (CPB)
Cronbach’s alpha: 0.86
Item Customer purchasing behaviour
from social media tools (Official
Websites, Facebook, Twitter)
Factor
loading
Item-total
correl.
Cronbach’s
alpha if
deleted
CPB1 I use social media tools (Official
websites, Facebook, Twitter) to
compare products/services of different
retailers
0.72 0.67 0.83
CPB2 Comments and information shared
by South African retailers (eg. Pick n
Pay, Spar Shoprite, Woolworths) on
their social media tools influence my
purchasing decisions
0.81 0.75 0.82
CPB3 Other customers’ comments on
social media tools influence my
purchasing decisions
0.77 0.71 0.83
CPB4 I use social media tools to make my
final purchasing decisions 0.72 0.66 0.84
CPB5 Since South African retailers started to
use social media tools, I purchase
more of their products
0.76 0.70 0.83
CPB6 I more often (frequently) purchase
online from South African retailers than
in their physical store outlets
0.54 0.50 0.86
CPB7 I spend larger amounts of money
when I purchase online from South
African retailers than when I purchase
in store
0.46 0.42 0.86
Customer purchasing behaviour reported factor loadings of between 0.46 and 0.81
(Table 5.16), which provides evidence of validity for this construct. The Cronbach’s
alpha coefficient is 0.86, indicating that the measuring scale used to measure this
construct is reliable.

144
The definition of Customer purchasing behaviour, as a result of the factor analysis,
remains unchanged. For the purpose of this study customer purchasing behaviour is
defined as the way in which individuals, groups and businesses choose, purchase,
use and dispose products/services, ideas or experiences in order to satisfy unique
needs and wants. Furthermore, what a customer buys, where a customer buys, how
a customer buys and how often a customer buys forms part of a customer’s
purchasing behaviour.
5.5 EMPIRICAL RESULTS ON THE VARIABLE RELATIONSHIPS
In the following section, the results of the descriptive statistics of the variables are
displayed and discussed. Pearson’s Product Moment Correlations were used to
determine the correlations between various factors investigated, and these
correlations will be discussed. Furthermore, the multiple linear regression analysis
used to investigate the influence of the independent variables on the intervening
variable and dependent variable will be discussed.
5.5.1 Descriptive statistics on variables
In order to describe the sample data from the measuring instrument, descriptive
statistics were calculated. The descriptive statistics included the mean, standard
deviation and frequency distributions. The measuring instrument made use of a five-
point Likert-type scale. However, to ensure briefness, the frequency distribution
responses were placed in three different categories (Table 5.17), as follows:
“Low”: for factor scores between 1 and 2.33;
“Medium”: for factor scores between 2.34 and 3.67; and
“High”, for factor scores between 3.68 and 5.

145
Table 5.17: Descriptive statistics on variables (N=180)
Factors Mean Std. Dev Low% Medium% High%
Independent variables
Official websites 2.09 0.96 60.60 33.33 6.10
Facebook 1.82 1.01 72.20 20.60 7.20
Twitter 1.32 0.81 90.00 5.00 5.00
Intervening variable
Brand image 2.09 0.87 59.40 37.80 2.80
Dependent variable
Customer purchasing
behaviour 1.95 0.86 66.70 30.00 3.30
The independent variable Official websites reported a mean score of 2.09. The
majority of respondents (60.60%) disagreed that they regularly visit Official websites
to communicate with retailers, to view special product/service offers and
product/service information, to participate in competitions, to view business activities
and images and videos. Furthermore, the majority of respondents (60.60%)
disagreed that they purchase products/services from these Official websites.
The independent variable Facebook returned a mean score of 1.82. The majority of
respondents (72.20%) disagreed that they have “liked” a retailer’s Facebook page,
that they make use of Facebook to communicate with retailers or other customers,
that they view special product/service offers and product information, participate in
competitions, view retailer activities and images and videos, or to view the comments
made by other customers.
The independent variable Twitter returned a mean score of 1.32. Most of the
respondents (90.00%) disagreed that they follow a retailer on Twitter, that they use
Twitter to view product/service information, special product/service offers, business
activities, images and videos, to communicate with a business or other customers

146
and that they feel as if they are part of an online community when using the Twitter
pages of a business.
The intervening variable Brand image returned a mean score of 2.09. Most of the
respondents (59.40%) disagreed that retailers currently have a positive brand image
in their minds.
Finally, the dependent variable Customer purchasing behaviour returned a mean
score of 1.95. Most of the respondents (66.70%) disagreed that they currently
compare products/services, that the comments and information found on social
media tools affects their purchasing decision, that they use social media tools to view
the comments of other customers and that they use social media tools to make their
final purchasing decision. Furthermore, the majority of the respondents, 66.70%
disagreed that they purchase more of the retailers’ products/services, that they
purchase more frequently and that they spend larger amounts of money since
retailers have been using social media tools (Official websites, Facebook and
Twitter).
5.5.2 Pearson’s Product Moment Correlations
The Pearson’s Product Moment Correlations were calculated to allow for the
investigation of correlations between the variables used in this study. The results of
the Pearson’s Product Moment Correlations are presented in Table 5.18.

147
Table 5.18: Pearson’s correlations coefficients
Factors
1 2 3 4 5
Official
websites
Facebook Twitter Brand
image
Customer
purchasing
behaviour
1 Official
websites 1.00
2 Facebook 0.575 1.00
3 Twitter 0.250 0.399 1.00
4 Brand image 0.626 0.664 0.565 1.00
5
Customer
purchasing
behaviour
0.629 0.636 0.490 0.690 1.00
(p<0.05)
The Pearson’s Product Moment Correlations indicates significant positive (p<0.05)
correlations between all the variables of this study.
The factor Official websites reported a strong positive correlation with the factor
Facebook (r = 0.575). The factor Twitter reported a weak positive correlation with the
factor Official websites (r = 0.250), and reported a moderate positive correlation with
the factor Facebook (r = 0.399).
The intervening variable Brand image reported strong positive correlations with the
independent variables Official websites (r = 0.626), Facebook (r = 0.664) and Twitter
(r = 0.565).
The dependent variable Customer purchasing behaviour reported strong positive
correlations with factors Official Websites (r = 0.629), Facebook (r = 0.636) and

148
Brand image (r = 0.690) and reported a moderate positive correlation with the factor
Twitter (r = 0.490).
As a result of the Pearson’s Product Moment Correlation calculation, it is clear that
positive correlations exist between the independent variables, intervening variable
and dependent variable.
5.5.3 Results of the Multiple Regression Analysis
To determine the influence of the various independent variables (Official websites,
Facebook and Twitter) on the Brand image (intervening variable) of retailers and
their Customer purchasing behaviour (dependent variable), multiple linear regression
analyses were conducted. Three separate regression models were constructed to
fulfil this purpose.
The first multiple regression analysis determined the influence of the independent
variables on the Brand image (intervening variable) of retailers (see Table 5.19).
Table 5.19: Influence of the independent variables on Brand image
Intervening variable: Brand image R-Square = 0.63
Independent variables Beta t-value Sig.(p)
Official websites 0.35 6.32 0.0000***
Facebook 0.32 5.44 0.0000***
Twitter 0.35 6.97 0.0000***
(*p<0.05; **p<0.01; ***p<0.001)
The multiple regression analysis (Table 5.19) shows that significant positive
relationships (0.000; p<0.001) are reported between Official websites, Facebook,
Twitter and Brand image. As these relationships are positive, it indicates that the
more retailers use these three social media tools, the more likely it is that the
business’s brand image will improve.
As mentioned, a separate regression analysis was conducted to determine the
relationships between the intervening variable Brand image of retailers and the
dependent variable Customer purchasing behaviour (see Table 5.20).

149
Table 5.20: Influence of the intervening variable on Customer purchasing
behaviour
Dependent variable: Customer purchasing behaviour R-Square = 0.48
Intervening variable Beta t-value Sig.(p)
Brand image 0.69 12.72 0.0000***
(*p<0.05; **p<0.01; ***p<0.001)
From Table 5.20, it is clear that a significant positive linear relationship exists
between Brand image and Customer purchasing behaviour (0.0000; p<0.01). In
other words, a retailer that has a positive brand image is likely to positively influence
the purchasing behaviour of customers.
Table 5.21 displays the results of the multiple regression analysis conducted to
determine the relationships between the independent variables (Official websites,
Facebook and Twitter) and the dependent variable (Customer purchasing
behaviour).
Table 5.21: Influence of the independent variables on Customer purchasing
behaviour
Dependent variable: Customer purchasing behaviour R-Square = 0.57
Intervening variable Beta t-value Sig.(p)
Official websites 0.38 6.36 0.0000***
Facebook 0.31 4.80 0.0000***
Twitter 0.27 5.03 0.0000***
(*p<0.05; **p<0.01; ***p<0.001)
The multiple regression analysis shows that significant positive relationships (0.000;
p<0.001) are reported between Official websites, Facebook, Twitter and Customer
purchasing behaviour. Thus, a retailer that actively engages in the use of these three
social media tools is likely to positively influence the purchasing behaviour of
customers.

150
To summarise the results of the multiple regression analyses, the research
hypotheses formulated to determine the relationships among the independent
variables, intervening variable and dependent variable can now be assessed:
H1: There is a significant positive relationship between Official websites and
Brand image.
H2: There is a significant positive relationship between Facebook and Brand
image.
H3: There is a significant positive relationship between Twitter and Brand image.
H4: There is a significant positive relationship between Brand image and
Customer purchasing behaviour.
Based on the above hypotheses and empirical results, the hypotheses H1, H2 and H3
are accepted as significant positive relationships exist between each of the
independent variables (Official websites, Facebook and Twitter) and the intervening
variable (Brand image). In addition, H4 is accepted as there is a significant positive
relationship between the intervening variable (Brand image) and the dependent
variable (Customer purchasing behaviour).
5.6 RESULTS OF THE DEMOGRAPHIC DATA T-TEST AND ANOVA
Despite the primary objective of this study, to investigate the influence of social
media tools on the Brand image of retailers and how it affects Customer purchasing
behaviour, an analysis was also conducted to determine the influence of selected
demographic variables on the perceptions of respondents with regard to the
independent variables, intervening variable and dependent variable. For this
purpose, a t-test and ANOVA was conducted.

151
5.6.1 Results of the t-test
A t-test was conducted to determine the respondents’ perceptions of the
independent variables, the intervening variable and dependent variable.
The following hypotheses have been formulated:
H0a: There is no difference between the mean scores of gender and Official
websites.
H0b: There is no difference between the mean scores of gender and Facebook.
H0c: There is no difference between the mean scores of gender and Twitter.
H0d: There is no difference between the mean scores of gender and Brand image.
H0e: There is no difference between the mean scores of gender and Customer
purchasing behaviour.
It was decided that the influence of respondents’ gender on the perceptions
regarding the independent, intervening and dependent variables were to be
determined. The reason for this is the general perception that the purchasing
behaviours and patterns of males and females are different. The results of the t-test
are displayed in Table 5.22.

152
Table 5.22: The influence of gender on the perceptions regarding the
independent, intervening and dependent variables
Independent variables t-value Sig.(p)
Official websites 1.06 0.2927
Facebook 0.56 0.5754
Twitter -2.46 0.0150*
Intervening variable t-value Sig.(p)
Brand image 0.62 0.5332
Dependent variable t-value Sig.(p)
Customer purchasing
behaviour -0.46 0.6443
(*p<0.05; **p<0.01; ***p<0.001)
As a result of the t-test (Table 5.22), it is evident that there are significant differences
in responses based on the gender of respondents and their use of Twitter. It is
therefore evident that whether respondents were male or female had an influence on
their perceptions regarding the use of Twitter. A Cohen’s d value of 0.38 was
reported for the independent variable Twitter, indicating that these mean scores are
of small practical significance.
5.6.2 Results of the analysis of variance
The demographic information of respondents was requested in section B of the
measuring instrument. This included information relating to the gender, age and race
of respondents. Furthermore, information relating to which social media tools the
respondent makes use of, which social media tools of retailers the respondent uses
and from which retailer the respondent purchases most of his/her products/services
were requested.
An ANOVA was undertaken to determine whether the perceptions of the
respondents were influenced by demographic variables (age). As the study

153
considers social media tools, a fairly recent technological development and use for
businesses, the researcher investigated the impact of customers’ age on their
perspective regarding social media tools. To determine significant differences
between individual mean scores for respondents’ age categories, post-hoc Tukey
tests were calculated, and the practical significance was determined and assessed
by calculating Cohen’s d values.
(a) Demographic variable – age
Table 5.23 displays the ANOVA results for the age demographic variable.
Table 5.23: The ANOVA results for the age demographic variable
Independent variables F-value Sig.(p)
Official websites 3.35 0.0114*
Facebook 3.19 0.0148*
Twitter 3.69 0.0065**
Intervening variable F-value Sig.(p)
Brand image 5.33 0.0004***
Dependent variable F-value Sig.(p)
Customer purchasing
behaviour 4.19 0.0029**
(*p<0.05; **p<0.01; ***p<0.001)
The results of the ANOVA (Table 5.23) reported significant relationships between the
demographic variable age and the variables Official websites (p<0.05), Facebook
(p<0.05), Twitter (p<0.01), Brand image (p<0.001) and Customer purchasing
behaviour (p<0.01).
The post-hoc Tukey test established significant differences regarding the age of the
respondent and Official websites, Facebook, Twitter, Brand image and Customer
purchasing behaviour. With regard to respondents’ use of Official websites, the post-
154
hoc Tukey test identified a statistical significant difference (p<0.01) between
respondents younger than 20 years of age (ẋ=1.72) and respondents aged between
30 and 39 years (ẋ=2.49). A Cohen’s d value of 0.96 indicates that the mean scores
are of large practical significance. The difference in mean scores suggests that
respondents younger than 20 years of age use the Official websites of retailers less
regularly than respondents between the ages of 30 and 39 years.
With regard to respondents’ use of Facebook, a statistical significant difference
(p<0.05) is evident between respondents between the ages of 30 and 39 years
(ẋ=2.15) and respondents older than 50 years of age (ẋ=1.33). A Cohen’s d value of
0.85 indicates the difference to be of large practical significance. The difference in
mean scores suggest that younger respondents, between the ages of 30 and 39
years, are more likely to make use of the Facebook pages of retailers than
respondents older than 50 years of age.
With regard to respondents’ use of Twitter, a statistical significant difference (p<0.05)
is found between respondents younger than 20 years of age (ẋ=1.09) and
respondents between the ages of 20 and 29 years (ẋ=1.60). A Cohen’s d value of
0.58 indicates this difference to be of moderate practical significance. The difference
in mean scores suggest that respondents younger than 20 years of age are less
likely to make use of the Twitter pages of retailers than respondents between the
ages of 20 and 29 years. Furthermore, with regard to respondent’s use of Twitter, a
statistical significant difference (p<0.05) is evident among respondents between the
ages of 20 and 29 years (ẋ=1.60) and respondents between the ages of 40 and 49
years of age (ẋ=1.12). A Cohen’s d value of 0.51 regards these mean scores to be of
moderate practical significance. The difference in mean scores indicate that
respondents between the ages of 20 and 29 years are more likely to make use of the
Twitter pages of retailers than respondents between the ages of 40 and 49 years.
With regard to Brand image, a statistical significant difference (p<0.01) is found
among respondents younger than 20 years of age (ẋ=1.70) and respondents
between the ages of 20 and 29 years (ẋ=2.36). A Cohen’s d value of 0.76 indicates
that the mean scores are of moderate practical significance. The difference in mean
scores suggests that the Brand image of respondents between the ages of 20 and

155
29 are more greatly influenced than that of respondents younger than 20 years. A
statistical significant difference (p<0.05), with regard to Brand image, was found
among respondents younger than 20 years of age (ẋ=1.70) and respondents aged
between 30 and 39 years (ẋ=2.32). A Cohen’s d value of 0.82 suggests that the
mean scores are of large practical significance. The difference in mean scores
suggest that the Brand image of respondents between the ages of 30 and 39 years
are more greatly influenced than that of respondents younger than 20 years.
Furthermore, with regard to Brand image, a statistical significant difference (p<0.05)
is evident among respondents between the ages of 20 and 29 (ẋ=2.36) and
respondents older than 50 years of age (ẋ=1.71). A Cohen’s d value of 0.71
suggests that the mean scores are of moderate practical significance. The difference
in mean scores suggests that the Brand image of respondents between the ages of
20 and 29 years are more greatly influenced than that of respondents older than 50
years of age.
A statistical significant difference (p<0.05) is evident among respondents younger
than 20 years of age (ẋ=1.63) and respondents between the ages of 20 and 29
(ẋ=2.12) in relation to Customer purchasing behaviour . A Cohen’s d value of 0.58
indicates that the mean scores are of moderate practical significance. The difference
in mean scores suggest that retailers’ use of social media tools regulate the
purchasing behaviour of respondents aged between 20 and 29 years more than
respondents younger than 20 years of age.
Furthermore, a statistical significant difference (p<0.05), in relation to Customer
purchasing behaviour, is found among respondents younger than 20 years of age
(ẋ=1.63) and respondents between the ages of 30 and 39 years (ẋ=2.29). A Cohen’s
d value of 0.89 suggests that the mean scores are of large practical significance. The
difference in mean scores indicates that retailers’ use of social media tools regulate
the purchasing behaviour of older respondents, between the ages of 30 and 39
years, more than younger respondents, younger than 20 years of age.
Lastly, in relation to Customer purchasing behaviour, a statistical significant (p<0.05)
was found among respondents between the ages of 30 and 39 (ẋ=2.29) and
respondents older than 50 years of age (ẋ=1.60). A Cohen’s d value of 0.85 indicates

156
this difference to be of large practical significance. The difference in mean scores
suggest that retailers’ use of social media tools regulates the purchasing behaviour
of younger respondents, between the ages of 30 and 39, more than older
respondents, older than 50 years of age.
5.7 SUMMARY
The empirical results of this study were presented and discussed in this chapter. A
summary of the demographic information detailing the gender, age and population
group of respondents was provided.
Thereafter, the assessment results of the validity and reliability of the measuring
instrument were provided. Based on the validity and reliability results, all of the
variables used in this study maintained the original definitions. No variables were
eliminated, no variables’ names were changed and therefore the hypothetical model
and its hypotheses remained unaffected. The results confirmed validity and reliability
of the measuring instrument.
The previous section provided the empirical results of the proposed relationships of
this study and these were displayed through descriptive statistics, the Pearson’s
Product Moment Correlations and the multiple regression analyses. The proposed
hypothetical model, along with its variables, was empirically tested through the use
of the multiple regression analyses. Significant positive relationships were found
between the independent variables (Official websites, Facebook and Twitter) and the
intervening variable (Brand image). Furthermore, a significant positive relationship
was found between the intervening variable (Brand image) and dependent variable
(Customer purchasing behaviour). Lastly, a t-test and ANOVA test were conducted
to determine the associations and relationships among demographical aspects of
respondents and variables used in this study.
The following, and final chapter of this study, chapter 6, will provide a summary of
the whole study. This will be followed by the main empirical results from chapter 5
and recommendations will be made. This chapter will focus on suggested
recommendations to retailers on how to use social media tools to improve their
Brand image and positively influence Customer purchasing behaviour. Lastly,

157
chapter 6 will state the contributions made by this study, the limitations of this study
and suggestions for future research will be made.

158
CHAPTER 6 SUMMARY, CONCLUSIONS AND RECOMMENDTIONS
6.1 INTRODUCTION
In chapter 5, the results of the empirical investigation conducted to achieve the
primary objective of this study were presented and discussed. Chapter 6, the final
chapter, will provide a broad overview of this study. The most important findings, as
well as the main empirical findings of this study will be highlighted.
Recommendations, based on the empirical results, will be proposed. Furthermore,
the contributions and limitations of this study will be presented. Finally, future
research possibilities will be provided.
6.2 OVERVIEW OF THE RESEARCH
Retailers, both nationally and internationally, play a dominant role in supply chains,
contribute largely to economies and GDP, are a major source of employment and
contribute to sustainable practices. However, retailers’ marketing strategies are
regularly challenged due to the pressures of the external business environment, and
the ever changing industry structure. Increased levels of competition among retailers
and constant changes in the business environment have led to retailers having to
continuously find new and innovative ways of ensuring good quality customer service
and high sales levels. Some retailers have incorporated social media tools as part of
their marketing strategy attempting to influence and manage their brand image.
However, little evidence exists as to how effective social media tools are for creating
a positive brand image in the minds of customers. For this reason, the purpose of
this study was to investigate the influence of social media tools on the brand image
of retailers, and the relationship between brand image and the purchasing behaviour
of customers in the retail industry. The social media tools used in this study included
Official websites, Facebook and Twitter. Due to the nature of this study, Official
websites, Facebook and Twitter were used as they are the most commonly
recognised social media tools. The possible relationships between social media
tools, brand image and customer purchasing behaviour were proposed in a
hypothetical model.

159
The primary objective of this study was to investigate the influence of social media
tools on the Brand image of retailers and how it affects Customer purchasing
behaviour of retail customers in the Eastern Cape.
To aid in the achievement of the primary objective, the following secondary
objectives were formulated:
To develop and undertake a detailed theoretical investigation of the nature of
social media tools, the brand image of retailers and the purchasing behaviour
of customers.
To develop a hypothetical model to test the relationships between social
media tools (Official websites, Facebook and Twitter), the Brand image of
retailers and Customer purchasing behaviour.
To empirically test the influence of three social media tools (Official websites,
Facebook and Twitter) as independent variables on the Brand image
(intervening variable) of retailers and Customer purchasing behaviour
(dependent variable).
To provide recommendations, based on the empirical results generated in this
study on how social media tools can be used to create a positive Brand image
which will positively influence Customer purchasing behaviour.
Thereafter, a comprehensive literature review was conducted on social media tools,
Brand image and Customer purchasing behaviour, presented in chapter 2 and
chapter 3.
Chapter 2 focussed on the retail environment and highlighted its importance. Before
the literature study on retailers and their importance was commenced, it was evident
that a number of different definitions could possibly be used to identify a retailer. For
the purpose of this study, a retailer was defined as any person or business which
buys final products/services from wholesalers and sells to the public, to fulfil
160
customer needs and wants. This chapter discussed the importance of retailers by
discussing their dominant role in supply chain control, their influence on the economy
and GDP, employment offered and their contribution to sustainability. The different
types of retailers, namely store-based retailers and non-store based retailers, were
mentioned and discussed. Recent developments in the South African retail
environment were discussed. This chapter mentioned and discussed four successful
South African retailers, namely Pick n Pay, Woolworths, Spar and Shoprite. For the
purpose of this study, the term brand image was defined as the overall impression
that a retailer communicates, through business activities, to customers and
shareholders. The image of a retailers’ brand is formed by the opinions and attitudes
of customers towards a business’s products/services. Brand image was discussed
by focussing on elements such as the importance of a positive brand image, the use
of social media tools for creating a positive brand image and a discussion on how
South African retailers create a positive brand image in the minds of their customers.
Lastly, for the purpose of this study, customer purchasing behaviour was defined as
what a customer buys, where a customer buys, how a customer buys and how often
a customer buys forms a customer’s purchasing behaviour. Additionally, customer
purchasing behaviour was also defined as the way in which individuals, groups and
businesses choose, purchase, use and dispose products/services, ideas or
experiences in order to satisfy unique needs and wants.
Chapter 3 of this study concentrated on social media as a marketing communication
tool. The term marketing was defined by focussing on the four P’s of marketing,
namely, product, price, place and promotion. This chapter highlighted the different
types of marketing tools used by retailers, namely, newspaper advertising, magazine
advertising, broadcast advertising, outdoor advertising, direct mail advertising and
Internet advertising. Thereafter, the term social media was defined. The advantages
of the use of social media, namely, social media as a customer interaction tool,
social media as a customer-customer interaction tool, the reach of social media and
social media as a marketing communication tool were explained. Thereafter, the
three social media tools used in this study (Official websites, Facebook and Twitter),
the independent variables, were mentioned, and the use of these social media tools
by four South African retailers (Pick n Pay, Woolworths, Spar and Shoprite) were
investigated. It was evident that all four retailers are using all three social media tools

161
extensively in their operations. Various literature sources were used to identify how
each of the independent variables used in this study could possibly lead to a positive
brand image in the minds of customers. Thus, the first two secondary objectives of
this study were achieved in chapter 1, chapter 2 and chapter 3.
The research methodology of this study was explained in chapter 4. In this chapter,
the way in which the hypothetical model and the research hypotheses would be
empirically tested was mentioned and discussed. A positivistic research paradigm
was implemented, given the nature of the problem statement and research
objectives used in this study. The population of the study was made up of retail
customers in the Eastern Cape and the sample size consisted of 220 respondents.
To identify respondents for the investigation, the convenience sampling technique
was incorporated. Secondary sources were used for the process of creating a self-
constructed and self-administered questionnaire. The questionnaire consisted of
three sections. Questionnaires were distributed to retail customers who indicated
willingness to partake. A total of 180 usable questionnaires were returned. The data
collected from these questionnaires were analysed by means of a variety of different
statistical techniques and analyses. These statistical techniques included descriptive
statistics, Pearson’s Product Moment Correlations, multiple regression analyses, a t-
test, ANOVA tests, post-hoc Tukey tests and Cohen’s d values. Chapter 4
contributed to the achievement of the third secondary objective of this study.
Chapter 5 presented the empirical results of the study. Chapter 5 contributed to the
achievement of the third secondary objective of this study. This chapter provided
descriptive statistics on the demographic information of respondents. To confirm the
validity and reliability of the measuring instrument used in this study, an EFA was
conducted. As a result of the EFA, no definitions of variables were adapted. None of
the initial variables used in this study were eliminated, and no additional variables
occurred as a result of the factor loadings. Therefore, the hypothetical model and
research hypotheses remained unchanged. All of the factor loadings were above
0.40, indicating validity of the measuring instrument used for this study. Thereafter,
the variables were exposed to further statistical analyses. Cronbach’s alpha
coefficients were calculated for each factor that emerged from the EFA to determine
internal consistency. This was done to test the reliability of the measuring instrument.

162
Cronbach’s alpha coefficients of greater than 0.70 were reported for all of the factors,
indicating reliability of the measuring scales used in this study.
Furthermore, descriptive statistics were calculated in order to summarise and
interpret the sample data. The independent variable Official websites returned a
mean score of 2.09, which was the highest of the independent variables. This
indicates that most of the respondents do not make use of the Official websites of
South African retailers. The remaining independent variables (Facebook and Twitter)
returned mean scores of 1.82 and 1.32 respectively, with most of the respondents
disagreeing with items in the measuring instrument used to measure the
independent variables, again indicating low use of the Facebook and Twitter pages
of retailers. The intervening variable Brand image returned a mean score of 2.09.
The mean score of Brand image indicate that most of the respondents disagreed
with the items in the measuring instrument, suggesting that respondents do not have
highly positive brand images of retailers. Lastly, the dependent variable Customer
purchasing behaviour reported a mean score of 1.95, indicating that most of the
respondents disagreed with the items used to measure the dependent variable,
suggesting that respondents’ purchasing behaviour are currently not as retailers
desire.
To establish the correlations between the investigated variables in this study,
Pearson’s Product Moment Correlations were calculated. All the independent
variables (Official websites, Facebook and Twitter) were positively correlated with
the intervening variable (Brand image) and the dependent variable (Customer
purchasing behaviour). Furthermore, strong positive correlations were found
between the independent variables.
Multiple regression analyses were conducted to determine the influence of the
various independent variables (Official websites, Facebook and Twitter) on the
Brand image of retailers and Customer purchasing behaviour. Furthermore, the
relationship among the intervening variable (Brand image) and dependent variable
(Customer purchasing behaviour) was also assessed by a multiple regression
analysis. Relationships at the 5% (p<0.05), 1% (p<0.01) and 0.1% (p<0.001) levels
were considered significant and were reported. Significant positive relationships

163
between the independent variables (Official websites, Facebook and Twitter), the
intervening variable (Brand image) and the dependent variable (Customer
purchasing behaviour) were reported. These significant relationships are presented
in Figure 6.1.
Figure 6.1: Summary of relationships from the multiple regression analyses
Brand image
H1;p<0.001
H2;p<0.001
H3;p<0.001
H4;p<0.001
H5;p<0.001
Official
websites
Customer
purchasing
behaviour
From Figure 6.1, it is evident that significant relationships exist between:
The independent variables Official websites, Facebook and Twitter, and the
intervening variable Brand image.
The intervening variable Brand image and the dependent variable Customer
purchasing behaviour.
The independent variables Official websites, Facebook and Twitter, and the
dependent variable Customer purchasing behaviour.
As mentioned, the primary objective of this study was to investigate the influence of
social media tools, Official websites, Facebook and Twitter, on the Brand image of

164
retailers, and Customer purchasing behaviour of retail customers in the Eastern
Cape. Based on the results of the statistical analyses conducted, the primary
objective of this study was achieved. All four initial hypotheses were accepted. As a
result of the third multiple regression analysis, a fifth hypothesis (see Figure 6.1) was
formulated and based on the results, H5 was accepted.
A t-test and ANOVA was undertaken to determine the influence of a selected
demographic variable (age) of respondents regarding the independent variables,
intervening variable and dependent variable. As the study considers social media
tools, a fairly recent technological development and use for businesses, the
researcher investigated the impact of customers’ age on their perspective regarding
social media tools. Relationships reported were considered significant as the 5%
(p<0.05), 1% (p<0.01) and 0.1% (p<0.001) levels. Post-hoc Tukey tests were
conducted to determine the statistical significance between the differences in mean
scores. Furthermore, Cohen’s d values were used to measure practical significance.
The results of the ANOVA suggested that the age of the respondents had a
significant influence on the respondent’s use of social media tools (Official websites,
Facebook and Twitter), retailers’ Brand image and Customer purchasing behaviour.
This means that in general, a customer’s use of the social media tools (Official
websites, Facebook and Twitter), the ability of a retailer to create a positive Brand
image in the minds of customers and Customer purchasing behaviour is largely
influenced by age.
Furthermore, a t-test and ANOVA was conducted to measure the influence that the
gender of respondents have on their perceptions of the independent variables,
intervening variable and dependent variable. It was decided that the influence of
respondents’ gender on the perceptions regarding the independent, intervening and
dependent variables were to be determined. The reason for this decision is the
general perception that the purchasing behaviours and patterns of males and
females are different. The results of the t-test revealed that the gender of the
respondents had a significant influence on their use of the social media tool Twitter.
It is therefore evident that whether respondents were male or female had an
influence on their perceptions regarding the use of Twitter.

165
The next section will present recommendations. The fourth secondary objective will
thus be achieved.
6.3 MAIN EMPIRICAL FINDINGS WITH RECOMMENDATIONS
Chapter 6 of this study reported that various factors have a significant influence on
the Brand image and Customer purchasing behaviour of retailers. These
relationships were reported on earlier in Section 6.2. In the following sections, these
significant relationships will be discussed and recommendations to retailers will be
made. Thus, the final secondary objective of this study will be achieved. A general
finding of this study is that, based on the mean scores, the majority of respondents
are not making use of the social media tools (Official websites, Facebook and
Twitter) of retailers (Pick n Pay, Woolworths, Spar and Shoprite). However, the
results of the multiple regression analyses suggested that a significant statistical
relationship exists among the independent (Official websites, Facebook and Twitter),
the intervening (Brand image) and dependent (Customer purchasing behaviour)
variables. This indicates that the small percentage of respondents making use of
retailers’ social media tools have a positive brand image of retailer and the use of
these social media tools positively influence their purchasing behaviour. It is thus
evident that for retailers to ensure increased levels of sales and success, they should
find ways of encouraging customers to make use of their social media tools.
6.3.1 Official websites
The findings of this study suggest that Official websites, a social media tool, has a
significant positive relationship with the Brand image of retailers. In other words,
retailers’ use of the social media tool Official websites is likely to create a positive
Brand image in the minds of customers, and have a significant positive influence on
Customer purchasing behaviour. Retailers can utilise this social media tool to
improve Brand image and positively influence Customer purchasing behaviour, thus
the following recommendations are made to retailers:
166
The Internet has changed all traditional ways of how businesses operate,
interact with customers and sell products/services. According to Tsai
(2003:162), a business operating in an online environment has the ability to
create customer value and centricity, as the business is able to closely
interact with customers. Close and regular customer interaction is necessary
for establishing business-customer relationships, which in turn is required by a
business in order to best satisfy customer needs and wants. The Internet has
influenced and changed the business-customer relationships, as the Internet
allows regular interaction (Gao 2005:9). Thus, retailers should incorporate the
use of the Internet into their marketing activities.
Retailers should use an official website to regularly provide customers with
product information, special product offers and opportunities to partake in
competitions.
Retailers should use an official website to communicate with customers, to
provide information with regard to activities participated in by the business and
to display business images and videos.
Retailers should make use of an official website to regulate post-purchase
behaviour of customers, by can encouraging customers to comment on
retailers’ products and service levels online. This will allow retailers to
determine customer satisfaction with products/services, and thereby allowing
the retailer to make necessary adjustments to products/services to ensure
future customer satisfaction.
Retailers should use their official website to encourage customers to visit and
“like” the Facebook and Twitter pages of the business.
6.3.2 Facebook
The social media tool Facebook had a significant positive influence on the Brand
image of retailers. Therefore, a retailer using Facebook to interact with customers is

167
likely to ensure a positive Brand image and positively influence Customer purchasing
behaviour.
In order for a retailer to utilise the social media tool Facebook effectively, to be able
to positively influence Brand image and Customer purchasing behaviour, the
following recommendations are suggested:
Retailers should use Facebook to advertise product information and special
product offerings, as well as provide users with the opportunity to partake in
competitions.
Retailers should encourage customers to “share” posts and updates made by
the retailer of new product offerings and special product offers. Customers
sharing posts and updates with friends on Facebook will allow the business to
advertise to a wider range of customers. Retailers can in turn reward a
customer who has shared the retailers’ posts and updates most.
Retailers should make use of Facebook to communicate with customers, to
provide information on activities participated in by the business and to display
images and videos. A business can encourage Facebook users to upload
images and videos of themselves enjoying an in-store experience, or making
use of a purchased retailer product.
Retailers should encourage customers to leave online Facebook query
messages, to which the business can provide feedback. “Friends” of a
retailer’s Facebook page can be encouraged by the business to send private
online messages or queries to the business’ inbox.
Retailers should use their Facebook page to encourage customers to visit the
official website and follow the Twitter pages of the business.

168
Retailers should make use of Facebook to regulate post-purchase behaviour
of customers. Retailers can use Facebook to determine customer satisfaction
with products/services, and thereby make necessary adjustments to
products/services to ensure future customer satisfaction.
Retailers can sell products/services on Facebook and create an online
environment in which users will feel part of an online community.
Retailers can make use of Facebook to create “events”. Retailers can make
use of this Facebook feature to invite customers to special events and to
communicate important details such as the date, place and time of the event.
6.3.3 Twitter
The findings of this study revealed that Twitter had a significant positive influence on
the brand image of retailers. Therefore, a retailer making use of Twitter to regularly
interact with customers will have an improved Brand image and Customer
purchasing behaviour.
The following recommendations are suggested for a retailer to improve their Brand
image and positively influence Customer purchasing behaviour through the use of
Twitter:
Retailers should make use of Twitter to primarily communicate with female
customers. “Tweets” can be made by the retailer to inform female customers
of special product offerings and in-store promotions.
Retailers can encourage customers to use their Twitter accounts by
advertising the Twitter account addresses in the actual store and on the price
tags of product items.

169
Retailers can use Twitter to regularly provide customers with product
information, special product offers and opportunities to partake in
competitions.
It would be beneficial for retailers to use Twitter to regularly communicate with
customers, to provide information with regard to activities participated in by
the business and to display images and videos of the business. Customers
can be encouraged to upload images and videos (onto the Twitter pages of
retailers) of their in-store experience, or of them making use of purchased
retailer products.
Retailers should make use of Twitter to regulate post-purchase behaviour of
customers. Retailers can use Twitter to determine customer satisfaction with
products/services, and thereby make necessary adjustments to
products/services to ensure future customer satisfaction.
Retailers can make “tweets” and create an online environment in which users
will feel part of an online community.
Retailers should use their Twitter page to encourage customers to visit the
official website and “like” the Facebook pages of the business.
6.3.4 Brand image
The findings of this study revealed a positive significant relationship between the
intervening variable (Brand image) and the dependent variable (Customer
purchasing behaviour). Therefore, it is evident that retailers able to create positive
associations about their business in the minds of customers are likely to positively
influence Customer purchasing behaviour.
For a retailer to create and maintain a positive Brand image and positively influence
Customer purchasing behaviour, the following is suggested:

170
Retailers can distribute printed advertisements to customers and the public
and make direct marketing efforts. These printed advertisements can be
placed in the shopping bags of customers, along with the products purchased
in store. Retailers can also use the price tags of products to advertise
important information.
Retailers should engage in marketing campaigns, as these campaigns are an
effective way for a business to remind customers of the brand and its
products/services, and have the ability to refresh or enhance the image of a
brand in the minds of customers.
Retailers should be able to satisfy their customers on a regular basis through
their products/services, generally provide customers with better quality, prices
and service. A retailer should create a positive retailer brand image by
providing customers with good quality products/services, which will satisfy
exact needs and wants.
Retailers’ social media tools (Official websites, Facebook and Twitter) should
be colourful and present the business’s logo and slogan.
6.3.5 Demographic variables
Despite the primary objective of this study being to investigate the influence of social
media tools, Official websites, Facebook and Twitter, on the Brand image of retailers
and Customer purchasing behaviour of retail customers, an analysis was conducted
to determine the influence of a selected demographic variable (age) on respondents’
responses with regard to the independent variables, intervening variable and
dependent variable. Furthermore, a t-test was conducted to determine the influence
of the gender of respondents on the perceptions that they have of the independent,
the intervening and dependent variables.
As the study considers social media tools, a fairly recent technological development
and use for businesses, the researcher investigated the impact of customers’ age on
their perspective regarding social media tools.

171
The results of the ANOVA suggested that the demographic variable age had an
influence on the respondents’ usage of Official websites, Facebook and Twitter. It
was evident that older respondents, between the ages of 30 and 39 years, make
more regular use of the Official websites of retailers than younger respondents. It
was also evident that older respondents, also between the ages of 30 and 39 years,
are more likely to make use of retailers’ Facebook pages. Lastly, the results of the
ANOVA suggested that younger respondents, between the ages of 20 and 29 years,
generally make use of the Twitter pages of retailers.
From the above information it is clear that for retailers to ensure high sales levels
and profits, they should make use of different social media tools to interact with
customers of different age groups.
Furthermore, the ANOVA revealed that the age of respondents also influenced the
Brand image of retailers. Respondents between the ages of 30 and 39 years have
the most positive Brand image of retailers. It is therefore important for retailers, for
ensuring high sales levels and profits in the future, to focus on creating a positive
Brand image in the minds of younger customers.
In addition, the results of the ANOVA revealed that the age of respondents had an
influence on their Customer purchasing behaviour. Once more, respondents
between the ages of 30 and 39 years have the most positive Customer purchasing
behaviour. This suggests that retailers can make use of social media tools to uphold
the positively influenced purchasing behaviour of customers of this age group, and to
positively influence the purchasing behaviour of younger customers by encouraging
them to use their social media tools.
The post-hoc Tukey revealed that respondents of different age groups use social
media tools (Official websites, Facebook and Twitter) for different purposes.
Furthermore, the post-hoc Tukey test suggests that respondents’ Brand image and
Customer purchasing behaviour of different age groups are influenced in different
ways.

172
To conclude, as seen in the literature review, a clear relationship exists between a
positive brand image and positive customer purchasing behaviour. A positive brand
image can influence the purchasing behaviour of customers, which will have an
effect on the performance of a business (Chaudhuri & Holbrook 2001:81). A positive
brand image has the ability to lead customers from awareness of products/services
into purchasing (Kumar 2008:192). In addition, the empirical results of this study also
suggested that a positive brand image leads to positive customer purchasing
behaviour. Therefore, a retailer that does not have a positive brand image should re-
asses the importance of creating a positive brand image in the minds of customers in
order to positively influence customer purchasing behaviour.
6.4 CONTRIBUTIONS OF THE STUDY
This study has contributed to the body of social media research, particularly in the
field of retailers. The extent to which retailers make use of social media tools has
been largely neglected and this study further confirms how these social media tools
can benefit retailers. Furthermore, this study confirmed the positive relationship
between brand image and customer purchasing behaviour for retailers.
The development of a measuring instrument that proved to be reliable and valid
assisted in the investigation of how social media tools can positively influence both
the brand image of retailers and customer purchasing behaviour. The measuring
instrument used in this study could serve as a base for developing other
questionnaires focussing on selected factors examined in this study.
The development of the hypothetical model aided in making a significant contribution
towards understanding the social media tools influencing the success of retailers. As
a result of this contribution, this study presents recommendations and suggestions to
assist retailers with their use of social media tools, to ensure that customers have a
positive brand image of the business and to ensure that customer purchasing
behaviour is positively influenced.

173
6.5 LIMITATIONS OF THE STUDY AND RECOMMENDATIONS FOR FUTURE
RESEARCH
This study attempted to make a significant contribution to the body of knowledge
relating to the use of social media tools by retailers. This study investigated and
established a greater and more in-depth understanding of the concepts social media,
brand image and customer purchasing behaviour relating to the retail environment.
However, this study encountered a number of limitations. Furthermore, this study
discovered future research opportunities. The following limitations and possibilities
for future research on social media in the retail environment are mentioned and
discussed.
The sampling method used in this study, convenience sampling, proved a limitation.
Using the convenience sampling method has various disadvantages such as
sampling bias and or the researcher not using a random process in selection
(Gravetter & Forzano 2012:151). Thus, it is impossible to generalise the findings of
this study to the entire retail environment of the Eastern Cape. A database from
which probability samples can be drawn for other researchers should be an objective
in future research.
Another limitation of this study is the sample size. A sample size of 180 retail
customers was used, and this disables the ability to accurately make a
generalisation of the population studied in the Eastern Cape. To avoid this limitation
in future studies, researchers should increase the size of the sample in order to gain
a better representation of retail customers.
This study focussed on the three most-used social media tools to determine their
influence on the brand image and customer purchasing behaviour of retail
customers. It is clear that there may be other variables that can be used to make this
assessment. Therefore, future studies concerning the use of social media tools in the
retail environment should consider investigating other social media tools that have
an influence on the brand image and customer purchasing behaviour of retail
customers. For example, other social media tools to investigate can include
LinkedIn, Pinterest, MySpace, Google Plus+.

174
This study focussed merely on a single intervening variable (Brand image), which is
a further limitation to this study. It is possible that the use of social media tools may
lead to other factors that may result in significant positive relationships with
Customer purchasing behaviour, the dependent variable. These other factors may
influence Customer purchasing behaviour, and future studies could investigate these
factors.
Future studies could attempt to investigate the influence of social media tools on the
brand image and customer purchasing behaviour of retail customers in countries
other than South Africa. Future research could be a comparative analysis of the
influence of social media tools on the brand image and purchasing behaviour of
customers used by retailers in developed and developing countries.
Despite the number of limitations, the execution and results of this study make a
significant contribution to the body of knowledge on social media tools used to
influence brand image and customer purchasing behaviour, especially in the retail
industry.
6.6 CONCLUDING REMARKS
The investigation of the influence that social media tools have on the success of a
business is growing, especially in the retail environment. This study presents a
greater understanding and deeper insights into how social media tools can be used
to positively influence both the brand image of retailers and purchasing behaviour of
customers. The findings and recommendations for future research presented by this
study attempt to provide retailers with practical recommendations on how social
media tools can be integrated into a business’s marketing efforts, and how it will
ultimately benefit the business. In other words, the study shows how retailers can
utilise social media tools such as official websites, Facebook and Twitter to positively
influence brand image and customer purchasing behaviour.
This study made a reasonable contribution to retailers, as the results suggest that in
order to improve a retailer’s brand image and customer purchasing behaviour, the
focus areas of a retailer should include the utilisation of Official websites, Facebook

175
and Twitter. The application of this study’s recommendations and suggestions may
possibly lead to retailers having more positive brand images as well as increased
sales and profits, as a result of positively influenced customer purchasing behaviour.
This may ultimately lead to more successful retailers.

176
REFERENCES
Abrams, R. 2003. The successful business plan: Secrets and strategies. 4th ed.
California: The Planning Shop.
Accenture. 2013. Accenture: Businesses that capitalize on consumer behaviour
change are better positioned to outperform economic growth, finds
Accenture. [Online] Available:
http://newsroom.accenture.com/news/businesses-that-capitalize-on-
consumer-behaviour-change-are-better-positioned-to-outperform-
economic-growth-finds-accenture.htm (Accessed 12 February 2013).
Adewunmi, F. 2012. How we made it in Africa: Four things you should know
about Africa’s retail environment. [Online] Available:
http://www.howwemadeitinafrica.com/four-things-you-should-know-about-
africas-retail-environment/17071/ (Accessed 10 February 2013).
Agarwal, V. 2010. Macroeconomics: Theory and policy. New Delhi: Pearson.
Agichtein, E., Castillo, C., Donato, D., Gionis, A. & Mishne, G. 2008. Finding
high-quality content in social media. Proceedings of the international
conference on Web search and web data mining, 183-194.
Anandan, C. 2009. Product Management. 2nd ed. New Delhi: Tata McGraw-Hill.
Andersen, P.H. 2001. Relationship development and marketing communication:
an integrative model. Journal of Business & Industrial Marketing,
16(3):167-183.
Anderson, D.R., Sweeney, D.J. & Williams, T.A. 2009. Statistics for business
and economics. 6th ed. United States of America: Thomson.
Andreasen, A.R. 2002. Marketing social marketing in the social change
marketplace. Journal of Public Policy & Marketing, 3-13.

177
Andrew, D.P.S., Pederson, P.M. & McEvoy, C.D. 2011. Research methods and
design in sport management. 1st edition. United Kingdom: Human
Kinetics.
Andrews, D.L., Mason, D.S. & Silk, M.L. 2005. Qualitative methods in sports
studies. New York: Berg.
Applegate, E. 2005. Strategic copywriting: How to create effective advertising.
United States of America: Rowman & Littlefield.
Aquaonline. 2013. Aquaonline: Cape Argus Pick n Pay Cycle Tour. [Online]
Available: http://www.aquaonline.com/showcase/the-pick-n-pay-like-
bike.aspx (Accessed 02 April 2013).
Arnold, R.A. 2008. Economics. 9th ed. United States of America: Cengage.
Arrive Alive. 2012. Arrive Alive: Make a difference by getting Liezel van der
Westhuizen over the cycle tour finish line – one click at a time. [Online]
Available: http://www.arrivealive.co.za/Print.aspx?s=1&i=2953 (Accessed
20 February 2013).
Asch, D. & Wolfe, B. 2001. New economy – new competition: The rise of the
consumer? New York: Palgrave.
Asur, S. & Huberman, B.A. 2010. Predicting the future with social media. Web
intelligence and intelligent agent technology, 1:492-499.
Babbie, E.R. 2010. The practice of social research. 12th ed. Canada: Cengage
Learning.
Baekdal, T. 2009. Baekdal: How the social web destroys traditional marketing.
[Online] Available: http://www.baekdal.com/analysis/traditional-marketing-
social-web (Accessed 18 March 2013).

178
Barker, M., Barker, D., Bormann, N. & Neher, K. 2013. Social Media Marketing:
A Strategic Approach. United States of America: Cengage.
Barker, R. & Angelopulo, G. 2006. Integrated organisational communication.
Cape Town: Juta.
Barrett, R. & Gow, M. 1997. Commerce skills. 2nd ed. United Kingdom: Nelson
Thornes.
Batra, R. & Homer, P.M. 2004. The Situational impact of brand image beliefs.
Journal of consumer psychology, 14(3):318-330.
Belén del Río, A., Vázquez, R., & Iglesias, V. 2001. The effects of brand
associations on consumer response. Journal of Consumer Marketing,
18(5):410-425.
Berardi, N., Katawazi, A. & Bellinaso, M. 2009. ASP.NET MVC 1.0 Website
programming: Problem – design – solution. United States of America:
John Wiley & Sons.
Berners-Lee, T. 2010. Long live the web. Scientific American, 303(6):80-85.
Birkholz, A. 2004. Offshoring of German high-tech IT jobs to low-wage
countries. Germany: Grin.
Black, K. 2010. Business statistics for contemporary decision making. 6th ed.
New Jersey: John Wiley & Sons.
Blakeman, R. 2005. The bare bones of advertising print design. United States
of America: Rowman & Littlefield.

179
Blanche, M.T., Durrheim, K. & Painter, D. 2006. Research in practice: Applied
methods for the social sciences. 2nd ed. Cape Town: University of Cape
Town.
Blessing, L.T.M. & Chakrabarti, A. 2009. DRM, a design research methodology.
New York: Springer.
Boesler, M. 2013. Business Insider: A perfect storm, why South Africa’s
currency has been getting destroyed. [Online] Available:
http://www.businessinsider.com/nasty-sell-off-in-south-african-rand-2013-
5 (Accessed 01 June 2013).
Bootwala, S., Lawrence, M.D. & Mali, S.R. 2009. Principles of marketing. 2nd
ed. Pune: Nirali Prakashan.
Bootwala, S., Mali, S.R. & Lawrence, M.D. 2007. Advertising and sales
promotion. Pune: Nirali Prakashan.
Bourlakis, M.A. & Weightman, P.W.H. 2004. Food supply chain management.
United Kingdom: Blackwell.
Boyd, D.M. & Ellison, N.B. 2010. Social network sites: Definition, history, and
scholarship. IEEE Engineering Management Review, 38(3):16.
Boyett, J.H. & Boyett, J.T. 2003. The guru guide to marketing: A concise guide
to the best ideas from today’s top marketers. 1st edition. New Jersey: John
Wiley & Sons.
Breckler, S., Olson, J. & Wiggins, E. 2006. Social psychology alive. United
States of America: Thomson.
Brentani, C. 2004. Portfolio management in practice. United Kingdom:
Butterworth-Heinemann.

180
Brink, A. & Berndt, A. 2004. Customer relationship management and customer
service. Cape Town: Juta.
Brink, A. & Berndt, A. 2008. Relationship marketing and customer relationship
management. Cape Town: Juta.
Brown, B.C. 2006. How to use the Internet to advertise, promote, and market
your business or web site with little or no money. Florida: Atlantic.
Brown, T.J. & Suter, T. 2012. MR. United States of America: Cengage.
Brønn, P.S. & Vrioni, A.B. 2001. Corporate social responsibility and cause-
related marketing: an overview. International Journal of Advertising,
20(2):207-222.
Brunty, J.L. & Helenek, K. 2012. Social media investigation for Law
Enforcement: Forensic studies for criminal justice. Great Britain: Newnes.
Bruce, N., Pope, D. & Stanistreet, D. 2008. Quantitative methods for health
research. New Jersey: John Wiley & Sons.
Brunty, J. & Helenek, K. 2012. Social media investigation for law enforcement.
United Kingdom: Elsevier.
Buchner, T.W. 2008. Performance management from the employee
perspective: A phenomenological study. United States of America:
ProQuest.
Bullmore, E. & Sporns, O. 2012. The economy of brain network organization.
Nature reviews neuroscience, 13(5):336-349.
Burrow, J.L. 2012. Marketing. 3rd ed. United States of America: Cengage.

181
Business Report. 2012. Business Report: Pick n Pay loyalty card exceeds
expectations. [Online] Available: http://www.iol.co.za/business/business-
news/pick-n-pay-loyalty-card-exceeds-expectations-
1.1269134#.Ua2sm4waL4g (Accessed 03 June 2013).
Bygrave, W.D. & Zacharakis, A. 2009. The portable MBA in entrepreneurship.
4th ed. New Jersey: John Wiley & Sons.
Cairns, P. 2010. Money Web: The investment case – Shoprite Holdings
Limited. [Online] Available: http://www.moneyweb.co.za/moneyweb-101-
for-beginners/the-investment-case--shoprite-holdings-limited (Accessed
04 June 2013).
Cant, M.C. 2005. Introduction to retailing. Cape Town: Juta.
Cant, M.C. 2010. Essentials of marketing. 3rd ed. Cape Town: Juta.
Cant, M.C., Strydom, J.W., Jooste, C.J. & du Plessis, P.J. 2006. Marketing
management. 5th ed. Cape Town: Juta.
Cant, M.C. & Van Heerden, C.H. 2010. Marketing management: A South
African perspective. Cape Town: Juta.
Canzer, B. 2006. E-business: Strategic thinking and practice. 2nd ed. United
States of America: Houghton Mifflin.
Capuzzi, D. & Stauffer, M.D. 2012. Career counseling: Foundations,
perspectives and applications. 2nd ed. New York: Routledge.
Carayannis, E.G., Varblane, U. & Roolaht, T. 2012. Innovation systems in small
catching-up economies: New perspectives on practice and policy. New
York: Springer.

182
Carte, D. 2009. Moneyweb: No recession for us – Shoprite. [Online] Available:
http://www.moneyweb.co.za/moneyweb-economic-trends/no-recession-
for-us--shoprite?sn=2009+Detail (Accessed 01 March 2013).
Cassell, C. & Symon, G. 2004. Essential Guide to Qualitative Methods in
Organizational Research. London: Sage.
Chan-Olmsted, S.M. 2006. Competitive strategy for media firms: Strategic and
brand management in changing media markets. London: Routledge.
Chantilly, V. 2010. BIA Kelsey: Nearly all consumers (97%) now use online
media to shop locally, according to BIA/Kelsey and ConStat. [Online]
Available: http://www.biakelsey.com/company/press-releases/100310-
nearly-all-consumers-now-use-online-media-to-shop-locally.asp
(Accessed 02 September 2013).
Chaudhuri, A. & Holbrook, M.B. 2001. The chain of effects from brand trust and
brand affect to brand performance: The role of brand loyalty. Journal of
Marketing, 65(2):81-93.
Cheng, H., Kotler, P. & Lee, N.R. 2011. Social marketing for public health:
Global trends and success stories. United Kingdom: Jones and Bartlett.
Child, D. 2006. The essentials of factor analysis. 3rd ed. Great Britain:
Continuum.
Chitty, W., Barker, N., Valos, M. & Shimp, T.A. 2012. Integrated marketing
communications. 3rd ed. United States of America: Cengage.
Clark, K. 2013. Tips on how to influence your customer’s first impressions.
[Online] Available: http://www.zeromillion.com/business/how-to-make-a-
first-impression-with-your-customer.html (Accessed 23 May 2013).

183
Cohen, L., Manion, L. & Morrison, K. 2007. Research methods education. 6th
ed. Canada: Routledge.
Connaway, L.S. & Powell, R.R. 2010. Basic research methods for librarians. 5th
ed. California: Greenwood.
Cooper, H., Hedges, L.V. & Valentine, J.C. 2009. The handbook of research
synthesis and meta-analysis. 2nd ed. New York: Russell Sage.
Constantinides, E. 2006. The marketing mix revisited: towards the 21st century
marketing. Journal of Marketing Management, 22(3-4):407-438.
Cornwall, J.R., Vang, D.O. & Hartman, J.M. 2013. Entrepreneurial financial
management: An applied approach. 3rd ed. New York: M.E. Sharpe.
Coughlin-Smith, N. 2007. EzyPzy websites - Build an Internet business. United
States of America: Award Branding.
Cox, E. 2011. Retail analytics: The secret weapon. New Jersey: John Wiley &
Sons.
Coyle, J.J., Langley, C.J., Gibson, B.J., Novack, R.A. & Bardi, E.J. 2009.
Supply chain management: A logistics perspective. 8th edition. United
States of America: Cengage.
CPA Australia. 2011. Improving business performance. [Online] Available:
http://www.cpaaustralia.com.au/cps/rde/xbcr/cpa-site/improving-business-
performance-brochure.pdf (Accessed 08 April 2013).
Cress, C. 2007. Handbook of geriatric care management. 2nd ed. London:
Jones & Bartlett.
184
Cvijikj, I.P., Cetin, G., Karpischek, S. & Michahelles, F. 2010. Influence of Facebook
on purchase decision making. Journal of Department of management,
technology and economics. 23-31.
Dahl, G. 2007. Advertising for dummies. 2nd ed. Indiana: Wiley.
Dalton, J. 2001. The Internet. Australia: Curriculum Corporation.
Dalton, J. 2002. The computer classroom: Web authoring. Australia: Curriculum
corporation.
Daymon, C. & Holloway, I. 2011. Qualitative research methods in public
relations and marketing communications. 2nd ed. New York: Routledge.
De Mooij, M. 2010. Global marketing and advertising: Understanding cultural
paradoxes. 3rd edition. United States of America: Sage.
De Mooij, M. K. 2009. Global marketing and advertising: Understanding cultural
paradoxes. 3rd ed. California: Sage.
Dennis, C., Fenech, T. & Merrilees, B. 2004. e-Retailing. New York: Routledge.
Dent, J. 2011. Distribution channels: Understanding & managing channels to
market. 2nd ed. United States of America: Kogan.
Department of finance: Mpumalanga. 2013. Department of finance
Mpumalanga: Provincial labour bulletin – February 2013. [Online]
Available:
http://finance.mpu.gov.za/documents/ea.Provincial%20Labour%20Bulletin
%20-%20February%202013.pdf (Accessed 02 June 2013).
Dickinson, B. 2013. Growth in retail jobs market strikes a positive note. [Online]
Available: http://www.bonddickinson.com/insight/publications/growth-
retail-jobs-market-strikes-positive-note (Accessed 26 September 2013).

185
Dixon, B.J. 2012. Social media for school leaders: A comprehensive guide to
getting the most out of Facebook, Twitter, and other essential web tools.
New Jersey: John Wiley & Sons.
Dochartaigh, N.Ó. 2007. Internet research skills. London: Sage.
Donald, S.H. & Gammack, J.G 2007. Tourism and the branded city (Epub) film
and identity on the pacific rim. England: Ashgate.
Donovan, R. & Henley, N. 2010. Principles and practices of social marketing:
An international perspective. 2nd ed. United Kingdom: Cambridge
University.
Doole, I. & Lowe, R. 2008. International marketing strategy: Analysis,
development and implementation. 5th ed. United States of America:
Cengage.
Dörnyei, Z. & Schmidt, R. 2001. Motivation and second language acquisition. 2nd ed.
Hawaii: National Foreign Language Resource Center.
Dos Santos, M.A., Svensson, G. & Padin, C. 2013. Indicators of sustainable
business practices: Woolworths in South Africa. Supply chain
management: An international journal, 18(1):104-108.
Doyle, A. 2013. About.com: Cost of living definition. [Online] Available:
http://jobsearch.about.com/od/glossary-c/g/cost-of-living-definition.htm
(Accessed 03 June 2013).
Dunne, P.M. & Lusch, R.F. 2008. Retailing. 6th ed. United States of America:
Thomson.
Dunne, P.M., Lusch, R.F. & Carver, J.R. 2011. Retailing. 7th ed. United States
of America: Cengage.

186
Durham, L. 2011. Supermarket & retailer: Opportunities and challenges for
South African retailers. May:33.
Durham, L. 2011. Supermarket: The threat of private lable. [Online] Available:
http://www.supermarket.co.za/news_articles.asp?ID=3063 (Accessed 01
March 2013).
Dvorak, D. 2010. Build your own brand. United States of America: Pelican.
Dyché, J. 2002. The Crm handbook: A business guide to customer relationship
management. United States of America: Addison-Wesley.
Ehrenfeld, J.R. 2005. The Roots of Sustainability. MIT Sloan Management
review, 46(2):23-25.
Ellis, N., Fitchett, J., Higgins, M., Jack, G., Lim, M., Saren, M. & Tadajewski, M.
2011. Marketing: A critical textbook. London: Sage.
Ellison, N.B., Steinfield, C. & Lampe, C. 2007. The benefits of Facebook
“friends:” Social capital and college students’ use of online social network
sites. Journal of Computer-Mediated Communication, 12(4):1143-1168.
Emerging Markets Information Service. 2013. Emerging markets information
service: Woolworths Holdings Limited. [Online] Available:
http://www.securities.com/Public/company-
profile/ZA/WOOLWORTHS_HOLDINGS_LIMITED_en_2038526.html
(Accessed 15 March 2013).
Ennew, C., Watkins, T. & Wright, M. 2012. Marketing financial services. 2nd ed.
Oxford: Butterworth-Heinemann.
Environmental Affairs and Tourism. 2008. Environmental Affairs and Tourism: A
national framework for sustainable development in South Africa. [Online]
187
Available: http://www.info.gov.za/view/DownloadFileAction?id=175921
(Accessed 02 June 2013).
Environmental Protection Agency. 2013. Environmental Protection Agency:
What is sustainability? [Online] Available:
http://www.epa.gov/sustainability/basicinfo.htm (Accessed 25 February
2013).
Euromonitor International. 2012. Euromonitor International: Retailing in South
Africa. [Online] Available: http://www.euromonitor.com/retailing-in-south-
africa/report (Accessed 25 March 2013).
Everard, K.B., Morris, G. & Wilson, I. 2004. Effective school management.
Great Britain: Sage.
Fabrigar, L.R. & Wegener, D.T. 2012. Exploratory factor analysis:
Understanding statistics. New York: Oxford University.
Facebook. 2013 a. Facebook: Woolworths SA. [Online] Available:
https://www.facebook.com/WoolworthsSA (Accessed 24 March 2013).
Facebook. 2013 b. Facebook: Pick n Pay. [Online] Available:
https://www.facebook.com/Picknpay (Accessed 24 March 2013).
Facebook. 2013 c. Facebook: My SPAR. [Online] Available:
https://www.facebook.com/myspar (Accessed 14 April 2013).
Facebook. 2013 d. Facebook: Checkers. [Online] Available:
https://www.facebook.com/checkerssa (Accessed 14 April 2013).
Facebook. 2013 e. Facebook: Facebook for business. [Online] Available:
https://www.facebook.com/business/overview (Accessed 11 February
2013).

188
Facebook. 2013 f. Woolworths SA: Customer Care. [Online] Available:
https://www.facebook.com/WoolworthsSA/app_205132682925364
(Accessed 23 February 2013).
Facebook. 2013 g. Facebook: Woolworths SA. [Online] Available:
http://www.facebook.com/WoolworthsSA#!/WoolworthsSA/app_57675755
167 (Accessed 25 February 2013).
Facebook. 2013 h. Facebook: Woolies Facebook community guide. [Online]
Available: http://www.facebook.com/WoolworthsSA#!/notes/woolworths-
sa/woolies-facebook-community-guide/10151181135504432 (Accessed
25 February 2013).
Facebook. 2013 i. Facebook: Woolworths store. [Online] Available:
http://apps.facebook.com/woolworthsstore/fbHome.jsp (Accessed 25
February 2013).
Facebook. 2013 j. Facebook: Save the rhinos with MyPlanet. [Online] Available:
http://www.facebook.com/WoolworthsSA#!/WoolworthsSA/app_18404331
4978312 (Accessed 25 February 2013).
Facebook. 2013 k. Facebook: Do one thing with MyPlanet and Woolworths.
[Online] Available:
http://www.facebook.com/WoolworthsSA#!/WoolworthsSA/app_25917169
0820294 (Accessed 25 February 2013).
Facebook. 2013 l. Facebook: Open Diary, About. [Online] Available:
http://www.facebook.com/opendiary#!/opendiary/info. (Accessed 26
February 2013).
Facebook. 2013 m. Facebook: My SPAR’s notes. [Online] Available:
https://www.facebook.com/myspar/notes (Accessed 15 April 2013).

189
Facebook. 2013 n. Facebook: SPAR Savour Magazine. [Online] Available:
https://www.facebook.com/myspar/app_109882002493604 (Accessed 15
April 2013).
Facebook. 2013 o. Facebook: Events. [Online] Available:
https://www.facebook.com/myspar/events (Accessed 15 April 2013).
Facebook. 2013 p. Checkers: About. [Online] Available:
https://www.facebook.com/checkerssa/info (Accessed 16 April 2013).
Facebook. 2013 q. Checkers: YouTube. [Online] Available:
https://www.facebook.com/checkerssa/app_57675755167 (Accessed 16
April 2013).
Facebook Developers. 2013. Facebook Developers: Like button. [Online]
Available: http://developers.facebook.com/docs/reference/plugins/like/
(Accessed 04 June 2013).
Facebook developers. 2013. Like Button. [Online] Available:
https://developers.facebook.com/docs/reference/plugins/like/ (Accessed
16 April 2013).
Farahani, R.Z., Rezapour, S. & Kardar, L. 2011. Logistics operations and
management: Concepts and models. United States of America: Elsevier.
Farfan. B. 2013. About.com: 2011 biggest global retail companies in South
Africa – Largest African retailers. [Online] Available:
http://retailindustry.about.com/od/largestsafricanretailers/a/South_african_
2011_largest_retail_global_companies_supermarkets.htm (Accessed 23
February 2013).
Fastmoving. 2013 a. Fastmoving: Pick n Pay, retailers South Africa. [Online]
Available: http://www.fastmoving.co.za/retailers/pick-n-pay-3 (Accessed
20 February 2013).

190
Fastmoving. 2013 b. Fastmoving: Woolworths. [Online] Available:
http://www.fastmoving.co.za/retailers/woolworths-1 (Accessed 01 June
2013).
Fastmoving. 2013 c. Fastmoving: Shoprite. [Online] Available:
http://www.fastmoving.co.za/retailers/shoprite-holdings-ltd-2 (Accessed 01
June 2013).
Fastmoving. 2013 d. Fastmoving: SPAR. [Online] Available:
http://www.fastmoving.co.za/retailers/spar-5 (Accessed 01 June 2013).
Fedorak, S. 2009. Pop culture: The culture of everyday life. Canada: Toronto.
Feld, S., Perrei, T., Pohlmann, N. & Schupp, M. 2011. Objectives and added
value of an Internet key figure system for Germany. ISSE.
Feldman, B.J. 2007. Surfnetkids: YouTube: What is it and why use it? [Online]
Available: http://www.surfnetkids.com/tech/1200/youtube-what-is-it-and-
why-use-it/ (Accessed 25 February 2013).
Fernández-Ballesteros, R. 2003. Encyclopedia of psychological assessment.
London: Sage.
Ferrell, O.C. & Hartline, M.D. 2010. Marketing strategy. 5th ed. United States of
America: Cengage Learning.
Finne, S. & Sivonen, H. 2009. The retail value chain: How to gain competitive
advantage through efficient consumer response (ECR) strategies. United
States of America: Kogan.
Fitzpatrick, J.J. & Kazer, M.W. 2011. Encyclopedia of nursing research. 3rd ed.
New York: Springer.

191
Folorunso, M.A. 2013. Dynamics of political communication: A treatise in
honour of Asiwaju Bola Tinubu. United Kingdom: Author House.
Franzen, M.D. 2000. Reliability and validity in neuropsychological assessment.
2nd ed. New York: Springer.
Franzen, G. & Moriarty, S. 2009. The science and art of branding. New York:
M.E. Sharpe.
Free servers. 2013. What is a website? [Online] Available:
http://www.freeservers.com/WebHosting101/WhatIsAWebsite.html
(Accessed 22 July 2013).
Freund, R.J., Wilson, W.J. & Sa, P. 2006. Regression analysis: Statistical
modelling of a response variable. 2nd ed. United States of America:
Academic.
Funk, T. 2011. Social media playbook for business: Reaching your online
community with Twitter, Facebook, LinkedIn, and more. United States of
America: Greenwood.
Funk, T. 2012. Advanced social media marketing: How to lead, launch, and
manage a successful social media. New York: Apress.
Gamble, P.R., Tapp, A., Marsella, A. & Stone, M. 2007. Marketing revolution.
2nd ed. United Kingdom: Kogan.
Gao, Y. 2005. Web systems design and online consumer behaviour. United
States of America: Idea.
Gatignon, H. 2003. Statistical analysis of management data. United States of
America: Springer.

192
Gerber, K., Delvare, I., Mabutho, L. & Ntulini, G. 2007. Economic environment.
Cape Town: Pearson.
Ginn, L. 2013. The social media hat: Using social media to influence your brand
image. [Online] Available: http://www.thesocialmediahat.com/blog/using-
social-media-influence-your-brand-image-
03112013?goback=%2Egde_4022728_member_221735256 (Accessed
24 March 2013).
Gitman, L.J. & McDaniel, C.D. 2008. The future of business: The essentials. 4th
ed. United States of America: Cengage.
Gleave, E., Welser, H.T., Lento, T.M. & Smith, M.A. 2009. A conceptual and
operational definition of ‘social role’ in online community. System
Sciences, Hawaii International conference, 1-11.
Glebbeek, A.C. & Bax, E.H. 2002. Labour Turnover and its Effects on
Performance: An Empirical Test Using Firm Data. Journal of Research
Institute of Systems, Organisations and Management, 1-25.
Gliner, J.A. & Morgan, G.A. 2000. Research methods in applied settings: An
integrated approach to design and analysis. New Jersey: Lawrence
Erlbaum.
Glynn, M.S. & Woodside, A.G. 2009. Business-to-business brand management:
Theory, research and executive case study exercises. United Kingdom:
Emerald.
Goldstruck, A. & Wronski, M. 2012. World Wide Worx: South African social
media landscape 2012. [Online] Available:
http://www.worldwideworx.com/wp-content/uploads/2012/10/Exec-
Summary-Social-Media-20121.pdf (Accessed 08 April 2013).

193
Gommans, M., Krishnan, K.S. & Scheffold, K.B. 2001. From brand loyalty to e-
loyalty: A conceptual framework. Journal of Economic and Social
Research, 3(1):43-58.
Goodwin, C.J. 2010. Research in psychology: Methods and design. 6th ed. New
Jersey: John Wiley & Sons.
Gopalan, N.P. & Sivaselvan, B. 2009. Data mining: Techniques and trends.
New Delhi: PHI.
Gordon, I. 2013. Managing the new customer relationship: Strategies to engage
the social customer and build lasting value. New Jersey: John Wiley &
Sons.
Govil, M. & Proth, J.M. 2002. Supply chain design and management: Strategic
and tactical perspectives. 1st edition. United States of America: Academic.
GPS-Business. 2013. GPS-Business: Retailers contribution to GDP. [Online]
Available: http://www.gps-business.net/industries/retailers-contribution-to-
gdp/ (Accessed 01 June 2013).
Grabianowski, E. 2013. 10 Signs the economy is improving. [Online] Available:
http://www.howstuffworks.com/10-signs-the-economy-is-
improving.htm#page=6 (Accessed 28 March 2013).
Gratton, C. & Jones, I. 2010. Research methods for sports studies. 2nd ed. New
York: Routledge.
Gravetter, F.J. & Forzano, L.A.B. 2012. Research methods: For the behavioral
sciences. 4th ed. United States of America: Cengage.
Gravetter, F.J. & Wallnau, L.B. 2007. Statistics for the behavioral sciences. 7th
ed. United States of America: Thomson.

194
Gravetter, F.J. & Wallnau, L.B. 2011. Essentials of statistics for the behavioural
science. 7th ed. United States of America: Cengage.
Federal ministry for the environment, nature conservation and nuclear safety.
2006. Greening shops and saving costs: A practical guide for retailers.
United Nations Environment Programme.
Gretzel, U., Fesenmaier, D. R., Formica, S. & O’Leary, J.T. 2006. Searching for
the future: Challenges faced by destination marketing organizations.
Journal of Travel Research, 45(1):116-127.
Groucutt, J., Leadley, P.J. & Forsyth, P. 2004. Marketing: essential principles,
new realities. 1st edition. Great Britain: Kogan.
Grover, S. 2013. eHow: What are the advantages & disadvantages of the GDP
in macroeconomics? [Online] Available:
http://www.ehow.com/info_8467424_advantages-disadvantages-gdp-
macroeconomics.html (Accessed 01 June 2013).
Gupta, S. & Randhawa, G. 2008. Retail management. New Delhi: Atlantic.
Hair, J.F., Black, W.C., Babin, B.J., Anderson, R.E. & Tatham, R.L. 2006.
Multivariate Data Analysis. Upper Saddle River: Pearson.
Hallam, J. 2013. The social media manifesto. United Kingdom: Palgrave
MacMillan.
Hansen, D.R., Mowen, M.M. & Guan, L. 2009. Cost management: Accounting
and control. 6th ed. United States of America: Cengage Learning.
Hansen, D., Shneiderman, B. & Smith, M.A. 2011. Analyzing social media
networks with NodeXL: Insights from a connected world. United Kingdom:
Elsevier.

195
Harris, L. & Rae, A. 2009. Social networks: the future of marketing for small
business. Journal of Business Strategy, 30(5):24-31.
Harrington, D. 2009. Confirmatory factor analysis. United States of America:
Oxford University.
Harrison, G. & Erpelding, M. 2012. Outdoor program administration: Principles
and practices. United States of America: Human Kinetics.
Hayes, B.E. 2008. Measuring customer satisfaction and loyalty: Survey design,
use, and statistical analysis methods. 3rd ed. United States of America:
ASQ.
Heer, R. 2008. Exploring the congruence of ethnic minority millennial students’
transition to college, social identity and community, and online social
network services. Iowa State University: Pro Quest.
Herbst, F. & Coldwell, D. 2004. Business research. Cape Town: Juta.
Hill, G. 2001. A level psychology through diagrams. 2nd ed. United Kingdom:
Oxford.
Hirsch, M. 2012. The Development of the retail environment in South Africa.
International Retail and Marketing Review, 82-85.
Hisrich, R.D. 2000. Marketing. 2nd ed. New York: Barron.
Hitchcock, D. & Willard, M. 2009. The business guide to sustainability: Practical
strategies and tools for organizations. 2nd ed. United States of America:
Earthscan.
Hoffenberg, D. 2011. Learn to use the Internet. Computer Related Tutorials.

196
Hoffman, D.L. & Fodor, M. 2010. Can you measure the ROI of your social
media marketing. MIT Sloan management review, 52(1):41-49.
Horowitz, A. 2010. The winning investor: What is market capitalization? [Online]
Available: http://winninginvestor.quickanddirtytips.com/what-is-market-
capitalization.aspx (Accessed 31 March 2013).
Houser, R. 1998. Counselling and educational research: Evaluation and
application. 2nd ed. London: Sage.
Hoyer, W.D. & Macinnis, D.J. 2010. Consumer behavior. 5th ed. United States
of America: Cengage.
Hume, M. 2010. Compassion without action: Examining the young consumers
consumption and attitude to sustainable consumption. Journal of world
business, 45(4):385-394.
Ihlen, Ø., Bartlett, J.L. & May, S. 2010. The handbook of communication and
corporate social responsibility. United Kingdom: John Wiley & Sons.
Investing Answers. 2013. Investing Answers: Economy. [Online] Available:
http://www.investinganswers.com/financial-
dictionary/economics/economy-1517 (Accessed 03 June 2013).
Investor Words. 2013. Investor Words: Economy. [Online] Available:
http://www.investorwords.com/1652/economy.html (Accessed 03 June
2013).
Jain, S. 2012. 40 Social media today: Most popular social networking sites of
the world. [Online] Available: http://socialmediatoday.com/node/195917
(Accessed 18 March 2013).
Jain, T.R., Trehan, M. & Trehan, R. 2010. Business environment. 2nd ed. New
Delhi: VK.

197
Jansen, B.J. & Schuster, S. 2011. Bidding on the buying funnel for sponsored
search and keyword advertising. Journal of electronic commerce
research, 12(1):1-18.
Jansen, B.J., Zhang, M., Sobel, K. & Chowdury, A. 2009. Twitter power: Tweets
as electronic word of mouth. Journal of the American society for
information science and technology, 60(11):2169-2188.
Jayachandran, S. 2004. Marketing management: Text and cases. New Delhi:
Excel.
John Brown Media. 2013. John Brown Media: Pick n Pay. [Online] Available:
http://www.johnbrownmedia.co.za/clients/pick-n-pay/ (Accessed 22
February 2013).
Johnson, B. & Christensen, L. 2010. Educational research: Quantitative,
qualitative, and mixed approaches. 4th ed. London: Sage.
Johnson, R.B. & Onwuegbuzie, A.J. 2004. Mixed methods research: A
research paradigm whose time has come. Educational researcher,
33(7):14-26.
Jones, C.I. 2009. The global financial crisis of 2007-20?? A supplement to
Macroeconomics, 1-45.
Jue, A.L., Marr, J.A. & Kassotakis, M.A. 2009. Social media at work: How
networking tools propel organizational performance. San Francisco:
Jossey-Bass.
Jugenheimer, D.W., Bradley, S.D., Kelley, L.D. & Hudson, J.C. 2010.
Advertising and public relations research. New York: M.E. Sharpe.

198
Kamakura, W.A., Wedel, M., de Rosa, F. & Mazzon, J.A. 2003. Cross-selling
through database marketing: a mixed data factor analyser for data
augmentation and prediction. International Journal of Research in
marketing, 20(1):45-65.
Kapferer, J.N. 2012. The new strategic brand management: Advanced insights
and strategic thinking. 5th ed. Great Britain: Kogan Page.
Kapferer, J.N. 2008. The new strategic brand management: Creating and
sustaining brand equity long term. 4th ed. Great Britain: Kogan Page.
Kaplan, A.M. & Haenlein, M. 2010. Users of the world, unite! The challenges
and opportunities of social media. Business horizons, 53(1):59-68.
Kaplan, R.M. & Saccuzzo, D.P. 2005. Psychological testing: Principles, applications,
and issues. 6th ed. United States of America: Thomson Wadsworth.
Karpilo, J. 2010. About.com: Developed or developing? Dividing the world into
the haves and the have-nots. [Online] Available:
http://geography.about.com/od/countryinformation/a/thirdworlddevelopingl
dc.htm (Accessed 20 February 2013).
Kasi, P.M. 2009. Research: What, why and how? : A Treatise from researchers
to researchers. United States of America: AuthorHouse.
Kauffman, R.J. & Wang, B. 2002. Bid together, buy together: On the efficacy of
group-buying business models in Internet-based selling. The E-business
Handbook, 99-137.
Kazmi, S.H.H. 2008. Marketing management: Text and cases. New Delhi:
Excel.
Kearney, A.T. 2006. Emerging market priorities for global retailers. [Online]
Available: http://www.fibre2fashion.com/industry-article/pdffiles/emerging-
market-priorities-for-global-retailers.pdf (Accessed 01 June 2013).

199
Keefe, L.M. 2004. What is the meaning of ‘marketing’. Marketing News,
38(15):17-18.
Kemp, B.J. & Mosqueda, L. 2012. Aging with a disability: What the clinician
needs to know. United States of America: JHU Press.
Kengthon, W. 2011. Consumer buying behaviour. Germany: Grin Verlag.
Kennerley, M. & Neely, A. 2003. Measuring performance in a changing
business environment. International journal of operations & production
management, 23(2):213-229.
Kietzmann, J. H., Hermkens, K., McCarthy, I.P. & Silvestre, B.S. 2011. Social
media? Get serious! Understanding the functional building blocks of social
media. Business Horizons, 54(3):241-251.
Kim, E., Fiore, A.M. & Kim, H. 2011. Fashion trends: Analysis and forecasting.
Oxford: Berg.
Kincaid, J.W. 2003. Customer relationship management: Getting it right! New
Jersey: Prentice Hall Professional.
Kirby, J. & Marsden, P. 2006. Connected marketing. Great Britain: Routledge.
Kitchener. 2010. Kitchener: Online communications strategy. [Online] Available:
http://www.kitchener.ca/en/insidecityhall/resources/online_communication
s_strategy.pdf (Accessed 04 June 2013).
Klimchuk, M.R. & Krasovec, S.A. 2012. Packaging design: Successful product
branding from concept to shelf. 2nd ed. New Jersey: John Wiley & Sons.

200
Kock, N. 2010. Evolutionary psychology and information systems research: A
new approach to studying the effects of modern technologies on human
behaviour. 2nd ed. New York: Springer.
Koekemoer, L. 2004. Marketing communications. 2nd ed. Cape Town: Juta.
König, A., Dengel, A. & Hinkelmann, K. 2011. Knowledge-based and intelligent
information and engineering systems. 3rd ed. New York: Springer.
Kornbrot, D. 2005. Encyclopedia of statistics in behavioural science. Hatefield:
John Wiley.
Kothari, C.R. 2008. Research methodology: Methods and techniques. 2nd ed.
New Delhi: New Age.
Kotler, P. 2000. Marketing management millennium ed: Customer ed for University
of Phoenix. 10th ed. New Jersey: Prentice-Hall.
Kotler, P. & Armstrong, G. 2010. Principles of marketing. Cape Town: Pearson.
Kozinets, R.V. 1999. E-tribalized marketing?: The strategic implications of
virtual communities of consumption. European Management Journal,
17(3):252-264.
Krafft, M. & Mantrala, M.K. 2010. Retailing in the 21st century. 2nd ed. New
York: Springer.
Kreitler, S., Ben-Arush, M.W. & Martin, A. 2012. Pediatric psycho-oncology:
Psychosocial aspects and clinical interventions. 2nd ed. New Jersey: John
Wiley & Sons.
Krizan, A.C., Merrier, P., Logan, J. & Williams, K. 2011. Business
communication. 8th ed. United States of America: Cengage.

201
Kuechler, W., Vaishnavi, V.K. & Kuechler, D. 2001. Supporting optimization of
business-to-business e-commerce relationships. Decision Support
Systems, 31(3):363-377.
Kumar, V. 2008. Managing customers for profit: Strategies to increase loyalty
and build profits. New Jersey: Pearson.
Kumar, R. 2005. Research methodology: A step-by-step guide for beginners.
2nd ed. London: Sage.
Kumar, R. 2010. Research methodology: A step-by-step guide for beginners.
3rd ed. London: Sage.
Kumar, V. & Petersen, J.A. 2012. Statistical methods in customer relationship
management. New Jersey: John Wiley & Sons.
Kushal, S.J. 2011. Business communication. New Delhi: V.K.
Kutlu, Ṣ. 2007. Fourth party logistics: The future of supply chain outsourcing.
United Kingdom: Best Global.
Kwak, H., Lee, C., Park, H. & Moon, S. 2010. What is Twitter, a social network
or a news media? Proceedings of the 19th international conference on
World Wide Web, 591-600.
Kwik Convenience. 2013. Kwik Convenience: The SPAR family. [Online]
Available:
http://www.kwikconvenience.co.za/kwikconvenience.co.za/The_Spar_Fa
mily.html (Accessed 04 June 2013).
Labuschagne, F.J.J. 2009. CSIR NYENDA programme: Traffic management
R&D capacity building-balancing the opportunities and constraints. The
South African Transport Conference. 400-408.

202
Lahman, A. 2005. JMP for basic univariate and multivariate statistics: A step-
by-step guide. 2nd ed. United States of America: SAS.
Laja, P. 2013. Conversion XL: 9 Things to know about influencing purchasing
decisions. [Online] Available: http://conversionxl.com/9-things-to-know-
about-influencing-purchasing-decisions/#. (Accessed 02 September
2013).
Lamb, C.W., Hair, J.F. & MacDaniel, C.D. 2008. Marketing. 10th ed. United
States of America: Cengage.
Lamb, C.W., Hair, J.F. & McDaniel, C.D. 2011. Essentials of marketing. 7th ed.
United States of America: Cengage.
Lamb, C.W., Hair, J.F. & McDaniel, C.D. 2009. Essentials of marketing. 6th ed.
United States of America: Cengage.
Lamb, C.W., Hair, J.F. & McDaniel, C.D. 2011. MKTG. 4th ed. United States of
America: Cengage.
Lamb, C.W., Hair, J.F., McDaniel, C.D., Kapoor, H., Klaise, H. & Appleby, R.
2009. MKTG. United States of America: Cengage.
Lancaster, G. & Reynolds, P. 2002. Marketing made simple. Great Britain:
Elsevier.
Landy, F.J. & Conte, J.M. 2010. Work in the 21st century: An introduction to
industrial and organizational psychology. 3rd ed. United States of America:
Wiley-Blackwell.
Lantos, G.P. 2011. Consumer behaviour in action: Real-life applications for
marketing managers. New York: M.E. Sharpe.

203
Lawrence, K.D. & Kleinman, G. 2012. Applications of management science.
United Kingdom: Emerald Group.
Ledderhos, M. 2003. Strategy on multiple channels – customer relationships as
a driving force for a multi-channel strategy: a view on today and tomorrow
at VESTMANLANDS LÄNS TIDING. Germany: Grin Verlag.
Lee, C.F., Lee, J.C. & Lee, A.C. 2000. Statistics for business and financial
economics. 2nd ed. Singapore: World Scientific.
Lee, M. & Johnson, C. 2005. Principles of advertising: A global perspective. 2nd
ed. United States of America: Routledge.
Lee, O. 2001. Internet marketing research. United States of America: Idea.
Leimeister, S. 2010. IT outsourcing governance: Client types and their
management strategies. Germany: Gabler Verlag.
Lenhart, A., Purcell, K., Smith, A. & Zickuhr, K. 2010. Social media & mobile
internet use among teens and young adults. Washington DC: Pew internet
& American life project, 155-179.
Leonard, B. 1997. Green paper on vertical restraints in EC competition policy.
United States of America: Diane.
Levine, J.R., Young, M.L. & Baroudi, C. 2007. The Internet for dummies. 11th
ed. Indiana: Wiley.
Lewis-Beck, M.S., Bryman, A. & Liao, T.F. 2004. The SAGE encyclopedia of
social science research methods. London: Sage.
Lipsey, R.G. & Chrystal, K.A. 2007. Economics. 11th ed. United Kingdom:
Oxford.

204
Londhe, B.R. 2006. Retail and Distribution Management. Pune: Rachana.
Londhe, N. 2006. Retail and distribution management. Pune: Rachana.
Longenecker, J.G., Moore, C.W., Petty, J.W. & Palich, L.E. 2008. Small
business management: An entrepreneurial emphasis. 13th ed. United
States of America: Thomson.
Longino, E. 2009. The determinants of sales organization effectiveness in the
pharmaceutical industry. Universal: United States of America.
Loudon, D.L. & Wrenn, B. 2006. Marketing planning guide. 3rd ed. United
States of America: Routledge.
Luftig, J. 1998. University of Colorado at Boulder: What is business
performance excellence? [Online] Available:
http://csscu.com/index.php/bpe/bpe-articles-t/40-what-is-business-
performance-excellence (Accessed 11 February 2013).
Luiz, J. & Bowen, A. & Beswick, C. 2011. Woolworths South Africa: Making
sustainability sustainable, 1-21.
Mabweazara, H.M., Mudhai, O.F. & Whittaker, J. 2014. Online journalism in
Africa: Trends, practices and emerging cultures. New York: Routledge.
MacDaniel, C.D. & Gates, R. 1998. Marketing research essentials. 2nd ed.
United States of America: International Thomson.
Maciejewski, W. 2002. The Baltic Sea region: Cultures, Politics, societies.
Baltic: Baltic University.
Magazines. 2013 a. Magazines: Business magazines in South Africa. [Online]
Available: http://www.magazines.co.za/category/business/all.html
(Accessed 15 July 2013).

205
Magazines. 2013 b. Magazines: Fresh Living. [Online] Available:
http://www.magazines.co.za/magazine/pick_n_pay_fresh_living.html
(Accessed 04 June 2013).
Mahadevan, B. 2007. Operations management: Theory and practice. 4th ed.
New Delhi: Dorling Kindersley.
Maimane, M. 2012. Politics web: Poor hard hit by cost of living increases –
Mmusi Maimane. [Online] Available:
http://www.politicsweb.co.za/politicsweb/view/politicsweb/en/page71654?
oid=293506&sn=Detail&pid=71654 (Accessed 03 June 2013).
Malhotra, N.K. 2010. Review of marketing research. 7th ed. United Kingdom:
Emerald.
Malmane, M. 2012. Politics web: Poor hard hit by cost of living increases.
[Online] Available:
http://www.politicsweb.co.za/politicsweb/view/politicsweb/en/page71654?
oid=293506&sn=Detail&pid=71654 (Accessed 01 April 2013).
Mangold, W.G. & Faulds, D.J. 2009. Social media: The new hybrid element of
the promotion mix. Business horizons, 52(4):357-365.
Mankiw, N.G. & Taylor, M.P. 2006. Economics. London: Thomson.
Mankiw, N.G. 2009. Principles of economics. 5th ed. United States of America:
Cengage.
Martella, R.C. Nelson, J.R., Morgan, R.L. & Marchand-Martella, N.E. 2013.
Understanding and interpreting educational research. New York: Guilford.
Mashable. 2013. Mashable: Twitter. [Online] Available:
http://mashable.com/category/twitter/ (Accessed 01 May 2013).

206
Mathur, U.C. 2010. Retail management: Text and cases. New Delhi: I.K.
International.
Matsho, J. 2010. The retail petrol industry in South Africa. [Online] Available:
http://uzspace.uzulu.ac.za/handle/10530/387 (Accessed 01 June 2013).
Maya, L. 2012. Envision to profit from the power of mobile social media in
social customer engagement: Learn effective mobile optimized strategies
from the best of both Chinese and Western worlds to grow your business.
Singapore: Trafford.
Maykut, P.S. & Morehouse, R.E. 1994. Beginning qualitative research: A
philosophic and practical guide. Great Britain: Routledge.
McBurney, D.H. & White, T.L. 2009. Research methods. 8th ed. United States
of America: Cengage.
McClard, A. & Anderson, K. 2008. Focus on Facebook: Who are we anyway?
Anthropology News, 49(3):10-12.
McDonald, M. 2007. Marketing Plans: How to Prepare Them, how to Use
Them. 6th ed. Butterworth-Heinemann.
McKee, J. & O’Driscoll, S. 2009. Executive travel: using social media to define
your brand. [Online] Available:
http://www.executivetravelmagazine.com/articles/using-social-media-to-
define-your-brand (Accessed 24 March 2013).
McNabb, D.E. 2009. Research methods for political science: Quantitative and
qualitative approaches. 2nd ed. United States of America: M.E. Sharpe.

207
McNabb, D.E. 2002. Research methods in public administration and non-profit
management: Qualitative and quantitative approaches. 2nd ed. New York:
M.E. Sharpe.
McVoy, G.R., Nelson, D.A., Krekeler, P., Kolb, E. & Gritsavage, J.S. 2010.
Moving towards sustainability: New York state department of
transportation’s GreenLites story. Proceedings of Green Streets and
Highways 2010 Conference.
Media Club South Africa. 2013. Media Club South Africa: South Africa’s
economy, key sectors. [Online] Available:
http://www.mediaclubsouthafrica.com/index.php?option=com_content&vie
w=article&id=111%3ASA (Accessed 03 June 2013).
Meier, G. 2013. Blue magnet digital Solutions: The current state of social media
in South Africa. [Online] Available: http://www.bluemagnet.co.za/blog/the-
current-state-of-social-media-in-south-africa- (Accessed 08 April 2013).
Mentzer, J.T. 2001. Supply chain management. 2nd ed. United Kingdom: Sage.
Mercer. 2011. Mercer: Worldwide cost of living survey 2011 – City ranking.
[Online] Available: http://www.mercer.com/press-
releases/1420615;jsessionid=PRSPHCJCRgYd15O7drJuCA**.mercer02?
siteLanguage=100 (Accessed 01 March 2013).
Mertens, D.M. 2009. Research and evaluation in education and psychology:
Integrating diversity with quantitative, qualitative, and mixed methods. 3rd
ed. London: Sage.
Meyers, H.M. & Gertsman, R. 2001. Branding @ the digital age. New York:
Palgrave.
Meyerson, M. 2010. Success secrets of social media marketing superstars.
Canada: Entrepreneur Media.

208
Michman, R.D., Mazze, E.M. & Greco, A.J. 2003. Lifestyle marketing: Reaching
the new American consumer. United States of America: Greenwood.
Miller, M. 2012. B2B digital marketing: Using the web to market directly to
businesses. United States of America: Que Publishing.
Milosevic, D.Z., Martinelli, R. & Waddell, J.M. 2007. Program management for
improved business results. New Jersey: John Wiley & Sons.
Mitchell, S. 2006. Create your own website. 2nd ed. United States of America:
Sams.
Mohamed, S. 2011. Polity: 2011 – another year of global economic uncertainty.
[Online] Available: http://www.polity.org.za/article/2011-another-year-of-
global-economic-uncertainty-2011-01-14 (Accessed 01 March 2013).
Mojave Interactive. 2009. Twitter guide for marketers. Robert Gourley.
Money Web. 2011. Money Web: Special report podcast: Justin Smith – good
business journey manager at Woolworths. [Online] Available:
http://www.moneyweb.co.za/moneyweb-special-report/special-report-
podcast-justin-smith--good-business?sn=2009+Detail (Accessed 04 June
2013).
Moorad, Z. 2013. Business Day Live: Shoprite aims to keep top retailer spot.
[Online] Available:
http://www.bdlive.co.za/business/retail/2013/02/20/shoprite-aims-to-keep-
top-retailer-spot (Accessed 03 June 2013).
Moore, C.W., Petty, J.W., Palich, L.E. & Longenecker, J.G. 2008. Managing
small business: An entrepreneurial emphasis. 14th ed. United States of
America: Cengage.
Morgan, M.J. & Summers, J. 2005. Sports marketing. Australia: Thomson.

209
Morschett, D., Schramm-Klein, H. & Zentes, J. 2009. Strategic international
management: Text and cases. Netherlands: Gabler.
Mthunzi, M. 2009. South African Retail Council: Consumer Goods Council of
South Africa, 1-12.
Mun, J. 2006. Real options analysis: Tools and techniques for valuing strategic
investments and decision. 2nd ed. New Jersey: John Wiley & Sons.
Muthethwa, S.M. 2012. Job opportunities and unemployment in the South
African labour market. Journal of Department of Labour of Republic of
South Africa, 1-26.
My Digital Life. 2012. My Digital Life: ‘Like bike’ to help fuel SA celeb to Argus
finish. [Online] Available:
http://mydl.itweb.co.za/index.php?option=com_content&task=view&id=106
1202&Itemid=251 (Accessed 02 April 2013).
Nargundkar, R. 2003. Marketing research. 2nd ed. New Delhi: Tata McGraw-
Hill.
Neelankavil, J.P. 2007. International business research. United States of America:
M.E. Sharpe.
Nemati, H.R. & Barko, C.D. 2004. Organizational data mining: Leveraging
enterprise data resources for optimal performance. United States of
America: Idea.
Neuendorf, K.A. 2002. The content analysis guidebook. United Kingdom: Sage.
Newman, A.J. & Cullen, P. 2002. Retailing: Environment & operations. London:
Cengage.

210
NTC hosting. 2013. Website. [Online] Available:
http://www.ntchosting.com/internet/website.html (Accessed 22 July 2013).
Nykiel, R.A. 2007. Handbook of marketing research methodologies for
hospitality and tourism. Great Britain: Routledge.
Obee, J. 2012. Social networking: The ultimate teen guide. United States of
America: Scarecrow.
O’Cass, A. & Fenech, T. 2003. Web retailing adoption: exploring the nature of
internet users Web retailing behaviour. Journal of Retailing and Consumer
services, 10(2):81-94.
O’Cass, A. & Julian, C. 2003. Examining firm and environmental influences on
export marketing mix strategy and export performance of Australian
exporters. European journal of marketing, 37(3/4):366-384.
Odendaal, N. 2013. Engineering news: GDP growth likely to remain flat in
2013. [Online] Available: http://www.engineeringnews.co.za/article/gdp-
growth-likely-to-remain-flat-in-2013-2013-02-26 (Accessed 22 May 2013).
O’Guinn, T.C., Allen, C.T. & Semenik, R.J. 2009. Advertising & integrated
brand promotion. 5th ed. United States of America: Cengage.
O’Guinn, T.C., Allen, C.T. & Semenik, R.J. 2011. Advertising and integrated
brand promotion. 6th ed. United States of America: Cengage.
Oh, H. & Pizam, A. 2008. Handbook of hospitality marketing management.
United Kingdom: Elsevier.
Olagbemi, F.O. 2011. The effectiveness of federal regulations and corporate
reputation in mitigating corporate accounting. United States of America:
Xlibris.

211
O’Leary, S., Sheehan, K. & Lentz, S. 2011. Small business smarts: Building
buzz with social media. California: ABC-Clio.
Olson, J.S. & López, C. 2009. Build your beverage empire. United States of
America: Jorge Olson.
Onkvisit, S. & Shaw, J.J. 2009. International marketing: Strategy and theory. 5th
ed. New York: Routledge.
Osterman, J. 2007. Excellence in brand advertising. China: Visual Reference.
Outhwaite, W. & Turner, S. 2007. The SAGE handbook of social science
methodology. London: Sage.
Ovretveit, J. 2002. Action evaluation of health programmes and changes: A
handbook for a user-focused approach. United Kingdom: Radcliffe.
Pailwar, V.K. 2008. Economic environment of business. 2nd ed. New Delhi: PHI.
Paler-Calmorin, L. & Calmorin, M.A. 2006. Statistics in education and the
sciences (with application to research). Philippines: Rex.
Park, C.W., Jaworski, B.J. & MacInnis, D.J. 1986. Strategic brand concept-
image management. The Journal of Marketing, 135-145.
Pati, D. 2002. Marketing research. India: Universities.
Patton, M.Q. 2002. Qualitative research & evaluation methods. 3rd ed. London:
Sage.
Pawar, M. 2004. Data collecting methods and experiences: A guide for social
researcher. New Delhi: New Dawn.
212
Peacock, J., Purvis, S. & Hazlett, R.L. 2011. Which broadcast medium better
drives engagement? Measuring the powers of radio and television with
electromyography and skin-conductance measurements. Journal of
advertising research, 54(4):578.
Peck, R., Olsen, C. & Devore, J.L. 2011. Introduction to statistics and data
analysis. 4th ed. United States of America: Cengage.
Petley, J. 2003. Advertising. United States of America: Smart Apple.
Pettinger, T. 2011. Causes of consumer spending. [Online] Available:
http://www.economicshelp.org/blog/396/economics/consumer-spending-
its-causes-and-effects/ (Accessed 28 March 2013).
Phillips, S. 2007. The Guardian: A brief history of Facebook. [Online] Available:
http://www.guardian.co.uk/technology/2007/jul/25/media.newmedia
(Accessed 30 April 2013).
Pick and Pay. 2010. Annual report: Sustainability report. [Online] Available:
http://www.picknpay.co.za/picknpay/applications/picknpay/templates/down
loads/2010%20SD%20report.pdf [Accessed 02 June 2013].
Pick n Pay. 2012. Pick n Pay: Like Bike 2 launches. [Online] Available:
http://www.picknpay.co.za/picknpay/content/en/news?oid=318430&sn=De
tail&pid=699 (Accessed 20 February 2013).
Pick n Pay. 2013 a. Pick n Pay. [Online] Available:
http://www.picknpay.co.za/picknpay/content/en/home (Accessed 24
March 2013).
Pick n Pay. 2013 b. Pick n Pay: About us. [Online] Available:
http://www.picknpay.co.za/picknpay/content/en/about-us-introduction
(Accessed 20 February 2013).

213
Pick n Pay. 2013 c. Pick n Pay: Shop smart online. [Online] Available:
http://www.picknpay.co.za/picknpay/content/en/shop-smart-online
(Accessed 20 February 2013).
Pick n Pay. 2013 d. Pick n Pay: Frequently asked questions. [Online] Available:
https://shop.pnp.co.za/b2c_pnp/b2c/displayCMSFAQ/(cpgsize=9&layout=
5.1-
6_1_3_79_81_7_10_2_3&uiarea=4&carea=504D6BE8B29D0830E10080
000A050131&cpgnum=1)/.do?faqID=271217 (Accessed 22 February
2013).
Pick n Pay. 2013 e. Pick n Pay: Featured products. [Online] Available:
https://shop.pnp.co.za/b2c_pnp/b2c/display/(layout=5.1-
6_1_3_79_80_7_10_2&uiarea=3&carea=504D6BE8B29D0830E1008000
0A050131)/.do?rf=y (Accessed 22 February 2013).
Pick n Pay. 2013 f. Pick n Pay: Fresh Living e-zine. [Online] Available:
http://www.picknpay.co.za/picknpay/content/en/fresh-living-preview
(Accessed 22 February 2013).
Pike, A. 2011. Brands and branding geographies. United Kingdom: Edward
Elgar.
Pike, L.J. & Gibbs, P. 2012. Deloitte: South African retailers make headway in
tough global environment. [Online] Available:
http://www.deloitte.com/view/en_za/za/insights/f621a2f43fbe4310VgnVC
M1000001a56f00aRCRD.htm (Accessed 20 February 2013).
Pike, S. 2008. Destination marketing: An integrated marketing communication
approach. United Kingdom: Butterworth-Heinemann.
Planty, M. & Carlson, D. 2010. Understanding education indicators: A practical
primer for research and policy. New York: Teachers College.

214
Polit, D.F. & Beck, C.T. 2008. Nursing research. 8th ed. Philadelphia: Lippincott.
Ponterotto, J.G. 2005. Qualitative research in counselling psychology: A primer
on research paradigms and philosophy of science. Journal of counselling
psychology, 52(2):126-136.
Potts, K. 2007. Web design and marketing solutions for business websites.
United States of America: Apress.
Pradhan, S. 2006. Retailing management. 2nd ed. New Delhi: Tata McGraw-
Hill.
Pradhan, S. 2009. Retailing management: Text & cases. 3rd ed. New Delhi:
Tata McGraw-Hill.
PricewaterhouseCoopers. 2012. PricewaterhouseCoopers: South African retail
and consumer products outlook 2012 – 2016. [Online] Available:
http://www.pwc.co.za/en_ZA/za/assets/pdf/retail-and-consumer-products-
outlook-2012-2016.pdf (Accessed 02 June 2013).
Pride, W.M. & Ferrell, O.C. 2010. Marketing. 15th ed. United States of America:
Cengage.
Pride, W.M. & Ferrell, O.C. 2012. Marketing. 16th ed. United States of America:
Cengage.
Pride, W.M. & Ferrell, O.C. 2014. Marketing. 17th ed. United States of America:
Cengage.
Procopio, M., Spielvogel, P. & Thomson, N. 2012. 42 Rules for B2B Social
Media Marketing: Learn Proven Strategies and Field-Tested Tactics
Through Real World Success. United States of America: Happy About.

215
Property 24. 2012. Property 24: South African retailers are resilient. [Online]
Available: http://www.property24.com/articles/south-african-retailers-are-
resilient/14747 (Accessed 02 March 2013).
Psychology Two. 2000. Super review: Psychology two. 2nd ed. New Jersey:
Research and Education Association.
Puranik, A. 2012. Publish your articles: Who is a retailer? What are the
characteristics, functions and services of a retailer? [Online] Available:
http://www.publishyourarticles.net/knowledge-hub/business-studies/who-
is-a-retailer-what-are-the-characteristics-functions-and-services-of-a-
retailer.html (Accessed 11 February 2013).
Raacke, J. & Bonds-Raacke, J. 2008. MySpace and Facebook: Applying the
Uses and Gratifications Theory to Exploring Friend-Networking Sites.
Cyber psychology & behavior. 11(2):169-174.
Ranganatham, M. & Madhumathi, R. 2006. Investment analysis and portfolio
management. New Dehli: Dorling Kindersley.
Rao, K. 2006. Webeze: Top 10 reasons why your business needs a website.
[Online] Available: http://www.web-
eze.com/articles/marketing_sales_articles.php?news_id=89 (Accessed 11
February 2013).
Rao, V.R. 2009. Handbook of pricing research in marketing. United Kingdom:
Edward Elgar.
Rangaswamy, A. & van Bruggen, G.H. 2005. Multichannel marketing. New
Jersey: John Wiley & Sons.
Ray, G. H. & Walker, J.T. 2004. Characteristics, motivations, and satisfaction of
college students who shop at non-store based retailers. Journal of Textile
and Apparel, Technology and Management, 4(1):1-12.

216
Rayner, C. 2012. The retail champion: 10 steps to retail success. United States
of America: Kogan.
Reddi, C.V.N. 2009. Effective public relations and media strategy. New Delhi:
PHI.
Rees, W. & Wackernagel, M. 2012. Urban ecological footprints: Why cities
cannot be sustainable – and why they are a key to sustainability. The
urban sociology reader, 157.
Reineccius, G. 1998. Source book of flavors. 2nd ed. United States of America:
Aspen.
Roggio, A. 2011. 6 Things Consumers Hate About Ecommerce Sites. [Online]
Available: http://www.practicalecommerce.com/articles/2707-6-Things-
Consumers-Hate-About-Ecommerce-Sites (Accessed 26 March 2013).
R.O.I. Media. 2013. SM = more connected than ever before. [Online] Available:
http://www.roimedia.co.za/social-
media/?gclid=CIaL1vK9qbUCFa_MtAodbh4AFQ (Accessed 10 February
2013).
Roos. P. 2011. Fin24: SA unemployment rates among highest. [Online]
Available: http://www.fin24.com/Economy/SA-unemployment-rate-among-
worlds-highest-20110504 (Accessed 20 February 2013).
Rossouw, R. 2010. Next Generation: King III integrated report: Why it’s crucial
to plan ahead – from a thought leader’s perspective. [Online] Available:
http://www.nextgeneration.co.za/king-iii-integrated-report-why-its-crucial-
to-plan-ahead-from-a-thought-leaders-perspective/ (Accessed 02 June
2013).

217
Riese, M., Pennisi, L.A. & Major, A.L. 2010. Using social media to market your
business. Journal of University of Nebraska, 1-3.
Ritchie, J. & Lewis, J. 2003. Qualitative research practice: A guide for social
science students and researchers. London: Sage.
Rittinghouse, J.W. & Ransome, J.F. 2010. Cloud computing: Implementation,
management, and security. CRC: United States of America.
Rubin, A. 2010. Statistics for evidence-based practice and evaluation. 2nd ed.
United States of America: Cengage.
Rumsey, D.J. 2011. Statistics for dummies. 2nd ed. Indiana: Wiley.
Ruskin-Brown, I. 2006. Mastering Marketing: A Comprehensive Introduction to
the Skills of Developing and Defending Your Company’s Revenue. 2nd ed.
London: Thorogood.
SABC News. 2012. ABSA admits retrenching workers. [Online] Available:
http://www.sabc.co.za/news/a/288fd9004c21bd9c9c6dbd8b30ab6902/Abs
a-admits-retrenching-workers-20122707Absa-admits-retrenching-workers-
20122707 (Accessed 26 September 2013).
Sandhusen, R. L. 2008. Marketing. 4th ed. New York: Barron.
Sarangapani, A. 2009. A textbook on rural consumer behaviour in India. New
Delhi: University Science.
SASSI. 2010. SASSI: Woolworths partners with MSC South Africa to promote
sustainable seafood. [Online] Available:
http://www.wwfsassi.co.za/?m=6&s=5&idkey=1349 [Accessed 02June
2013].

218
Schneider, F., Kallis, G. & Martinez-Alier, J. 2010. Crisis or opportunity?
Economic degrowth for social equity and ecological sustainability. Journal
of cleaner production, 18(6):511-518.
Schellong, A. 2008. Citizen relationship management: A study of CRM in
government. Germany: Peter Lang.
Shah, J. 2009. Supply chain management: Text and cases. India: Pearson.
Shah, K. & D’Souza, A. 2009. Advertising & promotions: An IMC perspective.
New Delhi: McGraw-Hill.
Sharedata. 2013 a. Sharedata: Sector Index – Retail – Food & Drug Retailers.
[Online] Available:
http://www.sharedata.co.za/index/retailfooddrugretailers.htm (Accessed
15 March 2013).
Sharedata. 2013 b. Sharedata: Sector Index – Retail – General Retailers.
[Online] Available:
http://www.sharedata.co.za/index/retailgeneralretailers.htm (Accessed 23
March 2013).
Sharedata. 2013 c. Sharedata: Woolworths Holdings Ltd. [Online] Available:
http://www.sharedata.co.za/Data/001682/main.htm (Accessed 14 March
2013).
Sharedata. 2013 d. Sharedata: Pick n Pay Holdings Ltd. [Online] Available:
http://www.sharedata.co.za/Data/001060/main.htm (Accessed 14 March
2013).
Sharkey, B.J. & Gaskill, S.E. 2006. Sport physiology for coaches. United States
of America: Human Kinetics.
219
Sharma, M. & Petosa, R.L. 2012. Measurement and evaluation for health
educators. United States of America: Jones & Bartlett.
Sharma, S. & Singh, R. 2006. Advertising: Planning and implementation. 4th ed.
New Delhi: PHI.
Shimp, T.A. 2010. Advertising, promotion, and other aspects of integrated
marketing communications. 8th ed. United States of America: Cengage.
Shoprite Holdings Limited. 2013 a. Shoprite: About our company. [Online]
Available: http://www.shopriteholdings.co.za/pages/1019812640/about-
our-company/overview.asp (Accessed 29 July 2013).
Shoprite Holdings Limited. 2013 b. Shoprite Holdings Limited: Corporate
responsibility. [Online] Available:
http://www.shopriteholdings.co.za/pages/1019812640/corporate-
responsibility/sustainability/overview.asp (Accessed 02 June 2013).
Shoprite Holdings Limited. 2013 c. About our company: History. [Online]
Available: http://www.shopriteholdings.co.za/pages/1019812640/about-
our-company/history.asp (Accessed 15 April 2013).
Shoprite Holdings Limited. 2013 d. About our company: Overview. [Online]
Available: http://www.shopriteholdings.co.za/pages/1019812640/about-
our-company/overview.asp (Accessed 15 April 2013).
Shoprite Holdings Limited. 2013 d. Shoprite: About the company. [Online]
Available: http://www.shopriteholdings.co.za/pages/1019812640/about-
our-company/history.asp (Accessed 01 June 2013).
Shoprite Holdings Limited. 2013 e. Checkers. [Online] Available:
https://twitter.com/CheckersSA [Online] Available:
https://twitter.com/CheckersSA (Accessed 09 June 2013).

220
Shugan, S.M. 2005. Brand loyalty programs: Are they shams? Marketing
Science, 24(2):185-193.
Silk, A.J. 2006. What is marketing? United States of America: Harvard.
Sim, J. & Wright, C. 2000. Research in health care: Concepts, designs, and
methods. United Kingdom: Nelson Thornes.
Simon, H. 2010. Beat the crisis: 33 Quick solutions for your company. New
York: Springer.
Simon, R.J. From Data to Public Policy: Affirmative Action, Sexual Harassment,
Domestic Violence and Social Welfare. United States of America:
University Press of America.
Singh, S. 2004. Market orientation, corporate culture and business
performance. England: Ashgate.
Singla, R.K. 2010. Business Organisation. New Delhi: VK.
Skjøtt-Larsen, T., Schary, P.B., Mikkola, J.H. & Kotzab, H. 2007. Managing the
global supply chain. 3rd ed. Denmark: Copenhagen Business School.
Slater, S.F., Hult, G.T.M., & Olson, E.M. 2007. On the importance of matching
strategic behaviour and target market selection to business strategy in
high-tech markets. Journal of the Academy of Marketing Science, 35(1):5-
17.
Smith, A. 2008. Introduction to sport marketing. London: Routledge.
Smith, B.E. & Bebak, A. 2007. Creating web pages for dummies. 8th ed.
Indiana: Wiley.

221
Smith, P.R. & Zook, Z.E. 2011. Marketing communication: Integrating offline
and online with social media. 5th ed. Great Britain: Kogan Page.
Smith, S.M. & Albaum, G.S. 2005. Fundamentals of marketing research.
London: Sage.
Sowetan. 2011. Sowetan: Pick n Pay to retrench over 3000 workers. [Online]
Available: http://www.sowetanlive.co.za/news/business/2011/07/07/pick-n-
pay-to-retrench-over-3000-workers (Accessed 03 June 2013).
Spar. 2013 a. SPAR: Our Business. [Online] Available:
http://www.spar.co.za/About-SPAR/Company (Accessed 14 April 2013).
Spar. 2013 b. SPAR: About SPAR. [Online] Available:
http://www.spar.co.za/About-SPAR (Accessed 14 April 2013).
Spar. 2013 c. SPAR: Sustainability, Environmental. [Online] Available:
http://www.spar.co.za/About-SPAR/Sustainability/Environmental
(Accessed 02 June 2013).
Spar. 2013 d. SPAR: About SPAR. [Online] Available: http://www.spar-
international.com/about-spar/80-years-of-spar (Accessed 14 April 2013).
Spar. 2013 e. SPAR: Driving Growth. [Online] Available: http://www.spar-
international.com/about-spar/keeping-to-our-core-values (Accessed 14
April 2013).
Spar. 2013 f. SPAR. [Online] Available: http://www.spar.co.za/Home (Accessed
16 April 2013).
Sperling, B. & Sander, P. 2007. Cities: Ranked & rated. 2nd ed. New Jersey:
Wiley.

222
Sprenkle, D.H. & Piercy, F.P. 2005. Research methods in family therapy. 2nd
ed. New York: Guilford.
Srivastava, T.N. & Rego, S. 2011. Business research methodology. New Delhi:
McGraw-Hill.
Ståhlberg, M. & Maila, V. 2010. Shopper marketing: How to increase purchase
decisions at the point of sale. United States of America: Kogan.
Stores. 2012. Stores: 2012 global retail industry trends. [Online] Available:
http://www.stores.org/STORES%20Magazine%20January%202012/2012-
global-retail-industry-trends (Accessed 02 April 2013).
Stiftung, H.B. 2009. Political analysis and commentary from Southern Africa:
The global economic crisis and South Africa. Perspectives, 1-22.
Straubhaar, J.D., LaRose, R. & Davenport, L. 2012. Media now: Understanding
media, culture, and technology. 7th ed. United States of America:
Cengage.
Strauss, J. & Frost, R. 2009. E-Marketing. 5th ed. United States of America:
Pearson Education.
Strauss, R. 2010. Marketing planning by design: Systematic planning for
successful marketing strategy. New Jersey: John Wiley & Sons.
Struwig, F.W. & Stead, G.B. 2001. Planning, reporting & designing. Cape
Town: Pearson.
Sullivan, M & Adcock, D. 2002. Retail marketing. London: Thomson.
Sutcliffe, R. 2007. Pick n Pay: 40 years. [Online] Available:
http://www.picknpay.co.za/picknpay/action/media/downloadFile?media_fil
eid=2284 (Accessed 15 March 2013).

223
Sullivan, M. & Adcock, D. 2002. Retail marketing. London: Thomson.
Svendsen, G.T. & Svendsen, G.L.H. 2009. Handbook of social capital: The
troika of sociology, political science and economics. United Kingdom:
Edward Elgar.
Swanson, R.A. & Holton, E.F. 2005. Research in organizations: Foundations
and methods of inquiry. California: Berrett-Koehler.
Talloo, T.J. 2008. Business organisation and management. New Delhi:
McGraw-Hill.
Taprial, V. & Kanwar, P. 2012. Understanding social media. Bookboon.
Taste Mag. 2013. Taste Mag: TASTE March 2013. [Online] Available:
http://www.tastemag.co.za/TheMag.aspx (Accessed 25 February 2013).
The Citizen. 2011. The Citizen: Growing economy not enough to create jobs:
Motlanthe. [Online] Available:
http://www.citizen.co.za/citizen/content/en/citizen/local-
news?oid=183749&sn=Detail&pid=334&Growing-economy-not-enough-
to-create-jobs--Motlanthe (Accessed 02 March 2013).
The eBusiness Knowledgebase. 2013. The eBusiness knowledgebase: Top 15
most popular social networking sites/ March 2013. [Online] Available:
http://www.ebizmba.com/articles/social-networking-websites (Accessed
18 March 2013).
The Face-Twit. 2011. SMEshing good effort, Pick n Pay! [Online] Available:
http://thefacetwit.co.za/?tag=pick-n-pay (Accessed 31 October 2013).
The SME Toolkit South Africa. 2012. Make you’re your website is a good one.
[Online] Available:
224
http://southafrica.smetoolkit.org/sa/en/content/en/5346/Make-sure-your-
website-is-a-good-one (Accessed 11 February 2013).
Thomas, A. 2013. Strategies for branding success: Give your brand the
competitive edge to succeed in today’s challenging economy.
eBookIt.com.
Thomas, R.W., Esper, T.L. & Stank, T.P. 2010. Testing the negative effects of
time pressure in retail supply chain relationships. Journal of retailing,
86(4):386-400.
Thomas, S. 2012. Financial mail: Woolworths’ history. [Online] Available:
http://www.fm.co.za/profiles/2012/11/28/woolworths-history (Accessed 01
June 2013).
Tibbs, A. 2010. Advertising: Its business, culture, and careers. New York:
Routledge.
Tompkins, J.A. & Harmelink, D. 2004. The supply chain handbook. United
States of America: Tompkins.
Trading Economics. 2012. South Africa retail sales MOM. [Online] Available:
http://www.tradingeconomics.com/south-africa/retail-sales (Accessed 10
February 2013).
Trading Economics. 2013. Trading Economics: South Africa unemployment
rate. [Online] Available: http://www.tradingeconomics.com/south-
africa/unemployment-rate (Accessed 30 March 2013).
Treasury. 2012. Treasury: The retail industry on the rise in South Africa.
[Online] Available:
http://www.treasury.gpg.gov.za/Document/Documents/QB1%20The%20R
etail%20Industry%20on%20the%20Rise.pdf (Accessed 22 May 2013).

225
Trehan, M. & Trehan, R. 2007. Advertising and Sales Management. 2nd ed.
New Delhi: VK.
Trehan, M. & Trehan, R. 2010. Advertising and Sales Management. 3rd ed.
New Delhi: VK.
Trehan, M. & Trehan, R. 2011. Advertising and Sales Management. 4th ed. New
Delhi: VK.
Tsai, H.L. 2003. Information technology and business process reengineering:
new perspectives and strategies. United States of America: Greenwood.
Turner, J. 2012. How to use social media monitoring tools. New Jearsey:
Pearson.
Turner, M.L. 2006. The unofficial guide to marketing your small business. New
Jersey: John Wiley & Sons.
Tuten, T.L. 2008. Advertising 2.0: Social media marketing in a web 2.0 world.
United States of America: Greenwood.
Twitter. 2013 a. Twitter: Pick n Pay. [Online] Available:
https://twitter.com/PicknPay (Accessed 24 March 2013).
Twitter. 2013 b. Twitter: SPAR International. [Online] Available:
https://twitter.com/SPARInt (Accessed 14 April 2013).
Twitter. 2013 c. Twitter: Woolworths SA. [Online] Available:
https://twitter.com/WOOLWORTHS_SA (Accessed 24 March 2013).
Twitter. 2013 d. Twitter: The fastest, simplest way to stay close to everything
you care about. [Online] Available: https://twitter.com/about (Accessed 11
February 2013).

226
Twitter. 2013 e. Twitter: Touch down. [Online] Available:
https://twitter.com/TouchDown326/status/224408965566566400
(Accessed 14 April 2013).
Tyagi, C.L. & Kumar, A. 2004. Advertising management. New Delhi: Atlantic.
Tyagi, C.L. & Kumar, A. 2004. Consumer behaviour. New Delhi: Atlantic.
United Nations environment programme. 2005. Integrating sustainability into
business: A management guide for responsible tour operations. Division
of technology, industry and economics. 1-68.
Valenzuela, S., Park, N. & Kee, K.F. 2009. Is There Social Capital in a Social
Network Site?: Facebook Use and College Students’ Life Satisfaction,
Trust, and Participation. Journal of Computer-Mediated Communication,
14(4):875-901.
Vargo, S.L. & Lusch, R.F. 2004. Evolving to a new dominant logic for
marketing. Journal of marketing, 1-17.
Varley, R. 2001. Retail product management: Buying and merchandising. 2nd
ed. United States of America: Routledge.
Varley, R. 2006. Retail Product Management: Buying and Merchandising. 2nd
ed. New York: Routledge.
Varley, R. 2013. Retail product management: Buying and merchandising. 3rd
ed. New York: Routledge.
Vasan, N. & Przybylo, J. 2013. Do good well: Your guide to leadership, action,
and social innovation. New Jersey: John Wiley & Sons.
Vasi, A. 2013. Serverarea.com: What companies can do with a website?
[Online] Available: http://www.serverarea.com/What_

227
companies_can_do.317.0.html (Accessed 11 February 2013).
Vom Brocke, J. & Roseman, M. 2010. Handbook on business process
management. London: Springer.
Wallace, P. 2001. The psychology of the Internet. United Kingdom: Cambridge
University.
Walsh, D.C., Rudd, R.E. Moeykens, B.A. & Moloney, T.W. 1993. Social
marketing for public health. Health Affairs, 12(2):104-119.
Waltz, C.F., Strickland, O.L. & Lenz, E.R. 2010. Measurement in nursing and
health research. 4th ed. New York: Springer.
Wankel, C., Marovich, M. & Stanaityte, J. 2010. Cutting-edge social media
approaches to business education: Teaching with LinkedIn, Facebook,
Twitter, Second Life, and Blogs. United States of America: Information
Age.
Wankel, C. & Stoner, J.A.F. 2009. Management education for global
sustainability. Information Age.
Weinberg, T. 2009. The New Community Rules: Marketing on the Social Web.
United States of America: O’Reilly.
Weiner, I.B., Freedheim, D.K. & Graham, J.R. 2003. Handbook of psychology:
Assessment psychology. New Jersey: John Wiley & Sons.
Westall, A. & Cowling, M. 1999. Agenda for growth. London: Institute for Public
Policy Research.
Whitley, B.E. & Kite, M.E. 2013. Principles of research in behavioral science.
3rd ed. New York: Routledge.
228
Wild, J. & Diggines, C. 2009. Marketing research. Cape Town: Juta.
Wilson, J. 2010. Essentials of business research: A guide to doing your
research project. London: Sage.
Wimmer, R.D & Dominick, J.R. 2011. Mass media research: An introduction. 9th
ed. Boston: Cengage.
Winer, R.S. 2001. Customer relationship management: a framework, research
directions, and the future. Haas School of Business. 1-33.
Woodside, A.G. 2010. Organizational culture, business-to-business
relationships, and interfirm networks. United Kingdom: Emerald.
Woolworths Holdings Limited. 2012. Woolworths Holding Limited: Good
business journey report. [Online] Available:
http://www.woolworthsholdings.co.za/downloads/2012/good_business_jou
rney_report_2012.pdf (Accessed 02 December 2013).
Woolworths. 2013 a. Woolworths. [Online] Available:
http://www.woolworths.co.za/ (Accessed 09 June 2013).
Woolworths. 2013 b. Woolworths: Responsible retailer award [Online]
Available: http://www.woolworths.co.za/Home/Corporate-
Info/Responsible-Retailer-Award/cat600152.cat (Accessed 25 February
2013).
Woolworths. 2013 c. Woolworths: Facts about our florist. [Online] Available:
http://www.woolworths.co.za/Home/Online-Florist/Facts-About-Our-
Florist/cat602500.cat (Accessed 25 February 2013).
Woolworths Limited. 2007. Doing the right thing: Sustainability strategy 2007 –
2015. [Online] Available:
229
http://www.woolworthslimited.com.au/icms_docs/130514_Doing_the_Righ
t_Thing.pdf (Accessed 02 December 2013).
Woolworths Limited. 2011. Economic structure and performance of the
Australian retail industry. [Online] Available:
http://www.pc.gov.au/__data/assets/pdf_file/0017/110195/sub110.pdf
(Accessed 02 December 2013).
Wu, Y. C., Huang, S., Kuo, L. & Wu, W. H. 2010. Management Education for
Sustainability: A Web-Based Content Analysis. Academy of Management
Learning & Education, 9(3)520-531.
W3newspapers. 2013. W3newspapers: Business magazines online. [Online]
Available: http://www.w3newspapers.com/magazines/business/ (Accessed 31
October 2013).
Xu, J. 2005. Market research handbook: Measurement, approach and practice.
United States of America: iUniverse.
Yeshin, T. 2006. Advertising. London: Thomson.
Yoo, B., Donthu, N. & Lee, S. 2000. An examination of selected marketing mix
elements and brand equity. Journal of the Academy of Marketing Science,
28(2):195-211.
Young, M.A. 2008. Exploring community well-being and sustainability at a local
scale: Finding the differences of focus between local residents, local
officials, and experts. Faculty of Forest and Natural Resources
Management, 1-65.
Young, W. & Tilley, F. 2006. Can businesses move beyond efficiency? The shift
toward effectiveness and equity in the corporate sustainability debate.
Business Strategy and the Environment, 15(6):402-415.

230
Youtube. 2013. Youtube: Pick n Pay: Like bike support Velokhaya (05.03.13)
[Online] Available: http://www.youtube.com/watch?v=qeYm6BdSIPU
(Accessed 02 April 2013).
Yuan, M.J. 2005. Nokia smartphone hacks. United States of America: O’Reilly.
Zarrella, D. 2010. The social media marketing book. Canada: O’Reilly.
Zarrella, D. & Zarrella, A. 2011. The Facebook marketing book. Canada:
O’Reilly.
Zeanah, C.H. 2009. Handbook of infant mental health. 3rd ed. New York:
Guilford.
Zentes, J., Morschett, D. & Schramm-Klein, H. 2011. Strategic retail
management: Text and international cases. 2nd ed. Netherlands: Gabler.
Zikmund, W.G. & Babin, B.J. 2013. Essentials of marketing research. 5th ed.
United States of America: Cengage.
Zikmund, W.G., Babin, B.J., Carr, J.C. & Griffin, M. 2013. Business research
methods. 9th ed. United States of America: Cengage.
Zimmerman, J. & Ng, D. 2012. Social Media Marketing All-in-one For Dummies.
2nd ed. New Jersey: John Wiley & Sons.

231
ANNEXURE A:
QUESTIONNAIRE
232
Unit for Applied Management Sciences South Campus
DEPARTMENT OF BUSINESS MANAGEMENT Tel. +27 (0)41 504 2875 Fax. +27 (0)41 504 4840
22 July 2013
Dear Sir/Madam
I am a Master’s student at the Nelson Mandela Metropolitan University (NMMU) conducting a research study in the field of Business Management. The topic of my study is: “Social media tools influencing customer purchasing behaviour in the retail environment” The aim of the research is to study the influence of social media tools (such as Official websites, Facebook and Twitter) on the brand image of retailers (such as PicknPay, Spar, Shoprite and Woolworths). Ultimately, the study aims to identify the relationship between brand image and the purchasing behaviour of customers in the retail environment. It would therefore be greatly appreciated if you could respond to the following questions so as to assist in the completion of this study. Participation is completely voluntary and anonymous. All information will be treated in the strictest confidence. You may withdraw at any stage. Your assistance will be greatly appreciated. If you have any queries, please feel free to contact us. Yours sincerely,
C Rootman R Scholtz
Dr C Rootman Mr R Scholtz Supervisor Researcher
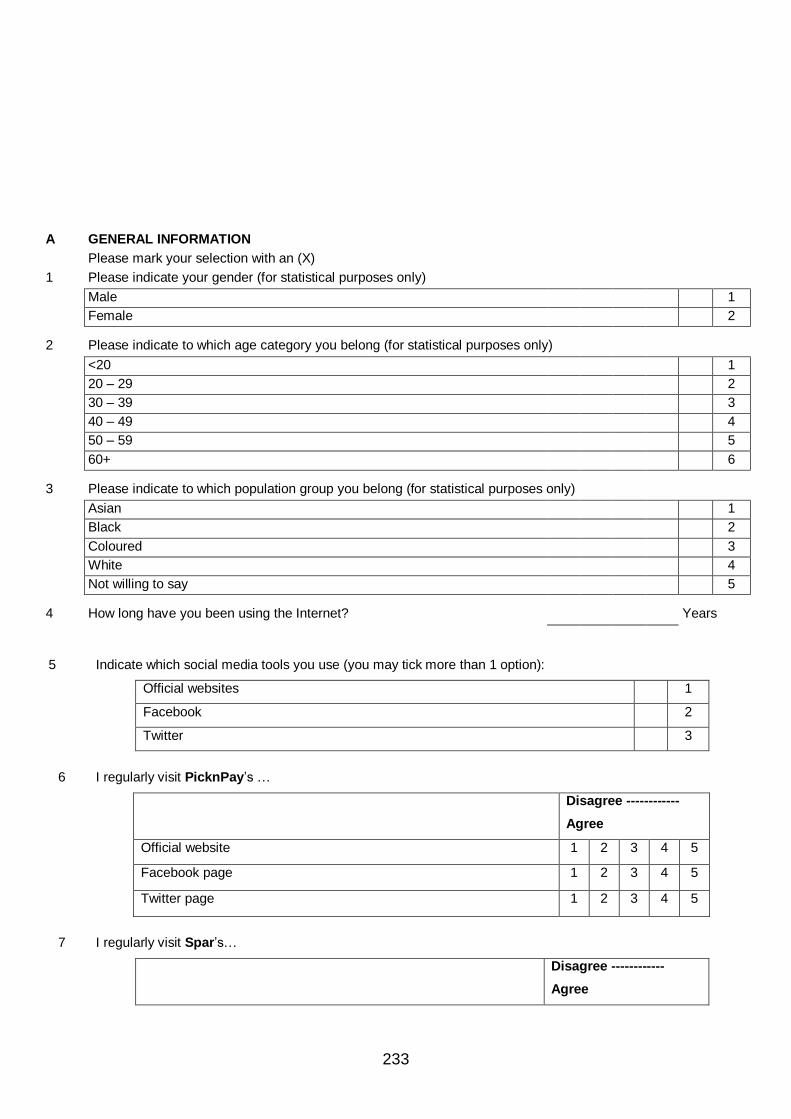
233
A GENERAL INFORMATION
Please mark your selection with an (X)
1 Please indicate your gender (for statistical purposes only)
Male 1
Female 2
2 Please indicate to which age category you belong (for statistical purposes only)
<20 1
20 – 29 2
30 – 39 3
40 – 49 4
50 – 59 5
60+ 6
3 Please indicate to which population group you belong (for statistical purposes only)
Asian 1
Black 2
Coloured 3
White 4
Not willing to say 5
4 How long have you been using the Internet? Years
5 Indicate which social media tools you use (you may tick more than 1 option):
Official websites 1
Facebook 2
Twitter 3
6 I regularly visit PicknPay’s …
Disagree ------------
Agree
Official website 1 2 3 4 5
Facebook page 1 2 3 4 5
Twitter page 1 2 3 4 5
7 I regularly visit Spar’s…
Disagree ------------
Agree

234
Official website 1 2 3 4 5
Facebook page 1 2 3 4 5
Twitter page 1 2 3 4 5
8 I regularly visit Shoprite’s…
Disagree ------------ Agree
Official website 1 2 3 4 5
Facebook page 1 2 3 4 5
Twitter page 1 2 3 4 5
9 I regularly visit Woolworths’s…
Disagree ------------ Agree
Official website 1 2 3 4 5
Facebook page 1 2 3 4 5
Twitter page 1 2 3 4 5
10 MOST of my purchases are done at (please only tick one option):
PicknPay 1
Spar 2
Shoprite 3
Woolworths 4
B SOCIAL MEDIA TOOLS
Please answer the following questions based on your own perceptions. There are no correct or
incorrect answers. Please indicate to what extent you agree with the following statements.
(1) strongly disagree, (2) disagree, (3) neutral, (4) agree, (5) strongly agree
1 OFFICIAL WEBSITES OF SOUTH AFRICAN RETAILERS (PICKNPAY, SPAR, SHOPRITE,
WOOLWORTHS)
Disagree -------------
Agree
1.1 I visit the Official websites of South African retailers (eg. PicknPay,
Spar, Shoprite, Woolworths) on a regular basis. 1 2 3 4 5
1.2 I visit the Official websites of these retailers for product information. 1 2 3 4 5
1.3 I visit the Official websites of these retailers to view special product 1 2 3 4 5

235
offers.
1.4 I use the Official websites of these retailers to communicate with the
business. 1 2 3 4 5
1.5 I use the Official websites of these retailers to participate in
competitions. 1 2 3 4 5
1.6 I visit the Official websites of these retailers to view the activities
participated in by the business. 1 2 3 4 5
1.7 I visit the Official websites of these retailers to view images and
videos uploaded by the businesses. 1 2 3 4 5
1.8 I purchase products from the Official websites of these retailers. 1 2 3 4 5
1.9 I enjoy visiting these retailers’ websites. 1 2 3 4 5
2 FACEBOOK PAGES OF SOUTH AFRICAN RETAILERS (PICKNPAY, SPAR, SHOPRITE,
WOOLWORTHS)
Disagree -------------
Agree
2.1 I have “liked” Facebook pages of South African retailers (eg.
PicknPay, Spar, Shoprite, Woolworths). 1 2 3 4 5
2.2 I visit the Facebook pages of these retailers for product information. 1 2 3 4 5
2.3 I visit the Facebook pages of these retailers to view special product
offers. 1 2 3 4 5
2.4 I use Facebook to communicate with these retailers. 1 2 3 4 5
2.5 I visit the Facebook pages of these retailers to participate in
competitions. 1 2 3 4 5
2.6 I visit the Facebook pages of these retailers to view the activities
participated in by these businesses. 1 2 3 4 5
2.7 I visit the Facebook pages of these retailers to view images and
videos uploaded by the businesses or followers. 1 2 3 4 5
2.8 I purchase products from the Facebook pages of these retailers. 1 2 3 4 5
2.9 I enjoy visiting the Facebook pages of these retailers. 1 2 3 4 5
2.10 I use Facebook to view the comments of other customers on the
products/ services and actions of these retailers. 1 2 3 4 5
2.11 I use Facebook to communicate with other customers with regard
to these retailers. 1 2 3 4 5
2.12 When I’m on the Facebook pages of these retailers feel as if I’m part
of a community. 1 2 3 4 5
3 TWITTER PAGES OF SOUTH AFRICAN RETAILERS (PICKNPAY, SPAR, SHOPRITE,
WOOLWORTHS)
Disagree -------------

236
Agree
3.1 I “follow” South African retailers (eg. PicknPay, Spar, Shoprite,
Woolworths) on Twitter. 1 2 3 4 5
3.2 I visit the Twitter pages of these retailers for product information. 1 2 3 4 5
3.3 I visit the Twitter pages of these retailers to view special product
offers. 1 2 3 4 5
3.4 I use Twitter to communicate with these retailers. 1 2 3 4 5
3.5 I visit the Twitter pages of these retailers to view the activities
participated in by these businesses. 1 2 3 4 5
3.6 I visit the Twitter pages of these retailers to view images and videos
uploaded by the businesses or followers. 1 2 3 4 5
3.7 I enjoy reading these retailers’ tweets. 1 2 3 4 5
3.8 I use Twitter to view the comments of other customers on the
products/services and actions of these retailers. 1 2 3 4 5
3.9 I use Twitter to communicate with other customers with regard to
these retailers. 1 2 3 4 5
3.10 When I’m on the Twitter pages of these retailers I feel as if I’m part of
a community. 1 2 3 4 5
C BRAND IMAGE AND CUSTOMER PURCHASING
1 BRAND IMAGE OF SOUTH AFRICAN RETAILERS (PICKNPAY, SPAR, SHOPRITE,
WOOLWORTHS)
Disagree -------------
Agree
1.1 I like the pictures and videos on the Official websites of South
African retailers (eg. PicknPay, Spar, Shoprite, Woolworths). 1 2 3 4 5
1.2 I like the pictures and videos on the Facebook pages of these
retailers. 1 2 3 4 5
1.3 I like the pictures and videos on the Twitter pages of these retailers. 1 2 3 4 5
1.4 Through their Official websites, these retailers better communicate
with me. 1 2 3 4 5
1.5 Through their Facebook pages, these retailers better communicate
with me. 1 2 3 4 5
1.6 Through their Twitter pages, these retailers better communicate with
me. 1 2 3 4 5
1.7 From the Official websites of these retailers, it is evident that they
care for the environment. 1 2 3 4 5
1.8 From the Facebook pages of these retailers, it is evident that they
care for the environment. 1 2 3 4 5
1.9 From the Twitter pages of these retailers, it is evident that they care 1 2 3 4 5

237
for the environment.
1.10 The Official websites of these retailers show that they care for the
community. 1 2 3 4 5
1.11 The Facebook pages of these retailers show that they care for the
community. 1 2 3 4 5
1.12 The Twitter pages of these retailers show that they care for the
community. 1 2 3 4 5
2
2.1
2.2
2.3
2.4
3
I have a positive brand image of…
Disagree -----------
Agree
PicknPay 1 2 3 4 5
Spar 1 2 3 4 5
Shoprite 1 2 3 4 5
Woolworths 1 2 3 4 5
CUSTOMER PURCHASING BEHAVIOUR FROM SOCIAL MEDIA TOOLS (OFFICIAL
WEBSITES, FACEBOOK, TWITTER)
Disagree -------------
Agree
3.1 I use social media tools (Official websites, Facebook, Twitter) to
compare products/services of different retailers. 1 2 3 4 5
3.2 Comments and information shared by South African retailers (eg.
PicknPay, Spar Shoprite, Woolworths) on their social media tools
influence my purchasing decisions.
1 2 3 4 5
3.3 Other customers’ comments on social media tools influence my
purchasing decisions. 1 2 3 4 5
3.4 I use social media tools to make my final purchasing decisions. 1 2 3 4 5
3.5 Since South African retailers started to use social media tools, I
purchase more of their products. 1 2 3 4 5
3.6 I more often (frequently) purchase online from South African
retailers than in their physical store outlets. 1 2 3 4 5
3.7 I spend larger amounts of money when I purchase online from
South African retailers than when I purchase in store. 1 2 3 4 5
THANK YOU VERY MUCH FOR YOUR PARTICIPATION

238
ANNEXURE B:
ETHICS FORM

239
ETHICS CLEARANCE FOR TREATISES/DISSERTATIONS/THESES
Please type or complete in black ink
FACULTY: Business and Economic Sciences
SCHOOL/DEPARTMENT: Business Management
I, Rootman, C.
the supervisor for Scholtz, R.
student number, 209095039
a candidate for the degree of MCom (Business Management)
with a dissertation entitled:
Social media tools influencing customer purchasing behaviour in the retail environment.
considered the following ethics criteria (please select the appropriate block):
FORM E

240
YES NO
1. Is there any risk of harm, embarrassment of offence, however slight or temporary, to the participant, third parties or to the communities at large?
x
2. Is the study based on a research population defined as ‘vulnerable’ in terms of age, physical characteristics and/or disease status?
x
2.1 Are subjects/participants/respondents of your study: x
(a) Children under the age of 18? x
(b) NMMU staff? x
(c) NMMU students? x
(d) The elderly/persons over the age of 60? x
(e) A sample from an institution (e.g. hospital/school)? x
(f) Handicapped (e.g. mentally or physically)? x
3. Does the data that will be collected require consent of an institutional authority for this study? (An institutional authority refers to an organisation that is established by government to protect vulnerable people)
x
3.1 Are you intending to access participant data from an existing, stored repository (e.g. school, institutional or university records)?
x
4. Will the participant’s privacy, anonymity or confidentiality be compromised?
x
4.1 Are you administering a questionnaire/survey that:
x
(a) Collects sensitive/identifiable data from participants? x
(b) Does not guarantee the anonymity of the participant? x
(c) Does not guarantee the confidentiality of the participant and the data? x
(d) Will offer an incentive to respondents to participate, i.e. a lucky draw or any other prize?
x
(e) Will create doubt whether sample control measures are in place? x
(f) Will be distributed electronically via email (and requesting an email response)? Note:
If your questionnaire DOES NOT request respondents’ identification, is distributed electronically and you request respondents to return it manually (print out and deliver/mail); AND
respondent anonymity can be guaranteed, your answer will be NO.
If your questionnaire DOES NOT request respondents’ identification, is distributed via an email link and works through a web response system (e.g. the university survey system); AND
respondent anonymity can be guaranteed, your answer will be NO.
x
Please note that if ANY of the questions above have been answered in the affirmative (YES) the student will need to complete the full ethics clearance form (REC-H application) and
submit it with the relevant documentation to the Faculty RECH (Ethics) representative.

241
and hereby certify that the student has given his/her research ethical consideration and full
ethics approval is not required.
________________________ _________________
SUPERVISOR(S) DATE
________________________ _________________
HEAD OF DEPARTMENT DATE
_______________________ ________________
STUDENT(S) DATE