Embed Size (px)
Citation preview
DO NOT CITE OR CIRCULATE WITHOUT PERMISSION Accepted at Human and Ecological Risk Assessment
1
Starbird, K., Dailey, D., Walker, A. H., Leschine, T. M., Pavia, R., & Bostrom, A. (2015). Social Media, Public Participation, and the 2010 BP Deepwater Horizon Oil Spill. Human and Ecological Risk Assessment: An International Journal,21(3), 605-630. http://dx.doi.org/10.1080/10807039.2014.947866
Social Media, Public Participation, and the 2010 BP Deepwater Horizon Oil
Spill
Kate Starbird,1 Dharma Dailey,1 Ann Hayward Walker,2 Thomas M. Leschine,3 Robert
Pavia,4 and Ann Bostrom5
1Human Centered Design & Engineering, University of Washington, Seattle, WA, USA; 2SEA
Consulting Group. Cape Charles, VA, USA; 3Human Dimensions of the Environment and the
School of Marine and Environmental Affairs, University of Washington, Seattle, WA, USA; 4School of Marine and Environmental Affairs, University of Washington, Seattle, WA, USA; 5Daniel J. Evans School of Public Affairs, University of Washington, Seattle, WA, USA
Address correspondence to Kate Starbird, Assistant Professor, Human Centered Design &
Engineering, University of Washington, Seattle, WA 98195 USA. Tel. 206-313-2766. E-mail
Running Head: Social Media, Public Participation, and the 2010 Deepwater Horizon oil spill
DO NOT CITE OR CIRCULATE WITHOUT PERMISSION Accepted at Human and Ecological Risk Assessment
2
ABSTRACT
This research examines how information about an oil spill, its impacts, and the use of
dispersants to treat the oil, moved through social media and the surrounding Internet during the
2010 BP Deepwater Horizon oil spill. Using a collection of tweets captured during the spill, we
employ a mixed-method approach including an in-depth qualitative analysis to examine the
content of Twitter posts, the connections that Twitter users made with each other, and the links
between Twitter content and the surrounding Internet. This paper offers a range of findings to
help practitioners and others understand how social media is used by a variety of different actors
during a slow-moving, long-term, environmental disaster. We enumerate some of the most
salient themes in the Twitter data, noting that concerns about health impacts were more likely to
be communicated in tweets about dispersant use, than in the larger conversation. We describe the
accounts and behaviors of highly-retweeted Twitter users, noting how locals helped to shape the
network and the conversation. Importantly, our results show the online crowd wanting to
participate in and contribute to response efforts, a finding with implications for future oil spill
response.
Key Words: social media, crowdsourcing, citizen science, emergency response, oil spill
response, digital volunteerism, emergent organization.
DO NOT CITE OR CIRCULATE WITHOUT PERMISSION Accepted at Human and Ecological Risk Assessment
3
INTRODUCTION
On April 20, 2010, the Deepwater Horizon oil rig exploded and sank into the Gulf of
Mexico off the coast of Louisiana. For 87 days, oil flowed from the seabed, resulting in what
became the largest marine oil spill ever along a U.S. coastline (Robertson and Krauss 2010). Oil
made its way to the waters and shores of Louisiana, Alabama, Mississippi, and Florida, causing
environmental damage, economic impact and concern for human health in the region.
In the immediate aftermath of the explosion more than 47,000 people were involved in
efforts to burn, contain, recover, or disperse oil. The use of two chemical dispersants, Corexit
9500 and Corexit 9527, became controversial among both experts and the public who grew
concerned about health impacts on marine life and humans. According to the National
Commission on the BP Deepwater Horizon oil spill and Offshore Drilling (Graham et al. 2011),
this controversy was fueled by three factors: the unprecedented amount of dispersants used (1.84
million gallons); the novel, untested application of dispersants underwater; and lack of guidelines
about overall amounts used and duration of use.
The BP Deepwater Horizon oil spill sparked considerable conversation on the web—from
mainstream news, to the blogosphere, to the social media sites. Twitter is a microblogging
platform that allows users to share short messages with their account’s “followers” as well as
with the general public. At the time of the oil spill, Twitter was just over 4 years old, but was
experiencing rapid growth (Costolo 2010). Recent earthquakes in Haiti (January 2010) and Chile
(February 2010) had attracted attention to the Twitter platform as a place for information
sharing, sense-making, and digital volunteerism during disaster (HHI 2011; Starbird and Palen
2011). Not surprisingly, individuals and organizations, both remote and local to the disaster,
turned to Twitter to discuss the spill.
BACKGROUND
Social media are becoming a consistent feature of the crisis response milieu. Affected
people are turning to these platforms to share information about event impacts (Liu et al. 2008;
Palen et al. 2010; Bruns et al. 2012); to seek information from others (Palen et al. 2010); and to
coordinate community-based response efforts (Shklovski et al. 2008, Qu et al. 2009; Sutton
2010). Remote audiences are converging into online interaction spaces both as spectators
(Hughes et al. 2008) and as digital volunteers (Starbird and Palen 2011). The live mapping of
DO NOT CITE OR CIRCULATE WITHOUT PERMISSION Accepted at Human and Ecological Risk Assessment
4
public information shared over social media and other public forums, an activity that is itself
coordinated using social media and other online tools, has become a common activity during
disaster events (Liu and Palen 2010; Goolsby 2010; Zook et al. 2010).
On one hand, researchers (e.g., Palen et al. 2010), practitioners (Harvard Humanitarian
Initiative 2011; Merchant et al. 2011), and media (Ngak 2012; Yeomans 2012) have been
optimistic about the potential for social media to play a productive role in getting timely
information to affected people and thereby improving their decision making. Along these same
lines, digital volunteerism has been characterized as having the potential for improving response
outcomes by facilitating connections between people and resources—in the form of information,
responders, supplies, etc. (Starbird and Palen 2011).
But there are also concerns about the use of these tools during disaster events, including the
potential spread of misinformation (Hughes and Palen 2012; Starbird et al. 2014) and the
disruption of traditional response processes (HHI 2011).
Social Media Use by Emergency Responders
With the knowledge that their publics are already online and expecting them there,
emergency responders are increasingly experimenting with social media and other online tools
for both outgoing and incoming crisis communications, though these forays are not without their
challenges. Latonero and Shklovski (2011) describe how one emergency manager (EM), an early
adopter of social media, uses these new tools to broadcast messages, to interact, and to listen to
the public. The EM describes how the ability to listen to the public through sites like Twitter is
extremely important, as it enables him to identify rumors, misinformation, and concerns of
members of his community, and to respond to them with better information in real-time.
Monitoring social media can also increase situational awareness for responders, and empirical
research shows that platforms like Twitter contain a significant amount of situational awareness
information during and after disasters (Vieweg et al. 2010).
Hughes and Palen (2012) report that social media use is disrupting the work of response
professionals who serve as Public Information Officers (PIOs), repositioning them as translators
of information, rather than gatekeepers. However, they note that many PIOs are concerned about
these changes, feeling that they do not have the capacity or the training to handle social media
communications, and fearing the spread of misinformation through these channels. On the other
DO NOT CITE OR CIRCULATE WITHOUT PERMISSION Accepted at Human and Ecological Risk Assessment
5
side of this relationship, when official channels of emergency-related information are not
adequately meeting their information needs, citizens turn to informal channels—and social media
are increasingly playing a role in informal information-seeking (Sutton et al. 2008).
Social Media Use during the 2010 BP Deepwater Horizon Oil Spill
In June 2010, Pew released a survey conducted June 3-6 of that year, finding that nearly
two-thirds of Americans were following the oil spill story closely, and that respondents trusted
the news media more for information about the spill than the government or BP (Pew 2010a).
Forty-six percent of respondents reported that they had little or no trust in the U.S. Federal
Government.
Later that summer, Pew published a related study of the role of media in the event (Pew
2010b), reporting that the oil spill dominated the mainstream news during the 100 days after the
spill. They noted that due to the complex nature of the spill itself and the methods for cleaning it,
media professionals had to have (or quickly gain) a large amount of technical and scientific
expertise, and for the most part, the report claimed, they rose to the occasion. Looking to some of
the content of the coverage, their research also indicated that while President Obama had
received mixed (both supportive and critical) coverage, BP and BP CEO Tony Hayward emerged
as villains.
Sutton et al. (2013) examined how government organizations used the Twitter platform
during the 2010 BP Deepwater Horizon oil spill, using what they called the “microstructure”—
i.e., retweets, mentions, replies, and links—within tweets to characterize tweeting behaviors
from government accounts, and mapping out the network of government accounts using friend-
following relationships. They report that government accounts were less likely to interact with
others using the retweet mechanism and had a larger proportion of non-reciprocal friend-follower
relationships than other accounts—supporting a view of government entities using Twitter
primarily as a broadcast mechanism.
Spiro et al. (2010) looked at rumoring behavior during the oil spill, using quantitative
analysis to assess the drivers of social media activity related to the spill. They found that news
coverage increased the volume of tweets related to the spill, and concluded that saliency of an
event drives online participation. They also found that serial transmission of information (in the
DO NOT CITE OR CIRCULATE WITHOUT PERMISSION Accepted at Human and Ecological Risk Assessment
6
form of retweets) was more common in tweets with event-related keywords. That study did not
look at the content of tweets or rumors or at whose information was being transmitted (retweets).
This research complements the largely quantitative studies of Twitter use during the 2010
BP Deepwater Horizon oil spill (Spiro et al. 2010; Sutton et al. 2013), employing mixed
methods, including an in-depth qualitative analysis, to examine the kinds of information that
were flowing through social media and to identify the individuals and organizations who played
important roles in shaping those flows.
The analysis focuses on a dataset collected during the event from public Twitter messages.
A vast majority of tweets are public and searchable, an affordance that contributes to the
platform’s utility during crisis events.
Though the original premise of Twitter was quite simple, users have introduced several
linguistic conventions to increase its usability, including the mention (@username), the retweet
(often RT @username or via @username) and the hashtag (#keyword). Mentions allow a user to
send a public message directed specifically to the attention of another user. Retweets act as a
forwarding mechanism, where a downstream user can repost a message that they have seen,
giving attribution to its original author or another upstream Twitter user. Retweets also serve, for
some, as a recommendation mechanism, both of the information and the author (Starbird and
Palen 2010). Hashtags act as a mechanism for Twitter users to mark up their tweets with certain
keywords, connecting them with certain groups or conversations and increasing their
searchability. In recent years, Twitter has added functionality to support these conventions. At
the time of the 2010 BP Deepwater Horizon oil spill, they had recently rolled out one-click
retweet functionality, though many Twitter users still employed other methods, including manual
ones, for marking their tweets as retweets.
These tweet features can be important for tracking information flow in the space. Hashtags
can be used to home in on specific kinds of conversation and sub-groups in the conversation
space, and are therefore useful for focused search. Retweets and mentions demonstrate different
kinds of connections between users, and can be traversed to create network graphs.
DO NOT CITE OR CIRCULATE WITHOUT PERMISSION Accepted at Human and Ecological Risk Assessment
7
OBJECTIVES
The objectives of this research are to evaluate the social media response to the BP
Deepwater Horizon oil spill. We look to the Twitter conversation around the #OilSpill hashtag to
assess how members of the public understood—and perhaps more importantly how they came to
understand—the actual and potential impacts of the disaster, the response efforts, and
specifically the use of oil dispersants in the clean-up. We examine the role of Twitter in shaping
public understanding, and look at how specific social media actors influenced the conversation.
In particular, we focus on the Twitter activities of people who were locals—we designate an
account as “local” if the account owner appeared to be tweeting from within 100 miles of the
Gulf Coast. We examine the kinds of content locals shared and linked to in their tweets as well
as with whom they interacted and how to get a sense of how the conversation affected and was
affected by those who had, by some measures, the most at stake.
METHODS
This research consists of an in-depth qualitative analysis of Twitter data, complemented by
descriptive network and quantitative analyses, to examine information flow within that social
media platform as well as the broader information space of the surrounding Internet.
Data Collection
Total #OilSpill Tweet Collection. Twitter provides several Application Programming
Interfaces (APIs) that allow anyone to collect public Twitter data programmatically. The data
analyzed in this study were collected using Twitter’s Streaming API, which enables a forward-
in-time search on a keyword or a set of keywords. We collected on the term #OilSpill (or
#oilspill), a hashtag that emerged to signal participation in the ongoing, public conversation
around the event. For each tweet, we captured the timestamp, author, and tweet text. This larger
dataset is referred to in this paper as the Total #OilSpill Collection. Several parts of the analysis
refer back to this set, including the network diagrams.
Collection period. The collection period spanned from May 9, 2010 (~3 weeks after the spill
began) and August 4, 2010 (~3 weeks after the well was capped). However, during that time our
collection software went inactive for several short time periods (less than 8 hours) and one long
DO NOT CITE OR CIRCULATE WITHOUT PERMISSION Accepted at Human and Ecological Risk Assessment
8
period (July 8–July 12) and no tweets were collected at those times. Figure 1 is the volume of
tweets per day during the collection period.
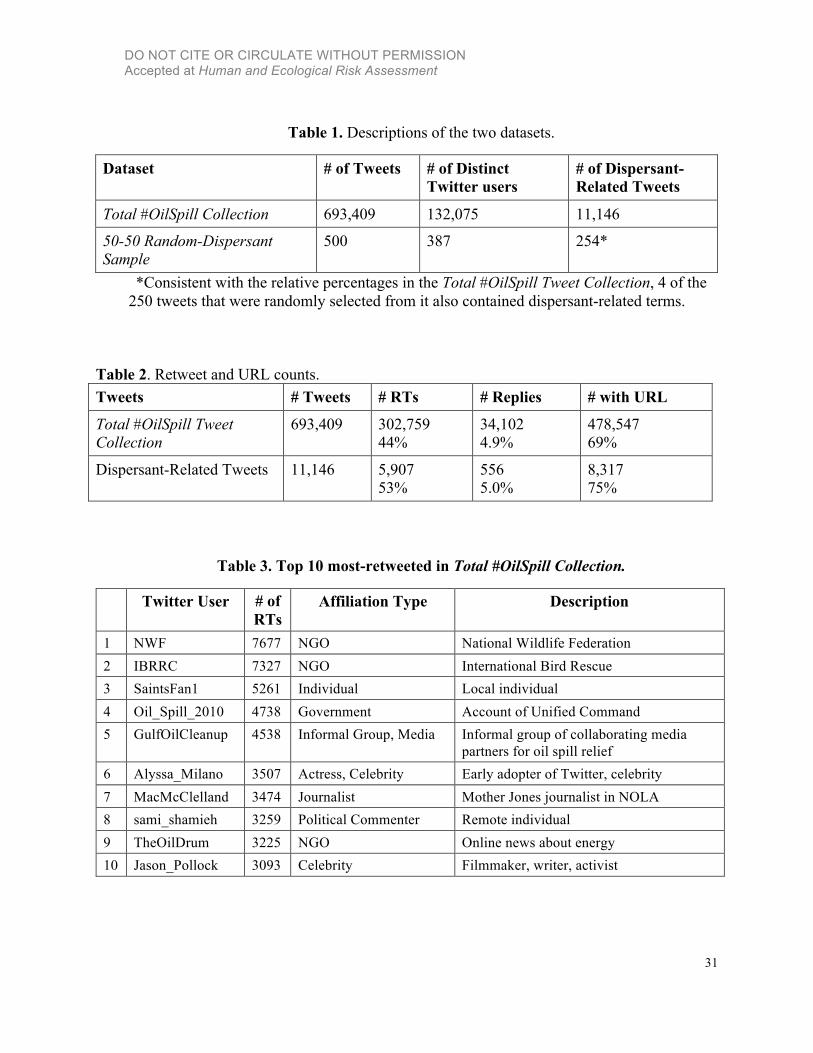
High level description of the Total #OilSpill Collection. The collection captured 693,409
tweets sent by 132,075 different Twitter users (see Table 1). Though the mean suggests each
Twitter user sent 5.25 tweets, the number of tweets per Twitter user has a heavy-tailed
distribution typical of many social media metrics (see Figure 2), and the vast majority of Twitter
users contributed only one tweet to our set. Of those, the sole tweet was most often a retweet,
indicating relatively low engagement in the #OilSpill conversation. Only 8,464 users sent 10 or
more #OilSpill tweets, but those 6.4% users produced more than half the tweets we collected.
Dispersant-related tweets. Within the Total #OilSpill Collection, we identified 11,146
tweets as having content related to oil dispersants based on the inclusion of any of the keywords:
dispersant, its common misspelling dispersent, or Corexit, the dispersant brand that drew the
most discussion during the event. Dispersant-related tweets constitute 1.6% of the tweets in the
Total #OilSpill Collection and were sent by 3,283 different Twitter accounts. Shown in Figure 3
is the volume of dispersant-related tweets per day.
Data Sampling
Because this research was designed to assess both the broader conversation about the BP
Deepwater Horizon oil spill and commentary specifically related to dispersant use, we randomly
selected 250 tweets from the Total #OilSpill Collection and 250 tweets from the 11,146 that
contained a dispersant-related term. We refer to these 500 tweets as the 50-50 Random-
Dispersant Sample. With this sample, we were able to complete an in-depth qualitative analysis
of tweet content that is respectively representative of the broader conversation around the oil
spill and of the specific conversation that took place concerning dispersants.
Our sampling strategy, in concert with the heavy-tailed distribution of tweets across Twitter
users, results in an important discrepancy in representativeness between the overall tweet and
Twitter user distributions. Using a tweet-based sampling strategy, users who sent 100 tweets are
100 times more likely to appear in the sample than users who sent one tweet. Therefore, though
the 500 tweets in the 50-50 Random-Dispersant Sample represent a random sample of the overall
tweet distribution, the accounts owners in the 50-50 Random-Dispersant Sample are more likely
DO NOT CITE OR CIRCULATE WITHOUT PERMISSION Accepted at Human and Ecological Risk Assessment
9
to be higher volume #OilSpill tweeters than the average account in the set, a limitation which we
account for in the reporting of our findings.
Data Analysis
The analysis took place in four stages: exploratory analysis, qualitative coding of tweets,
qualitative coding of articles linked-to by tweets, and mixed-method analysis of results.
Exploratory analysis
We first approached the Total #OilSpill Collection data quantitatively, calculating the larger
features of the set (e.g., number of retweets and URLs) and creating network graphs of the
interactions. This helped us understand some of the features of the larger set, including which
accounts were influential. It also informed our sampling strategy.
Tracing information flow using retweets, replies and URLs. Retweets, replies, and URL
links within tweets play important roles in information flow within Twitter and across the
broader information space of the Internet. If we think of these information spaces as networks,
these linguistic markers within tweets can be inferred to generate connections between accounts
(retweets and replies) and between Twitter and other sites (URLs).
Shown in
Table 2 are the number of retweets, replies, and tweets with URLs both within the Total
#OilSpill Collection and within the subset of tweets that contain dispersant-related terms. Forty-
four percent of the tweets we collected are retweets and 69% contain a URL link to an external
webpage. For both features, these are much higher rates (approximately three times) than what
would be found across a completely random set of tweets in 2010 (Rao 2010; Suh et al. 2010).
So, #OilSpill tweets were more likely to contain a URL and to be retweets than the average
tweet. For dispersant-related tweets these numbers are even higher—53% are retweets and 75%
contain a link. Both of these suggest that many Twitter users relied on other sources and websites
for the information they were sharing about the #OilSpill. First-hand and other information that
was new to the broader information space, though certainly present, was less prevalent.
Network analysis. One way to examine information flow during the event is through
network visualizations. Using linguistic conventions in tweet content (like retweets and
DO NOT CITE OR CIRCULATE WITHOUT PERMISSION Accepted at Human and Ecological Risk Assessment
10
mentions) we can construct networks of relationships between Twitter users that are event-
specific and separate from their lists of followers and followings.
Figure 4 is a network graph showing the connections created by each retweet in the Total
#OilSpill Tweet Collection. Each node in the graph represents a Twitter account in our set and is
sized by the number of retweets that account received. Each edge (line connecting a pair of
nodes) represents a retweet of one account by another and they are sized according to the log
number of retweets sent between the two accounts. Accounts in this graph are grouped into and
subsequently colored by “clusters”—nodes in the graph that have similar sets of connections to
other nodes—as determined by the Louvain method (Blondel et al. 2008).
We used this network graph to inform the preliminary analysis of #OilSpill data and later to
interpret and contextualize findings.
Qualitative coding of tweets and URL links
We coded the 50-50 Random-Dispersant Sample data across two separate dimensions: tweet
content and URL link content.
Tweet content. For each tweet in the 50-50 Random-Dispersant Sample, we coded across
several dimensions including tweet theme and whether the tweet contained scientific content.
Categories for tweet theme coding were initially developed using a grounded approach across a
large, preliminary sample of tweets. These thematic categories (see Table 4 for the full list) were
therefore ones we found, through an iterative coding process, to be salient in the Twitter data for
this event. Later, we grouped these categories according the Drivers-Pressure-State-Impact-
Response (DPSIR) framework (Smeets and Weterings 1999).
URL link content. A large portion of tweets in the Total #OilSpill Collection (69%) contain
an embedded URL link. To capture a picture of the larger information space surrounding Twitter,
and the flow of information between Twitter and other sites, we explored the content of
embedded links in our sample.
Of the 500 tweets in the 50-50 Random-Dispersant Sample, 354 contained a web link. Many
of these links were still active and we were able to recover others through the Internet Archive
online service (https://archive.org/web/). Ultimately we were able to locate the original content
of 81.5% of the links nearly three years after the event.
DO NOT CITE OR CIRCULATE WITHOUT PERMISSION Accepted at Human and Ecological Risk Assessment
11
We were particularly interested in the range of sources that were mentioned in different
cited articles. We coded individuals and entities mentioned in linked-to web content across
multiple dimensions, including role and organizational affiliation. We also captured title, author,
domain, and media type (e.g., news article, video, blog, petition). Specific to characterizing the
nature of dispersant related tweets, we noted when a link’s content contained a high level of
scientific or technical content. This analysis allowed us to see the kinds of external sources that
different Twitter users brought into the #OilSpill conversation.
Mixed-method analysis
Finally, we analyzed the results of the coding, integrating descriptive statistics of the codes
with further qualitative analysis of tweet content, Twitter user behaviors, and network
connections between users. This mixed method approach provides a rich set of findings,
described below.
Data Limitations
Consistent with other studies on social media data (boyd and Crawford 2011), these data
represent only a subset of the broader Twitter conversation about the 2010 BP Deepwater
Horizon oil spill and have specific biases related to its collection and sampling. Most
significantly, only tweets where the account owner purposefully used the #OilSpill hashtag in
their tweets were collected, which means that account owners who were not aware of the hashtag
are not represented in this analysis. However, the presence of certain accounts, including several
high-volume, local Twitter users and the official Twitter account of Unified Command
(@Oil_Spill_2010), suggests that some portion of the relevant oil spill conversation was indeed
organized around the use of this hashtag. Unified Command is the term used to describe the
authorities responsible for jointly managing an incident near where it occurs. This was the
account operated by the U.S. Coast Guard in New Orleans.
RESULTS
Network Analysis: Diverse Voices
The #OilSpill conversation included a variety of different voices, including: wildlife and
other non-governmental organizations (NGOs), locals, response organizations, accounts specific
DO NOT CITE OR CIRCULATE WITHOUT PERMISSION Accepted at Human and Ecological Risk Assessment
12
to the event, media, celebrities, and political bloggers. Tracing retweet connections on Twitter
allows us to see how some of these accounts interacted with each other (Figure 4). Retweets
show how information spreads across different Twitter users. They can also be viewed as a form
of recommendation for specific tweets or for accounts (Starbird and Palen 2010). Listed in Table
3 are the 10 most-retweeted accounts in the Total #OilSpill Collection, the voices that resonated
most among the online “crowd”—the numerous users, connected by information-communication
technology, who came together to participate in the online conversation about the spill.
NGOs as independent domain experts
An examination of Table 3 shows the National Wildlife Federation (@NWF) and the
International Bird Rescue Research Center (@IBRRC) to be by far the most-retweeted accounts
in the Total #OilSpill Tweet Collection. These two accounts are also both somewhat central in
our network graph. Both organizations are NGOs that focus on the environment and on wildlife
protection and rescue, and both existed prior to the 2010 BP Deepwater Horizon oil spill.
The NWF is a non-profit organization that promotes conservation education and advocacy
efforts in the United States. During the oil spill, their Twitter account was retweeted 7,677 times
by 4,103 different Twitter users, suggesting a broad impact and likely reflecting a high number
of followers. They sent 256 #OilSpill tweets during the event, receiving nearly 30 retweets per
tweet, the most of any highly-retweeted account in our dataset. Two hundred thirty-six (236) of
their tweets (92%) contained a link to a webpage, often to a blog on their own website or to a
source in the mainstream media.
Evidence suggests that NWF’s tweets impacted the conversation about dispersants. Though
they sent only four tweets referring to dispersant use, those tweets—which were critical of BP’s
strategy for deploying dispersants—were retweeted 111 times. @NWF (May 10): Using dispersants on an #OilSpill doesn’t reduce the total amount of oil in the environment: http://bit.ly/daeo8q
@NWF (May 25): BP Still Stonewalling EPA on Dispersant Chemicals http://bit.ly/cmXif8 #OilSpill
The IBRRC is an organization of veterinarians and scientists who specialize in cleaning
birds after oil spills. They tweeted 1,209 #OilSpill tweets during the event, often with links to
photos or articles on their own site that described their clean-up efforts. Many of their tweets
contained photos of oiled or recently cleaned birds.
DO NOT CITE OR CIRCULATE WITHOUT PERMISSION Accepted at Human and Ecological Risk Assessment
13
Though the IBRRC was retweeted almost as much as the NWF within the #OilSpill
conversation, a deeper analysis shows the crowd interacting with their account in a different way.
IBRRC was retweeted 7,327 times by 2,291 different Twitter users, which means that far fewer
users retweeted them, but these users were more likely to retweet them multiple times.
Significantly, though the NWF had the more prominent position in the larger Twittersphere, the
IBRRC was more highly-retweeted among the local, high-volume #OilSpill tweeters in the 50-50
Random-Dispersant Sample. Put another way, while the NWF had a broader impact on the larger
Twitter crowd, messages from the IBRRC seem to have resonated more with those who were
more engaged with the event.
Importantly, both of these highly-retweeted organizations had domain expertise relevant to
the oil spill. Their accounts also share a degree of independence from the event, which may have
contributed to their highly retweeted status.
A local Twitter user at the center of the conversation
There were 41 local Twitter users in the 50-50 Random-Dispersant Sample. One local
Twitter user, @SaintsFan11, was the third most retweeted account in the Total #OilSpill
Collection, with 5,261 retweets. Like several other locals, she was also a high-volume Twitter
user, sending 5,173 #OilSpill tweets over the course of the event.
Though her per-tweet impact was not very high—about one retweet for every tweet—her
overall impact on the #OilSpill conversation was, especially among other locals and other users
who were highly engaged. Significantly, she was retweeted by far fewer unique Twitter accounts
than other highly-retweeted accounts in the data. For instance, while the NWF and IBRRC were
retweeted by 4,103 and 2,291 different accounts respectively, @SaintsFan1 was only retweeted
by 877 different accounts. However, these 877 Twitter users were both more engaged with
@SaintsFan1 (each retweeted her on average 6 times) and more engaged with the #OilSpill
conversation over the course of the event. People who retweeted @SaintsFan1 sent a mean of
164 and a median of 40 #OilSpill tweets each, far more than the mean (5.25) and median (1)
from the dataset at large.
@SaintsFan1 can be seen as having a form of local authority (Starbird and Palen 2010),
because she lived in an affected area. Our network and retweet analyses show her as central and 1 This account name is anonymized to protect the privacy of the Twitter user.
DO NOT CITE OR CIRCULATE WITHOUT PERMISSION Accepted at Human and Ecological Risk Assessment
14
highly influential within the network of high-volume #OilSpill tweeters, especially among other
locals. She is not the only local in the set—our coded sample identified 40 other accounts that
were operated by someone who was in the affected area at some time during the event—but she
is by far the most influential individual who is not associated with an organization or the media.
@SaintsFan1 also used the Twitter platform in various ways. One was to engage publicly
with government accounts related to oil spill response. She sent 379 “reply” tweets that she also
marked with the #OilSpill tag, intentionally calling these tweets to the attention of others
following the conversation. These included 4 tweets to the @WhiteHouse, 7 to @BarackObama,
37 to @LisaPJackson (USEPA head during the event), and 26 tweets to the @Oil_Spill_2010
account (described below). Below are a few samples of these tweets: @SaintsFan1 (May 16, 2010): @WhiteHouse We paid for ALVIN & NR-1 with our taxpayer dollars, so we demand deployment now w/media 14on’t14a14.
#oilspill #oceans
@SaintsFan1 (May 27, 2010): @BarackObama Mornin Mr. President sir. Please take the WHPressCorps on a tour with Billy Nungesser IN the
marsh, not on the shore #oilspill
@SaintsFan1 (July 18, 2010): @LisaPJackson : pls consider disbarring BP from ALL federal contracts including those w/Defense Energy Support
Center (DESC) #oilspill
These tweets show a local Twitter user leveraging that platform in attempts to make her
voice heard, questioning the government’s clean-up strategies and giving directives to
government officials. These tweets were often retweeted, which amplified these sentiments
across the larger information space. From another perspective, these tweets also represent an
opportunity for the recipient accounts of government representatives and organizations to
respond directly to constituents, in this case to an influential local Twitter user, through the
social media platform.
@SaintsFan1 also engaged with other local users in the set, and sent 44 public tweets to
@BP_America, the official account of BP for the spill, including these two: @SaintsFan1 (June 24, 2010): @BP_America During #oilspill cleanup, your co. has a DUTY 2 ensure that workers R protected frm the harms
caused by exp. 2 oil & dispersant
DO NOT CITE OR CIRCULATE WITHOUT PERMISSION Accepted at Human and Ecological Risk Assessment
15
@SaintsFan1 (June 26, 2010): @BP_America : You call this cleaned? The oil is still beneath the sand!
http://www.youtube.com/watch?v=5zQydQB7TOQ #oilspill #blacktide
Like many others in the set, @SaintsFan1 was especially critical of BP, accusing them of
not doing everything they could to stop and clean up the spill, and also implying that they were
more concerned with avoiding responsibility than with protecting the environment and the health
of people in the region.
Along another dimension, @SaintsFan1 can be seen to use Twitter to converse with others
as opposed to simply broadcasting her views to the crowd—though she certainly used the
platform for both purposes. The high volume of tweets she sent suggests an “always on” status;
for those following her or following the #OilSpill hashtag, each tweet may have signaled an
availability or even a willingness to converse and engage with others. Her tweet stream also
contains thousands of links to outside sources, showing her to be performing a kind of curatorial
role in addition to her eyewitness reporting. Across the breadth of these tweets, an account
“personality” comes through, including some insight into a range of fears, questions, and
concerns that this local Twitter user had during the oil spill.
Formal responders using Twitter to communicate and engage
Within the #OilSpill data, there were a handful of accounts that belonged to formal response
organizations, including: @Oil_Spill_2010, the official Twitter account of Unified Command’s
Joint Information Center during the summer of 2010; and @GOHSEP, the Louisiana Governor's
Office of Homeland Security and Emergency Preparedness. Both were highly retweeted.
@Oil_Spill_2010 was the fourth-most retweeted account in the Total #OilSpill Collection.
Though that account is now gone and—problematically—another has taken its place, their
profile at the time read, “Official tweets from the Deepwater Horizon Incident Joint Information
Center (JIC) on Unified Command response efforts to the oil spill in the Gulf of Mexico.” They
had significant impact on the broader #OilSpill conversation as indicated by their high retweet
rates (4,738 total retweets from 1,600 different accounts). The account was second-most
popular—in terms of retweets—among locals in the 50-50 Random-Dispersant Sample.
@Oil_Spill_2010 sent a total of 616 #OilSpill tweets, receiving about 8 retweets per tweet.
DO NOT CITE OR CIRCULATE WITHOUT PERMISSION Accepted at Human and Ecological Risk Assessment
16
The @Oil_Spill_2010 account was one part of a comprehensive communications strategy
employed by Unified Command’s JIC that included liveblogging of press conferences; two
event-specific websites with audio, video, and transcripts; a YouTube channel; a Facebook
group; a Flickr account; a widget; and text messages. The JIC used the Twitter accounts to
promote their other communication venues and to broadcast information from government
organizations such as health information from the CDC and maps of the spill from NOAA. Each
day, a link to a summary of command and government activities was promoted via Twitter along
with “status maps” of the event. Actions of the government’s oil spill leadership were updated
frequently. In addition, non-governmental activities were reported such as BP America’s
announcement that claims were being taken. Occasionally, @Oil_Spill_2010 linked to media
stories from national sources like CNN and the New York Times.
In addition to serving as a newswire, Twitter was employed by the JIC as a way to monitor
public concern and, at times, to converse with them directly. Ideas for capping the well were
solicited through Twitter. Questions on topics such as how to volunteer in the clean-up were
answered. Later in the paper, we return to discuss difficulties this account had with engagement.
The celebrity effect: broad, yet shallow
In research on Sina-Weibo, a Twitter-like microblogging platform that is popular in China,
accounts of celebrities and other “VIPs” were shown to play an important role in information
diffusion during a crisis event (Qu et al. 2011). In the #OilSpill Twitter conversation, two U.S.
entertainment celebrities with large Twitter followings, @Alyssa_Milano and @Jason_Pollock,
were among the most retweeted. In both cases, large following numbers likely contributed to
their highly-retweeted status. Both had peripheral positions in the #OilSpill network graph, a
finding supported by the fact that the number of different people who retweeted these celebrities
is quite high in proportion to their retweet count—i.e., most people who retweeted them did so
only once, and for many of these, this was the only #OilSpill tweet that user sent. This suggests
that though celebrities and others with large followings may be able to attract a large number of
people to engage in a topic, this engagement is likely to be low.
DO NOT CITE OR CIRCULATE WITHOUT PERMISSION Accepted at Human and Ecological Risk Assessment
17
A local media consortium and a national reporter on the ground
The 2010 BP Deepwater Horizon oil spill was widely covered by traditional journalism
outlets (Pew 2010a,b). Two of the 10 most retweeted accounts in the Total #OilSpill Tweet
Collection are media-related. Ranked #5 in the list of most-retweeted accounts, the most
retweeted media account is a consortium of local and regional media outlets that came together
for the event to report from the impacted area. @GulfOilCleanup is self-described in its Twitter
profile as a collaborative effort of AL.com, Mobile Alabama’s Press-Register, The Mississippi
Press, and GulfLive.com. For the most part, the @GulfOilCleanup account tweeted headlines
and links to news articles and blogs from these different media organizations.
Also on the top-ten list for the Total #OilSpill Tweet Collection is Mac McClelland
(@MacMcClelland), a journalist who reported from the affected area during the spill for the
national magazine Mother Jones. McClelland posted many tweets in real time as she travelled
through the impacted area, often walking the beaches and tweeting her observations of oil
impacts. Her account is in a central position in our large network graph, but interestingly, she is
not highly-retweeted by the high-volume #OilSpill tweeters in our 50-50 Random-Dispersant
Sample. She appears as the 47th most-retweeted Twitter user by locals in that sample. This
suggests that she may have been more influential across the broader crowd than among those
who were highly engaged in the spill.
Accounts specific to the 2010 BP Deepwater Horizon Oil Spill
@GulfOilCleanup is also one of 21 accounts in the 50-50 Random-Dispersant Sample coded
as being specific to the oil spill. The accounts were created during the event with the expressed
purposes of responding in some way to the spill. Two other event-specific accounts,
@SaveTheGulf and @BPGulfLeak, were among the 10 most-highly retweeted accounts by
locals in the 50-50 Random-Dispersant Sample (see Table 3).
Some of these accounts, such as @SaveTheGulf, represent coordinated groups who aimed to
volunteer or otherwise address the event collectively in some fashion. Others, including
@BPGulfLeak, appear to be the work of single individuals. Some of these groups may have been
purely online organizations, but others seem to have some offline interaction as well (e.g.,
@GulfOilCleanup and @gulfvolunteers), and some, though certainly not all, had members in the
affected areas along the Gulf Coast. The emergence of multiple event-specific accounts supports
DO NOT CITE OR CIRCULATE WITHOUT PERMISSION Accepted at Human and Ecological Risk Assessment
18
other evidence that members of the crowd sought out ways to actively contribute to response
efforts through volunteerism and activism.
The political echo
Political commentary was part of the overall mix of themes in #OilSpill conversation. The
following tweets are just a few examples (among thousands) of how people with different
political viewpoints weighed in: @anonymized1: It took George W Bush two days to waive the Jones Act after Katrina. It took Obama SEVENTY days to do so after #oilspill.
(23 retweets) @anonymized2: I don’t know if the #oilspill is Obama’s Katrina, but Obama is certainly America’s Katrina! #tcot #p2 (15 retweets) @anonymized3: If one really needs a metaphor, and employs logic to make one, #oilspill is Cheney’s Chernobyl, not Obama’s Katrina. (15 retweets)
During the exploratory analysis we encountered a large number of tweets of a political
nature, and we later determined 20 of the 387 accounts in the 50-50 Random-Dispersant Sample
to be primarily devoted to political commentary. Many political tweets were extremely negative
towards and explicitly distrustful of the government in general and the response efforts
particularly. They also contained a notable amount of content that we determined to be related to
one of several “conspiracy theories” spreading within the space. @Sami_Shamieh (July 5, 2010): They Must Be Hiding Something Really Big in the Gulf http://bit.ly/bk31ng #tcot #p2 #oilspill #crimeinc
It was therefore not surprising to find a political blogger among the most retweeted.
@sami_shamieh, at #9, is a political blogger who sent more than 1000 #OilSpill tweets, many
laying blame on the Obama administration for not adequately responding to the event.
Significantly, the retweet network graph (Figure 4, largest node in red) shows this account to be
at the core of a separate conversation-network related to the spill, and that, though vocal and
inflammatory, it was not central to the mainstream #OilSpill conversation. However, a few locals
did connect with this account—four local accounts in the 50-50 Random-Dispersant Sample
retweeted @sami_shamieh a total of eleven times—showing some exchange of information
DO NOT CITE OR CIRCULATE WITHOUT PERMISSION Accepted at Human and Ecological Risk Assessment
19
between political outsiders and those affected by the spill, an effect that opened up channels for
the transmission of politically motivated speculation and commentary on response efforts.
Tweet Themes: Differences in Dispersant-Related Tweets
Shown in Table 4 is the distribution of tweets from the 50-50 Random-Dispersant Sample
according to the themes that presented. Each tweet was assigned up to two themes from the list.
Tweets that were not related to dispersants contained a wide range of themes (see Table 4).
Eighteen percent of these tweets were simply about the state of the spill. Fifteen percent dealt
with environmental impact. Twelve percent focused on liability issues, with many of these
suggesting that BP be held accountable. About 10% were calls to action, including requests to
sign petitions or join in volunteer activities. Commentary on how the oil spill was being
communicated by official sources, including accusations of a cover-up, constituted about 10% of
tweets in the broader conversation. Another 10% of tweets contained remarks on drivers of the
event, including environmental and commercial policy. Political impact was a primary theme in
7.5% of non-dispersant tweets.
Dispersant-related tweets focused around a smaller set of themes. Seventy-six percent
related to the clean up strategy, including aspects of the risks and benefits of dispersant use.
Fifteen percent dealt with environmental impacts and 13% were focused around health impacts,
like the tweet below: @NolaAnn2 (July 12): .@BP_America I wanna kno what #BP is gonna do for my Daughter age 4 if shes sick b/c of your use of #Corexit in
#OilSpill #Toxic #blacktide
Significantly, dispersant-related tweets were much more likely to refer to human health
impacts than tweets that did not mention dispersants (13% to 2%, see Table 4, row 3). This
suggests that while the social media crowd talked about the oil itself as an environmental
disaster, dispersant use brought up more concerns around human health.
Though we identified mental health impacts as a potential theme from existing literature on
oil spill affected communities (Lyons et al. 1999; Palinkas et al. 1993) and through interpretation
of the emotional tone of tweets during preliminary analysis, tweet coding did not show Twitter
users talking explicitly about mental health impacts. In other words, though we perceived that
2 This account name is anonymized to protect the privacy of the Twitter user.
DO NOT CITE OR CIRCULATE WITHOUT PERMISSION Accepted at Human and Ecological Risk Assessment
20
mental health impacts were, for some users, manifesting within their tweets, none of the 500
tweets in our sample referred to them directly.
The Public Grappled with Scientific Complexity and Uncertainty
Analysis of tweets and URLs shows a public grappling with the scientific complexity and
uncertainty that characterized the clean-up efforts after the 2010 Deepwater Horizon oil spill. @oceandog (July 12, 2010): Researcher says Corexit is toxic at only 2.61 PPM and reacts to warming of Gulf. #OilSpill #ecocide
In the above tweet, a local Twitter user attempted to communicate that Corexit’s “low”
toxicity measure of 2.61 was actually problematic. Some members of the public may have had a
hard time understanding that low toxicity numbers are worse than high numbers; the U.S.
Environmental Protection Agency (USEPA) attempted to explain this concept on their website
(USEPA 2013). @Oceandog’s tweet content addressed some of this complexity. There were a
few other tweets that tried to communicate the complexity solely within tweet content, but the
scientific sophistication of the information space was even more evident in the URL content
linked to from within the tweets. The Material Safety Data Sheet (MSDS) for Corexit, a
document that governments require chemical manufacturers to provide to those who handle their
products, appeared several times in the dataset in different forms—e.g., as a PDF, or pasted into
a blog. Other links contained screenshots of information appearing on Corexit barrels and a
product description from a supplier. Four tweets linked to an academic article describing the
toxicity of Corexit dispersants. These source documents, intended for a technical or scientific
audience, became part of the broader discussion on Twitter, shared by local, unaffiliated users as
well as journalists, NGOs, and response accounts.
Tweet data show that, within the complex conversation about dispersant use, social media
users valued the voices of scientists and sought out scientifically sophisticated sources. A
percentage of 6.4% (16) of dispersant-related tweets in the 50-50 Sample reference a scientist
using one of the following terms: scientist, researcher, chemist or biologist. @SaintsFan1 (July 23, 2010): Leading Ocean Scientists Issue Consensus Statement to End Dispersant Use (CNBC) http://bit.ly/ajhfmq #oilspill
#blacktide
DO NOT CITE OR CIRCULATE WITHOUT PERMISSION Accepted at Human and Ecological Risk Assessment
21
@oceansforme (June 8, 2010): Alabama scientist: Dispersant worse than oil on shore - Andalusia Star-News http://bit.ly/d4M0gQ #oilspill
#ocean
The above examples show how users shared tweets citing scientists in reference to the
conversation about dispersant use. Interestingly, only one tweet in the 50-50 Sample that was not
related to dispersants mentioned a scientist.
Examining content linked to within #OilSpill tweets shows an even greater number and
diversity of scientific sources. 99 tweets in the 50-50 Sample (more than one-third of tweets with
a URL) link to sources where scientists are mentioned. Another 13 tweets link to sources with an
academic or research affiliation. Dispersant-related tweets were significantly more likely to link
to content citing scientists—69 dispersant-related tweets (46%) vs. 30 non-dispersant tweets
(22%). Cited scientists came from a variety of fields, including ocean and marine scientists,
toxicologists, biologists, environmental scientists, chemists, geologists, and engineers.
Interestingly, tweeted links reflected how scientists from different fields had different views
on dispersant use. In a press release from Nalco, the company that manufactured the Corexit
brand of dispersants, a civil engineer claimed dispersants reduce environmental impacts of the
oil; while within a TED Talk, a marine toxicologist stated that the combination of dispersants
and oil is more toxic to marine life than oil alone: @Nalco_News: Do you know what the experts are saying about COREXIT? Find out here: http://bit.ly/9WyQ7R #oilspill
@missionblue: Today on #TED: Toxicologist Susan Shaw shows how dispersant is making #oilspill damage even worse http://bit.ly/bfgDs2
Some social media users demonstrated awareness of these conflicting views and the
scientific uncertainty surrounding oil spill clean-up: @CarmenSisson (July 13, 2010): Nearly 1 million barrels of dispersants have been poured into the Gulf, but scientists can’t agree on safety.
http://bit.ly/d4PGdV #OilSpill
Taken as a whole, this sample of tweets communicates many conflicting views on safety and
efficacy of dispersant use. It also reveals the presence of some alternative views about how
dispersants were being applied and about the possibility for negative health impacts. For
example, the following tweet is one of about 30 in the Total #OilSpill Collection that mention a
possibility for toxic rain related to dispersant use:
DO NOT CITE OR CIRCULATE WITHOUT PERMISSION Accepted at Human and Ecological Risk Assessment
22
@Anonymized4 (June 26, 2010): Could #BP dispersant be coming down in the form of rain killing animals and crops #oilspill #NOAA #gulf
#wildlife http://fb.me/BMnOzpUm
The Public Wanted to Participate
As Thad Allen, retired Coast Guard Commandant and the National Incident Commander
during the response to the 2010 Deepwater Horizon oil spill, said while reflecting on the spill,
“There’s never going to be a major event in this country again without public participation”
(Allen 2011). Sociologists of disaster might argue that public participation has always been a
feature of major crisis events (Fritz and Mathewson 1957; Dynes 1970; Tierney et al. 2001).
However, new technologies are certainly increasing the visibility of public participation and
perhaps changing the nature of participation as well. Recent research shows people appropriating
social media technologies to both volunteer individually and to improvise collective action after
disaster events (Vieweg et al. 2008; Qu et al. 2009; Starbird and Palen 2011).
The #OilSpill tweets reveal a public that was both suffering from an impending (and
seemingly unavoidable) disaster, and eager to participate somehow in responding to it. Though
some Twitter users communicated intent to help directly with the clean-up efforts, as least one
remarked that she was unable to find a role in official response activities. Instead, they turned to
other forms of participation, including information-sharing, activism, and first-hand reporting
from the impacted areas.
It is possible to view the intense information-sharing activities, the work to make sense out
of a complex information space, as a form of collective action. Some Twitter users, including a
handful of locals, contributed thousands of tweets through which they helped to curate the larger
information space. Considering activity across the breadth of the crowd, #OilSpill participants
worked to resolve some of the uncertainty of the event by assembling different pieces of
information and calling on a range of sources, very often ones with scientific credentials.
Many locals also contributed by posting first-hand reports of oil impacts to Twitter, often
including photos along with a textual description: @SaintsFan1 (May 21, 2010): Baseball-sized tarballs on beach in Waveland, Miss. #OilSpill http://twitpic.com/1ptpna
@OceanDog (July 1, 2010): Oiled brown pelican-La. #oilspill http://twitpic.com/21hs3i
DO NOT CITE OR CIRCULATE WITHOUT PERMISSION Accepted at Human and Ecological Risk Assessment
23
@NolaAnn (July 1, 2010: Ft. Morgan, Gulf Shores & Mobile Bay, AL-no oil, no orange goo, no smell. Lots of birds at mouth of the bay. Pelis
2. SEEMS ok. #oilspill
@CarmenSisson (July 13, 2010): Spent the evening exploring Biloxi to Waveland. Lots of BP workers on the beach at 9 p.m. using work lamps
in Long Beach. #oilspill #response
The users whose tweets are featured above, all of whom lived near the coast in areas that
were either directly affected or under threat of oil spill impacts, spent time touring coastal areas
taking pictures of oil on the shore, oiled wildlife and response efforts. @SaintsFan1 spent several
evenings walking her local beaches and tweeting what she saw. On several occasions,
@OceanDog would drive from beach to beach, taking photos and noting observations, and then
later tweet out what he had seen. This activity likely reflects multiple motivations: to participate
actively in the event as a witness; to raise awareness of their situation; and to credential
themselves as locals, people who were actually there.
Twitter users also turned to activism—i.e., venting anger and endeavoring to affect change
in regards to current response efforts and future policies: @cleanthegulfnow (May 31, 2010): We must create a unified message and send it in unison. BAN COREXIT! Use better options:
http://bit.ly/9MBwVu @epagov @barackobama #oilspill
This activity often focused on communicating outrage at the spill, its causes, its impacts, and
what many saw as incompetence or corruption within the clean-up efforts. For many remote
participants, activism was their primary method of participation, but locals also participated in
this way. Many event-specific accounts seemed to be largely focused around activism.
Locals Used Twitter to Interact with Responders
As mentioned above, Unified Command’s @Oil_Spill_2010 account was central account in
the #OilSpill conversation network. That account was retweeted 1,390 times, received 268
“mentions” (where other users publicly mentioned them in tweets), and 60 “replies” (where other
users directed public tweets to them).
Several Twitter users utilized the mention and reply conventions to attempt to communicate
directly with the @Oil_Spill_2010 account, both to ask questions and to voice concern and anger
with response efforts. @Oil_Spill_2010 sent 31 reply tweets to various other Twitter users,
DO NOT CITE OR CIRCULATE WITHOUT PERMISSION Accepted at Human and Ecological Risk Assessment
24
showing some level of interaction between that account and the public. The excerpt below shows
an interaction between one local Twitter user and that Unified Command account: @SaintsFan1 (June 10 2010, 1:40am) @Oil_Spill_2010 Admiral STOP SPRAYING DISPERSANTS NOW IN POP AREAS. SEARCH & CLEAR AREA FIRST!!!
THIS IS AMERICA!! #OILSPILL
@Oil_Spill_2010 (June 10 2010, 5:28pm): @SaintsFan1 Dispersants are only used in and over H2O. EPA has a 24/7 hotline for concerns 1-888-
623-0287. #OilSpill
@SaintsFan1 (June 10 2010, 5:34pm): @Oil_Spill_2010 thank you for your response. What about workers on boats. Are they warned before aerial
sprays r conducted? #OilSpill
@Oil_Spill_2010 (June 10, 2010, 6:57pm): @SaintsFan1 No dispersants are released within three miles of any boats #OilSpill
In this exchange, @SaintsFan1 initially sent an all-caps tweet—suggestive of yelling in
online communication—to the @Oil_Spill_2010 account, implying that Unified Command
forces were spraying dispersants over populated areas and directing Admiral Thad Allen to stop
this practice.
Though @Oil_Spill_2010 did not always respond to similar tweets, in this case the account
did answer, refuting the claim and offering a phone number where @SaintsFan1 can get more
information. On the surface, this seems like a good response, and indeed @SaintsFan1 is
noticeably less confrontational in the following tweet. However, the timing of
@Oil_Spill_2010’s reply, nearly 16 hours after the original tweet, demonstrates an inability for
that account’s operator to keep up with the real-time pace that many social media users have
come to expect, a noted problem for response organizations trying to incorporate social media
(Hughes and Palen 2012).
Over the next few weeks, perhaps encouraged by the initial interaction, @SaintsFan1
continued to try to interact with the @Oil_Spill_2010 account, but rarely received any response.
Then, a few weeks after their first exchange, on June 27, @SaintsFan1 was in the New Orleans
area and complained about air quality. @SaintsFan1 (June 27, 2010, 6:54pm): L.A. has smog alerts. There R definitely VOCs in the air in N.O. My eyes and nose are burning. Why
no Air Quality alerts here? #oilspill
DO NOT CITE OR CIRCULATE WITHOUT PERMISSION Accepted at Human and Ecological Risk Assessment
25
This tweet did receive a response from @Oil_Spill_2010, but the account operator failed to
recognize, possibly due to lost context in the tweet propagation, that @SaintsFan1 was actually
reporting information from the area. The @Oil_Spill_2010 account made this claim: @Oil_Spill_2010 (June 27, 2010, 7:41pm): @SaintFan @barbiesnow We’re in NoLa and have not received any reports. Stand by as we continue to
investigate your questions. #oilspill
It is possible that @SaintsFan1 never saw the reply, as her account name was misspelled in
the reply and @Oil_Spill_2010 did not follow up on this exchange. Or she may have been turned
off by the fact that her concern was not registered. In either case, her account showed a growing
distrust. Hours later, @SaintsFan1 speculated that the lack of information may be intentional: @SaintsFan1 (June 27, 2010, 11:11pm): Captured ALL of the NOAA NWS surface smoke data over SELA that now comes up empty. Was it scrubbed?
Who knows? Nite all. #oilspill
Over the next week or so, the tone of @SaintsFan1’s tweets shifted back to frustration, and
she seemed to take issue with the management of the @Oil_Spill_2010 account: @SaintsFan1 (July 6, 2010, 1:32pm): @Oil_Spill_2010 Who manages this twitter account? PIER Communications, USCG or Ogilvy? Please clarify
for the public. Thanks. #oilspill
This analysis shows a negative effect of social media engagement when interactions go
awry. Though their initial interaction with @SaintsFan1 was quite effective, they were unable to
maintain rapport over time, and in this case, the Unified Command’s social media operators
missed an opportunity to establish trust with a local individual who had significant influence on
the larger discourse.
DISCUSSION AND CONCLUSION
This multi-method, in-depth analysis of Twitter data collected during the 2010 BP
Deepwater Horizon oil spill offers a variety of findings about how the online crowd
communicated during a major environmental crisis. Analysis of tweet themes shows a broad
interest in response efforts and the strategies that responders were employing, including the use
of dispersants. Interestingly, dispersant-related tweets were much more likely to refer to health
impacts than tweets across the larger #OilSpill conversation. Network analysis reveals that the
Twitter conversation surrounding this event was shaped by a diverse group of influencers,
DO NOT CITE OR CIRCULATE WITHOUT PERMISSION Accepted at Human and Ecological Risk Assessment
26
including NGOs, locals, media, and event-specific accounts. Importantly, network features
change when focus shifts from the larger crowd to other subsets, including users who were more
engaged with the conversation and those who were local to the event. We identify and describe
how locals participated in the conversation, interacting with response accounts, asking questions,
using Twitter to voice their concerns and, in many cases, their anger.
This research offers some lessons for emergency responders. An analysis of tweets sent by
the Unified Command (OilSpill_2010) account shows those account operators interacting with
Twitter users, answering questions, and addressing rumors. However, social media missteps are
also uncovered, including inconsistencies in tone and response time. These errors are
understandable from an operations standpoint, but they may have damages that account’s
reputation among locals. This analysis aligns with existing research that suggests a misalignment
between traditional work practices among oil spill responders and new norms and expectations
of interaction on social media (Hughes and Palen 2012).
These findings underscore the importance of positioning the public as participatory. The
social media record shows that people—including both local and remote actors—wanted to
contribute to response efforts, and that they used these platforms to report first-hand observations
from the impacted areas; to curate the information space by passing along information they felt
was important; and to organize and participate in activism (Pavia et al., 2015).
The oil spill was a major environmental disaster in the U.S., characterized by high levels of
uncertainty and scientific complexity, and social media users were surrounded by a dense and
complex information space. The #OilSpill tweets show members of the public working to make
sense of this technically sophisticated space, actively seeking out scientific sources and clearly
valuing the voices of scientists. These finding may reflect changing dynamics as people become
more active information seekers in an information-rich online environment.
Social media platforms are clearly changing the ways in which people communicate during
crisis events. Emergency responders are beginning to understand that they cannot ignore these
new channels, even as they recognize that their current modes of operation are not necessarily
compatible with emerging norms and expectations of online participation. Hopefully, this
research will help them better understand how to work with their connected publics during
response efforts.
DO NOT CITE OR CIRCULATE WITHOUT PERMISSION Accepted at Human and Ecological Risk Assessment
27
ACKNOWLEDGMENTS
Special thanks to workshop invitees Jeannette Sutton and Emma Spiro for their feedback on
an early draft of this work. We would also like to thank Sean Mitchell for his help with the
qualitative coding of the Twitter data and Project EPIC at the University of Colorado for
granting us permission to use these data, collected during the first author’s graduate studies there.
Funding for this project was provided by the University of New Hampshire’s Coastal Response
Research Center (NOAA Grant Number: NA07NOS4630143. Contract: 13-003).
KEY ABBREVIATIONS
CDC - Centers for Disease Control and Prevention
DPSIR Framework - Drivers-Pressures-State-Impact-Response Framework
EM - Emergency Manager
IBRRC - International Bird Rescue Research Center
JIC - Joint Information Center
NGO - Non-Governmental Organization
NOAA - National Oceanic and Atmospheric Administration
PIO - Public Information Officer
NWF - National Wildlife Federation
REFERENCES Allen T. 2011. Getzen Lecture on Government Accountability. Lecture given April 26, 2011 at the University of
Georgia’s School of Public and International Affairs. Atlanta, GA, USA
Blondel V, Guillaume J, Lambiotte R, et al. 2008. Fast unfolding of communities in large networks. J Stat Mech:
Theory Exp 2008:P10008
boyd d and Crawford K. 2012. Critical questions for big data: Provocations for a cultural, technological, and
scholarly phenomenon. Information, Communication Soc 15(5):662-79
Bruns A, Burgess JE, Crawford K et al. 2012. #qldfloods and @QPSMedia: Crisis Communication on Twitter in the
2011 South East Queensland Floods. White Paper. ARC Centre of Excellence for Creative Industries &
Innovation (CCI), Brisbane, Australia
Costolo D. 2010. Meaningful growth. Twitter Blog. Available at: https://blog.twitter.com/2010/meaningful-growth
Dynes RR. 1970. Organized Behavior in Disaster. Heath Lexington Books, Lexington, MA, USA
Fritz CE and Mathewson JH. 1957. Convergence Behavior in Disasters: A Problem in Social Control. National
Academy of Sciences, Washington, DC, USA

DO NOT CITE OR CIRCULATE WITHOUT PERMISSION Accepted at Human and Ecological Risk Assessment
28
Gillmor D. 2004. We the media: The rise of citizen journalists. National Civic Review, Fall 2004:58-63
Goolsby R. 2010. Social media as crisis platform: The future of community maps/crisis maps. ACM Transactions on
Intelligent Systems and Technology (TIST), 1(1):Article 7
Graham B. Reilly W, K Beinecke, et al. 2011. Deep Water: The Gulf Oil Disaster and the Future of Offshore
Drilling. Report to the President [of the USA] by the National Commission on the BP Deepwater Horizon Oil
Spill and Offshore Drilling, Washington. DC, USA
HHI (Harvard Humanitarian Initiative). 2011. Disaster Relief 2.0: The Future of Information Sharing in
Humanitarian Emergencies. Washington, DC, USA and Berkshire, UK: UN Foundation & Vodafone Foundation
Technology Partnership
Heverin T and Zach L. 2012. Use of microblogging for collective sense-making during violent crises: A study of
three campus shootings. J Amer Soc Info Sci Tech, 63(1):34-47
Hughes A, Palen L, Sutton JN, et al. 2008. “Site-seeing” in disaster: An examination of on-line social
convergence. Proceedings of the 2008 Information Systems for Crisis Response and Management Conference,
ISCRAM 2008. Washington, DC, USA
Hughes AL and Palen L. 2009. Twitter adoption and use in mass convergence and emergency events. Internat J
Emer Manage 6(3):248-60
Hughes AL and Palen L. 2012. The evolving role of the public information officer: An examination of social media
in emergency Management. J Homeland Security Emer Manage 9(1):Article 22
Kwak H, Lee C, Park H et al. 2010. What is Twitter, a social network or a news media? Proceedings of Intl. WWW
Conference, 2010, pp. 591-600. New York, ACM, 2010
Latonero M and Shklovski I. 2011. Emergency management, Twitter, and social media evangelism. Int J
Information System Crisis Response Manage. 3(4):1-16
Liu SB and Palen L. 2010. The new cartographers: Crisis map mashups and the emergence of neogeographic
practice. Cartography Geographic Informat Sci 37(1):69-90
Liu SB, Palen L, Sutton JN, et al. 2008. In search of the bigger picture: The emergent role of on-line photo-sharing
in times of disaster. Proceedings of the 2008 Information Systems for Crisis Response and Management
Conference, ISCRAM 2008. Washington, DC, USA
Lyons RA, Temple JM, Evans D, et al. 1999. Acute health effects of the Sea Empress oil spill. J Epidemiol
Community Hlth 53(5):306-10
Merchant RM, Elmer S, and Lurie N. 2011. Integrating social media into emergency-preparedness efforts. New Eng
J Med 365(4):289-91
Ngak C. 2012. Social media a news source a tool during Superstorm Sandy. CBS News. Available at:
http://www.cbsnews.com/news/social-media-a-news-source-and-tool-during-superstorm-sandy/
Palen L, Anderson KM, Mark G, et al. 2010. A vision for technology-mediated support for public participation &
assistance in mass emergencies & disasters. Proceedings of the 2010 ACM-BCS Visions of Computer Science
Conference, pp 1-12. British Computer Society, Edinburgh, UK
Palinkas LA, Petterson JS, Russell J et al. 1993. Community patterns of psychiatric disorders after the Exxon Valdez
DO NOT CITE OR CIRCULATE WITHOUT PERMISSION Accepted at Human and Ecological Risk Assessment
29
oil spill. Amer J Psychiatry 150(10):1517-23
Pew. 2010a. Gulf disaster continues to dominate coverage, interest news media trusted for information on oil leak.
June 9, 2010. Pew Research Center for People and the Press. Available at: http://www.people-
press.org/2010/06/09/news-media-trusted-for-information-on-oil-leak/
Pew. 2010b. 100 Days of Gushing Oil: Media Analysis and Quiz. August 25, 2010. Pew Research Center’s Project
for Excellence in Journalism. Available at: http://www.journalism.org/analysis_report/100_days_gushing_oil
Qu Y, Wu PF and Wang X. 2009. Online community response to major disaster: A study of Tianya Forum in the
2008 Sichuan Earthquake. Proceedings of the 42nd Hawaii International Conference on System Sciences
(HICSS '09), pp 1-11. Manoa, HI, USA. Jan 5-8
Qu Y, Huang C, Zhang P, et al. 2011. Microblogging after a major disaster in China: A case study of the 2010
Yushu Earthquake, Proceedings of the ACM 2011 Conference on Computer Supported Cooperative Work,
(CSCW 2011). pp. 25-34. Hangzhou, China. March 19-23
Rao L. 2010. Twitter seeing 90 million tweets per day, 25 percent contain links. TechCrunch, (September 14, 2010).
Available at: http://techcrunch.com/2010/09/14/twitter-seeing-90-million-tweets-per-day/
Robertson C and Krauss C. 2010. Gulf spill is the largest of its kind, scientists say. New York Times, August 2, 2010.
Available at: http://www.nytimes.com/2010/08/03/us/03spill.html?_r=2&fta=y&
Shklovski I, Palen L, and Sutton JN. 2008. Finding community through information and communication technology
in disaster events. Proceedings of the ACM 2008 Conference on Computer Supported Cooperative Work
(CSCW 2008), pp 127-36. San Diego, CA, USA. Nov 8-12
Smeets E and Weterings R. 1999. Environmental Indicators: Typology and Overview. European Environment
Agency, Copenhagen, Denmark
Spiro ES, Fitzhugh S, Sutton JN, et al. 2012. Rumoring during extreme events: A case study of deepwater horizon
2010. Proceedings of the 3rd Annual ACM Web Science Conference, pp. 275-83. Evanston, IL, USA. June 22-
24
Starbird K and Palen L. 2010. Pass it on? Retweeting in mass emergencies. Proceedings of the International
Conference on Information Systems for Crisis Response & Management Conference, ISCRAM 2010, Seattle
WA, USA. May 2-5
Starbird K and Palen L. 2011. ‘Voluntweeters’: Self-organizing by digital volunteers in times of crisis, Proceedings
of the 2011 ACM Conference on Human Factors in Computing Systems, pp. 1071-80. Vancouver, BC. May 7-
12
Starbird K, Palen L, Hughes AL, et al. 2010. Chatter on The Red: What hazards threat reveals about the social life
of microblogged information. Proceedings of the ACM 2010 Conference on Computer Supported Cooperative
Work, pp. 241-50. Savannah, GA, USA. February 6-10
Starbird K, Maddock J, Orand M, et al. 2014. Rumors, false flags, and digital vigilantes: Misinformation on Twitter
after the 2013 Boston Marathon Bombings. Proceedings of iConference 2014. Berlin, Germany. March 4-7
Suh B, Hong L, Pirolli P, et al. 2010. Want to be retweeted? Large scale analytics on factors impacting retweet in
Twitter network. In IEEE Intl Conference on Social Computing, pp 177-84. Minneapolis, MN, USA. Aug 20-22
DO NOT CITE OR CIRCULATE WITHOUT PERMISSION Accepted at Human and Ecological Risk Assessment
30
Sutton, JN. 2010. Twittering Tennessee: Distributed networks and collaboration following a technological disaster.
Proceedings of the International Conference on Information Systems for Crisis Response & Management
Conference, ISCRAM 2010, Seattle WA, USA. May 2-5
Sutton JN. 2013. Tweeting the spill: Online informal communications, social networks, and conversational
microstructures during the Deepwater Horizon Oilspill. Int J Info Systems for Crisis Response and Management
(IJISCRAM) 5(1):58-76
Sutton JN, Palen L and Shklovski I. 2008. Backchannels on the front lines: Emergent use of social media in the 2007
Southern California Wildfires. Proceedings of the 2008 Information Systems for Crisis Response and
Management Conference, ISCRAM 2008. Washington, DC, USA
Tierney K, Lindell M, and Perry RW. 2001. Facing the Unexpected: Disaster Preparedness and Response in the
United States. John Henry Press, Washington, DC, USA
USEPA (U.S. Environmental Protection Agency). 2013. Questions and Answers on Dispersants. Available at:
http://www.epa.gov/bpspill/dispersants-qanda.html
Yeomans M. 2012. Social media’s crucial role in disaster relief efforts. Guardian Professional. Available at:
http://www.theguardian.com/sustainable-business/social-media-hurricane-sandy-emergency-planners
Vieweg S, Palen L, Liu SB, et al. 2008. Collective intelligence in disaster: An examination of the phenomenon in
the aftermath of the 2007 Virginia Tech Shootings. Proceedings of the 2008 Information Systems for Crisis
Response and Management Conference, ISCRAM 2008. Washington, DC, USA
Vieweg S, Hughes A, Starbird K and Palen L. 2010. Micro-blogging during two natural hazards events: What
Twitter may contribute to situational awareness, Proceedings of the 2010 ACM Conference on Human Factors in
Computing System, pp. 1079-88. Atlanta, GA, USA. April 10-15
Winter A. 2010. Gulf Oil Spill creates ‘giant experiment’ in marine toxicology. New York Times: Energy &
Environment. (May 21, 2010). Available at: http://www.nytimes.com/gwire/2010/05/21/21greenwire-gulf-oil-
spill-creates-giant-experiment-in-mari-1284.html
Zook M, Graham M, Shelton T, et al. 2010. Volunteered geographic information and crowdsourcing disaster relief:
A case study of the Haitian earthquake. World Medical Health Policy 2(2):7-33
DO NOT CITE OR CIRCULATE WITHOUT PERMISSION Accepted at Human and Ecological Risk Assessment
31
Table 1. Descriptions of the two datasets.
Dataset # of Tweets # of Distinct Twitter users
# of Dispersant-Related Tweets
Total #OilSpill Collection 693,409 132,075 11,146
50-50 Random-Dispersant Sample
500 387 254*
*Consistent with the relative percentages in the Total #OilSpill Tweet Collection, 4 of the 250 tweets that were randomly selected from it also contained dispersant-related terms.
Table 2. Retweet and URL counts. Tweets # Tweets # RTs # Replies # with URL
Total #OilSpill Tweet Collection
693,409 302,759 44%
34,102 4.9%
478,547 69%
Dispersant-Related Tweets 11,146 5,907 53%
556 5.0%
8,317 75%
Table 3. Top 10 most-retweeted in Total #OilSpill Collection.
Twitter User # of RTs
Affiliation Type Description
1 NWF 7677 NGO National Wildlife Federation 2 IBRRC 7327 NGO International Bird Rescue 3 SaintsFan1 5261 Individual Local individual 4 Oil_Spill_2010 4738 Government Account of Unified Command 5 GulfOilCleanup 4538 Informal Group, Media Informal group of collaborating media
partners for oil spill relief 6 Alyssa_Milano 3507 Actress, Celebrity Early adopter of Twitter, celebrity 7 MacMcClelland 3474 Journalist Mother Jones journalist in NOLA 8 sami_shamieh 3259 Political Commenter Remote individual 9 TheOilDrum 3225 NGO Online news about energy 10 Jason_Pollock 3093 Celebrity Filmmaker, writer, activist
DO NOT CITE OR CIRCULATE WITHOUT PERMISSION Accepted at Human and Ecological Risk Assessment
32
Table 4. Distribution of tweets across identified themes.
Theme
Dispersant-Related
Not Dispersant-Related
Response: Clean Up Strategy, Including Efficacy of Dispersants 188 76% 21 9% Impact: Environmental Impact 36 15% 35 15% Impact: Health Impact 32 13% 4 2% State: Clean Up or Spill Status 19 8% 43 18% Response: Who is in charge? 15 6% 5 2% Response: Call to Action 11 4% 25 10% Impact: General/Other Impact 10 4% 18 8% Response: Communications/Cover Up 9 4% 24 10% Response: Monitoring 9 4% 4 2% Response: Responsibility/Liability 8 3% 29 12% Response: Community Response 6 2% 14 6% Response: Environmental Policy 6 2% 5 2% Pressure: Corruption 4 2% 7 3% Impact: Political Impact 4 2% 18 8% Pressure: Environmental/ Commercial Policy 3 1% 24 10% Response: General/Other 3 1% 8 3% Other 2 1% 19 8% Unknown, Unclear or Off topic 2 1% 19 8% Response: Recovery-Assistance 1 <1% 3 1% Response: Wildlife Response 1 <1% 8 3% Impact: Economic Impact 0 0 2 1% Impact: Mental Health Impact 0 0 0 0 Response: Evacuation/Safety Regulation 0 0 3 1%
DO NOT CITE OR CIRCULATE WITHOUT PERMISSION Accepted at Human and Ecological Risk Assessment
33
Figure 1. Tweet volume over time. [Black represents volume of #OilSpill tweets per day. Grey (small volume at the bottom) shows the volume for dispersant-related tweets.]
DO NOT CITE OR CIRCULATE WITHOUT PERMISSION Accepted at Human and Ecological Risk Assessment
34
Figure 2. Tweet volume per Twitter user Total #OilSpill Tweet Collection
DO NOT CITE OR CIRCULATE WITHOUT PERMISSION Accepted at Human and Ecological Risk Assessment
35
Figure 3. Volume of dispersant-related tweets over time.
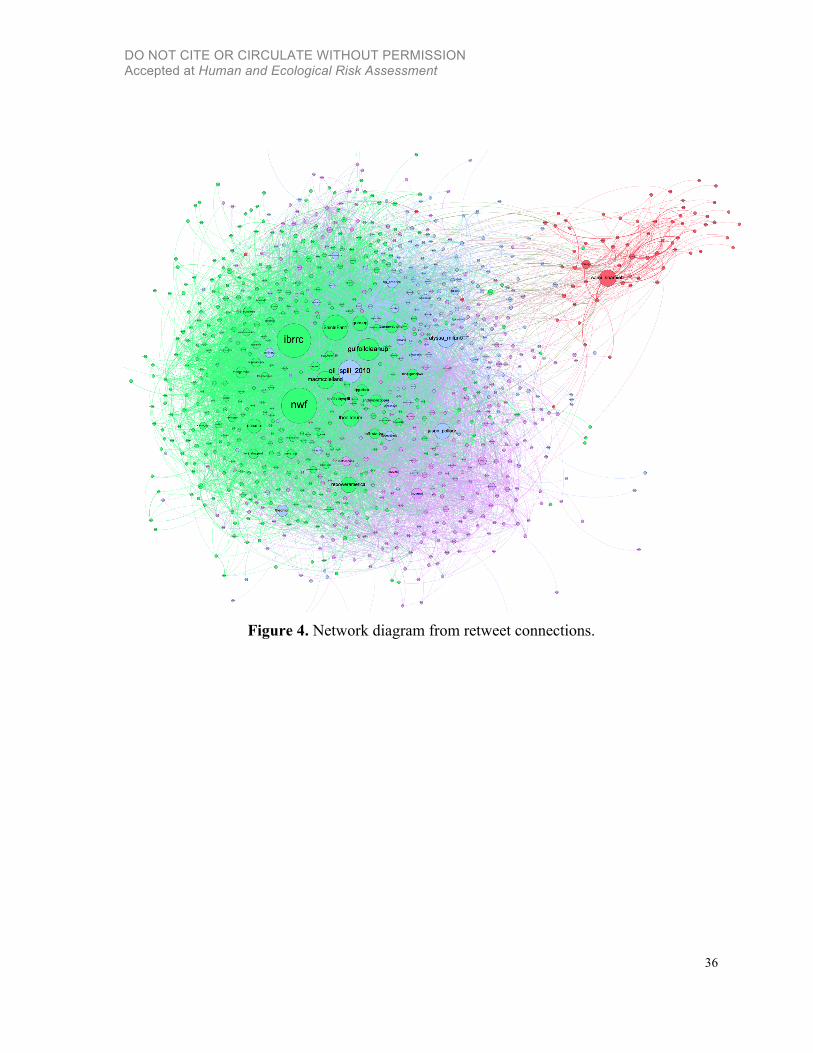
DO NOT CITE OR CIRCULATE WITHOUT PERMISSION Accepted at Human and Ecological Risk Assessment
36
Figure 4. Network diagram from retweet connections.