Embed Size (px)
Citation preview
Social Media as Social Science Data
Steven L. Wilson
V-Dem Institute, University of Gothenburg
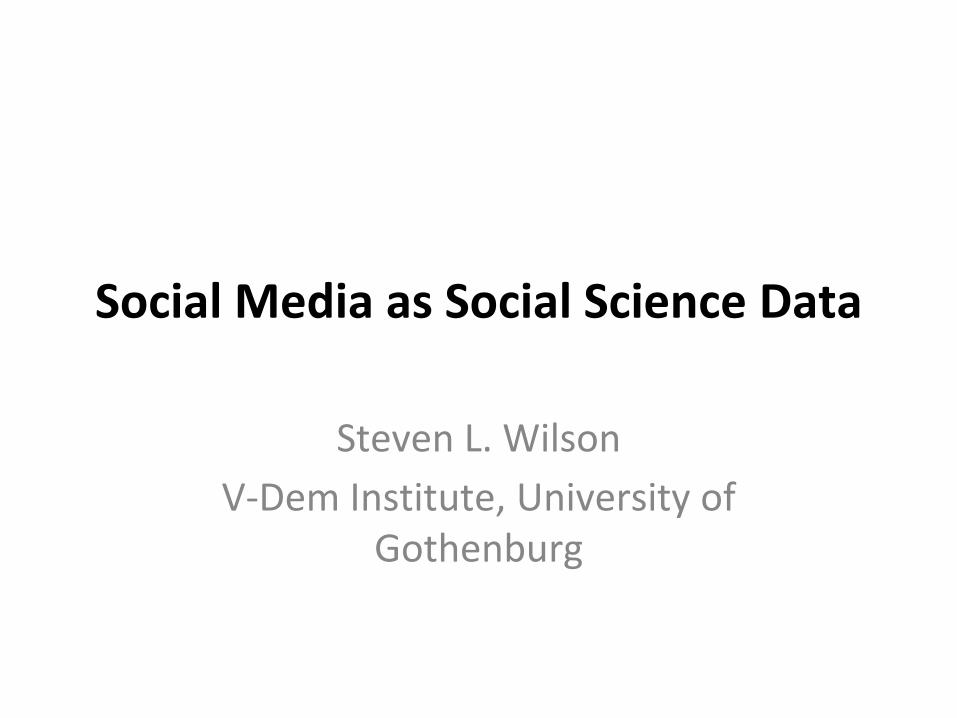
From Tiananmen to Tahrir
2
Social Media as Social Science Data
• Theory
• My data collection project
• Sample projects
• Case study
Social Media as Social Science Data
Approach 1: social media as a causal variable in and of itself:
• Effect of social media on authoritarian regimes (Mazaid et al 2011, Tufeki and Wilson 2012, Farrell 2012, Tucker 2013)
• Effect of social media on mobilization/protest (Wilson 2016)
Social Media as Social Science Data
Approach 2: social media as a tool to measure something else:
• Detect effect of natural disasters (Sakashi, et al. 2010; Vieweget al. 2010)
• Information diffusion through population (Lerman and Ghosh 2010, Romero et al 2011, Jansen et al 2009)
• Measure real-time effect of debates on voters (Diakopoulosand Shamma 2010)
Social Media as Social Science Data
Idealist claim: everything we want to know about public opinion is available via social media.
Limitation: that information is inaccessible because we don’t know what the denominator is.
The Problems
• The Representativeness Problem– Social media users not representative
– Vocal social media users not representative
• The Population Problem– Might not even be in the population in question
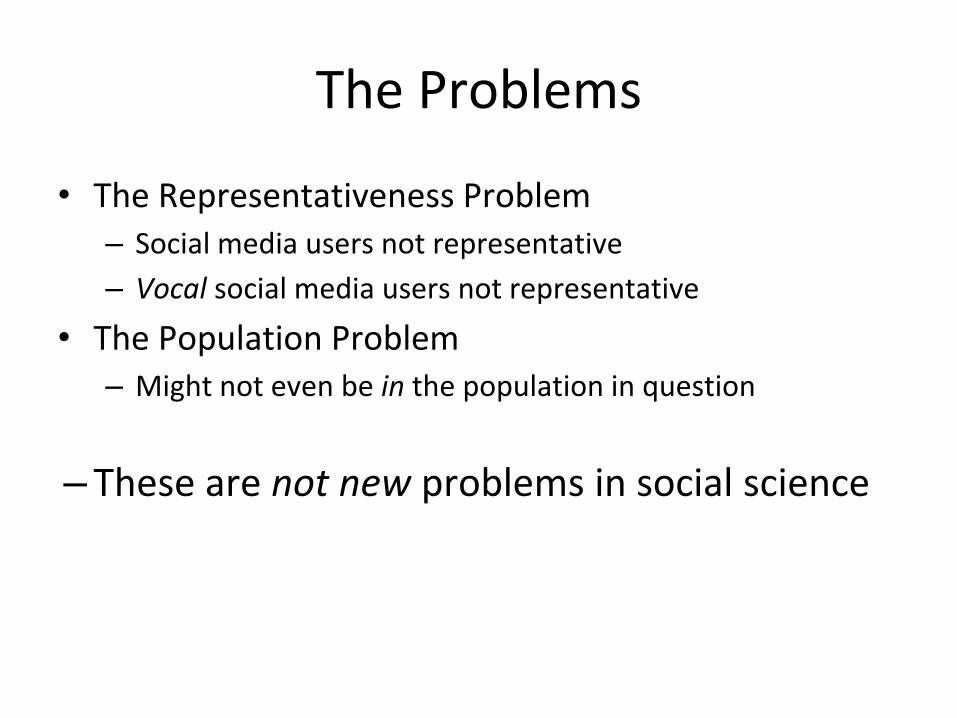
The Problems
• The Representativeness Problem– Social media users not representative
– Vocal social media users not representative
• The Population Problem– Might not even be in the population in question
– These are not new problems in social science
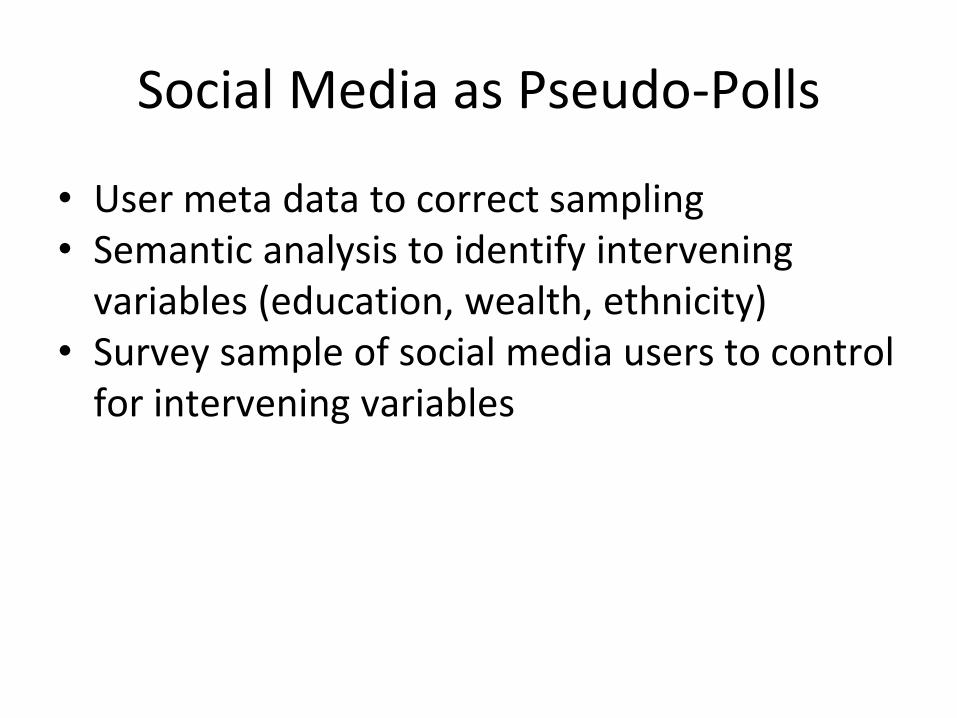
Social Media as Pseudo-Polls
• User meta data to correct sampling• Semantic analysis to identify intervening
variables (education, wealth, ethnicity)• Survey sample of social media users to control
for intervening variables
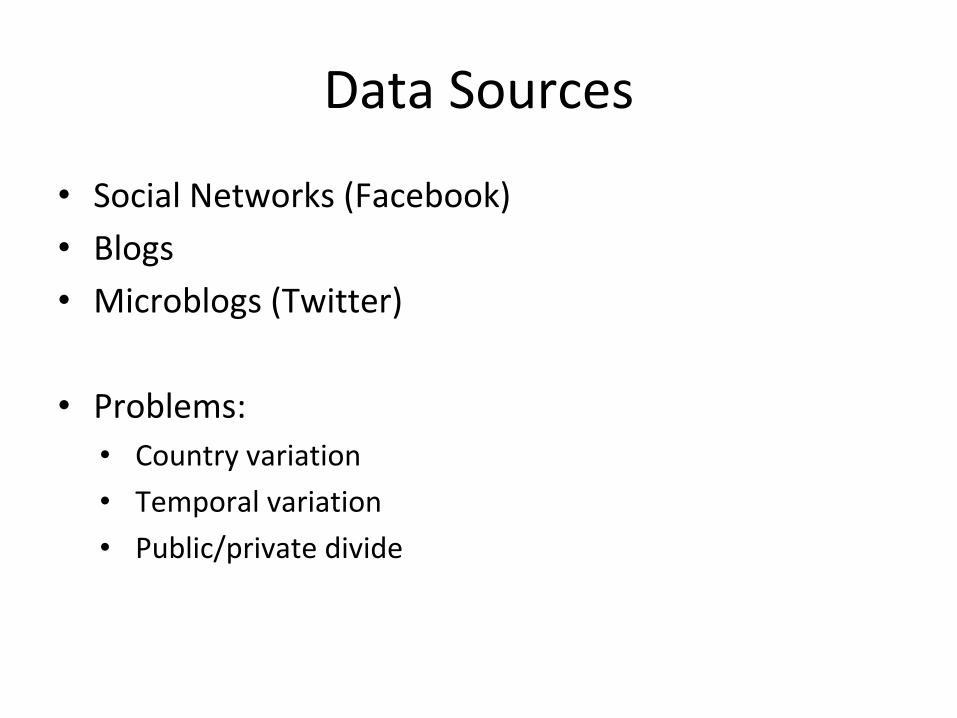
Data Sources
• Social Networks (Facebook)
• Blogs
• Microblogs (Twitter)
• Problems:
• Country variation
• Temporal variation
• Public/private divide
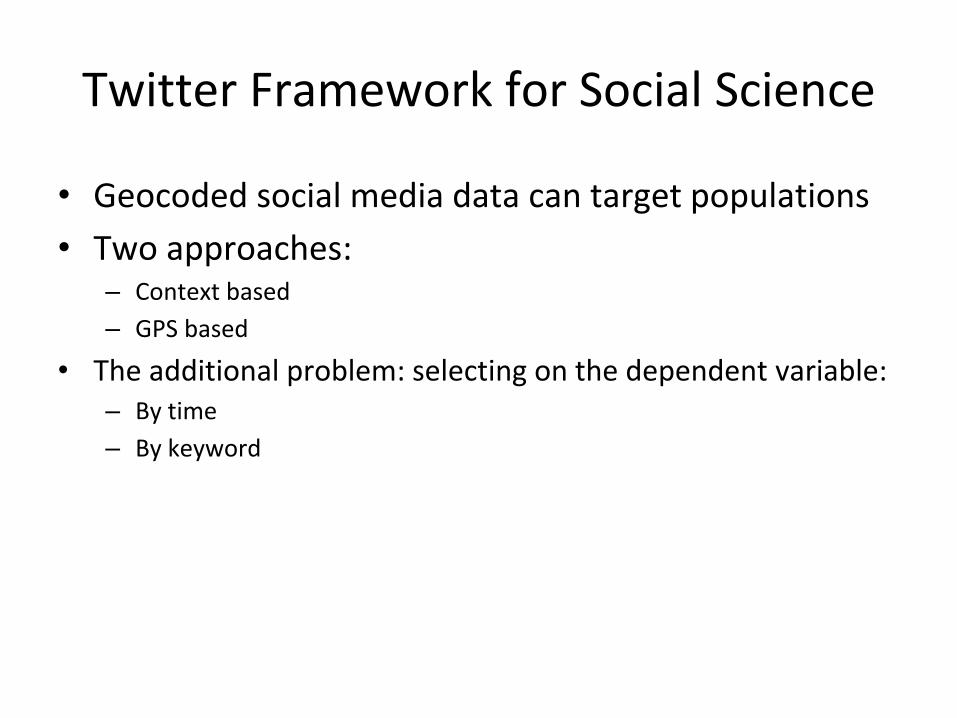
• Geocoded social media data can target populations
• Two approaches:– Context based
– GPS based
• The additional problem: selecting on the dependent variable:– By time
– By keyword
Twitter Framework for Social Science
Twitter Framework for Social Science
• The Data:
– Latitude and longitude
– Full text and keywords
– Metadata: followers, time zone, language
12
Twitter Framework for Social Science
• Every geocoded tweet (3 billion):
– E. Europe, Asia, Africa (since Jan 2012)
– Latin America (since Dec 2014)
• Keyword collection on demand:
– Worldwide
– Real time sub-national categorization
13
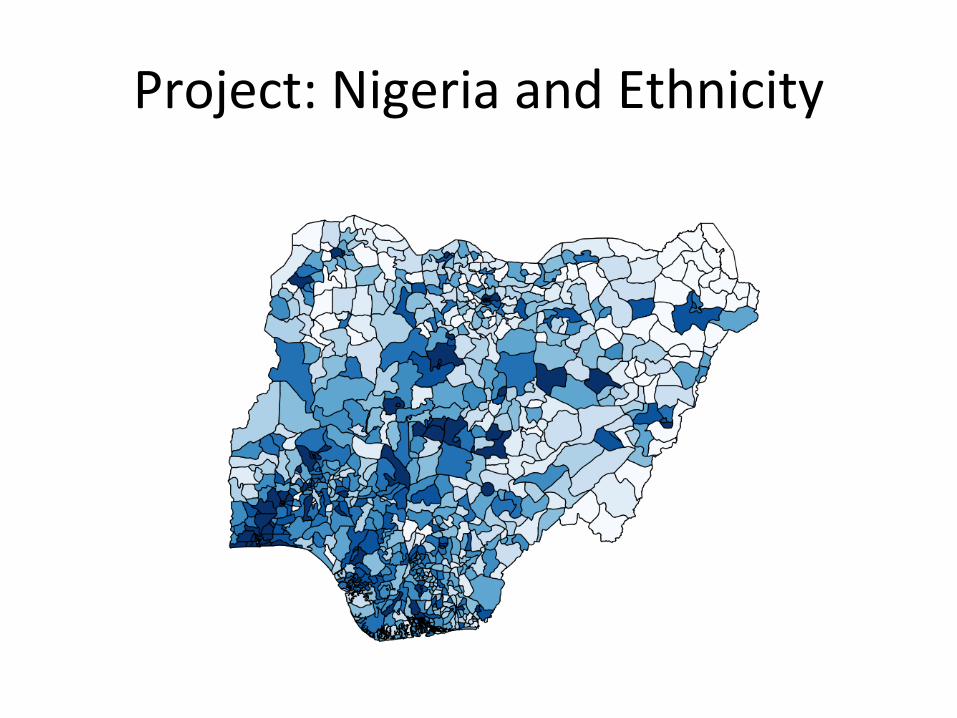
Project: Nigeria and Ethnicity
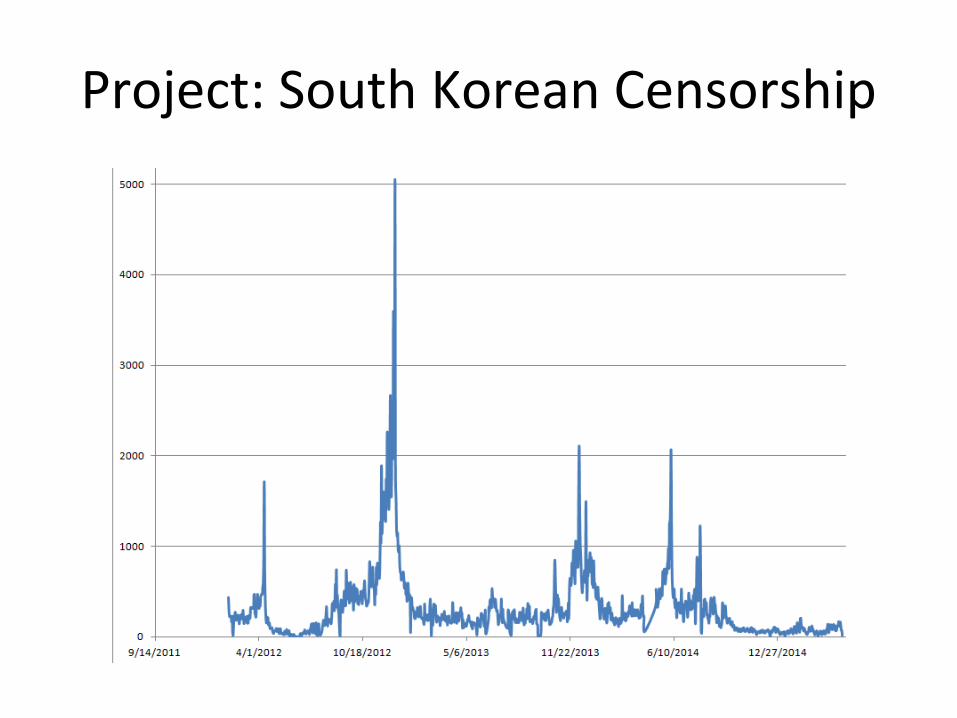
Project: South Korean Censorship
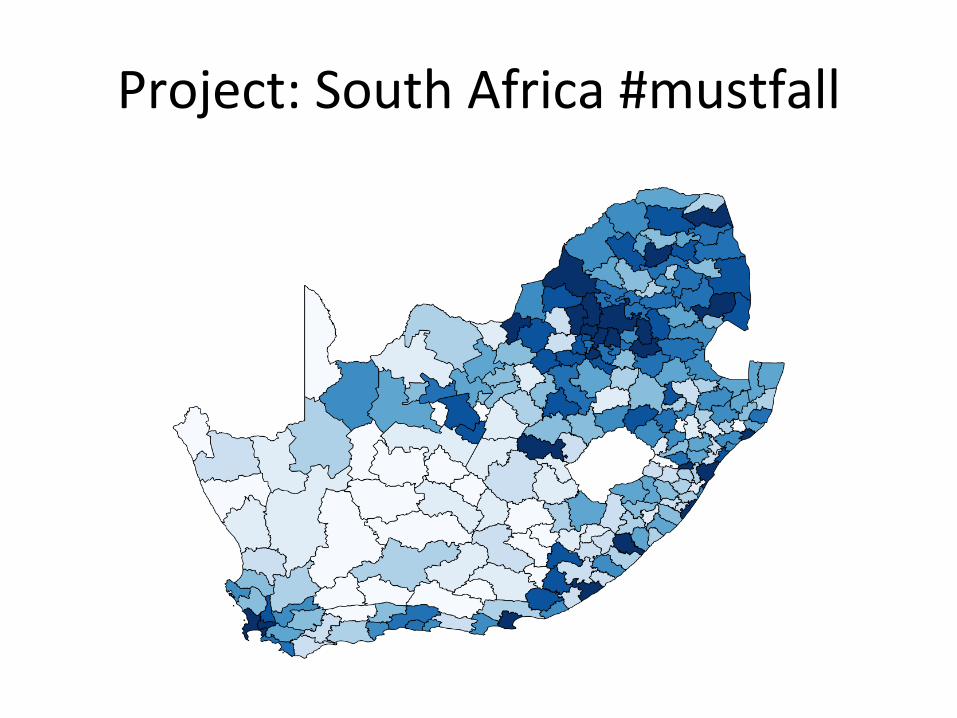
Project: South Africa #mustfall
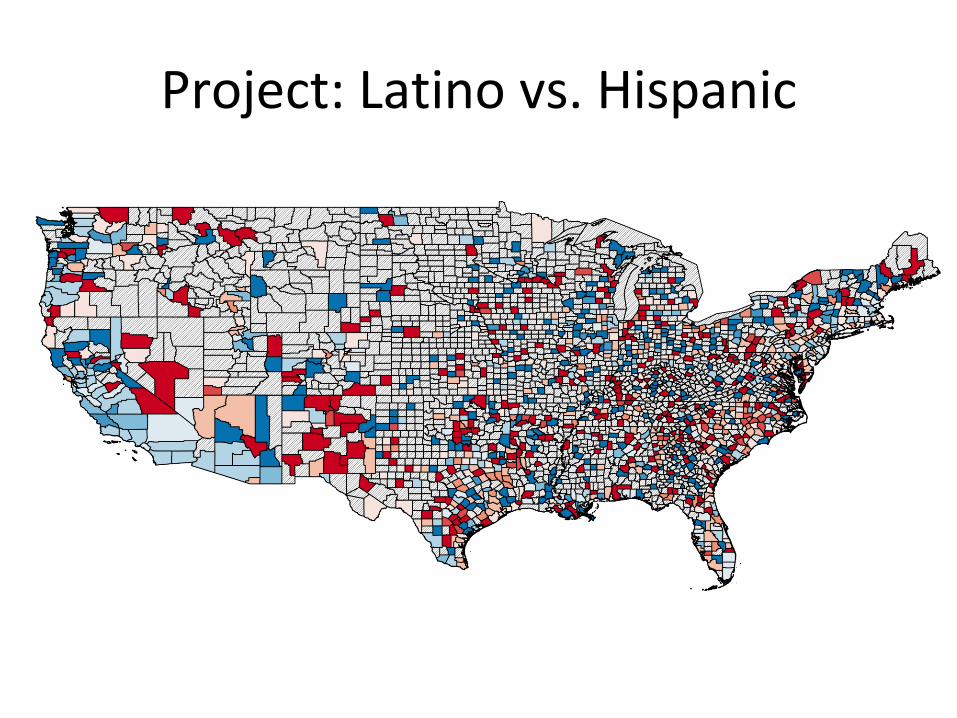
Project: Latino vs. Hispanic
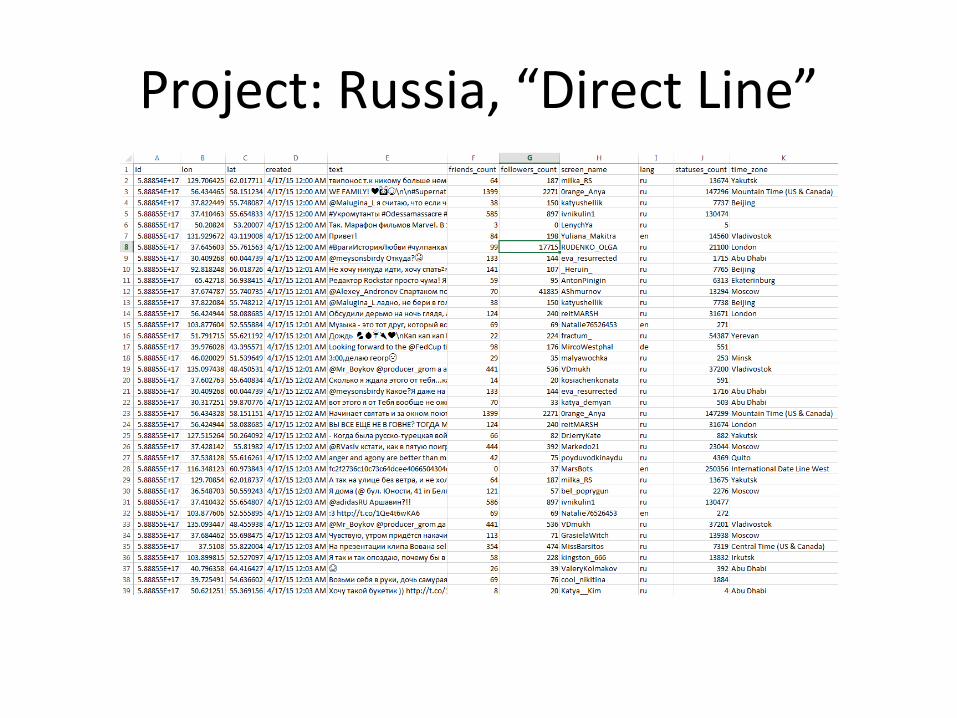
Project: Russia, “Direct Line”
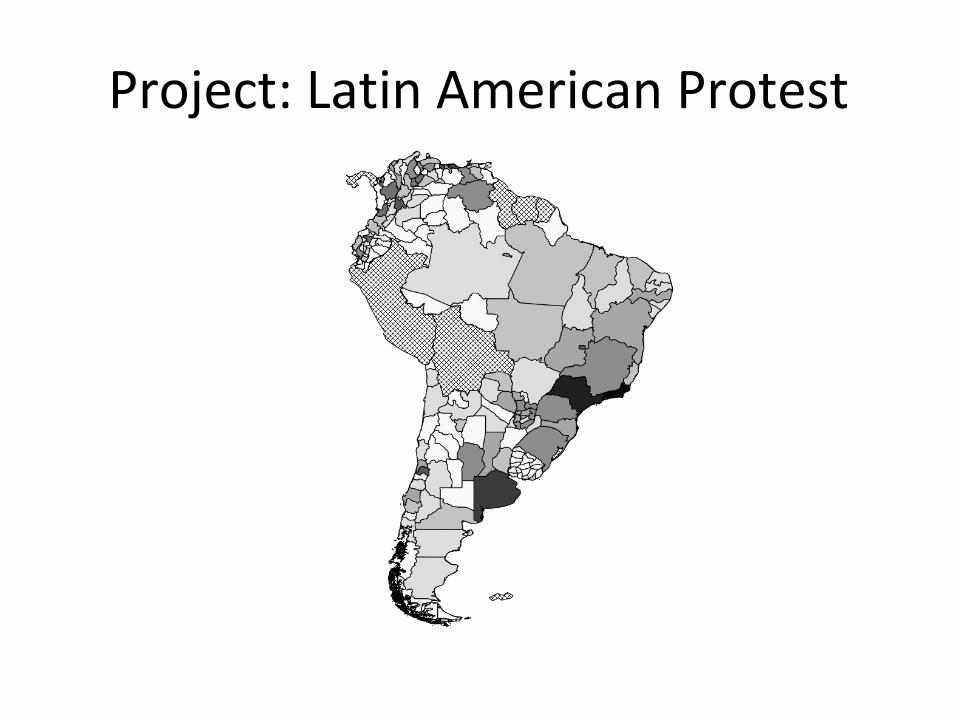
Project: Latin American Protest
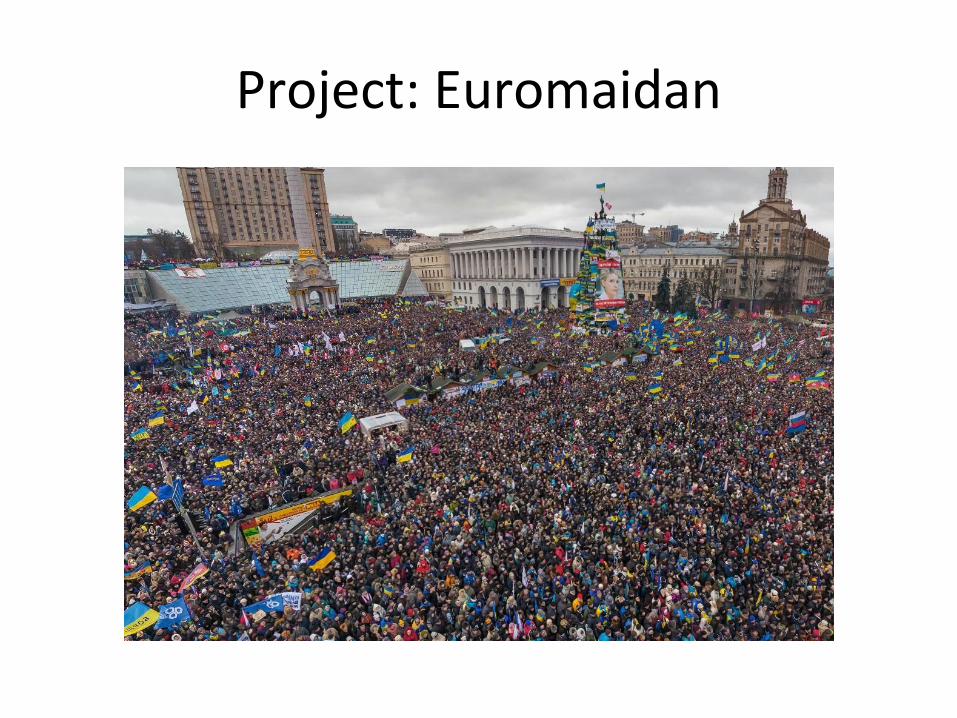
Project: Euromaidan
Operationalization: Tweets
• Tweets within Ukraine
– 6 months of tweets (10/1/13 to 3/31/14)
– 2.2 million tweets
• Operationalization:
– Custom GIS code to identify raion
– Number of friends (for weighting)
Operationalization: Protest
• Hand-coded from media sources
– 26 days with size estimates (2K to 500K)
– 73 days with protests but no size estimates
– 95 days with no protest
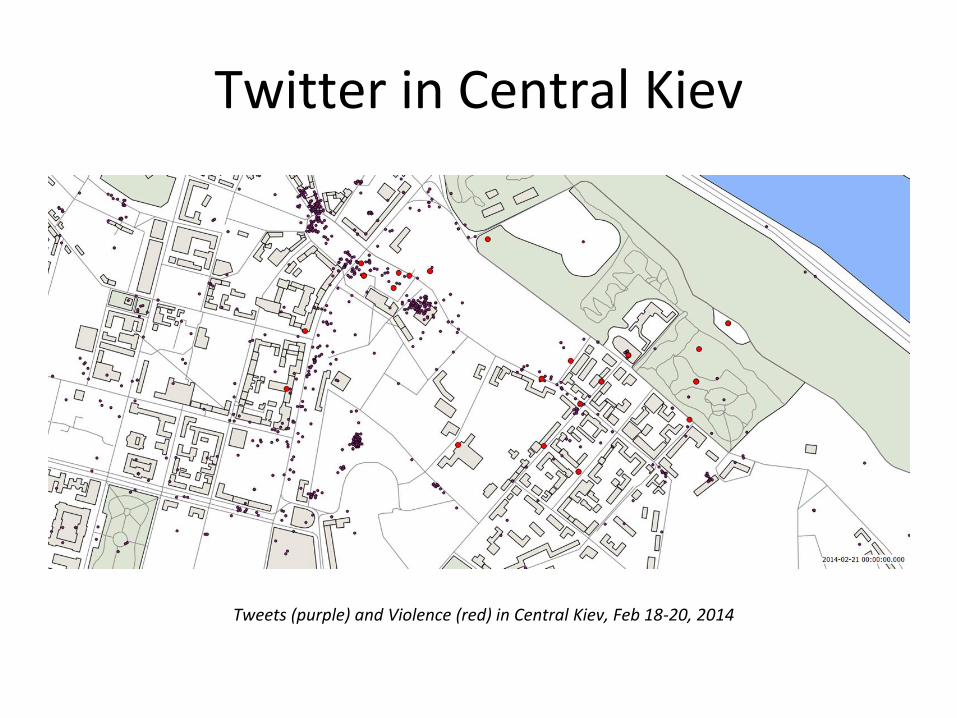
Twitter in Central Kiev
Tweets (purple) and Violence (red) in Central Kiev, Feb 18-20, 2014
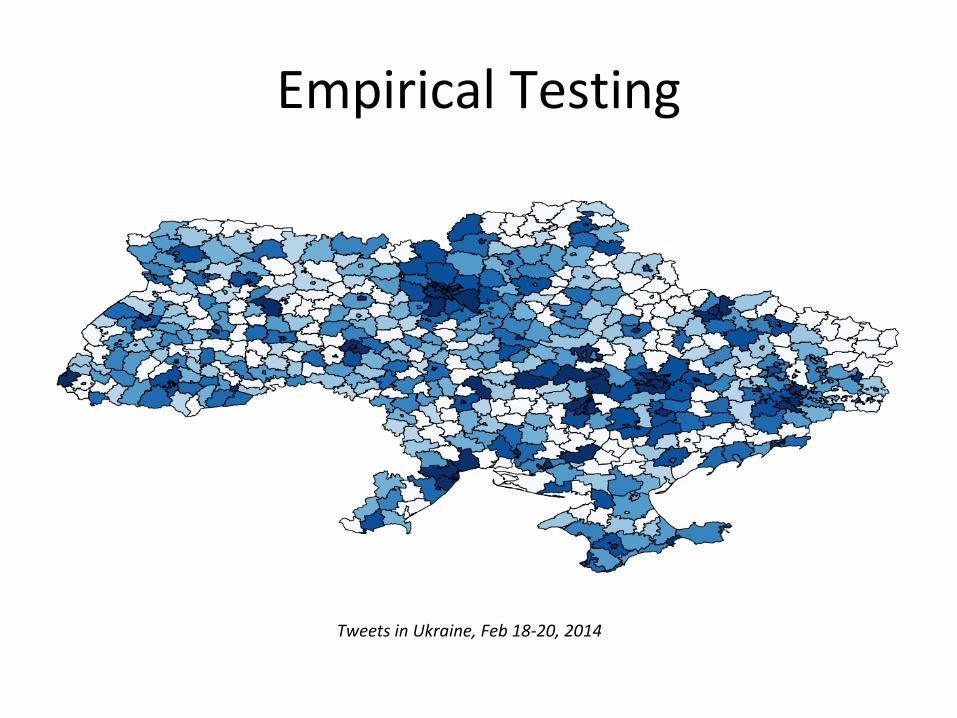
Empirical Testing
Tweets in Ukraine, Feb 18-20, 2014
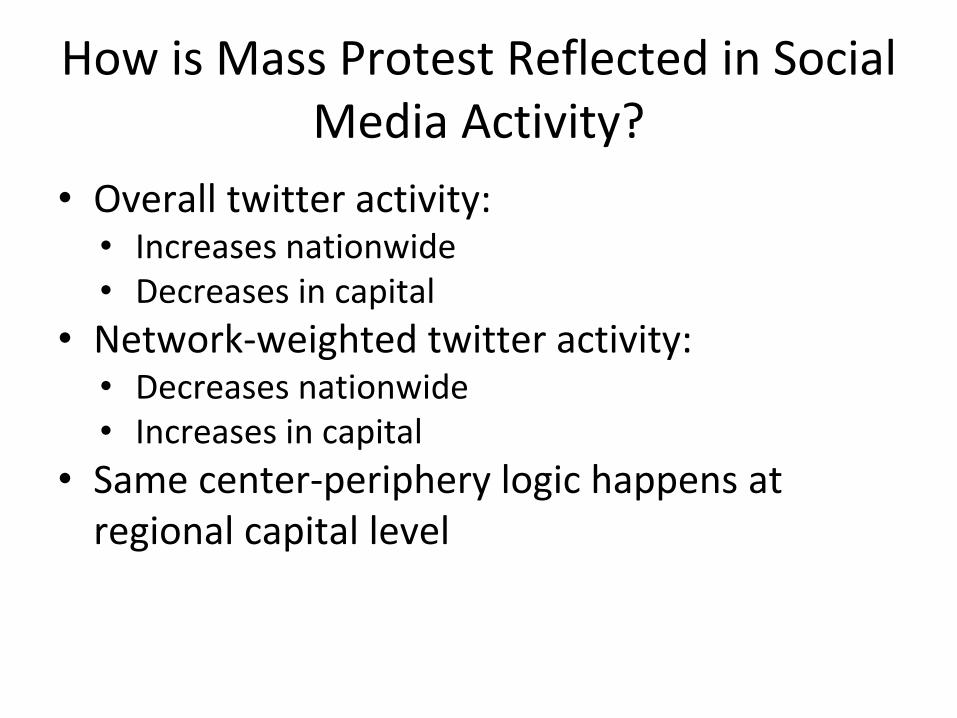
How is Mass Protest Reflected in Social Media Activity?
• Overall twitter activity:• Increases nationwide• Decreases in capital
• Network-weighted twitter activity:• Decreases nationwide• Increases in capital
• Same center-periphery logic happens at regional capital level
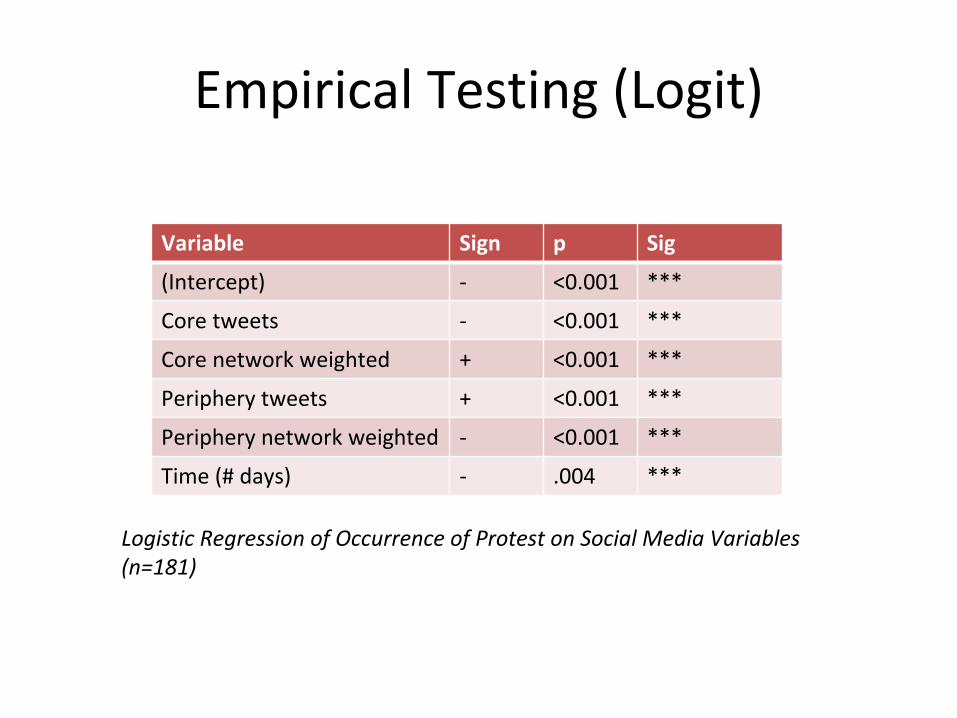
Empirical Testing (Logit)
Variable Sign p Sig
(Intercept) - <0.001 ***
Core tweets - <0.001 ***
Core network weighted + <0.001 ***
Periphery tweets + <0.001 ***
Periphery network weighted - <0.001 ***
Time (# days) - .004 ***
Logistic Regression of Occurrence of Protest on Social Media Variables (n=181)
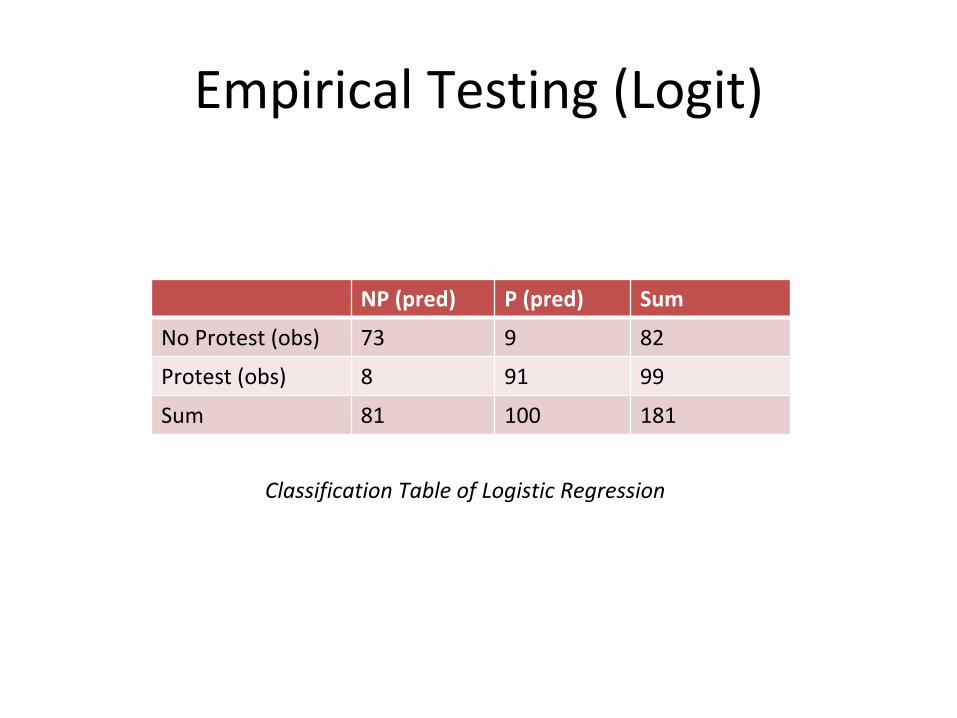
Empirical Testing (Logit)
NP (pred) P (pred) Sum
No Protest (obs) 73 9 82
Protest (obs) 8 91 99
Sum 81 100 181
Classification Table of Logistic Regression

Wrapping Up
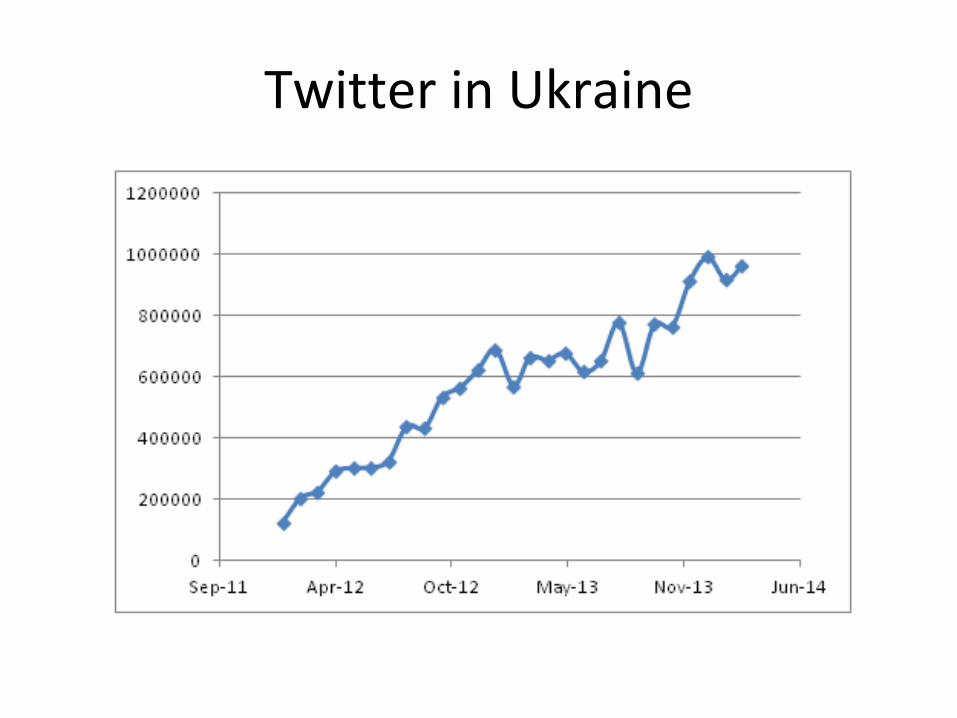
Twitter in Ukraine
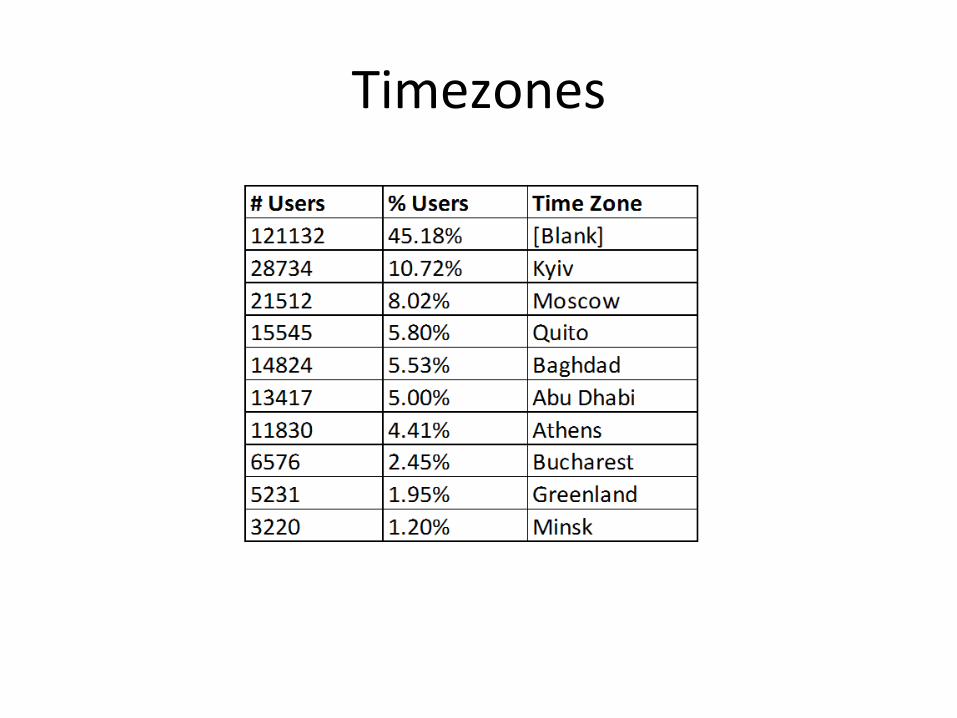
Timezones
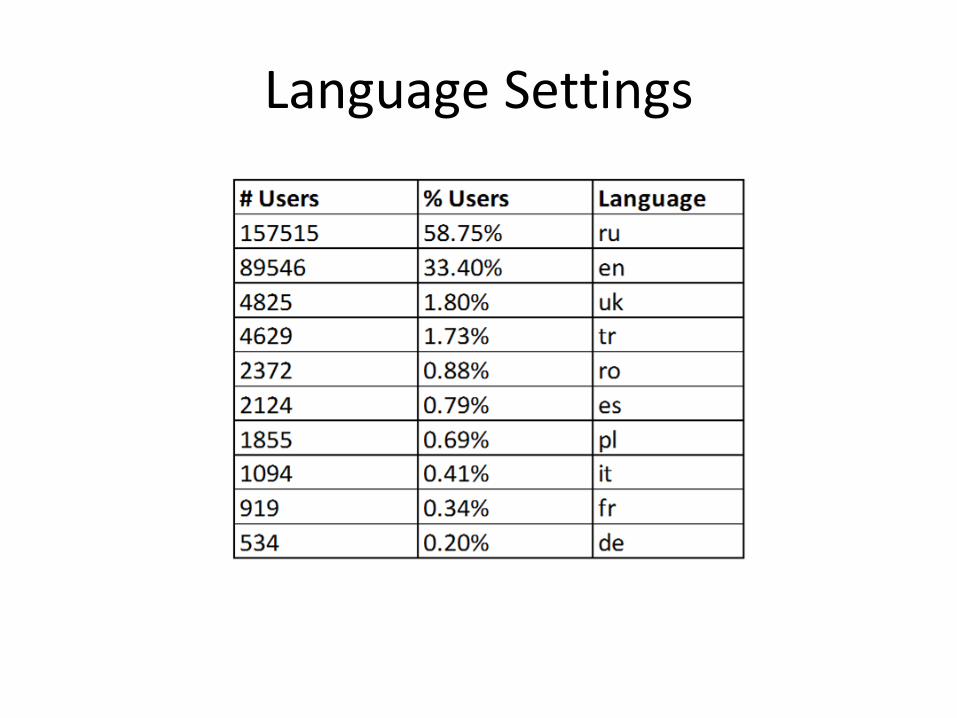
Language Settings