Embed Size (px)
Citation preview
Social Media as a Measurement Tool of Depression in Populations
Munmun De Choudhury
Scott Counts
Microsoft Research, Redmond WA 98052
{munmund, counts, horvitz}@microsoft.com
Eric Horvitz
ABSTRACT
Depression is a serious and widespread public health
challenge. We examine the potential for leveraging social
media postings as a new type of lens in understanding
depression in populations. Information gleaned from social
media bears potential to complement traditional survey
techniques in its ability to provide finer grained
measurements over time while radically expanding
population sample sizes. We present work on using a
crowdsourcing methodology to build a large corpus of
postings on Twitter that have been shared by individuals
diagnosed with clinical depression. Next, we develop a
probabilistic model trained on this corpus to determine if
posts could indicate depression. The model leverages
signals of social activity, emotion, and language manifested
on Twitter. Using the model, we introduce a social media
depression index that may serve to characterize levels of
depression in populations. Geographical, demographic and
seasonal patterns of depression given by the measure
confirm psychiatric findings and correlate highly with
depression statistics reported by the Centers for Disease
Control and Prevention (CDC).
Author Keywords
behavior, depression, emotion, health, language, social
media, mental health, public health, Twitter, wellness
ACM Classification Keywords
H.4.3; H.5.m
INTRODUCTION
Depression affects more than 27 million Americans and is
believed to be responsible for the more than 30,000 suicides
each year [2,14]. Besides being directly debilitating to
sufferers, depression can adversely affect chronic health
conditions, such as cardiovascular disease, cancer, diabetes,
and obesity. It is also known to have negative influences on
individuals’ family and personal relationships, work or
school life, and sleeping and eating habits.
Over the coming 20 years, depression is projected to be the
leading cause of disability in high-income nations such as
the United States [16]. The World Health Organization
(WHO) now ranks major depression as one of the most
burdensome diseases in the world [2,16]. Although a
number of primary care programs have been devised for its
detection and treatment, the majority of the millions of
Americans who meet depression criteria are untreated or
undertreated [11]. Furthermore, ethnic minority groups such
as Mexican Americans and African Americans are
significantly less likely to receive depression therapies than
are other ethnic groups [9].
As part of a national-scale effort to curb depression, every
few years the Centers for Disease Control and Prevention
(CDC) administers the Behavioral Risk Factor Surveillance
System (BRFSS) survey via telephone to estimate the rate
of depression among adults in the US [2]. However the
large temporal gaps across which these measurements are
made, as well as the limited number of participant
responses (on the order of thousands) makes it difficult for
agencies to track and identify risk factors that may be
associated with mental illness, or to develop effective
intervention programs.
We examine the potential of social media as a new tool for
mental health measurement and surveillance. Platforms
such as Twitter and Facebook are increasingly gaining
traction among individuals allowing them to share their
thoughts and emotions around a variety of happenings in
everyday life. The emotion and language used in social
media postings may indicate feelings of worthlessness,
guilt, helplessness, and self-hatred that characterize
depression as manifested in everyday life. Additionally,
depression sufferers often show withdrawal from social
situations and activities—i.e., the etiology of depression
typically includes social environmental factors [17].
Characterization of social media activity and changing
social ties within social media can provide measurement of
such withdrawal and capture the depression sufferers’
social context in a manner that might help detect depression
in populations.
Relying on social media as a behavioral health assessment
tool has other advantages as well. For instance, in contrast
to the self-report methodology in behavioral surveys, where
responses are prompted by the experimenter and typically
comprise recollection of (sometimes subjective) health
facts, social media measurement of behavior captures social
activity and language expression in a naturalistic setting.
Such activity is real-time, and happens in the course of a
Permission to make digital or hard copies of all or part of this work for personal or classroom use is granted without fee provided that copies are
not made or distributed for profit or commercial advantage and that copies
bear this notice and the full citation on the first page. To copy otherwise, or republish, to post on servers or to redistribute to lists, requires prior
specific permission and/or a fee.
WebSci’13, May 2–4, 2013, Paris, France.
Copyright 2013 ACM 978-1-4503-1889-1....$10.00.
person’s day-to-day life. Hence it is less vulnerable to
memory bias or experimenter demand effects, and can help
track concerns at a fine-grained temporal scale.
Our main contributions in this paper are as follows:
(1) Using crowdsourcing techniques, we gather a ground
truth set of 69K Twitter postings shared by individuals
suffering from clinical depression—depression was
measured using the CES-D (Center for Epidemiologic
Studies Depression Scale) screening test [22].
(2) We develop statistical models (an SVM classifier) that
can predict whether or not a Twitter post in a test set could
be depression-indicative. To construct and test the
predictive models, we harness evidence from a variety of
measures, spanning emotional expression, linguistic style,
user engagement, and egocentric social network properties.
We demonstrate that our models can predict if a post is
depression-indicative, with accuracy of more than 70% and
precision of 0.82.
(3) Finally we propose a metric we refer to as the social
media depression index (SMDI). SMDI uses the above
prediction models to determine depressive-indicative
postings on Twitter, and thereby helps characterize the
levels of depression in populations. We conduct a variety of
analyses at population scale, examining depression levels
(as given by SMDI) across geography (US cities and
states), demographics (gender), and time, including diurnal
and seasonal patterns. Our findings from these analyses
align with CDC reported statistics of depression in US
population, as well as confirm known characteristics of
depression given in clinical literature.
We believe that, when tied to behavioral health records
from agencies, information derived from our prediction
models and analyses can be valuable to epidemiologists
who study macro-trends of individuals suffering from
depression or other types of mental health disorders.
RELATED WORK
Social/Psychological Context and Depression
Offline social networks and attributes relating to the
psychological environment of individuals have consistently
been used to study behavioral health concerns. Billings and
Moos [1] studied the roles of stress, social resources, and
coping among individuals entering treatment for
depression. Neils Rosenquist, Fowler, and Christakis [17]
found that levels of depression showed diffusion upto three
degrees of separation in a large social network, suggesting a
network influence component to depression. On similar
lines, in [10], Kawachi et al. explored the role of social ties
and social capital in the maintenance of psychological
wellbeing and treatment of behavioral health concerns. This
prior research provides strong evidence that individuals’
social environments contain vital information useful for
understanding and intervening on mental health.
In the field of psycholinguistics, Oxman et al. [18]
demonstrated that linguistic analysis of speech could
classify patients into diagnostic groups such as those
suffering depression and paranoia. Computerized analysis
of written text has also been known to reveal cues about
neurotic tendencies and psychiatric disorders [23]. Utilizing
such analyses, particularly of social media given their
strong connection to people’s social environment, can help
us overcome the limitations of surveys for understanding
the social/psychological context of individuals.
Public Health using Online Data
Leveraging internet data for modeling and analyzing public
health behaviors has been a ripe area of research in the
recent past. Google Flu Trends1 provides nuanced
predictions of flu infections based on online search queries.
Paul and Dredze [20] developed a disease-specific topic
model based on Twitter’s posts in order to model behavior
around a variety of diseases of importance in public health.
Through language modeling of Twitter posts, Collier et al.
[4] found evidence of high correlation between social media
signals and diagnostic influenza case data. Sadelik et al.
[24] developed statistical models that predicted infectious
disease (e.g. flu) spread in individuals based on geotagged
postings made on Twitter (also see [13]).
While this body of work has investigated a range of
challenges around public health, research on harnessing
social media for understanding behavioral health disorders
is still in its infancy. Park et al. [19] found initial evidence
that people do post about their depression and even their
treatment for depression on Twitter. In other related work
[6], we examined linguistic and emotional correlates for
postnatal course of new mothers, and thereafter built a
model to predict extreme behavioral changes in new
mothers. This early work thus points to the potential of
social media as a signal to leverage in the study of
depression. With the present work we expand the scope of
social media-based studies of depression by examining
general depression at population scale.
DATA
A primary challenge is the gathering of adequate social
media data, in particular Twitter posts, which bear
information on whether or not they could contain
depression-bearing/indicative content. We tackle this issue
by collecting actual depression information on a set of
Twitter users. The idea is that the postings made by a user
suffering from depression will contain cues or signals that
could reflect their mental condition. Such postings would
thus help construct the positive/target class (i.e. set of posts
that are depression-indicative) necessary for classification.
Identifying Clinically Depressed Users
We employ a crowdsourcing methodology to collect
information on the status of depression of a set of users.
1 http://www.google.org/flutrends/
Using Amazon’s Mechanical Turk interface, we designed
HITs wherein crowdworkers were asked to take a clinical
depression survey, followed by self-report seeking
questions on their depression history. The crowdworkers
could also opt-in to share their Twitter usernames if they
had a public profile. We sought responses from
crowdworkers who were located in the US, and had an
approval rating greater than or equal to 90%. Each
crowdworker was restricted to take the HIT exactly once,
and was paid 90 cents for completing the task.
We used the CES-D (Center for Epidemiologic Studies
Depression Scale) questionnaire as the primary tool to
determine the depression levels in the crowdworkers. The
CES-D is a 20-item self-report scale designed to measure
depressive symptoms in the general population [22]. Higher
scores in the test indicate the presence of more
symptomatology. In our study, we also collected
information about the crowdworkers’ depression history
through the following questions:
Whether or not they have been diagnosed with clinical
depression in the past. If so, when.
If the answer above was positive, what was the estimated
date of onset of depression.
From the date of depression onset, how many depression
episodes had they experienced.
Finally, we asked the crowdworkers to share their (public)
Twitter username for research purposes, under the privacy
clause that their data may be mined using a computer
program and analyzed anonymously.
Statistics of Crowdsourcing Study
A total of 1,583 crowdworkers completed our HITs
between September 15 and October 31, 2012. However, not
all crowdworkers opted in to share their Twitter
usernames—637 participants (~40%) agreed to provide us
access to their Twitter feeds. Next, we eliminated noisy
respondents who took too little time to complete the task.
Finally, we sought data from individuals with depression
onset dates anytime in the last one year, but no later than
three months before the survey was taken. These constraints
were assumed to ensure that, for each user detected with
depression, we would have sufficient postings on Twitter
after the onset and until the point in time that they took the
survey. We also sought users who had reported to be
clinically depressed (and were currently so as well based on
the scoring on the survey) with at least two depression
episodes in the studied period. This helped us to focus on
high precision data for which we had recurring signs of
depression; depression would be a prevalent condition in
these individuals. A set of 489 users was obtained, who
indicated either they have clinical depression with onset in
or after September 2011 and before June 2012, or did not
have depression anytime. The set contained 251 males, 238
females, and the median age was 25 years.
Total number of users 489
(1) #users detected with depression
(2) #users with no signs of depression
117
157
Total number of Twitter posts 69,514
(1) Positive class (depression-indicative)
(2) Negative class (standard posts)
23,984
45,530
Mean number of posts per user 253.7
Variance of number of posts per user 24.88
Mean number of posts per day per user 2.79
Variance of number of posts per day per user 7.04
Table 1. Statistics of Twitter data for classification.
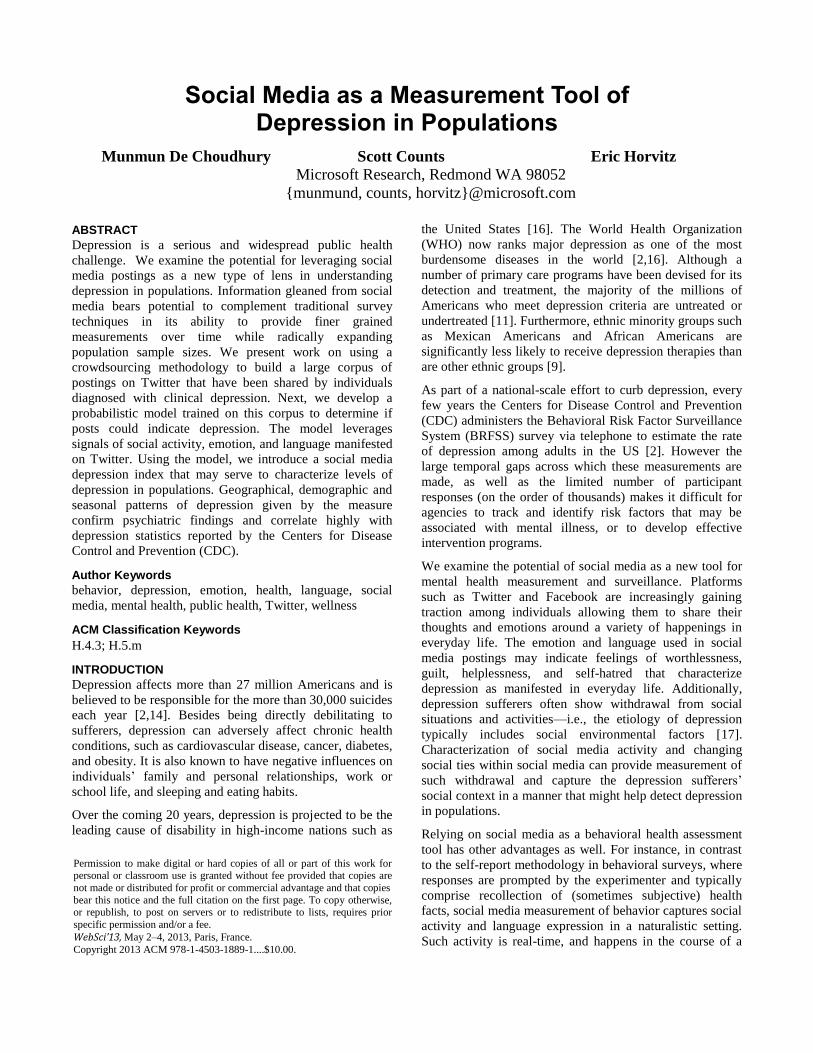
A distribution of the users per their depression scores is
displayed in Figure 1. Based on the standard cut-off of 30
or above for high-range depression [21], we found 117
users with signs of severe depression. Separately, we
obtained a set of 157 users, with scores in the range (0-10),
who showed very little likelihood/almost no sign of
depression in the period of our interest.
Positive class (depression-indicative posts)
“Are you okay?” Yes…. I understand that I am upset and
hopeless and nothing can help me… I’m okay… but I am not
alright
“empty” feelings I WAS JUST TALKING ABOUT HOW I I
HAVE EMOTION OH MY GOODNESS I FEEL AWFUL
I want someone to hold me and be there for me when I’m sad.
Reloading twitter till I pass out. *lonely* *anxious* *butthurt*
*frustrated* *dead*
Having a job again makes me happy. Less time to be depressed
and eat all day while watching sad movies.
Table 2. Example posts from the positive class.
Building Ground Truth Dataset
We now discuss how we constructed a dataset of Twitter
posts, with ground-truth label information (on whether or
not the post is depression-indicative). We use Twitter
postings of the two sets of users obtained above—(1) for
the positive class (depression-indicative posts), and (2) for
the negative class (standard posts). For each user in both
sets, we use all of their postings in a three-month period.
Figure 1. Distribution of depression scores based on the
CES-D questionnaire. Shaded regions show the users who
were considered for constructing ground truth classes.
For the positive class of posts, we collect all postings made
by users in the first set during the three months after their
indicated onset of depression. For the negative class, we
collect all postings made by users in the second set, during
the three months before the date they took our survey. For
collecting the posts, we utilized the Firehose made available
to us via our organization’s contract with Twitter. Table 1
gives the final statistics of the dataset thus constructed. A
few examples of posts from the target class of depression-
indicative posts are given in Table 2.
FEATURES
We propose several features to characterize the postings in
our dataset. The features can be categorized into two types:
post-centric and user-centric—the former captures
properties in the post, while the latter characterizes the
behavior of the post’s author. Several of our features are
motivated from [6], where greater details can be accessed
by the readers.
Post Features
Emotion. We consider four features of the emotional state
manifested in the posts: positive affect (PA), negative affect
(NA), activation, and dominance. Measurements of PA and
NA per post are computed using the psycholinguistic
resource LIWC (http://www.liwc.net/), whose emotion
categories have been validated to perform well for
determining affect in Twitter [3,6]. We use the ANEW
lexicon [5,6] for computing activation and dominance.
Time. We define a measure that uses the timestamp
information of a post, that is, whether it was a day time or
night time post (in terms of local time of the post author).
Our motivation springs from observations in the depression
literature indicating that users showing depression signs
tend to be relatively more active during the evening and
night [15]. For the purpose we define a “night” window in a
given day as “9PM—5:59AM” (consequently the “day”
window for the same user, in local time, would be “6AM-
8:59PM”). For each post, we therefore assign a “time”
index 1 or -1, depending on whether it was posted
respectively in the night or day window.
Linguistic Style. We also introduce features to characterize
posts based on the use of linguistic styles [3,6]. We again
use LIWC for determining 22 specific linguistic styles:
articles, auxiliary verbs, conjunctions, adverbs, impersonal
pronouns, personal pronouns, prepositions, functional
words, fillers, assent, negation, certainty and quantifiers.
n-grams. We also extract unigrams and bigrams from the
posts, in order to account for the general language use.
User Features
Engagement. We utilize a set of engagement measures of
the authors of posts in order to characterize the general
behavior associated with them—we believe users found to
be clinically depressed (or not) will bear distinctive
behavioral markers in their postings. A measure of overall
engagement of author of a post in social media is volume,
defined as the number of posts the user has made so far on
social media. We define a second engagement feature to be
the proportion of reply posts (@-replies) from a post’s
author. The third feature is the fraction of retweets from a
post author. The proportion of links (urls) shared by each
post author comprises our fourth feature. We define a fifth
feature as the fraction of question-centric posts from a
post’s author.
Ego-network. We define two features that characterize a
post author’s egocentric social network: (1) the number of
followers or inlinks of the user, (2) the count of her
followees or outlinks.
EXPLORATION OF DEPRESSION BEHAVIOR
Based on the features discussed so far, we present some
descriptive analyses of differences in the two classes of
posts: the “depression-indicative”, and the “standard” posts.
Table 3 gives a list of the high frequency unigrams that
appear in the postings of the two classes. For the negative
class (standard posts), most of the unigrams relate to
commonplace details of daily life, ranging from work to
entertainment (work, friends, life, tomorrow, movie,
football). A number of positive emotion words are also
observed, such as brilliant, love, beautiful, perfect, great.
Depression-indicative posts Standard posts
loser, depress*, lonely, sad,
alone, weak, useless, life,
imbalance, blame, problems,
unsuccessful, suicidal, torture,
safe, escape, worry, intimidat*,
uncomfortable, therapy,
medication, shit, pressure,
conversation, hurts, myself,
worth, break, nobody, mine,
painful, hate, suck*
lol, work, weekend, say,
friends, brilliant, follow, tips,
bieber, love, amazing, hello,
now, bored, awesome,
beautiful, romantic, fuck*,
perfect, excited, smile, meet,
tonight, life, movie, football,
favorite, sleepy, great, night,
team, good, anyone, you, your,
tomorrow, money
Table 3. Top unigrams for the two classes of posts.
On the other hand, in the case of depression-indicative
posts, many words are emotional in nature (e.g., sad,
happiness, uncomfortable, hurts, painful, hate, hope,
worry). However we notice a strong inclination towards
unigrams representing negative affect and low intensity
emotions—possibly reflecting the mental instability and
helplessness of the individuals sharing these posts,
including symptoms of their likely depression (loser,
depress*, weak, useless, suicidal, unsuccessful). Some posts
also contain references to therapy and medication, possibly
because individuals may be interested to exchange
information about these with their audiences.
We extend these findings through observations of the
difference in means across the two classes in terms of
various features (except the n-grams)—for a particular
feature f, it is defined as μ(f)=fd – fs where fd (or fs) is the
mean value of f for the positive (or negative) class. This is
shown in Table 4.
There are considerable differences across the two classes,
as noted in the differences of means as well as the statistical
significance tests. For instance, for the depression-
indicative posts, we observe considerable decrease in user
engagement features, such as volume, RTs, and replies.
This indicates that the authors of the depression-indicative
posts are posting less, suggesting a possible loss of social
connectedness. Additionally, lowered numbers of followers
and followees shows that the authors of the depression-
indicative posts exhibit reduced desire to socialize or
tendency to consume external information and remain
connected with others.
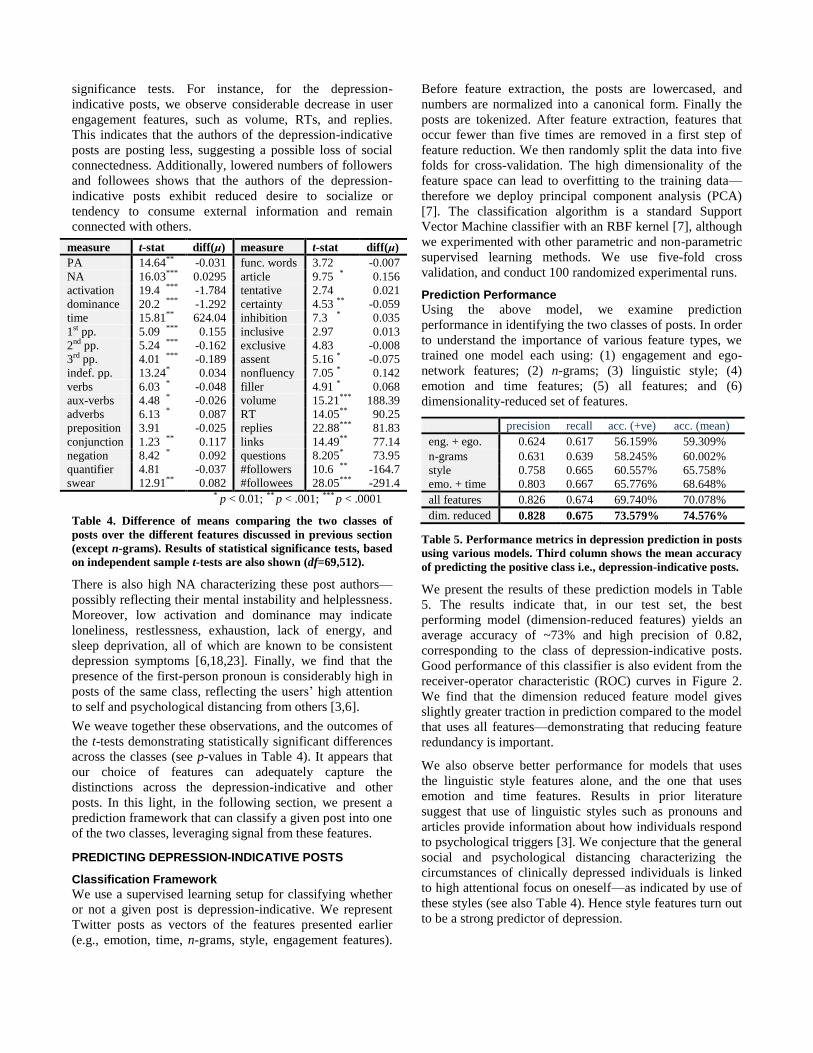
measure t-stat diff(μ) measure t-stat diff(μ)
PA 14.64** -0.031 func. words 3.72 -0.007
NA 16.03*** 0.0295 article 9.75 * 0.156
activation 19.4 *** -1.784 tentative 2.74 0.021
dominance 20.2 *** -1.292 certainty 4.53 ** -0.059
time 15.81** 624.04 inhibition 7.3 * 0.035
1st pp. 5.09 *** 0.155 inclusive 2.97 0.013
2nd pp. 5.24 *** -0.162 exclusive 4.83 -0.008
3rd pp. 4.01 *** -0.189 assent 5.16 * -0.075
indef. pp. 13.24* 0.034 nonfluency 7.05 * 0.142
verbs 6.03 * -0.048 filler 4.91 * 0.068
aux-verbs 4.48 * -0.026 volume 15.21*** 188.39
adverbs 6.13 * 0.087 RT 14.05** 90.25
preposition 3.91 -0.025 replies 22.88*** 81.83
conjunction 1.23 ** 0.117 links 14.49** 77.14
negation 8.42 * 0.092 questions 8.205* 73.95
quantifier 4.81 -0.037 #followers 10.6 ** -164.7
swear 12.91** 0.082 #followees 28.05*** -291.4 * p < 0.01; ** p < .001; *** p < .0001
Table 4. Difference of means comparing the two classes of
posts over the different features discussed in previous section
(except n-grams). Results of statistical significance tests, based
on independent sample t-tests are also shown (df=69,512).
There is also high NA characterizing these post authors—
possibly reflecting their mental instability and helplessness.
Moreover, low activation and dominance may indicate
loneliness, restlessness, exhaustion, lack of energy, and
sleep deprivation, all of which are known to be consistent
depression symptoms [6,18,23]. Finally, we find that the
presence of the first-person pronoun is considerably high in
posts of the same class, reflecting the users’ high attention
to self and psychological distancing from others [3,6].
We weave together these observations, and the outcomes of
the t-tests demonstrating statistically significant differences
across the classes (see p-values in Table 4). It appears that
our choice of features can adequately capture the
distinctions across the depression-indicative and other
posts. In this light, in the following section, we present a
prediction framework that can classify a given post into one
of the two classes, leveraging signal from these features.
PREDICTING DEPRESSION-INDICATIVE POSTS
Classification Framework
We use a supervised learning setup for classifying whether
or not a given post is depression-indicative. We represent
Twitter posts as vectors of the features presented earlier
(e.g., emotion, time, n-grams, style, engagement features).
Before feature extraction, the posts are lowercased, and
numbers are normalized into a canonical form. Finally the
posts are tokenized. After feature extraction, features that
occur fewer than five times are removed in a first step of
feature reduction. We then randomly split the data into five
folds for cross-validation. The high dimensionality of the
feature space can lead to overfitting to the training data—
therefore we deploy principal component analysis (PCA)
[7]. The classification algorithm is a standard Support
Vector Machine classifier with an RBF kernel [7], although
we experimented with other parametric and non-parametric
supervised learning methods. We use five-fold cross
validation, and conduct 100 randomized experimental runs.
Prediction Performance
Using the above model, we examine prediction
performance in identifying the two classes of posts. In order
to understand the importance of various feature types, we
trained one model each using: (1) engagement and ego-
network features; (2) n-grams; (3) linguistic style; (4)
emotion and time features; (5) all features; and (6)
dimensionality-reduced set of features.
precision recall acc. (+ve) acc. (mean)
eng. + ego. 0.624 0.617 56.159% 59.309%
n-grams 0.631 0.639 58.245% 60.002%
style 0.758 0.665 60.557% 65.758%
emo. + time 0.803 0.667 65.776% 68.648%
all features 0.826 0.674 69.740% 70.078%
dim. reduced 0.828 0.675 73.579% 74.576%
Table 5. Performance metrics in depression prediction in posts
using various models. Third column shows the mean accuracy
of predicting the positive class i.e., depression-indicative posts.
We present the results of these prediction models in Table
5. The results indicate that, in our test set, the best
performing model (dimension-reduced features) yields an
average accuracy of ~73% and high precision of 0.82,
corresponding to the class of depression-indicative posts.
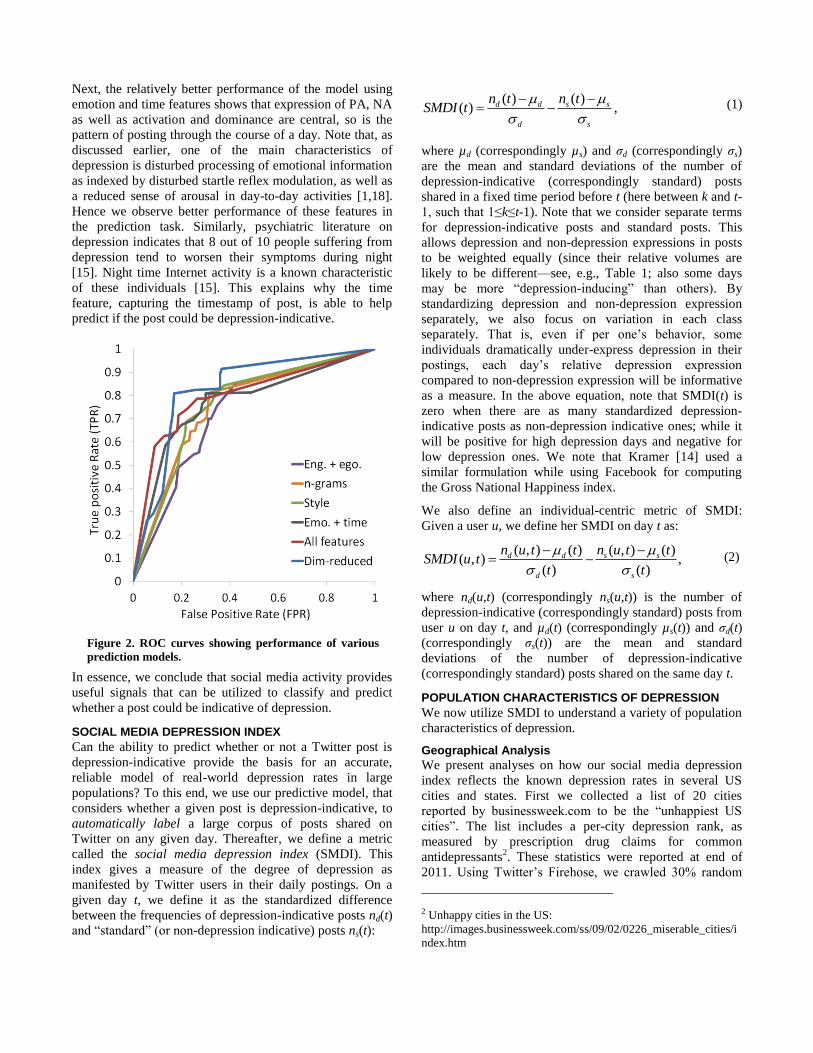
Good performance of this classifier is also evident from the
receiver-operator characteristic (ROC) curves in Figure 2.
We find that the dimension reduced feature model gives
slightly greater traction in prediction compared to the model
that uses all features—demonstrating that reducing feature
redundancy is important.
We also observe better performance for models that uses
the linguistic style features alone, and the one that uses
emotion and time features. Results in prior literature
suggest that use of linguistic styles such as pronouns and
articles provide information about how individuals respond
to psychological triggers [3]. We conjecture that the general
social and psychological distancing characterizing the
circumstances of clinically depressed individuals is linked
to high attentional focus on oneself—as indicated by use of
these styles (see also Table 4). Hence style features turn out
to be a strong predictor of depression.
Next, the relatively better performance of the model using
emotion and time features shows that expression of PA, NA
as well as activation and dominance are central, so is the
pattern of posting through the course of a day. Note that, as
discussed earlier, one of the main characteristics of
depression is disturbed processing of emotional information
as indexed by disturbed startle reflex modulation, as well as
a reduced sense of arousal in day-to-day activities [1,18].
Hence we observe better performance of these features in
the prediction task. Similarly, psychiatric literature on
depression indicates that 8 out of 10 people suffering from
depression tend to worsen their symptoms during night
[15]. Night time Internet activity is a known characteristic
of these individuals [15]. This explains why the time
feature, capturing the timestamp of post, is able to help
predict if the post could be depression-indicative.
In essence, we conclude that social media activity provides
useful signals that can be utilized to classify and predict
whether a post could be indicative of depression.
SOCIAL MEDIA DEPRESSION INDEX
Can the ability to predict whether or not a Twitter post is
depression-indicative provide the basis for an accurate,
reliable model of real-world depression rates in large
populations? To this end, we use our predictive model, that
considers whether a given post is depression-indicative, to
automatically label a large corpus of posts shared on
Twitter on any given day. Thereafter, we define a metric
called the social media depression index (SMDI). This
index gives a measure of the degree of depression as
manifested by Twitter users in their daily postings. On a
given day t, we define it as the standardized difference
between the frequencies of depression-indicative posts nd(t)
and “standard” (or non-depression indicative) posts ns(t):
(1)
where µd (correspondingly µs) and σd (correspondingly σs)
are the mean and standard deviations of the number of
depression-indicative (correspondingly standard) posts
shared in a fixed time period before t (here between k and t-
1, such that 1≤k≤t-1). Note that we consider separate terms
for depression-indicative posts and standard posts. This
allows depression and non-depression expressions in posts
to be weighted equally (since their relative volumes are
likely to be different—see, e.g., Table 1; also some days
may be more “depression-inducing” than others). By
standardizing depression and non-depression expression
separately, we also focus on variation in each class
separately. That is, even if per one’s behavior, some
individuals dramatically under-express depression in their
postings, each day’s relative depression expression
compared to non-depression expression will be informative
as a measure. In the above equation, note that SMDI(t) is
zero when there are as many standardized depression-
indicative posts as non-depression indicative ones; while it
will be positive for high depression days and negative for
low depression ones. We note that Kramer [14] used a
similar formulation while using Facebook for computing
the Gross National Happiness index.
We also define an individual-centric metric of SMDI:
Given a user u, we define her SMDI on day t as:
( , ) ( ) ( , ) ( )( , ) ,
( ) ( )
d d s s
d s
n u t t n u t tSMDI u t
t t
(2)
where nd(u,t) (correspondingly ns(u,t)) is the number of
depression-indicative (correspondingly standard) posts from
user u on day t, and µd(t) (correspondingly µs(t)) and σd(t)
(correspondingly σs(t)) are the mean and standard
deviations of the number of depression-indicative
(correspondingly standard) posts shared on the same day t.
POPULATION CHARACTERISTICS OF DEPRESSION
We now utilize SMDI to understand a variety of population
characteristics of depression.
Geographical Analysis
We present analyses on how our social media depression
index reflects the known depression rates in several US
cities and states. First we collected a list of 20 cities
reported by businessweek.com to be the “unhappiest US
cities”. The list includes a per-city depression rank, as
measured by prescription drug claims for common
antidepressants2. These statistics were reported at end of
2011. Using Twitter’s Firehose, we crawled 30% random
2 Unhappy cities in the US:
http://images.businessweek.com/ss/09/02/0226_miserable_cities/i
ndex.htm
Figure 2. ROC curves showing performance of various
prediction models.
( ) ( )( ) ,d d s s
d s
n t n tSMDI t
samples of Twitter posts (English language), per month
between Jan 1 2011 and Dec 31 2011, for each city, to
approximately match the time period around which these
numbers were reported. Note that matching a post with a
city was made based on the post author’s self-report
location on the Twitter profile, although other sophisticated
location inference schemes may be adopted in future work.
Table 6 gives statistics of the data crawled for each city.
City Posts Users City Posts Users
Portland 3.38M 24K Cleveland 6.95M 28K
Jacksonville 2.52M 17K Milwaukee 3.48M 18K
Nashville 4.63M 23K Sacramento 2.57M 17K
Seattle 5.87M 39K
Kansas
City 3.15M 18K
Cincinnati 3.05M 17K Tucson 1.69M 12K
Louisville 2.41M 16K
New
Orleans 8.16M 23K
Minneapolis 2.69M 21K Atlanta 26.1M 91K
Pittsburgh 5.41M 25K Memphis 6.79M 27K
Indianapolis 4.49M 23K Las Vegas 6.39M 37K
St Louis 421K 2.3K Detroit 13.3M 43K
Table 6. Statistics of 20 US cities with high depression rate.
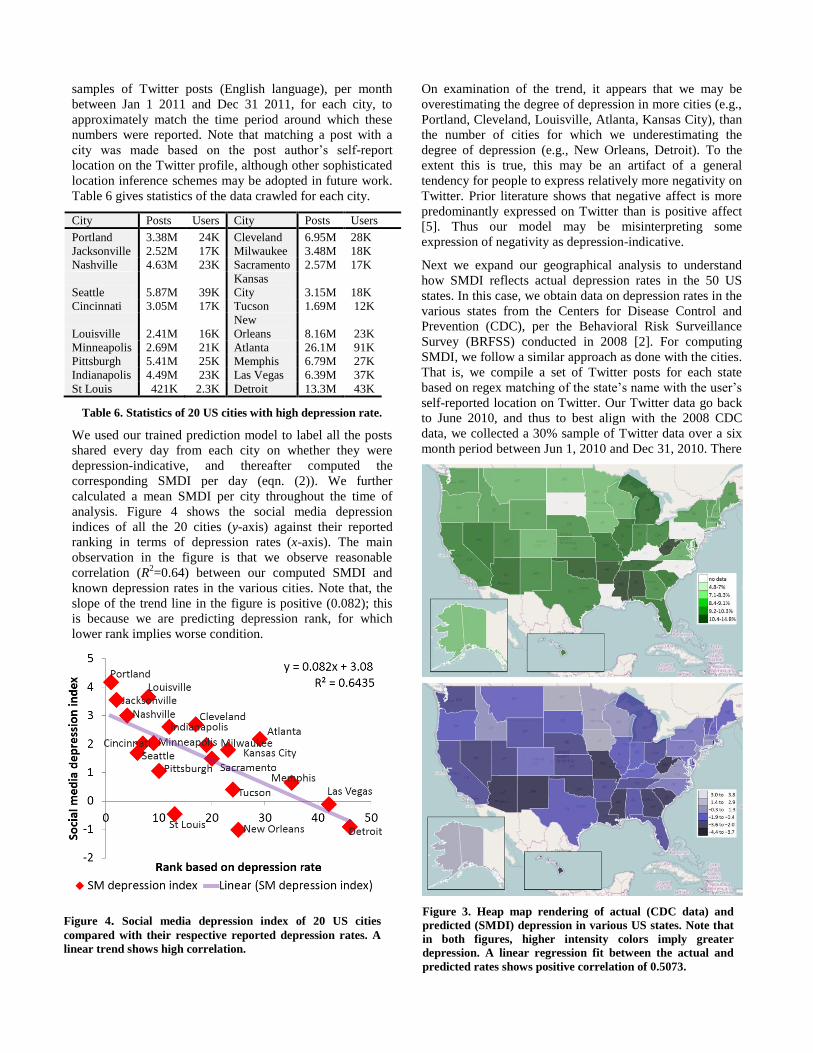
We used our trained prediction model to label all the posts
shared every day from each city on whether they were
depression-indicative, and thereafter computed the
corresponding SMDI per day (eqn. (2)). We further
calculated a mean SMDI per city throughout the time of
analysis. Figure 4 shows the social media depression
indices of all the 20 cities (y-axis) against their reported
ranking in terms of depression rates (x-axis). The main
observation in the figure is that we observe reasonable
correlation (R2=0.64) between our computed SMDI and
known depression rates in the various cities. Note that, the
slope of the trend line in the figure is positive (0.082); this
is because we are predicting depression rank, for which
lower rank implies worse condition.
On examination of the trend, it appears that we may be
overestimating the degree of depression in more cities (e.g.,
Portland, Cleveland, Louisville, Atlanta, Kansas City), than
the number of cities for which we underestimating the
degree of depression (e.g., New Orleans, Detroit). To the
extent this is true, this may be an artifact of a general
tendency for people to express relatively more negativity on
Twitter. Prior literature shows that negative affect is more
predominantly expressed on Twitter than is positive affect
[5]. Thus our model may be misinterpreting some
expression of negativity as depression-indicative.
Next we expand our geographical analysis to understand
how SMDI reflects actual depression rates in the 50 US
states. In this case, we obtain data on depression rates in the
various states from the Centers for Disease Control and
Prevention (CDC), per the Behavioral Risk Surveillance
Survey (BRFSS) conducted in 2008 [2]. For computing
SMDI, we follow a similar approach as done with the cities.
That is, we compile a set of Twitter posts for each state
based on regex matching of the state’s name with the user’s
self-reported location on Twitter. Our Twitter data go back
to June 2010, and thus to best align with the 2008 CDC
data, we collected a 30% sample of Twitter data over a six
month period between Jun 1, 2010 and Dec 31, 2010. There
Figure 3. Heap map rendering of actual (CDC data) and
predicted (SMDI) depression in various US states. Note that
in both figures, higher intensity colors imply greater
depression. A linear regression fit between the actual and
predicted rates shows positive correlation of 0.5073.
Figure 4. Social media depression index of 20 US cities
compared with their respective reported depression rates. A
linear trend shows high correlation.
were a total of approximately 132M posts over all the 40
states in our sample thus compiled.
Figure 3 shows heat map rendering of actual and predicted
depression rates in various states—higher intensity colors
imply greater depression rate reported by CDC (top) or
greater SMDI (bottom). Using the exact percent of each
state’s population that is depressed (as opposed to the
binned values in Figure 3), the Pearson correlation between
actual per-state rate of depression and those predicted by
SMDI is found to be 0.51. This demonstrates that our
metric can capture to a reasonable extent, the actual rates of
depression known in these states.
Demographic Analysis: Gender Differences
In this section we perform a demographic-centric analysis
of depression, comparing men and women. Our goal is to
be able to examine whether the rates of depression as found
by the BRFSS survey (same source as above) for men and
women align with the SMDI rates.
For the purpose, we utilize the same corpus of Twitter posts
used in the analysis reported in Figure 3. This analysis
however necessitated that we know the gender of the author
of a post, which is not an available attribute from Twitter.
Hence we utilized a gender classifier [6] that uses regex
matching of Twitter’s self-reported first names of users
with a gazetteer of names and gender collated from US
Census, baby name lists and public Facebook profiles. As
found in [6], a gender classifier of this type is known to
yield accuracy between 85-90%. In our corpus, we obtained
about 61% women and the rest men, after about 65%
coverage over all users.
For each post for which the author’s gender was inferred,
we computed the individual-centric measure of SMDI (see
eqn. (3)). Figure 5 shows the results. We observe that we
can reasonably predict the percentages of men and women
depressed. Women are known to suffer from 1.3 times more
depression than men [11]—approximately that ratio is
observed in our prediction as well (1.5 times in our case as
given by the actual rates of percent depressed in Figure 5).
This is denoted by the nearly parallel lines for predicted and
actual percent of each gender who are depressed. However
as with our previous analysis on geography, we observe a
slight overestimation of depression when using our method.
Interestingly, it appears that overestimation is higher for
women than for men (notice the SMDI values specifically).
One possibility is that women generally show greater
emotional expressivity than men, typically negative in
affect [8], hence leading to a bias in our model.
Temporal Analysis
In this final section on population-scale analyses, we focus
on understanding some of the temporal patterns of
depression, at diurnal and annual scales.
We first use the same data as used in Figure 5 to study
levels of SMDI over the course of a typical day (in local
time) across men and women. This is shown in Figure 6. As
in correspondence with our findings in Figure 5, we see that
diurnal SMDI values for women (μ=-0.47) are higher than
that of men (μ=-01.39; p<.001); although they have high
correlation (R2=0.78). An interesting finding of this study is
that, for both men and women, SMDI is higher during the
Figure 5. Differences in actual and predicted depression
for men and women based on Twitter posts, and from
users based in the US.
Figure 6. Diurnal patterns of social media depression index
for men and women.
Figure 7. Yearly patterns of social media depression index
over US cities with high depression rates.
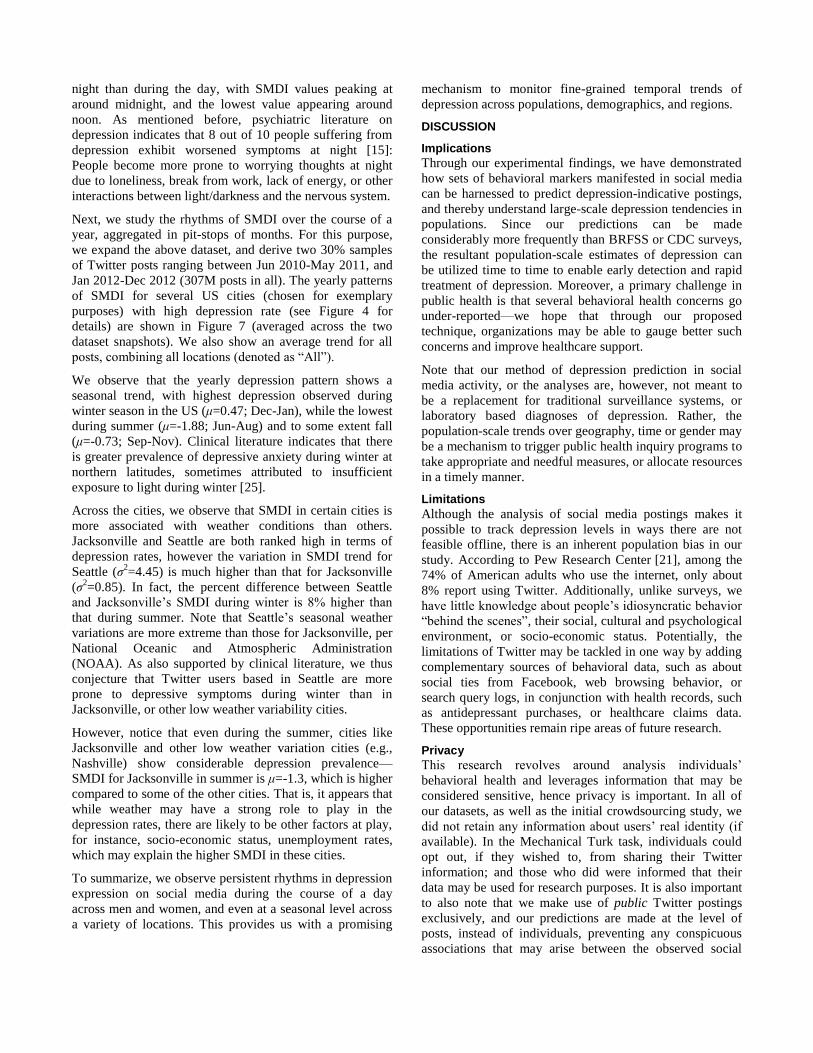
night than during the day, with SMDI values peaking at
around midnight, and the lowest value appearing around
noon. As mentioned before, psychiatric literature on
depression indicates that 8 out of 10 people suffering from
depression exhibit worsened symptoms at night [15]:
People become more prone to worrying thoughts at night
due to loneliness, break from work, lack of energy, or other
interactions between light/darkness and the nervous system.
Next, we study the rhythms of SMDI over the course of a
year, aggregated in pit-stops of months. For this purpose,
we expand the above dataset, and derive two 30% samples
of Twitter posts ranging between Jun 2010-May 2011, and
Jan 2012-Dec 2012 (307M posts in all). The yearly patterns
of SMDI for several US cities (chosen for exemplary
purposes) with high depression rate (see Figure 4 for
details) are shown in Figure 7 (averaged across the two
dataset snapshots). We also show an average trend for all
posts, combining all locations (denoted as “All”).
We observe that the yearly depression pattern shows a
seasonal trend, with highest depression observed during
winter season in the US (μ=0.47; Dec-Jan), while the lowest
during summer (μ=-1.88; Jun-Aug) and to some extent fall
(μ=-0.73; Sep-Nov). Clinical literature indicates that there
is greater prevalence of depressive anxiety during winter at
northern latitudes, sometimes attributed to insufficient
exposure to light during winter [25].
Across the cities, we observe that SMDI in certain cities is
more associated with weather conditions than others.
Jacksonville and Seattle are both ranked high in terms of
depression rates, however the variation in SMDI trend for
Seattle (σ2=4.45) is much higher than that for Jacksonville
(σ2=0.85). In fact, the percent difference between Seattle
and Jacksonville’s SMDI during winter is 8% higher than
that during summer. Note that Seattle’s seasonal weather
variations are more extreme than those for Jacksonville, per
National Oceanic and Atmospheric Administration
(NOAA). As also supported by clinical literature, we thus
conjecture that Twitter users based in Seattle are more
prone to depressive symptoms during winter than in
Jacksonville, or other low weather variability cities.
However, notice that even during the summer, cities like
Jacksonville and other low weather variation cities (e.g.,
Nashville) show considerable depression prevalence—
SMDI for Jacksonville in summer is μ=-1.3, which is higher
compared to some of the other cities. That is, it appears that
while weather may have a strong role to play in the
depression rates, there are likely to be other factors at play,
for instance, socio-economic status, unemployment rates,
which may explain the higher SMDI in these cities.
To summarize, we observe persistent rhythms in depression
expression on social media during the course of a day
across men and women, and even at a seasonal level across
a variety of locations. This provides us with a promising
mechanism to monitor fine-grained temporal trends of
depression across populations, demographics, and regions.
DISCUSSION
Implications
Through our experimental findings, we have demonstrated
how sets of behavioral markers manifested in social media
can be harnessed to predict depression-indicative postings,
and thereby understand large-scale depression tendencies in
populations. Since our predictions can be made
considerably more frequently than BRFSS or CDC surveys,
the resultant population-scale estimates of depression can
be utilized time to time to enable early detection and rapid
treatment of depression. Moreover, a primary challenge in
public health is that several behavioral health concerns go
under-reported—we hope that through our proposed
technique, organizations may be able to gauge better such
concerns and improve healthcare support.
Note that our method of depression prediction in social
media activity, or the analyses are, however, not meant to
be a replacement for traditional surveillance systems, or
laboratory based diagnoses of depression. Rather, the
population-scale trends over geography, time or gender may
be a mechanism to trigger public health inquiry programs to
take appropriate and needful measures, or allocate resources
in a timely manner.
Limitations
Although the analysis of social media postings makes it
possible to track depression levels in ways there are not
feasible offline, there is an inherent population bias in our
study. According to Pew Research Center [21], among the
74% of American adults who use the internet, only about
8% report using Twitter. Additionally, unlike surveys, we
have little knowledge about people’s idiosyncratic behavior
“behind the scenes”, their social, cultural and psychological
environment, or socio-economic status. Potentially, the
limitations of Twitter may be tackled in one way by adding
complementary sources of behavioral data, such as about
social ties from Facebook, web browsing behavior, or
search query logs, in conjunction with health records, such
as antidepressant purchases, or healthcare claims data.
These opportunities remain ripe areas of future research.
Privacy
This research revolves around analysis individuals’
behavioral health and leverages information that may be
considered sensitive, hence privacy is important. In all of
our datasets, as well as the initial crowdsourcing study, we
did not retain any information about users’ real identity (if
available). In the Mechanical Turk task, individuals could
opt out, if they wished to, from sharing their Twitter
information; and those who did were informed that their
data may be used for research purposes. It is also important
to also note that we make use of public Twitter postings
exclusively, and our predictions are made at the level of
posts, instead of individuals, preventing any conspicuous
associations that may arise between the observed social
media activity of an individual and their actual
psychological state.
CONCLUSION
Mining and analysis of social media activity in order to
understand a variety of public health phenomena has been
gaining considerable traction recently among researchers.
In this paper, we have demonstrated the potential of using
social media as a reliable tool for measuring population-
scale depression patterns. We adopted a crowdsourcing
strategy of collecting ground truth data on depression from
Twitter, and devised a variety of measures such as
language, emotion, style and user engagement to build an
SVM classifier. The classifier predicted with high accuracy
(73%) whether or not a post on Twitter could be
depression-indicative. Thereafter, the trained model was
leveraged in a population-scale measurement metric of
depression—called the social media depression index.
Variety of analyses around geography, gender and time
showed that SMDI can closely mirror CDC defined
statistics on depression. In the future, we are interested in
developing individual-centric predictive models that
analyse a person’s social media feeds, and provide early
warning/intervention if there are behavioral concerns out of
the ordinary. Modeling the contagion of depressive
disorders in social media is also an exciting future direction.
REFERENCES
1. Billings, A., Moos, Rudolf H. (1984). Coping, stress,
and social resources among adults with unipolar
depression. Journal of Personality and Social
Psychology, 46(4), 877-891.
2. Centers for Disease Control and Prevention (CDC).
Behavioral Risk Factor Surveillance System Survey
Data. Atlanta, Georgia: U.S. Department of Health and
Human Services, Centers for Disease Control and
Prevention, 2008, 2011, 2012.
3. Chung, C.K., & Pennebaker, J.W. (2007). The
psychological functions of function words. In K. Fielder
(Ed.), Social communication (pp. 343-359).
4. Collier, N., Son, N., & Nguyen, N. (2011). OMG U got
flu? Analysis of shared health messages for bio-
surveillance. Journal of Biomedical Semantics.
5. De Choudhury, M., Counts, S., and Gamon, M. (2012).
Not All Moods are Created Equal! Exploring Human
Emotional States in Social Media. In Proc. ICWSM ‘12.
6. De Choudhury, M., Counts, S., & Horvitz, E. (2013).
Predicting Postpartum Changes in Behavior and Mood
via Social Media. In Proc. CHI 2013, to appear.
7. Duda, Richard O., Hart, Peter E., & Stork, David G.
(2000). Pattern Classification. 2nd Edition, Wiley.
8. Fujita, F., Diener, E. and Sandvik, E. (1991). Gender
differences in negative affect and wellbeing: The case
for emotional intensity. Journal of Personality and
Social Psychology, 61: 427–434.
9. González HM, Vega WA, Williams DR, Tarraf W, West
BT, & Neighbors HW (2010). Depression Care in the
United States: Too Little for Too Few. Archives of
General Psychiatry 67 (1): 37–46.
10. Kawachi, I., and Berkman, L. S. (2001). Social ties and
mental health. Journal of Urban Health, 78(3), 458-467.
11. Kessler, R.C., Berglund, P., Demler, O. et al. (2003).
The Epidemiology of Major Depressive Disorder:
Results from the National Comorbidity Survey
Replication (NCS-R). Journal of the American Medical
Association 289 (23): 3095-3105.
12. Kramer, A. (2010). An Unobtrusive Behavioral Model
of “Gross National Happiness”. In Proc. CHI 2010.
13. Krieck, M., Dreesman, J., Otrusina, L., & Denecke, K.
(2011). A new age of public health: Identifying disease
outbreaks by analyzing tweets. In Proc. Health Web-
Science Workshop, ACM Web Science Conference.
14. Luoma JB, Martin CE, Pearson JL (2002). Contact with
mental health and primary care providers before suicide:
a review of the evidence. The American Journal of
Psychiatry 159 (6): 909–16.
15. Lustberg L, & Reynolds CF (2000). Depression and
insomnia: questions of cause and effect. Sleep Medicine
Reviews 4 (3): 253–262.
16. Mathers, C.D., Loncar, D. (2006). Projections of global
mortality and burden of disease from 2002 to 2030.
PLoS Med 3 (11).
17. Niels Rosenquist, J., Fowler, J. & Christakis, N. (2011).
Social Network Determinants of Depression. Molecular
Psychiatry 16 (3): 273–281.
18. Oxman T.E., Rosenberg S.D., & Tucker G.J. (1982). The language of paranoia. American J. Psychiatry 139:275–82.
19. Park, M., Cha, C., & Cha, M. (2012). Depressive Moods
of Users Captured in Twitter. In Proc. ACM SIGKDD
Workshop on Healthcare Informatics (HI-KDD).
20. Paul, M., J., & Dredze, M. (2011). You are What You
Tweet: Analyzing Twitter for Public Health. In Proc.
ICWSM ’11.
21. Pew Research Center Report on Twitter use:
http://pewinternet.org/Reports/2010/Twitter-Update-
2010/Findings/Overview.aspx
22. Radloff, L.S. (1977). The CES-D scale: A self-report
depression scale for research in the general population.
Applied Psychological Measurement 1: 385-401.
23. Rude, S., Gortner, E., & Pennebaker, J. (2004).
Language use of depressed and depression-vulnerable
college students. Cognition and Emotion, 1121-1133.
24. Sadilek, A., Kautz, H., & Silenzio, V. (2012). Modeling
Spread of Disease from Social Interactions. In Proc.
ICSWM ’11.
25. Wehr TA, Rosenthal NE. (1989). Seasonality and
Affective Illness. Am J Psychiatry. 146(7):829-39.


![forum.konkurdl.konkur.in/PHD/99/255-PHD99-[konkur.in].pdfMil-elevation in boiling point measurement (i M -elevation in boiling point measurement (r Mu-depression in boiling point measurement](https://img.pdfslide.us/doc/110x75/5f93ea11ba287c28636723e6/forum-konkurinpdf-mil-elevation-in-boiling-point-measurement-i-m-elevation.jpg)