Embed Size (px)
Citation preview
Social Social InstitutionInstitutionss
Chapters 12 through Chapters 12 through 1414Chapters 12 through Chapters 12 through 1414

Social Social InstitutionsInstitutions•TraditionTradition
•TodayToday
FunctionsFunctions•Manifest Manifest (_______)(_______)
•Latent Latent (________)(________)

The The FamilyFamily
•FunctionsFunctions
Family Family CompositionComposition
•Nuclear v. ExtendedNuclear v. Extended
•Monogamy v. Monogamy v. ______________________________
•PolygamyPolygamy
–________ v. Polyandry________ v. Polyandry
–__________ Living__________ Living
Marriage and Marriage and FamilyFamily
• In US, In US, % marry% marry
• ____________ (still the norm)____________ (still the norm)– Reinforces group cohesivenessReinforces group cohesiveness
• ______________________– Incest TabooIncest Taboo
• ________ Marriages Increasing________ Marriages Increasing
Delaying Delaying MarriageMarriage
•Median Age of First MarriageMedian Age of First Marriage
–1890- 1890- Women Women Men Men
–1960- 1960- Women Women Men Men
–2000- 2000- Women ___ Men Women ___ Men
““American” American” FamilyFamily•Traditional Traditional FamilyFamily
•ChangesChanges

Duel Income Duel Income FamiliesFamilies
•Why?Why?
Domestic Domestic ViolenceViolence•____________ most at risk____________ most at risk
•Includes all economic groupsIncludes all economic groups
•Violence _______ over timeViolence _______ over time
–___% of all murders (1998) ___% of all murders (1998) were intimate-partner were intimate-partner violence. ___% of victims violence. ___% of victims were womenwere women

Single Parent Single Parent FamiliesFamilies
• __% of White Families__% of White Families
• __% of Hispanics__% of Hispanics
• __% of Blacks__% of Blacks
• __% headed by Women__% headed by Women
•Stigma reducedStigma reduced
•Single Fathers more ________Single Fathers more ________
DivorceDivorce•Greater social _________Greater social _________
•More “____________”More “____________”
•Growing worldwide Growing worldwide acceptanceacceptance
•More ______divorce lawsMore ______divorce laws
Divorce Divorce StatisticsStatistics•Teens who wed _____ likelyTeens who wed _____ likely
•College Education ____ likelyCollege Education ____ likely
•Grad school women ____ likely Grad school women ____ likely to divorceto divorce
• __% women, __% men will __% women, __% men will remarryremarry
• __% of remarriages will end in __% of remarriages will end in divorcedivorce
““Cyclical” Cyclical” ProblemProblem•Kids of Divorce _____ Kids of Divorce _____ likely to divorce, likely to divorce, esp. in marriages esp. in marriages where both spouses where both spouses come from _________ come from _________ familiesfamilies
•Due in part to _______Due in part to _______
CohabitationCohabitation•Number ________ dramaticallyNumber ________ dramatically
• __% of people 25-40 have __% of people 25-40 have cohabitatedcohabitated
•Same trend in other countriesSame trend in other countries
• ________ couples more likely ________ couples more likely than college studentsthan college students
• ________ also in older people________ also in older people
Reproductive Reproductive TechnologyTechnology
•__________ and multiple __________ and multiple birthsbirths
•The “_____” ProgramThe “_____” Program
•_________ of Sex, etc _________ of Sex, etc possiblepossible
•Many ________ issuesMany ________ issues
Question:Question:
•Should Should the _______ the _______ _______ _______ continue?continue?

““Good Old” Good Old” DaysDays
•1950’s “Perfect” 1950’s “Perfect” FamilyFamily
Today’s Family Today’s Family (2000)(2000)
EducationEducation•FunctionsFunctions
•Hidden CurriculumHidden Curriculum
•Traditional American Traditional American EducationEducation
–__________________
Changes in Changes in EducationEducation
•““A ___________” - A ___________” - 19831983
–No major progress over No major progress over next 10-12 yearsnext 10-12 years
•Gradual __________ in Gradual __________ in recent yearsrecent years
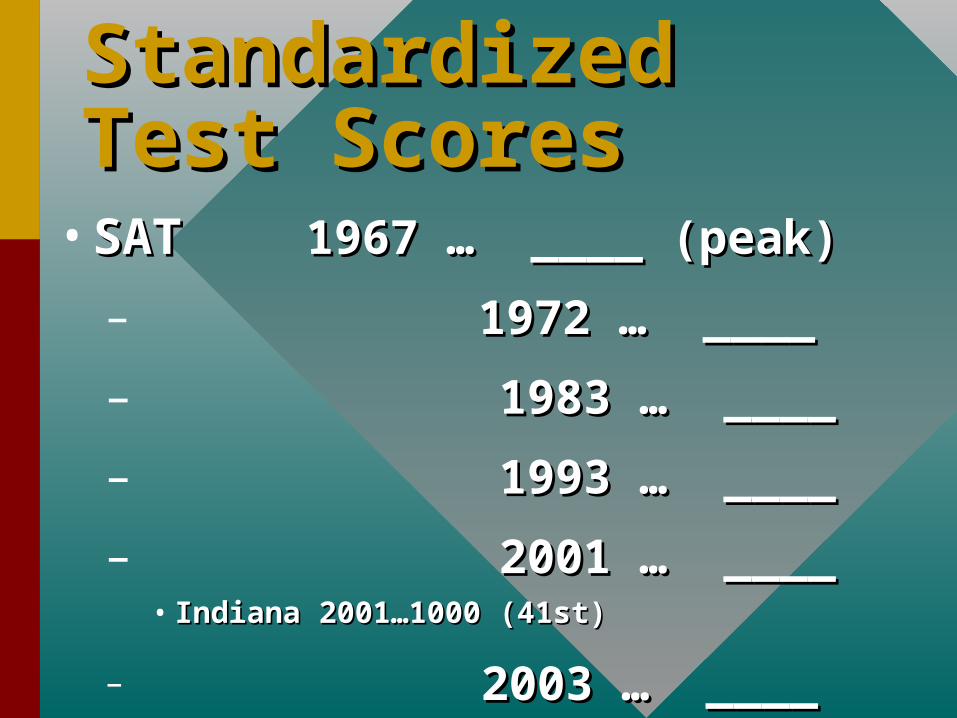
Standardized Standardized Test ScoresTest Scores
• SATSAT 1967 … ____ (peak)1967 … ____ (peak)
– 1972 … ____1972 … ____
– 1983 … ____1983 … ____
– 1993 … ____1993 … ____
– 2001 … ____2001 … ____• Indiana 2001…1000 (41st)Indiana 2001…1000 (41st)
– 2003 … ____2003 … ____
Numbers Numbers taking Testtaking Test
•Will affect ___________Will affect ___________
•Can you compare with Can you compare with other _______?other _______?
•Can you compare Can you compare ______________?______________?
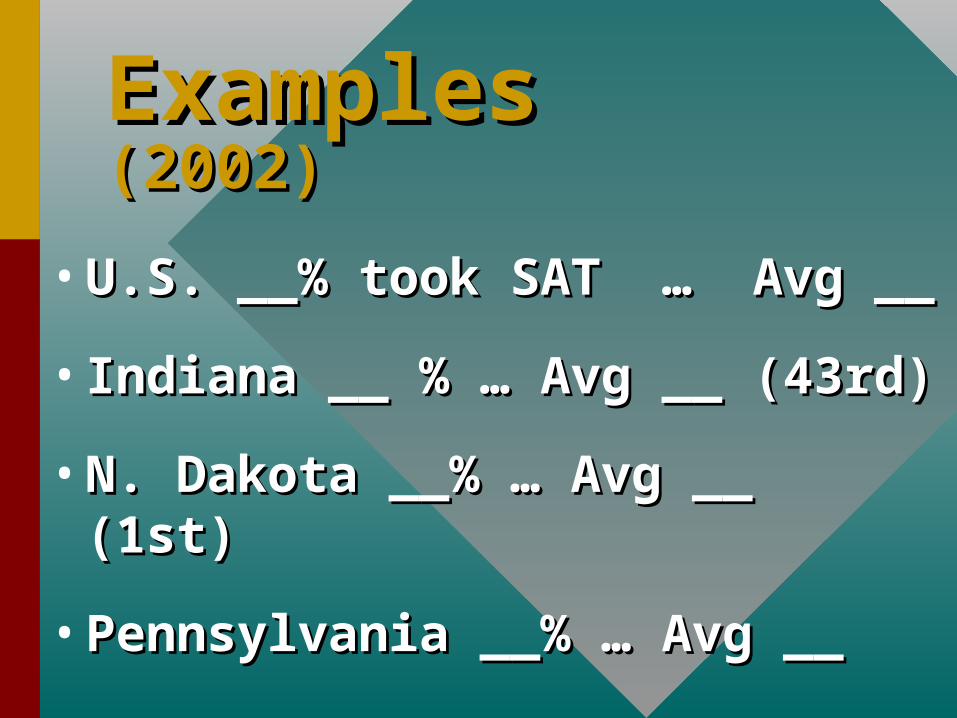
Examples Examples (2002)(2002)
• U.S. __% took SAT … Avg __U.S. __% took SAT … Avg __
• Indiana __ % … Avg __ (43rd)Indiana __ % … Avg __ (43rd)
• N. Dakota __% … Avg __ (1st)N. Dakota __% … Avg __ (1st)
• Pennsylvania __% … Avg __ Pennsylvania __% … Avg __
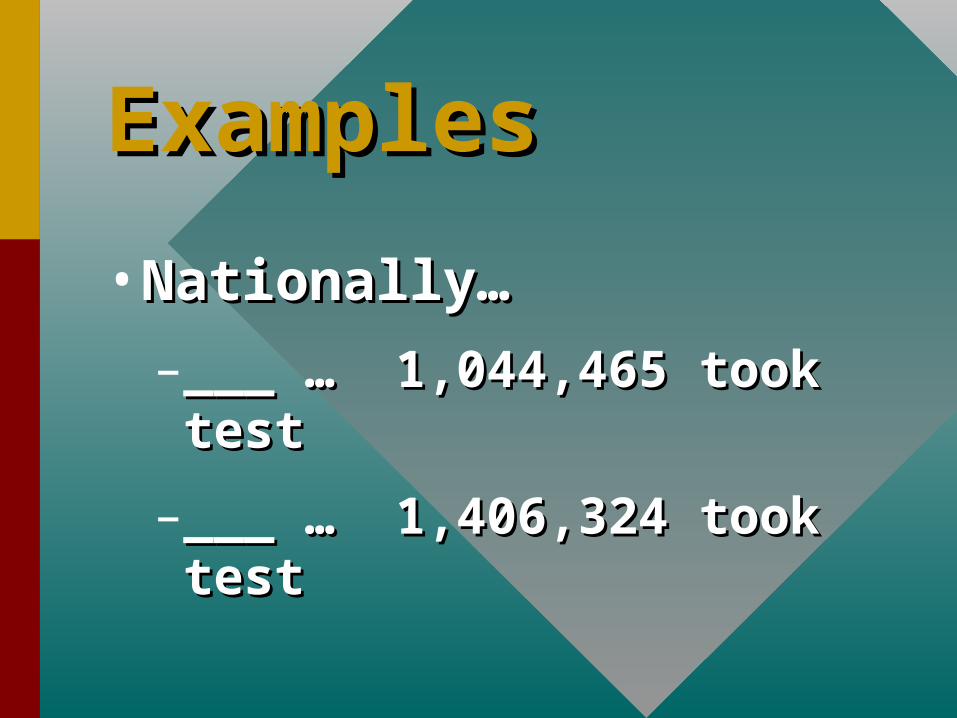
ExamplesExamples
•Nationally…Nationally…
–___ … 1,044,465 took test___ … 1,044,465 took test
–___ … 1,406,324 took test___ … 1,406,324 took test
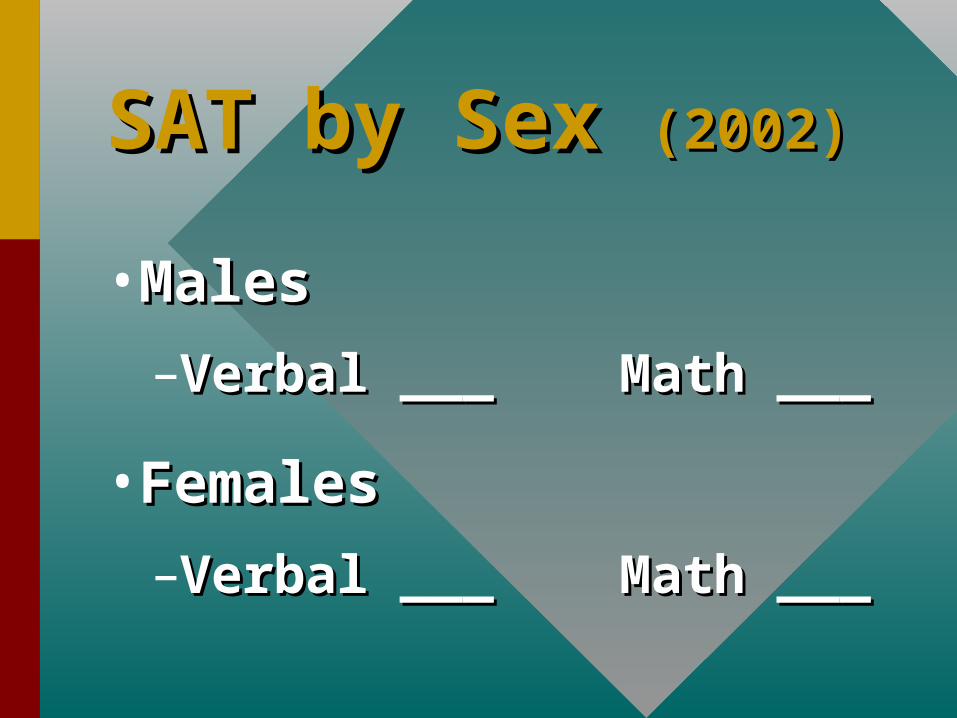
SAT by Sex SAT by Sex (2002)(2002)
•MalesMales
–Verbal ___ Math ___Verbal ___ Math ___
•FemalesFemales
–Verbal ___ Math ___Verbal ___ Math ___
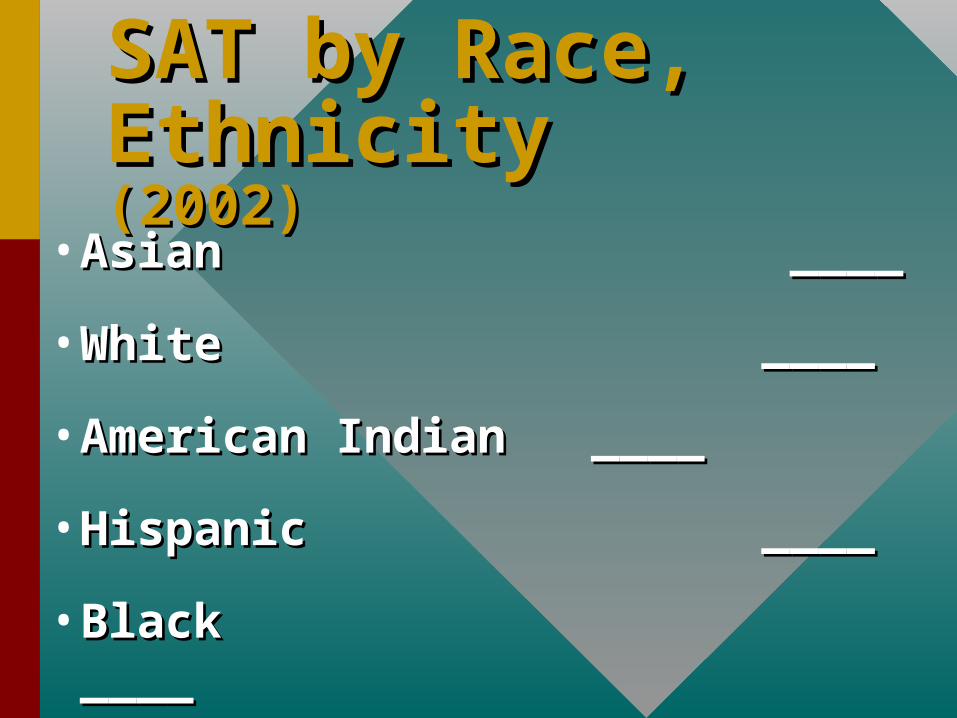
SAT by Race, SAT by Race, EthnicityEthnicity (2002) (2002)
•Asian ____Asian ____
•White ____White ____
•American Indian ____American Indian ____
•Hispanic ____Hispanic ____
•Black ____Black ____

Predictors of Predictors of College Success College Success (IUPUI)(IUPUI)

Educational Educational AlternativesAlternatives•_________ Schools_________ Schools
•School Choice School Choice (___________)(___________)
•Home SchoolingHome Schooling

ReligionReligion

Cultural Change Cultural Change within U.S.within U.S.

GovernmentGovernment•FunctionsFunctions
•Types (2 Basic Types)Types (2 Basic Types)
–______________________
–AuthoritarianAuthoritarian
EconomyEconomy
•FunctionsFunctions
•________ v. _______________ v. _______
•Globalization of Globalization of EconomyEconomy