Embed Size (px)
Citation preview

Social inequalities in Central and Eastern Europe during societal transformation
Martin Bobak
Department of Epidemiology and Public Health

• Macro-economic changes• Deaths and births• Russian mortality crisis• Social inequalities
– Between populations
– Within populations
• Proposed explanations

Central and Eastern Europe in 1990
0
0.1
0.2
0.3
0.4
0.5
0.6
0 20 40 60 80 100 120
GDP per capita (PPP), West=100%
Gin
i co
effi
cien
t
??
CEE
West
LA
From Unicef

Poland and Czech Rep. 1989-2000 (Data from UNICEF)
0
0.1
0.2
0.3
0.4
0.5
0.6
0 20 40 60 80 100 120
GDP per capita (PPP), West=100%
Gin
i co
effi
cien
t
West
LA
Poland1989
Poland2000
Czech1989
Czech 2000

Russia 1989-2000 (Data from UNICEF)
0
0.1
0.2
0.3
0.4
0.5
0.6
0 20 40 60 80 100 120
GDP per capita (PPP), West=100%
Gin
i co
effi
cien
t
West
LA
Russia1989
Russia2000

Poland and Czech Rep. 1989-2007 (Data from UNICEF)
0
0.1
0.2
0.3
0.4
0.5
0.6
0 20 40 60 80 100 120
GDP per capita (PPP), West=100%
Gin
i co
effi
cien
t
West
LA
PL1989
PL2000
CZ1989
CZ 2000
PL2007
CZ 2007

Russia 1989-2007 (Data from UNICEF)
0
0.1
0.2
0.3
0.4
0.5
0.6
0 20 40 60 80 100 120
GDP per capita (PPP), West=100%
Gin
i co
effi
cien
t
West
LA
RU1989
RU2000
RU 2007
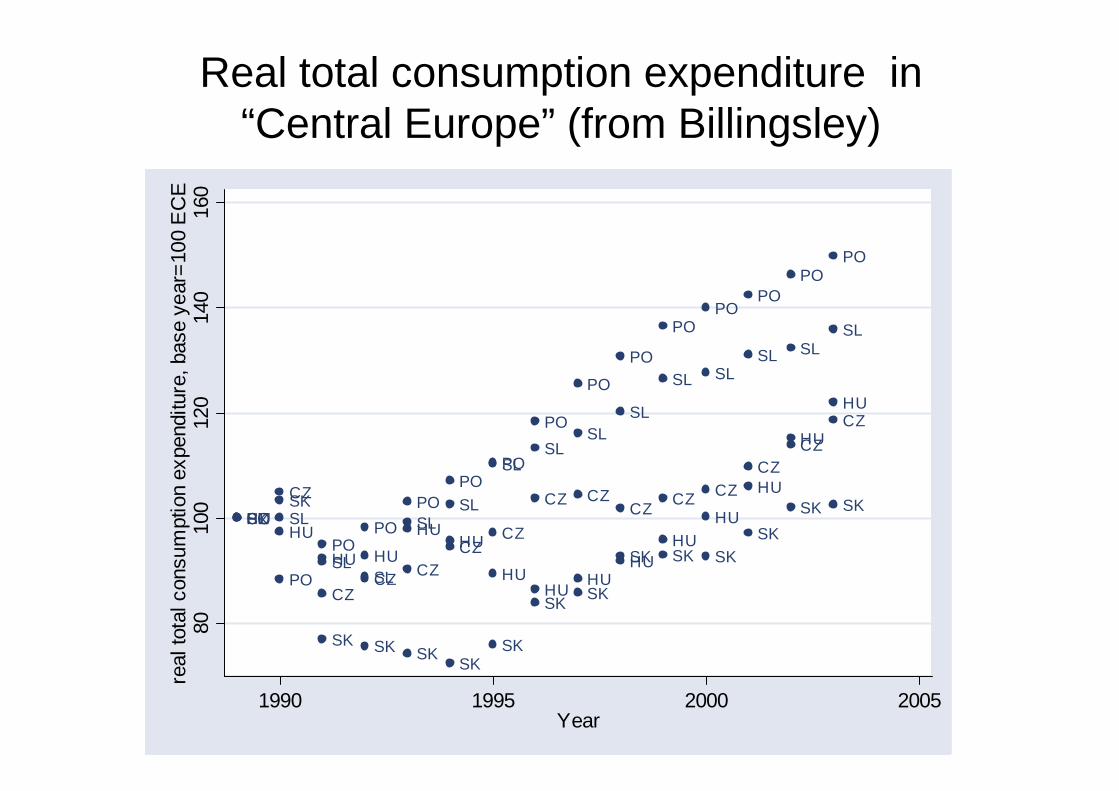
Real total consumption expenditure in “Central Europe” (from Billingsley)
CZSKHUPO SLHU
SKCZ
POCZ
SLPO
SK
HU
SK
HU
PO
SLCZ
SK
PO
CZ
SLHUCZ
SL
PO
SK
HU CZ
POSL
HU
SK
SKHU
SL
CZ
PO
SK
PO
HU
SL
CZ
HU
CZ
SK
PO
SL
SK
SL
CZ
HU
PO
SK
PO
SL
CZ
HU
PO
CZ
SK
HU
SL
SK
CZ
SL
HU
PO
CZ
PO
HU
SL
SK
8010
012
014
016
0re
al to
tal c
onsu
mpt
ion
expe
nditu
re, b
ase
year
=10
0 E
CE
1990 1995 2000 2005Year

Real total consumption expenditure in “Eastern Europe” (from Billingsley)
ROBU BE
RO
RULAUKKABU
LA
BUBEUKROKARU
RU
LA
KABUUKROBE
LA
BU
MO
RO
BE
ESRU
KA
UK
MO
RU
BU
LA
BEUK
ES
KA
RO
ES
MO
LA
BU
RO
RU
BEUK
LI
KA UK
LIMO
ES
LA
RU
RO
BE
BU
KA LA
RU
LI
BU
ES
KA
BE
RO
UK
MO
BU
UK
BE
KALA
LI
ES
MO
RU
RO
RU
BU
KA
MO
LI
BE
ES
LAUK
RO
LA
BU
UK
BE
KA
RO
RU
LI
ES
MO
LI
BU
RO
UK
RU
MO
LA
BE
ES
KA
BU
RU
UKKALA
LI
ROMO
ES
BEBE
LA
ES
RO
RU
LI
BU
KAUK
MO
5010
015
020
0re
al to
tal c
onsu
mpt
ion
expe
nditu
re, b
ase
year
=10
0 E
CE
1990 1995 2000 2005Year

Deaths…
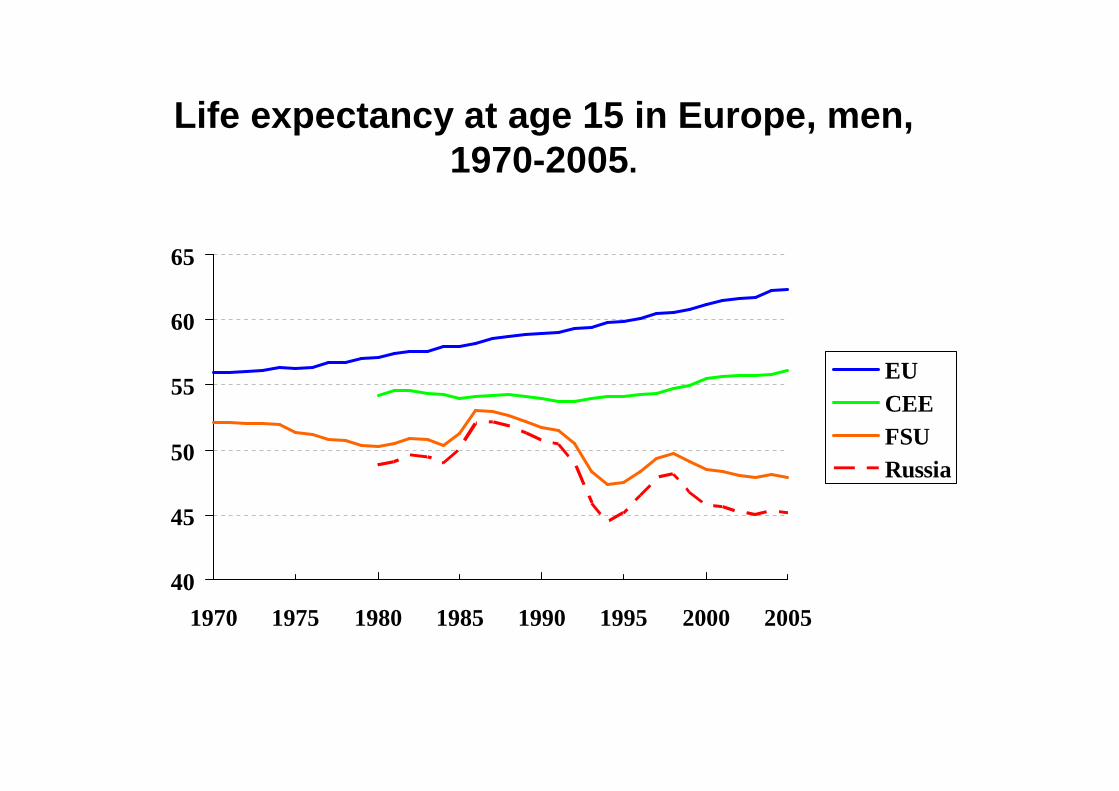
Life expectancy at age 15 in Europe, men, 1970-2005.
40
45
50
55
60
65
1970 1975 1980 1985 1990 1995 2000 2005
EUCEEFSURussia
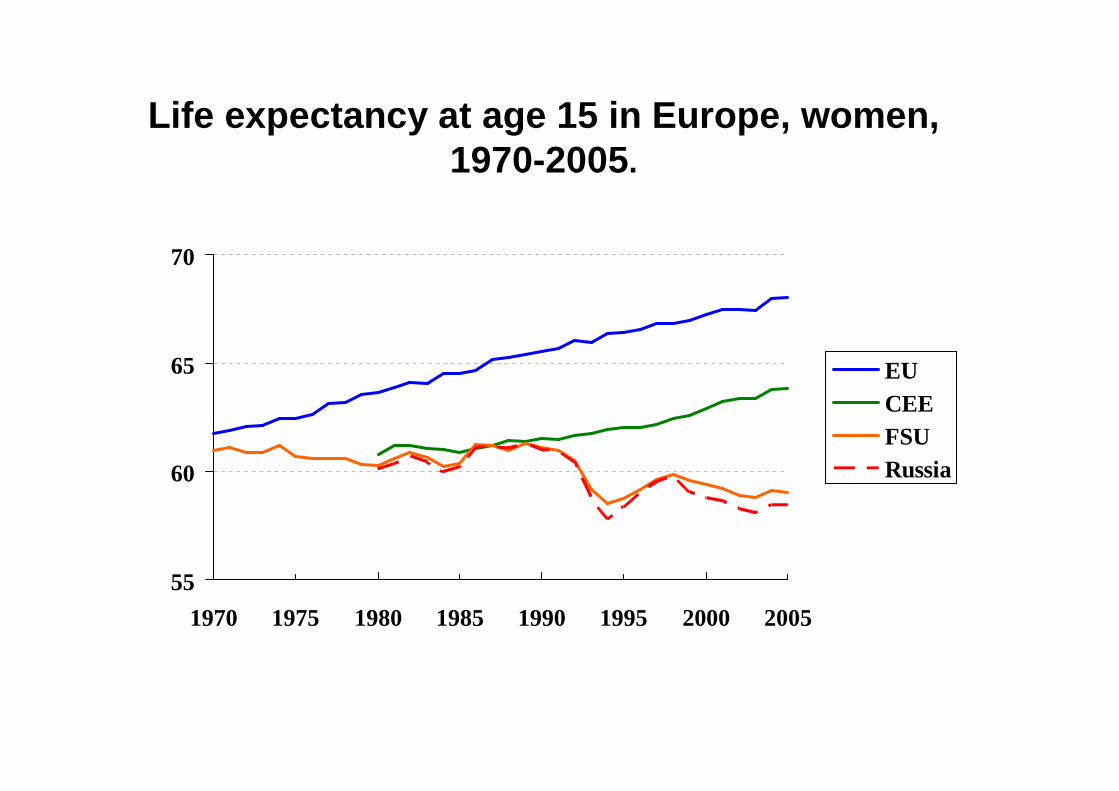
Life expectancy at age 15 in Europe, women, 1970-2005.
55
60
65
70
1970 1975 1980 1985 1990 1995 2000 2005
EUCEEFSURussia
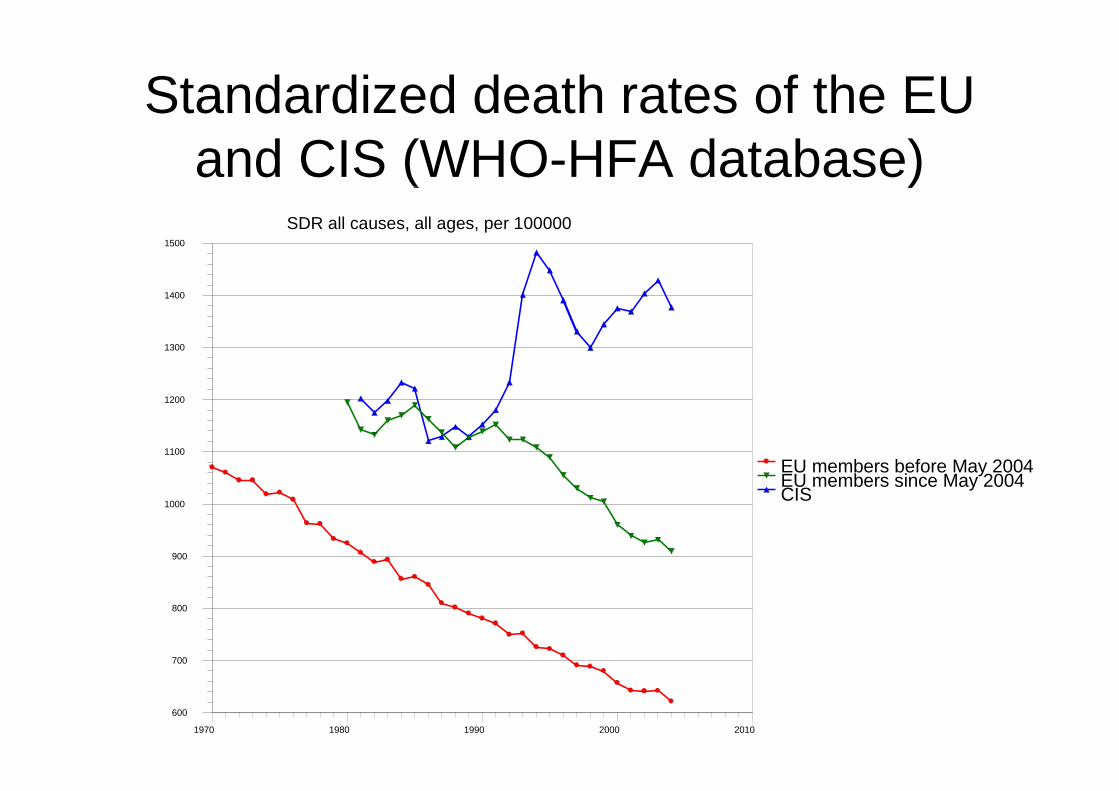
Standardized death rates of the EU and CIS (WHO-HFA database)
600
700
800
900
1000
1100
1200
1300
1400
1500
1970 1980 1990 2000 2010
EU members before May 2004 EU members since May 2004 CIS
SDR all causes, all ages, per 100000

Several patterns of mortality trends
• Group 1: minimal increase, general decline: Generally Central Europe (Bulgaria, Czech Republic, Hungary, Poland, Romania, Slovakia and Slovenia).
• Group 2: increase but decline since mid-1990s: Generally the Baltics plus Armenia, Azerbaijan, Georgia
• Group 3: sustained increase / fluctuations:larger parts of FSU: Belarus, Kazakhstan, Kyrgyzstan, Moldova, Russia, Ukraine.

Life expectancy by type of transition
54
56
58
60
62
64
66
68
70
72
1990 1991 1992 1993 1994 1995 1996 1997 1998 1999 2000 2001 2002 2003 2004 2005
Mal
e li
fe e
xpec
tan
cy a
t b
irth
TT1 life expectancy
TT2 life expectancy
TT3 life expectancy

…and births

Change in fertility after 1989
5
7
9
11
13
15
17
1989
1990
1991
1992
1993
1994
1995
1996
1997
1998
1999
2000
2001
2002
2003
2004
2005
2006
2007
Calendar year
Cru
de
bir
th r
ate
Czech Poland Hungary Estonia Russia
Crude birth rate = live births / 1000 population From Unicef, TransMONEE database
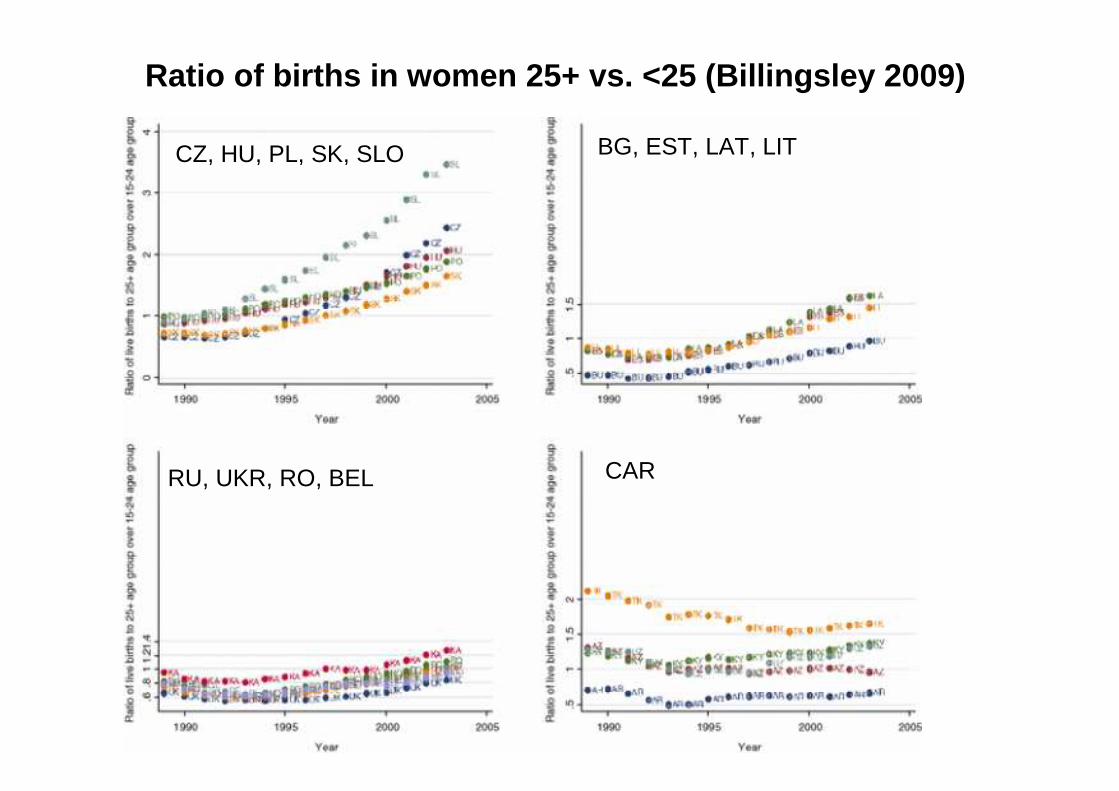
Ratio of births in women 25+ vs. <25 (Billingsley 2009)
CZ, HU, PL, SK, SLO BG, EST, LAT, LIT
RU, UKR, RO, BEL CAR

0.00
0.25
0.50
0.75
1.00
0 50 100 150 200Months since birth of first child
pre-1991 1991+
By time periodKaplan-Meier Second Birth Estimates for Women
Missing 2nd births in Russia:
Billingsley 2009

Russian mortality crisis

Death rates in Russia 1980-2007both genders, per 100,000
800
1000
1200
1400
1600
180019
8019
8219
8419
8619
8819
9019
9219
9419
9619
9820
0020
0220
0420
0620
08
SDR Crude DR
Gorbatchevelected
Coup againstGorbatchev, breakup of USSR
Roublecrisis
3M extra deaths(Men et al, 2003)

Russian mortality from all causes, 35-69 yrs, rates per 100,000
0
500
1000
1500
2000
2500
3000
Men Women
1991199419982001

Russian mortality from all causes, 35-69 yrs, rate ratios
1 1
1.57
1.42
1.181.12
1.431.3
0.5
1
1.5
2
Men Women
1991199419982001

Proportional changes in age-specific mortality in Russia
Shkolnikov et al, 2001

Proportional change in mortality by cause of death
0.0
0.5
1.0
1.5
2.0
2.5
3.0
Infe
ctio
ns
Cance
r
CVDRes
pirato
ryDig
estiv
eLive
r cirr
h.Ext
ernal
Alcohol
poi
s.
Men Women
From Men et al, 2003
Income inequalities and health of populations
[ecological]

Relation between life expectancy at birth and percentage of post tax and benefit income received by least well off 70%
of families, 1981 (Wilkinson, BMJ 1992)
72
73
74
75
76
77
78
43 44 45 46 47 48 49 50 51
% of income received
Lif
e ex
pec
tan
cy
W Germany
USA
AustraliaCanada
UK
Switzerland
Netherlands
Sweden
Norway
r=0.86, p<0.001

INCOME INEQUALITY & MORTALITY IN CANADA & USA
Ross et al; BMJ 2000
-7-6-5-4-3-2-10123
0 0.05 0.1 0.15 0.2
Change in Gini coefficient, 1989-95
Cha
nge
in li
fe e
xpec
tanc
y at
bir
th, 1
989-
95
(yea
rs)
Slo SvkCze
Pol
Hun
RomBul
Bel EstLit
Mol
Rus
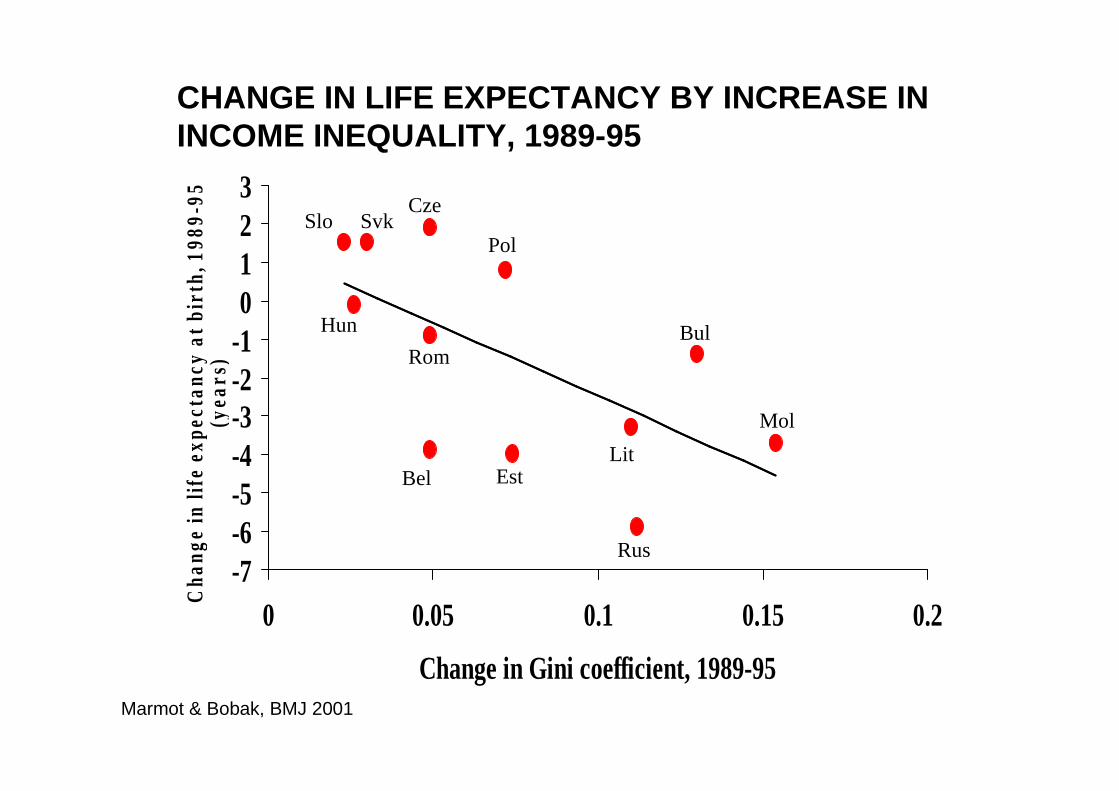
CHANGE IN LIFE EXPECTANCY BY INCREASE IN INCOME INEQUALITY, 1989-95
Marmot & Bobak, BMJ 2001

CHANGE IN LE BY SOCIAL STRESS IN 12 RUSSIAN REGIONS, 1989-94
-8
-7
-6
-5
-4
-3
-2
12 14 16 18 20 22
*UNEMPLOYMENT, LABOUR TURNOVER,CHANGE IN MARRIAGE AND DIVORCE RATE
CHANGE IN MALELIFEEXPECTANCY
(Cornia 1997)
STRESS CAUSED BY UNEXPECTED SITUATIONS

Age-sex adjusted prevalence of poor self-rated health and
life expectancy at age 15 (r -0.73, p=0.005, n=13)
BGR
CZ E
SVK
HUN
POL
ROM
SLO
BLR
UKR
RUS
ESTLVA
LIT
52
54
56
58
60
62
Lif
e e
xp
ecta
ncy
at
age
15
(ye
ars
)
10 15 20 25Prevalence of poor health (%)
Bobak et al, JECH 2007
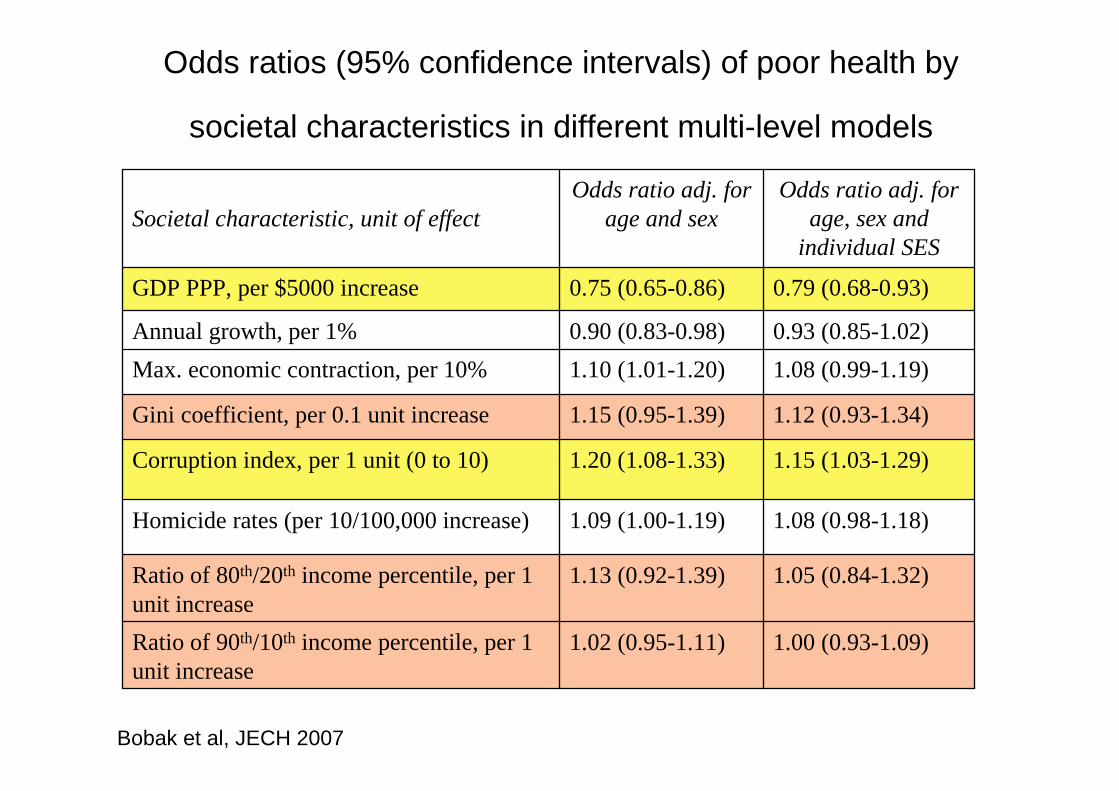
Odds ratios (95% confidence intervals) of poor health by
societal characteristics in different multi-level models
1.00 (0.93-1.09)1.02 (0.95-1.11)Ratio of 90th/10th income percentile, per 1 unit increase
1.05 (0.84-1.32)1.13 (0.92-1.39)Ratio of 80th/20th income percentile, per 1 unit increase
1.08 (0.98-1.18)1.09 (1.00-1.19)Homicide rates (per 10/100,000 increase)
1.15 (1.03-1.29)1.20 (1.08-1.33)Corruption index, per 1 unit (0 to 10)
1.12 (0.93-1.34)1.15 (0.95-1.39)Gini coefficient, per 0.1 unit increase
1.08 (0.99-1.19)1.10 (1.01-1.20)Max. economic contraction, per 10%
0.93 (0.85-1.02)0.90 (0.83-0.98)Annual growth, per 1%
0.79 (0.68-0.93)0.75 (0.65-0.86)GDP PPP, per $5000 increase
Odds ratio adj. for age, sex and
individual SES
Odds ratio adj. for age and sexSocietal characteristic, unit of effect
Bobak et al, JECH 2007
Social inequalities in health
[within populations]

Changes in mortality (SMR) in Russia by education between 1988-89 and 1993-94 (SMR in 1988-89=100; from Shkolnikov et al).
50
70
90
110
130
150
170
190
HIGHER LOWER HIGHER LOWER
88-89 93-94
+35%
+57%
+8%
+30%
MEN WOMEN
RR: 1.6 � 1.9 in men, 1.4 � 1.8 in women
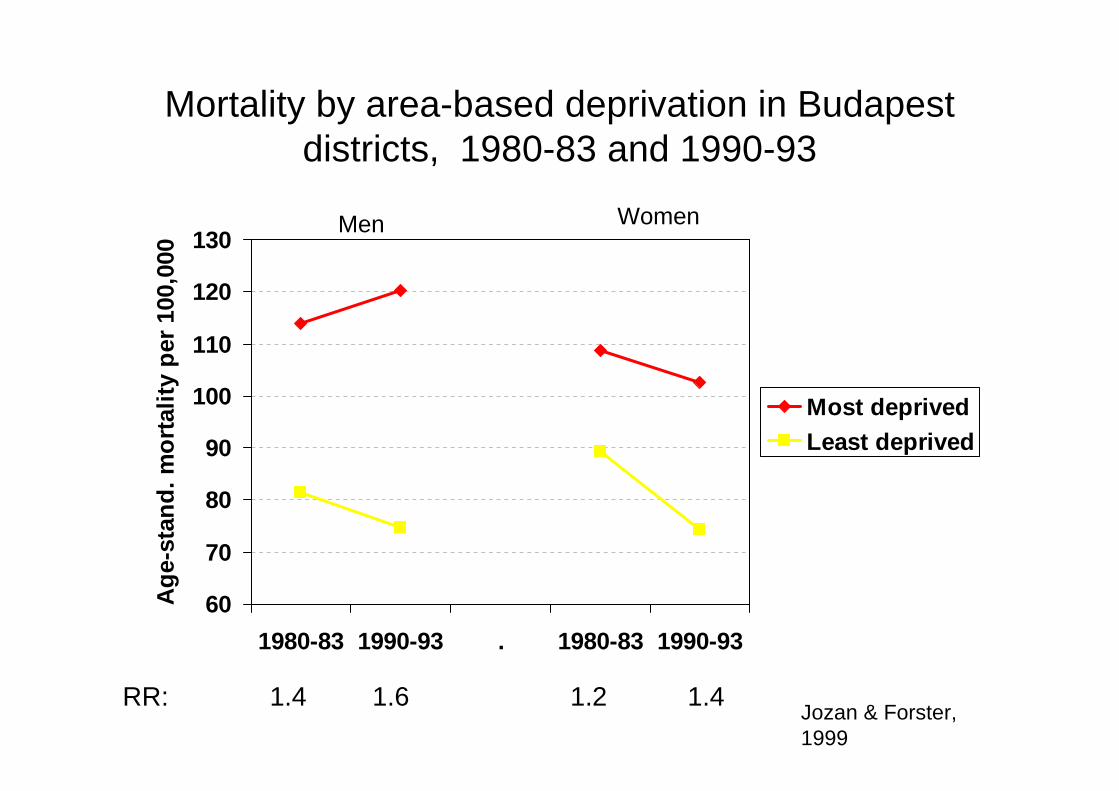
Mortality by area-based deprivation in Budapest districts, 1980-83 and 1990-93
60
70
80
90
100
110
120
130
1980-83 1990-93 . 1980-83 1990-93
Ag
e-st
and
. mo
rtal
ity
per
100
,000
Most deprivedLeast deprived
RR: 1.4 1.6 1.2 1.4
Men Women
Jozan & Forster, 1999

Mortality by education in Estonia 1989 and 2000
0
500
1000
1500
2000
2500
3000
1989 2000 . 1989 2000
Ag
e-st
and
. mo
rtal
ity
per
100
,000
PrimarySecond.Univ.
RR: Prim. 1.7 2.4 1.4 2.2Sec. 1.3 1.9 1.1 1.7 Univ. 1.0 1.0 1.0 1.0
Men Women
Leinsalu et al,2003

Increase in educational differentials in mortality between 1980s and 1990s in St
Petersburg men
0
10
20
30
40
50
60
1980s 1990s
Mor
tali
ty p
er 1
000
PrimaryHigh schoolUniversity
From Plavinski et al 2003

Trends in probability of survival in men by education (relatives’ study)
0.4
0.45
0.5
0.55
0.6
0.65
0.7
1989
1990
1991
1992
1993
1994
1995
1996
1997
1998
1999
2000
2001
Calendar year
45 p
20
45 p20 = probability of living to 65 yrs when aged 20 yrs
University
Less than secondary

Birth weight by maternal education, Czech Republic 1989-1996 (differences from primary educated)
19961995199419931992199119901989
Diff
eren
ce in
birt
hwei
ght i
n gr
amm
s 260
240
220
200
180
160
140
120
University
Secondary
Vocational

Changes by Education Group, not controlling for occupational class
0
0.25
0.5
0.75
1
1.25O
dd
s R
atio
low middle high
Pre-Transition Reference
Men Women
Changes by Education Group, controlling for occupational class
0.000.250.500.751.001.251.501.752.002.25
Od
ds
Rat
io
low middle high
Pre-Transition Reference
Men
Women
***
***
******
****** *** ***
Changes by Education Group, not controlling for occupational class
0
0.25
0.5
0.75
1
1.25O
dd
s R
atio
low middle high
Pre-Transition Reference
Men Women
Changes by Education Group, controlling for occupational class
0.000.250.500.751.001.251.501.752.002.25
Od
ds
Rat
io
low middle high
Pre-Transition Reference
Men
Women
***
***
******
****** *** ***
Billingsley 2009
Russia, Generations &Gender Survey, 2006
Fertility
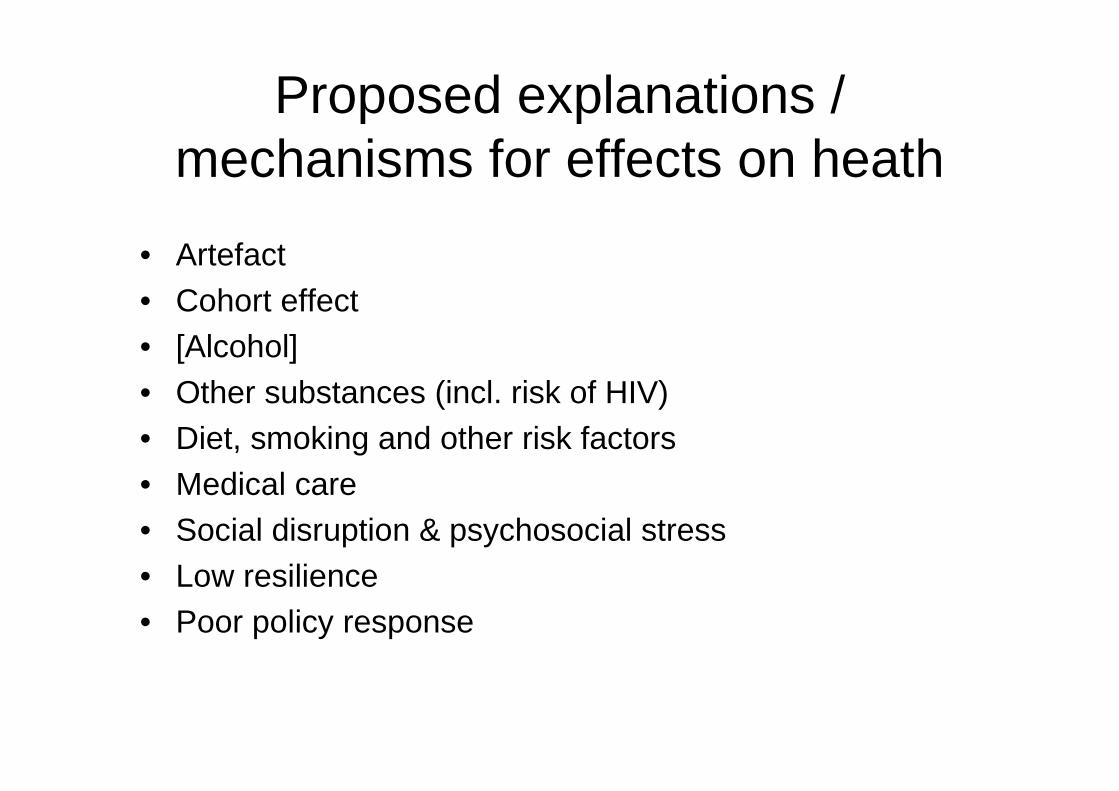
Proposed explanations / mechanisms for effects on heath
• Artefact• Cohort effect• [Alcohol]• Other substances (incl. risk of HIV)• Diet, smoking and other risk factors• Medical care• Social disruption & psychosocial stress • Low resilience • Poor policy response

Artefact
• Hypothesis: reporting before 1990 was “doctored”, increase after 1990 not genuine
• Reconstructed Russian life tables (Shkolnikov) showed that the mortality rise was real

Cohort effect
• Hypothesis: vulnerable birth cohorts (e.g. people born in the war) reached age when they died disproportionately more often than other birth cohorts
• Some evidence on some outcome (e.g. CVD in Leningrad Siege Study or height in HAPIEE)
• But the effects too weak to explain the huge rise in mortality

Substance abuse: not only alcohol
• Tobacco – >60% of men smoke– but effects long-term and lagged, not acute
• Intravenous drug use– 1.8M (1.8%) i.v. drug users in age group 15-64
yrs

Infectious diseases
• TB: – incidence 119 and mortality 22 per 100,000 in 2005– Important contribution by prison population
• HIV– About 400,000 officially registered cases– Estimates suggest >1M HIV+ persons (prevalence
~1.2% among 15-49 year olds)– 37% (~0.7M) of i.v. drug users are HIV+ (Mathers et al.
2008)– Incidence about 5 times higher than in “old” EU
• Hepatitis (related to iv drugs)
• Immunisation-preventable diseases seem under control
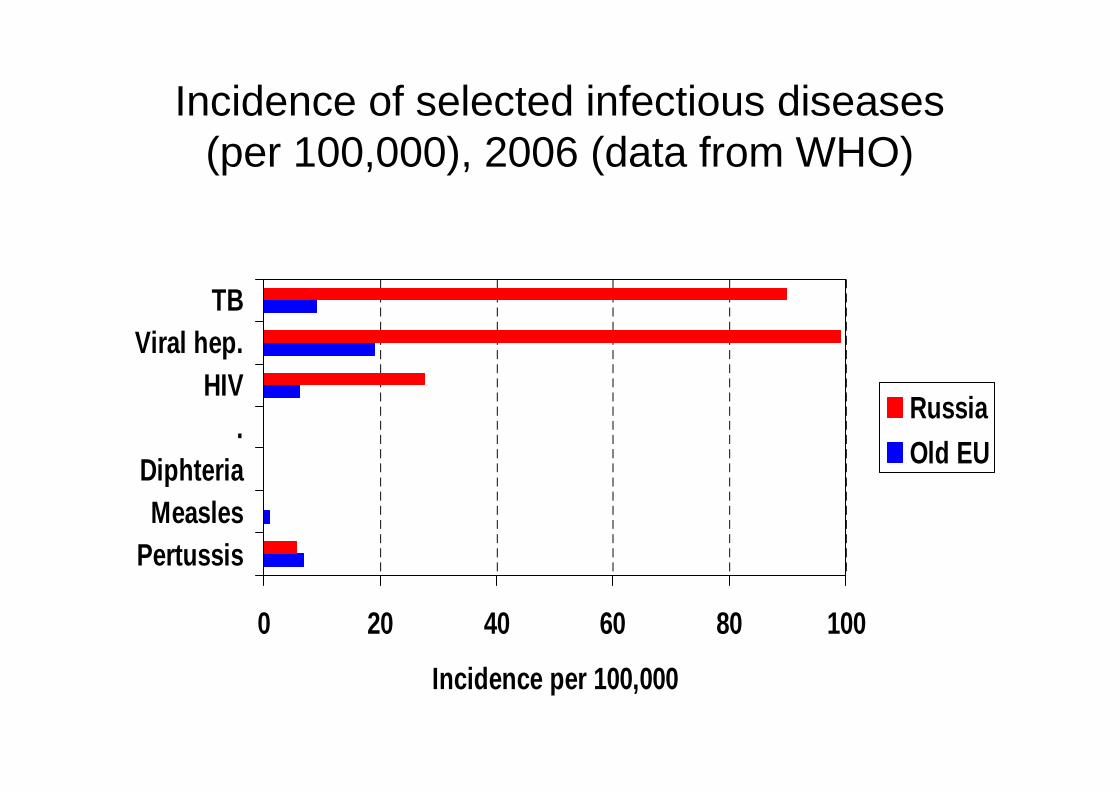
Incidence of selected infectious diseases (per 100,000), 2006 (data from WHO)
0 20 40 60 80 100
PertussisMeasles
Diphteria.
HIVViral hep.
TB
Incidence per 100,000
RussiaOld EU
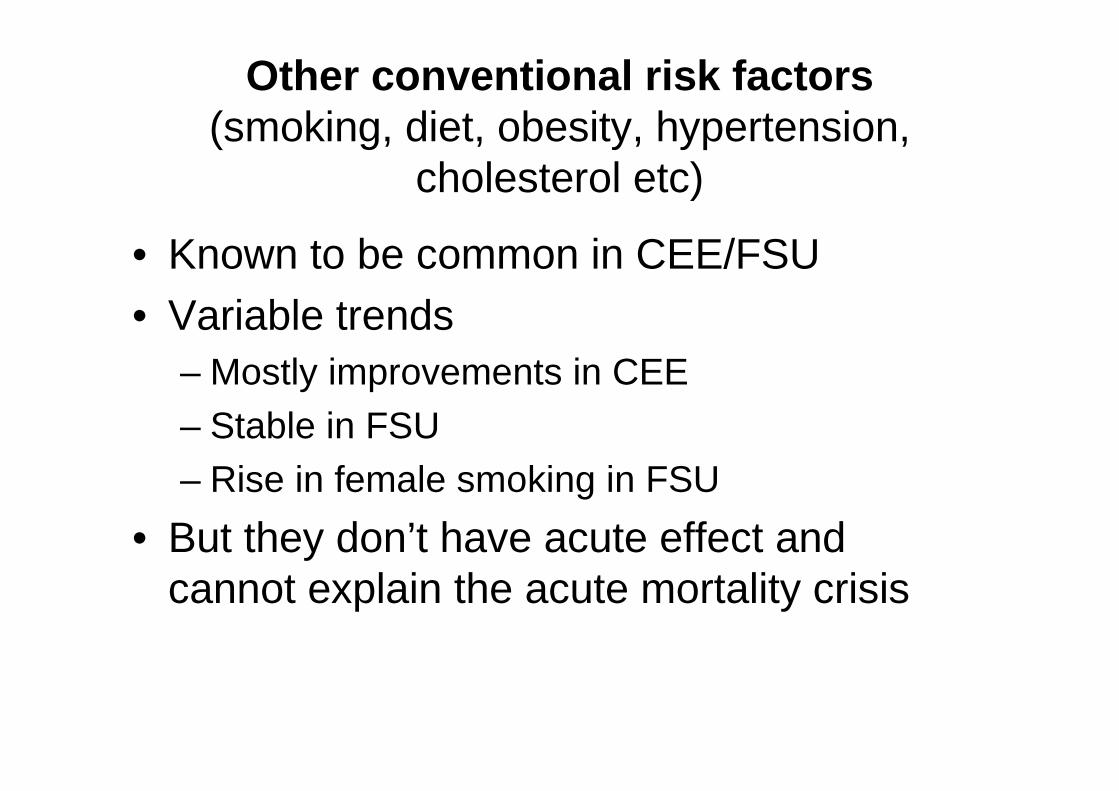
Other conventional risk factors(smoking, diet, obesity, hypertension,
cholesterol etc)
• Known to be common in CEE/FSU• Variable trends
– Mostly improvements in CEE
– Stable in FSU– Rise in female smoking in FSU
• But they don’t have acute effect and cannot explain the acute mortality crisis

Health care

‘Avoidable’ mortality
• Rutstein et al. “unnecessary, untimely deaths” (1976)
• Conditions from which, in the presence of timely and effective medical care, premature death should not occur• Single case of death (illness/disability): Why did it
happen?• Rate: not every single case preventable/
manageable � reduction of incidence

‘Avoidable’ mortality: examples
• immunisation, e.g. measles
• early detection, e.g. cervical cancer
• medical treatment, e.g. hypertension
• surgery, e.g. appendicitis

Types of ‘avoidable’ mortality
Treatable (or amenable) mortality• Deaths from causes sensitive to health care
(primary & hospital care, collective health interventions eg screening)• selected cancers (breast, colorectal, testes, cervix),
diabetes <50, hypertension/stroke, surgical conditions, maternal mortality, perinatal conditions etc.
Preventable mortality• Deaths from causes sensitive to public health or
inter-sectoral policies• Lung cancer, liver cirrhosis, transport injuries

What happened where medical care failed to modernise?
• Death rate from avoidable mortality in UK and Russia similar in 1965, when little could be done
• Gap began to widen in 1970s, and has continued to do so since
0
100
200
300
400
500
600
700
1965 1975 1985 1995
Year
deat
hs/1
00,0
00
Russia United Kingdom
Source: Andreev et al. 2003

Prevalence, awareness and treatment of high total cholesterol and hypertension in Novosibirsk and Czech
Republic, both sexes, 45-69 yrs, 2002-05, (%)
0
20
40
60
80
100
Russia Czech R. . Russia Czech R.
PrevalenceAwareness*Treatment*Control*
* Among positives
Cholesterol ≥ 5 mmol/l Blood pressure ≥140/90

Social stress
• Social disruption• Anomie• Distrust• Low social capital• Low social cohesion• High levels of inequalities• Low optimism / perceived control / mastery• Depression / hostility …

-7-6-5-4-3-2-10123
0 0.05 0.1 0.15 0.2
Change in Gini coefficient, 1989-95
Cha
nge
in li
fe e
xpec
tanc
y at
bir
th, 1
989-
95
(yea
rs)
Slo SvkCze
Pol
Hun
RomBul
Bel EstLit
Mol
Rus
CHANGE IN LIFE EXPECTANCY BY INCREASE IN INCOME INEQUALITY, 1989-95
Marmot & Bobak, BMJ 2001

PERCEIVED CONTROL IN NATIONAL
SAMPLES AND ALL CAUSE MORTALITY
1000
1100
1200
1300
1400
1500
1600
3 3.5 4 4.5 5
RU
LI
LA
ES
HU
PO
CZ
CONTROL (AGE-SEX ADJUSTED)
Pikhart, 2000
SDR
all
caus
es (
per
100,
000)

EVERYTHING changed, not just alcohol…
• Political changes• Fall in income and wages, rise in
deprivation (and diseases caused by deprivation)
• Increase in inequalities• Unemployment, insecurity, uncertainty• All this leading to “social stress”

Reaction to economic change, Russia 2001
9
48
10
32
Pro-marketNostalgicNegativePositively indifferent
From Rose 2001
Social disruption
• Some countries (mainly in the FSU) seem very susceptible to societal shocks
• Mortality fluctuations in Russia probably the largest ever recorded
• May be vulnerable in the future
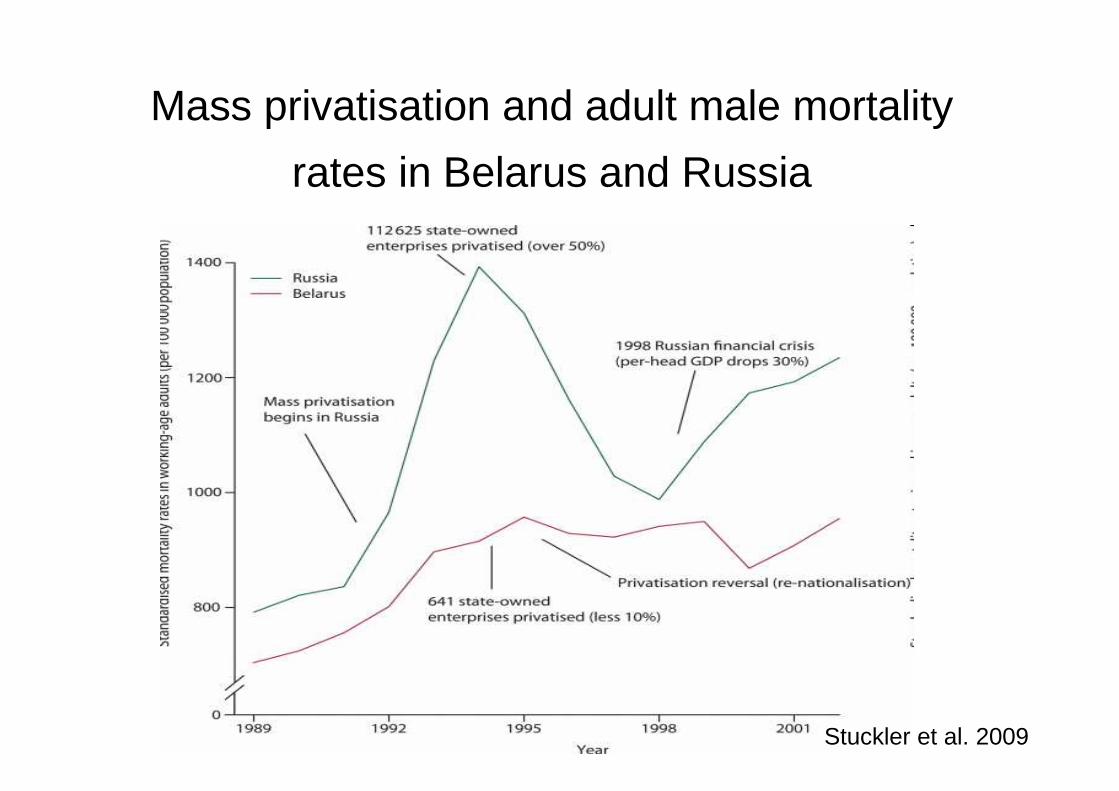
Mass privatisation and adult male mortality
rates in Belarus and Russia
Stuckler et al. 2009

Interaction between mass privatisation and social capital
Stuckler et al 2009

Unemployment and mortality in Russia
0
1
2
3
4
Unemployment Paid in goods . Unemployment Paid in goods
Adj.1 Adj. 1 + alcohol
Overall Within 1 year
Perlman & Bobak 2009
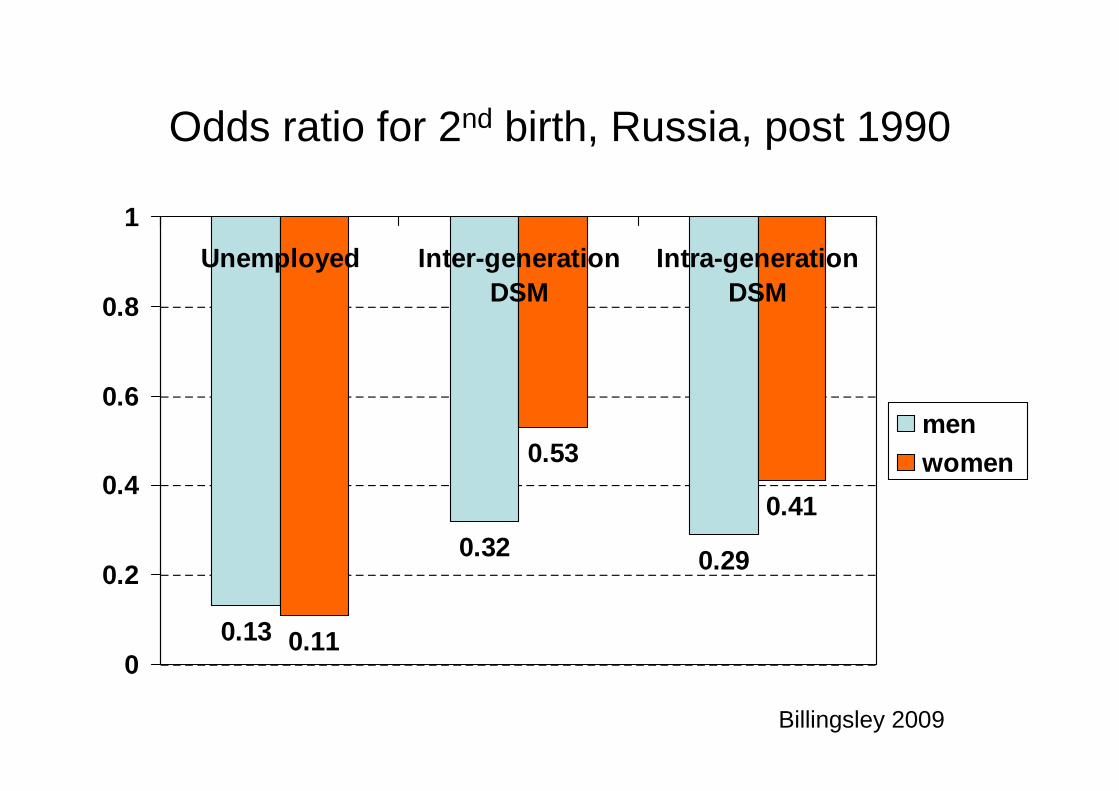
Odds ratio for 2nd birth, Russia, post 1990
0.13
0.32 0.29
0.11
0.53
0.41
0
0.2
0.4
0.6
0.8
1
Unemployed Inter-generationDSM
Intra-generationDSM
menwomen
Billingsley 2009
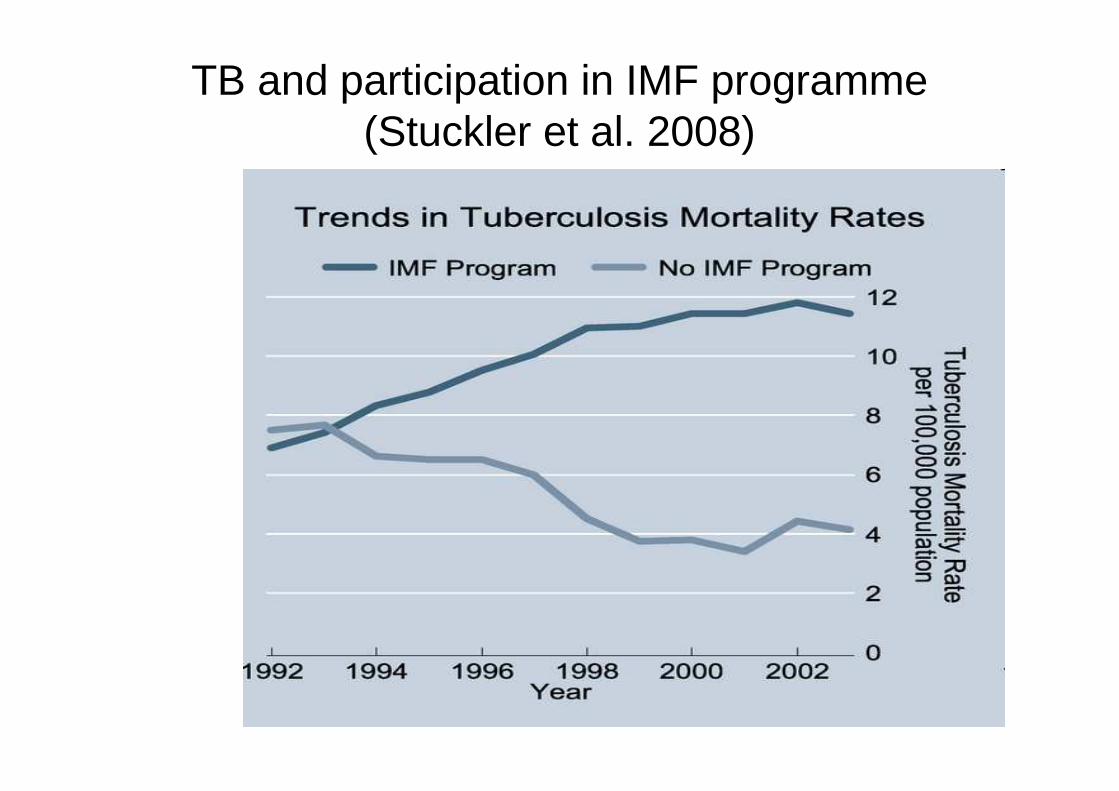
TB and participation in IMF programme (Stuckler et al. 2008)

Poor policy response
• Poor management of the transition• Very rapid privatisation• Corruption• Massive loss of employment• Rapid deterioration of social and health
services• No safety nets• Concerns about fertility, not mortality

Low resilience
• Russian population always prone to large fluctuations in mortality
• Impact clearly differed by geography and SES
• Few resources available• No past pattern of coping• Potential accumulation of disadvantage of
the life course

Social structure
Social Environment
Work
HealthBehaviours
Patho-physiologicalchangesOrgan impairment
Well-beingMortalityMorbidity
Genes
Early Life
Culture
BrainNeuro-endocrine and immune
Psychological
Material factors
Multiple influences on health
Alcohol
Depression
UnemploymentJob stress
ViolenceInequalitiesLow cohesion
CorruptionExclusionMass privatisation
Deprivation
Cognition
Growingup in war(or 1950s)

Conclusions
• Rapid unexpected changes in social environment
• Increase in absolute deprivation• Rise in inequalities and relative deprivation• Rise in uncertainty / insecurity• Many resent the new regime
• Proximal mechanisms not clear, may include: alcohol, drugs, nutrition, other risk factors, medical care, direct effect of stress …???