Embed Size (px)
Citation preview
SOCIAL INDICATORS OF
FARM-LEVEL
SUSTAINABILITY Beatriz HERRERA
1, Maria GERSTER-BENTAYA
1, Andrea KNIERIM
1,2
1 Universität Hohenheim, Germany
2 ZALF, Germany
28 December 2016
Public
D5.2E
FLINT is funded by the European Commission’s 7th
2 Social indicators of farm-level sustainability
ABOUT THE FLINT PROJECT
FLINT will provide an updated data-infrastructure needed by the agro-food sector and policy makers to provide up to date information on farm level indicators on sustainability and other new relevant issues. Better decision making will be facilitated by taking into account the sustainability performance of farms on a wide range of relevant topics, such as (1) market stabilization; (2) income support; (3) environmental sustainability; (4) climate change adaptation and mitigation; (5) innovation; and (6) resource efficiency. The approach will explicitly consider the heterogeneity of the farming sector in the EU and its member states. Together with the farming and agro-food sector the feasibility of these indicators will be determined.
FLINT will take into account the increasing needs for sustainability information by national and international retail and agro-food sectors. The FLINT approach is supported by the Sustainable Agriculture Initiative Platform and the Sustainability Consortium in which the agro-food sector actively participates. FLINT will establish a pilot network of at least 1000 farms (representative of farm diversity at EU level, including the different administrative environments in the different MS) that is well suited for the gathering of these data.
The lessons learned and recommendations from the empirical research conducted in 9 purposefully chosen MS will be used for estimating and discussing effects in all 28 MS. This will be very useful if the European Commission should decide to upgrade the pilot network to an operational EU-wide system.
Social indicators of farm-level sustainability 3
PROJECT CONSORTIUM:
1 DLO Foundation (Stichting Dienst Landbouwkundig Onderzoek) Netherlands
2 AKI - Agrargazdasagi Kutato Intezet Hungary
3 LUKE Finland Finland
4 IERiGZ-PIB - Instytut Ekonomiki Rolnictwa i Gospodarki
Zywnosciowej-Panstwowy Instytut Badawcy Poland
5 INTIA - Instituto Navarro De Tecnologias e Infraestructuras Agrolimentarias Spain
6 ZALF - Leibniz Centre for Agricultural Landscape Research Germany
7 Teagasc - The Agriculture and Food Development Authority of Irelan Ireland
8 Demeter - Hellenic Agricultural Organization Greece
9 INRA - Institut National de la Recherche Agronomique France
10 CROP-R BV Netherlands
11 University of Hohenheim Germany
MORE INFORMATION:
Drs. Krijn Poppe (coordinator) e-mail: [email protected]
Dr. Hans Vrolijk e-mail: [email protected]
LEI Wageningen UR phone: +31 07 3358247
P.O. Box 29703
2502 LS The Hague www.flint-fp7.eu
The Netherlands
4 Social indicators of farm-level sustainability
TABLE OF CONTENTS
List of tables ................................................................................................................................................. 5
List of figures ................................................................................................................................................ 6
List of acronyms............................................................................................................................................ 7
Executive summary ...................................................................................................................................... 8
1 Introduction .......................................................................................................................................... 9
2 Data and methodology ....................................................................................................................... 11
2.1 Data used ................................................................................................................................... 11
2.2 Methodology ............................................................................................................................. 13
3 Results ................................................................................................................................................ 16
3.1 Social indicators ......................................................................................................................... 16
3.1.1 Knowledge and information ................................................................................................ 16
3.1.2 Working conditions .............................................................................................................. 17
3.1.3 Social engagement ............................................................................................................... 19
3.1.4 Satisfaction with quality of life............................................................................................. 19
3.1.5 Continuity of the farm (succession) ..................................................................................... 23
3.2 Path model testing .................................................................................................................... 24
3.2.1 Influence of job satisfaction on perceived quality of life ..................................................... 24
3.2.2 Drivers of perceived quality of life ....................................................................................... 25
4 Conclusion .......................................................................................................................................... 28
5 References .......................................................................................................................................... 29
Social indicators of farm-level sustainability 5
LIST OF TABLES Table 1. Variables used for the case study ................................................................................................ 12
Table 2. Descriptive statistics of knowledge and information indicators by country ................................ 16
Table 3. Descriptive statistics of working conditions’ indicators by country ............................................. 18
Table 4. Descriptive statistics of social engagement indicators by country ............................................... 19
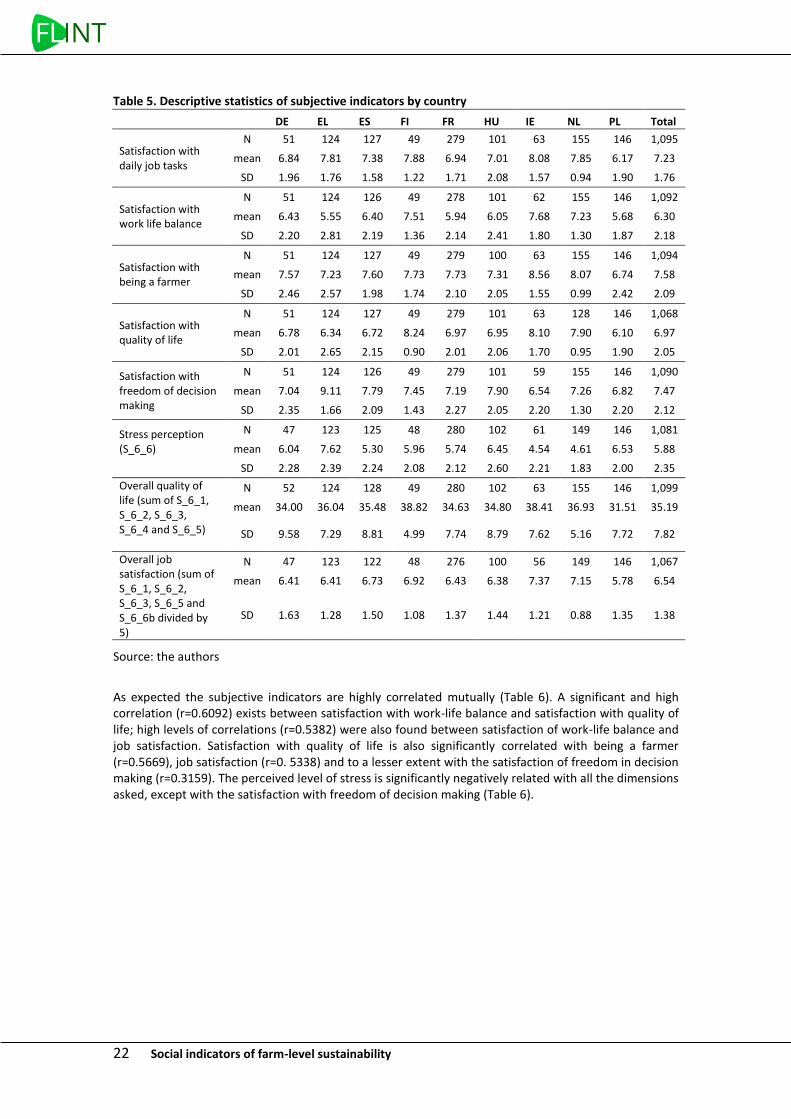
Table 5. Descriptive statistics of subjective indicators by country ............................................................. 22
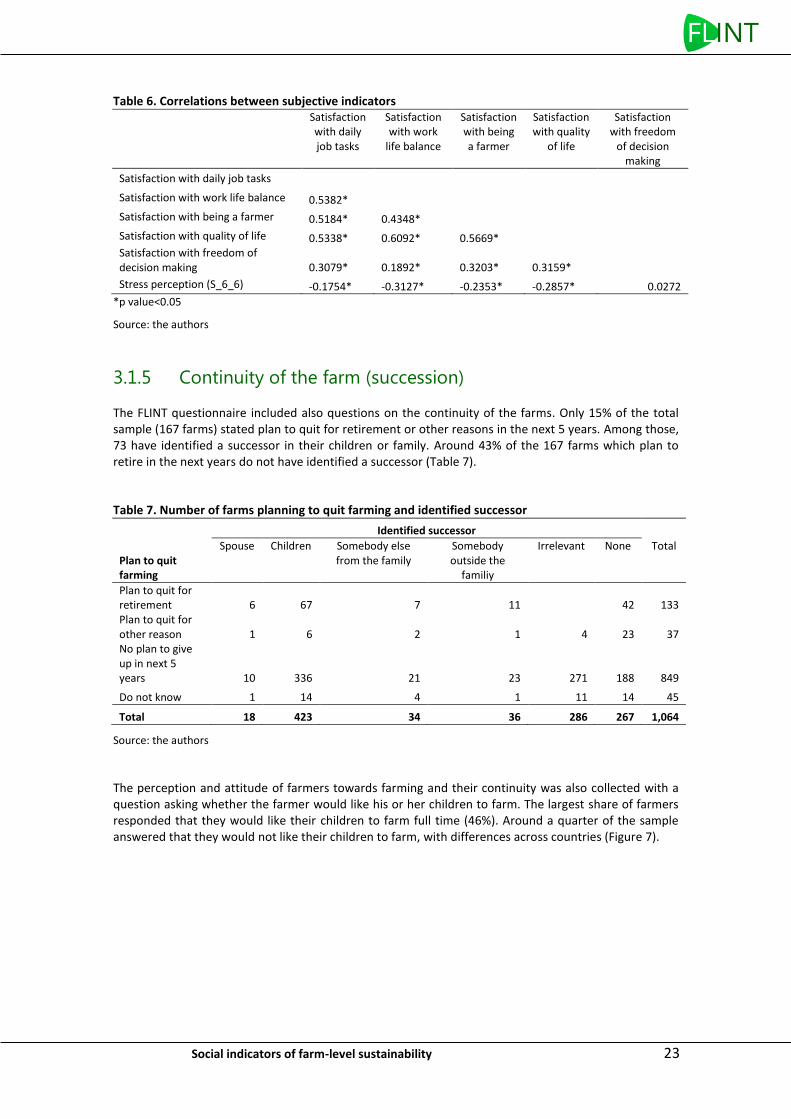
Table 6. Correlations between subjective indicators ................................................................................. 23
Table 7. Number of farms planning to quit farming and identified successor ........................................... 23
Table 8. Assessment of measurement model of C2-JOB SATISFACTION .................................................... 24
Table 9. Assessment of the measurement models of latent variables in the path model ......................... 25
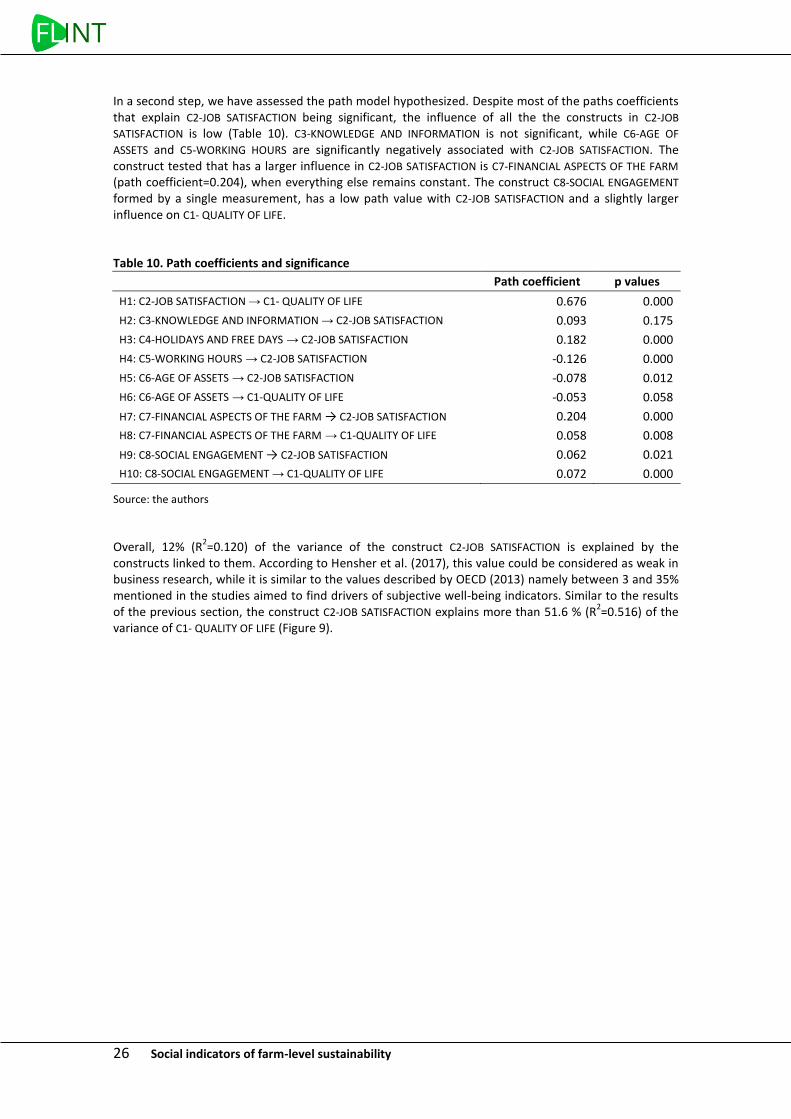
Table 10. Path coefficients and significance ............................................................................................... 26
6 Social indicators of farm-level sustainability
LIST OF FIGURES Figure 1: Theoretical framework for the measurement of subjective well-being and its determinants ..... 9
Figure 2: Path diagram for the hypothetized relationship between subjective social indicators .............. 14
Figure 3. Path diagram for the hypothetized relationships between social indicators .............................. 15
Figure 4. Distribution of farms according to the perceived level of satisfaction with quality of life, by country ....................................................................................................................................................... 20
Figure 5. Distribution of farms according to the perceived level of satisfaction with quality of life, by economic size of farms ............................................................................................................................... 20
Figure 6. Distribution of farms according to the perceived level of subjective indicators ......................... 21
Figure 7. Distribution of farms on perception on farm continuity based on whether farmers would like their children to farm ................................................................................................................................. 24
Figure 8. Path model results between subjective social indicators ............................................................ 25
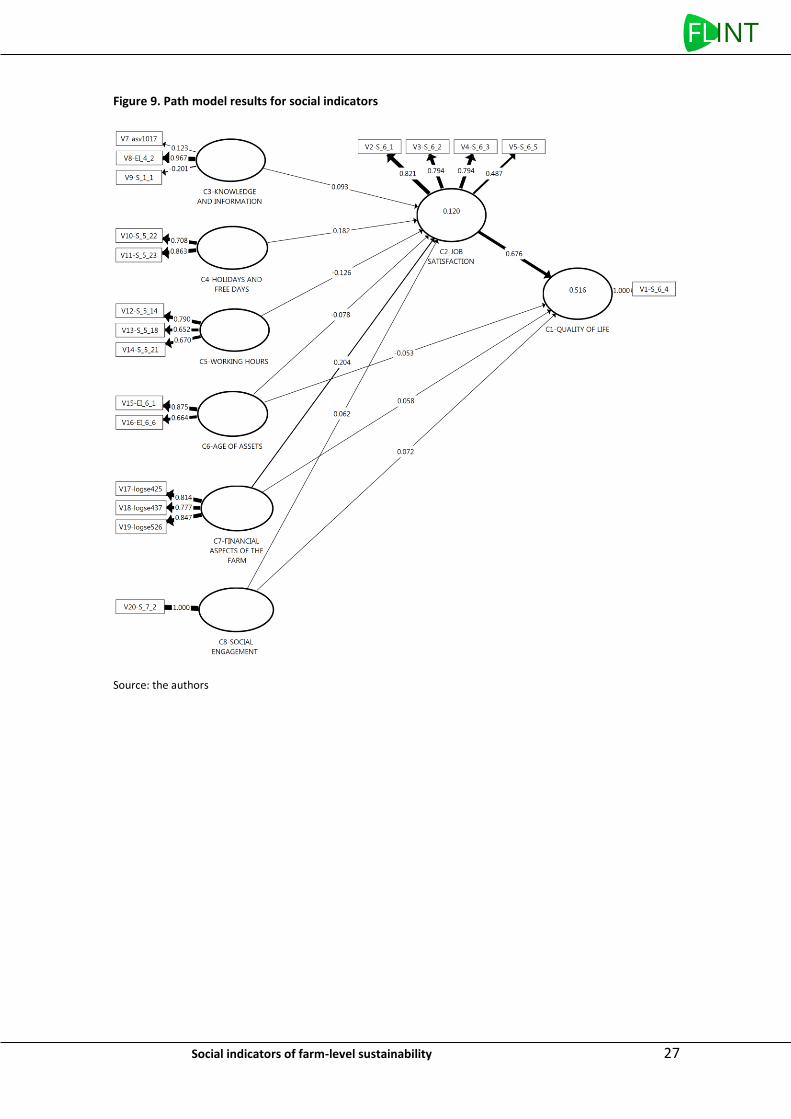
Figure 9. Path model results for social indicators ...................................................................................... 27
Social indicators of farm-level sustainability 7
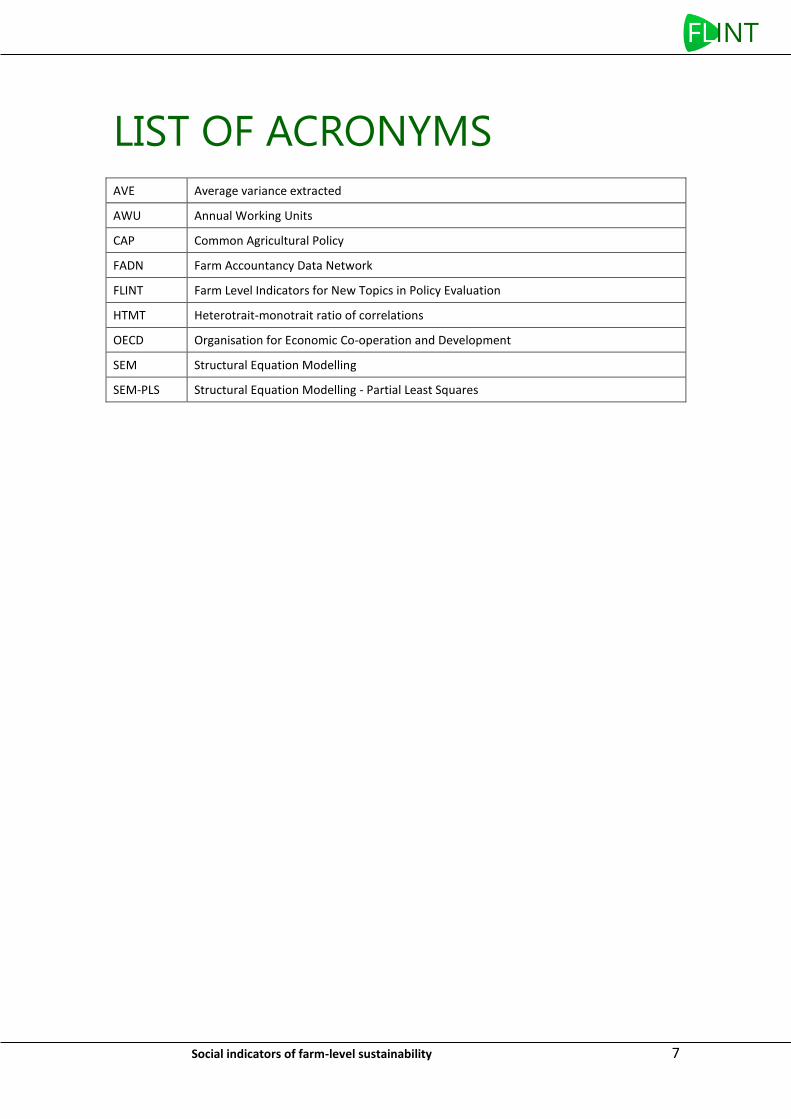
LIST OF ACRONYMS AVE Average variance extracted
AWU Annual Working Units
CAP Common Agricultural Policy
FADN Farm Accountancy Data Network
FLINT Farm Level Indicators for New Topics in Policy Evaluation
HTMT Heterotrait-monotrait ratio of correlations
OECD Organisation for Economic Co-operation and Development
SEM Structural Equation Modelling
SEM-PLS Structural Equation Modelling - Partial Least Squares
8 Social indicators of farm-level sustainability
EXECUTIVE SUMMARY This case study explores to which extent do objective and subjective indicators of social dimension of sustainability collected during the FLINT project reflect the concept of quality of life for farmers. It explores also how the indicators are mutually related. Using the FLINT data sample of 1,099 farms in nine countries in the European Union in 2014-2015, a Structural Equation Modelling - Partial Least Squares approach was conducted to test the validity and reliability of indicators and their relationships to the perceived quality of life of interviewed farms. Overall, subjective indicators meet the criteria of validity and reliability. Nevertheless, not all the hypothesized drivers of these subjective indicators fulfill reliability criteria. Two main conclusions can be derived from the results. The first one is that it is possible to collect subjective information from quality of life either asking one single question which reflects several dimensions of quality of life, or asking several questions capturing various dimensions to construct one composite indicator of quality of life. The second main conclusion is that perception of quality of life could not be inferred from objective variables collected either in FLINT or in the Farm Accountancy Data Network (FADN). Therefore, if policy makers or researchers are interested on this sustainability dimension, it should be asked directly to the farmers. Although detailed analyses on the relationships should be digged further, this case study illustrates the potential of integrated data to determine quality of life and its determinants at farm level and their relationship with social sustainability.
Social indicators of farm-level sustainability 9
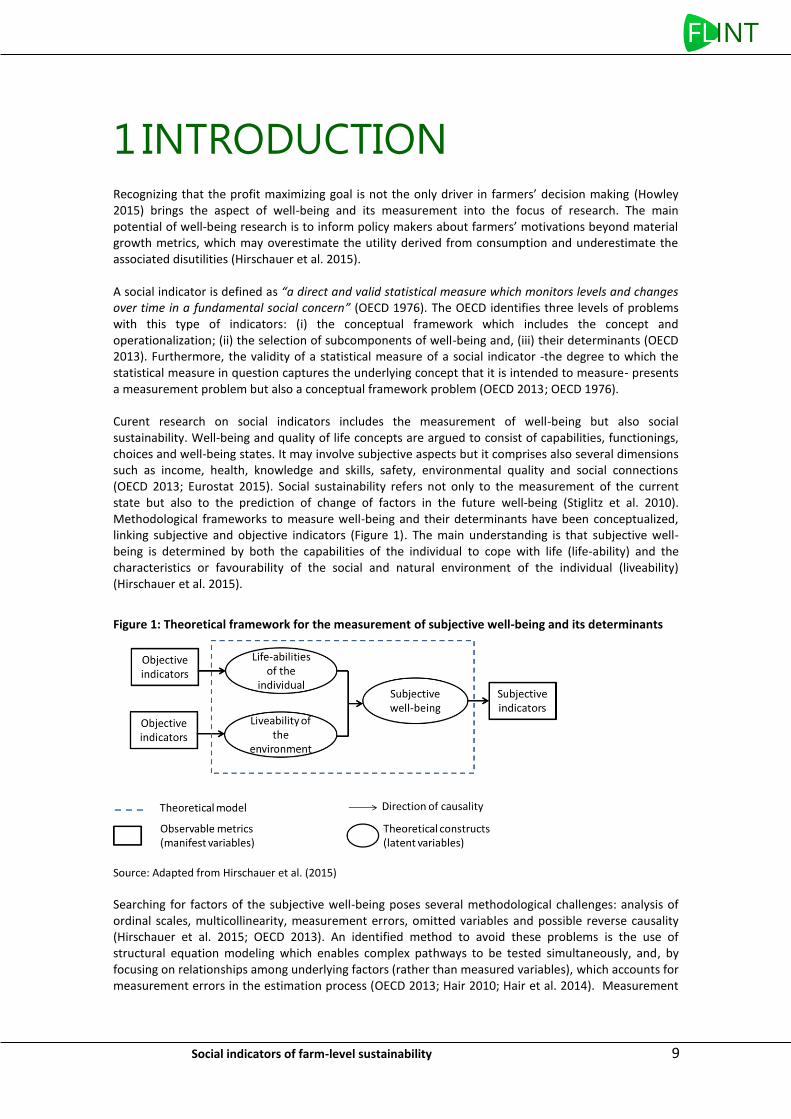
1 INTRODUCTION Recognizing that the profit maximizing goal is not the only driver in farmers’ decision making (Howley 2015) brings the aspect of well-being and its measurement into the focus of research. The main potential of well-being research is to inform policy makers about farmers’ motivations beyond material growth metrics, which may overestimate the utility derived from consumption and underestimate the associated disutilities (Hirschauer et al. 2015). A social indicator is defined as “a direct and valid statistical measure which monitors levels and changes over time in a fundamental social concern” (OECD 1976). The OECD identifies three levels of problems with this type of indicators: (i) the conceptual framework which includes the concept and operationalization; (ii) the selection of subcomponents of well-being and, (iii) their determinants (OECD 2013). Furthermore, the validity of a statistical measure of a social indicator -the degree to which the statistical measure in question captures the underlying concept that it is intended to measure- presents a measurement problem but also a conceptual framework problem (OECD 2013; OECD 1976). Curent research on social indicators includes the measurement of well-being but also social sustainability. Well-being and quality of life concepts are argued to consist of capabilities, functionings, choices and well-being states. It may involve subjective aspects but it comprises also several dimensions such as income, health, knowledge and skills, safety, environmental quality and social connections (OECD 2013; Eurostat 2015). Social sustainability refers not only to the measurement of the current state but also to the prediction of change of factors in the future well-being (Stiglitz et al. 2010). Methodological frameworks to measure well-being and their determinants have been conceptualized, linking subjective and objective indicators (Figure 1). The main understanding is that subjective well-being is determined by both the capabilities of the individual to cope with life (life-ability) and the characteristics or favourability of the social and natural environment of the individual (liveability) (Hirschauer et al. 2015).
Figure 1: Theoretical framework for the measurement of subjective well-being and its determinants
Source: Adapted from Hirschauer et al. (2015)
Searching for factors of the subjective well-being poses several methodological challenges: analysis of ordinal scales, multicollinearity, measurement errors, omitted variables and possible reverse causality (Hirschauer et al. 2015; OECD 2013). An identified method to avoid these problems is the use of structural equation modeling which enables complex pathways to be tested simultaneously, and, by focusing on relationships among underlying factors (rather than measured variables), which accounts for measurement errors in the estimation process (OECD 2013; Hair 2010; Hair et al. 2014). Measurement
10 Social indicators of farm-level sustainability
errors in subjective social indicators are expected to be high, mainly because they are estimations or perceptions where memory errors or individual characteristics are highly influential. An important obstacle in doing this type of research has up to now been the lack of data. Besser and Mann (2015) for example mention the lack of possibility to link accountancy data from the Farm Accountancy Data Network (FADN) with job satisfaction metrics. The analysis here will rely on the data collected via the FLINT project. These are farm-level data for a sample of farmers of the FADN in several European Union (EU) countries (The Netherlands-NL, Hungary-HU, Finland-FI, Poland-PL, Spain-ES, Ireland-IE, Greece-GR, France-FR and Germany-DE). The data include accountancy data from FADN (here after: ‘FADN data’), as well as additional data on economic, environmental and social sustainability of farms. These additional data, the ‘FLINT data’, were collected via face-to-face survey or merging of existing data, depending on the country. The FADN and FLINT data relate to accountancy year 2015, except for France and Germany for which it is 2014. The objective of this case study is to determine the validity and reliability of observable variables (both objective and subjective ones) gathered during the FLINT project in order to measure well-being/social sustainability at farm level and to determine how the indicators of well-being are mutually related. This report describes the methodology used, the main results and a final conclusion and outlook.
Social indicators of farm-level sustainability 11
2 DATA AND METHODOLOGY This section explains the methodology and describes the data used.
2.1 Data used
The variables used in the case study included the dataset of FLINT variables collected, FLINT indicators designed based on the FLINT variables, and FADN standard results (Table 1). FLINT farm return incorporated both subjective and objective social indicators. We call “objective indicators” those which aim to estimate events or conditions in the farm. These social indicators were classified into four main topics: knowledge and information, employment and working conditions, social engagement and succession and farm continuity. As a contrast, “subjective indicators” are those metrics intended to measure perceptions of the manager of experiences or affecting factors. Here, three areas were considered: satisfaction with several dimensions of the job and quality of life, perceptions of the change from the past and perceptions about the continuity of farming. Knowledge and information indicators are explored through data collected about the main sources of information about Common Agricultural Policy (CAP), the number of contacts of advisory services, frequency of trainings attended, and the use of technology for the farm management. This information is complementary to those variabes computed from FADN such as degree of agricultural training and years of experience of the manager. Additionaly, two more indicators were calculated from FLINT variables: number of advisory service providers and number of types of advice. Employment and working conditions topics comprised factors that affect the quality of the job in agriculture. FLINT gathered information about on and off- farm working hours per week and during peak season, the amount of free days and holidays per year, the availability of replacement in case of illness or other cases, and the age of assets as a factor that may influence the quality of the job. This is in addition to indicators of labour derived from FADN: number of Annual Working Units (AWU), farm net value added per AWU, share of family labour and structure of total farm labour. Social engagement of farms, as a measure of social capital and sustainability awareness, was investigated collecting information about the involvement of the farmers in organisations or community initiatives. Farmers were asked about their joining of a list of organisations and whether they are only members or members of the board. Farmers were also asked about their involvement in local initiatives such as farmers markets, open days, giving apprenticeships, fairs and hosting open-days events. Farm continuity or succession was asked through two main questions. The first one is about the planning of quitting farming in the next five years. The second one is if a succesor is already identified. Subjective indicators of quality of life covered five dimensions. Four of them are considered as perceptions of personal affects and estimations. Satisfaction with daily job tasks evaluates subjectively the perception of farming tasks in a typical day. Satisfaction with work-life balance refers to the personal assessment of the amount of time that the farmer has to do things that she or he likes doing in comparison to job duties. Satisfaction with being a farmer refers to the perception of the profession chosen and its associated life style. Finally, perception of quality of life as a whole is evaluated in the fourth question. Farmers’ freedom of decision making was evaluated with the fifth question, assuming that farms and its operators are similar to business owners. Considering opinions of stakeholders, a question related with the perception of stress was included. Each of the questions was presented in an 11 point scale, from 0 to 10.
12 Social indicators of farm-level sustainability
Perception of stress and freedom of decision making respective to the past was also asked to the respondents in order to determine their view towards the changes. Also, their opinion on the future of farming was asked, including a question whether the farmers would like their children to farm.
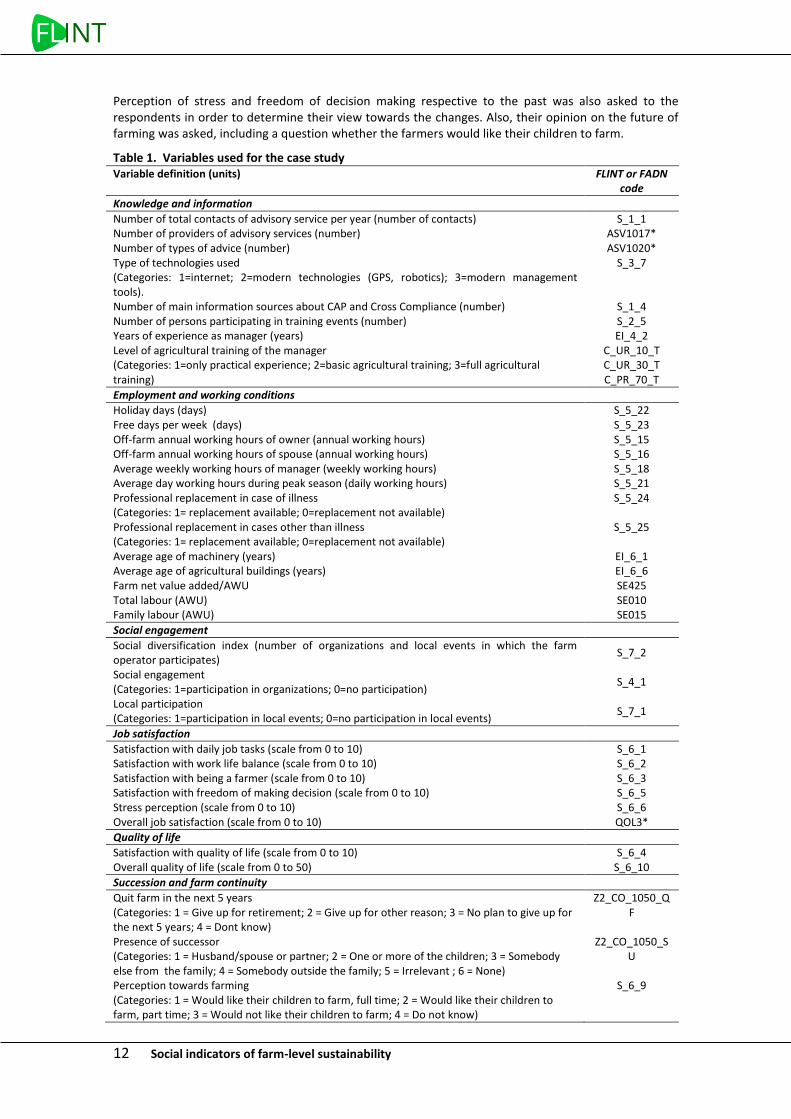
Table 1. Variables used for the case study Variable definition (units) FLINT or FADN
code
Knowledge and information
Number of total contacts of advisory service per year (number of contacts) S_1_1 Number of providers of advisory services (number) ASV1017* Number of types of advice (number) ASV1020* Type of technologies used (Categories: 1=internet; 2=modern technologies (GPS, robotics); 3=modern management tools).
S_3_7
Number of main information sources about CAP and Cross Compliance (number) S_1_4 Number of persons participating in training events (number) S_2_5 Years of experience as manager (years) EI_4_2 Level of agricultural training of the manager (Categories: 1=only practical experience; 2=basic agricultural training; 3=full agricultural training)
C_UR_10_T C_UR_30_T C_PR_70_T
Employment and working conditions
Holiday days (days) S_5_22 Free days per week (days) S_5_23 Off-farm annual working hours of owner (annual working hours) S_5_15 Off-farm annual working hours of spouse (annual working hours) S_5_16 Average weekly working hours of manager (weekly working hours) S_5_18 Average day working hours during peak season (daily working hours) S_5_21 Professional replacement in case of illness (Categories: 1= replacement available; 0=replacement not available)
S_5_24
Professional replacement in cases other than illness (Categories: 1= replacement available; 0=replacement not available)
S_5_25
Average age of machinery (years) EI_6_1 Average age of agricultural buildings (years) EI_6_6 Farm net value added/AWU SE425 Total labour (AWU) SE010 Family labour (AWU) SE015
Social engagement
Social diversification index (number of organizations and local events in which the farm operator participates)
S_7_2
Social engagement (Categories: 1=participation in organizations; 0=no participation)
S_4_1
Local participation (Categories: 1=participation in local events; 0=no participation in local events)
S_7_1
Job satisfaction
Satisfaction with daily job tasks (scale from 0 to 10) S_6_1 Satisfaction with work life balance (scale from 0 to 10) S_6_2 Satisfaction with being a farmer (scale from 0 to 10) S_6_3 Satisfaction with freedom of making decision (scale from 0 to 10) S_6_5 Stress perception (scale from 0 to 10) S_6_6 Overall job satisfaction (scale from 0 to 10) QOL3*
Quality of life
Satisfaction with quality of life (scale from 0 to 10) S_6_4 Overall quality of life (scale from 0 to 50) S_6_10
Succession and farm continuity
Quit farm in the next 5 years (Categories: 1 = Give up for retirement; 2 = Give up for other reason; 3 = No plan to give up for the next 5 years; 4 = Dont know)
Z2_CO_1050_QF
Presence of successor (Categories: 1 = Husband/spouse or partner; 2 = One or more of the children; 3 = Somebody else from the family; 4 = Somebody outside the family; 5 = Irrelevant ; 6 = None)
Z2_CO_1050_SU
Perception towards farming (Categories: 1 = Would like their children to farm, full time; 2 = Would like their children to farm, part time; 3 = Would not like their children to farm; 4 = Do not know)
S_6_9
Social indicators of farm-level sustainability 13
* These variables were not available directly in FLINT and FADN data but were computed for the current case study.
Source: the authors
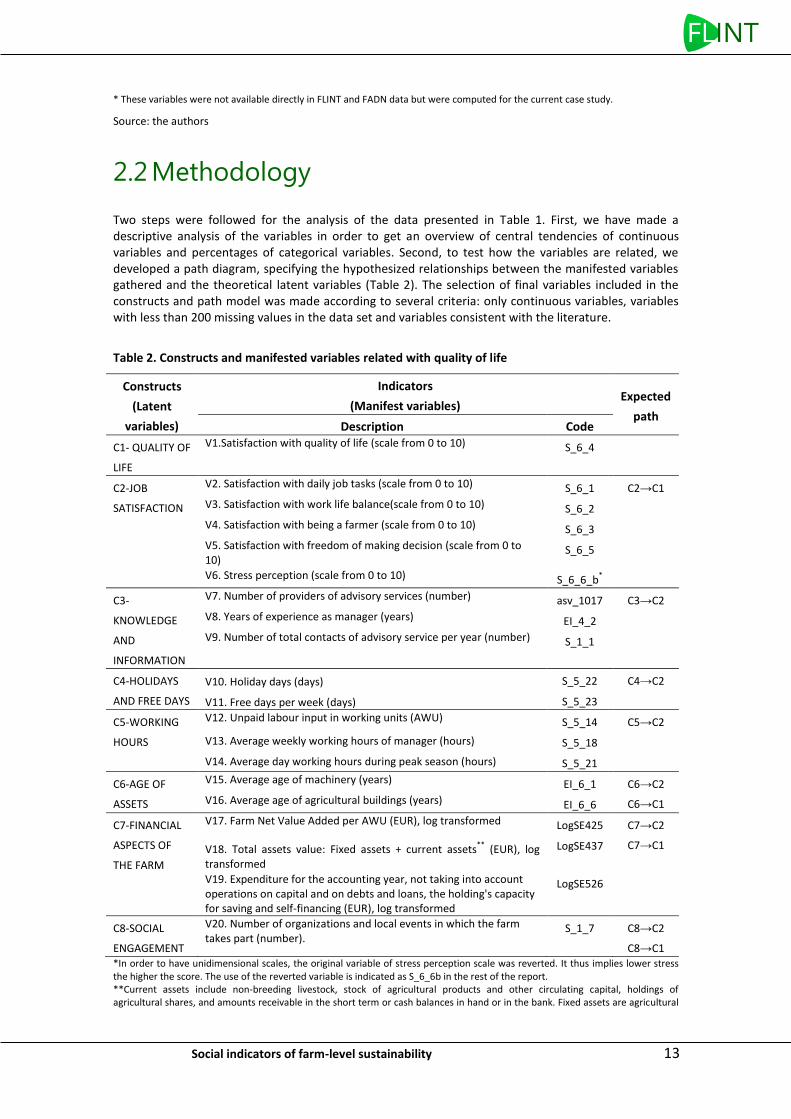
2.2 Methodology
Two steps were followed for the analysis of the data presented in Table 1. First, we have made a descriptive analysis of the variables in order to get an overview of central tendencies of continuous variables and percentages of categorical variables. Second, to test how the variables are related, we developed a path diagram, specifying the hypothesized relationships between the manifested variables gathered and the theoretical latent variables (Table 2). The selection of final variables included in the constructs and path model was made according to several criteria: only continuous variables, variables with less than 200 missing values in the data set and variables consistent with the literature.
Table 2. Constructs and manifested variables related with quality of life
Constructs
(Latent
variables)
Indicators
(Manifest variables) Expected
path Description Code
C1- QUALITY OF
LIFE
V1.Satisfaction with quality of life (scale from 0 to 10) S_6_4
C2-JOB
SATISFACTION
V2. Satisfaction with daily job tasks (scale from 0 to 10) S_6_1 C2→C1
V3. Satisfaction with work life balance(scale from 0 to 10) S_6_2
V4. Satisfaction with being a farmer (scale from 0 to 10) S_6_3
V5. Satisfaction with freedom of making decision (scale from 0 to 10)
S_6_5
V6. Stress perception (scale from 0 to 10) S_6_6_b*
C3-
KNOWLEDGE
AND
INFORMATION
V7. Number of providers of advisory services (number) asv_1017 C3→C2
V8. Years of experience as manager (years) EI_4_2
V9. Number of total contacts of advisory service per year (number) S_1_1
C4-HOLIDAYS
AND FREE DAYS
V10. Holiday days (days) S_5_22 C4→C2
V11. Free days per week (days) S_5_23
C5-WORKING
HOURS
V12. Unpaid labour input in working units (AWU) S_5_14 C5→C2
V13. Average weekly working hours of manager (hours) S_5_18
V14. Average day working hours during peak season (hours) S_5_21
C6-AGE OF
ASSETS
V15. Average age of machinery (years) EI_6_1 C6→C2
C6→C1 V16. Average age of agricultural buildings (years) EI_6_6
C7-FINANCIAL
ASPECTS OF
THE FARM
V17. Farm Net Value Added per AWU (EUR), log transformed LogSE425 C7→C2
C7→C1 V18. Total assets value: Fixed assets + current assets**
(EUR), log transformed
LogSE437
V19. Expenditure for the accounting year, not taking into account operations on capital and on debts and loans, the holding's capacity for saving and self-financing (EUR), log transformed
LogSE526
C8-SOCIAL
ENGAGEMENT
V20. Number of organizations and local events in which the farm takes part (number).
S_1_7 C8→C2
C8→C1 *In order to have unidimensional scales, the original variable of stress perception scale was reverted. It thus implies lower stress the higher the score. The use of the reverted variable is indicated as S_6_6b in the rest of the report. **Current assets include non-breeding livestock, stock of agricultural products and other circulating capital, holdings of agricultural shares, and amounts receivable in the short term or cash balances in hand or in the bank. Fixed assets are agricultural
14 Social indicators of farm-level sustainability
land, permanent crops, farm- and other buildings, forest capital, machinery and equipment, and breeding livestock (European Commission 2015).
→ Direction of causation
Source: the authors
The validity and reliability of the variables was determined using a Structural Equation Modelling - Partial Least Square (SEM-PLS) with the help of the software SMART-PLS (Ringle et al. 2015). SEM-PLS is estimated with regression-based methods (prediction of the constructs) and can handle both reflective and formative constructs without assuming the normality of the data (Hair 2010). When analyzing the model, we followed the steps suggested by Hair et al. (2017): (i) checking the data and evaluating correlations between subjective indicators and other social end economic variables; because of their screwed distribution, the economic variables were log transformed. Cases with missing values of the variables tested were not included in the analysis; (ii) running the SEM-PLS algorithm and using bootstrapping methods to calculate significance levels; (iii) evaluating the measurement models: loadings, composite reliability, Cronbachs alpha, average variance extracted (AVE) and Heterotrait-monotrait ratio of correlations (HTMT); and (iv) evaluating the inner model through the path estimates and R
2.
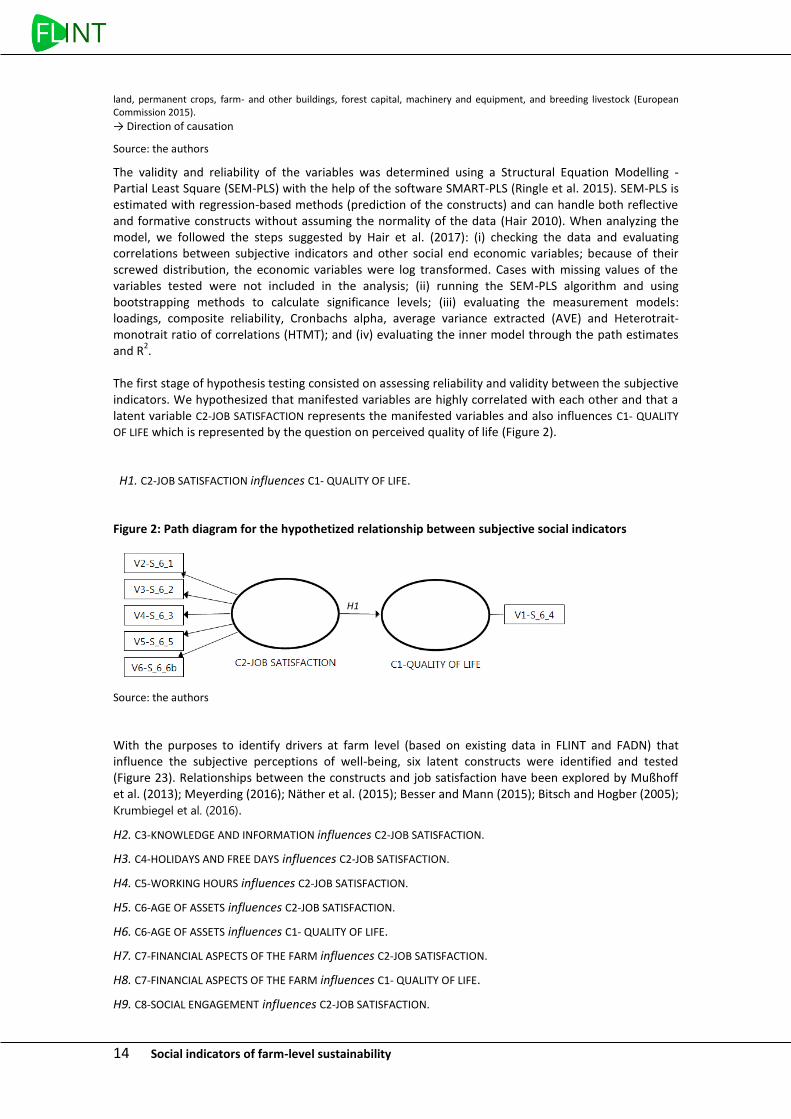
The first stage of hypothesis testing consisted on assessing reliability and validity between the subjective indicators. We hypothesized that manifested variables are highly correlated with each other and that a latent variable C2-JOB SATISFACTION represents the manifested variables and also influences C1- QUALITY
OF LIFE which is represented by the question on perceived quality of life (Figure 2).
H1. C2-JOB SATISFACTION influences C1- QUALITY OF LIFE.
Figure 2: Path diagram for the hypothetized relationship between subjective social indicators
Source: the authors
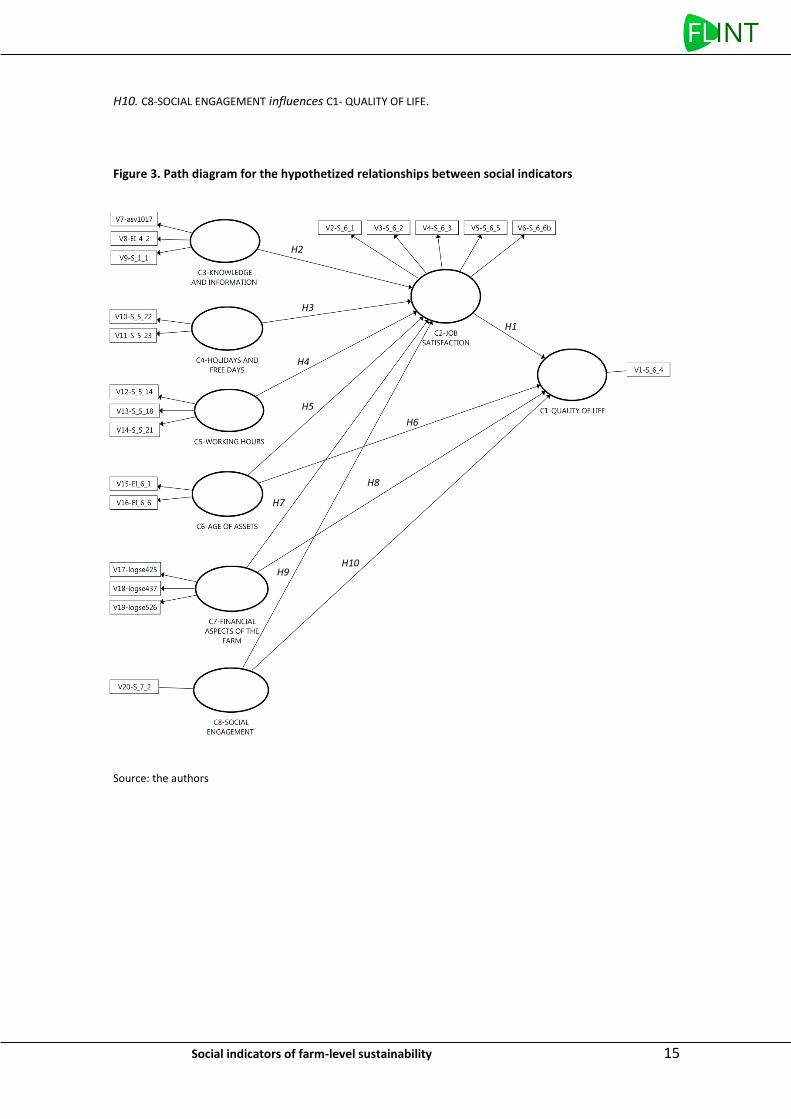
With the purposes to identify drivers at farm level (based on existing data in FLINT and FADN) that influence the subjective perceptions of well-being, six latent constructs were identified and tested (Figure 23). Relationships between the constructs and job satisfaction have been explored by Mußhoff et al. (2013); Meyerding (2016); Näther et al. (2015); Besser and Mann (2015); Bitsch and Hogber (2005); Krumbiegel et al. (2016).
H2. C3-KNOWLEDGE AND INFORMATION influences C2-JOB SATISFACTION.
H3. C4-HOLIDAYS AND FREE DAYS influences C2-JOB SATISFACTION.
H4. C5-WORKING HOURS influences C2-JOB SATISFACTION.
H5. C6-AGE OF ASSETS influences C2-JOB SATISFACTION.
H6. C6-AGE OF ASSETS influences C1- QUALITY OF LIFE.
H7. C7-FINANCIAL ASPECTS OF THE FARM influences C2-JOB SATISFACTION.
H8. C7-FINANCIAL ASPECTS OF THE FARM influences C1- QUALITY OF LIFE.
H9. C8-SOCIAL ENGAGEMENT influences C2-JOB SATISFACTION.
H1
Social indicators of farm-level sustainability 15
H10. C8-SOCIAL ENGAGEMENT influences C1- QUALITY OF LIFE.
Figure 3. Path diagram for the hypothetized relationships between social indicators
Source: the authors
H1
H2
H3
H4
H5
H6
H7
H8
H9 H10
16 Social indicators of farm-level sustainability
3 RESULTS This section is divided into two parts. The first part presents the results of the descriptive analysis of social indicators. The second one presents the result of the path model.
3.1 Social indicators
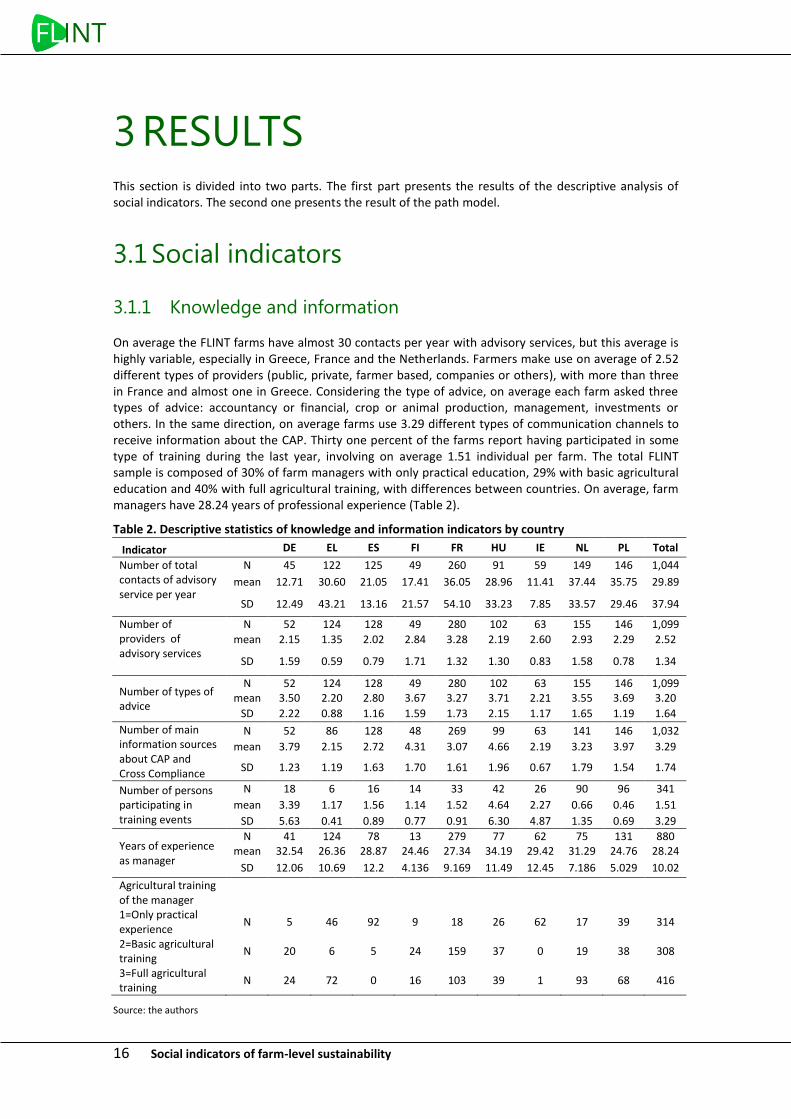
3.1.1 Knowledge and information
On average the FLINT farms have almost 30 contacts per year with advisory services, but this average is highly variable, especially in Greece, France and the Netherlands. Farmers make use on average of 2.52 different types of providers (public, private, farmer based, companies or others), with more than three in France and almost one in Greece. Considering the type of advice, on average each farm asked three types of advice: accountancy or financial, crop or animal production, management, investments or others. In the same direction, on average farms use 3.29 different types of communication channels to receive information about the CAP. Thirty one percent of the farms report having participated in some type of training during the last year, involving on average 1.51 individual per farm. The total FLINT sample is composed of 30% of farm managers with only practical education, 29% with basic agricultural education and 40% with full agricultural training, with differences between countries. On average, farm managers have 28.24 years of professional experience (Table 2).
Table 2. Descriptive statistics of knowledge and information indicators by country
Indicator DE EL ES FI FR HU IE NL PL Total
Number of total contacts of advisory service per year
N 45 122 125 49 260 91 59 149 146 1,044
mean 12.71 30.60 21.05 17.41 36.05 28.96 11.41 37.44 35.75 29.89
SD 12.49 43.21 13.16 21.57 54.10 33.23 7.85 33.57 29.46 37.94
Number of providers of advisory services
N 52 124 128 49 280 102 63 155 146 1,099
mean 2.15 1.35 2.02 2.84 3.28 2.19 2.60 2.93 2.29 2.52
SD 1.59 0.59 0.79 1.71 1.32 1.30 0.83 1.58 0.78 1.34
Number of types of advice
N 52 124 128 49 280 102 63 155 146 1,099 mean 3.50 2.20 2.80 3.67 3.27 3.71 2.21 3.55 3.69 3.20
SD 2.22 0.88 1.16 1.59 1.73 2.15 1.17 1.65 1.19 1.64
Number of main information sources about CAP and Cross Compliance
N 52 86 128 48 269 99 63 141 146 1,032
mean 3.79 2.15 2.72 4.31 3.07 4.66 2.19 3.23 3.97 3.29
SD 1.23 1.19 1.63 1.70 1.61 1.96 0.67 1.79 1.54 1.74
Number of persons participating in training events
N 18 6 16 14 33 42 26 90 96 341
mean 3.39 1.17 1.56 1.14 1.52 4.64 2.27 0.66 0.46 1.51
SD 5.63 0.41 0.89 0.77 0.91 6.30 4.87 1.35 0.69 3.29
Years of experience as manager
N 41 124 78 13 279 77 62 75 131 880 mean 32.54 26.36 28.87 24.46 27.34 34.19 29.42 31.29 24.76 28.24
SD 12.06 10.69 12.2 4.136 9.169 11.49 12.45 7.186 5.029 10.02
Agricultural training of the manager
1=Only practical experience
N 5 46 92 9 18 26 62 17 39 314
2=Basic agricultural training
N 20 6 5 24 159 37 0 19 38 308
3=Full agricultural training
N 24 72 0 16 103 39 1 93 68 416
Source: the authors
Social indicators of farm-level sustainability 17
3.1.2 Working conditions
In this section we present the description of FLINT-based collected information about working time, workload and age of assets based on Table 3.
On average, farmers have 19.01 days of holidays per year with a high variability among countries and types of farms. A high variability is also presented within the variable free days per week: on average 0.82 day per week in a range between 0.62 in the Netherlands to 1.16 in Ireland. Only 166 farms report owner’s off-farm working hours, with an average of 898 hours per year. Almost twice as much is the number of working hours of the spouse (1,351 hours per year). In those farms where there exists only one manager, the farm manager works between 30.81 (Greece) and 44.20 (Poland) hours in the week. During the peak season days, working hours are described from 11.50 to 12.01 hours per day.
More than 62% of the farms stated that there is availability of replacement in case of illness, and 57% reported availability of replacement in any other case. These percentages are considerable lower in Spain (less than 15%). The average age of machinery and agricultural buildings, as an indicator of modernity, are 14 and 22 years, respectively.
Average farm net value added per AWU varies from 8,231 in Poland to 60,570.67 in The Netherlands, presenting a high variability among countries. On average each farm uses annually 3.36 AWU (with a higher average in Hungary 12.29). The number of AWU from the family is on average 1.52, with France with the highest number (1.95) and Hungary with the lowest (0.90).

18 Social indicators of farm-level sustainability
Table 3. Descriptive statistics of working conditions’ indicators by country
DE EL ES FI FR HU IE NL PL Total
Holiday days
N 48 124 126 49 276 85 60 101 145 1014
mean 10.10 60.69 10.49 29.53 11.04 30.68 7.35 14.49 6.44 19.01
SD 8.93 69.07 10.07 14.32 12.77 30.05 4.66 15.09 7.96 32.39
Free days per week N 45 122 125 27 274 76 63 61 145 938
mean 0.71 0.65 0.83 0.59 0.63 1.54 1.16 1.44 0.62 0.82 SD 0.73 0.63 0.81 0.84 0.73 1.01 0.37 0.89 0.68 0.81
Off-farm annual working hours of owner
N 27 14 9 12 37 40 12 0 15 166
mean 470.22 1,065.00 877.33 393.33 595.22 1,381.15 674.75 . 1,573.47 898.73
SD 726.10 483.02 607.57 348.43 515.93 597.49 505.83 . 674.05 706.13
Off-farm annual working hours of spouse
N 20 22 23 15 126 24 30 0 32 292
mean 861.55 1,502.27 1,236.57 1,303.47 1,576.06 1,440.88 269.13 . 1,719.38 1,351.14 SD 766.33 776.21 649.97 482.62 403.17 581.29 506.20 . 584.07 678.90
Average weekly working hours of manager
N 44 124 85 13 280 102 63 75 138 924 mean 40.61 30.81 34.79 41.85 29.78 30.04 40.75 39.19 44.20 34.76
SD 10.44 18.28 1.95 17.06 1.79 11.27 10.84 15.93 11.71 12.21
Average day working hours during peak season
N 52 124 123 49 278 90 62 139 145 1062 mean 12.31 11.50 11.22 12.59 11.43 11.87 11.69 11.40 12.01 11.64
SD 2.33 3.73 2.17 2.24 2.41 3.12 2.87 2.47 2.71 2.72
Replacement in case of illness N 52 124 128 49 280 102 63 155 146 1,099 % 48 67 13 82 60 54 68 84 86 62
Replacement in other case N 52 124 128 49 280 102 63 155 146 1099 % 48 54 5 78 50 52 83 81 82 57
Average age of machinery in years
N 49 123 121 48 277 95 63 155 146 1,077
mean 16.07 17.42 9.94 15.22 13.20 15.58 14.88 15.56 12.82 14.13
SD 7.90 8.78 5.21 5.85 6.25 8.24 5.17 7.51 6.20 7.16
Average age of agricultural buildings in years
N 50 107 94 49 258 96 63 155 146 1,018 mean 29.87 24.86 18.23 17.73 24.47 24.75 16.75 22.69 22.53 22.88
SD 7.90 8.78 5.21 5.85 6.25 8.24 5.17 7.51 6.20 7.16
Farm net value added/AWU in 1,000 EUR
N 52 124 128 49 280 102 63 155 146 1,099
mean 32.88 14.23 15.78 29.85 10.29 27.99 37.83 60.57 8.23 23.36
SD 31.44 17.72 24.72 26.58 23.03 61.00 33.019 65.79 10.61 40.61
Total labour in AWU
N 52 124 128 49 280 102 63 155 146 1,099
mean 3.46 1,44 2,09 1,92 2,67 12,09 1,33 3,72 2,25 3,36
SD 6.45 1,30 1,46 1,01 1,62 34,73 0,53 6,67 1,15 11,35
Family labour in AWU
N 52 124 128 49 280 102 63 155 146 1,099
mean 1.17 1.11 1.37 1.51 1.95 0.90 1.20 1.52 1.87 1.52
SD 0.59 0.72 0.63 0.61 0.64 0.89 0.38 0.64 0.70 0.76
Source: the authors
Social indicators of farm-level sustainability 19
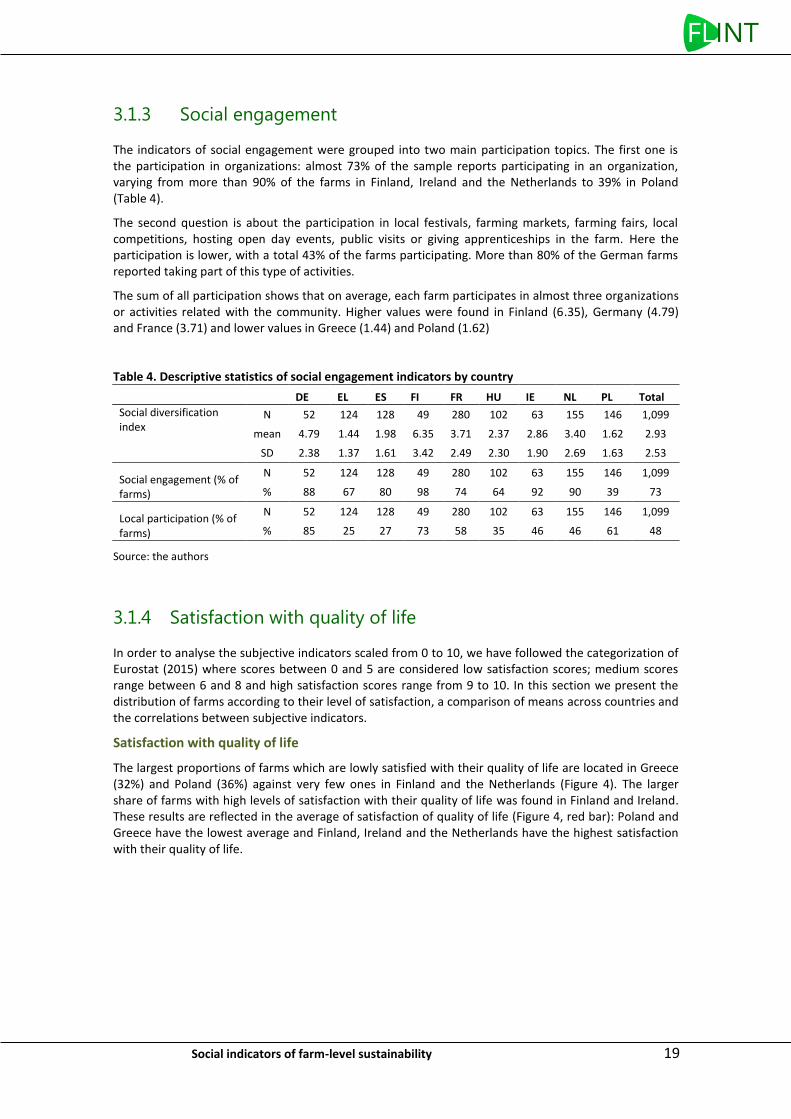
3.1.3 Social engagement
The indicators of social engagement were grouped into two main participation topics. The first one is the participation in organizations: almost 73% of the sample reports participating in an organization, varying from more than 90% of the farms in Finland, Ireland and the Netherlands to 39% in Poland (Table 4).
The second question is about the participation in local festivals, farming markets, farming fairs, local competitions, hosting open day events, public visits or giving apprenticeships in the farm. Here the participation is lower, with a total 43% of the farms participating. More than 80% of the German farms reported taking part of this type of activities.
The sum of all participation shows that on average, each farm participates in almost three organizations or activities related with the community. Higher values were found in Finland (6.35), Germany (4.79) and France (3.71) and lower values in Greece (1.44) and Poland (1.62)
Table 4. Descriptive statistics of social engagement indicators by country
DE EL ES FI FR HU IE NL PL Total
Social diversification index
N 52 124 128 49 280 102 63 155 146 1,099
mean 4.79 1.44 1.98 6.35 3.71 2.37 2.86 3.40 1.62 2.93
SD 2.38 1.37 1.61 3.42 2.49 2.30 1.90 2.69 1.63 2.53
Social engagement (% of farms)
N 52 124 128 49 280 102 63 155 146 1,099
% 88 67 80 98 74 64 92 90 39 73
Local participation (% of farms)
N 52 124 128 49 280 102 63 155 146 1,099
% 85 25 27 73 58 35 46 46 61 48
Source: the authors
3.1.4 Satisfaction with quality of life
In order to analyse the subjective indicators scaled from 0 to 10, we have followed the categorization of Eurostat (2015) where scores between 0 and 5 are considered low satisfaction scores; medium scores range between 6 and 8 and high satisfaction scores range from 9 to 10. In this section we present the distribution of farms according to their level of satisfaction, a comparison of means across countries and the correlations between subjective indicators.
Satisfaction with quality of life
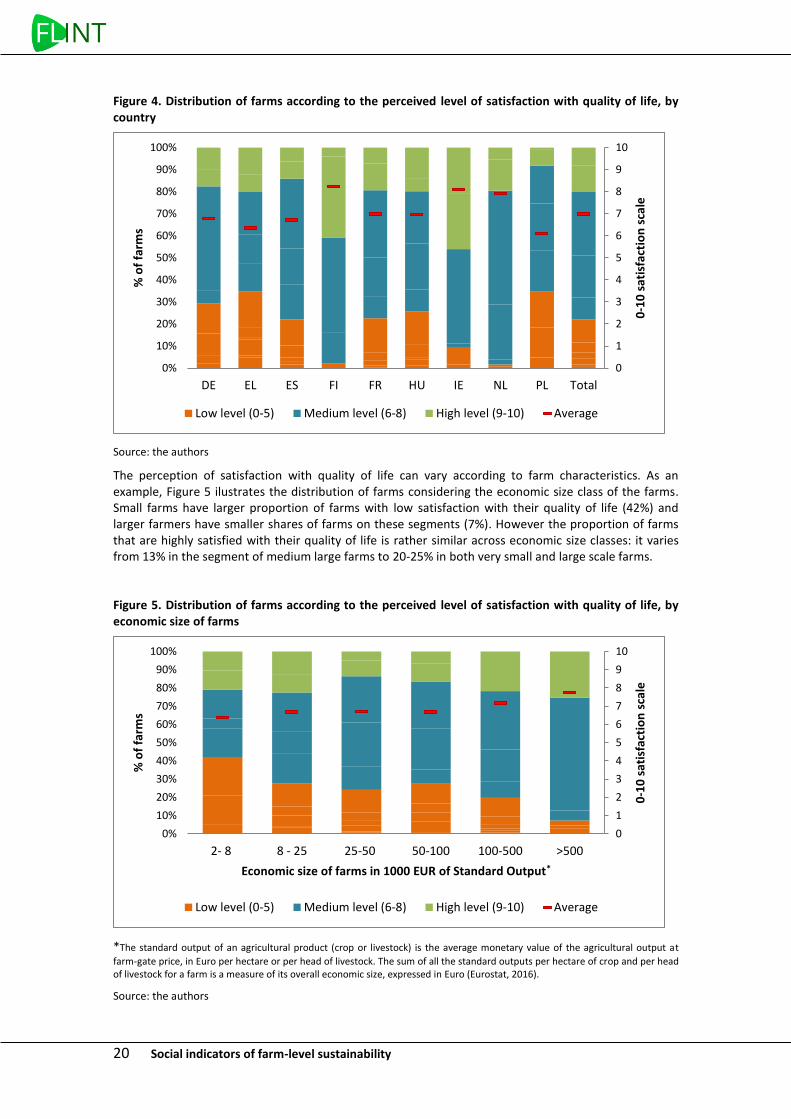
The largest proportions of farms which are lowly satisfied with their quality of life are located in Greece (32%) and Poland (36%) against very few ones in Finland and the Netherlands (Figure 4). The larger share of farms with high levels of satisfaction with their quality of life was found in Finland and Ireland. These results are reflected in the average of satisfaction of quality of life (Figure 4, red bar): Poland and Greece have the lowest average and Finland, Ireland and the Netherlands have the highest satisfaction with their quality of life.
20 Social indicators of farm-level sustainability
Figure 4. Distribution of farms according to the perceived level of satisfaction with quality of life, by country
Source: the authors
The perception of satisfaction with quality of life can vary according to farm characteristics. As an example, Figure 5 ilustrates the distribution of farms considering the economic size class of the farms. Small farms have larger proportion of farms with low satisfaction with their quality of life (42%) and larger farmers have smaller shares of farms on these segments (7%). However the proportion of farms that are highly satisfied with their quality of life is rather similar across economic size classes: it varies from 13% in the segment of medium large farms to 20-25% in both very small and large scale farms.
Figure 5. Distribution of farms according to the perceived level of satisfaction with quality of life, by economic size of farms
*The standard output of an agricultural product (crop or livestock) is the average monetary value of the agricultural output at
farm-gate price, in Euro per hectare or per head of livestock. The sum of all the standard outputs per hectare of crop and per head of livestock for a farm is a measure of its overall economic size, expressed in Euro (Eurostat, 2016).
Source: the authors
0
1
2
3
4
5
6
7
8
9
10
0%
10%
20%
30%
40%
50%
60%
70%
80%
90%
100%
DE EL ES FI FR HU IE NL PL Total
0-1
0 s
atis
fact
ion
sca
le
% o
f fa
rms
Low level (0-5) Medium level (6-8) High level (9-10) Average
0
1
2
3
4
5
6
7
8
9
10
0%
10%
20%
30%
40%
50%
60%
70%
80%
90%
100%
2- 8 8 - 25 25-50 50-100 100-500 >500
0-1
0 s
atis
fact
ion
sca
le
% o
f fa
rms
Economic size of farms in 1000 EUR of Standard Output*
Low level (0-5) Medium level (6-8) High level (9-10) Average
Social indicators of farm-level sustainability 21
Satisfaction with dimensions of quality of life
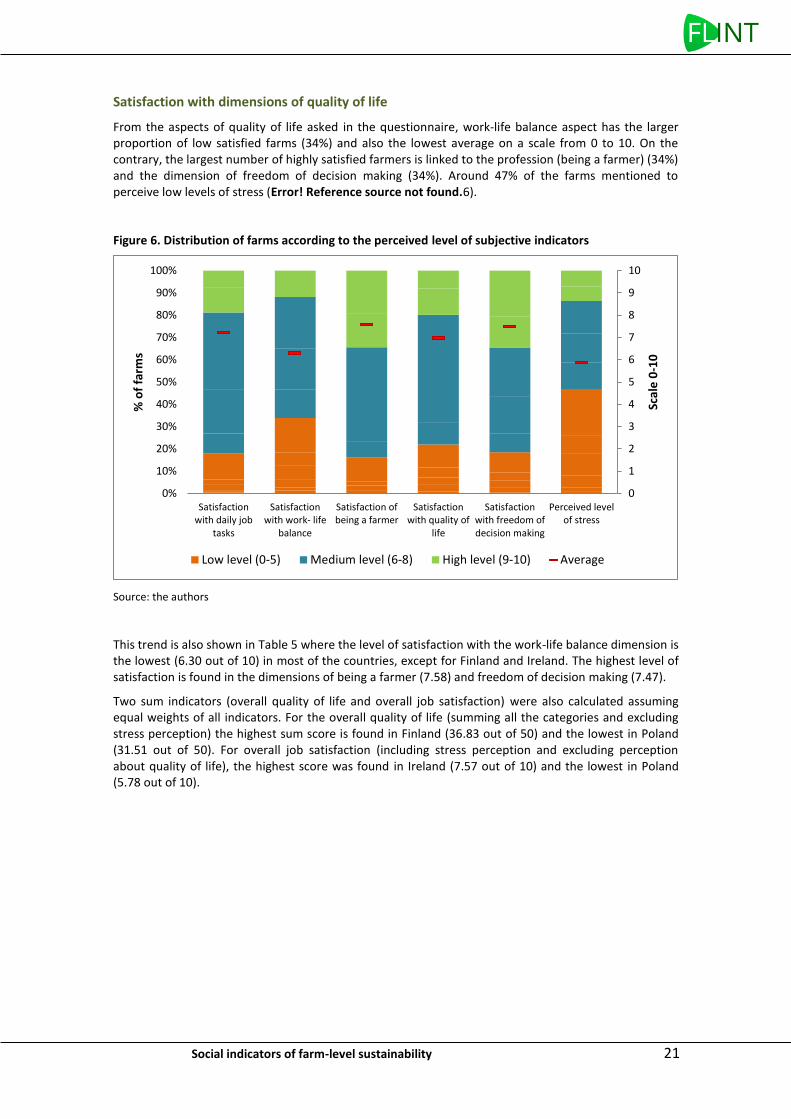
From the aspects of quality of life asked in the questionnaire, work-life balance aspect has the larger proportion of low satisfied farms (34%) and also the lowest average on a scale from 0 to 10. On the contrary, the largest number of highly satisfied farmers is linked to the profession (being a farmer) (34%) and the dimension of freedom of decision making (34%). Around 47% of the farms mentioned to perceive low levels of stress (Error! Reference source not found.6).
Figure 6. Distribution of farms according to the perceived level of subjective indicators
Source: the authors
This trend is also shown in Table 5 where the level of satisfaction with the work-life balance dimension is the lowest (6.30 out of 10) in most of the countries, except for Finland and Ireland. The highest level of satisfaction is found in the dimensions of being a farmer (7.58) and freedom of decision making (7.47).
Two sum indicators (overall quality of life and overall job satisfaction) were also calculated assuming equal weights of all indicators. For the overall quality of life (summing all the categories and excluding stress perception) the highest sum score is found in Finland (36.83 out of 50) and the lowest in Poland (31.51 out of 50). For overall job satisfaction (including stress perception and excluding perception about quality of life), the highest score was found in Ireland (7.57 out of 10) and the lowest in Poland (5.78 out of 10).
0
1
2
3
4
5
6
7
8
9
10
0%
10%
20%
30%
40%
50%
60%
70%
80%
90%
100%
Satisfactionwith daily job
tasks
Satisfactionwith work- life
balance
Satisfaction ofbeing a farmer
Satisfactionwith quality of
life
Satisfactionwith freedom ofdecision making
Perceived levelof stress
Scal
e 0
-10
% o
f fa
rms
Low level (0-5) Medium level (6-8) High level (9-10) Average
22 Social indicators of farm-level sustainability
Table 5. Descriptive statistics of subjective indicators by country
DE EL ES FI FR HU IE NL PL Total
Satisfaction with daily job tasks
N 51 124 127 49 279 101 63 155 146 1,095
mean 6.84 7.81 7.38 7.88 6.94 7.01 8.08 7.85 6.17 7.23
SD 1.96 1.76 1.58 1.22 1.71 2.08 1.57 0.94 1.90 1.76
Satisfaction with work life balance
N 51 124 126 49 278 101 62 155 146 1,092
mean 6.43 5.55 6.40 7.51 5.94 6.05 7.68 7.23 5.68 6.30
SD 2.20 2.81 2.19 1.36 2.14 2.41 1.80 1.30 1.87 2.18
Satisfaction with being a farmer
N 51 124 127 49 279 100 63 155 146 1,094
mean 7.57 7.23 7.60 7.73 7.73 7.31 8.56 8.07 6.74 7.58
SD 2.46 2.57 1.98 1.74 2.10 2.05 1.55 0.99 2.42 2.09
Satisfaction with quality of life
N 51 124 127 49 279 101 63 128 146 1,068
mean 6.78 6.34 6.72 8.24 6.97 6.95 8.10 7.90 6.10 6.97
SD 2.01 2.65 2.15 0.90 2.01 2.06 1.70 0.95 1.90 2.05
Satisfaction with freedom of decision making
N 51 124 126 49 279 101 59 155 146 1,090
mean 7.04 9.11 7.79 7.45 7.19 7.90 6.54 7.26 6.82 7.47
SD 2.35 1.66 2.09 1.43 2.27 2.05 2.20 1.30 2.20 2.12
Stress perception (S_6_6)
N 47 123 125 48 280 102 61 149 146 1,081
mean 6.04 7.62 5.30 5.96 5.74 6.45 4.54 4.61 6.53 5.88
SD 2.28 2.39 2.24 2.08 2.12 2.60 2.21 1.83 2.00 2.35
Overall quality of life (sum of S_6_1, S_6_2, S_6_3, S_6_4 and S_6_5)
N 52 124 128 49 280 102 63 155 146 1,099
mean 34.00 36.04 35.48 38.82 34.63 34.80 38.41 36.93 31.51 35.19
SD 9.58 7.29 8.81 4.99 7.74 8.79 7.62 5.16 7.72 7.82
Overall job satisfaction (sum of S_6_1, S_6_2, S_6_3, S_6_5 and S_6_6b divided by 5)
N 47 123 122 48 276 100 56 149 146 1,067
mean 6.41 6.41 6.73 6.92 6.43 6.38 7.37 7.15 5.78 6.54
SD 1.63 1.28 1.50 1.08 1.37 1.44 1.21 0.88 1.35 1.38
Source: the authors
As expected the subjective indicators are highly correlated mutually (Table 6). A significant and high correlation (r=0.6092) exists between satisfaction with work-life balance and satisfaction with quality of life; high levels of correlations (r=0.5382) were also found between satisfaction of work-life balance and job satisfaction. Satisfaction with quality of life is also significantly correlated with being a farmer (r=0.5669), job satisfaction (r=0. 5338) and to a lesser extent with the satisfaction of freedom in decision making (r=0.3159). The perceived level of stress is significantly negatively related with all the dimensions asked, except with the satisfaction with freedom of decision making (Table 6).
Social indicators of farm-level sustainability 23
Table 6. Correlations between subjective indicators
Satisfaction with daily job tasks
Satisfaction with work
life balance
Satisfaction with being a farmer
Satisfaction with quality
of life
Satisfaction with freedom
of decision making
Satisfaction with daily job tasks
Satisfaction with work life balance 0.5382*
Satisfaction with being a farmer 0.5184* 0.4348*
Satisfaction with quality of life 0.5338* 0.6092* 0.5669*
Satisfaction with freedom of decision making 0.3079* 0.1892* 0.3203* 0.3159*
Stress perception (S_6_6) -0.1754* -0.3127* -0.2353* -0.2857* 0.0272
*p value<0.05
Source: the authors
3.1.5 Continuity of the farm (succession)
The FLINT questionnaire included also questions on the continuity of the farms. Only 15% of the total sample (167 farms) stated plan to quit for retirement or other reasons in the next 5 years. Among those, 73 have identified a successor in their children or family. Around 43% of the 167 farms which plan to retire in the next years do not have identified a successor (Table 7).
Table 7. Number of farms planning to quit farming and identified successor
Identified successor
Plan to quit farming
Spouse Children Somebody else from the family
Somebody outside the
familiy
Irrelevant None Total
Plan to quit for retirement 6 67 7 11
42 133
Plan to quit for other reason 1 6 2 1 4 23 37 No plan to give up in next 5 years 10 336 21 23 271 188 849
Do not know 1 14 4 1 11 14 45
Total 18 423 34 36 286 267 1,064
Source: the authors
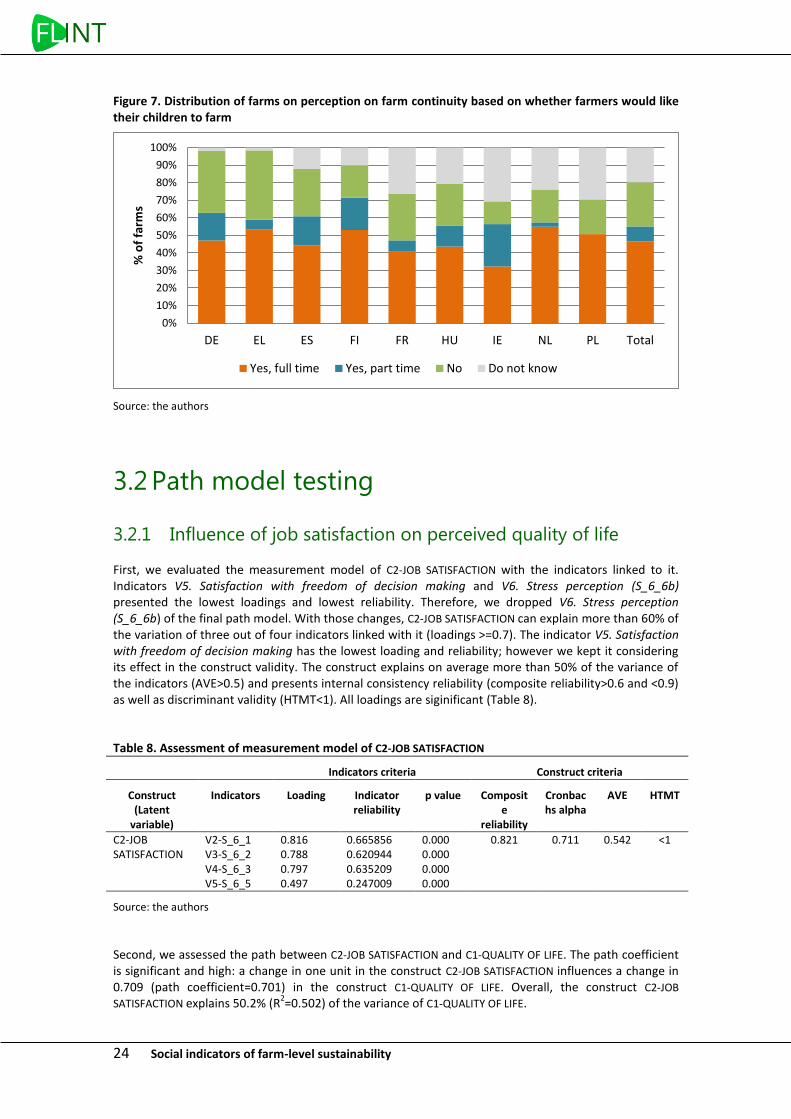
The perception and attitude of farmers towards farming and their continuity was also collected with a question asking whether the farmer would like his or her children to farm. The largest share of farmers responded that they would like their children to farm full time (46%). Around a quarter of the sample answered that they would not like their children to farm, with differences across countries (Figure 7).
24 Social indicators of farm-level sustainability
Figure 7. Distribution of farms on perception on farm continuity based on whether farmers would like their children to farm
Source: the authors
3.2 Path model testing
3.2.1 Influence of job satisfaction on perceived quality of life
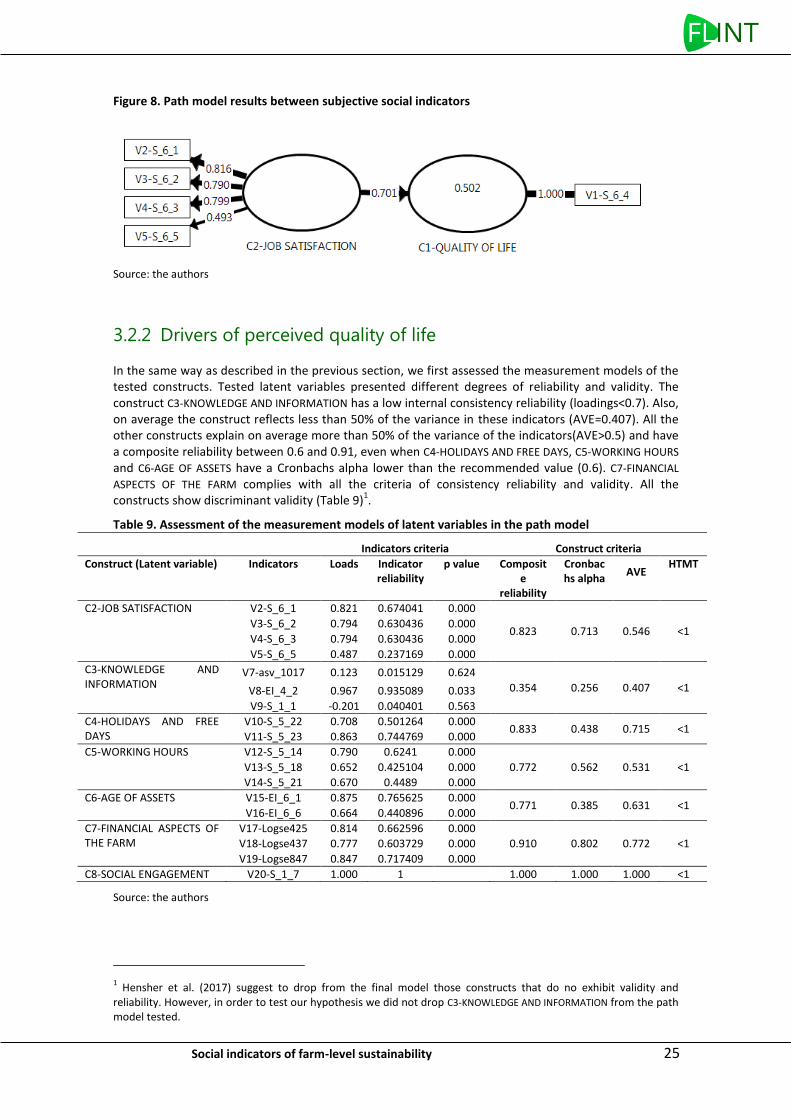
First, we evaluated the measurement model of C2-JOB SATISFACTION with the indicators linked to it. Indicators V5. Satisfaction with freedom of decision making and V6. Stress perception (S_6_6b) presented the lowest loadings and lowest reliability. Therefore, we dropped V6. Stress perception (S_6_6b) of the final path model. With those changes, C2-JOB SATISFACTION can explain more than 60% of the variation of three out of four indicators linked with it (loadings >=0.7). The indicator V5. Satisfaction with freedom of decision making has the lowest loading and reliability; however we kept it considering its effect in the construct validity. The construct explains on average more than 50% of the variance of the indicators (AVE>0.5) and presents internal consistency reliability (composite reliability>0.6 and <0.9) as well as discriminant validity (HTMT<1). All loadings are siginificant (Table 8).
Table 8. Assessment of measurement model of C2-JOB SATISFACTION
Indicators criteria Construct criteria
Construct (Latent
variable)
Indicators Loading
Indicator reliability
p value Composite
reliability
Cronbachs alpha
AVE
HTMT
C2-JOB SATISFACTION
V2-S_6_1 0.816 0.665856 0.000 0.821
0.711
0.542
<1 V3-S_6_2 0.788 0.620944 0.000 V4-S_6_3 0.797 0.635209 0.000 V5-S_6_5 0.497 0.247009 0.000
Source: the authors
Second, we assessed the path between C2-JOB SATISFACTION and C1-QUALITY OF LIFE. The path coefficient is significant and high: a change in one unit in the construct C2-JOB SATISFACTION influences a change in 0.709 (path coefficient=0.701) in the construct C1-QUALITY OF LIFE. Overall, the construct C2-JOB
SATISFACTION explains 50.2% (R2=0.502) of the variance of C1-QUALITY OF LIFE.
0%
10%
20%
30%
40%
50%
60%
70%
80%
90%
100%
DE EL ES FI FR HU IE NL PL Total
% o
f fa
rms
Yes, full time Yes, part time No Do not know
Social indicators of farm-level sustainability 25
Figure 8. Path model results between subjective social indicators
Source: the authors
3.2.2 Drivers of perceived quality of life
In the same way as described in the previous section, we first assessed the measurement models of the tested constructs. Tested latent variables presented different degrees of reliability and validity. The construct C3-KNOWLEDGE AND INFORMATION has a low internal consistency reliability (loadings<0.7). Also, on average the construct reflects less than 50% of the variance in these indicators (AVE=0.407). All the other constructs explain on average more than 50% of the variance of the indicators(AVE>0.5) and have a composite reliability between 0.6 and 0.91, even when C4-HOLIDAYS AND FREE DAYS, C5-WORKING HOURS and C6-AGE OF ASSETS have a Cronbachs alpha lower than the recommended value (0.6). C7-FINANCIAL
ASPECTS OF THE FARM complies with all the criteria of consistency reliability and validity. All the constructs show discriminant validity (Table 9)
1.
Table 9. Assessment of the measurement models of latent variables in the path model
Indicators criteria Construct criteria
Construct (Latent variable) Indicators Loads Indicator reliability
p value Composite
reliability
Cronbachs alpha
AVE
HTMT
C2-JOB SATISFACTION V2-S_6_1 0.821 0.674041 0.000
0.823 0.713 0.546 <1 V3-S_6_2 0.794 0.630436 0.000
V4-S_6_3 0.794 0.630436 0.000
V5-S_6_5 0.487 0.237169 0.000
C3-KNOWLEDGE AND INFORMATION
V7-asv_1017 0.123 0.015129 0.624
0.354 0.256 0.407 <1 V8-EI_4_2 0.967 0.935089 0.033
V9-S_1_1 -0.201 0.040401 0.563
C4-HOLIDAYS AND FREE DAYS
V10-S_5_22 0.708 0.501264 0.000 0.833 0.438 0.715 <1
V11-S_5_23 0.863 0.744769 0.000
C5-WORKING HOURS V12-S_5_14 0.790 0.6241 0.000
0.772 0.562 0.531 <1 V13-S_5_18 0.652 0.425104 0.000
V14-S_5_21 0.670 0.4489 0.000
C6-AGE OF ASSETS V15-EI_6_1 0.875 0.765625 0.000 0.771 0.385 0.631 <1
V16-EI_6_6 0.664 0.440896 0.000
C7-FINANCIAL ASPECTS OF THE FARM
V17-Logse425 0.814 0.662596 0.000
0.910 0.802 0.772 <1 V18-Logse437 0.777 0.603729 0.000
V19-Logse847 0.847 0.717409 0.000
C8-SOCIAL ENGAGEMENT V20-S_1_7 1.000 1 1.000 1.000 1.000 <1
Source: the authors
1 Hensher et al. (2017) suggest to drop from the final model those constructs that do no exhibit validity and
reliability. However, in order to test our hypothesis we did not drop C3-KNOWLEDGE AND INFORMATION from the path model tested.
26 Social indicators of farm-level sustainability
In a second step, we have assessed the path model hypothesized. Despite most of the paths coefficients that explain C2-JOB SATISFACTION being significant, the influence of all the the constructs in C2-JOB
SATISFACTION is low (Table 10). C3-KNOWLEDGE AND INFORMATION is not significant, while C6-AGE OF
ASSETS and C5-WORKING HOURS are significantly negatively associated with C2-JOB SATISFACTION. The construct tested that has a larger influence in C2-JOB SATISFACTION is C7-FINANCIAL ASPECTS OF THE FARM
(path coefficient=0.204), when everything else remains constant. The construct C8-SOCIAL ENGAGEMENT
formed by a single measurement, has a low path value with C2-JOB SATISFACTION and a slightly larger influence on C1- QUALITY OF LIFE.
Table 10. Path coefficients and significance
Path coefficient p values
H1: C2-JOB SATISFACTION → C1- QUALITY OF LIFE 0.676 0.000
H2: C3-KNOWLEDGE AND INFORMATION → C2-JOB SATISFACTION 0.093 0.175
H3: C4-HOLIDAYS AND FREE DAYS → C2-JOB SATISFACTION 0.182 0.000
H4: C5-WORKING HOURS → C2-JOB SATISFACTION -0.126 0.000
H5: C6-AGE OF ASSETS → C2-JOB SATISFACTION -0.078 0.012
H6: C6-AGE OF ASSETS → C1-QUALITY OF LIFE -0.053 0.058
H7: C7-FINANCIAL ASPECTS OF THE FARM → C2-JOB SATISFACTION 0.204 0.000
H8: C7-FINANCIAL ASPECTS OF THE FARM → C1-QUALITY OF LIFE 0.058 0.008
H9: C8-SOCIAL ENGAGEMENT → C2-JOB SATISFACTION 0.062 0.021
H10: C8-SOCIAL ENGAGEMENT → C1-QUALITY OF LIFE 0.072 0.000
Source: the authors
Overall, 12% (R2=0.120) of the variance of the construct C2-JOB SATISFACTION is explained by the
constructs linked to them. According to Hensher et al. (2017), this value could be considered as weak in business research, while it is similar to the values described by OECD (2013) namely between 3 and 35% mentioned in the studies aimed to find drivers of subjective well-being indicators. Similar to the results of the previous section, the construct C2-JOB SATISFACTION explains more than 51.6 % (R
2=0.516) of the
variance of C1- QUALITY OF LIFE (Figure 9).
Social indicators of farm-level sustainability 27
Figure 9. Path model results for social indicators
Source: the authors
28 Social indicators of farm-level sustainability
4 CONCLUSION We have explored to which extent do objective and subjective indicators of social dimension of sustainability collected during the FLINT project reflect the concept of quality of life at farm level. About subjective indicators of quality of life
Most of the subjective manifest indicators are significantly correlated. Subjective indicators of perceived satisfaction with quality of life (excluding stress perception level) asked in FLINT can be explained by a latent construct called C2-JOB SATISFACTION which presents internal reliability and validity. This construct can explain around 50% of the variance of the perceived satisfaction with quality of life of the farmers in the sample. Implications for data collection on subjective indicators can be outlined: (i) One question of perceived satisfaction with quality of life could represent the multiple dimensions explored in FLINT and (ii) four dimensions of perceived satisfaction of quality of life could be used to determine a theoretical construct of perceived quality of life or job satisfaction. The value of this construct could be used to relate with other aspects of sustainability at farm level.
About drivers of subjective indicators of quality of life
In the present case study, drivers of perceived satisfaction of quality of life were explored. Those drivers are derived from manifested variables based on FLINT or FADN data. Reliability and validity varied according to the hypothesized latent variables. Theoretical constructs such as C3-KNOWLEDGE AND
INFORMATION presented low reliability and validity. Although all the other constructs have an acceptable convergent validity and composite reliability, their influence in the construct C2-JOB SATISFACTION is significant but rather weak: those constructs explain 12% of the variance of the construct, meaning that more than 80% of the variance of the construct is determined by factors not included in the available database. While searching for drivers of perceived satisfaction with quality of life, we have to consider the “omitted variable problem”: this analysis explored the influence of extrinsic farm level attributes in the subjective perception of quality of life. Two other factors are not included in the analysis that may influence that perception. The first one is the favourability of the social or economic environment around the farmers: regional or local indicators of well-being beyond farm-level (Jantsch et al. 2016). The second one is the consideration of intrinsic reasons of the individual that affects satisfaction with job (Krumbiegel et al. 2016). These results suggests that, if collected data at farm level do not strongly represent the perceived dimension of quality of life, then it is necessary to ask those subjective dimensions directly to the farmers.
About the analysis and use of indicators of quality of life and its drivers
This case study illustrates a possible way to find the drivers of job satisfaction using integrated information at farm level. Metholodogical limitations during the analysis should be considered: (i) the nature of the constructs (formative or reflective) should be further explored and assessed consistently; (ii) the hierarchichal order of the constructs in the description of working conditions and (iii) the differences between groups for accounting for heterogeneity and fixed effects of regions, types of farms, and individual characteristics. With the data collected, several analyses and methodologies could be done: instrumental variables to link financial data with job satisfaction, possible models to relate perceived quality of life and succession, analysis of drivers for each dimension of job satisfaction and analysis of the role of social participation on both job satisfaction and quality of life. The collection of information in different periods of time would enable to control for external factors influencing perceived quality of life.
Social indicators of farm-level sustainability 29
5 REFERENCES Besser, T.; Mann, S. (2015): Which farm characteristics influence work satisfaction? An analysis of two agricultural systems. In Agricultural Systems 141, pp. 107–112.
Bitsch, V.; Hogberg, M. (2005): Exploring horticultural employees' attitudes toward their jobs. A qualitative analysis based on Herzberg's theory of job satisfaction. In Journal of Agricultural and Applied Economics 37 (03), pp. 659–671.
European Commission (2015): EU farm economics overview. Based on 2012 FADN data. European Commission. DG Agriculture & Rural Development. Brussels, Belgium.
Eurostat (2015): Quality of life. Facts and views. Luxembourg: Publications Office of the European Union. European Union. Statistical books.
Eurostat (2016): Agriculture, forestry and fishery statistics. 2016 edition. Luxembourg: Publications Office of the European Union. European Union. Agriculture and fisheries. Statistical books.
Hair, J.F. (2010): Multivariate data analysis. A global perspective. 7. ed., Upper Saddle River, NJ, Munich, Germany: Pearson.
Hair, J. F.; Hult, G. T. M.; Ringle, M. CH.; Sarstedt, M. (2017): A primer on partial least squares structural equations modeling (PLS-SEM). United States of America: Sage Publications.
Hair J. F.; Sarstedt, M.; Hopkins, L.; Kuppelwieser, V.G. (2014): Partial least squares structural equation modeling (PLS-SEM). In European Business Review 26 (2), pp. 106–121.
Hirschauer, N.; Lehberger, M.; Musshoff, O. (2015): Happiness and utility in economic thought—or. what can we learn from happiness research for public policy analysis and public policy making? In Social Indicators Research 121 (3), pp. 647–674.
Howley, P. (2015): The happy farmer. The effect of nonpecuniary benefits on behavior. In American Journal of Agricultural Economics 97 (4), pp. 1072–1086.
Jantsch, A.; Wunder, C.; Hirschauer, N. (2016): Lebensqualität in Deutschland – Ein Vergleich von ländlichen und städtischen Regionen. Selected paper presented in 56. Jahrestagung der GEWISOLA „Agrar- und Ernährungswirtschaft: Regional vernetzt und global erfolgreich“, Bonn, Germany.
Krumbiegel, K.; Maertens, M.; Wollni, M. (2016): The role of Fairtrade certification for wages and job satisfaction of plantation workers. GlobalFood Discussion Papers. Göttingen, Germany.
Meyerding, S. G. H. (2016): Job satisfaction and preferences regarding job characteristics of vocationals and master craftsman scholars and horticulture students in Germany. In Review of Agricultural and Applied Economics 19 (01), pp. 30–49.
Mußhoff, O.; Tegtmeier, A.; Hirschauer, N. (2013): Attraktivität einer landwirtschaftlichen Tätigkeit – Einflussfaktoren und Gestaltungsmöglichkeiten. In: Berichte über Landwirtschaft - Zeitschrift für Agrarpolitik und Landwirtschaft, Band 91, Heft 2, August 2013.
Näther, M.; Stratmann, J.; Bendfeldt, C.; Theuvsen, L. (2015): Wodurch wird die Arbeitszufriedenheit landwirtschaftlicher Arbeitnehmer beeinflusst? In Journal of Socio-Economics in Agriculture 8, pp. 85–96.
OECD (1976): Measuring social well-Being. A progress report on the development of social indicators. Paris, France: OECD.
OECD (2013): OECD guidelines on measuring subjective well-being: Paris, France: OECD Publishing.
Ringle, C. M.; Wende, S.; Becker, J.-M. (2015): "SmartPLS 3." Boenningstedt: SmartPLS GmbH, http://www.smartpls.com.
30 Social indicators of farm-level sustainability
Stiglitz, J. E.; Sen, A.; Fitoussi, J. (2010): Mismeasuring our lives. Why GDP doesn't add up; the report by the Commission on the Measurement of Economic Performance and Social Progress. New York, NY, United States of America: New Press.