Embed Size (px)
Citation preview

Social Heterogeneity and Wasteful Lobbying
Marcel Fafchamps†, Alain de Janvry,††, and Elisabeth Sadoulet††
June 1993
Last revision: September 1996
Abstract
Using a general equilibrium model with endogenous policy, we explore how hetero-
geneity affects wasteful lobbying by sectoral interest groups. With the help of a simula-
tion approach, we first investigate the impact of information heterogeneity on how lob-
bies react to a shift from a soft to a strict government budget constraint. Next, we exam-
ine how lobbying is influenced by heterogenous perception of the general equilibrium
implications of lobbying effort. Finally, we explore the consequences of heterogenous
specialization in households’ asset portfolios. We conclude that social heterogeneity in
information, perceptions, and portfolio compositions increases incentives to lobby.
_______________
† Stanford University; †† University of California at Berkeley. Correspondence should be sent to:Marcel Fafchamps, Department of Economics, Stanford, CA 94305.

Heterogeneity and Wasteful Lobbying
1. Heterogeneity as a Source of Wasteful Lobbying
Thanks to the important contributions of the public choice school, economists and
political scientists have long recognized that lobbying activities can be an important
source of resource wastage (e.g., Tullock, 1980; Krueger, 1974; Bhagwati, 1982). This
happens not only through the policy distortions which lobbying may induce, but also
through the wastage of resources which are rationally expended in lobbying activities by
special interest groups. In recent years, considerable attention has been given to the role
of heterogeneity of incomes or endowments in collective action (e.g., Quiggin, 1993;
Johnson and Libecap, 1982). In that literature, heterogeneity has been analyzed in terms
of the role which intra-group differences play on the ability of a group to cooperate, gen-
erally finding that some forms of heterogeneity are detrimental to successful cooperation
(e.g., Baland and Platteau, 1996). Here, we focus instead on aspects of heterogeneity
across groups which may induce particular groups to modify their lobbying behavior.
Interest in inter-group heterogeneity is in part motivated by widespread political
liberalization which has removed the lid on internal conflicts of influence over the state.
In highly heterogenous societies, like those in the Balkans, Eastern Europe, and Africa,
such conflicts have frequently unleashed intense wars of influence over state policy. One
factor that seems to have played an important role in the success of economic and politi-
cal reforms is the degree of inter-group heterogeneity characterizing the communities
that have acquired greater control over local governments in the wake of political liberal-
ization.
2
Interest in inter-group heterogeneity is also related to the effect it has on the out-
come of economic liberalization. Reforms modify the prevailing political equilibrium
and appear to induce a flurry of new lobbying activity. For instance, stabilization and
adjustment policies have typically closed the era of debt-financed soft budget constraints.
In their stead, these policies have introduced strict budgetary rules. These changes seem
to have created incentives for increased lobbying. Further, in a context of heterogeneity,
uneven information about reforms across groups may induce better informed groups to
increase lobbying and capture a rent from the other groups’ ignorance. Rising hetero-
geneity in sectoral rigidities can also induce more rigid sectors to seek trade protection
through lobbying. Finally, increasing heterogeneity in the asset portfolio of households
may induce more lobbying compared to a situation where the state plays an important
redistributive role and economic interests are less polarized. If sectoral rigidities get
reinforced by growth and liberalization, and if household portfolios of physical and
human capital become increasingly sector-specific, incentives may be created for sectors
and interest groups to intensify wasteful lobbying expenditures, thereby dissipating some
of the expected benefits of economic reform.
In this paper, we develop a formal model of endogenous lobbying behavior to
explore these aspects of the role of heterogeneity. The framework is inspired from the
works of Tullock (1980), Zusman (1976), Becker (1983), and Magee, Brock, and Young
(1989). Specifically, we use an archetype general equilibrium model where specific
social and economic features lead to different levels of endogenous resource wastage in
lobbying. Unlike Grossman and Helpman (1994), we do not restrict ourselves to a partic-
ular set of political institutions, e.g., campaign supports. In our model, the policy is
defined by maximization of a governance function which can be derived, following

3
Zusman (1976), from a game theoretic formulation in which the government has its own
agenda which lobbies can influence by rewards and punishments. Instead of focusing on
direct transfers between groups, as in Swinnen and de Gorter (1993), we focus on trade
policy. In the formulation that we adopt, interest groups have a Stackelberg leadership
position relative to the state, while they play a Nash non-cooperative game with each
other. We do not, as in Baik (1994), allow winners to compensate losers through side
payments. The simulation framework we propose is highly versatile and can be adapted
to explore other aspects of collective action in a general equilibrium framework where
the level of complexity typically prevents obtaining analytical solutions.
We focus our attention on aspects of heterogeneity that are potential determinants
of increased resource wastage in lobbying. First, we consider shifts in budgetary rules
from soft budget constraint to fiscal discipline and heterogenous information across
groups about the reforms in progress. We then turn to heterogenous time horizons across
groups and assume that some groups only visualize the partial equilibrium implications
of lobbying. We examine whether there is room for strategic games of myopia where
pretense of ignorance of the general equilibrium effects of lobbying may enhance the
bargaining position of a particular lobby. Next, we investigate the effect of heterogeneity
in sectoral rigidity. Finally, we explore how lobbying efforts respond to increasing
heterogeneity in the level of specialization of household assets portfolios. Given that our
results rely on numerical simulations, they should be considered as exploratory and are
not fully generalizable without further analytical work. They nevertheless provide valu-
able insights regarding the processes at work and should help guide future work in this
promising area.
4
2. A Model of Lobbying for Trade Protection
To minimize the risk of ‘black box’ effects that often plague intricate general equili-
brium models, we organize our presentation around a simple neo-classical model with
three sectors, two of which produce tradables (e.g., Fafchamps, Sadoulet and de Janvry
(1993)). The state chooses tariffs to maximize a weighted sum of individual utilities.
Owners of physical and human capital in each sector lobby the state for trade protection.
Lobbying is wasteful. The order in which agents make decisions is assumed to be as fol-
lows. Lobbies move first by choosing their level of lobbying effort. All lobbies move
simultaneously. Lobbying determines, through an influence function, the weights that the
state attributes to each sector in its governance function. Taking the lobbies’ actions as
given, the state then maximizes social welfare by choosing a set of trade taxes, tariffs and
subsidies. These policies affect relative prices and thus the production and consumption
decisions of producers and consumers in the economy. Thus, while the state act as a
Stackelberg leader with respect to producers and consumers, lobbies as a group act as
Stackelberg leaders with respect to the state: they set the level of their lobbying effort
after internalizing the state’s reaction function. Among themselves, however, lobbies
play a Nash game.
The three-tier Nash-Stackelberg structure of the model makes it difficult to derive
analytical results linking lobbying to heterogeneity in the economy itself. This is why we
rely on a numerical approach. We begin by presenting the structure of the economy. We
then introduce the state’s optimization problem and explain how trade policy is deter-
mined. We then model tariff seeking by lobbies. The functional forms and numerical
algorithm used in the simulations are presented in a technical appendix.
5
2.1 The Economy
The economy has three sectors denoteda, m, ands. Two of these sectors, which for
exposition purposes we shall call agriculturea and manufacturingm, produce tradables.
The third,s, which we call services, produces non-tradables. Interindustry flows of inter-
mediate goods are ignored. Output is produced with two factors, capital and labor.
Sector-specific human capital and skills are treated as part of capital. Unlike in Mayer
(1984), capital is treated as a fixed factor: it cannot be reallocated from one sector to
another. Labor is mobile across sectors; consequently, there is a single wage ratepl .
Producers maximize profits. They behave competitively and take pricespa, pm, ps,
and wagespl as given. ProfitsΠh in sectorh ∈ H ≡ {a, m, s} are given by the profit
function Πh(pa, pm, ps, pl ). Output supply in sectorh is denotedQhh; labor demand in
the same sector (which, by construction, is a negative number) is writtenQhl . From
optimality we have:
Qhh = ∂ph
∂Πh_____ and Qhl = ∂pl
∂Πh_____, h ∈ {a, m, s}. (1)
Factor income is distributed to households according their their endowments of cap-
ital and labor. Each household has one unit of pure labor sold at the going wage ratepl .
Households own all the capital in the economy. Relative endowments of capital and
labor are idential across households but individual households own capital only in one of
the three sectors.1 As a result, they naturally identify with that sector. Unlike Magee,
Brock, and Young (1989), we focus on sectoral issues and ignore possible divergence of
interest between workers and owners of capital. Given these assumptions, lobbying is
_______________1 We dispense with this assumption in section 5 where we investigate the effect of asset portfolio
composition on lobbying.

6
organized along sectoral interest lines.
The number of households who own capital in sectorh is written Nh; they are all
identical. Total population is denotedN ≡ h ∈ HΣ Nh. Household income is the sum of sec-
toral profitsΠh, wage incomepl Nh, taxesTh, and lobbying expenditurespl Lh whereLh
is the level of labor resources devoted to lobbying (see infra). Individual income is thus:
yh = Nh
1___ HI Πh(pa, pm, ps, pl ) + pl Nh − Th − pl Lh
JK , h∈H. (2)
Households take prices as given and maximize their utility subject to the above budget
constraint. Their indirect utility function isVh(yh, pa, pm, ps). Consumption demand by
householdh for goodk is denotedchk. It is a function of prices and income and is related
to Vh by Roy’s identity, i.e.:
chk = −∂ Vh/∂ yh
∂ Vh/∂ pk_________. (3)
The market clearing condition for labor and services are:
h∈HΣ (Nh + Qhl − Lh) = 0 (4)
h∈HΣ (Qhs − Nhchs) = 0 (5)
The price of tradable goodst ∈{a, m} is fully determined by the exchange ratee, the
international pricept* , and an ad valorem tariff denotedtt :
pt = e pt* (1 + tt), for t∈{a, m}. (6)
The tariff turns into a trade subsidy iftt < 0. The balance of trade is:
t∈{a, m}Σ pt
* h∈HΣ (Qht − Nhcht) = 0. (7)
Equations (1) to (7) fully describe how the economy responds to changes in lobbyingLh,
taxesTh, and tariffstt . Since the resulting system of equations is homogenous in prices
and satisfies Walras Law, one price,pl , is chosen as numeraire and the trade balance,
7
equation (7), is dropped.
2.2 The State’s Optimization Problem
The state maximizes a governance functionh∈HΣ IhVh(yh, pa, pm, ps) defined over
the utility levels of the three types of households. Welfare weightsIh capture the sym-
pathies of the state; they can be altered through lobbying. Unlike in Feenstra and
Bhagwati (1982) and Findlay and Wellisz (1982) where a direct relationship between
lobbying and policy is postulated, we assume that lobbying by sectoral interest groups
only influence the weight they have in the government’s welfare function. The state, not
lobbies, remains ultimately in charge of policy decisions.
To focus attention on trade protection, we assume that the policy instruments con-
trolled by the state include sector-specific tariffsta andtm on tradable goods. The state’s
budget constraint is:
G = −t∈{a, m}
Σ e pt* tt
h∈HΣ (Qht − Nhcht), (8)
whereG is government surplus (deficit in the case of trade subsidies). This surplus is
returned to households through lumpsum transfersTh. Unlike Swinnen and de Gorter
(1993), we assume that the state cannot use these transfers to redistribute resources
among households.2 Consequently, we assume thatG is redistributed equally among
households, i.e.:
Th = N
Nh___ G. (9)_______________
2 If lumpsum transfers can be used for redistribution, the second welfare theorem implies that allocativedecisions can be separated from equity issues: interest groups would lobby for direct transfers but preservefirst best in trade (e.g., Feenstra and Bhagwati (1982)). Grossman and Helpman (1994) identify conditionsunder which lobbies may prefer to have the government use trade policy to transfer income.

8
The state is subject to political pressure but is otherwise efficient. As in Appelbaum
and Katz (1987), the state takes consumers’ and producers’ reaction functions into
account when setting relative prices through its choice of tariffs. The state also under-
stands the budgetary and general equilibrium implications of its policies. It treats world
pricespt* , lobbying effortLh, and populationsNh as given. Its optimization problem can
thus be written:
ta, tmMax
h∈HΣ IhVh(yh, pa, pm, ps) (10)
subject to equations (1) to (6), (8), (9), andpl = 1.
This system of equations is undetermined ine and tt . It is indeed easy to see from
equation (6) that tariffs and the exchange rate always appear jointly in the forme(1+tt).
The exchange rate cannot, therefore, be identified separately from thett ’s. The reason is
that the same domestic prices can be achieved through a low exchange ratee and high
tariffs ta and tm, or with a highe and low tariffs. Since by construction the balance of
trade is always in equilibrium, the tax incidence on the government budget is identical in
both cases. To eliminate this indeterminacy, we normalize the exchange rate and set it
equal to one. With this normalization, the government effectively sets the domestic prices
of tradables by choosing trade taxes. The model can thus be simplified by letting the
government choose domestic prices of tradables directly and dropping equations (6).
With these changes, the state optimization problem can be rewritten:
pa, pm, ps, GMax
h∈HΣ IhVh(yh, pa, pm, ps) (11)
subject to
yh = Nh
1___ HAIΠh(pa, pm, ps, 1) + Nh +
N
Nh___ G − Lh
JAK, h∈H (12)
9
G = −t∈{a, m}
Σ (1 − pt) h∈HΣ (Qht − Nhcht) (13)
h∈HΣ (Nh + Qhl − Lh) = 0 (14)
h∈HΣ (Qhs − Nhchs) = 0 (15)
and the output supply, input demand, and consumption demand equations (equations 1
and 3). Taken together, these equations represent the optimization problem that the
government faces. They also implicitly determine the state’s reaction to changes in wel-
fare weights.
2.3 Tariff Seeking
We now turn to lobbying.3 Interest groups have to spend real resources in order to
gain influence (Krueger (1974), Posner (1975), Varian (1989)). We assume that lobbying
requires -- and thus wastes -- labor. The idea is that lobbying diverts productive man-
power to directly unproductive activities such as hiring consultants and lawyers, involv-
ing employees and management in lobbying activities, withdrawing production to put
pressure on government, encouraging or allowing strikes to occur, etc (e.g., Bhagwati
(1982)).
The economic, social, and political process whereby sectoral interest groups
influence the state is summarized by a reduced form influence function that transforms
lobbying laborLh into welfare weightsIh:
Ih = fh(La, Lm, Ls). (16)
Welfare weights sum to ones. Without lobbying, they are proportional to the relative size
of the population in each group, as in Becker (1983). Given the symmetry of the econ-
_______________3 The term ’lobbying’ is understood here in a broad sense. Our framework is sufficiently general to
accomodate other forms of political pressure.
10
omy, they are also equivalent to Negishi weights. Consequently, in the absence of lobby-
ing, the state opts for free trade and setsta = tm = 0 (Negishi, 1960). The initial sym-
pathies of the state are thus assumed neutral across sectors and in favor of free trade.
Lobbying can be described as tariff (or trade subsidy) seeking.
Each sectoral interest group chooses a level of tariff seeking activityLh that maxim-
izes its own utilityVh, taking the level of lobbying by other interest groups as given.4 The
effect of lobbying on utilityVh depends on howIh varies withLh, how the state modifies
relative prices in response to changes inIh, and how these changes affect production
choices, profits, wages, and consumption. Interest groups are assumed to know the
influence functions of all other groups, the state’s governance function, and the general
structure of the economy. They realize that the state is setting domestic relative prices by
manipulating trade barriers and incentives. If they are fully rational, they also understand
that the state is solving an optimization problem of the form (11) to (15). The solution to
this optimization implicitly determines how policies respond to lobbying efforts by sec-
toral interest groups. The choice facing each interest grouph can thus be written as:
Lh
Max Vh(yh, pa, pm, ps) (17)
subject to equation (16) and the first order conditions to the state’s optimization problem.
Each lobbyh takes as given the level of lobbyingLk, k ≠ h by other sectoral interests.
The Nash equilibrium of the tariff seeking game is naturally defined as the vector(s) of
lobbying efforts{L a* , Lm
* , Ls* } at which no group wants to change its level of lobbying
given the levels of lobbying of the others._______________
4 Strictly speaking, each interest group cannot spend on lobbying more than the labor resources thathave not already been wasted on tariff seeking by other groups. In the simulations reported here,decreasing returns to lobbying ensure that this upper limit is never binding and can be ignored (seeappendix).

11
We also examine what happens when interest groups fail to perceive or refuse to
acknowledge some of the macroeconomic constraints that the economy -- and thus the
state -- must eventually satisfy. If the reaction they anticipate from the state is different
from its actual behavior, interest groups are then said to be myopic or irrational. Their
erroneous anticipations nevertheless determine their lobbying effortLh and thus the
equilibrium of the economy. We focus our attention on misperceptions regarding the bal-
anced government budget and the labor market equilibrium condition. To derive the
state’s reaction function anticipated by myopic lobbies, a different, less constrained state
optimization problem must be solved. The reader should keep in mind that this optimiza-
tion problem is a fabrication of myopic lobbies; it is not the one that subsequently deter-
mines the state’s actual policy choices.5
Formally, the true optimization model of the state is rearranged as follows:
pa, pm, ps, GMax
h∈HΣ IhVh(yh, pa, pm, ps) − λGD2 − λLX2 (18)
subject to:
yh = Nh
1___ HAIΠh(pa, pm, ps, 1) + Nh(1 +
NX__) +
N
Nh___ G − Lh
JAK, h∈H (19)
D = G − t∈{a, m}
Σ (1 − pt) h∈HΣ (Qht − Nhcht) (20)
X = −h∈HΣ (Nh + Qhl − Lh) (21)
h∈HΣ (Qhs − Nhchs) = 0. (22)
VariablesD and X represent the government deficit and the excess demand for labor,
_______________5 Provided that levels of lobbying are publicly observable, interest groups should over time revise their
expectations regarding the state’s response to lobbying. If lobbying is not publicly observable, however,lobbies may form erroneous beliefs regarding the level of lobbying activity by other interest groups (e.g.,conspiracy theory) instead of realizing the existence of macroeconomic constraints. This in turn may leadto more lobbying. These issues are left for future research.
12
respectively. If myopic interest groups implicitly postulate the existence of surplus labor,
excess demand for laborX may arise. We assume that it is met by extra effort provided
by all households in proportion to their labor force. To ensure that Walras Law still holds,
the extra labor incomepl X is distributed among households -- hence the extraX /N term
in the modified income equation (19).6 Similarly, when interest groups ignore the effect
of tariff policy on the balance of trade, we suppose that they implicitly assume that
foreign borrowing provides the necessary resources to cover the trade deficit and, by
Walras Law, the government deficitD as well (see equation (20)).
VariablesX andD formally enter the state’s objective function with weightsλG and
λL. These weights can be thought of as penalty functions: if either or both of them are
small, macro constraints are violated. If these weights are large, the welfare cost of fail-
ing to satisfy constraints is high, andD andX are kept at a minimum. By settingλG and
λL to arbitrarily large numbers, the solution to systems (11) to (15) and (18) to (22) can
be made to coincide. Myopia regarding the labor market is simulated by settingλL to 0
andλG to a large positive number. Myopia about the sustainability of the government
deficit is simulated by doing the reverse.
The lobbying model presented here is too complex to be solved analytically but its
Nash equilibrium can be found numerically. A detailed description of an algorithm capa-
ble of solving the lobbying model is presented in appendix. Simulations are used in the
following two sections to explore the effects of heterogeneity on lobbying.
_______________6 If Walras Law is violated, the optimization problem of the state is ill defined and, in general,
unbounded. This implies that the reaction function of the state is itself undefined.

13
3. From Soft to Strict Budget Constraint With Heterogenous Information
A systematic feature of the post-1982 economic order is the inability of govern-
ments to maintain a soft budget constraint and to continue meeting their budget deficits
through higher levels of foreign indebtedness. For that reason, economic liberalization
generally means shifting from a soft to a strict government budget constraint. Sectoral
interest groups may differ, however, in the extent to which they recognize that the rules
of the lobbying game have changed. Differences in information about the true nature of
economic liberalization thus characterize one important dimension of heterogeneity that
may affect lobbying behavior.
The questions we raise in this section are whether the shift from soft to hard budget
constraint tends to increase or decrease lobbying, and what is the impact that asymmetric
information about new budgetary rules across interest groups has on the more and less
informed sectors and on society at large. The simulation model presented in section 2
helps provide a tentative answer to these important questions. We begin by considering
what happens when all sectoral interest groups are equally informed. We then allow for
asymmetric information.
3.1 Symmetric Information
Before we can discuss the effect that policy change has on lobbying, we need a base
run to compare results to. We therefore begin by reporting simulated base run values.
Functional forms and parameter values used in these simulations are reported in appen-
dix. The base run assumes perfectly rational lobbies with perfect information about the
strict constraints facing the economy. Simulated values are reported in experiments 1 to
3 of Table 1. Experiment 1 shows that, when allLh = 0, tariffs ta and tm equal 0 and all

14
domestic prices equal 1. This is hardly surprising since the model was deliberately set in
such a way that free trade is chosen by the state in the absence of lobbying. Because of
symmetry, there is no trade. Since there are no trade taxes or subsidies either, there is no
government budget surplus or deficit to be distributed across household groups via
transfers andG = Th = 0.
Experiment 2 shows the optimal level of lobbying that sectora would choose in the
absence of lobbying by other sectors, and the ensuing equilibrium of the economy.
Results indicates that a sector that lobbies alone influences the government’s welfare
function in such a way that it obtains an increase in its own welfare while the utilities of
the other two sectors decrease. The welfare gain is obtained through a differential price
support for the lobbying sector, withpa = 1.023. The other tradable sector is taxed. The
subsidized sector increases its production and becomes net exporter, while the taxed sec-
tor decreases its production and becomes a net importer.
The relative prices of the two tradable sectors are determined by the necessary
equilibrium between imports and exports imposed by the balance of trade constraint. The
price of non-tradables (and thus the real exchange rate) is determined by the aggregate
level of the trade imbalance. In this case, a small real devaluation results from the waste
of domestic resources due to lobbying. The price distortions imply an export subsidy for
a and an import subsidy form. These government subsidies are covered by a negative
transfer (a tax) on all three sectors. To summarize, the non-tradable sector pays a tax, the
lobbying sector gets a favorable price support, partially eroded by tax, and the other trad-
able sector is detrimentally affected by both the trade distortion and the tax.
Experiment 3 shows what happens as other sectors respond toa’s lobbying. A Nash

15
equilibrium results in which sectorsa andm decide to lobby, there is a general waste of
resources, and no effective protection is achieved. Positive marginal returns to lobbying
thus give rise to a form of prisoner’s dilemma in this game of influence. Tradable sectors
lose the most as they fruitlessly expend resources in lobbying. The non-tradable sector,
which chooses to passively watch the lobbying efforts of the two other sectors without
participating in it, only loses marginally as the overall economy shrinks.
Now that we have described the base run and that we have a better understanding of
the mechanisms at work, we are ready to compare what would happen under different
assumptions. Our first experiment is to allow for a soft budget constraint and to let
foreign capital inflows cover the government deficit. Lobbies correctly anticipate that
the state itself does not treat its own budget constraint as binding. The results from this
experiment can then be compared to experiment 3 to see how a shift from soft to hard
budget constraint affects lobbying. Table 1 reports the outcome of the experiment in
three steps: the optimal policy with no lobbying (experiment 4), the optimal lobbying
behavior of a single sector when others are not lobbying (experiment 5), and the equili-
brium solution of the lobbying game (experiment 6). These experiments are formally
equivalent to experiments 1, 2, and 3, except thatλG in equations (18-22) is now set to 0.
Consider experiment 4 first, that is, the equilibrium without lobbying. The govern-
ment can rely on foreign borrowing to cover its deficit. The resulting inflow of foreign
funds increases domestic output and welfare (GDP rises compared to experiment 1). It
also induces the classical Dutch Disease phenomenon: relative to experiment 1, there is a
large appreciation of the real exchange rate (the price of non-tradables increases to
1.073). Production in the service sector rises, attracting labor into that sector. The pro-
duction and prices of tradables decline while consumption goes up: the economy
16
becomes a net importer of tradables. The total budget deficit is 3.03, which covers the
cost of import subsidies (0.11) and allows for sizeable transfers to households (2.92). The
inflow of foreign funds allows the country to (temporarily) live above its means and is
thus beneficial to the short term welfare of all households: utility goes up in all three
groups. Long term detrimental effects on the economy are ignored here as we focus
exclusively on the effects of the Dutch Disease on lobbying activity.
Now consider the lobbying efforts of a single sector (experiment 5). Households in
sectora seek to reduce the discriminatory tax on their sector to increase output and raise
profits. The expected impact of lobbying is a lower tax (price rises from .965 to .981).
This results in a lower government deficit and thus less foreign borrowing. By supporting
the price and production of sectora, the government indirectly reduces the inflow of
foreign funds. Taxation is raised on the non-lobbying sector, but the overall deficit
remains lower than in the non-lobbying case. Hence, the "productivity" of lobbying is
reduced by the fact that it reduces the foreign transfer. This explains why the optimum
level of lobbying is lower under a soft budget constraint than it is under a strict budget
constraint. As is intuitively clear from the argument above, this effect does not depend on
parameter values and is qualitatively robust.
When all sectors follow this logic (experiment 6), the symmetry of the economy
implies that the resulting war of influence cannot induce any differential among trad-
ables. The outcome is a policy of direct transfer to households, with the implied Dutch
Disease, in addition to the resource wastage due to lobbying (experiment 6). By compar-
ing experiment 3 to experiment 6, we thus see that shifting to stricter budgetary rules
leads to more lobbying. It also results in higher prices for tradables and lower prices for
non-tradables, lower GDP as there is more resource wastage in lobbying and no more
17
inflows of funds from abroad, and consequently sharply lower utility levels for all sec-
tors.
Stabilization and adjustment are thus prone to enhance resource wastage in domes-
tic wars of influence.7 The reason why this occurs is that, under a soft budget constraint,
lobbying creates redistributive gains at a double net social cost: (1) a wastage of labor
and (2) a negative externality. This externality comes from the reduced foreign capital
inflows necessary to balance the government budget, as lobbying raises the price of trad-
ables, increases production, reduces imports, and thus lowers the trade deficit and foreign
borrowing. By contrast, with a strict budget constraint, lobbying creates redistributive
gains with a single net social cost: the associated labor wastage. By reducing the oppor-
tunity cost of lobbying, therefore, the new budgetary rules enhance the incentive to
invest in the exercise of influence.
3.2 Information Heterogeneity
During the transition from soft to strict budgetary rules, not all sectoral interest
groups may become simultaneously aware of the new rules of the game: one sector (say
m) may be informed while the other tradable sector still operates under the illusion that
the old soft budget constraint applies. There is heterogeneity. Such a situation is depicted
in experiment 7. The level of lobbying of the myopic sector is derived usingλG = 0 in
equations (18-22), but the actual equilibrium of the economy is obtained using equations
(11-15) with a binding government budget constraint.
Simulation results show that the informed sector sharply increases its lobbying
_______________7 This, of course, should not be considered as an argument against stabilization and adjustment but
rather as a warning against an undesirable consequence.

18
(experiment 7) compared to the former soft budget constraint rule (experiment 6). It also
lobbies more than under symmetric information (experiment 3). The uninformed sector
increases its lobbying only marginally, and this for defensive purposes as it sees the other
step up its attacks. The non-tradable sector again chooses not to lobby. There is less
overall lobbying than when the strict budget constraint is recognized by all sectors
(experiment 3) and hence less resource wastage and a higher GDP, thanks to the ignorant
sector. This GDP gain is basically captured by the informed sector: its price, output,
exports, and utility levels rise, while those of the uninformed sector fall marginally. Early
information or awareness about the transition from soft to strict budgetary discipline
creates a differential rent from lobbying.
4. Heterogenous Perceptions and Labor Market Constraints
We now explore how lobbying behavior is influenced by myopia regarding the
effect of lobbying on wages. We focus on differences in the degree to which sectors
correctly anticipate and are concerned by the implications of their lobbying on the labor
market. In the lobbying equilibrium with full information, we have seen that the real
wage increases as labor is wasted in lobbying activities (Table 3, experiment 3). Because
the two tradable sectors hire labor to support their lobbying efforts, the increase in real
wage represents a net cost to them and thus contributes to reducing the benefit from lob-
bying. Lobbies may, however, be myopic and fail to recognize the wage impact of lobby-
ing, either because they are ignorant or because they have a very short time horizon.
There also may be differences in lobbies’ perception of and concern for the real wage
implications of their actions.

19
We begin by examining the lobbying equilibrium in which all sectors are equally
myopic about the effect of their lobbying on the economy at large. Next, we investigate
what happens when certain sectors are more myopic than others. We also discuss the
possible existence of perverse incentives to mimic myopia in order for an interest group
to improve its position. Throughout this section, optimal levels of lobbying are obtained
by settingλL = 0 in equations (18) to (22) to compute the state’s reaction function antici-
pated by the lobbies, but the realized equilibrium is based on equations (11) to (15) with
full employment.
4.1 Symmetrical Myopia
In order to understand why myopic interest groups lobby more, we must depict what
they implicitly expect to happen as a result of their action. Experiment 7 in Table 2
presents what one sector expects to happen when it is the only one to lobby. What both
sectors expect to happen at the myopic Nash equilibrium is depicted in experiment 8.
Experiment 9 shows what actually happens when the labor market constraint is real.
Given that lobbies implicitly postulate the existence of a labor reserve, they anticipate
that all domestic prices could be raised and that production would grow in all sectors.
When only one sector actively lobbies (experiment 7), it expects to obtain a favorable
treatment which would allow it to grow more than the other sectors and hence to become
an exporter. Because of the trade balance constraint, it anticipates that the other tradable
sector will begin importing. The anticipated impact on the government budget is small:
the import tariff revenue exceeds the cost of export subsidies only by a little. The net
government revenue so generated (0.08) is distributed to households. The increase in
labor force needed to satisfy the labor demand is equivalent to 15% of the initial labor

20
available in the economy. In this myopic model, lobbies assume that this additional
employment will generate wage payments for their members.
If both sectors are myopic and actively lobby, the outcome is a high level of lobby-
ing by the two tradable sectors. The service sector again chooses not to lobby for trade
distorsions. The differential benefits sought by the lobbies cancel each other. However,
they expect that economic growth will take place and benefit all (experiment 8). In real-
ity, the economy does not have idle labor resources (experiment 9). Because of greater
use of labor in lobbying, the real wage increase by 4.2% instead of the anticipated large
drop. The economy wastes more resources and is forced into a higher real exchange rate
devaluation. The utility level in the two tradable sectors is sharply less than expected,
and also less than under perfect information. The failure to recognize that economic
resources are limited and wasted by the lobbying process thus results in more lobbying;
myopia is wasteful for all.
4.2 Asymmetrical Myopia
We now consider the case when there is heterogeneity in the sense that only one
sector, saya, is myopic. Experiment 10 presents the Nash equilibrium expected by sector
a when all sectors choose their level of lobbying optimally; experiment 11 shows the
realized equilibrium. Simulation results indicate than the myopic sector lobbies more
than the non-myopic sector. This is because myopia induces it to underestimate the cost
of lobbying. It expects the economy to grow rapidly, thereby generating benefits for all,
but especially for itself (experiment 10). The real outcome (experiment 11) is of course
much less favorable. The waste of labor resource induces a real devaluation. All sectors
lose compared to the case of lobbying under perfect foresight. Yet, the myopic sector

21
ends up better off than the informed sector, because it has lobbied more: it is less taxed
and its utility level is above that of the informed sector.
Does this result imply that lobbies have an incentive to be or to pretend to be myo-
pic? Not in terms of absolute utility. This can be seen by comparing sectoral payoffs in
experiments 3, 9, and 11 (Table 2). The corresponding payoff matrix is summarized in
the first part of Table 3. As the Table shows, if the other sector is myopic (e.g., sectora in
experiment 11), being informed yields the highest utility: 0.498 instead of 0.494. Simi-
larly, if the other sector is informed (sectorm in experiments 3 and 11), the best option is
to be informed as well: utility is 0.521 compared to 0.516. It is therefore always in a
player’s interest to be informed. Myopia is costly both at the individual and the aggregate
levels.
The interesting issue is when lobbies reason in relative instead of absolute terms, as
would be the case if sectoral payoffs with lobbying serve as threat points in a negotiation
and thus influence the bargaining power of each lobby. By pretending to be myopic, a
lobby can credibly threaten to impose a high penalty on the other sector at a relatively
low cost to itself, should the negotiation break down. Compare, for instance, experiment
3 where no sector is myopic to experiment 11 where sectora is myopic and sectorm is
not: by being myopic, sectora reduces its utility from 0.521 to 0.516. But at the same
time it reduces its opponent’s utility from 0.521 to 0.498 (Table 3, second part). Next,
compare experiment 11, where only sectorm is informed, to experiment 9 where both
sectors are myopic: by being myopic, sectorm reduces its own utility from 0.498 to
0.494, but its opponent’s utility drops from 0.516 to 0.494. Both sectors may thuspretend
to be myopic in order to improve their negotiating stance. If negotiations fail, interest
groups may feel that their future credibility is at risk unless they act the way they claimed
22
they would. The result is an enheightened war of influence and increased wastage of
domestic resources.
5. Heterogeneity in Asset Portfolios
There are other dimensions of heterogeneity whose effect on lobbying deserve to be
explored. We focus here on differences across economies in the degree to which the phy-
sical and human capital portfolio of households is diversified across sectors. Assets port-
folio specialization increases the dependence of individual households on the fate of
specific sectors of the economy. Owners of installed production capacity and sector-
specific capital and skills identify more readily with a particular sector and hence may
intensify their lobbying to protect their interests. As we now show, simulation results
confirm this intuition and indicate that sectoral heterogeneity in asset portfolios result in
greater lobbying effort.
In the base run (experiment 3), households have fully specialized asset portfolios:
all the physical and human capital they own is in a single sector. We now simulate a
situation where households have diversified portfolios and assume that one third of the
assets owned bym households is in sectora, and vice versa for sectora (experiment 12).
The rest of the capital held by householdsm anda continues to be in their own sector.
Results, shown in Table 4, show that, even though portfolio diversification is not com-
plete, the motivation to lobby has virtually disappeared. Even though households in sec-
tor s remain with a fully specialized portfolio, they continue to stay out of the lobbying
race because they have little to gain from trade protection.
These results clearly indicate that polarized economic interests in sectors exposed to

23
international trade result in higher levels of lobbying for trade protection. They are thus
broadly consistent with the casual observation that countries with polarized sectoral
interests such as those in Latin America appear less able to introduce policy reforms than
countries assets portfolios are more diversified, such as Taiwan and Malaysia. Taiwan
indeed has a more egalitarian land distribution, thanks to a widespread and successful
land reform conducted in the 1950s; its industry is highly decentralized; and human capi-
tal is widely distributed thanks to a proactive education policy. Malaysia has pursued a
policy aiming at spreading the benefits of growth across the different communities. Rul-
ing over heterogeneity appears as an evident challenge. Institutional mechanisms that
reduce portfolio specialization, such as land reform, the organization of a stock
exchange, and the creation of mutual funds, may help reduce the conflicts of interest over
trade policy and thus minimize wasteful lobbying.
6. Conclusions
Simulations with the general equilibrium model of endogenous lobbying developed
in this paper have shown that heterogeneity can have high social costs and creates seri-
ous challenges for governance. According to our results, the shift from soft budget con-
straints to strict fiscal rules that many countries have experienced as part of stabilization
and adjustment policies, is expected to induce more lobbying. Misinformation about the
new rules, especially if it is distributed unevenly across sectors, enables better informed
sectors to lobby more and to capture a lobbying rent from other sectors’ ignorance.
Myopia about the general equilibrium effects that lobbying has on the labor market
creates an incentive to lobby more as some of the costs from lobbying are underes-
timated. As a result, more myopic sectors lobby more intensively. While interest groups
24
cannot improve their absolute welfare by stategically pretending to be shortsighted, they
can enhance their relative position by doing so. This creates an incentive for interest
groups to blatanty disregard the secondary effects of their lobbying and to engage in des-
tructive lobbying initiatives, an attitude reminiscent of populist mobilization of mass sup-
port. Finally, greater heterogeneity in the ownership of productive assets leads to more
lobbying, explaining why reforms are more adamantly resisted in countries where house-
holds’ physical and human capital endowments are highly specialized. Although these
results were derived using simulations, they are qualitatively robust: the general equili-
brium effects that underlie them are fairly general and do not depend on specific parame-
ter values.
Heterogeneity in information, perceptions, and portfolio compositions thus tend to
induce socially wasteful lobbying. This result extends to inter-group issues the impor-
tance recently given to intra-group heterogeneity for collective action. It calls upon pol-
icy interventions aimed at reducing inter-group heterogeneity as an instrument to achieve
greater social efficiency when complex political economy mechanisms are involved.
Such interventions include improved information-sharing about the reforms in progress
and the secondary consequences of lobbying, and reduced specialization in households’
asset portfolio of physical and human capital through wider access to financial markets
and better (re)training opportunities.
On the methodological side, we have demonstrated that numerical simulations pro-
vide a useful tool to further our understanding of the general equilibrium processes that
influence lobbying for trade protection. The methodology developed in this paper can be
used to similarly explore other political economy processes that arise in a wide range of
concrete setups. Our analysis nevertheless serves as a warning against too much
25
optimism in our ability to derive important insights from more complicated numerical
models: even in the fully symmetrical economy used as reference point in this paper,
results are not trivial to interpret as they occur through channels that involve complex
economic and political processes. The complexity of these processes also implies that
modeling these issues analytically is likely to be difficult. Simulations can help to get a
better grasp on the most relevant mechanisms at work, thereby opening fruitful avenues
for further analytical work. This is left for future research.
26
Technical Appendix
Numerical simulations are conducted as follows. To keep simulations results free
from composition effects, we consider a fully symmetrical economy, i.e., one in which all
sectors have the same labor endowmentsNh and production technology, face the same
consumption preferences for their products, and have identical elasticities and influence
functions. Each sector produces a single good. Intermediate demand is ignored. Total
value added in each sector is equal to 9. In the absence of lobbying, labor gets two thirds
of it. Income is spend equally on all three commodities, each sector is exactly self-
sufficient in labor and there is no external trade. Prices are normalized to equal 1 in the
absence of lobbying.
Specific functional forms are chosen for the profit function, the indirect utility func-
tion, and the influence function. All three sectors share the same Generalized Leontief
profit function:
Πh = 18ph + 15pl − 18√MM M Mphpl .
The price elasticity of output is equal to 0.5 and the corresponding wage elasticity of
labor demand is 0.75. All households share the same Translog indirect utility function:
Vh = −jΣ 3
1__lny
pj___ + 21__
jΣ
kΣ0.1932 ln
y
pj___ lny
pk___.
Elasticities are calibrated so that all restrictions imposed by homogeneity and symmetry
are satisfied. The influence function is given the following form, preferred for its ease of
use and flexibility:
Ih =
k∈HΣ Nk + Lk
β
Nh + Lhβ
___________,
whereβ = 0.5 to reflect the idea that there are decreasing returns in rent seeking. This
27
assumption is essential to keep the lobbying equilibrium away from corner solutions.
Raisingβ makes lobbying easier, and results in more lobbying; other qualitative results
are essentially unchanged.
The Nash equilibrium of the lobbying game is computed numerically using a For-
tran coded algorithm developed for this purpose. The iterative numerical procedure is
articulated around a series of nested algorithms that follow closely the presentation of the
model in the text. An innermost algorithm solves the economy for output and consump-
tion much as a general computable equilibrium model, treating lobbying levelsLh and
tariffs th as given. Government transfers are endogenously determined using equation
(9). When lobbies are myopic, the modified version of the economy is used instead (see
equations 19-22).
This inner algorithm essentially determines a numerical relationship between tariff
ratesth and utility Vh. It is then ‘fed’ to a first outer algorithm that solves the state’s
optimization problem. This outer algorithm takes lobbying effortsLh and welfare
weightsIh as given and returns utility levels for each sectoral interest group. This outer
algorithm defines a new (numerical) function mapping lobbyingLh to utility Vh. Again,
if lobbies are myopic, the modified version of the state’s optimization problem is used
instead.
A second outer algorithm then finds the optimum level of lobbying for, say, interest
groupa by maximizinga’s utility subject to the numerical relationship between its level
of lobbyingLa andVa given by the first outer algorithm (or subroutine). When maximiz-
ing its own utility, interest groupa treats the levels of lobbyingLm andLs as given. The
solution to this second outer algorithm givesa’s best response to actionsLa andLs taken

28
by the other two lobbies.
The Nash equilibrium of the lobbying game is found by iterating among the three
interest groups as follows. We first findLa* given Lm = Ls = 0. We then findLm
* given
La = La* andLs = 0. Next, we findLs
* givenLa = La* andLm = Lm
* . We then go back toa
and resolves forLa** given Lm = Lm
* and La = La* . Iterating among the three interest
group eventually converges in a cobweb-like fashion to a vector of lobbying efforts that
is the (evolutionary stable) Nash equilibrium of the lobbying game. In the case of myo-
pic lobbies, we then resolve the state’s optimization problem using these levels of lobby-
ing and the true macroeconomic constraints. Simulation results are reported in Tables 1
to 4 and discussed in detail in the text.
29
References
Appelbaum, E. and Katz, E., ‘‘Seeking Rents by Setting Rents: The Political Economy of
Rent Seeking,’’Econ. J., 97: 685-699, September 1987.
Baik, K. H., ‘‘Winner-Help-Loser Group Formation in Rent-Seeking Contests,’’
Economics and Politics, 6(2): 147-162, July 1994.
Baland, J. and Platteau, J.,Inequality and Collective Action in the Commons, CRED,
Facult\’s Universitaires Notre Dame de la Paix, Namur, Belgium, 1996.
Becker, G. S., ‘‘A Theory of Competition Among Pressure Groups for Political
Influence,’’Quarterly Journal of Economics, XCVIII, No. 3, August 1983.
Bhagwati, J. N., ‘‘Directly Unproductive, Profit-Seeking (DUP) Activities,’’Journal of
Political Economy, 90: 988-1002, October 1982.
Fafchamps, M., Sadoulet, E., and de Janvry, A., ‘‘Tariff Seeking in a General
Equilibrium Framework,’’J. Internat. Trade and Econ. Devel., p. 167-189, 1993.
Fafchamps, M., ‘‘Sovereign Debt, Structural Adjustment, and Conditionality,’’J.
Development Econ., August 1996 .
Feenstra, R. C. and Bhagwati, J. N., ‘‘Tariff Seeking and the Efficient Tariff,’’Import
Competition and Response, p. 223-234, Jagdish N. Bhagwati (ed.), Chicago, 1982.
Findlay, R. and Wellisz, S., ‘‘Endogenous Tariffs, the Political Economy of Trade
Restrictions, and Welfare,’’Import Composition and Response, Jagdish N.
Bhagwati (ed.), University of Chicago Press, London, 1982.
30
Grossman, G. M. and Helpman, E., ‘‘Protection for Sale,’’Amer. Econ. Rev., 84(4): 833-
850, September 1994.
Johnson, R. N. and Libecap, G. D., ‘‘Contracting Problems and Regulation: The Case of
the Fishery,’’Amer. Econ. Rev., 72(5): 1005-1022, December 1982.
Katz, E. and Rosenberg, J., ‘‘Rent-Seeking for Budgetary Allocation: Preleminary
Results for 20 Countries,’’Public Choice, 60: 133-144, 1989.
Krueger, A. O., ‘‘The Political Economy of the Rent-Seeking Society,’’American
Economic Review, LXIV, No. 3, June 1974.
Magee, S. P., Brock, W. A., and Young, L.,Black Hole Tariffs and Endogenous Policy
Theory: Political Economy in General Equilibrium, Cambridge University Press,
Cambridge, 1989.
Mayer, W., ‘‘Endogenous Tariff Formation,’’Amer. Econ. Rev., 74(5): 970-985,
December 1984.
Negishi, T., ‘‘Welfare Economics and Existence of an Equilibrium for a Competitive
Economy,’’Metroeconomica, XI, 1959.
Posner, R. A., ‘‘The Social Costs of Monopoly and Regulation,’’J. Polit. Econ., 83(4):
807-827, 1975.
Quiggin, J., ‘‘Common Property, Equality, and Development,’’World Development,
21(7): 1123-1138, July 1993.
Swinnen, J. F. and de Gorter, H., ‘‘Why Small Groups and Low Income Sectors Obtain
Subsidies: The "Altruistic" Side of a "Self-Interested" Government,’’Economics
31
and Politics, 5(3): 285-293, November 1993.
Tullock, G., ‘‘Efficient Rent Seeking,’’Toward a Theory of the Rent-Seeking Society, p.
97-112, J.M. Buchanan, R.D. Tollison, and G. Tullock (eds.), Texas A&M
University Press, College Station, 1980.
Varian, H. R., ‘‘Measuring the Deadweight Costs of DUP and Rent Seeking Activities,’’
Economics and Politics, 1(1): 81-95, Spring 1989.
Zusman, P., ‘‘The Incorporation and Measurement of Social Power in Economic
Models,’’ International Economic Review, 17, No. 2: 447-462, June 1976.

Table 1. Lobbying With Strict and Soft Government Budget Constraints
Only sector Soft budget constraint Strict budget constraint
m informedLobbying No Lobbying No
Lob. by allby allby alobbyingby allby alobbying
-7- -6- -5- -4- -3- -2- -1-
Lobbying effort
0.0990.0970.09600.1430.1440by sector a
0.1430.097000.14300by sector m
Utility
0.5200.6540.6930.6740.5210.5780.550in sector a
0.5300.6540.6350.6740.5210.4910.550in sector m
0.5480.8540.8550.8590.5490.5460.550in sector s
Domestic prices
0.9770.9510.9810.9650.9791.0231.000of good a
0.9880.9510.9370.9650.9790.9571.000of good m
0.9821.0561.0641.0730.9790.9891.000of good s
Production
8.898.778.918.848.909.109.00in sector a
8.948.778.708.848.908.809.00in sector m
8.929.219.289.318.908.959.00in sector s
Trade
-0.08-1.49-1.15-1.5200.450export of good a
0.08-1.49-1.86-1.520-0.450export of good b
02.983.003.03000trade deficit
26.7629.7729.8930.0126.7126.8527.00GDP
02.842.862.920-0.030Total transfers

Table 2. Lobbying With Myopia about Labor Market Conditions
Only sector a myopicSymmetrical myopiaPerfect
Lobbying by allActual Expected by allinformation
ActualExpectedLobbying LobbyingLobbying
by aby allby allby aby all
-11- -10- -9- -8- -7- -3-
Lobbying effort
0.2840.2840.2780.2780.2910.143by sector a
0.1420.1420.2780.2780.0000.143by sector m
Utility
0.5160.6830.4940.6590.7440.521in sector a
0.4980.6550.4940.6590.6130.521in sector m
0.5480.7030.5490.7040.6970.549in sector s
Domestic prices
0.9821.1910.9591.1661.2430.979of good a
0.9561.1580.9591.1661.1280.979of good m
0.9691.1740.9591.1661.1830.979of good s
Production
8.9179.7538.8119.6669.9268.904in sector a
8.7949.6388.8119.6669.5278.904in sector m
8.8559.6958.8119.6659.7258.904in sector s
Trade (Exports)
0.1810.1920.0000.0000.6680.000export of good a
-0.181-0.1920.0000.000-0.6680.000export of good b
0.0000.0000.0000.0000.0000.000trade deficit
Labor market
0.0002.6880.0002.7092.6710.000labor deficit
1.0320.8511.0420.8580.8461.022real wage
26.56629.08726.43228.99529.17826.710GDP
-0.0050.0060.0000.0000.0760.000Total transfers
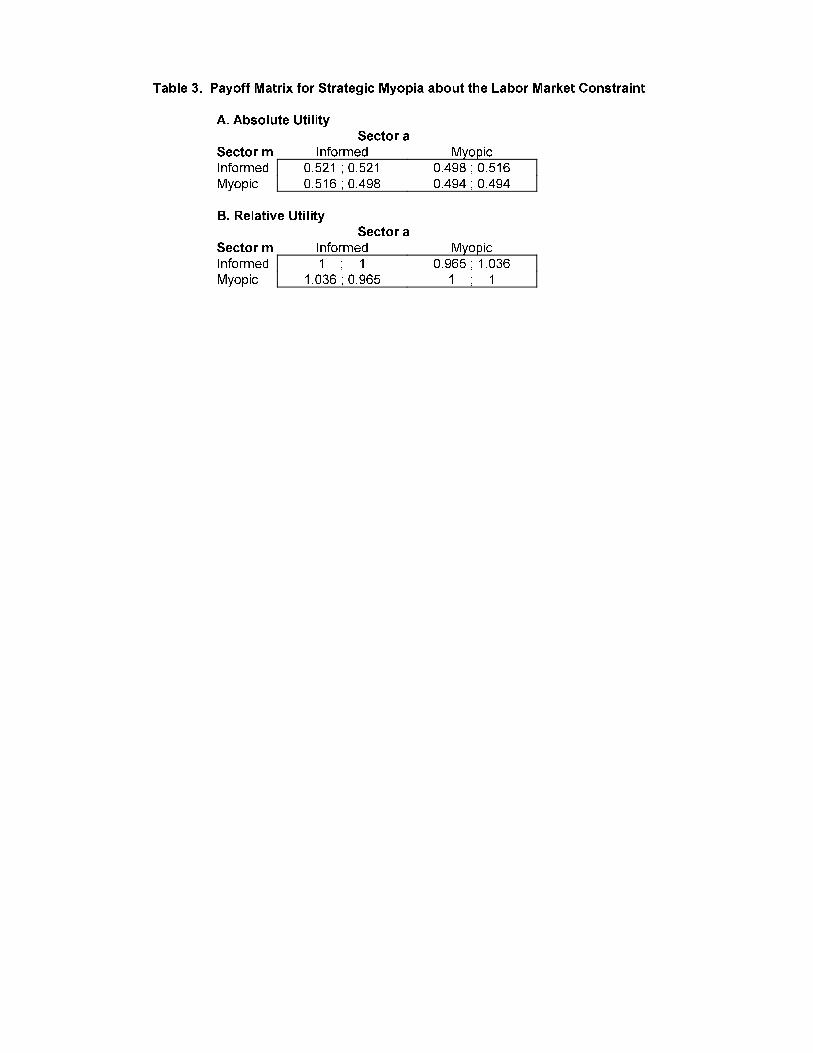
Table 3. Payoff Matrix for Strategic Myopia about the Labor Market Constraint
A. Absolute Utility
Sector a
MyopicInformedSector m
0.498 ; 0.5160.521 ; 0.521Informed
0.494 ; 0.4940.516 ; 0.498Myopic
B. Relative Utility
Sector a
MyopicInformedSector m
0.965 ; 1.0361 ; 1Informed
1 ; 11.036 ; 0.965Myopic

Table 4. Lobbying With Sectoral Rigidity and Diversified Portfolios
DiversifiedBase case
porfolios
LobbyingLobbyingNo
by allby alllobbying
-12- -3- -1-
Lobbying effort
0.0020.1430.000by sector a
0.0020.1430.000by sector m
Utility
0.5480.5210.550in sector a
0.5480.5210.550in sector m
0.5480.5490.550in sector s
Domestic prices
1.0000.9791.000of good a
1.0000.9791.000of good m
1.0000.9791.000of good s
Production
8.9988.9049.000in sector a
8.9988.9049.000in sector m
8.9988.9049.000in sector s
26.99626.71027.000GDP
1.0001.0221.000Real wage