Embed Size (px)
Citation preview

1Chen W, et al. BMJ Glob Health 2017;2:e000477. doi:10.1136/bmjgh-2017-000477
Social health insurance coverage and financial protection among rural-to-urban internal migrants in China: evidence from a nationally representative cross-sectional study
Wen Chen,1 Qi Zhang,2 Andre M N Renzaho,3 Fangjing Zhou,4 Hui Zhang,5 Li Ling1
Research
To cite: Chen W, Zhang Q, Renzaho AMN, et al. Social health insurance coverage and financial protection among rural-to-urban internal migrants in China: evidence from a nationally representative cross-sectional study. BMJ Glob Health 2017;2:e000477. doi:10.1136/bmjgh-2017-000477
Handling editor Seye Abimbola
► Additional material is published online only. To view please visit the journal online (http:// dx. doi. org/ 10. 1136/ bmjgh- 2017- 000477).
Received 15 July 2017Accepted 27 September 2017
For numbered affiliations see end of article.
Correspondence toProfessor Li Ling; lingli@ mail. sysu. edu. cn
AbstrACtIntroduction Migrants are a vulnerable population and could experience various challenges and barriers to accessing health insurance. Health insurance coverage protects migrants from financial loss related to illness and death. We assessed social health insurance (SHI) coverage and its financial protection effect among rural-to-urban internal migrants (IMs) in China.Methods Data from the ‘2014 National Internal Migrant Dynamic Monitoring Survey’ were used. We categorised 170 904 rural-to-urban IMs according to their SHI status, namely uninsured by SHI, insured by the rural SHI scheme (new rural cooperative medical scheme (NCMS)) or the urban SHI schemes (urban employee-based basic medical insurance (UEBMI)/urban resident-based basic medical insurance (URBMI)), and doubly insured (enrolled in both rural and urban schemes). Financial protection was defined as ‘the percentage of out-of-pocket (OOP) payments for the latest inpatient service during the past 12 months in the total household expenditure’.results The uninsured rate of SHI and the NCMS, UEBMI/URBMI and double insurance coverage in rural-to-urban IMs was 17.3% (95% CI 16.9% to 17.7%), 66.6% (66.0% to 67.1%), 22.6% (22.2% to 23.0%) and 5.5% (5.3% to 5.7%), respectively. On average, financial protection indicator among uninsured, only NCMS insured, only URBMI/UEBMI insured and doubly insured participants was 13.3%, 9.2%, 6.2% and 5.8%, respectively (p=0.004). After controlling for confounding factors and adjusting the protection effect of private health insurance, compared with no SHI, the UEBMI/URBMI, the NCMS and double insurance could reduce the average percentage share of OOP payments by 33.9% (95% CI 25.5% to 41.4%), 14.1% (6.6% to 20.9%) and 26.8% (11.0% to 39.7%), respectively.Conclusion Although rural-to-urban IMs face barriers to accessing SHI schemes, our findings confirm the positive financial protection effect of SHI. Improving availability and portability of health insurance would promote financial protection for IMs, and further facilitate achieving universal health coverage in China and other countries that face migration-related obstacles to achieve universal coverage.
IntroduCtIonBy the end of 2015, the estimated population of rural-to-urban internal migrants (IMs) in China had reached 277.5 million, accounting for one-fifth of China’s population.1 2 Like many other countries across the world, achieving universal health coverage (UHC) is one of China’s health priorities to ensure all people receive needed quality healthcare without financial hardship. Social health insurance (SHI) has been the primary focus
Key questions
What is already known about this topic? ► Social health insurance schemes are the main focus of efforts to promote access to healthcare and financial protection in low-income and middle-income countries.
► Evidence on social health insurance coverage and its financial protection effect is currently scant for rural-to-urban internal migrants in China, which account for about one-fifth of the total population.
What are the new findings? ► Rural-to-urban internal migrants face barriers to accessing social health insurance schemes, especially at current residence.
► Social health insurance, regardless of the type of scheme, positively protected against the financial burden of inpatient services for rural-to-urban internal migrants. However, the rural scheme had a smaller protection effect than urban schemes.
recommendations for policy ► Qualifying migrants for social health insurance schemes at their current residence and improving portability of health insurance would be important approaches to promote financial protection in health, and facilitate universal health coverage in China and other countries that face emerging migration issues.
on October 29, 2021 by guest. P
rotected by copyright.http://gh.bm
j.com/
BM
J Glob H
ealth: first published as 10.1136/bmjgh-2017-000477 on 16 O
ctober 2017. Dow
nloaded from

2 Chen W, et al. BMJ Glob Health 2017;2:e000477. doi:10.1136/bmjgh-2017-000477
BMJ Global Health
of efforts to promote access to healthcare and to provide financial protection against impoverishing healthcare cost in China and other low-income and middle-income countries.3 4 SHI has made remarkable progress in China since the late 1990s. Similar to many countries that currently have SHI systems,5 China started the reform of national SHI schemes by first introducing an SHI scheme for workers in 1998, which is the urban employee-based basic medical insurance (UEBMI). In 2003, the new rural cooperative medical scheme (NCMS), a form of commu-nity-based health insurance, was established and offered cover to rural residents. Later, in 2007, the urban resi-dent-based basic medical insurance (URBMI) scheme for unemployed urban residents was piloted and then scaled up across China. The NCMS and URBMI are mainly subsidised by the local government, while the financing of the UEBMI comes mainly from joint urban employers and employees’ premiums.6 The detailed financing and benefits of the three SHI schemes are summarised in table 1.6–8 By the end of 2015, the Chinese government had successfully provided the three SHI schemes to more than 95% of the population.9
In China, rural-to-urban IMs face a dilemma regarding access to SHI, which was mainly created by the registered permanent residence (hukou in Chinese) system. Rural and urban residents are categorised separately according to their hukou,10 11 and the government financing of the NCMS and the URBMI only targets rural and urban residents, respectively.10 That is without an urban hukou status, the rural-to-urban IM population is largely
excluded from accessing the URBMI available only to urban residents, and their eligibility for the UEBMI varies across the country depending on local UEBMI policies. For example, in the China Health and Retirement Longi-tudinal Study, retired rural-to-urban IMs were more likely to be uninsured (relative risk ratio=1.39, 95% CI 1.24 to 1.57) compared with their local counterparts.12 Another study conducted in the South China’s megacity of Shen-zhen found 43.1% of IMs and 12.2% of local residents were uninsured, respectively, and IMs were five times as likely as their urban peers to be uninsured.13 On the other hand, although IMs are eligible for the NCMS, the scheme runs at the county level and encourages enrollees to use designated hospitals within the county. For migrants who use health services outside the NCMS counties, the coinsurance for health services could rise markedly, and they need to pay for health services out-of-pocket (OOP) and afterwards get reimbursed.14 High OOP payments could discourage IMs from seeking care and may lead to impoverishment or even destitution for people with a need for treatment.3
While there is a growing literature assessing SHI schemes among urban or/and rural residents, such as coverage, financial protection and equality of insurance schemes,15–18 only a few studies have been carried out among IMs. Most of the studies among IMs in China have focused on the impact of SHI status on health service util-isation.19–21 Yet little is known about SHI coverage and its financial protection effects among this vulnerable popu-lation. Previous studies showed insurance coverage was
Table 1 Financing and benefits among three social health insurance schemes
UEBMI URBMI NCMS
Eligible population Employed urban residents Unemployed urban residents Rural residents
Unit of funding pool7 Municipal city (n=333) Municipal city (n=333) Rural county (n=2852)
Source of funding7 8% of employees’ annual wage (6% from employers, and 2% from employees)
Government subsidy (70%) and unemployed urban residents’ premium (30%)
Government subsidy (80%) and rural residents’ premium (20%)
National average premium per capita in 2014 (US$)8
418 238 60
National average ceiling in 2008 (US$)6
14 706 11 765 2941
Reimbursement rate in 2008 (%)6
72 50 40
Service package covered Comprehensive (outpatient and inpatient services)
Limited (outpatient services are restricted)
Limited (outpatient services are restricted)
Average number of drugs covered7
2300 2300 800
Restrictions on the facilities in which insured can claim reimbursements
Reimbursements can be claimed for health services in designated facilities.The majority of designated facilities locate within the unit of funding pool.Insured use services in designated facilities within the unit of funding pool can claim higher reimbursements than their counterparts who use out-of-unit services.
Source of data: refs6–8.US$1=¥6.8.NCMS, new rural cooperative medical scheme; UEBMI, urban employee-based basic medical insurance; URBMI, urban resident-based basic medical insurance.
on October 29, 2021 by guest. P
rotected by copyright.http://gh.bm
j.com/
BM
J Glob H
ealth: first published as 10.1136/bmjgh-2017-000477 on 16 O
ctober 2017. Dow
nloaded from

Chen W, et al. BMJ Glob Health 2017;2:e000477. doi:10.1136/bmjgh-2017-000477 3
BMJ Global Health
not significantly associated with OOP payments among IMs.22 23 While the level of OOP payment is indicative of financial protection, it fails to measure the extent to which the cost of medical services accounts for a house-hold’s living budget, and limits the comparison across regions and time. Therefore, WHO suggests using indi-cators drawn from both medical costs and household expenditure data to monitor financial protection.3 Thus, using data from the 2014 ‘National Internal Migrant Dynamic Monitoring Survey (NIMDMS)’, our study aimed to extend our knowledge of coverage and finan-cial protection in SHI schemes among rural-to-urban IMs in China. We hypothesised that (1) rural-to-urban IMs would have lower health insurance coverage than the national average and would vary by regions, and (2) the financial protection would be stronger among SHI insured rural-to-urban IMs than their uninsured counter-parts and the relative degree of protection would vary by schemes.
MetHodsdata resourceThe current study used data from the NIMDMS, collected in May 2014. The NIMDMS is a nationwide cross-sectional study aimed to be representative of IMs in mainland China,
and is funded and organised by the National Health and Family Planning Commission of China (NPFPC) yearly since 2009, with the fieldwork undertaken by local Health and Family Planning Commissions.24 We chose the 2014 NIMDMS data because the NIMDMS changed survey topics every year, and variables related to SHI coverage and financial protection were only included in the 2014 questionnaire. The 2014 NIMDMS data (http:// hdl. handle. net/ 11620/ 10725) are publicly available to authorised researchers who have been permitted by the NPFPC, and we received the permission.
study participants and samplingThe 2014 NIMDMS included IMs aged 15–59 years old who had lived in the study sites for at least 1 month prior to the survey. IMs are defined as individuals who do not have hukou in the study sites, excluding people migrating for study/training purposes, tourism and medical care.24 IMs with urban hukou were excluded for the analysis in this study.
The 2014 NIMDMS planned to investigate 201 000 IMs in all provinces in mainland China. The survey was based on a stratified three-stage sampling design (figure 1).24 25 There were a total of 119 strata in mainland China, strat-ified by province, urban group and leading city, such as
Figure 1 Sampling flow chart. #Data source: China statistical yearbook 2014. IM, internal migrants; PPS, probability proportional to size.
on October 29, 2021 by guest. P
rotected by copyright.http://gh.bm
j.com/
BM
J Glob H
ealth: first published as 10.1136/bmjgh-2017-000477 on 16 O
ctober 2017. Dow
nloaded from
4 Chen W, et al. BMJ Glob Health 2017;2:e000477. doi:10.1136/bmjgh-2017-000477
BMJ Global Health
provincial capital and city specifically designated in the state plan (see online supplementary table S1). Sample selection was then carried out independently within each stratum. At the first stage, 3776 township-level divisions were selected with probability proportional to size26 (the number of IMs in 2003). At the second stage, a total of 8993 urban neighbourhoods and rural villages with 10 050 clusters were selected from sampled township-level divi-sions by probability proportional to size (the number of IMs in 2014). At the third and final stages, 20 eligible IMs were selected in each sampled cluster by the following steps. First, all eligible IMs in each sampled neighbour-hood/village were enumerated, and divided into several groups with a group size of around 150 IMs. Second, one or more clusters were randomly sampled among all groups. Then, within each cluster, a simple random sample of 20 IMs was chosen. If a selected migrant came from the same family as another participant or was not able to be contacted, or refused to participate, then the next migrant listed in the sampling frame, with same sex and similar age and duration of residence, was selected for replacement. Face-to-face interviews were conducted via home visits. Interviewers received standardised training by the NPFPC, and quality control was imple-mented in data collection and input. More details about the technical aspects of the survey are available.24
MeasuresSHI schemes statusRespondents were asked if they were participating in the NCMS, UEBMI or URBMI (yes/no). Based on the responses, study participants’ SHI schemes status were further categorised as the following:1. Uninsured by SHI: The respondents did not
participate in any SHI scheme.2. Only NCMS insured: The respondents participated in
the NCMS only. Rural-to-urban IMs are eligible for the NCMS in their county of origin.
3. Only urban basic medical insurance schemes (UEB-MI/URBMI) insured: The respondents participated in either the UEBMI or URBMI. The two insurance schemes were combined because they cover mutually exclusive population (employed vs unemployed pop-ulation), and only 3.7% of the participants reported participation in the URBMI.
4. Doubly insured: IMs participated in rural (NCMS) and urban (UEBMI/URBMI) schemes at the same time. Due to independent systems for rural and urban SHI schemes, migrant workers who had participated in the NCMS could also enrol in the UEBMI.
Financial protectionTo measure the relative degree of financial protection effects across SHI schemes status, we used one key indi-cator—the percentage of OOP payments for the latest inpatient service during the past 12 months in the total household expenditure—and other secondary indicators (table 2).
As recommended by the WHO, the monitoring of finan-cial protection is typically based on indicators generated from both OOP payments and household expenditure. For example, as the most common indicator, catastrophic health expenditure is defined as OOP payments for healthcare exceeding a portion of a household’s expen-diture, that is, 25% of total expenditure.3 However, the 2014 NIMDMS data only included respondents’ OOP payments for the latest inpatient service during the past 12 months. We, therefore, calculated the relative degree of financial protection as the the percentage of OOP payments for the latest inpatient service during the past 12 months in the total household expenditure as a surro-gate measure of catastrophic health expenditure. More-over, to adjust the financial protection effect of private health insurance (86 participants got reimbursements), we added reimbursements from private health insurance into the participants’ OOP payments. Our suggested method is supported by the fact that inpatient services’ costs are the main source of OOP payments among IMs in China, with costs of inpatient services accounting for around 75% of annual medical expenditures among IMs,27 and only 5.9% of the study participants have multiple inpatient stays.
Inpatient services utilisationRespondents were asked whether they used inpatient services prescribed by doctors during the past 12 months (yes/no), what level of health facilities they accessed at the time of the latest inpatient service use (county/district hospitals and below, or municipal hospitals and above) and where were the health facilities (within county of origin, or out of county of origin).
Confounding factorsRespondents’ demographics that were associated with individuals’ willingness to participate in and/or bene-fited from health insurance schemes were included, such as age, sex, monthly income, annual household expenditure, marital status, education level, employ-ment status, duration of migration, whether migrating with families, household size and region of sending prov-inces (Western/Central/Eastern China).14 22 28 In the NIMDMS, the household was defined as an economic unit in which a group of persons live and eat their meals together, excluding left-behind spouses and children in rural areas.24
statistical analysisAnalyses were conducted using IBM SPSS Statistics V.21.0. Descriptive statistics including the mean, SD, median, IQR, frequency and proportion were used to summarise the demographics, inpatient services utilisa-tion and financial protection among study participants with different SHI schemes status, and differences among statuses by study variables were assessed by one-way anal-ysis of variance for continuous variables or the χ2 test for categorical variables. In addition, Fisher’s least
on October 29, 2021 by guest. P
rotected by copyright.http://gh.bm
j.com/
BM
J Glob H
ealth: first published as 10.1136/bmjgh-2017-000477 on 16 O
ctober 2017. Dow
nloaded from

Chen W, et al. BMJ Glob Health 2017;2:e000477. doi:10.1136/bmjgh-2017-000477 5
BMJ Global Health
significant different test was used to further compare the subgroup differences on financial protection indicators that were found significant on one-way analysis of vari-ance (p<0.05).
Population weighted uninsured rate of SHI, the NCMS, UEBMI/URBMI and double insurance coverage and 95% CIs were estimated based on a survey weight that ranged from 0.01 to 17.57.24 The survey weight was composed of three parts of weight to reduce biases due to unequal probabilities, non-response and non-coverage of the population.29 In addition, the QGIS V.2.18.10 soft-ware was used to translate the UEBMI/URBMI coverage and uninsured rate by current provinces of residence and the NCMS coverage by sending provinces into maps.
The financial protection effect of SHI schemes among participants who used inpatient services in the past 12 months was assessed by three-level generalised linear mixed models (GLMMs). IMs were the first level who nested within current counties/districts of residence (level 2) and further nested within current cities of resi-dence (level 3). First, bivariate three-level GLMMs with log link were used to analyse simple associations between the financial protection effect and participants’ SHI status, indicators of inpatient services utilisation and confounding factors. Second, a multivariate three-level GLMM with log link was built to assess the association
between health insurance status and the financial protec-tion effect, while controlling for all variables that were found significant on bivariate GLMMs (p<0.10), and percentage share of total medical expenditures on the latest inpatient service.
resultsA total of 200 937 IMs were recruited in the 2014 NIMDMS, and 170 904 (85.1%) rural-to-urban IMs were included in this study with a mean age of 33.4 (SD=9.4) years (table 3). There were 100 201 male participants (58.1%), and 87.8% of the participants (n=150 031) were either employed or employers.
Based on self-reported data (table 4), 23 539 out of 170 904 participants had not enrolled in any SHI scheme (weighted uninsured rate: 17.3%, 95% CI 16.9% to 17.7%), 119 997 participants had enrolled in the NCMS only, 21 272 participants had enrolled in the UEBMI/URBMI only, and 6096 participants were doubly insured (weighted coverage: 5.5%, 95% CI 5.3% to 5.7%). There-fore, 126 093 (119 997+6096) participants had enrolled in the NCMS (weighted coverage: 66.6% (66.0% to 67.1%)), and 27 368 (21 272+6096) participants had enrolled in the UEBMI/URBMI (weighted coverage: 22.6% (22.2% to 23.0%)). It is worth noting that SHI schemes
Table 2 Definitions of measurement variables on financial protection of SHI
Variable Definition Variable type
OOP payments3 for the latest inpatient service (US$)
All inpatient costs paid directly by participants at the time of the latest service use, including copayment, deductible, coinsurance and other payments for medicines and services not covered by the insurance, but insurance premiums and reimbursements from SHI* were excluded.
Continuous
The percentage of OOP payments for the latest inpatient service during the past 12 months in the total household† expenditure
The percentage of the participant’s OOP payments for the latest inpatient service during the past 12 months as a share of annual total household expenditureTotal household expenditure included food, clothing, housing, education, transportation, healthcare and spending on other necessities.
Continuous
Medical expenditures for the latest inpatient service during the past 12 months
All categories of medical expenditures paid by the participants at the time they received the latest inpatient service during the past 12 months, including OOP payments and reimbursements
Continuous
Effective SHI reimbursement ratio
The proportion of reimbursements from SHI as a share of medical expenditures on the latest inpatient service during the past 12 months
Continuous
The percentages of medical expenditures on the latest inpatient service during the past 12 months in total household† expenditure
The proportion of the participant’s total medical expenditures on the latest inpatient service during the past 12 months as a share of annual total household expenditures
Continuous
Percentage point change (before–after)
This variable measures the change in percentage share of OOP payments after having excluded reimbursements from SHI (percentage of medical expenditures on the latest inpatient service in annual total household expenditure – percentage of OOP inpatient service payments in the annual total household expenditure).
Continuous
Definition of out-of-pocket (OOP) payments: ref 3.*To measure the financial protection effect of social health insurance (SHI) and adjust the effect of private insurance, reimbursements from private health insurance were included in the participants’ OOP payments.†Household only included persons who live and eat together at current residence.
on October 29, 2021 by guest. P
rotected by copyright.http://gh.bm
j.com/
BM
J Glob H
ealth: first published as 10.1136/bmjgh-2017-000477 on 16 O
ctober 2017. Dow
nloaded from

6 Chen W, et al. BMJ Glob Health 2017;2:e000477. doi:10.1136/bmjgh-2017-000477
BMJ Global Health
Tab
le 3
C
hara
cter
istic
s of
inte
rnal
mig
rant
s in
the
201
4 N
atio
nal I
nter
nal M
igra
nt D
ynam
ic M
onito
ring
Sur
vey
(n=
170
904)
Cha
ract
eris
tics
No
SH
I*(n
=23
539
)O
nly
NC
MS
*(n
=11
9 99
7)O
nly
UE
/RB
MI*
(n=
21 2
72)
NC
MS
+U
E/R
BM
I*(n
=60
96)
Tota
l*(n
=17
0 90
4)p
Val
ue†
Age
32.5
(9.9
)33
.8 (9
.5)
32.4
(8.7
)32
.4 (8
.6)
33.4
(9.4
)<
0.00
1
Dur
atio
n of
mig
ratio
n (m
onth
s)37
(13–
79)
36 (1
4–72
)39
(15–
83)
38 (1
4–79
)36
(14–
74)
<0.
001
Num
ber
of p
eop
le p
er h
ouse
hold
†2.
5 (1
.2)
2.6
(1.2
)2.
4 (1
.2)
2.4
(1.2
)2.
6 (1
.2)
<0.
001
Mon
thly
hou
seho
ld in
com
e (U
S$)
†66
2 (4
41–8
82)
706
(441
–882
)73
5 (5
15–1
029)
735
(515
–102
9)73
5 (4
41–8
97)
<0.
001
Ann
ual h
ouse
hold
exp
end
iture
(US
$)†
3529
(264
7–52
94)
4147
(264
7–54
71)
4412
(282
4–61
76)
4412
(264
7–61
76)
4059
(264
7–56
47)
<0.
001
Sex
<0.
001
M
ale
13 5
21 (5
7.4)
70 3
59 (5
8.6)
12 6
73 (5
9.6)
3648
(59.
8)10
0 20
1 (5
8.6)
F
emal
e10
018
(42.
6)49
638
(41.
4)85
99 (4
0.4)
2448
(40.
2)70
703
(41.
4)
Mar
ital s
tatu
s
M
arrie
d15
997
(68.
0)94
720
(78.
9)15
690
(73.
8)46
46 (7
6.2)
131
053
(76.
7)<
0.00
1
S
ingl
e75
42 (3
2.0)
25 2
77 (2
1.1)
5582
(26.
2)14
50 (2
3.8)
39 8
51 (2
3.3)
Ed
ucat
ion
leve
l
P
rimar
y sc
hool
and
less
4410
(18.
7)19
930
(16.
6)18
88 (8
.9)
636
(10.
4)26
864
(15.
7)<
0.00
1
S
econ
dar
y sc
hool
13 1
96 (5
6.1)
72 3
59 (6
0.3)
9313
(43.
8)30
72 (5
0.4)
97 9
40 (5
7.3)
H
igh
scho
ol43
42 (6
.8)
21 7
99 (1
8.2)
5442
(25.
6)15
39 (2
5.2)
33 1
22 (1
9.4)
C
olle
ge a
nd a
bov
e15
91 (6
.8)
5909
(4.9
)46
29 (2
1.8)
849
(13.
9)12
978
(7.6
)
Em
plo
ymen
t st
atus
E
mp
loye
e11
793
(50.
1)51
967
(43.
3)16
260
(76.
4)46
40 (7
6.1)
84 6
60 (4
9.5)
<0.
001
E
mp
loye
r18
79 (8
.0)
9836
(8.2
)11
77 (5
.5)
319
(5.2
)13
211
(7.7
)
S
elf-
emp
loye
d61
01 (2
5.9)
42 6
49 (3
5.5)
2618
(12.
3)79
2 (1
3.0)
52 1
60 (3
0.5)
U
nem
plo
yed
3766
(16.
0)15
546
(13.
0)12
17 (5
.7)
345
(5.7
)20
873
(12.
2)
Mig
ratin
g w
ith fa
mili
es<
0.00
1
Y
es16
727
(71.
1)93
353
(77.
8)15
259
(71.
7)43
41 (7
1.2)
129
680
(75.
9)
N
o68
12 (2
8.9)
26 6
44 (2
2.2)
6013
(28.
3)17
55 (2
8.8)
41 2
24 (2
4.1)
Cov
ered
by
priv
ate
heal
th in
sura
nce
<0.
001
Y
es10
67 (4
.5)
3360
(2.5
)12
31 (5
.8)
546
(9.0
)62
04 (3
.6)
N
o22
467
(95.
5)11
6 62
2 (9
7.2)
20 0
41 (9
4.2)
5550
(91.
0)16
4 68
0 (9
6.4)
Reg
ion
of s
end
ing
pro
vinc
es<
0.00
1
E
aste
rn C
hina
8114
(34.
5)32
017
(26.
7)79
78 (3
7.5)
1983
(32.
5)50
092
(29.
3)
C
entr
al C
hina
7562
(32.
1)44
177
(36.
8)65
73 (3
0.9)
2323
(38.
1)60
635
(35.
5)
W
este
rn C
hina
7863
(33.
4)43
803
(36.
5)67
21 (3
1.6)
1790
(29.
4)60
177
(35.
2)
US
$1=
¥6.8
.D
ata
are
mea
n (S
D),
med
ian
(IQR
) or
n (%
).*N
umb
ers
mig
ht n
ot a
dd
up
to
the
colu
mn
tota
l bec
ause
of m
issi
ng d
ata.
†p V
alue
s fo
r an
alys
is o
f var
ianc
e w
ith fo
ur g
roup
s.‡H
ouse
hold
onl
y in
clud
ed p
erso
ns w
ho li
ve a
nd e
at t
oget
her
at c
urre
nt r
esid
ence
.S
HI,
soci
al h
ealth
insu
ranc
e; N
CM
S, n
ew ru
ral c
oop
erat
ive
med
ical
sch
eme;
UE
/RB
MI,
urb
an e
mp
loye
e-b
ased
/res
iden
t-b
ased
bas
ic m
edic
al in
sura
nce
sche
me.
on October 29, 2021 by guest. P
rotected by copyright.http://gh.bm
j.com/
BM
J Glob H
ealth: first published as 10.1136/bmjgh-2017-000477 on 16 O
ctober 2017. Dow
nloaded from

Chen W, et al. BMJ Glob Health 2017;2:e000477. doi:10.1136/bmjgh-2017-000477 7
BMJ Global Health
Tab
le 4
In
pat
ient
ser
vice
s ut
ilisa
tion
and
fina
ncia
l pro
tect
ion
effe
ct o
f SH
I sch
emes
am
ong
inte
rnal
mig
rant
s in
the
201
4 N
atio
nal I
nter
nal M
igra
nt D
ynam
ic M
onito
ring
Sur
vey
(n=
170
904)
Cha
ract
eris
tics
No
SH
I*O
nly
NC
MS
*O
nly
UE
/RB
MI*
NC
MS
+U
E/R
BM
I*To
tal*
p V
alue
†
n=23
539
n=11
9 99
7n=
21 2
72n=
6096
n=17
0 90
4
Rec
eive
d in
pat
ient
ser
vice
s p
resc
ribed
by
a d
octo
r d
urin
g th
e p
ast
12 m
onth
s
Y
es69
6 (3
.0)
3722
(3.1
)73
3 (3
.4)
227
(3.7
)53
78 (3
.1)
0.00
1
N
o22
839
(97.
0)11
6 27
4 (9
6.9)
20 5
39 (9
6.6)
5869
(96.
3)16
5 52
1 (9
6.9)
n=69
6n=
3722
n=73
3n=
227
n=53
78
Hea
lth fa
cilit
ies
acce
ssed
in t
he la
test
inp
atie
nt s
ervi
ce<
0.00
1
C
ount
y/d
istr
ict
hosp
itals
and
bel
ow o
ut o
f co
unty
of o
rigin
320
(46.
0)13
24 (3
5.6)
318
(43.
4)90
(39.
6)20
52 (3
8.2)
M
unic
ipal
hos
pita
ls a
nd a
bov
e ou
t of
co
unty
of o
rigin
272
(39.
1)14
67 (3
9.4)
328
(44.
7)94
(41.
4)21
61 (4
0.2)
C
ount
y/d
istr
ict
hosp
itals
and
bel
ow w
ithin
co
unty
of o
rigin
83 (1
1.9)
762
(20.
5)71
(9.7
)35
(15.
4)95
1 (1
7.7)
M
unic
ipal
hos
pita
ls a
nd a
bov
e w
ithin
co
unty
of o
rigin
21 (3
.0)
169
(4.5
)16
(2.2
)8
(3.5
)21
4 (4
.0)
Got
rei
mb
urse
men
ts fr
om p
rivat
e he
alth
insu
ranc
e0.
374
Ye
s12
(1.7
)54
(1.5
)17
(2.3
)3
(1.3
)86
(1.6
)
N
o68
4 (9
8.3)
3668
(98.
5)71
6 (9
7.7)
224
(98.
7)52
92 (9
8.4)
Med
ical
exp
end
iture
s on
the
late
st in
pat
ient
se
rvic
e d
urin
g th
e p
ast
12 m
onth
s (U
S$)
735
(471
–117
6)70
6 (4
41–1
176)
853
(518
–139
3)77
2 (5
15–1
176)
735
(441
–117
6)0.
019
OO
P p
aym
ents
for
the
late
st in
pat
ient
se
rvic
e d
urin
g th
e p
ast
12 m
onth
s (U
S$)
735
(441
–114
7)47
1 (2
62–8
82)
368
(147
–662
)36
8 (1
52–6
62)
471
(250
–882
)0.
032
ES
RR
(%)
0.0
(0.0
–0.0
)24
.0 (0
.0–5
0.0)
56.3
(28.
1–75
.0)
50.0
(25.
8–73
.6)
23.8
(0.0
–52.
0)<
0.00
1
Per
cent
age
of m
edic
al e
xpen
ditu
res
for
the
late
st in
pat
ient
ser
vice
dur
ing
the
pas
t 12
mon
ths
in t
otal
hou
seho
ld e
xpen
ditu
r e
(%)
14.2
(8.3
–23.
8)13
.5 (8
.3–2
5.0)
14.3
(8.3
–26.
9)13
.9 (8
.0–2
7.2)
13.9
(8.3
–25.
0)0.
187
Per
cent
age
of O
OP
pay
men
ts fo
r th
e la
test
in
pat
ient
ser
vice
dur
ing
the
pas
t 12
mon
ths
in t
otal
hou
seho
ld e
xpen
ditu
r e (%
)
13.3
(8.0
–22.
2)9.
2 (4
.8–1
8.1)
6.2
(2.6
–12.
8)5.
8 (2
.4–1
3.6)
9.1
(4.6
–17.
9)0.
004
Per
cent
age
poi
nt c
hang
e (b
efor
e–af
ter)
(%)
0.0
(0.0
–0.0
)2.
5 (0
.0–7
.7)
6.7
(2.3
–15.
4)6.
7 (2
.2–1
3.9)
2.2
(0.0
–8.2
)<
0.00
1
Dat
a ar
e n
(%) o
r m
edia
n (IQ
R).
US
$1=
¥6.8
.*N
umb
ers
mig
ht n
ot a
dd
up
to
the
colu
mn
tota
l bec
ause
of m
issi
ng d
ata.
† p V
alue
s fo
r an
alys
is o
f var
ianc
e w
ith fo
ur g
roup
s.E
SR
R, e
ffect
ive
SH
I rei
mb
urse
men
t ra
tio; N
CM
S, n
ew ru
ral c
oop
erat
ive
med
ical
sch
eme;
OO
P, o
ut-o
f-p
ocke
t; S
HI,
soci
al h
ealth
insu
ranc
e; U
E/R
BM
I, ur
ban
em
plo
yee-
bas
ed/r
esid
ent-
bas
ed
bas
ic m
edic
al in
sura
nce
sche
me.
on October 29, 2021 by guest. P
rotected by copyright.http://gh.bm
j.com/
BM
J Glob H
ealth: first published as 10.1136/bmjgh-2017-000477 on 16 O
ctober 2017. Dow
nloaded from

8 Chen W, et al. BMJ Glob Health 2017;2:e000477. doi:10.1136/bmjgh-2017-000477
BMJ Global Health
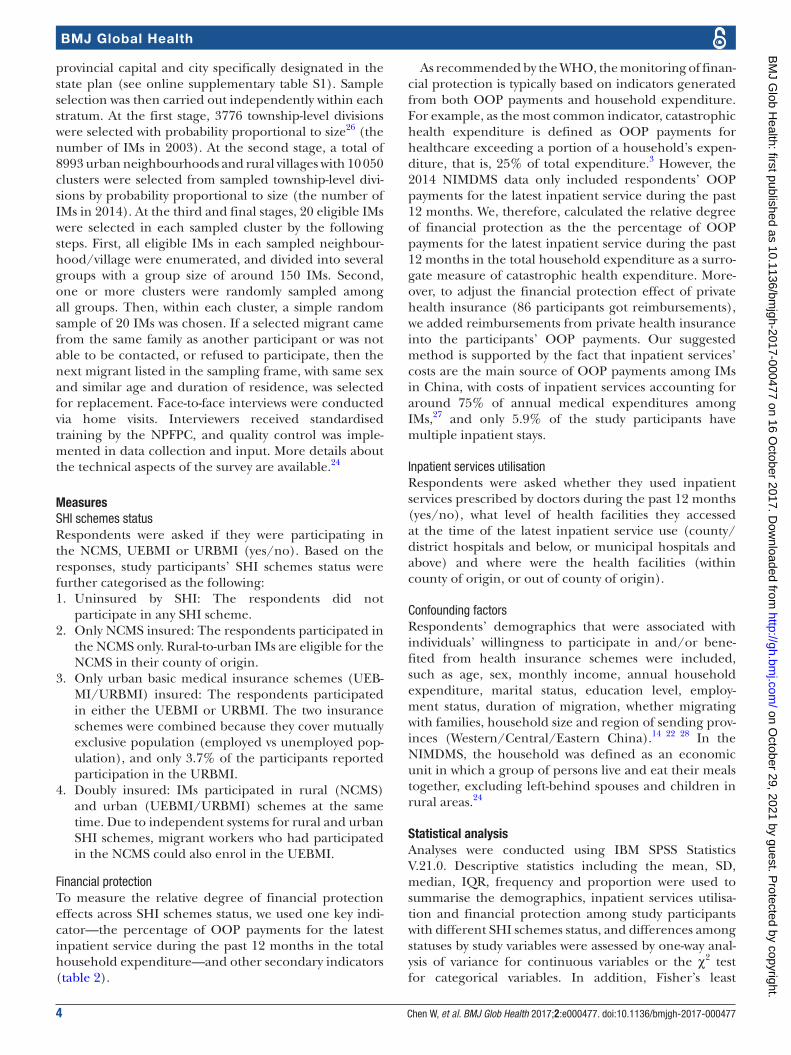
coverage in rural-to-urban IMs varied across mainland China. Overall, rural-to-urban IMs living in Central China had the lowest uninsured rate of SHI (mean=6.9% (SD=2.2%)), compared with IMs living in Eastern (17.3% (5.8%)) and Western China (10.9% (8.7%)) (figure 2). The NCMS coverage in participants from Western (74.1% (12.2%)) and Central China (77.8% (4.4%)) was higher than Eastern China (66.8% (6.3%)) (figure 3). However, Eastern China had the highest URBMI/UEBMI coverage (19.5% (8.8%)) among the three regions (9.0% for Central China, SD=4.1%; 11.3% for Western China, SD=8.0%) (figure 4).
Table 4 shows 5378 (3.1%) participants had used inpa-tient services during the past 12 months, 317 of them had multiple inpatient stays, and 86 of them got reimburse-ments from private health insurance. The percentage share of OOP payments for the latest inpatient service was 13.3% (IQR: 8.0%–22.2%), 9.2% (4.8%–18.1%), 6.2% (2.6%–12.8%) and 5.8% (2.4%–13.6%) among
participants without SHI, only covered by NCMS, only covered by URBMI/UEBMI and had both insurances, respectively (p=0.004). The average effective SHI reim-bursement ratio was 24.0% (0.0%–50.0%), 56.3% (28.1%–75.0%) and 50.0% (25.8%–73.6%) among partic-ipants enrolled in only NCMS, only URBMI/UEBMI and both insurances, respectively (p<0.001).
Table 5 reveals that the average percentage share of OOP payments for the latest inpatient service among individuals who only participated in the NCMS and only participated in the URBMI/UEBMI was 6.2% (p=0.009) and 11.1% (p<0.001) lower than their counterparts who had no SHI. The average percentage share of OOP payments among participants who were only insured by the NCMS was 4.9% higher than that of the URBMI/UEBMI insured individuals (p=0.034). There was no statistically significant difference between the doubly insured and SHI uninsured groups. Furthermore, differ-ences in effective SHI reimbursement ratio were statis-tically significant between any two groups, except the difference between the doubly insured and the URBMI/UEBMI insured participants.
With a multivariate three-level GLMM with log link (table 6), we detected the positive financial protection effect of SHI schemes among rural-to-urban IMs. After adjusting the protection effect of private health insurance and controlling for confounding factors, compared with partic-ipants without SHI, the average percentage share of OOP payments for the latest inpatient service among participants only covered by the URBMI/UEBMI, only covered by the NCMS and covered by both schemes increased by a factor of 0.661 (95% CI 0.586 to 0.745), 0.859 (0.791 to 0.934) and 0.732 (0.603 to 0.890), respectively. In other words, compared with no SHI, the UEBMI/URBMI could reduce the average percentage share of OOP payments for the latest inpatient service by 33.9% (95% CI 25.5% to 41.4%), and the NCMS and double insurance could reduce the
Figure 2 Uninsured rate of social health insurance among 170 904 rural-to-urban internal migrants by current province of residence in China, 2014.
Figure 3 The new rural cooperative medical scheme coverage in 170 904 rural-to-urban internal migrants by sending province in China, 2014.
Figure 4 The urban employee-based/resident-based basic medical insurance scheme coverage in 170 904 rural-to-urban internal migrants by current province of residence in China, 2014.
on October 29, 2021 by guest. P
rotected by copyright.http://gh.bm
j.com/
BM
J Glob H
ealth: first published as 10.1136/bmjgh-2017-000477 on 16 O
ctober 2017. Dow
nloaded from

Chen W, et al. BMJ Glob Health 2017;2:e000477. doi:10.1136/bmjgh-2017-000477 9
BMJ Global Health
percentage by 14.1% (6.6% to 20.9%) and 26.8% (11.0% to 39.7%), respectively.
dIsCussIonEnsuring access to health insurance and financial protec-tion in health for migrants is a global public health concern.30 China, with a sizeable migrant population from diverse socioeconomic and cultural backgrounds, provides a great opportunity to assess the financial protection effect of SHI. Moreover, by providing two different types of SHI scheme for many IMs, including the UEBMI, a traditional form of SHI in which employees and employers pay via contributions based on salaries, and the NCMS, a form of community-based health insur-ance, China can provide lessons for many counties facing migration-related obstacles to achieve universal coverage.
Our study provides evidence that rural-to-urban IMs face barriers to accessing SHI in China and the barrier varies by schemes. Specifically, we found that rural-to-urban IMs had 12.3% higher uninsured rate of SHI than the national average (17.3% vs <5%),9 more than 72.4% lower UEBMI/URBMI coverage than urban resi-dents (22.6% vs >95%),9 and 32.3% lower NCMS coverage than rural residents (66.6% vs 98.9%2). Worldwide, many countries face the challenge of financing healthcare for migrants. Although sporadic, there are innovative approaches to enhancing UHC among migrants. For example, as a regional hub for migrants in Asia, Thai-land has introduced health insurance programmes for migrants since 1997, including the compulsory migrant health insurance targeting registered migrant workers, and the voluntary migrant health insurance scheme for documented and undocumented migrants who are not covered by the mandatory scheme.31 32 Both schemes cover migrant-friendly comprehensive healthcare services that are similar to the Thai UHC scheme for citizens. Despite these efforts, the population coverage was still suboptimal. By 2015, the two schemes covered around 1.6 out of 3.5 million estimated migrants in Thailand. Poor portability of the schemes, the voluntary nature of migrant health insurance and migrants’ illegal status are key barriers to enrolment. In Europe, providing healthcare for immigrants, particularly undocumented migrants, is also a matter of concern and challenge. A small number of European countries provide full access to healthcare to migrants under specified conditions, including France, Switzerland, the Netherlands, Spain and Portugal. For example, in France, the UHC Act, and the state and home medical assistance provide insurance coverage and full access to public healthcare to migrants. In the Netherlands, compulsory private insurance covers migrants who pay income tax, and the government covers undocumented migrants’ necessary medical expen-ditures. In Switzerland, undocumented migrants are obliged to purchase statutorily private health insurance. However, implementation challenges still exist in these countries. For instance, complex application process, Ta
ble
5
Pos
t-ho
c co
mp
aris
ons
on fi
nanc
ial p
rote
ctio
n in
dic
ator
s am
ong
four
gro
ups
with
diff
eren
t S
HI s
tatu
s: r
esul
ts o
f Fis
her’s
leas
t si
gnifi
cant
diff
eren
ce t
ests
Hea
lth
insu
ranc
e st
atus
Per
cent
age
of
OO
P p
aym
ents
fo
r th
e la
test
inp
atie
nt
serv
ice
in t
ota
l ho
useh
old
exp
end
itur
es (%
)P
erce
ntag
e p
oin
t ch
ang
e (b
efo
re–a
fter
) (%
)E
SR
R (%
)
No
SH
IO
nly
NC
MS
Onl
y U
E/
RB
MI
NC
MS
+U
E/R
BM
IN
o S
HI
Onl
y N
CM
SO
nly
UE
/R
BM
IN
CM
S+
UE
/RB
MI
No
SH
IO
nly
NC
MS
Onl
y U
E/
RB
MI
NC
MS
+U
E/R
BM
I
No
SH
I0
6.2*
*11
.1**
*6.
40
−5.
6***
−13
.1**
*−
17.2
***
0−
21.6
***
−44
.0**
*−
43.4
***
Onl
y N
CM
S0
4.9*
−0.
20
−7.
5***
−11
.6**
*0
−22
.4**
*−
21.9
***
Onl
y U
E/R
BM
I0
−4.
70
−4.
10
0.5
NC
MS
+U
E/R
BM
I0
00
Mea
n d
iffer
ence
s (c
olum
n 1 −
col
umn 2-
13) a
re s
how
n in
thi
s ta
ble
. *p
<0.
05, *
*p<
0.01
, ***
p<
0.00
1.E
SR
R, e
ffect
ive
SH
I rei
mb
urse
men
t ra
tio; N
CM
S, n
ew ru
ral c
oop
erat
ive
med
ical
sch
eme;
OO
P, o
ut-o
f-p
ocke
t; S
HI,
soci
al h
ealth
insu
ranc
e; U
E/R
BM
I, ur
ban
em
plo
yee-
bas
ed/r
esid
ent-
bas
ed b
asic
med
ical
in
sura
nce
sche
me.
on October 29, 2021 by guest. P
rotected by copyright.http://gh.bm
j.com/
BM
J Glob H
ealth: first published as 10.1136/bmjgh-2017-000477 on 16 O
ctober 2017. Dow
nloaded from

10 Chen W, et al. BMJ Glob Health 2017;2:e000477. doi:10.1136/bmjgh-2017-000477
BMJ Global Health
Table 6 SHI financial protection effects among internal migrants who used inpatient services in the 2014 National Internal Migrant Dynamic Monitoring Survey: results of three-level GLMMs with log link (n=5378)
Characteristics
Percentage of OOP payments for the latest inpatient service during the past 12 months in total household expenditure
Exp(b) (95% CI) p Value Exp(badjusted) (95% CI) p Value
Fixed effects
Social health insurance schemes
No SHI (ref) 1 – 1 –
Only NCMS 1.236 (1.036 to 1.474) 0.019 0.859 (0.791 to 0.934) <0.001
Only UE/RBMI 0.936 (0.741 to 1.183) 0.581 0.661 (0.586 to 0.745) <0.001
NCMS+UE/RBMI 1.293 (0.957 to 1.779) 0.092 0.732 (0.603 to 0.890) 0.002
Percentage of medical expenditures for the latest inpatient service in total household expenditure (%)*
2.081 (2.036 to 2.128) <0.001 1.853 (1.817 to 1.891) <0.001
Age (years) 1.117 (1.084 to 1.100) <0.001 1.016 (1.013 to 1.020) <0.001
Number of people per household* 0.485 (0.460 to 0.512) <0.001 0.981 (0.947 to 1.017) 0.304
Duration of migration (months) 1.006 (1.006 to 1.007) <0.001 1.000 (1.000 to 1.001) 0.782
Monthly household income (US$)* 0.996 (0.996 to 0.996) <0.001 1.000 (0.999 to 1.000) <0.001
Sex
Male (ref) 1 – 1 –
Female 0.094 (0.082 to 0.108) <0.001 0.792 (0.742 to 0.847) <0.001
Marital status
Married (ref) 1 – 1 –
Single 3.171 (2.784 to 3.615) <0.001 1.274 (1.122 to 1.446) <0.001
Education level
Primary school and less (ref) 1 – 1 –
Secondary school 0.546 (0.490 to 0.608) <0.001 1.110 (1.027 to 1.198) 0.008
High school 0.335 (0.273 to 0.410) <0.001 1.149 (1.033 to 1.279) 0.011
College and above 0.168 (0.110 to 0.257) <0.001 1.174 (1.018 to 1.353) 0.027
Employment status
Employee (ref) 1 – 1 –
Employer 1.028 (0.815 to 1.300) 0.811 1.137 (0.993 to 1.301) 0.064
Self-employed 0.796 (0.688 to 0.920) 0.002 0.990 (0.909 to 1.078) 0.818
Unemployed 1.047 (0.919 to 1.192) 0.494 0.927 (0.859 to 1.000) 0.050
Migrating with families
Yes (ref) 1 – 1 –
No 2.651 (2.316 to 3.037) <0.001 0.934 (0.811 to 1.076) 0.344
Level of health facilities accessed in the latest inpatient service
County/district hospitals and below (ref)
1 – 1 –
Municipal hospitals and above 3.732 (3.408 to 4.084) <0.001 1.309 (1.221 to 1.402) <0.001
Location of health facilities accessed in the latest inpatient service
Out of county of origin (ref) 1 – 1 –
Within county of origin 0.262 (0.204 to 2.974) <0.001 0.974 (0.899 to 1.058) 0.540
Region of sending provinces
Eastern China (ref) 1 – – –
Central China 1.021 (0.863 to 1.208) 0.807 – –
Western China 0.996 (0.840 to 1.182) 0.967 – –
Continued
on October 29, 2021 by guest. P
rotected by copyright.http://gh.bm
j.com/
BM
J Glob H
ealth: first published as 10.1136/bmjgh-2017-000477 on 16 O
ctober 2017. Dow
nloaded from

Chen W, et al. BMJ Glob Health 2017;2:e000477. doi:10.1136/bmjgh-2017-000477 11
BMJ Global Health
costly premium, inadequate benefits and uneven imple-mentation of policies across regions impede migrants’ inclusion.33 Moreover, to qualify Chinese IMs for schemes at their current residence, there is an urgent need to implement and deepen the reform of hukou system to eliminate hukou-related obstacles to access health insur-ance.34 Further research on the economic impact of the current and approaching schemes will be needed.
Additionally, geographical disparities in the coverage of SHI, especially the urban schemes, existed in China. Eastern China has higher coverage of the UEBMI/URBMI but lower coverage of the NCMS than Western and Central China. One explanation is that, as the primary destination of IMs in China, Eastern China could have more migrant-sensitive health systems compared with other regions. For instance, in some Eastern cities, local governments developed special projects to recruit migrant workers into the UEBMI, and integrated the NCMS and URBMI into one scheme to eliminate the hukou barrier to accessing health insurance.12 14 Another possible explanation is that, in Eastern China, more IMs who did labour contract needed jobs than their peers in Western and Central regions,1 which could increase enrolment of IMs into the UEBMI. Similarly, in Vietnam, rural-to-urban IMs who worked in industrial zones had higher insurance coverage than IMs who worked without labour contracts or are self-employed.35 Regarding the relative optimal NCMS coverage in Western and Central China, it may be mainly due to the Chinese government’s financing scheme to encourage the NCMS enrolment in these poor regions.36 For example, in 2014, the central government paid for US$32 and US$26 out of US$47 government subsidies in Western and Central China, respectively.37 In conclusion, developing migrant-sensi-tive health systems and tailored health insurance policy would be key approaches to reduce geographical dispar-ities in SHI coverage among this vulnerable population.
We also found that after adjusting the protection effect of private health insurance and controlling for
confounding factors, regardless of the type of scheme, SHI insured participants received greater protection against the financial burden of inpatient services than uninsured participants. Our study provides new find-ings opposite to the previous studies conducted among IMs in China.22 23 Inconsistent measurements of finan-cial protection and sampling framework (ie, only OOP payments were measured in existing regional studies) and improvement in SHI implementation in China over the years could lead to the differences. Moreover, we pointed that the fragmented SHI system and hukou management in China could weaken the financial protection effect of SHI schemes. For example, the result shows the NCMS had a smaller protection effect than urban schemes. Low effective reimbursement ratio of the NCMS due to the limited portability and the reimburse-ment payment lag could be a leading explanation. For instance, Qiu et al14 found 65% of IMs did not receive inpatient reimbursements because of not staying in an NCMS designated hospital, and the majority of desig-nated hospitals are within the county. Additionally, under the current NCMS policy, IMs who used health services outside the NCMS counties need to pay for OOP payments at the time of services use and get reimbursed afterwards. The reimbursement payment lag could also increase financial hardship in a short period. Second, according to the ‘salmon bias hypothesis’, many migrants choose to return to home town on being on an illnesses due to limited access to health services, insurance and supports in the receiving areas,38 which could cause delays in seeking health services and further increase treatment costs.39 Moreover, the NCMS sets lower ceiling and higher coinsurance than the UEBMI/URBMI due to the limited funding pool.6 Taken together, it turned out the NCMS insured IMs had a higher percentage share of OOP payments than the UEBMI/URBMI insured peers. To increase portability of the NCMS, in 2015, China started to develop a national NCMS online reim-bursement system so the NCMS enrollees will receive
Characteristics
Percentage of OOP payments for the latest inpatient service during the past 12 months in total household expenditure
Exp(b) (95% CI) p Value Exp(badjusted) (95% CI) p Value
Random effects
Variance among current cities of residence (estimate (SE))
0.106 (0.041)
Variance among current counties/districts of residence within cities (estimate (SE))
0.456 (0.048)
Variance among IMs within counties/districts (estimate (SE))
0.212 (0.004)
US$1=¥6.8.*Household only included persons who live and eat together at current residence.–, no data; Exp(b), exponentiation of the regression coefficient; GLMM, generalised linear mixed model; IMs, internal migrants; NCMS, new rural cooperative medical scheme; OOP, out-of-pocket; ref, reference group; SHI, social health insurance; UE/RBMI, urban employee-based/resident-based basic medical insurance scheme.
Table 6 Continued
on October 29, 2021 by guest. P
rotected by copyright.http://gh.bm
j.com/
BM
J Glob H
ealth: first published as 10.1136/bmjgh-2017-000477 on 16 O
ctober 2017. Dow
nloaded from

12 Chen W, et al. BMJ Glob Health 2017;2:e000477. doi:10.1136/bmjgh-2017-000477
BMJ Global Health
reimbursements on a real-time basis in designated hospi-tals across regions in 2020.40 Further empirical evidence on the effectiveness of the new policy will be needed. In addition, raising the funding level should also be consid-ered in the future (eg, from county/city level to provin-cial level) to overcome the fragmentation of SHI systems, increase portability of SHI and reduce restrictions to claiming benefits. For example, Japan has raised the unit of national health insurance finances from the munic-ipal level to the prefectural level, which promoted the achievement of UHC.41
strengths and weaknesses of the studyTo our best knowledge, this study produced evidence on SHI coverage and its financial protection effects that were unavailable for rural-to-urban IMs, which repre-sent about a fifth of the total population in China. It is worth noting that the main contribution of the findings is to compare the relative degree of financial protection across SHI schemes status, rather than to obtain an abso-lute measure of financial protection, in terms of the level of protection.
This study has a few limitations. First, the measurement was based on self-reported information rather than on data from health insurance database and hospital infor-mation system. Thus, the SHI coverage and medical costs may be either underestimated or overestimated due to bias (ie, recall bias). Second, the 2014 NIMDMS was not specially designed for this study and the data were collected before this study. Thus, the data were imper-fect for assessing financial protection among IMs. For example, the financial protection effect of SHI schemes represented a low bound because the 2014 NIMDMS did not collect costs of outpatient and multiple inpa-tient services during the past 12 months. However, as introduced in the Measures section, financial burdens of medical services among IMs were mainly caused by the latest inpatient service.27 Additionally, due to the limits of available data, some confounding factors, such as health or disease status,42 cannot be controlled. Further mono-graphic research on financial protection effects of SHI among IMs is needed. Third, the sample was limited to IMs between 15 and 59 years old. Therefore, our findings are not generalisable to IMs in all age groups, especially the elders who may have greater healthcare needs than young migrants.
Notwithstanding these limitations, our study provides evidence that rural-to-urban IMs face barriers to accessing SHI in China, and SHI had significant financial protec-tion effects. Although hard to access, SHI schemes at migrants’ current residence had a better protection than the scheme in sending regions. The findings suggest that promoting availability of SHI by qualifying migrants for schemes at their current residence, and improving porta-bility of SHI, would promote financial protection for IMs, and further facilitate achieving UHC in China and other countries that face migration-related obstacles to achieve universal coverage.
Author affiliations1Faculty of Medical Statistics and Epidemiology, School of Public Health, Sun Yat-Sen University, Guangzhou, China2School of Community and Environmental Health, Old Dominion University, Norfolk, Virginia, USA3School of Social Science and Psychology, Humanitarian and Development Research Initiative, Western Sydney University – Penrith Campus, Kingswood, New South Wales, Australia4Department of Prevention and Treatment, Center for Tuberculosis Control of Guangdong Province, Guangzhou, China5Faculty of Health Policy and Management, School of Public Health, Sun Yat-Sen University, Guangzhou, China
Contributors LL got the access to data from the ‘2014 National Internal Migrant Dynamic Monitoring Survey (NIMDMS)'. WC developed analytical strategy, analysed data and drafted the manuscript. QZ and AMNR participated in critically revising the manuscript. FZ contributed to data analysis. All authors contributed to the data interpretation, manuscript writing and final approval of the manuscript.
Funding The NIMDMS was funded by the National Health and Family Planning Commission of China. The funding agency played no role in data analysis, writing of the manuscript, interpretation of the results or submission for consideration of publication. QZ was supported by the 111 Project, grant number B16031.
Competing interests None declared.
Patient consent Obtained.
ethics approval This was secondary analysis of publicly available data, and no participant consent forms were required to access this data set. This study was approved by the Ethics Committee of School of Public Health, Sun Yat-Sen University.
Provenance and peer review Not commissioned; externally peer reviewed.
data sharing statement The data controller of the data analysed is the National Health and Family Planning Commission of China. The 2014 NIMDMS data are available subject to authorised researchers who have been permitted by the National Health and Family Planning Commission of China.
open Access This is an Open Access article distributed in accordance with the Creative Commons Attribution Non Commercial (CC BY-NC 4.0) license, which permits others to distribute, remix, adapt, build upon this work non-commercially, and license their derivative works on different terms, provided the original work is properly cited and the use is non-commercial. See: http:// creativecommons. org/ licenses/ by- nc/ 4. 0/
© Article author(s) (or their employer(s) unless otherwise stated in the text of the article) 2017. All rights reserved. No commercial use is permitted unless otherwise expressly granted.
RefeRences 1. National Bureau of Statistics of the People's Republic of China.
Monitoring report of rural-to-urban migrant workers in 2015. Secondary Monitoring report of rural-to-urban migrant workers in 2015. http://www. stats. gov. cn/ tjsj/ zxfb/ 201604/ t20160428_ 1349713. html (Epub ahead of print 28-04-2016).
2. National Bureau of Statistics of the People's Republic of China. China statistical yearbook 2015. Beijing: China Statistics Press, 2016.
3. World Health OrganizationWorld Bank. Tracking universal health coverage: first global monitoring report. Geneva: World Health Organization, 2015.
4. Doetinchem O, Carrin G, Evans D. Thinking of introducing social health insurance? Ten questions. World Health Report (2010) Background Paper. Geneva: World Health Report, 2010.
5. Carrin G, James C. Social health insurance: Key factors affecting the transition towards universal coverage. Int Soc Secur Rev 2005;58:45–64.
6. Meng Q, Tang S. Universal health care coverage in China: challenges and opportunities. Procedia Soc Behav Sci 2013;77:330–40.
7. Meng Q, Fang H, Liu X, et al. Consolidating the social health insurance schemes in China: towards an equitable and efficient health system. Lancet 2015;386:1484–92.
8. Ministry of human resources and social security of the people's republic of China. China labour statistics yearbook 2015. Beijing: China statistics press, 2015.
on October 29, 2021 by guest. P
rotected by copyright.http://gh.bm
j.com/
BM
J Glob H
ealth: first published as 10.1136/bmjgh-2017-000477 on 16 O
ctober 2017. Dow
nloaded from

Chen W, et al. BMJ Glob Health 2017;2:e000477. doi:10.1136/bmjgh-2017-000477 13
BMJ Global Health
9. The State Council of the People's Republic of China. Guidelines for deepening health systems reform in the 13th 'five-year' period. Beijing, 2016.
10. Ling L, Cook S, Zhang S, et al. Migration and Health in China. Beijing: China Social Sciences Press, 2015.
11. Yue Z, Li S, Feldman MW. Social integration of rural-urban migrants in China: current status, determinants and consequences. Singapore: World Scientific, 2015.
12. Jin Y, Hou Z, Zhang D. Determinants of health insurance coverage among people aged 45 and over in China: who buys public, private and multiple insurance. PLoS One 2016;11:e0161774.
13. Lam KK, Johnston JM. Health insurance and healthcare utilisation for Shenzhen residents: a tale of registrants and migrants? BMC Public Health 2012;12:868.
14. Qiu P, Yang Y, Zhang J, et al. Rural-to-urban migration and its implication for new cooperative medical scheme coverage and utilization in China. BMC Public Health 2011;11:520.
15. Yip W, Hsiao WC. Non-evidence-based policy: how effective is China's new cooperative medical scheme in reducing medical impoverishment? Soc Sci Med 2009;68:201–9.
16. Ma J, Xu J, Zhang Z, et al. New cooperative medical scheme decreased financial burden but expanded the gap of income-related inequity: evidence from three provinces in rural China. Int J Equity Health 2016;15:72.
17. Zhang C, Lei X, Strauss J, et al. Health insurance and health care among the mid-aged and older chinese: evidence from the national baseline survey of CHARLS. Health Econ 2017;26:431–49.
18. Liu X, Wong H, Liu K. Outcome-based health equity across different social health insurance schemes for the elderly in China. BMC Health Serv Res 2016;16:9.
19. Mou J, Cheng J, Zhang D, et al. Health care utilisation amongst Shenzhen migrant workers: does being insured make a difference? BMC Health Serv Res 2009;9:214.
20. Peng Y, Chang W, Zhou H, et al. Factors associated with health-seeking behavior among migrant workers in Beijing, China. BMC Health Serv Res 2010;10:69.
21. Zhou C, Tobe RG, Chu J, et al. Detection delay of pulmonary tuberculosis patients among migrants in China: a cross-sectional study. Int J Tuberc Lung Dis 2012;16:1630–6.
22. Zhao Y, Kang B, Liu Y, et al. Health insurance coverage and its impact on medical cost: observations from the floating population in China. PLoS One 2014;9:e111555.
23. Qin X, Pan J, Liu GG. Does participating in health insurance benefit the migrant workers in China? An empirical investigation. China Economic Review 2014;30:263–78.
24. National Health and Family Planning Commission of China. National internal migrant dynamic monitoring survey data users guide. Beijing, 2014.
25. Wang PA. Collection of data from 2014 migrant population dynamic monitoring survey in China. Beijing: China population publishing house, 2016.
26. Kalton G. Introduction to survey sampling. Beverly Hills: Sage, 1983.
27. Statistical information center of National Health and Family Planning Commission of China. Analysis report of health services survey among migrants. Beijing: Peking union medical college press, 2016.
28. Zhao X, Ming DY, Ma WJ. [Utilization and cost of outpatient care and their influencing factors among middle and aged peasant-workers in China]. Beijing Da Xue Xue Bao 2015;47:464–8.
29. Department of Economic and Social Affairs. Studies in methods. series F No.98. Designing household survey samples: practical guidelines. New York: United Nation, 2005.
30. International Organization for Migration. World migration report 2010-the future of migration: building capacities for change. Geneva, 2010.
31. Tangcharoensathien V, Thwin AA, Patcharanarumol W. Implementing health insurance for migrants, Thailand. Bull World Health Organ 2017;95:146–51.
32. Srithamrongsawat S, Wisessang R, Ratjaroenkhajorn S. Financing healthcare for migrants: a case study from Thailand. Bangkok: International Organization for Migration, World Health Organization, 2009.
33. Gray BH, van Ginneken E. Health care for undocumented migrants: European approaches. Issue Brief 2012;33:1–12.
34. The State Council of the People's Republic of China. Proposal on further promoting the reform of hukou system. Beijing: The State Council of the People's Republic of China, 2014.
35. Le AT, Vu LH, Schelling E. Utilization of health care services among internal migrants in hanoi and its correlation with health insurance: a cross-sectional study. Tap Chi Y Te Cong Cong 2015;3:44–56.
36. The Chinese Communist Party Committee. Decisions of the central committee of the communist party of China and the State Council on further strengthening rural health work. Beijing, 2002.
37. Ministry of Finance of ChinaNational Health and Family Planning Commission of China, Ministry of Human Resources and Social Security of China. Notice on raising the premium of the new rural cooperative medical scheme and the urban residents basic medical insurance scheme in 2014. Beijing, 2014:04–25.
38. Abraído-Lanza AF, Dohrenwend BP, Ng-Mak DS, et al. The Latino mortality paradox: a test of the "salmon bias" and healthy migrant hypotheses. Am J Public Health 1999;89:1543–8.
39. Kraft AD, Quimbo SA, Solon O, et al. The health and cost impact of care delay and the experimental impact of insurance on reducing delays. J Pediatr 2009;155:281–5.
40. National Health and Family Planning Commission of China, Ministry of Finance of China. Guidelines for cost verification and reimbursement for out-of-province medical serivces under the new rural cooperative medical scheme. Beijing, 2015.
41. Ikegami N, Yoo BK, Hashimoto H, et al. Japanese universal health coverage: evolution, achievements, and challenges. Lancet 2011;378:1106–15.
42. Li Y, Wu Q, Xu L, et al. Factors affecting catastrophic health expenditure and impoverishment from medical expenses in China: policy implications of universal health insurance. Bull World Health Organ 2012;90:664–71.
on October 29, 2021 by guest. P
rotected by copyright.http://gh.bm
j.com/
BM
J Glob H
ealth: first published as 10.1136/bmjgh-2017-000477 on 16 O
ctober 2017. Dow
nloaded from