Embed Size (px)
Citation preview
Page 1
Social Grants, Welfare and the Incentive to Trade-Off Health for Income among
Individuals on HAART in South Africa
Running Header: Social Grants, Welfare and Health
Atheendar S. Venkataramani1, Brendan Maughan-Brown2, Nicoli Nattrass2, Jennifer Prah Ruger1
1Division of Health Policy and Administration, Yale University School of Public Health,
2AIDS and Society Research Unit, University of Cape Town
Correspondence and Reprints to:: A. Venkataramani, 60 College St/ P.O. Box 208034 /New
Haven, CT 06520 USA; e-mail: [email protected]; ph: (+1) 518 859 0995
Funding Sources: The Whitney and Betty MacMillan Center for International and Area Studies
at Yale University and the William and Flora Hewlett Foundation.
Conflicts of Interest: None.
ABSTRACT
Background: A growing body of qualitative research suggests that poor South Africans
living with HIV/AIDS may be compelled to trade-off their health in order to remain eligible

Page 2
to receive state grants given to those too sick to work. We used quantitative methods to
evaluate the extent to which disability grants promoted individual and household welfare
and, consequently, the impacts of grant loss, among persons living with HIV/AIDS in South
Africa. We then assessed whether individuals forewent/modulated their treatment in order
to retain/regain access to grants.
Methods and Findings: Using data from a unique three-year panel study of individuals on
HAART from Khayelitsha, a large township of Cape Town, we used individual fixed effects
models to assess the impacts of disability grant receipt/termination on indicators of
individual and household welfare such as self-reported health status, adherence to treatment,
individual and household incomes, and employment status. We then used a variety of
strategies to further assess whether individuals traded off health for income, including
tracking the health trajectories of poorer individuals who a priori might be most susceptible
to reacting to perverse incentives introduced by the disability grant system. We found that
disability grant loss was associated with substantial declines in individual and household
incomes, especially among those people who could not find employment thereafter.
However, we found no evidence of a relationship between grant loss and self-reported
health or adherence, and respondents did not appear to take frequent breaks from treatment
in order to remain eligible for grants.
Conclusion: While individuals and households experienced significant drops in income due
to grant loss, they experienced no fall in health status and appeared unwilling to trade-off
their health for income.
KEYWORDS
Adherence, AIDS, Antiretroviral Therapy, Incentives, Social Security, South Africa

Page 3

Page 4
INTRODUCTION
HIV/AIDS is an important public health and policy issue in South Africa. Recent
estimates suggest that nearly 20% of all adults aged 20-64 in the country are infected with
this disease [1]. Policies to address the adverse health and socioeconomic consequences of
HIV/AIDS in South Africa include public sector provision of highly active antiretroviral
therapy (HAART) and the disability grant, a cash transfer program targeting individuals who
are deemed too sick or incapacitated to work and who meet an income-based means test [2].
The disability grant is a small but growing component of South Africa’s relatively
generous and well-developed social security system. The number of individuals receiving
disability grants has more than doubled since 2000, rising to 1.4 million recipients in 2008,
with much of this growth attributable to increases in the number of AIDS-sick people [3-7].
Government grants in general, and the disability grant and old age pension in particular (the
two largest transfers), are highly redistributive. Poor households with access to such grants
are significantly better off than comparable households without pensioners or disability
grantees [5, 8-16].
Disability grants are awarded either on a ‘temporary’ basis (payments are provided up
to one year, whereupon the individual has to reapply for further benefits) or on a
‘permanent’ basis (requiring renewal every five years); a letter from a physician is used to
confirm that the applicant it indeed to sick too work and the necessary time frame over
which the grant is to be awarded[2]. People lose eligibility once they become healthy enough
to re-enter the labor force. However, because of high rates of unemployment, particularly
among black South Africans, the loss of a disability grant is not necessarily followed by a
shift into employment. Indeed, many people who lose their grants may find themselves

Page 5
trapped in a state of unemployment, with serious consequences for individual and household
welfare.
For individuals who are AIDS-sick, those receiving treatment generally have their
health restored within six months [17-19]. These individuals should lose their disability
grants as they are no longer too sick to work. However, if the person is unable to find work
after the disability grant has been terminated, and if they cannot borrow from formal
institutions or extended family/social networks, they may find their health threatened once
again – most obviously by poor nutrition (which undermines the person’s immune system
and reduces the effectiveness of HAART).
Consequently, policymakers and researchers are concerned that individuals on
HAART may have to choose between adhering to treatment and losing the disability grant,
or defaulting on treatment in order to get sick enough to have the grant renewed [5, 6, 12,
14, 15]. That is, the disability grant system may create perverse incentives for individuals
living with HIV/AIDS to forego treatment in order to maintain their income. Given that the
number of people losing their disability grants per year is likely to rise to about half a million
by 2010 [6], this potential trade-off could have serious social implications and may
contribute to the development of resistance to HAART [20]. The aim of this study is to
quantitatively assess, for the first time, the impacts of disability grant receipt on individual
and household welfare (i.e., establish whether the hypothesized perverse incentives are
salient) and whether the possibility of grant loss or grant loss itself drives individuals to trade
off their health for additional income, using a unique longitudinal dataset of individuals on
HAART.

Page 6
METHODS
Setting and Data
Data used in this study were collected in Khayelitsha, a large black township of over
500,000 people situated southeast of central Cape Town. Khayelitsha is an overcrowded mix
of formal housing and informal (shack type) houses, but most residents are poor and live in
corrugated iron shacks without running water. Unemployment rates in the area are around
51% [21]. Antenatal clinic data indicate an HIV prevalence of 33% [22].
In 2004/2005 the AIDS and Society Research Unit (ASRU) at the University of
Cape Town initiated the HAART Panel Study to investigate the impact of long-term
HAART on the lives of people living with AIDS. The study aimed to recruit as many people
who had participated in the pilot HAART roll-out program conducted in Khayelitsha by
Médecins Sans Frontières (MSF) in collaboration with the Western Cape Provincial
government. This program, the first public provision of HAART in Africa, started in May
2001 and, by 2004, more than a thousand Khayelitsha residents had commenced treatment
[23-25].
Because of patient confidentiality issues, there was no sample frame upon which to
draw a representative random sample. Consequently, a (purposive) snowball sample of 242
individuals who had been on HAART for at least a year was recruited through social
networks via word of mouth and contacts with clinics and support groups. Over two thirds
of those who joined the MSF pilot HAART project in 2001 were recruited into the study, as
were over a third of the total known cohort of people in Khayelitsha who had been on
HAART for longer than a year. The sample was re-interviewed in early 2006 and late 2007.
The HAART Panel sample is suitable for the purposes of this study for three
reasons. First, Khayelitsha is a relatively poor area and, consequently, the majority of the

Page 7
sample would be eligible for the disability grant. Second, Khayelitsha is known to afford
residents relatively easy access to social welfare organizations. Thus, a high proportion of
eligible adults in Khayelitsha can be expected to be accessing disability grants. Third, as
HAART has restored many of the participants’ health it is likely that disability grant loss
would be reported during the three-year study period.
For our analysis, we used data on individual and household incomes (inclusive of all
wages, profits, remittances and grants) and a binary measure of employment in the month
preceding the interview as indicators of economic status. Specific measures of health used
were self-reported health status (1 – 5 Likert scale, with 1 being poor and 5 being excellent
health) and side effects experienced (a scale from 0 – 12, reflecting the number of different
types of side effects). We considered side effects as these may reflect reduced efficacy of
HAART in conditions where nutritional intake is compromised due to loss of income. We
also utilized two measures of adherence to treatment: a 1 – 10 Likert scale, with 10 being
perfect adherence, and a binary measure from the 2007 wave indicating whether the
individual would hypothetically forego treatment to continue receiving disability grants
Empirical Analysis
We began by examining trends in adherence to treatment, health, economic status
and disability grant receipt, by calculating descriptive statistics for the individual and
household welfare outcomes for each of the three survey waves. These statistics were
computed for the entire sample and separately by those receiving disability grants in order to
differences in grant recipients and non-recipients and to assess the potential impacts of grant
loss. We also followed health and economic status over time for those individuals who lost
disability grants between the first and second rounds of the survey by subsequent

Page 8
employment status to assess whether the impact of grant loss varied by whether or not an
individual could find work.
Individual fixed effects regressions were then used to examine impacts of grant
receipt/termination on individual and household welfare. Specifically, disability grant receipt
was used as the main independent variable, with adherence to treatment, health (self-
reported health status and side effects), employment, income, and household demographic
characteristics (household size, number of pensioners, and number of children) as dependent
variables. We included the demographic variables as previous research has shown them to be
responsive to social welfare transfers [16]. All specifications included binary indicators for
survey wave, and interactions between survey wave and age, education, length of time since
commencing HAART, and gender to account for differential time trends that may influence
both disability grant receipt and the outcomes of influence.
We used individual fixed effects in order to control for time invariant unobservable
characteristics that may be jointly correlated with disability grant receipt and individual and
household welfare outcomes. For example, those who receive grants may be worse
off/poorer than those who do not, thus leading to underestimates of the impact of grant
loss. The bias may work in the opposite direction as well: those who receive grants may be
better able to navigate the social security system using skills that are also beneficial in gaining
employment and sustaining health. Fixed effects would account for both types of bias.
However, several issues arise with the use of fixed effects regressions. For example,
such models would be prone to bias from reverse causality. In our case, because grants are
allocated based on health status, estimates from fixed effects models may reflect the effect of
changes in health on grant status rather than the other way around. More generally, fixed
effects models do not account for time-varying characteristics, such as unobserved changes
Page 9
in family circumstances, which may influence both grant receipt and individual and
household health outcomes. To address this issue, we compared the fixed effects coefficients
to those gleaned from instrumental variable models, where we used reported grant renewal
prior to the first survey wave as an instrument for grant receipt status. We contend that grant
renewals are correlated with the type of grant that the individual may have initially received
(‘permanent grants’ would not require renewal, whereas ‘temporary’ grants would), and
therefore also with the likelihood of having a grant at any given time. Qualitative evidence
suggests that doctors vary greatly in how stringently they follow disability grant laws and
with regard to their propensities for prescribing ‘temporary’ or ‘permanent’ grants [26]. Thus,
conditional on individual fixed effects, the type of disability grant an individual initially
received may essentially be random1. Under these assumptions, grant renewal would be an
ideal instrumental variable in that it would predict who loses grants but would not affect
(changes in) adherence, health and socioeconomic status directly. Put differently, with the
use of this instrument, we can be confident that grant loss is not (reverse) caused by any of
our outcome variables or by unobserved time varying characteristics
The fixed effects approach, while useful in helping determine the impacts of grant
loss, may not necessarily provide information on people’s behavioral responses to the
potential of grant loss. For example, if individuals forego or modulate their treatment
regimen just before their grant comes up for renewal in order to remain on disability grants,
not only would the estimates of the impact of grant loss on health be downward biased, but
the empirical model would not necessarily capture this nuanced dynamic behavior.
1 This assumption might be too strong if individuals may have initially bribed doctors to get temporary or permanent grants. However, if the propensity or ability to bribe officials remains fixed over time, then this possibility would be addressed by the individual specific fixed-effect.

Page 10
We adopted several different strategies to further address this issue. First, we utilized
information from questions directly asking individuals whether they would be willing to
forego treatment in order to remain on disability grants and their level of adherence to
treatment between survey waves. Second, since response patterns to these questions may
reflect social desirability bias, we followed self-reported health and side effects over time for
groups of individuals a priori deemed most likely to respond to perverse incentives. Recent
evidence suggests that frequent (structured) breaks from treatment may lead to poorer health
and an increased risk of complications [27]. From this it seems reasonable to suggest that
intermittent breaks from treatment uninformed by clinical parameters may be as bad or
worse for one’s health. As such, if individuals were actually foregoing treatment from time to
time in order to stay eligible to receive grants, we would expect to see worsening self-
reported health and side-effect profiles over time. Thus, our strategy compared the health
trajectories of those individuals who reported having had to renew their grant prior to 2004
and/or those individuals in the bottom quartile of the baseline income distribution and see if
their health status worsens over time relative to their better off counterparts. We chose the
group of renewers because, as mentioned earlier, these individuals were likely on temporary
grants and thus actually stood to lose the transfers during the study period. Poorer
individuals were chosen because it is likely that these individuals were most reliant on grant
income for consumption. The specific model we used to assess differential trends included
the interaction between a binary indicator for being in a “vulnerable” group at baseline and
survey year and individual fixed effects; the dependent variable was either self-reported
health or the number of reported side effects.
Finally, we investigated possible biases due to attrition across the survey waves. We
used regression techniques to model the probability of leaving the panel study as a function

Page 11
of age, gender, level of education, employment status, household income, household size,
disability grant receipt and self-reported health at baseline. If attrition was due to death, an
outcome that is perhaps more likely for those who do not adhere to treatment, then the
relationships between grant receipt and/or poverty and attrition may provide additional
insight into whether individual’s trade-off their health for income.
RESULTS
Sample characteristics, calculated from the first wave of the survey, are presented in
Table 1. We also present sample statistics from baseline data collected from the concurrent
Khayeltisha Panel Study (KPS). The latter study represents a random sample of the township
population and serves as a useful benchmark to assess whether empirical results from the
HAART sample can be generalized.
In the HAART sample, the vast majority of respondents (79%) were women; the
difference between the HAART and KPS in this regard is statistically significant.2 The mean
age in the HAART Panel Study was 34 years, and most individuals had completed an average
of 9.5 years of schooling, which mirrors the results found in the general population survey.
Baseline income levels across the two surveys were similar, as well, though individuals in the
KPS were significantly more likely to hold employment. Also, individuals in the KPS
reported having better self-reported health than their counterparts in the HAART survey.
Finally, most relevant to the present study, 74% of respondents in the HAART sample
reported receiving a disability grant.
Despite similarities across many baseline sociodemographic studies, one issue with
2 This reflects the fact that women are more vulnerable to HIV than men (so one would expect more women than men to be AIDS-sick) and that men are less likely than women to participate in HAART programs, and seek medical treatment more generally [27].
Page 12
using a selected sample of early adopters of HAART is that they may have been more
health-conscious and more likely to adhere to treatment than the average individual. To
address this possibility, we also looked at differences in (potentially) risky sexual behaviors.
While we found that individuals in the HAART sample are significantly less likely to report
always using a condom, this proportion is still not zero. Furthermore, there was no cross
sample difference in the proportion of individuals reporting concurrent sexual partnerships.
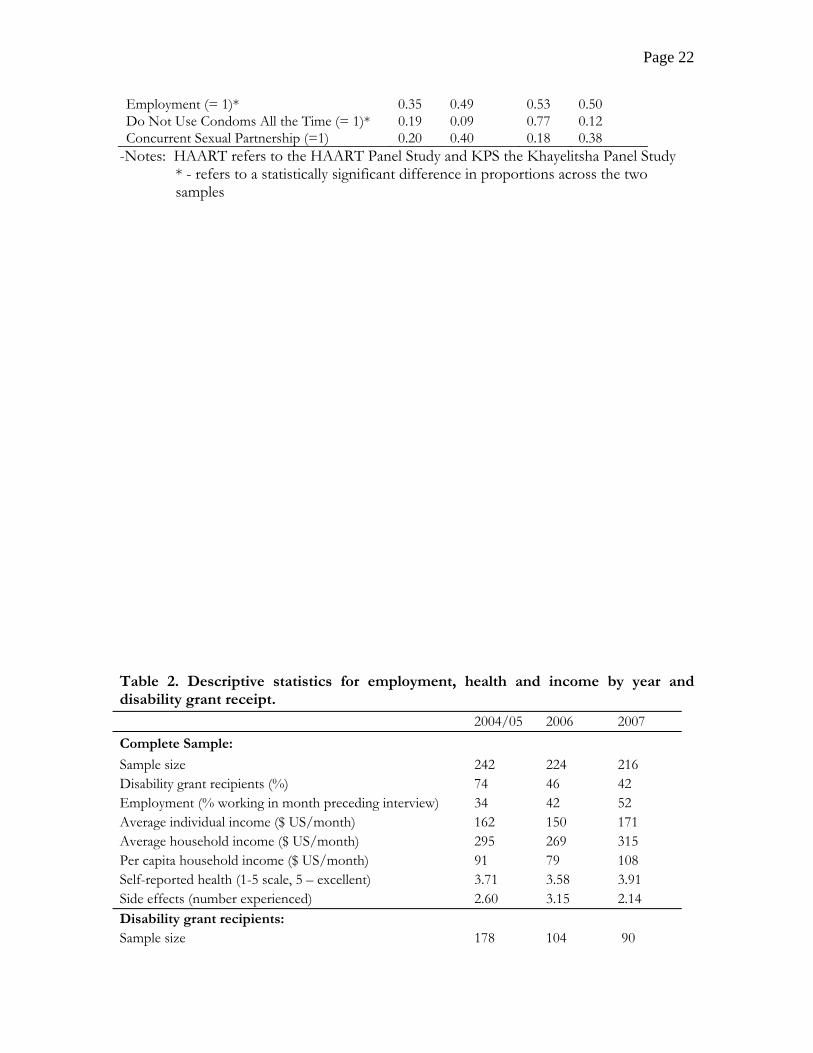
Table 2 presents means for household and individual income, self-reported health
and number of side effects, and the proportions of individuals employed, by sample year and
by receipt of disability grant. Importantly, all individuals reported perfect or near perfect
adherence (9 or 10 out of 10 on the Likert scale) across all three survey waves. In addition,
not a single individual indicated that they would “stop taking ARVs” to “get (back) [their]
disability grant.” 3 We do not report these results in the table given the lack of variation in
adherence behaviors.
Table 2 highlights three main points. First, not surprisingly, disability grant receipt
appeared to be strongly associated with individual and household income. Among disability
grant recipients, grant income constituted the majority of individual income (almost two
thirds in 2004/5 and 2006, and 56% in 2007) and about 40% of household income. Second,
disability grant receipt did not appear to be associated with health outcomes, as self-reported
health and side effects reported were very similar across those with and without grants.
Third, the disability grant system did not appear to have operated as intended: the majority
of the individuals receiving disability grants reported being in good or excellent health and
nearly a third of all grant recipients in the sample were employed in 2004/5 and 2006 (43%
3 It should be noted, however, that 10% of respondents in 2007 agreed that “it is a common strategy for HIV-infected people who have lost their disability grant to become sick again to get the grant back.”

Page 13
of grant recipients were working in 2007).4 In addition, of the 42 individuals who started
receiving disability grants before 2002, exactly half continued to report receipt in 2007 (not
shown here). Even under the assumption that these individuals were issued permanent (five-
year) grants, all of these grants should have been terminated by the final survey wave.
Table 3 explores the potential negative effects of grant loss on health and income by
following individuals whose disability grant was terminated (and not renewed) between the
first two survey waves. On average, an individual who lost a disability grant reported
significantly lower personal income in 2006, though this appears to have rebounded slightly
in 2007 (see first panel of table). Household income showed a similar pattern, though the
declines were smaller in relative and absolute terms. This suggests the presence of coping
mechanisms among households, extended families and social networks that helped smooth
income in response to the loss of grants. However, our results also suggest that these coping
mechanisms may have been incomplete: household income fell substantially and had not
recovered more than two years after the loss of the disability grant. The adverse effects of
this drop in income would be accentuated if consumption smoothing mechanisms are
limited, as is likely among this poor sample.
For individuals losing disability grants who were unable to find employment (see
second panel of Table 3), the situation was more dire: personal income dropped by over 95%
and household income fell by nearly 50%. While these individuals reported increases in all
measures of income in the final survey round, the turnaround was small in comparison to
the initial decline. In addition, unemployed individuals reported being in slightly worse
health and a greater number of side effects from HAART immediately after losing their
4 Not only did individuals continue to receive grants after commencing employment, but several individuals actually started receiving grants while being engaged in steady wage or self-employment over the previous year (not shown here).

Page 14
grants, though these outcomes rebounded in the final survey wave.
Results for fixed effects models evaluating the potential effects of disability grants on
various measures of individual and household welfare are presented in Table 4. To reduce
clutter, we only report coefficients on the disability grant variable. The first panel of the table
illustrates results for logged income (individual and household) and employment. The
estimates suggest that losing a disability grant was associated with a 74% decrease in personal
income (coefficient/[coefficient + 1]). The results for household income suggest a similar
pattern, though the percentage decreases are much smaller (43%). As mentioned previously,
this could reflect the effect of consumption and income smoothing mechanisms among
families and other social networks. We found no association between disability grant status
and employment status.
In the second panel of Table 4 we present results for self-reported health and side
effects from treatment. We found no statistically significant association between disability
grant receipt and the health status indicators. The findings in this panel, as well as those
presented in the first panel, are consistent with those gleaned from Tables 2 and 3.
Finally, the third panel of Table 4 illustrates the association between disability grant
receipt and household demographics. We found a strong positive association between grant
status and the number of children under the age of 10. We found no statistically significant
associations between total household size or the number of pension eligible elderly living in
the household and disability grant status. Collectively, these findings suggest that the share of
dependents in the household decreased in response to disability grant loss, which is
consistent with the literature on the South African Old Age Pension [16].
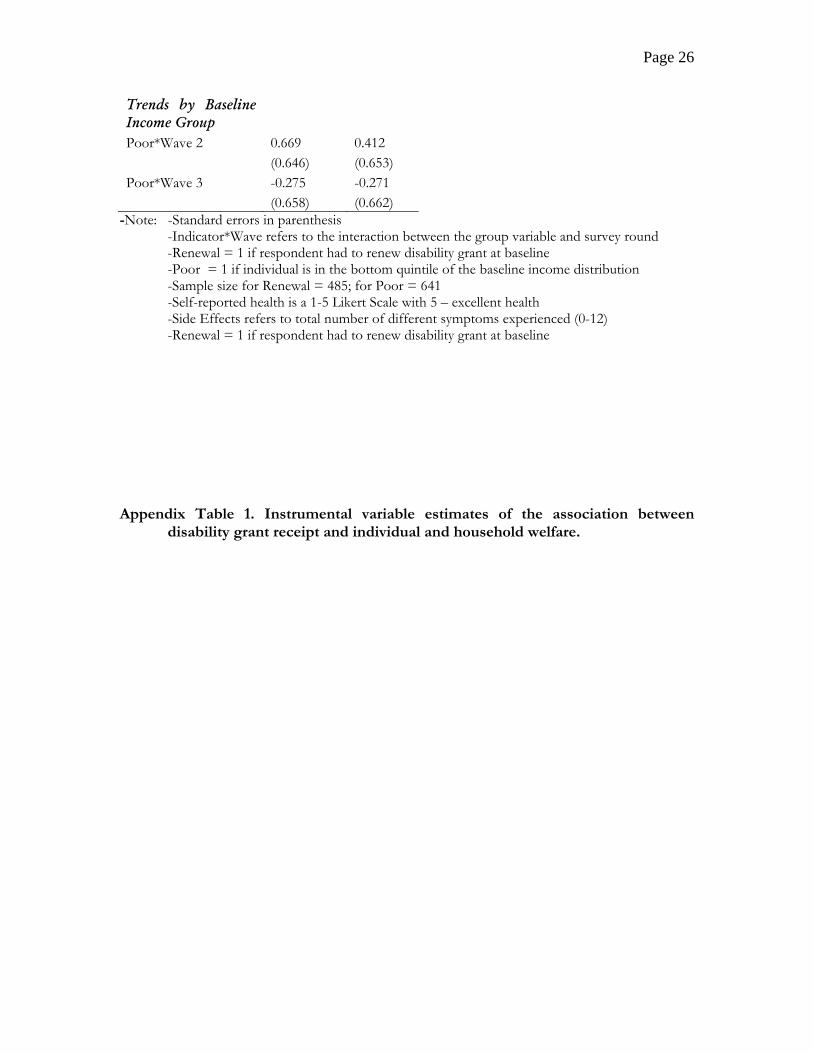
The IV results (see Appendix Table 1) were similar in magnitude and sign, though less
precisely estimated, as compared to the results in Table 4. Furthermore, we tested the
Page 15
sensitivity of the fixed effects results to the exclusion of the age, gender and education
specific trends and found the results to be robust (not shown here). Both pieces of evidence
suggest that the fixed effects estimates on disability grant receipt were not biased by other
time-varying factors that might have jointly influenced grant receipt and individual and
household welfare, thus confounding the relationship between the two.
Table 5 presents results for fixed effects models comparing the health trajectories of
population groups who were a priori deemed more likely to respond to perverse incentives
generated by the grant program to those their better off counterparts. Using those who had
to renew their grants as our group of vulnerable individuals, we found no downward
(upward) trend in self-reported health (side effects) in models with or without additional
controls: in fact the point estimates imply that renewers became slightly better off in terms
of these health indicators than their counterparts. While the standard errors on these
coefficients were large, the 95% confidence intervals did rule out meaningful adverse trends.
The trend estimates for those in the bottom quintile of the baseline income distribution were
even less impressive than those estimated for baseline grant renewers and were often “wrong
signed,” as well, though in the case of self-reported health the 95% confidence bands did not
rule out substantively important trends towards poorer health. These results, in conjunction
with those from the fixed effects models and the fact that not a single respondent reported
that they would consider trading-off income for health, suggest that individuals did not
respond to perverse incentives in grant loss during the study period.

Page 16
Finally, none of the baseline characteristics (health, income, side effects, disability
grant receipt, age, and education level) were significant predictors of survey attrition (not
shown here). This suggests that the estimates in Tables 4 and 5 were not biased by poorer,
sicker individuals leaving the survey.
DISCUSSION
The disability grant program is an important part of South African policy towards
persons living with AIDS. Individuals who become AIDS-sick are eligible to receive this
large transfer payment, which is intended to support them until they become well enough to
work. However, upon grant termination, many individuals may be unable to find work due
to high levels of unemployment, which could create perverse incentives to forego treatment
in order to stay sick enough to remain eligible for grant payments.
The aim of our study was to examine (1) whether the loss of disability grants had
measures of individual and household welfare, such as income and self-reported health, and
(2) whether individuals responded to potential perverse incentives created by the grant
program by forgoing or interrupting treatment. Using data from a panel survey of individuals
on HAART in Khayelitsha, South Africa, our core findings were that disability grant receipt
(termination) was highly associated with higher (lower) personal and household incomes.
However, there was no association between grant receipt and health and the results of a
variety of different empirical tests consistently suggested that individuals did not interrupt
treatment in order to become/remain eligible for grants. Put differently, our results with
respect to adherence and health do not support qualitative and anecdotal evidence that
individuals forego or modify treatment in order to continue receiving disability grant

Page 17
transfers. This is despite the fact that individuals who lost grants, especially those who were
not employed, experienced large decreases in their own and their household’s income.
The discrepancy in the findings regarding adherence/health and income may be
explained by households compensating for the loss of a disability grant in ways that do not
require one to sacrifice their health. For example, as our results indicated, one such
compensation mechanism was altering household composition. Along these lines, our
findings that the disability grant system did not work as intended – individuals who a priori
should have been ineligible for grants continued to receive them - suggests that individuals
may have had ample opportunities to game the system, which may have precluded the need
to forego treatment. Finally, individuals may not have been willing to trade-off their health
under any circumstances, as the disutility from becoming AIDS-sick again far outweighs the
loss of income or consumption. Each of these points warrants further research attention.
The discrepancy between our results and the qualitative evidence may perhaps also be
explained by differences in sampling. It is possible that the individuals who self-selected into
the HAART Panel Study, who were recruited through social networks, were more vigilant
about maintaining their health the average person living in Khayelitsha. Thus, our sample
may exclude those people who would be most likely to forego treatment for income.
However, as shown in Table 1, the respondents in the HAART sample were similar to a
random sample of those in the general population on a number of important characteristics,
including educational attainment and income. With regards to greater vigilance over one’s
health specifically, the high level of concurrent sexual partnerships and risky sexual behaviors
in the HAART sample suggest that non-representativeness with respect to these
characteristics may not compromise the generalizability of the results entirely.
There are several other limitations in our study, as well. First, our strategies to explore

Page 18
whether individuals respond to perverse incentives are indirect. While we are able to show in
a variety of tests that the bulk of the evidence points towards finding that individuals do not
trade-off income for health, future research would do well to procure more direct evidence.
Second, self-reported measures for adherence and, to a lesser extent, health may be prone to
reporting biases. Future research should seek to use objective indicators, such as viral loads
or CD4+ counts. On this point, we did use some self-reported information on CD4+
counts and the results conformed very well to the findings presented in the previous section.
However, self-reported counts are only available for about 60% of the sample, and the
number of reported counts varies greatly across individuals. Thus, we did not highlight these
results due to worries about recall bias and sample selection.
In terms of policy implications, while our results suggest that individuals on HAART
do not forego treatment to remain on disability grants, there still appears to be a large
financial burden associated with grant loss. Future research should examine alternative social
welfare programs for AIDS-sick individuals that do not assume that individuals can find
work after they stop receiving transfers or provide means to better smooth consumption and
income over time. This would help mitigate any negative welfare costs of losing a social
grant as well as reduce any incentive to engage in potentially harmful behaviors to continue
receiving transfers.
ACKNOWLEDGEMENTS
We would like to thank the Center for Social Science Research at the University of Cape
Town for access to data from the HAART Panel Study and research support. We would also
like to thank Nathan Geffen, A. David Paltiel, Jeremy Seeking, Jody Sindelar, and seminar
participants at the University of Cape Town, Center for Social Science Research for helpful
comments and suggestions. Funding for this research was provided by the Whitney and
Page 19
Betty MacMillan Center for International and Area Studies at Yale University and the
William and Flora Hewlett Foundation.
REFERENCES 1. Actuarial Society of South Africa. ASSA 2003 HIV/AIDS projection models. In;
2005. 2. Department of Social Development - Republic of South Africa. Disability Grants.
In; 2007. 3. Department of Social Development - Republic of South Africa. Annual report. In;
2003. 4. Department of Social Development - Republic of South Africa. Annual report. In;
2006. 5. Nattrass N. Trading off income and health?: AIDS and the disability grant in
South Africa. Journal of Social Policy 2006,35:3-19.
Page 20
6. Nattrass N. Disability and Welfare in South Africa's Age of Unemployment and AIDS. In: The State of the Nation 2007. Edited by Southall R, Daniel J. Pretoria: Human Sciences and Research Council; 2006.
7. National Treasury (Republic of South Africa). Budget Review 2008. Pretoria: National Treasury; 2008.
8. Booysen F, Van der Berg S. The role of social grants in mitigating the socio-economic impact of HIV/AIDS in two Free State communities. South African Journal of Economics 2005,73:545 - 563.
9. Case A, Deaton A. Large cash transfers to elderly in South Africa. The Economic Journal 1998,108:1330 - 1361.
10. Duflo E. Child health and household resources in South Africa: Evidence from the Old Age Pension program. American Economic Review 2000,90:393-398.
11. Edmonds EV. Child labor and schooling responses to anticipated income in South Africa. Journal of Development Economics 2006,81:386-414.
12. Hardy C, Richter M. Disability grants or antiretrovirals? A quandry for people with HIV/AIDS in South Africa. African Journal of AIDS Research 2006,5:85-96.
13. Koker C, de Waal L, Vorster J. A profile of social security beneficiaries in South Africa - Vols I and II. In; 2006.
14. Leclerc-Madlala S. 'We will eat when I get the grant': negotiating AIDS, poverty and antiretroviral treatment in South Africa. African Journal of AIDS Research 2006,5:249 - 256.
15. Simchowitz B. Social security and HIV/AIDS: assessing 'disability" in the context of ARV treatment. Center for Social Science Research Working Paper, University of Cape Town 2004,Number 99.
16. Edmonds EV, Mammen K, Miller DL. Rearranging the family? Income support and elderly living arrangements in a low-income country. Journal of Human Resources 2005,40:186-207.
17. Graff-Zivin J, Thirumurthy H, Goldstein M. AIDS treatment and intrahousehold resource allocations: children's schooling and nutrition in Kenya. NBER Working Paper 2006,No. 12689.
18. Smit C, Geskus R, Walker S, Sabin C, Coutinho R, Porter K, et al. Effective therapy has altered the spectrum of cause-specific mortality following HIV seroconversion. Aids 2006,20:741-749.
19. Thirumurthy H, Graff-Zivin J, Goldstein M. The economic impact of AIDS treatment: labor supply in Western Kenya. NBER Working Paper 2005,No. 11871.
20. Bangsberg D, Porco T, Kagay C, Charlebois D, Deeks S, Guzman D, et al. Modeling the HIV protease inhibitor adherence-resistance curve by use of empirically derived estimates. The Journal of Infectious Diseases 2004,190:162-165.
21. City of Cape Town. A population profile of Khayelitsha. In; 2005. 22. Shaikh N, Abdullah F, Lombard CJ, Smit L, Bradshaw D, Makubalo L. Masking
through averages - intraprovincial heterogeneity in HIV prevalence within the Western Cape. Samj South African Medical Journal 2006,96:538-543.
23. Coetzee D, Boulle A, Hildebrand K, Asselman V, Van Cutsem G, Goemaere E. Promoting adherence to antiretroviral therapy: the experience from a primary care setting in Khayelitsha, South Africa. Aids 2004,18:S27-S31.
24. Coetzee D, Hildebrand K, Boulle A, Maartens G, Louis F, Labatala V, et al. Outcomes after two years of providing antiretroviral treatment in Khayelitsha, South Africa. Aids 2004,18:887-895.

Page 21
25. Médecins Sans Frontières. Antiretroviral Therapy in Primary Health Care: The Experience of the Khayelitsha Programme in South Africa. . Geneva: World Health Organization; 2003.
26. De Paoli M, Mills E, Grønningsæter A. Social grants, AIDS, and the role-out of HAART on South Africa. Unpublished manuscripts. 2008.
27. The Strategies for Management of Antiretroviral Therapy (SMART) Study Group. CD4+ count-guided interruption of antiretroviral treatment. New England Journal of Medicine 2006,355:2283-2296.
TABLES Table 1. Baseline characteristics for HAART Panel Study.
HAART (n = 242) KPS (n = 571) Mean Std. Dev Mean Std. Dev Disability Grant (= 1)* 0.74 0.44 0.08 0.27 Gender (female = 1)* 0.79 0.41 0.59 0.49 Age (years) 33.95 7.22 38.49 12.22 Education None 0.02 0.14 0.03 0.16 Primary 0.12 0.32 0.17 0.38 Secondary 0.54 0.50 0.53 0.50 Grade 12/Matric 0.33 0.47 0.27 0.49 Baseline Household Income ($US/month) 294.87 194.53 321.65 284.12 Self-Reported (1-5 Likert Scale, 5 – excellent health) 3.71 1.13 4.07 1.11
Page 22
Employment (= 1)* 0.35 0.49 0.53 0.50 Do Not Use Condoms All the Time (= 1)* 0.19 0.09 0.77 0.12 Concurrent Sexual Partnership (=1) 0.20 0.40 0.18 0.38
-Notes: HAART refers to the HAART Panel Study and KPS the Khayelitsha Panel Study * - refers to a statistically significant difference in proportions across the two samples
Table 2. Descriptive statistics for employment, health and income by year and disability grant receipt. 2004/05 2006 2007 Complete Sample: Sample size 242 224 216 Disability grant recipients (%) 74 46 42 Employment (% working in month preceding interview) 34 42 52 Average individual income ($ US/month) 162 150 171 Average household income ($ US/month) 295 269 315 Per capita household income ($ US/month) 91 79 108 Self-reported health (1-5 scale, 5 – excellent) 3.71 3.58 3.91 Side effects (number experienced) 2.60 3.15 2.14 Disability grant recipients: Sample size 178 104 90

Page 23
Employment (% working in month preceding interview) 30 32 43 Average individual income ($ US/month) 176 173 192 Contribution of disability grant to individual income (%) 65 65 59 Average household income ($ US/month) 298 284 331 Contribution of disability grant to household income (%) 39 40 34 Per capita household income ($ US/month) 93 81 109 Self-reported health (1-5 scale, 5 – excellent) 3.75 3.61 3.89 Side effects (number experienced) 2.61 3.43 2.78 Notes: Income measures for 2006 and 2007 were adjusted to 2004 values to account for
inflation. We then converted South African Rand to US Dollars using the average exchange rate for 2004.
Table 3. Descriptive statistics for health and income by year and by employment status for those who lost disability grants between 2004 and 2006. 2004/05 2006 2007 Individuals who lost the disability grant between the 2004/05 and 2006 surveys
Sample size 65 65 55 Employment (% working in month preceding interview)
34 43 60
Average individual income ($ US/month) 195 89 135 Average household income ($ US/month) 318 259 268 Per capita household income ($ US/month) 107 79 111 Self-reported health (1-5 scale, 5 – excellent) 3.90 3.64 4.07 Side effects (number experienced) 2.42 2.81 2.01 Unemployed individuals who lost the disability grant between the 2004/05 and 2006 surveys

Page 24
Sample size 37 22 Average individual income ($ US/month) 9 28 Average household income ($ US/month) 173 194 Per capita household income ($ US/month) 45 52 Self-reported health (1-5 scale, 5 – excellent) 3.55 3.88 Side effects (number experienced) 3.76 2.50 Notes: See Notes for Table 2. Table 4. Fixed effects regression estimates of the association between disability grant receipt and individual and household welfare. Panel 1 - Economic Variables Ln(Individual Income) Ln(Household Income) Employment Disability Grant 2.988* 0.755* -0.035 (0.254) (0.157) (0.056) Sample size 675 648 675 Panel 2 - Health Variables Self-Reported Health Side Effects Disability Grant 0.156 -0.007 (0.129) (0.385) Sample Size 672 675
Panel 3 - Demographic Variables
Household Size No. Under 10 No. Pension Eligible Disability Grant 0.052 0.210* 0.009 (0.197) (0.086) (0.047) Sample Size 673 673 673 Notes: Standard errors in parentheses

Page 25
-* statistically significant at 5% level -All models include dummy variables for 2006 and 2007 survey waves, and the interaction between these variables and baseline age, time since commencing HAART and education and gender. -Disability Grant: binary indicator = 1 if individual was receiving a grant at the time of the survey. -Ln(individual income) and Ln(Household Income): the natural logs of individual and household income, respectively. Zero values for the income variables were coded as 1. -Employment: binary indicator = 1 if the individual reported wage or self-employment in the month preceding the interview. -Self-reported health: 1 – 5 Likert Scale, with 1 being poor health and 5 excellent health. -Side effects: the total number of different side effects experienced (up to 12 possible) -Household size, No. Under 10 and No. Pension Eligible: total number of household members in each category, respectively.
Table 5. Fixed effects regression estimates of trends in self-reported health and side effects by baseline vulnerability Self Reported Health
No Controls
With Controls
Trends by Renewal Renewal*Wave 2 0.022 0.052 (0.211) (0.216) Renewal*Wave 3 0.244 0.368 (0.217) (0.223) Trends by Baseline Income Group Poor*Wave 2 0.019 0.108 (0.218) (0.220) Poor*Wave 3 0.046 0.091 (0.222) (0.223) Side Effects
Trends by Renewal Renewal*Wave 2 0.234 0.250 (0.630) (0.651) Renewal*Wave 3 0.368 0.366 (0.648) (0.671)
Page 26
Trends by Baseline Income Group Poor*Wave 2 0.669 0.412 (0.646) (0.653) Poor*Wave 3 -0.275 -0.271 (0.658) (0.662)
-Note: -Standard errors in parenthesis -Indicator*Wave refers to the interaction between the group variable and survey round -Renewal = 1 if respondent had to renew disability grant at baseline -Poor = 1 if individual is in the bottom quintile of the baseline income distribution -Sample size for Renewal = 485; for Poor = 641
-Self-reported health is a 1-5 Likert Scale with 5 – excellent health -Side Effects refers to total number of different symptoms experienced (0-12) -Renewal = 1 if respondent had to renew disability grant at baseline Appendix Table 1. Instrumental variable estimates of the association between
disability grant receipt and individual and household welfare.

Page 27
EmploymentDisability Grant 0.146
(0.336)
Sample size 482
IV DiagnosticsCragg-Donald Statistic 6.844Hausman Endogeneity (p-value) 0.735 (0.391)Sargan Overidentification (p-value) 0.013 (0.909)
Disability Grant
Sample Size
IV DiagnosticsCragg-Donald StatisticHausman Endogeneity (p-value)Sargan Overidentification (p-value)
No. Pension EligibleDisability Grant 0.273
(0.296)
Sample Size 480
IV DiagnosticsCragg-Donald Statistic 6.843Hausman Endogeneity (p-value) 1.137 (0.286)Sargan Overidentification (p-value) 0.115 (0.734)
6.8430.372 (0.542)1.409 (0.235)
6.8430.009 (0.925)0.388 (0.533)
6.8440.212 (0.645)1.387 (0.239)
6.7701.501 (0.221)1.286 (0.260)
6.4090.624 (0.429)
480 480
-0.454 0.206(1.115) (0.475)
Panel 3 - Demographic VariablesHousehold Size No. Under 10
480 482
2.579 (0.108)
6.8440.541 (0.462)0.092 (0.762)
(0.784) (2.276)
Self-Reported Health Side Effects-0.518 -1.092
Panel 2 - Health Variables
482 457
2.222 1.385*(1.267) (0.687)
Panel 1 - Economic VariablesLn(Individual Income) Ln(Household Income)
-Note: -See Notes for Table 4 for information on model specification and variable definitions
-Standard errors in parentheses -* statistically significant at 5% level -Instrumental variables: Reported grant renewal (=1) in 2004 interacted with dummies for
2005 and 2007 survey waves. Because only those receiving grants in 2004 reported need for renewal, sample sizes are smaller than those reported in Table 4 -Cragg-Donald Statistic is F-statistic for instruments in the first stage models (not shown here) -The null hypothesis of the Hausman endogeneity test is that the instrumented regressor is not determined by omitted variables that also influence the outcomes of interest. The null of the Sargan overidentification test is that the instruments are not correlated with factors other than the regressor of interest that affect the outcome.