Embed Size (px)
Citation preview
The impact of government policyon social exclusion amongolder people
A review of the literaturefor the Social Exclusion Unitin the Breaking the Cycle series
The
imp
acto
fg
overn
men
tp
olicy
on
socialexclusio
nam
on
go
lder
peo
ple
OD
PM–
SEU
The impact ofgovernment policy onsocial exclusion among
older people
A review of the literature for the Social
Exclusion Unit in the Breaking the Cycle
series
August 2004
Chris Phillipson and Thomas ScharfCentre for Social Gerontology, Keele University
Office of the Deputy Prime Minister, London

AcknowledgementsThe authors wish to acknowledge the contribution of Jim Hakim, Kate Jopling, Simon Main and Kirby Swales inpreparing the review. Any errors or omissions remain the responsibility of the authors.
The Office of the Deputy Prime MinisterEland HouseBressenden PlaceLondon SW1E 5DUTelephone 020 7944 4400Web site www.odpm.gov.uk
www.socialexclusionunit.gov.uk
© Crown Copyright 2004
Copyright in the typographical arrangement rests with the Crown.
This publication, excluding logos, may be reproduced free of charge in any format or medium for research, privatestudy or for internal circulation within an organisation. This is subject to it being reproduced accurately and not used ina misleading context. The material must be acknowledged as Crown copyright and the title of the publication specified.
For any other use of this material, please write to HMSO Licensing, St Clements House, 2–16 Colegate, Norwich NR3 18Q Fax: 01603 723000 or email: [email protected].
This is a value added publication which falls outside the scope of the HMSO Class Licence.
Further copies of this publication are available from:ODPM PublicationsPO Box 236Wetherby LS23 7NBTel: 0870 1226 236Fax: 0870 1226 237Textphone: 0870 1207 405Email: [email protected]: www.publications.odpm.gov.uk
ISBN: 185 1127 291
Views expressed in this report are not necessarily those of the Office of the Deputy Prime Minister or any otherGovernment Department.
Printed in Great Britain on material containing 75% post-consumer waste and 25% ECF pulp
August 2004
Product code: 045EU02465
CONTENTS
Executive Summary 5
Chapter 1: Introduction and conceptual framework 9Introduction 9Conceptual Framework 9Methodology of the Review 13
Chapter 2: Review of policies 14
2:1 Policies relating to income 15Introduction 15Minimum Income Guarantee 17Housing Benefit 22Council Tax Benefit 26Attendance Allowance and Disability Living Allowance 29Social Fund 35Addressing financial exclusion of older people: 39Direct Payment and Universal Banking ServicesAddressing fuel poverty among older people: Warm Front 45
2:2 Policies relating to health and social care 53Introduction 53Community care policies and social exclusion 53Health Action Zones 65NHS Direct and Care Direct and Social Exclusion and 71Older People
2:3 Older people and neighbourhood renewal 75Neighbourhood Renewal and New Deal for Communities 75Introduction 75Home Improvement Agencies 79
2:4 Crime, social exclusion and older people 81Introduction 81Policies to reduce crime and fear of crime 82Trends in crime affecting older people 83Evaluating the success of policy initiatives 84
Chapter 3: Conclusion 88
References 91

TABLES
Table 1: Expenditure in long-term care for older people by source: 551996 figures and projections from the PSSRU long-term care financing model (billions of pounds)
Table 2: Average number of contact hours per household per week, 571992 to 2002
Table 3: Households receiving intensive home care 58
EXECUTIVE SUMMARY
IntroductionThis report presents the findings of research that reviews the impact of Government policy on thesocial exclusion of older people. The research was commissioned by the Social Exclusion Unit inJuly 2003, and is mainly based on research and analytical evidence published until February 2004.This is one of four reviews commissioned to inform the Social Exclusion Unit’s assessment ofprogress made in tackling social exclusion.
Developing policies to combat social exclusion has been an important element of Governmentpolicy since the election of the first Labour administration in 1997. Initiatives have beenundertaken targeting poverty and exclusion affecting older people. These initiatives – set out indocuments such as the Department for Work and Pensions’ annual Opportunity for All reports –have been part of a wider debate about the meaning of social exclusion as a concept, and inparticular the relevance of its application to groups such as elderly people. This review examinesavailable research evidence on the effectiveness of policies aimed at limiting the impact of socialexclusion in old age.
The project team set itself three main aims:
• first, to examine the success of policies designed to tackle social exclusion in old age;
• second, to consider whether the evidence suggests some policies have been more successfulthan others;
• third, to identify factors that may either assist the development or create obstacles to theimplementation of effective policies.
To achieve these aims this report:
• examines the background to issues relating to social exclusion in old age;
• identifies the range of policies used to tackle exclusion;
• considers evidence about the impact of policies designed to integrate older people into socialand community life.
Conceptualising social exclusionThe review takes a broad look at social exclusion and identifies four groups of conditions thatmight cause exclusion:
• Age-related characteristics refer to the way in which older people are disproportionatelyaffected by certain kinds of losses or restrictions relating to income, health or reduced socialties. Such changes might take place across all points of the life course but they are likely tofeature more prominently in later life given income changes associated with retirement, theimpact of chronic disabling conditions, and increased needs among people adjusting to livingalone.
5
• Cumulative disadvantage refers to the way that the same birth cohorts may become moreunequal over time. For example, limited educational and work opportunities at early points inthe life course may have long-term consequences in terms of reduced income in old age orlimited awareness about how to access the full range of social and health services.
• Community characteristics highlight the way older people, who may have strongattachments to their locality, may also be vulnerable. Typically this concerns changesassociated with population turnover, economic decline, and rising levels of crime andinsecurity within neighbourhoods.
• Age-based discrimination refers to the impact of ageism within economic and socialpolicies that contributes to various forms of social exclusion in old age. The debate aroundageism has challenged the link with age as a form of dependency, emphasising instead variousdifferent forms of positive engagement that can be maintained throughout the latter half ofthe life course.
Review of policiesA wide range of policies could reasonably be viewed as trying to tackle social exclusion in one formor another. The selection of policies to be studied for the review was guided by two principles.These are adequacy of research data, and relevance to the social exclusion debate. As a result, thereview addresses 19 policy areas grouped under four broad headings. These can in turn be linkedto the drivers of social exclusion in later life outlined above.
These are:
Policies relating to income (age/cumulative disadvantage)• Minimum Income Guarantee.
• Housing Benefit;
• Council Tax Benefit;
• Attendance Allowance and Disability Living Allowance (including Carer’s Allowance);
• Social Fund (including Winter Fuel Payments and Cold Weather Payments);
• Direct Payment and Universal Banking Services;
• Warm Front.
Policies relating to health and social care (age/cumulative disadvantage/age-baseddiscrimination)• Community Care policies;
• Health Action Zones;
• NHS Direct;
• Care Direct.
The impact of government policy on social exclusion among older people
6
Policies relating to urban and neighbourhood renewal (community characteristics)• Neighbourhood Renewal Fund;
• New Deal for Communities;
• Community Empowerment Fund;
• Home Improvement Agencies.
Policies relating to crime (community characteristics)• Reducing Burglary Initiative.
• Neighbourhood Wardens;
• Locks for Pensioners;
• Distraction Burglary Task Force.
Key findingsOn the drivers of social exclusion in later life, the evidence suggests that in general, Governmentpolicy has been more successful in addressing exclusion based on age-related characteristicsand age-based discrimination. By comparison, exclusion driven by cumulativedisadvantage and community characteristics has proved more difficult to tackle.
• Taking the age-related area, government policy can claim some successes.Particularly noteworthy, for example, have been the reduction in the proportion of olderpeople on absolute low incomes; the stabilisation/reduction in the proportion of pensionersexperiencing relative poverty; the enhanced support for people with high levels ofdependency; and the securing of innovations in the community care field. All these gainsmight be said to modify or reduce some of the pressures affecting people as they move intotheir 70s and beyond: for example, pressures that arise through the loss of income associatedwith retirement; problems stemming from chronic health conditions; and problems linked tothe impact of changes associated with life course transitions.
• In contrast, social exclusion arising from cumulative disadvantage appears moreresistant to change. The proportion of those on persistently low incomes has remainedalmost constant since the early 1990s. This suggests a hard core of older people who haveprobably encountered poverty at points throughout their life, and who go on to experiencehigh levels of deprivation in old age. As an illustration, those who have traditionally been poorin old age appear to remain so: single older women, those from ethnic minorities, and thosewith disabilities. These are also the groups who fail in large numbers to claim means-testedbenefits. Low expectations and a lack of awareness of services (a product of cohort rather thanage-related differences) have partly been addressed in the community care reforms andthrough innovations such as NHS Direct and Care Direct. But even here it is noticeable thatkey groups continue to exclude themselves, and that the ‘service-rich’ probably do muchbetter than the ‘service poor’ in utilising service innovations.
• Problems arising from community change remain a significant driver leading tosocial exclusion in old age. Some successes have been recorded with initiatives such asNeighbourhood Wardens, the Reducing Burglary Initiative, and individual projects under NewDeal for Communities. However, there is no clear evidence that the needs of older people arebeing given systematic attention in urban regeneration schemes. Areas of high population
Executive summary
7
turnover and economic deprivation remain an important driver leading to exclusion in oldage. This is reinforced where feelings of insecurity produce restrictions on daily living. Whileworries or fears about particular crimes may have receded, concern about the ‘unsafe’ natureof urban communities remains high and may limit older people’s involvement in a range ofactivities.
• Measures designed to tackle age-based discrimination have been extensive andare beginning to produce a cultural shift in perceptions of older people. In somerespects this is not an easy target to measure, and systematic evidence on the impact ofpolicies has yet to be collected. Also, some of the most significant policies designed tochallenge ageism – such as the National Service Framework – are still at an early assessmentstage. But the range of activity is impressive, notably through the activities promoted by BetterGovernment for Older People, a number of community-based activities in Health ActionZones, community care work, and the development of a range of policies around older peopleand pensions in the Department for Work and Pensions.
In summary, therefore, the review suggests that the impact of policies on social exclusion has beenuneven. Policy has been stronger in tackling certain types of problems which cluster in old age,and in challenging myths and stereotypes about older people. It has been less successful inchallenging inequalities which are carried through into old age and which reflect the experiencesof particular birth cohorts and groups within these cohorts. In addition, policy has been lesssuccessful – at least based on current evidence – in limiting problems that arise from communitiesaffected by economic decline and high rates of population turnover.
Suggestions for future policy developmentArising from these key findings, the review concludes by suggesting three types of policydevelopment that might be important to consider:
• Monitoring the impact of new types of poverty and social exclusion which emerge in old age,against which existing policies may prove inadequate. Some groups, notably divorced andsingle women with inadequate pension provision, are likely to need policy intervention inorder to prevent new forms of social exclusion emerging over the next few years.
• Community care policies need to be broadened to embrace more effectively the socialexclusion agenda. While the extent of change in this policy area has been extensive over thepast decade, there is a case for widening the scope of this work and extending the ambitionsof care in the community.
• In all areas certain groups remain excluded still from key services and benefits. However, thedifferences between and within groups – such as minority ethnic groups, those with mentalhealth problems, or people with disabilities – can be large. The next phase of the socialexclusion debate needs therefore to acknowledge the complex differences between groupsand the implications of this for new forms of social exclusion.
The impact of government policy on social exclusion among older people
8
CHAPTER 1: Introduction andconceptual framework
IntroductionThis report presents the findings of research that reviews the impact of Government policy on thesocial exclusion of older people. The research was commissioned by the Social Exclusion Unit inJuly 2003, and is mainly based on research and analytical evidence published until February 2004.This is one of four reviews commissioned to inform the Social Exclusion Unit’s assessment ofprogress made in tackling social exclusion.
Developing policies to combat social exclusion has been an important element of Governmentpolicy since the election of the first Labour administration in 1997. A number of policy initiativeshave been undertaken, targeting poverty and exclusion affecting older people. These initiatives –set out in documents such as the Department for Work and Pensions’ annual Opportunity forAll reports – have themselves been part of a wider debate about the meaning of social exclusion asa concept, and in particular the relevance of its application to groups such as elderly people. Thisreview examines the available research evidence concerning the effectiveness of policies aimed atlimiting the impact of social exclusion in old age.
The project team set itself three main aims:
• first, to examine the success of policies designed to tackle social exclusion in old age;
• second, to consider whether the evidence suggests some policies have been more successfulthan others;
• third, to identify factors which may either assist the development or create obstacles to theimplementation of effective policies.
To achieve these aims this report:
• examines the background to issues relating to social exclusion in old age;
• identifies the range of policies used to tackle exclusion;
• considers evidence about the impact of policies designed to integrate older people into socialand community life.
Conceptual Framework
What is social exclusion in old age?In the 1950s and 1960s, researchers such as Townsend and Wedderburn (1965) showed olderpeople to be one of the largest groups living in poverty, with widowed and single older peoplebeing identified as especially vulnerable. Townsend (1981) widened the debate with the idea ofolder people being affected by forms of ‘structured dependency’. This was produced by
9
compulsory retirement, poverty and restricted social roles. It was developed through the 1990swith awareness of widening inequalities between pensioners dependent on welfare benefits andthose with access to occupational pensions and savings.
Definitions of social exclusion typically draw together distributional dimensions of poverty (that islack of material resources) and relational aspects (lack of social ties). This is reflected in theGovernment’s definition of social exclusion representing ‘a shorthand term for what can happenwhen people or areas suffer from a combination of linked problems such as unemployment, poorskills, low incomes, discrimination, poor housing, high crime, bad health and family breakdown’.
Measures of social exclusion thus attempt to identify groups lacking in resources, as well as peoplewhose lives are affected by, for example, discrimination, chronic sickness, geographical location, orcultural identification. The approach taken in the study undertaken here tends to follow thisdefinition: lack of material resources is viewed as an important cause of non-participation, but the role of non-material factors will also be highlighted.
Following the above, Burchardt et al. (1999) have sought to develop an operational definition ofsocial exclusion, encompassing five distinct elements relating to an individual’s participation in‘normal’ activities. These are:
• consumption activity – the ability to consume up to a minimum level, the goods and servicesconsidered normal for society;
• savings activity – the accumulation of savings, pension entitlements or property ownership;
• production activity – engagement in an economically or socially valued activity;.
• political activity – engagement in some collective effort to improve or protect the immediateor wider social and physical environment; and
• social activity – engagement in significant social interaction with family or friends andidentifying with a cultural group or community.
Scharf et al. (2002) have emphasised the spatial dimension to social exclusion, drawing on Perri 6’s(1997) view that: ‘[Social exclusion] is a useful term in societies in which there is a growingpolarisation of access and opportunity, so that often small areas – a housing estate, an inner orouter urban area – are effectively cut off from life around them’. This idea is further developed byMadanipour et al. (1998) who refer to the multi-dimensionality of social exclusion and its impacton particular types of location. They suggest that:
‘Social exclusion is defined as a multi-dimensional process, in which various forms of exclusion arecombined: participation in decision making and political processes, access to employment andmaterial resources, and integration into common cultural processes. When combined, they createacute forms of exclusion that find a spatial manifestation in particular neighbourhoods.’ (p. 22)
Applying the concept of social exclusion to older peopleThere are at least three difficulties associated with debates linking social exclusion to the range ofsituations faced by older people. These are also reflected in attempts to operationalise the conceptin research.
The impact of government policy on social exclusion among older people
10
The first difficulty concerns the centrality of labour market participation as an indicator of socialinclusion (Levitas, 1998). The focus of exclusion debates on work and employment leaves unclearthe position of older people who have permanently withdrawn from their occupational roles. Forexample, in their production domain of exclusion, Burchardt et al. (1999) judge as ‘included’ and‘engaged in a socially valued activity’ those who have reached state retirement age and are retired.This runs counter to research in social gerontology that highlights the exclusionary impact ofretirement on many older people (Phillipson, 1998).
A second difficulty arises from an emphasis in exclusion debates on the dynamic nature of socialexclusion (Byrne, 1999). Household panel studies show how people move in and out ofpoverty/exclusion as their circumstances change (Burchardt, 2000; Leisering and Walker, 1998).The evidence from such studies leads to the conclusion that, as Perri 6 (1997) asserts, ‘... mostpeople get out of poverty’. This gives rise to the impression that exclusion boundaries areessentially fluid rather than rigid. But older people’s situation is likely to be different. For thoseprone to exclusion, the experience may be more permanent than would be the case for othergroups. Thus, while exclusion from political activity or social interaction might represent anepisodic characteristic of younger people’s lives, older people may face additional difficulties inseeking to escape the enduring impact of such situations. Equally, older people who lack adequatematerial resources are unlikely to be able to ‘get out of poverty’ without a lot of financial statesupport.
A third problem concerns the neighbourhood dimension of exclusion, and its impact on olderpeople’s sense of identity (Scharf et al, 2002). For many reasons, the local residential environmentmay represent a much more important aspect of exclusion for older people than for other agegroups. On the one hand, older people tend to spend more time than younger people in theirimmediate neighbourhood. On the other, many older people have spent much of their lives in aparticular neighbourhood, deriving a strong sense of emotional investment both in their home andsurrounding community (Phillipson et al., 2000).
Against this background, and building on a review of different approaches to measuring socialexclusion, Scharf and Smith (2004) suggest that older people may experience, in one or more ofthe following forms exclusion from:
• material resources;
• social relations;
• civic activities;
• basic services;
• neighbourhood exclusion.
From this examination of issues concerning the application of the concept, we move to aconsideration of experiences of exclusion and the range of policies designed to tackle the problem.
Are some individuals/groups of older people more at risk of exclusionthan others?A common theme from research is that groups of older people will be affected by social exclusionin different ways. The following examples are illustrative but are examined in more detail in theliterature review:
Introduction and conceptual framework
11
• Those affected by cumulative (life course) disadvantage and persistent poverty, for example,women without occupational pensions; some older people from ethnic minority groups;homeless older people.
• Those affected by contracting social networks, for example older people experiencingloneliness and intense social isolation; older people without informal carers; single personhouseholds.
• Those affected by area disadvantage, for example, older people residing in inner citycommunities subject to economic and social decline; older people living in remote ruralcommunities characterised by a loss of services and amenities.
• Those marginalised through physical and mental ill-health, for example, the frail elderly withmultiple chronic conditions.
• Those affected by the operation of ageist beliefs and practices, for example, older peopleseeking employment or access to particular services.
• Those cut off from new technologies, for example, older people without access to the internet.
• Those who experience difficulty in exercising their civic rights, for example, older people notregistered to vote; older people who find contact with legal and advice services problematic.
What are the causes of social exclusion?The next issue then becomes: what are the mechanisms/drivers that might result in older peoplenot achieving one or more of the ‘wants’ or ‘life chances’ outlined in the previous section? In thecase of older people we are suggesting that the conditions that might cause exclusion can begrouped under four headings: age-related characteristics; cumulative disadvantage; communitycharacteristics, and age-based discrimination:
• Age-related characteristics refer to the way in which older people are disproportionatelyaffected by certain kind of losses or restrictions relating to income, health or reduced socialties. Such changes might take place across all points of the life course but they are likely tofeature more prominently in later life given retirement associated income changes, the impactof chronic disabling conditions, and increased needs among people adjusting to living alone.
• Cumulative disadvantage refers to the fact that birth cohorts may become more unequalover time. For example, limited educational and work opportunities at early points in the lifecourse may in the long-term lead to reduced income in old age or limited awareness abouthow to access the full range of social and health services.
• Community characteristics highlight how older people, who may have strong attachmentsto their locality, may also be vulnerable to changes associated with population turnover,economic decline, and rising levels of crime and insecurity within neighbourhoods.
• Age-based discrimination refers to the impact of ageism within economic and socialpolicies that contributes to various forms of social exclusion in old age. The debate aroundageism has challenged the link with age as a form of dependency. It emphasises insteadvarious different forms of positive engagement that can be maintained throughout the latterhalf of the life course.
The impact of government policy on social exclusion among older people
12
Methodology of the ReviewGiven the broad conceptualisation of social exclusion that this review looks at, the research groupwas interested in generating a comprehensive list of policies and initiatives relating to eachexclusion driver. To an initial list of policies and initiatives supplied by the Social Exclusion Unit, thegroup added further policies that reflected different dimensions of exclusion affecting older people.A final list of policies to review was subsequently agreed with the Social Exclusion Unit. Thisincluded both targeted schemes (for example, the Minimum Income Guarantee) and mainstreampolicies (Housing Benefit).
Various techniques were used to find evidence to include in the review. In particular, electronicsearch techniques were used to identify relevant materials. Concerning academic analyses, thisentailed systematic use of a range of electronic databases, including EBSCO, ISI Web of Knowledge,BIDS [Ingenta], ScienceDirect, Cambridge Scientific Abstract Internet Database, PsycINFO, FirstSearch and Swetswise. A key source on ageing is the Centre for Policy on Ageing’s AgeInfodatabase. Electronic search engines, in particular Google, were used to find other sources ofevidence, including that generated by central and local government departments and a range ofvoluntary organisations. The research team also compiled a list of relevant research centres andthink tanks, and used this information to explore the organisations’ websites. A separate search ofrelevant government department websites was also done.
The search strategy was limited to evidence relating to the period 1997 to 2003. It sought toidentify a general literature on the theme of social exclusion among older people, in addition to anarrower literature addressing specific policies. Such a search strategy yielded many documents.The list included many sources that were later judged irrelevant to the review’s needs. Ultimately,the research group generated an interim list of some 215 sources to be included. Each of thesesources was then explicitly linked to a particular policy area or initiative relating to the review’stheme. While preparing the review, more material was generated to inform the review. Thisencompassed a range of government documents and official statistics, as well as examples of localschemes that related to the policy area being examined. Such an approach was necessitated by thelack of data relating to some policies and initiatives.
The review is based largely on academic analyses of relevant policy areas. Where appropriate,priority has been given to highlighting findings reported by independent, academic commentatorsin peer-reviewed publications. A lot of evidence arises from official publications, commissioned bygovernment departments but undertaken by independent researchers. Material based on theanalysis of voluntary bodies and/or special interest groups, is included where there is an absence ofmore robust alternative sources or where the argument adds significantly to the academic andpolicy debate.
Introduction and conceptual framework
13
CHAPTER 2: Review of policiesA wide range of policies could reasonably be viewed as attempting to tackle social exclusion in oneform or another. These range from income support measures, such as the Social Fund, AttendanceAllowance and Housing Benefit, to support for Carers, free TV licences, and crime prevention work.Two principles guided the selection of policies to be studied for the review: first, adequacy ofresearch data; and, second, relevance to the social exclusion debate.
On the first of these, the final selection of policies reflected a prior sifting of the available researchdata, with a focus on those policies that had received some form of evaluation. In some cases,important policies are the subject of ongoing evaluation, for example the National ServiceFramework for Older People, Intermediate Care. In others, full evaluation has yet to becommissioned, for example Better Government for Older People. In some cases there wasinsufficient data to draw safe conclusions about the impact of a policy on older people, at least inthe social exclusion arena, for example Healthy Living Centres.
Second, our priority was to find a range of policies which could reasonably be linked to the socialexclusion debate, and which had been tested with sufficient rigour to allow some conclusions tobe drawn.
Having sifted through the research, using the methodology identified earlier, 19 policy areas wereidentified as fitting the above criteria:
Policies relating to income (age/cumulative disadvantage):• Minimum Income Guarantee;
• Housing Benefit;
• Council Tax Benefit;
• Attendance Allowance and Disability Living Allowance (including Carer’s Allowance);
• Social Fund (including Winter Fuel Payments and Cold Weather Payments);
• Direct Payment and Universal Banking Services;
• Warm Front.
Health and social care policies (age/cumulative disadvantage/age-based discrimination):• Community Care policies;
• Health Action Zones;
• NHS Direct;
• Care Direct.
Urban and neighbourhood renewal policies (community characteristics)• Neighbourhood Renewal Fund;
• New Deal for Communities;
14
• Community Empowerment Fund;
• Home Improvement Agencies.
Policies on crime (community characteristics):• Reducing Burglary Initiative;
• Neighbourhood Wardens.
• Locks for Pensioners;
• Distraction Burglary Task Force.
Findings for each of these policies will now be reviewed with a provisional conclusion dealing withissues relating to the overall impact and inter-relationship between policies.
2:1 Policies relating to incomeIntroductionThis section reviews evidence on policies that seek to maintain older people’s incomes. The focus ison identifying the impact on older people of the following policies (selected on the basis of theirimportance to those who are potentially vulnerable to poverty and social exclusion):
• Minimum Income Guarantee (Pension Credit);
• Housing Benefit;
• Council Tax Benefit;
• Attendance Allowance and Disability Living Allowance (including Carer’s Allowance); and
• Social Fund (including Winter Fuel Payments and Cold Weather Payments).
The analysis undertaken in this section also includes two further policy areas that are directlyrelated to income:
• Direct Payment and Universal Banking Services (addressed here in relation to debates about‘financial exclusion’); and
• Warm Front (which addresses the income-related theme of ‘fuel poverty’).
At the heart of attempts to address social exclusion through age-related changes is a concern withpensioner poverty. The British welfare state has long recognised the particular income maintenanceneeds of older people. The state provides a wide range of benefits that seek to cushion the loss ofincome associated with no longer having a job and the consumption of savings in retirement.According to the most recent data, some 10.5 million people over state pension age claimed atleast one of the major state benefits in May 2003. This represented 100% of the pensionerpopulation (Department for Work and Pensions, 2003a: 7). The state seeks to encourage people tosave for their retirement throughout their working lives. It does so by requiring individuals tocontribute to different types of pension scheme, and by supporting other types of savings activity.
Review of policies
15
Income maintenance programmes for older people recognise a key difference between the relativesituations of older and younger people on low incomes. While many people of working age mayexperience poverty at some stage, the chances of escaping it are improved by having a job. Formost older people, the opportunity to escape poverty is limited by lack of access to employment.As a result, a key means of avoiding poverty in old age is by preventive strategies, for example, bymaking saving compulsory for those of working age. Another way is by policies that seek tosupplement pensioners’ incomes (for those currently retired and on low incomes).
The 1980s were associated with a significant widening of income inequality in the UK (Hills, 1998).During the 1990s inequalities in income tended to fluctuate, and this pattern has continuedthrough to the first years of the new century (Department for Work and Pensions, 2003n Lakin,2003: 11). This general picture also applied to older people, where during the 1980s, incomevaried greatly between different groups of pensioners (Hancock and Weir, 1994; Falkingham,1998).
Key differences have emerged between older people who have an occupational pension and thosereliant solely on state benefits. While the average real incomes from occupational pensions rose byan estimated 152% between 1979 and 1996-97, benefit incomes increased by just 39% duringthis period (House of Commons, 2003a: 19). A significant factor in the growing divide betweenthese groups was the diminishing value of the State Retirement Pension in relation to risingearnings. This gap followed the 1980 change in rules for the up-rating of the retirement pension.
A major impact of these growing income inequalities was the rising proportion of pensionersexperiencing relative poverty through the 1980s and early 1990s. The scale of the increase isreflected in the analysis of pensioner incomes undertaken by the Institute for Fiscal Studies: ‘Overthe second half of the 1980s … relative pensioner poverty – measured by the proportion ofpensioners on incomes below 60% median AHC income – more than tripled, from around 13% in1984 to about 41% in 1989. The rate then fell back sharply again over the early 1990s to about26% in 1993–94’ (Goodman et al. 2003: 22).
Tackling social exclusion experienced by older people arising from low incomes is the focus of arange of policies. In this review, attention examines those income maintenance policies that arelikely to be of greatest significance to older people with low incomes. This reflects the emphasis ofgovernment policy on targeting financial support on those pensioners in greatest need. The keypolicy innovation for the period under review is the Minimum Income Guarantee (subsumed bythe Pension Credit scheme in October 2003). In addition, the review assesses the impact of the keymeans-tested benefits (Housing Benefit, Council Tax Benefit and the Social Fund) along with theuniversal benefits (Attendance Allowance and Disability Living Allowance) in addressing socialexclusion of older people. The broader, income-related issues of financial exclusion and fuelpoverty are addressed through an examination of, respectively, the Direct Payment/UniversalBanking Services scheme and Warm Front.
A consistent theme of this section of the review relates to take-up of benefits by older people.Some of the more general issues involved in debates about take-up of means-tested benefits areaddressed in the discussion on the Minimum Income Guarantee. Where more specific evidencerelating to take-up of particular benefits exists, this is addressed in the review’s appropriate sub-section.
The impact of government policy on social exclusion among older people
16
Minimum Income GuaranteeDescription of policy‘In 1997, we recognised that there was much to reform in the field of pensions. But by their verynature, this is a long-term process. Our first priority was to address the low incomes among currentpensioners. That is why we put in place Minimum Income Guarantee.’ (Department for Work andPensions, 2002a: 68)
Together with the State Retirement Pension, for the period under review, the Minimum IncomeGuarantee (MIG) represented a major plank of Government policy. That policy aimed to tackle thepoverty faced by current cohorts of older people. Introduced in April 1999, as a re-branding ofIncome Support for pensioners, the scheme was subsumed within the new Pension Credit systemin October 2003. [It is beyond the scope of this review to assess the impact of this relatively newmeasure].
Scope of Minimum Income GuaranteeMinimum Income Guarantee was a means-tested benefit. Paid through Income Support, it wasdesigned to provide extra financial assistance to help meet the living costs of people aged 60 andover who are living on low incomes. Entitlement could also be linked to receipt of a range of otherstate benefits, with Housing Benefit and Council Tax Benefit being of most relevance to pensioners(see below). The budget allocated to the Minimum Income Guarantee increased by more than therate of inflation since its introduction, with upgrading subsequently linked to rises in averageearnings. Since its launch in April 1999, real-terms spending on the Minimum Income Guarantee(at 2004-2005 prices) grew from £4,206 million in 1999-2000 to £4,798 million in 2002-2003(Department for Work and Pensions data).1
When the Minimum Income Guarantee was first introduced, its value was set at a rate somewhathigher than the earlier levels of Income Support. After 1999, the Minimum Income Guarantee’svalue was increased each year by more than the related rise in State Retirement Pension and bymore than the inflation rate. The biggest boost occurred in 2001, with significant up-rating andthe equalisation of rates across age-bands. For pensioners under 75, this meant an increase from£78.45 to £92.15 each week for a single person, and from £121.95 to £140.55 for a couple. Thesteady increase in the level of the Minimum Income Guarantee since 1999, especially from 2001onwards, had the effect of significantly increasing the number of pensioners who were entitled toclaim the benefit. In 1999-2000, 1.62 million pensioner households received the Minimum IncomeGuarantee. This number increased to 1.73 million in 2001-2002. The most recent data show that1.76 million pensioner households received the Minimum Income Guarantee in 2002-2003.2
From 2003-2004, the benefit sought to raise the weekly income of recipients to £102.10 for asingle pensioner and £155.80 for a pensioner couple. People facing particular needs, for examplecarers or disabled people, were potentially eligible to receive additional payments. There were alsosupplements to the Minimum Income Guarantee for older pensioners, with a maximum ratepayable to those aged 80 and over. Average weekly sums of Minimum Income Guarantee claimedby all pensioners increased from £36.80 to £39.70 between 1999-2000 and 2000-2001(Department for Work and Pensions, 2003b: 18; Table 1.8). The principal restriction applying tothose who might qualify for the Minimum Income Guarantee on low income grounds concernedapplicants’ savings. Pensioners with savings above £12,000 did not qualify for the benefit, whilethose with savings of between £6,000 and £12,000 were entitled to a reduced level of theMinimum Income Guarantee. The Pension Credit system, introduced from October 2003, seeks toprovide greater financial rewards to savers.
Review of policies
17
1 Details available from: http://www.dwp.gov.uk/asd/asd4/medium_term.asp
2 Details available from: http://www.dwp.gov.uk/asd/asd1/is/is_quarterly_nov03.asp
Research on Minimum Income GuaranteeThe Minimum Income Guarantee has not had an independent evaluation. An evaluation of itstelephone claim line (Bunt et al., 2001) is of some relevance, as is an earlier evaluation of IncomeSupport Pilots designed to identify pensioners entitled to Income Support but not claiming thebenefit (Croden et al., 1999). Despite the lack of a full evaluation of the Minimum IncomeGuarantee, there is much statistical and research evidence relating to aspects of the policy that canbe used to judge the Minimum Income Guarantee’s effectiveness in addressing pensioner poverty.A particular focus has been on benefit take-up and reasons for non-take-up by so-called ‘entitlednon-recipients’. The evidence ranges from official government reports to independent academicanalyses and includes useful contributions from voluntary sector organisations.
Evaluating the success of the Minimum Income GuaranteeIn the absence of a formal evaluation of the policy, to some extent the success of the MinimumIncome Guarantee can be judged from the benefit’s take-up rates, and the extent to which it hascontributed to a reduction in poverty among older people. Pensioner poverty trends are addressedat the end of this section. In reviewing the evidence on the Minimum Income Guarantee, it is alsoworth emphasising that many of the issues raised about the take-up of this particular benefit are ofgeneral relevance across the range of income-related policies.
Caseload take-up data show that 1.52 million pensioner ‘families’ claimed the Minimum IncomeGuarantee in 2001-2002. The overwhelming majority of claimants (960,000) were single femalepensioners. Pensioner couples and single male pensioners accounted for 280,000 and 270,000claims respectively. Benefit take-up ranged from 63% to 72% of all entitled pensioners. Between67% and 75% of single female pensioners claimed the Minimum Income Guarantee, comparedwith a range of 52% to 62% for pensioner couples (Department for Work and Pensions, 2004a: 18;Table 1.7). Take-up rates tend to be higher for younger pensioners, and decline steadily with age(Pudney et al., 2002: 9). The evidence points to a fall in take-up between 2000-2001 and 2001-2002, with pensioner couples even less likely to claim their benefit entitlement (Department forWork and Pensions, 2003b: 18; Table 1.7). However, across all pensioner age groups, those eligiblefor the highest amounts of benefit are more likely to take-up benefits.
In 2001-2002, the latest financial year for which comparable data are available, it was estimatedthat 32% of all pensioners and 41% of single pensioners received at least one type of means-testedbenefit. Just 18% of pensioner couples received such benefits (Department for Work and Pensions,2002b: 49, Table 9). Examination of take-up rates of the most important income-related benefits,highlights different levels of acceptance of various means-tested benefits. In this respect, MinimumIncome Guarantee take-up is significantly lower than that for Housing Benefit, but somewhathigher than Council Tax Benefit take-up. While between 63% and 72% of pensioners entitled tothe Minimum Income Guarantee claimed the benefit in 2000-2001, the corresponding range forHousing Benefit was between 83% and 90%. Council Tax Benefit was claimed by between 57%and 63% of eligible pensioners (Department for Work and Pensions, 2004a).
These figures can be turned around to indicate the degree of non Minimum Income Guaranteetake-up. In this respect, between 22% and 36% of pensioners failed to claim their MinimumIncome Guarantee entitlement in 1999-2000. In 2000-2001, this proportion narrowed to between24% and 32%, but increased in 2001-2002 to between 28% and 37% (Department for Work andPensions, 2004a: 18; Table 1.7). Pensioners appear to be less likely than non-pensioners to claimmeans-tested benefits (National Audit Office, 2002a: 16).
There is a lot of literature on reasons for the non-take-up of means-tested benefits (Citizens Advice,2003; Costigan et al., 1999; Cowell, 1986; Fry and Stark, 1987, 1993; National Audit Office,2002a; Pudney et al., 2002). In its report on pensioner take-up of benefit entitlements, theNational Audit Office (2002a) identifies barriers at two levels. These concern, first, the structure
The impact of government policy on social exclusion among older people
18
and administration of the benefits system and, second, individuals’ behaviour on benefits and theclaiming process. On the benefits system, the National Audit Office (2002a) cites the followingbarriers to take-up for pensioners:
• The complexity of the benefits system as a whole is further related to confusion over thenaming of particular benefits. An example is the shift from Income Support to the MinimumIncome Guarantee. Other confusing issues concern the different rules on capital limits fordifferent benefits, the need for pensioners to supply similar information to different bodieswhen seeking to increase their incomes, the lack of public understanding of how receipt ofone benefit (such as the Minimum Income Guarantee) can lead to entitlement to otherbenefits, and a reluctance to claim unless people were sure that the claim would lead toreceipt of benefits.
• Means-testing. Means-tested benefits have traditionally had lower take-up than universal orcontributory benefits.
• Leaving the initiative to the pensioner. The benefits system is administered in such away that requires pensioners to take the initiative to claim their entitlement. Many olderpeople only become aware of their entitlement following a ‘life-changing event’, such asillness or disability, or after a bereavement.
• Unresponsive or inaccessible channels of communication. Many older people appearreluctant to use the telephone to pursue a benefit claim. Reasons for this reluctance includethe dislike of disclosing personal information over the phone, and hearing-difficulties. There isalso evidence that some older people dislike visiting Benefits Agency offices to make a claim.They give transport/mobility problems as a cause, or express concern about the physicalenvironment of the local Benefit Agency office (Bunt et al., 2001).3
• Access to information and advice. Older people may find it difficult to access relevantinformation for a potential benefit claim. In this respect, the National Audit Office (2002a)notes that ‘it is among the most dependent older people, with the lowest income and little orno savings, that obtaining benefit information is perceived as most difficult’ (p. 24).
At the level of the individual, the National Audit Office (2002a) study reports five common barriersto benefit take-up:
• Ignorance of, and misconceptions about, the benefits available. Many older peoplelack knowledge about the benefits system, or even about the benefits that they currentlyreceive. This leads to a series of potential misunderstandings in relation to individuals’perceptions of their entitlement to benefits, and the consequences of claiming benefits.
• Difficulty completing forms.
• Fear of stigma and humiliation. This is judged to be particularly prevalent among theoldest age-cohorts, and applies especially to means-tested benefits such as the MinimumIncome Guarantee rather than to universal benefits, such as free television licences for theover-75s or the Winter Fuel Payment. A survey of Citizens Advice Bureaux (Citizens Advice,2003) suggests ‘old-fashioned stigma is a huge barrier for a generation brought up to copeand take responsibility for themselves and their families’ (p. 4).
Review of policies
19
3 The Pension Service, established in April 2002, has since assumed the role previously fulfilled by the Benefits Agency indelivering pensioner related benefits and services. It is too soon to evaluate older people’s views about these newdelivery arrangements.
• Fear of losing independence. For some older people, receipt of means-tested benefits maybe perceived as a loss of independence, and inability to cope. This too, was found to applymore to older than younger pensioners.
• Perception that making a claim is not worth the effort. Pensioners who judge that aclaim might only lead to a slight improvement in their income are less likely to pursue theirentitlement than those who would benefit most. This finding is supported by an analysis ofFamily Resources Survey data for 1997 to 2000. Hancock et al. (2003: 10f.) show that non-take-up is higher for pensioners whose benefit entitlements are lowest.
These findings mirror those of an earlier analysis of barriers to the take-up of Income Support byolder people (Costigan et al., 1999). They are further supported by recent research evidence. Anexample is the evaluation of the Minimum Income Guarantee claim line undertaken by Bunt et al.(2001). It indicates that the most common reason cited by those pensioners who had contactedthe claim line yet subsequently failed to return a claim form was that they felt they would not beeligible for Minimum Income Guarantee. This applied to 44% of non-completed claims. A further28% of non-completions were attributed to aspects of the Minimum Income Guaranteeapplication process. Reasons were the complexity of the claim form, concern about the personalnature of some questions or the inability to locate documents required to support the application(Bunt et al, 2001: 39f.). A similar picture emerges from analysis of the 1999-2000 Northern IrelandLife and Times Survey. Nearly half of those identified as being potentially entitled to claim theMinimum Income Guarantee (47%) did not wish to pursue a claim. The most important reasonsgiven were linked to the bother of filling out forms and the disclosure of personal information.Issues linked to pride or stigma were of only secondary importance (Evason et al., 2002: 43).
Who are the entitled non-recipients of the Minimum Income Guarantee? There is relatively limitedevidence on the characteristics of non-recipients. However, the research that is available suggeststhat non-receipt is linked to characteristics such as household composition, age and gender. As forother means-tested benefits, the composition of the entitled non-recipient group broadly followsthe composition of recipients. In relation to age, a significant proportion of those who fail to claimtheir benefit entitlements are aged at least 75. In 2001-2002, 56% of all pensioner entitled non-recipients were 75 years of age or over compared with 47% of entitled recipients of MinimumIncome Guarantee. While 67% of single female pensioner entitled non-recipients were aged 75 orover, the corresponding proportions for single males or pensioner couples were 49% and 40%respectively. The same overall pattern exists among those pensioners who were entitled to and inreceipt of Minimum Income Guarantee (59%, 34% and 22% respectively) (Department for Workand Pensions, 2004a: 21). Pensioners living in rural areas and those with sensory impairments havealso been identified as being less likely to receive state benefits (National Audit Office, 2002a: 26). Itis likely that those living in deprived urban areas, where poverty rates are above the nationalaverage, are also disproportionately affected by low take-up rates (Scharf et al., 2002).
The fourth Opportunity for All report pays particular attention to the lack of take-up by olderpeople from ethnic minority groups, suggesting the need for further research (Department forWork and Pensions, 2002a: 19).4 The many barriers faced by minority group potential benefitclaimants are also highlighted by the National Audit Office (2002a: 28). In addition to the barriersto take-up that apply to older people in general, those belonging to ethnic minority groups mayexperience problems. These include language and literacy problems, limitations in interpretationservices, difficulty in providing necessary documentary evidence to support a claim, and lack ofcontact with the formal benefit system and a reliance on informal or community-based services.The same issues were highlighted in a recent analysis of barriers to benefit take-up by older peoplebelonging to a range of black and ethnic minority groups, along with a concern about thepotential impact of take-up on residency (Barnard and Pettigrew, 2003: 32).
The impact of government policy on social exclusion among older people
20
4 A fifth Opportunity for All report was published in September 2003. However, the latest report does not address theissue of benefit take-up.
Despite long-recognised problems with take-up of means-tested benefits, current policy persists inpursuing a strategy which targets those in greatest need. Some researchers suggest that a shift inemphasis from means-tested to universal benefits would be a more effective way of securingpensioners’ living standards. In this respect, Evason et al. (2002) note: ‘It might be argued that,after so much effort to maximise take-up rates generally, it would be more sensible to abandonwhat has turned into social policy’s equivalent of the search for the Holy Grail. Government cannotdo this, however, because take-up has been pinpointed (..) as the Achilles heel of current pensionspolicy. In consequence, unprecedented efforts have been made since 1999 to get pensioners toclaim the Minimum Income Guarantee’ (p. 38).
A number of steps have been taken to simplify the process of claiming the Minimum IncomeGuarantee, and thereby increase benefit take-up.
This has included:
• A reduction in the length of the claim form from 40 to ten pages, and a simplification of thequestions.
• The introduction in May 2000 of a telephone claim line for the Minimum Income Guarantee.This occurred in response to research done on behalf of the then Department for SocialSecurity which indicated a dislike of visiting Benefits Agency offices among pensioners(Costigan et al., 1999: 56f.). The evaluation of the Minimum Income Guarantee claim line hasproved inconclusive, but around two-thirds of callers agreed that use of the telephone was lessembarrassing than a personal visit to a Benefits Agency office (Bunt et al., 2001).
• A national television advertising campaign in 2000 helped significantly to raise awareness ofthe Minimum Income Guarantee among pensioners from 42% to 76% (National Audit Office,2002a: 37).
• A series of measures to identify potential claimants. Those claiming State Retirement Pensionby phone are now asked questions about their potential entitlement to the Minimum IncomeGuarantee. People who claim their State Retirement Pension by post are sent a leafletexplaining the Minimum Income Guarantee.
• Other life events now trigger the sending to potential recipients of a leaflet explaining theMinimum Income Guarantee. Such triggers include reaching age 75 or 80, or receiving otherbenefits such as Attendance Allowance or Invalid Care Allowance (Department for Work andPensions, 2002a: 69).
The National Audit Office (2002a) highlights a number of national and local initiatives that havesought to increase rates of benefit take-up by pensioners. However, these initiatives have not beensubject to systematic cost and benefit evaluation. While national take-up campaigns are likely togenerate many new claims, many of these are likely to be unsuccessful. By contrast: ‘Localoutreach work is much more resource-intensive and focused, but may be more likely to makesuccessful contact with people from hard-to-reach groups’ (National Audit Office, 2002a: 45). Thispoint is echoed by Citizens Advice (2003: 5) who identify face-to-face contact and successfultargeting as the two most important factors in benefit take-up work with older people. Althoughbased on relatively limited data, Citizens Advice suggest that some of their take-up campaigns haveidentified an average benefit gain of £85 per client for every £1 invested in the campaign (CitizensAdvice, 2002: 5).5
Review of policies
21
5 The report fails to indicate the time period to which the benefit gain applies (Citizens Advice, 2002).
Conclusions: impacts of the Minimum Income Guarantee on the socialexclusion of older peopleThe stabilisation or modest reduction in relative poverty among pensioners since 1999-2000 –depending on which poverty measure is used – has coincided with the introduction of theMinimum Income Guarantee. When viewed alongside existing means-tested benefits, it is possibleto argue that the Minimum Income Guarantee has made a significant contribution to thereduction (or at least stabilisation) of pensioner poverty (discussed in more detail in the summaryto this section). As such, it represents an important device for promoting the social inclusion ofolder people.
In their review of social exclusion indicators, Palmer et al. (2002) point to the potential of furtherreductions in the numbers of pensioners affected by poverty, commenting that: ‘although theGovernment’s Minimum Income Guarantee (MIG) for pensioners was introduced in April 1999, thebig rises in the amounts actually came into effect in April 2001 and are thus not included in the2000-01 figures. While the 2001 increases are unlikely to lift pensioners above the low-incomethreshold, it will move them much closer to it’ (p. 76).
Take-up of the new Pension Credit system is likely to continue to be an issue. This point is forcefullymade by Arber and Ginn (2004) who comment: ‘It remains to be seen what the impact of therecently introduced Pension Credit scheme (which subsumes the MIG scheme) will be onpensioner incomes, although the official target of 73% take-up suggests that many older peoplewill not receive the help they are entitled to’ (Arber and Ginn, 2004:9). In this respect, inDecember 2003, 2.53 million pensioners – or just over half of the 4.9 million people estimated tobe eligible – were already receiving Pension Credit (Department for Work and Pensions data).
One reason why pensioner poverty continues to pose a problem is that not all those who areeligible to claim benefits pursue their claim. However, this is only part of the problem. In theiranalysis of Family Resources Survey data, Goodman et al. (2003) point to potential limitationsassociated with the improvement of benefit take-up rates. Taking a poverty measure based on 60%of median income after housing costs, full take-up of benefit entitlements would ‘only’ reduce theoverall number of pensioners classified as poor by between 100,000 and 200,000 people (or 1 to 2percentage points). The advantages of increasing take-up to 100% are more pronounced inrelation to a poverty measure at the 50% of median income level. It also helps to reduce poverty‘gaps’. Full Minimum Income Guarantee take-up by all entitled pensioners would reduce the‘depth’ of poverty by just over two percentage points (Goodman et al., 2003: 35).
Housing BenefitDescription of policyHousing Benefit (HB) is designed to contribute towards meeting the housing costs of people withlow incomes who live in private or social rented accommodation. The major aim of HousingBenefit is ‘to support those who would not otherwise be able to afford an acceptable standard ofhousing’ (Hills, 2001: 1888). The benefit may represent the full amount or a part of a claimant’srental costs, and is available to people of all ages. Along with other means-tested benefits, such asIncome Support (MIG) and Council Tax Benefit, Housing Benefit represents an important source ofincome for many older people. The Housing Benefit scheme is administered by local authorities onbehalf of the Department for Work and Pensions.
The impact of government policy on social exclusion among older people
22
Scope of Housing BenefitHousing Benefit is calculated in a similar way to Council Tax Benefit. Eligibility is based on acalculation that links individuals’ financial and household circumstances to their rental costs.Applicants who have more than £16,000 in savings are not entitled to receive Housing Benefit,while those with savings of between £6,000 and £16,000 may receive a reduced benefit payment.
In 2001-2002, expenditure on Housing Benefit was £11.5 billion (Department for Work andPensions, 2003e). Since 1996, there has been a steady decrease in the overall numbers of peoplereceiving Housing Benefit. In 1996, there were around 4.8 million Housing Benefit recipients. ByMay 2003, the latest date for which comparable data are available, the number of recipients haddecreased to 3.8 million (Department for Work and Pensions, 2003e, 2003f).
As with other means-tested benefits, Housing Benefit has been subject to reform in recent years.After the 1997 general election, the Housing Benefit scheme was identified as a source of potentialsavings on benefits. A key reason was that the programme was perceived to be vulnerable to fraud(Kemp, 2000: 268). A series of deficiencies in the existing Housing Benefit system weresubsequently highlighted in the welfare reform Green Paper of 1998 (Department of SocialSecurity, 1998), leading to a range of changes in benefit rules and regulations. However, thegovernment’s original aim of radically reorganising Housing Benefit has tended to give way to amore modest programme of benefit reform (Department for Work and Pensions, 2003g: 36;Kemp, 2000: 271).
Research on Housing BenefitThere is limited research evidence on Housing Benefit and older people. Statistical analyses ofHousing Benefit recipient data are undertaken by the Department for Work and Pensions, andthese have become more sophisticated in recent years allowing analysis by client group. TheNational Audit Office’s (2002a) study of pensioner poverty provides a useful analysis of benefittake-up issues, some of which are relevant to Housing Benefit. Hancock et al. (2003) address themultiple take-up of benefit entitlements by pensioner households. While most academic analyses ofHousing Benefit tend not to focus on the situation of older people, they provide some helpfulinformation on the operation and weaknesses of the scheme that can sometimes be applied totheir situation (for example Cowan and Marsh, 2001; Hills, 2001; Kemp, 2000).
Evaluating the success of Housing BenefitA potential indicator of Housing Benefit’s relative success is the extent to which older people takeup their benefit entitlement. In May 2002, 1.63 million of the UK’s 3.81 million Housing Benefitrecipients – or just over two-fifths – were aged 60 and over (Department for Work and Pensions,2003e: Table 3.3). In 2000-2001, 1.66 million pensioner ‘families’ received Housing Benefit in theUK. This represented a fall from the corresponding figure for 1999-2000, when 1.74 millionpensioner ‘families’ received the benefit (Department for Work and Pensions, 2003b). However,analysis by the Department for Work and Pensions suggests that ‘there was no evidence of achange in take-up among those pensioners who were entitled in both years, and little difference inthe rate of take-up between this group and those newly entitled to Housing Benefit’ (Departmentfor Work and Pensions, 2003b: 27).
Analysis of Family Resources Survey data shows that some groups of older people are more likely toreceive Housing Benefit than others. This is likely to reflect the position of such groups in theoverall income distribution. While 12% of all ‘benefit units’ were in receipt of Housing Benefit in2001-2002, this proportion increased to 25% for single male pensioners and 27% for single femalepensioners. By contrast, only 10% of pensioner couples received Housing Benefit payments(Department for Work and Pensions, 2003h: Table 3.15).
Review of policies
23
For a means-tested benefit, Housing Benefit take-up is perceived to be relatively high. Between86% and 94% of eligible pensioner recipients received payments under the Housing Benefitscheme in 2000-2001. However, for the same period, it was still estimated that between 110,000and 270,000 pensioner ‘families’ were entitled to receive Housing Benefit, but were not doing so(Department for Work and Pensions, 2003b: 27, Table 2.1). Overall, in recent years around one inten pensioners have consistently failed to claim their Housing Benefit entitlement (National AuditOffice, 2002a: 16; Hancock et al., 2003: 5).
In May 2002, the average weekly Housing Benefit paid to claimants aged 60 and over was £48.50(Department for Work and Pensions, 2003e, Table 3.7). On average, pensioner ‘families’ claimedHousing Benefit worth £42.80 a week in 2000-2001. The average weekly amount that wentunclaimed by entitled non-recipients was £25.80 (Department for Work and Pensions, 2003b: 27,Table 2.2). While older people who have most to gain from claiming Housing Benefit are mostlikely to take-up their benefit entitlement, non-take-up continues to deprive many older people of apotentially significant proportion of their income entitlement.
Closer analysis of pensioner entitled non-recipients has been undertaken by the Department forWork and Pensions. This suggests that non-recipients are disproportionately located in the bottomtwo deciles of the income distribution. Before housing costs are considered, some six out of tenpensioner entitled non-recipients had incomes in this range. After housing costs, the proportionincreases to around seven in ten (Department for Work and Pensions, 2003b: 30; Table 2.5). Non-receipt of Housing Benefit has also been shown to be closely related to low household income.Before housing costs, 54% of entitled non-recipient pensioners lived in households with below60% of median income, compared with 14% of Housing Benefit recipients. These proportionsincrease greatly once housing costs are taken into account (Department for Work and Pensions,2003b: 31, Table 2.7). This suggests that pensioners who receive Housing Benefit are significantlyless likely to be living in poor households than those who are entitled to Housing Benefit but arenot receiving the benefit.
Analysis of claimants’ experiences of delivery of Housing Benefit (and Council Tax Benefit) by localauthorities, provides useful indicators of the difficulties associated with claiming such benefits.Though not specifically focusing on older claimants, the study done by Pettigrew et al. (1999),based on 30 group discussions in ten local authorities, suggested that:
• Older people were more likely than younger applicants to require and seek help with HousingBenefit applications.
• Claimants did not consider the telephone the most useful means of contacting the localauthority. Problems concerned identifying the appropriate person to deal with the case, beingpassed from person to person, the absence of contact ‘names’ from the office, and calls beingcut off without explanation.
• When dealing with local authority staff, older claimants appeared to dislike discussing complexpersonal issues with people they felt were a lot younger than them.
• Practical steps could be taken to improve service and efficiency. These include a reduction inthe time taken to process claims, the combination of Housing Benefit and Council Tax Benefitforms, and changes to local authority offices such as the introduction of appointment systems,the provision of greater privacy, and more knowledgeable staff (Pettigrew et al., 1999).
Some of these points were echoed by Age Concern England (2000) in its submission to the Houseof Commons Social Security Committee’s inquiry into Housing Benefit (House of Commons, 2000).Based on the – albeit anecdotal – experience of their benefits advisers, Age Concern England
The impact of government policy on social exclusion among older people
24
expressed misgivings about the operation of the Housing Benefit system, noting the ‘considerablevariation in service’ between different parts of England. The organisation highlighted difficultiesexperienced by older people over the administration of Housing Benefit. These included:
• Delays in the processing of claims. Age Concern England’s benefits advisers reported thatmany people had to wait far longer than the anticipated 14 days for a claim to be processed.In some cases, claim forms were lost necessitating completion of a new application.
• Difficulty in contacting local authority benefits sections by telephone. In particular, theabsence of a named member of staff to deal with individual claims or requests for information,was regarded as a weakness of existing systems.
• The need to provide original documents to support a Housing Benefit claim can raisedifficulties for some older people. Many people are unwilling to post such documents, for fearof losing them, and are consequently obliged to attend the benefits office in person. This canprove problematic for older people with mobility problems, but also raises problems for thosedealing with the claims of people with mental health problems.
• Some local authority staff appear to deal insensitively with the needs of older people. Thisrelates to the checks and anti-fraud measures applied to control Housing Benefit misuse. Someolder people feared that their benefits might be stopped after routine visits by local authoritystaff. In this context, Cowan and Marsh (2001: 266) point to the potentially damaging effectsthat extensive anti-fraud measures can have on people’s lives. Linking receipt of welfarebenefits to fraud can potentially lead to further stigmatisation of Housing Benefit recipients(Cowan and Marsh, 2001: 266).
• The Housing Benefit system formerly required a renewal of claims every 60 weeks. AgeConcern England noted that some older people may assume that the initial claim is sufficient,and not proceed with the renewal.6
For another group of older people, the system of Housing Benefit administration might poseparticular difficulties. In a study of Housing Benefit paid to people living in a range of supportedaccommodation, including many older people living in sheltered housing, Cebulla et al. (1999)found a lot of confusion over Housing Benefit payment calculation. This confusion arose from thedifferent methods used by housing providers to determine their charges, and from the applicationof a range of methods to assess benefit entitlements by Housing Benefit administrators. Theauthors of this study concluded that: ‘Only a small minority of claims was soundly based’ (p. 5).
The weaknesses of the existing Housing Benefit system are acknowledged in the Government’slatest National Action Plan on Social Inclusion (Department for Work and Pensions, 2003g).Drawing on the experiences of claimants, Housing Benefit is identified as ‘a problem area in thebenefit system. It does not cover full rents in many places, it is not really available to owner-occupiers and it is frequently late and wrongly estimated, leading to fines, debt and stress’ (p.88).
Conclusions: impacts of Housing Benefit on the social exclusion ofolder peopleBy meeting some or all of recipients’ housing costs,, Housing Benefit provides many older peoplewith the security of an affordable home. This in itself represents an important element of socialinclusion in contemporary society. Housing Benefit represents a major source of income for lowincome older people. When viewed in the context of other means-tested benefits received, the
Review of policies
25
6 From April 2004 this particular requirement was removed to align Housing Benefit with the new Pension Credit system(Department for Work and Pensions, 2003g).
scheme can contribute well to alleviating pensioner poverty. Households Below Average Incomedata suggest that older people who receive Housing Benefit, experienced a reduced risk of lowincome when compared to older people as a whole. 22% of all pensioners lived in households withan income below 60% of median household income in 2001-2002. For those in receipt of HousingBenefit, the corresponding proportion was 10% on the before housing costs measure and 34% onthe after housing costs measure (Department for Work and Pensions, 2003d: 113, Table 6.6).There is limited evidence to allow conclusions to be drawn about the impact of Housing Benefit inreducing social exclusion experienced by particular groups of older people.
Government reforms have sought to simplify the Housing Benefit application process, with the linkto the Pension Credit system likely to increase take-up. People who contact the freephone PensionCredit application line are now asked if they are claiming Housing Benefit (and/or Council TaxBenefit). If they are not, a Housing Benefit/Council Tax Benefit claim form is posted to them alongwith their Pension Credit details. The applicant is then required to complete the claim form andreturn it to their local authority for processing.7
Older people who are not receiving their Housing Benefit entitlements are most likely to belong tothe poorest group of pensioners. However, there is evidence that some take-up strategies might bemore effective in reaching this group than others. In this respect, the submission by NewcastleUpon Tyne City Council’s Welfare Rights Service to the Institute of Revenues, Rating and Valuation’sinquiry into Council Tax Benefit and Housing Benefit explicitly focuses on benefit take-up amongolder people (Newcastle Upon Tyne, 2001). This highlights the success of active take-up strategiesin promoting benefit take-up. In particular, identification of older people who appear to be entitledbut not claiming Housing Benefit, results in a home visit to all potential claimants, unless he or shehas actively refused the service (p. 83). These findings, generated through the work of a singleorganisation and not subject to systematic scientific evaluation, at least raise the question ofwhether such schemes might succeed in other localities.
A final point relates to the scope of the Housing Benefit system. While the benefit can be seen assuccessfully meeting the needs of low income tenants, there is a wider issue over the situation oflow income owner-occupiers. Those who qualify are entitled to have necessary repair costs metthrough the Housing Benefit scheme. However, no equivalent help is available to people who owntheir homes (Hills, 2001: 1894). This is likely to increase the financial insecurity of some groups ofolder home-owners, including those who have bought homes formerly owned by local authorities,some ethnic minority groups, and older people living in areas characterised by a substantial drop inhouse prices.
Council Tax BenefitDescription of policyCouncil Tax Benefit is a means-tested benefit designed to help those on low incomes meet some orall of the amount of their Council Tax liability. Introduced in 1993, the Council Tax itself representsa key source of local government income, with the scale of Council Tax charges levied againstindividual households being largely determined by local authorities. Individuals’ liability to CouncilTax – and consequently their potential entitlement to Council Tax Benefit – varies according to thevalue of applicants’ homes.
The impact of government policy on social exclusion among older people
26
7 Information supplied by Department for Work and Pensions.
Scope of Council Tax BenefitThere are two ways of receiving Council Tax Benefit. The first is determined through eligibility toother state benefits, including Income Support (MIG). A second route is offered through theSecond Adult Rebate system. This provides for a reduced Council Tax bill for those living with aperson, other than a partner, who is on a low income. Most of the research evidence relates to thefirst of these benefit routes.
Eligibility to receive Council Tax Benefit is determined by the applicant’s income and capital. InApril 2000, the amount of income and capital that pensioners were able to receive before losingpart of their benefit entitlement was increased by more than the increase in State RetirementPension. As a result, pensioners with more than £16,000 in capital are ineligible to claim CouncilTax Benefit, while capital of between £6,000 and £16,000 results in a reduced entitlement.
Applications for Council Tax Benefit are processed by local authorities. In some areas, it is possibleto claim Council Tax Benefit on the same form as Housing Benefit, since much of the sameinformation is required to process both types of benefit. A key feature of the new Pension Creditscheme (introduced in October 2003), has been the facility for older people to claim Council TaxBenefit (and Housing Benefit) at the same time as the credit. In these cases, the Department forWork and Pensions forwards the relevant claim form(s) to applicants. On completion, applicantsare required to pass the form(s) on to their local authority for processing. People who are entitledto receive Pension Guarantee Credit have their Council Tax liability met in full by the localauthority.
A significant outcome of the change in rules concerning Council Tax Benefit applicable amounts(described above), and an increase in Council Tax bills by more than the rate of inflation in recentyears, has been an increasing number of pensioners who are eligible to receive Council Tax Benefit.Overall, some 4.6 million households received Council Tax Benefit in May 2003 – the latest year forwhich data is available. Of the 4.7 million households receiving Council Tax Benefit in 2000-2001,around half (2.36 million) were pensioner households (Department for Work and Pensions, 2003b).The overall expenditure on Council Tax Benefit represented £2.7 billion in 2001-2002 (Departmentfor Work and Pensions, 2003e).
Research on Council Tax BenefitBesides research undertaken on behalf of the Department for Work and Pensions, there is a smallnumber of studies that investigate issues relating to Council Tax Benefit and the situation of olderpeople. The work of Clark et al. (1999) for the Joseph Rowntree Foundation has recently beensupplemented by the New Policy Institute’s (2003) analysis of the impact of Council Tax on olderpeople’s income, undertaken on behalf of Help the Aged.
Evaluating the success of Council Tax BenefitThe most recent data relating to the take-up of Council Tax Benefit by older people covers theperiod 2000-2001 (Department for Work and Pensions, 2003b). In that year, 2.36 millionpensioner ‘families’ received the benefit. Many older people on low incomes are therefore relievedof all or part of their Council Tax obligation.
However, pensioner Council Tax Benefit take-up is significantly lower than for other means-testedbenefits. It is estimated that between 32% and 38% of entitled pensioners are not receiving theirCouncil Tax Benefit entitlement. This corresponds to between 1.1 million and 1.43 millionpensioner ‘families’ (Department for Work and Pensions, 2003b: 35, Table 3.1). The evidence alsopoints to a lower take-up by pensioner than non-pensioner households. While 84% of entitled non-pensioners claimed Council Tax Benefit in 2000-2001, the corresponding rate for pensioners wasjust 65% (New Policy Institute, 2003: 12).
Review of policies
27
Analysis of Family Resources Survey data highlights variations between different groups of olderpeople in relation to receipt of Council Tax Benefit. Overall, 16% of all ‘benefit units’ receivedCouncil Tax Benefit in 2001-2002. While 17% of pensioner couples received the benefit, theproportions for single pensioners were much higher. Thirty-one per cent of single male pensionersand 38% of single female pensioners received Council Tax Benefit in 2001-2002 (Department forWork and Pensions, 2003h: Table 3.15).
On average, pensioner ‘families’ claimed Council Tax Benefit worth £9.20 a week in 2000-2001.This represented an increase from £8.40 in 1999-2000. The average weekly amount that wentunclaimed by entitled non-recipients in 2000-2001 was £7.60 (Department for Work and Pensions,2003b: 35, Table 3.2). In comparison with Housing Benefit take-up data, there is less differencebetween the average weekly amounts of Council Tax Benefit that are claimed and the averageamounts that remain unclaimed. The Department for Work and Pensions analysis suggests thataround three-fifths of pensioner entitled non-recipients lived in households with incomes below60% of median household income (before housing costs). After housing costs are taken intoaccount, this proportion falls to just over half (52%) (Department for Work and Pensions, 2003b:40, Table 3.9).
It is difficult to separate an analysis of Council Tax Benefit take-up data from a broader investigationinto the Council Tax itself. In this respect, the study of the impact of Council Tax on older people’sincome undertaken by the New Policy Institute (2003: 1) is important in summarising four keyproblems with the tax:
• The tax represents a greater burden for lower income households than for higher incomehouseholds. While this affects pensioner and non-pensioner households in the same way,pensioner households are more likely to be affected by low incomes than non-pensioners.
• Council Tax has been increasing by more than the rate of inflation for the ten years since itsintroduction. Since increases in the State Retirement Pension are linked to the rate of inflation,this results in a reduction in the disposable income of many pensioner households.8
• The Council Tax represents more of a burden for pensioner than for non-pensionerhouseholds. This is true for both single pensioners and pensioner couples. Citing data from theHouseholds Below Average Income study for 2000-2001, the New Policy Institute (2003)analysis suggests that ‘among households paying the tax either in full or in part, council taxrepresented 3% of net income of all households, compared with some 5.5% for singlepensioners and 5% for pensioner couples’ (p.4). There is also some evidence to suggest thatthe Council Tax burden is greater for older pensioners than for those who have recentlyretired.
• Many pensioners are not claiming their Council Tax Benefit entitlement. This is especially sofor many older people who own their homes outright. According to the New Policy Institute(2003: 6) about one in four pensioners with net weekly incomes below £100 and about half ofthose with incomes between £100 and £150, pay the full Council Tax. While almost all thosewith net weekly incomes below £150 who live in socially rented accommodation receivedCouncil Tax Benefit, the proportion of Council Tax Benefit recipients who were home-ownersand had the same net income, was just one third (New Policy Institute, 2003: 6).
The impact of government policy on social exclusion among older people
28
8 Council Tax is taken into account in the calculation of the Retail Price Index. However, for those who spend a higherthan average proportion of their income on Council Tax and who are not in receipt of Council Tax Benefit, this will notfully compensate them for the Council Tax increase.
These points are echoed in an earlier analysis of Council Tax Benefit undertaken by researchersbased at the Institute for Fiscal Studies (IFS). In their study, Clark et al. (1999) showed that whilemost claimants of Council Tax Benefit were found in the lowest income deciles, the benefit ‘hascomparatively little effect on the burden of the poorest income decile, and that relatively fewrecipients are found there’ (Clark et al., 1999: 3). This includes many older people, with pensionersidentified as a group that is left with a higher Council Tax burden even after taking account ofbenefit payments.
Conclusions: the impacts of Council Tax Benefit on the social exclusionof older peopleThere is limited evidence on which to judge the impact of Council Tax Benefit in reducing socialexclusion among older people. Those on low incomes who claim the benefit receive an importantboost to their weekly incomes. However, relatively high rates of non-take-up of this benefitsuggests that many older people on low incomes are losing out on a potentially significantaddition to that income. In particular this applies to older owner-occupiers who may not beentitled to receive other forms of means-tested benefit.
Attendance Allowance and Disability Living AllowanceDescription of policyAttendance Allowance (AA), introduced in 1971, is a non-contributory, tax-free benefit aimed atpeople over the age of 65 who are severely disabled, physically or mentally, and require help withpersonal care. Since April 1992, people who were disabled before the age of 65 have been eligibleto receive Disability Living Allowance (DLA) instead of Attendance Allowance. Disability LivingAllowance is a non-contributory benefit available to those under the age of 65 who have care orsupervision needs or who have mobility problems. People who have been awarded Disability LivingAllowance before reaching the age of 65 continue to receive this benefit after that age. A medicalassessment may be needed before eligibility for either Attendance Allowance or Disability LivingAllowance can be established. Receipt of either benefit also qualifies older people for higher ratesof some other state benefits including MIG (now Pension Credit).
Scope of Attendance Allowance/Disability Living AllowanceAttendance Allowance claimants over the age of 65 who need help both during the day and atnight are eligible to receive a higher rate of benefit. A lower rate is available to people needinghelp either during the day or at night. The current rates of Attendance Allowance are £57.20 aweek (higher rate) and £38.30 a week (lower rate). Government expenditure on AttendanceAllowance was estimated as £3.25 billion for the period 2002-2003 (National Audit Office, 2003a:10).
Disability Living Allowance comprises two components (Counsel and Care 2003b). The first is acare component, the receipt of which is based on similar criteria to those concerning AttendanceAllowance. This component can be paid at three rates. People who need care or supervision duringthe day and night are entitled to a higher rate of £57.20. A middle rate of £38.30 is paid to thoseneeding such help during either the day or the night. The lower rate of £15.15 is paid to peoplewho are unable to cook a hot main meal or who need help for at least an hour a day.
The second component of Disability Living Allowance relates to an individual’s mobility needs. Thiselement is paid at two rates. The higher rate of £39.95 is paid to people whose mobility is severelyrestricted, for example by a physical disability, or who are both deaf and blind. The lower ratemobility component is paid at a rate of £15.15 to people who are able to walk, but are unable to
Review of policies
29
walk outside in an unfamiliar area without guidance or supervision. Government expenditure onDisability Living Allowance – for claimants of all ages – was estimated to be £7.05 billion in 2002-2003 (National Audit Office, 2003a: 10).
Disability Living Allowance and Attendance Allowance can be awarded for either a fixed period oftime or for an indefinite period. Those qualifying for both the care and mobility components ofDisability Living Allowance will receive these for the same time period. People over the age of 65are ineligible to apply for the mobility component of Disability Living Allowance. However, thosewho have already received such payments before reaching that age can continue to receive thisform of the benefit until the end of the fixed period, or indefinitely.
People who qualify to receive the higher rate mobility component of Disability Living Allowanceare entitled to additional forms of support. This can include help to purchase a car or an electricwheelchair under the Motability Scheme. Also, people who provide care for 35 hours or more eachweek to someone receiving Attendance Allowance or one of the two higher rates of DisabilityLiving Allowance care component, may be entitled to receive Carer’s Allowance (previously calledInvalid Care Allowance). Although a restriction limiting receipt of Carer’s Allowance (CA) to peopleunder the age of 65 was lifted in October 2002, the numbers of older people claiming this benefitat any one time are relatively small. In August 2003, there were estimated to be 38,000 peopleaged 60 and over receiving Carer’s Allowance, with an average benefit of £26.52 a week paid topeople aged 65 and over (Department for Work and Pensions, 2003l: Table CA2). The relativelylow number of Carer’s Allowance claimants is partly due to overlapping benefit rules. They meanthat someone who already receives £43.15 a week or more from other social security benefits(including the state retirement pension) is ineligible to receive Carer’s Allowance (Counsel and Care2003c). However, Carer’s Allowance recipients who also receive means-tested benefits, such asPension Credit, Housing Benefit or Council Tax Benefit, are entitled to an additional Carer Premiumof £25.10. The key beneficiaries of the 2002 rule change on Carer’s Allowance, appear to be oldercarers. These are mainly women, who fail to qualify for a basic state pension or whose pensionentitlement falls below the £43.15 sum.
Research on Attendance Allowance/Disability Living AllowanceGiven the potential importance of disability benefits such as Attendance Allowance and DisabilityLiving Allowance in alleviating poverty (and social exclusion) among older people, it is perhapssurprising that there is relatively little independent academic research relating to these particularbenefits (Evason et al., 2002: 41). However, there are several robust studies that have been doneby or on behalf of official bodies such as the National Audit Office and the Department for Workand Pensions. While the analysis undertaken here relies primarily on such studies, whereappropriate, use is also made of a range of statistical data collected through nationallyrepresentative surveys. Several studies have addressed the role of primary care professionals inrelation to encouraging higher take-up of disability benefits. These are reviewed by Greasley andSmall (2002).
Evaluating the success of Attendance Allowance/Disability LivingAllowanceAnalysis of Family Resources Survey data show that about a fifth of pensioner households receivedat least one type of disability benefit in 2001-2002 (Department for Work and Pensions, 2002b).9
This proportion has increased greatly in recent decades. In 1979, the proportion of pensionerhouseholds receiving such benefits was around 4% (Department of Social Security, 2000: 48).
The impact of government policy on social exclusion among older people
30
9 While DLA and AA account for the greatest proportion of disability benefits claimed by older people, this figure alsoincludes other benefits such as War Disablement Pension, Invalid Care Allowance, Industrial Disablement Pension,Severe Disablement Allowance, Disabled Person’s Tax Credit and Statutory Sick Pay.
Pensioner couples are more likely to receive disability benefits than single pensioners, and receipt isslightly more common among pensioners who had been retired longer (Department for Work andPensions, 2002b: 51; Table 10). The average amount of disability benefits awarded to pensionerswas £53 a week in 2001-2. While such benefits increased by on average 30% between 1979 and1996-7, ‘estimates for more recent years do not suggest any major changes in the second half ofthe 1990s’ (Department for Work and Pensions, 2002b: 50).
In August 2003, when the most recent data were published, there were an estimated 1.36 millionrecipients of Attendance Allowance in the UK. Of this number 680,000 people were receiving thehigher rate and 679,000 the lower rate of benefit. Given the nature of the benefit, the likelihoodthat a person will receive Attendance Allowance, increases significantly with age. While just under46,000 people aged 65 to 69 years received Attendance Allowance in August 2003, thecorresponding number of those aged 80 to 84 years was 382,000 (Department for Work andPensions, 2003j; Tables AA1 and AA2). According to the most recent Family Resources Survey, 5%of people receiving benefit aged 65 to 74 years, 18% of those aged 75 to 84 years and 28% ofthose aged 85 and over received Attendance Allowance in 2001-2002 (Department for Work andPensions, 2003h: Table 3.18). The overwhelming majority of older people receive AttendanceAllowance and at least one other state benefit. In most cases this is the basic state pension, or thebasic state pension with MIG (Department for Work and Pensions, 2003a: 22; Table 3.3).
In August 2003, there were some 2.53 million recipients of Disability Living Allowance of all ages inthe UK. Of this total, 570,000 received the mobility component alone, 336,000 received only thecare component, and the remaining 1.6 million claimants received both mobility and carecomponents. About 930,000 recipients of Disability Living Allowance (37% of all recipients) wereaged 60 or over (Department for Work and Pensions, 2003k: Tables DLA1 and DLA2). Given theeligibility criteria for receipt of the benefit, it is not surprising that data from the Family ResourcesSurvey show the proportion of older people receiving Disability Living Allowance to be decliningwith age. While the care component of the benefit is received by 10% of benefit recipients aged60 to 64 years in 2001-2002, the respective proportion was 7% of those aged 65 to 69 years, andjust 2% of those aged 70 and over. A similar pattern exists for the mobility component of DisabilityLiving Allowance. It is received by 12% of benefit recipients headed by a person aged 60 to 64years, and just 1% of those aged 85 and over (Department for Work and Pensions, 2003h: Table3.18). As for Attendance Allowance, most recipients of Disability Living Allowance also receiveother state benefits, in particular the basic state pension and the Minimum Income Guarantee(Department for Work and Pensions, 2003a: 22; Table 3.3).
There is only limited recent evidence addressing take-up rates among those potentially entitled toreceive disability benefits. A study using data from 1996-1997 estimated that take-up ofAttendance Allowance was between 40% and 60% of those potentially eligible (Craig andGreenslade, 1998). This figure is substantially lower than the take-up rates reported for other keybenefits, such as the Minimum Income Guarantee (now Pension Credit), Housing Benefit andCouncil Tax Benefit. However, these estimates were produced when DLA was a relatively newbenefit. The number of people aged 65 and over claiming Attendance Allowance or DisabilityLiving Allowance has risen by 21% since 1996 – though many claims ultimately prove unsuccessful(National Audit Office, 2002a: 16).
In discussing barriers to benefit take-up by older people, Mayhew (2002) suggests that theevidence relating to disability benefits is unclear: ‘While pensioners regard disability benefits lessnegatively than Income Support – like Housing Benefit and Council Tax Benefit they are seen aspaying for essential items or services – evidence among people of all ages suggests that theattitudinal and process-related barriers to claiming disability benefits are similar to those againstclaiming Income Support’ (Mayhew 2002: 63). Barnard and Pettigrew’s (2003) analysis of barriersexperienced by older black and ethnic minority group people, emphasises this point, while alsohighlighting difficulties associated with lack of knowledge of benefit rules: ‘Older people alsoworried that their health problems were not severe enough to merit the benefit and that they
Review of policies
31
might have to return the money later. This concern was exacerbated if they saw ‘severely disabled’written on their documents, indicating a higher level of benefit. In contrast, other older people didnot realise that there was an upper limit to the benefit and thought that it would continue toincrease as their condition worsened, even if they were already receiving the highest level’ (Barnardand Pettigrew, 2003: 120).
The Department for Work and Pensions (DWP) has acknowledged that relatively low take-up ofdisability benefits is problematic. The DWP has recently been taking steps ‘to improve the take-upof Disability Living Allowance and Attendance Allowance. It has been doing this in a carefullydirected way by working closely with partners, such as local authorities and welfare rightsorganisations, which can identify potential claimants to disability benefits’ (Department for Workand Pensions, 2003c: 106).
There is some evidence that welfare advice delivered at a suitable time and location can lead toimproved take-up of disability benefits by older people. In their review of welfare advice providedin GP surgeries, Greasley and Small (2002) report on a number of local case studies that deliveredadditional benefits to primary care patients. Attendance Allowance figured prominently as thebenefit least likely to be claimed by potentially eligible older people in many of the case studies.For example, a campaign in Camden – conducted in conjunction with the local Citizens AdviceBureau – involved writing to all patients over the age of 80 registered with a GP practice. Of the206 people contacted, 45% (93 people) subsequently received additional benefits equivalent to£137,820 in extra annual income. Attendance Allowance was cited as the most common benefittaken up after such a campaign (Greasley and Small, 2002: 8).
Drawing on their detailed review of the literature relating to the provision of welfare advice servicesin primary care, Greasley and Small (2002: 16f) identify eight advantages associated with providingadvice services within general practices:
• the service is local and accessible, offering the potential of home visits by advice workers. Thisprovides access to welfare advice for people who might otherwise be ‘excluded due to age,poor health, poverty, lack of transport, or psychological barriers in visiting mainstream adviceservices’;
• providing a service within a GP practice serves to legitimise the claims process, reducing thestigma often associated by older people with claiming state benefits’;
• the service raises local awareness of welfare advice services’;
• the service enhances health workers’ knowledge of welfare advice services and benefits. As aresult, health workers are able to offer better advice and meet patients’ needs in a moreholistic way’;
• advice workers in GP surgeries can act as a useful resource for health professionals whendealing with health-related benefits claims such as Disability Living Allowance. For example,the experience and knowledge of welfare advice workers can save time for GPs completingforms, and ensure the correct submission of claims’;
• in highly deprived areas, the service can provide a useful resource to practices in which manyconsultations have ‘an underlying psycho-socio-economic basis’. This is likely to relieve someof the pressures placed on health professionals working in such settings’;
• ‘the service may lead to an improvement in the health and quality of life of patients’;
The impact of government policy on social exclusion among older people
32
• any improvement in the health and quality of life of patients might contribute to a reductionin patients’ use of NHS resources, for example consultations and prescriptions.
Recent changes to claiming Attendance Allowance/Disability LivingAllowanceAlongside innovative approaches to encouraging higher rates of take-up of disability benefits, theDepartment for Work and Pensions has been addressing problematic aspects of the administrationof such benefits. Mayhew (2002) summarises a key element of the resistance of some older peopleto claim benefits in the following way: ‘There is an expectation that claim forms will be long andcomplex, or that there will be a lot of forms to fill in. The perceived complexity of the claim formsis such that some older people feel that success in obtaining help is more a question of energy andmental agility than need’ (Mayhew, 2002:59). Key issues concerning both Attendance Allowanceand Disability Living Allowance are the complexity of the claims process, and the ensuing relativelyhigh rates of appeals against decisions made. Recent changes have sought to make progress insimplifying the claims process for both Attendance Allowance and Disability Living Allowance.
In October 2003, a shorter and simpler form for people claiming Attendance Allowance wasintroduced across the UK. The new form has been reduced in size from 37 to 19 pages. Thisfollowed successful pilots in Bristol and Glasgow. Piloting found the shortened form to be simplerto complete and less intrusive than the original form, and resulted in significantly fewer appealsand fewer medical evidence checks. The Bristol pilot also suggested a reduction in processing timesby up to six days without affecting decision accuracy (National Audit Office, 2003a: 15). Analysis ofcustomers’ views about the new claim form showed that 75% of claimants found the revised formeasy to complete (Hansard, 8 July 2003: Column 757W).
While the Department for Work and Pensions consided the pilot of the new Attendance Allowanceforms a success, there have been criticisms of the pilot from welfare advice workers. These havebeen expressed most coherently on the Benefits and Work organisation’s website(www.benefitsandwork.co.uk). In particular, the reduction in the number of appeals following theintroduction of the reduced claim form, is interpreted as reflecting a greater difficulty in mountingan appeal. Further concerns have been expressed over the large number of claims determinedsolely on the basis of the information presented in the shortened form, and not subject to furtherevidence gathering: ‘Reliance on just the information in the short forms is worrying enough inrelation to Attendance Allowance, where 80% of new claims result in an award. If the sameprocedures are followed in relation to Disability Living Allowance however, where only about halfnew claims are successful, it will be a very major concern indeed for disabled people’ (Donnison,2003: 3).
A shortened Disability Living Allowance claim form was trialled in Glasgow between January andApril 2003. The Disability Living Allowance pilot involved a 15 minute telephone interview as an‘interactive claim process’, to generate a shorter, individualised Disability Living Allowance claimform. While the evaluation of the Disability Living Allowance pilot is still awaited, a decision toextend the revised form to the country as a whole should take account of the comments ofdisability rights advisers expressed above.
In recent years there have been improvements in the speed of processing Attendance Allowanceand Disability Living Allowance claim forms. In 2000-2001 it took on average 30.5 days to processthe Attendance Allowance relevant forms. By 2002-2003 this had been reduced to 24.2 days. Thatmeant that recipients received their benefit entitlement some six days earlier than was previouslythe case. Initial evidence on the revised Attendance Allowance claim form suggests a furtherimprovement in processing time, with claims taking on average 22.6 days (Hansard, 8 July 2003:Column 757W). The improvement in processing times of Disability Living Allowance claims hasbeen slightly less pronounced; between 2000-2001 and 2002-2003 the number of days taken toprocess initial claims fell from 46.8 days to 42 days (National Audit Office, 2003a: 14).
Review of policies
33
While there has been some success in delivering Attendance Allowance and Disability LivingAllowance decisions more quickly, there continues to be cause for concern about the relatively highdegree of inaccuracy and number of appeals against such decisions. Just 55% of initial andreconsidered decisions relating to Attendance Allowance and Disability Living Allowance werejudged to be correct in 2001-2002. This represented a fall from the previous year’s figure of 61%,and is significantly worse than corresponding accuracy figures for other state benefits (NationalAudit Office, 2003b: 16).
In 2002-2003, nearly 270,000 requests were made to review initial decisions on Disability LivingAllowance (Department for Work and Pensions, 2003k: Table DLA9). The corresponding number ofrequests for Attendance Allowance was 85,000 (Department for Work and Pensions, 2003j: TableAA9). A high proportion of appeals prove to be successful. In September 2002, 54% of DisabilityLiving Allowance appeals and 47% of Attendance Allowance appeals led to a reconsideration of theapplicant’s eligibility for the benefit or the award of a higher rate of benefit (National Audit Office2003a: 5). The most common reason given for a successful appeal for these benefits was newevidence being available to the appeals tribunals. This applied to 72% of appeals. However, moreworrying perhaps, was the finding that in 42% of appeals over Attendance Allowance andDisability Living Allowance, the appeals tribunal came to a different decision on the basis of thesame initial evidence (National Audit Office, 2003b: 23). This mirrors the findings of an earlierstudy of Disability Living Allowance and Attendance Allowance awards in 1998 by the DisabilityLiving Allowance Advisory Board (DLAAB) and the National Adjudication, Support, Checking andAdvisory Team (NASCT) which highlighted the uncertainty over the accuracy and consistency ofdecision-making (Swales, 1998). This suggests the existence of a persisting weakness within theDepartment for Work and Pension’s Disability and Carers Service over the administration of suchdisability benefits.
The relatively high number of appeals against decisions on eligibility for Attendance Allowance andDisability Living Allowance, and the proportion of successful appeals, raises several issues for olderpeople who are vulnerable to forms of social exclusion. In particular, those with limited languageand literacy skills are likely to find the process of pursuing a claim against an initial decisiondifficult. Older minority ethnic group people are potentially most likely to experience difficulties inthis regard. For example, Barnard and Pettigrew’s (2003: 120) review of barriers to the take-up ofbenefits by older people belonging to such groups, highlights the complexity of forms as being akey issue. Where new forms of claiming such benefits rely on telephone interviews, this may act tothe disadvantage of those older people who lack access to a telephone or who dislike using one todiscuss personal matters.
Conclusions: impacts of Attendance Allowance/Disability LivingAllowance on the social exclusion of older peopleAnalysis of Households Below Average Income data show that pensioners who receive disabilitybenefits, experience a reduced risk of low income when compared with those receiving other keystate benefits (MIG, HB). After housing costs, 11% of Disability Living Allowance recipientpensioners and 6% of those receiving Attendance Allowance lived in households with below 60%of median household income in 2001-2002. The corresponding proportion of all pensioners livingin such low income households was 22% (Department for Work and Pensions, 2003d: 113; Table6.6). While the risk of low income appears to be lower for Attendance Allowance or DisabilityLiving Allowance recipients, the Department for Work and Pensions has long acknowledged thatsuch data may understate the extent of this particular risk. That is because there are often higherliving costs associated with the disabilities that these benefits are intended to support (Departmentfor Work and Pensions, 2003d: 99; also Lakin, 2003: 17). This point is further emphasised byGoodman et al. (2003) who note that: ‘In the HBAI statistics, those who receive [extra] socialsecurity benefits due to disability, will appear better off than those who do not have suchdisabilities. If this extra income is given purely to cover the expenses for the extra needs that thedisability generates – for extra care, transport and heating costs, for example – then the extra
The impact of government policy on social exclusion among older people
34
money would not truly [improve their] living standards’ (Goodman et al., 2003: 44). Furtherresearch would help in improving understanding of the impact of disability benefits on the livingstandards of different groups of older people.
While the evidence suggests that universal disability benefits are likely to contribute greatly toreducing the risk of income poverty in old age, older people vulnerable to forms of social exclusionmay find aspects of the operation of such benefits more problematic. Studies have highlighted thecomplex nature of the claims process and the high degree of inaccurate decisions relating toclaims. These factors are likely to impact most greatly on those older people who lack languageand literacy skills, or who lack contact with the informal and formal sources of help that are oftenrequired to complete an application for disability benefits.
A longstanding issue over Attendance Allowance and Disability Living Allowance is the apparentdiscriminatory manner in which entitlement to these benefits operates in relation to age. Central tothe critique of organisations such as Help the Aged and the Disability Alliance is the fact that themobility part of Disability Living Allowance is not available to disabled people over 65 (Help theAged, 2002a). There appears to be no logical reason why older people should be denied access tothis form of support simply on the basis of age rather than the nature of their disability.Consideration might be given to removing this upper age limit, and bringing disability benefitscloser in line with the earlier decision on Carer’s Allowance. Such a move would inevitably havesignificant public spending implications. However, for older people vulnerable to social exclusion,help with mobility needs, could prove an important source of reintegration – for example byenabling access to transport.
Social FundDescription of policyThe Social Fund was introduced in 1988 with the aim of providing a variety of forms of financialsupport to people on low incomes. The scheme is available to people of all ages. For older people,the Social Fund can be regarded as a potential supplement to other state benefits, such as IncomeSupport (MIG), replaced by Pension Credit, Housing Benefit and Council Tax Benefit. Apart fromcrisis loans, payments from the discretionary social fund are only available to older people whoreceive Minimum Income Guarantee (since October 2003, Pension Credit).10
Scope of the Social FundThere are two elements of the Social Fund that address older people’s needs. One is a regulatedcomponent. This is designed to meet largely predictable events and encompasses Winter FuelPayments, Cold Weather Payments, Sure Start Maternity Grant and Funeral Payments.Such payments are provided to individuals on the basis of a set of regulations. The secondcomponent is a discretionary element aimed at providing flexible support for individuals facingoften unexpected needs. In turn, it comprises three types of support. Community Care Grantsaim to promote independent living in non-institutional settings for vulnerable people.Community Care Grants provide financial support to ease exceptional pressures faced byfamilies and help with some travelling costs. Budgeting Loans are available to meet the cost ofone-off expenses that low-income households might otherwise find it difficult to budget for. CrisisLoans exist to meet expenses that arise in an emergency, and aim to prevent serious damage orrisk to applicants’ health and safety. Access to each of these three types of financial assistance isdetermined at the discretion of Department for Work and Pensions staff (see Rowe, 2002).
Review of policies
35
10 Introduction of Pension Credit has expanded access to the Social Fund, because loans are now available to peoplewho receive savings credit only, as well as to those who receive the income guarantee element.
The regulated component of the Social Fund had a gross expenditure of £166 million in 2002-2003, plus £1.76 billion on Winter Fuel Payments. The discretionary component had a grossbudget in 2002-2003 of £627 million. Excluding Winter Fuel Payments, in this period the fund’sregulated and discretionary components provided payments worth over £820 million, with overfour million awards made (Department for Work and Pensions, 2003i).
Research on the Social FundThere is relatively limited evidence available on Social Fund use by older people. However, someuseful insights appear in a recent study done for the Department for Work and Pensions (Kempsonet al., 2002). This report draws on in-depth interviews with 37 older people in four differentlocations to examine reasons for take-up and non-take-up of discretionary Social Fund payments.There are some general studies of Social Fund use (Rowe, 2002) and several official documents(Department for Work and Pensions, 2001, 2003i; Social Security Select Committee, 2001), butdespite its relatively limited scope, the report by Kempson et al. (2002) represents the main sourceused in the subsequent analysis.
Evaluating the success of the Social FundTogether with Income Support (MIG), the discretionary Social Fund can potentially providefinancial support at key moments of need to older people who are vulnerable to social exclusion onthe grounds of low incomes. For example, a Budgeting Loan might help meet the one-off cost of anew refrigerator or cooker, while a Community Care grant could be used to pay for a move intosheltered accommodation. Concerning the introduction of the Universal Banking Services, olderpeople who have difficulty in managing a bank account, may increasingly have to turn to the CrisisLoan system for short-term financial support (see page 44). An important indicator of the extent towhich the fund is meeting older people’s needs is therefore the number of applications andsuccessful applications that there are.
Kempson et al. (2002: 8) cite analysis of take-up data to show that pensioners are significantly lesslikely to make use of the Social Fund than people from other eligible groups: ‘In May 2001, 37% ofall people eligible to apply to the fund were pensioners … yet figures on Social Fund take-up showthat pensioners accounted for only:
• 10% of expenditure on Community Care grants.
• 4% of expenditure on Budgeting Loans.
• 1% of expenditure on Crisis Loans.’
Older people’s use of the loan schemes appeared to be especially low (Kempson et al.: 8). The mostrecent data on Social Fund take-up relate to the period 2002-2003. These suggest a continuation ofthe pattern identified by Kempson et al. (2002). In 2002-2003, 9.3% of Community Care grantsexpenditure, 4.7% of Budgeting Loans expenditure and 1.4% of Crisis Loans expenditure was paidto pensioners (Department for Work and Pensions, 2003i: 20; Annex 3).
There are several plausible explanations for the relatively limited use of the Social Fund by olderpeople. These occur alongside issues identified more generally in relation to the lack of take-up ofbenefits by some groups of older people (see the Minimum Income Guarantee analysis on page 18).
A first difficulty, highlighted in research on the scheme as a whole, yet likely to act to thedisadvantage of older applicants, concerns an apparent lack of openness about the distribution ofSocial Fund resources. As Rowe (2002: 21) suggests, despite the existence of directions concerningthe way in which discretionary payments are made ‘the way in which these operate is, in practice,
The impact of government policy on social exclusion among older people
36
unknown, inequitable and not easily accounted for’. Drawing on interviews with Social Fundofficers, Rowe (2002: 23) identifies the game played out by benefit claimants and gatekeepers:‘Those who know the rules and understand how to play within them will access funds’. Theimplication is that potential claimants who are unfamiliar with the rules of the game may havelimited access to discretionary payments under the Social Fund scheme: ‘For a scheme meant to beflexible, the Social Fund appears hostile and unresponsive to applicants’ (Rowe, 2002: 23).Responding to such a critique, changes were made in August 2002 to the directions and guidanceto local budget managers. These changes have ensured that budget loan applicants with similarpersonal circumstances should receive the same outcome regardless of where they live(Department for Work and Pensions, 2003i: 7).
Second, many older people are unaware of the existence of the Social Fund. This was one of thekey weaknesses highlighted in the study undertaken by Kempson et al. (2002). Older people –even those receiving discretionary payments under the Social Fund – appeared to be unaware ofthe fund’s existence. Those who were aware, were likely to have found out about the scheme bychance. There was also a lot of confusion about the scheme’s operation. Some older people hadapplied for Budgeting Loans when a Community Care Grant might have been available (Kempsonet al., 2002: 58). In this respect, the Select Committee on Social Security (2001) recommended theintroduction of a rule that would have allowed a Community Care Grant instead of a BudgetingLoan if eligibility for the latter was proved after receipt of a loan. This recommendation wassubsequently rejected by Government (Department for Work and Pensions, 2001: 7).
Third, take-up of the Social Fund may be limited by older people’s reluctance to take on debt. Thiswas a point highlighted by Help the Aged (2001) in their submission to the Select Committee onSocial Security’s review of the Social Fund, where they comment that: ‘Older people are much lesslikely to have a credit card or overdraft, and may have less experience of loans and borrowing. Formany there is still a great stigma attached to debt, and there is much anecdotal evidence thatsome older people would rather go without than get into debt’. Repayments under the loanschemes can account for much of an applicant’s weekly income. According to Kempson et al.(2002), around half of Budgeting Loan applicants were making repayments that represented 15%of their Minimum Income Guarantee amount.
In contrast with applications made under the discretionary scheme, older people appear rathermore likely to take-up payments made under the regulated Social Fund. In this respect, the Officeof Fair Trading (OFT) inquiry into the funeral industry provides useful data on the Social Fund’sFuneral Payment scheme. In 1999-2000, some 7% of total deaths (44,000 cases) were subject toawards under this scheme, with the average award being £866. The Office of Fair Trading reportedthat some funeral directors considered the £600 maximum payment (in 2001) to be too low andinadequate to meet the costs of the services they provided (Office of Fair Trading, 2001: 24). Inresponse to this suggestion, and a recommendation of the Select Committee on Social Security(2001), this payment has – since April 2003 – been raised to £700 (Department for Work andPensions, 2003i). Besides this sum, claimants are entitled to receive a contribution towards thecosts of a grave and burial or cremation, the cost of doctor’s certificates and reasonable transportcosts. The impact of such additional costs raises the average Funeral Payment above the £700figure. According to the most recent data, in 2002-2003 45,000 Funeral Payments were madethrough the Social Fund, with an average award of £929 (Department for Work and Pensions,2003i: 18). Just over two-fifths of awards were made to pensioners (40.8%) (Department for Workand Pensions, 2003i: 19).
Winter Fuel Payments – delivered through the Pension Service – are also marked by high take-uplevels. Introduced as a universal benefit in 1997, the Winter Fuel Payment forms a key componentof the Government’s commitment to end fuel poverty for older people by 2010 (see also review ofWarm Front scheme on page 45). It is currently fixed at an annual £200 payment for householdsaged 60 to 79. Since the 2003 Budget, households including one or more people aged 80 or over,qualify for a higher payment of £300. In 2002-2003 Winter Fuel Payments were made to 11.3
Review of policies
37
million pensioners living in some eight million households (Department for Work and Pensions,2003a). An estimated two million households were expected to receive the 80-plus payment in2003-2004. While such payments are highly valued by many older people as an importantaddition to their incomes, there is cause to doubt the long-term effectiveness of the scheme inaddressing the fuel poverty issue (Hewett, 2002) (see review of Warm Front scheme on page 45).As a universal benefit, the Winter Fuel Payment goes to all pensioners irrespective of their incomeor vulnerability to fuel poverty. As such, it is perhaps more useful to consider such a payment to bepart of the state pension than a means of addressing the needs of older people who are fuel poor.
Cold Weather Payments aim to provide extra help with heating costs to people on low incomeswho receive a range of means-tested benefits, including the Minimum Income Guarantee (PensionCredit). A Cold Weather Payment of £8.50 is made automatically to those who qualify when theaverage temperature is recorded as, or forecast to be, 0 degrees centigrade or below over sevenconsecutive days. The number and value of payments necessarily varies from year to yeardepending on weather conditions. While over 3.5 million payments were made to people of allages in 2000-2001, the corresponding number was 1.68 million in 2002-2003 (amounting to£14.24 million) (Hansard, 16 December 2003: Column 871W). Such payments can provide animportant boost to the incomes of pensioners during periods of prolonged cold weather. The factthat payment is made automatically without the need to apply, makes the system straightforwardfor recipients. However, the fact that receipt of Minimum Income Guarantee (Pension Credit) actsas a condition for accessing Cold Weather Payments means that those older people who fail toclaim this benefit will lose out on the additional income. Also, Shenton (2002) makes the obviouspoint about Cold Weather Payments that they may not necessarily help to alleviate fuel poverty:‘The problem here is that payments are only made when there are severe weather conditions andare paid after expense may or may not have already been incurred. Fuel poor households however,may choose to spend this money on other essential items’ (Shenton, 2002).
Conclusions: impacts of the Social Fund on the social exclusion of olderpeopleThere is limited evidence that the impact of the Social Fund reduces social exclusion among olderpeople. In principle, the fund’s discretionary component can provide the flexible type of supportneeded by older people faced with the difficulty of replacing expensive household items. Kempsonet al. (2002: 38) report that Social Fund applicants most commonly used the fund to pay for whitegoods, beds and bedding, and floor coverings. The lack of affordability of such basic itemsindicates poverty, as shown in a series of scientific studies (for example, Gordon et al., 2000; Mackand Lansley, 1985; Scharf et al., 2002). However, given Kempson et al.’s (2002) finding that thelevel of need for Social Fund applicants and non-applicants was broadly similar, it is likely thatmany people vulnerable to exclusion are not receiving the support they are entitled to.
Drawing on the work done by Kempson et al. (2002), it is evident that many older people on lowincomes are unfamiliar with the range of support potentially available through the Social Fundscheme. This is particularly evident in relation to the discretionary component of the fund.Kempson et al. highlight four strategies that could overcome the disproportionately low take-up ofSocial Fund awards by older people, including:
• increasing awareness and knowledge;
• overcoming the stigma of applying;
• overcoming communication difficulties; and
• reducing repayment levels for loans.
The impact of government policy on social exclusion among older people
38
The Department for Work and Pensions Annual Report for 2002-2003 on the Social Fund suggeststhat consideration is being given to providing pensioners with ‘easy and effective access to theSocial Fund scheme through the Pension Service’ (Department for Work and Pensions, 2003i: 11).While simplification of the application process is likely to prove beneficial for some older people,pensioners who are particularly vulnerable to social exclusion on low income grounds, are likely tobenefit most from a strategy that moves away from loans towards a more transparent grantssystem.
In relation to particular groups of older people who have been highlighted as being vulnerable tosocial exclusion, the review of research on the Social Fund is inevitably limited. There is an absenceof research that acknowledges the potentially different experiences of this particular schemeaccording to such characteristics as age, gender, ethnic background, health and disability, andplace of residence.
There is also a wider agenda pertaining to the Social Fund and its potential role in promotingfinancial inclusion. In a recent study, the Institute for Public Policy Research and Citizens Adviceargue for the need to transform the Social Fund into a social lender, maintaining the mix of grantsand loans but expanding access and eligibility to loans and ending the cash limited nature ofgrants (Regan and Paxton, 2003). It would be useful to consider the impact of such a shift on thesituation of older people.
Addressing financial exclusion of older people: Direct Payment and Universal Banking Services
BackgroundExclusion from financial services and products represents a key component of social exclusion. Atone level, such exclusion relates to a lack of access to basic financial products such as bank orbuilding society accounts and savings or insurance products. Such exclusion affects bothindividuals and the communities in which they live. At another level, there is growing recognitionof the exclusionary impact associated with individuals’ lack of adequate information or knowledgeabout financial matters. These include financial products, the outcome of risk assessment done byfinancial organisations, the conditions attached by such organisations to their financial products,and the marketing strategies adopted by them (Carlton et al, 2003: 6).
In the mid-1990s, it was estimated that one and a half million households in Britain (7%) did notuse any form of financial service. One in five households made use of only one or two financialproducts. People aged 70 and over were identified as one of the groups most likely to experiencesuch financial exclusion (Kempson and Whyley, 1999). The fact that the proportion of peoplewithout a current account, insurance products or savings accounts is relatively small represents akey part of the financial exclusion agenda. McCormick et al. (2004: 94) argue that ‘those who areoutside the system are smaller in number than in the past, but the consequences are harsher andthe prospects for inclusion without coordinated government action are slim’. Such exclusion has adisproportionate impact on low income households. In 2001-2002, one in six of the pooresthouseholds did not have any type of bank or building society account, which was four times therate for households on average incomes (Palmer et al., 2003: 101).
Addressing financial exclusion is identified by Kempson and Whyley (1999: 2) as a key policyconcern ‘because the options for operating a household budget without mainstream financialservices are more expensive and often unregulated. For communities with limited access tofinancial products, this process becomes self-reinforcing and is an important factor in socialexclusion’. The impact of such exclusion on marginalised geographic areas was further highlightedin the Policy Action Team 14 (1999: 1) report on access to financial services: ‘People in poor
Review of policies
39
neighbourhoods may make little use [of] financial services for reasons that are related to the areaitself. Where crime rates are high, property insurance, both household and business, may beunaffordable. Remoteness from major commercial centres, and the withdrawal of financial serviceoutlets from poor communities, may be factors in low income households’ non-use of mainstreaminstitutions’.
Financial exclusion and older peopleResearch suggests that some groups of older people may be especially prone to the experience offinancial exclusion. For example, those aged 80 and over are disproportionately likely to lack abank or building society current account (Financial Services Authority, 2000: 28). In their study ofolder people in deprived areas, Scharf et al. (2002: 100) report that 39% of those aged 60 andover had not used a bank or building society in the year preceding interview. Those belonging tosome minority groups may also be disproportionately affected. In this respect, African-Caribbean,Pakistani and Bangladeshi households have been identified as being vulnerable to exclusion fromfinancial services (Financial Services Authority, 2000: 21).
The National Institute of Adult Continuing Education (NIACE) has conducted a number of studiesthat examine the relationship of older people to financial issues. In its It doesn’t add up report,Soulsby and Lee (2002) highlight several factors that suggest a need for developing educationalprogrammes to improve older people’s basic knowledge of financial matters. Key findingsincluded:
• Financial issues are potentially complex for people of all ages, but older people may be unlikelyto take full advantage of ‘the financial benefits, services and concessions available to them.Lack of knowledge, advice and understanding of financial matters generally are importantfactors, but so are lack of confidence and trust, and the inhibitions of pride’.
• ‘Older people need someone – whether a person or agency – that they can trust and olderpeople prefer face-to-face meetings’. Given the existence of a highly fragmented financialservices system, there is a need to provide older people with impartial and objective advice,guidance and information.
• ‘The relationship between older people and those who provide financial services and utilities isnot helpful. There is a perception that services have been created for younger people and theneeds of older people ignored.’
• ‘The increasing use of ICT for financial services may exclude older people but conversely it canbe part of the solution in educational environments’ (Carlton et al., 2002: 2f).
Description of policy initiatives to address financial exclusionRecent government policy has sought to combine the dual aims of providing greater access tofinancial products for those on low incomes, while also increasing efficiency in the delivery ofpensions and state benefits (Department for Work and Pensions, 2003c: 35). This latter aim isreflected in the Department for Work and Pensions’ PSA target to ‘make significant progresstowards modernising welfare delivery so that by 2005, 85% of customers have their benefit paidinto their bank accounts’. The key policy initiatives on financial inclusion are the Direct Paymentand Universal Banking Services schemes.
The Direct Payment initiative aims to increase the proportion of people who receive pension andbenefit payments by electronic means directly into a bank or building society account. Besidesgreatly reducing transaction costs, the Direct Payment scheme aims to cut down on benefit fraud,and help increase the number of people with bank accounts.
The impact of government policy on social exclusion among older people
40
A broader aim of Direct Payment is to sustain the Post Office network, as identified in thePerformance and Innovation Unit’s (2000) Counter Revolution report. The PIU report identifiesthe central role played by post offices in both urban and rural communities. It also identifies waysin which the viability of the network can be secured. In this regard, income related to benefitpayments represents a central component of the Post Office’s resources, with the payment of socialsecurity benefits accounting for over a third (35%) of network income in 2000 (Performance andInnovation Unit, 2000: 4). The loss of such income is a major challenge for the Post Office network.Older and poorer people are the network’s most frequent users, and are therefore crucial tosustaining a dense network of post offices (Postcomm, 2002). These groups are also the mostacutely affected by the closure of Post Office branches (Postcomm, 2003: 67).
Since April 2003, direct payments into bank and building society accounts have become thenormal method for paying benefits, pensions and tax credits. The aim is to phase out order booksand girocheques over a two-year period, with the overwhelming majority of benefits paid into anaccount by 2005. A small number of people who are unable to manage a bank account will beable to make use of an emerging ‘Exceptions Service’.11
Most people who already have a bank account opt for their pensions and benefits to be paiddirectly into that account. A recent study suggests that only some 5% of those interviewed as partof a representative national study were unable to receive direct payments (Coleman et al., 2002:72). In this context, nine out of ten pensioners already have a bank or building society accountsuitable for receipt of direct payments (House of Commons, 2003b: 7).
For people who don’t have access to a suitable bank or building society account, the UniversalBanking Services scheme has been introduced. Broadly, the scheme has adopted the centralrecommendations of a report published by the New Policy Institute (Donovan and Palmer, 1999).Universal Banking Services consists of two strands:
• The first strand has seen 17 major banks and building societies make their basic bank accountsavailable, free of charge, at Post Office counters from April 2003. Such accounts allow mosttransactions, including direct debits, but do not allow account holders to go overdrawn or toissue cheques (Financial Services Authority, 2003).
• The second strand is the introduction of the Post Office card account. This is designed to be astraightforward account specifically for the receipt of benefits, pensions and tax creditpayments. Such accounts can be accessed at any Post Office. Account holders are issued witha card and Personal Identification Number (PIN), which are then used together to makewithdrawals. This system means that benefit claimants are still able to collect cash at a PostOffice branch if they wish. An extra feature of the Post Office card account is that people whoare unable to collect their benefit payments themselves can access the account through acarer or other trusted person. In such cases, the carer can be issued with their own card andPIN to access the account.
The Direct Payment scheme is being phased in over a number of months. People are being invitedto supply their account details as part of a rolling programme over a two-year period. A CustomerConversion Centre has been created which offers support and assistance to customers, helpingthem to decide on the account most suitable for their circumstances. The first invitations wereissued in April 2003. People uncertain about how best to receive their pension and benefitpayments, can continue receiving such payments through the traditional order book system untilearly 2005.
Review of policies
41
11 Chris Pond, Parliamentary Under-Secretary, in a Written Ministerial Statement announced on 11/5/04 that the verysmall number of our customers who cannot genuinely open or manage an account would receive a Cheque Payment.In his statement are the groups of customers likely to have to use it.
Research on Direct Payment and Universal Banking ServicesThe Direct Payment scheme and Universal Banking Services represent recent policies aimed atpromoting financial inclusion of previously marginalised social groups. Consequently there isrelatively limited research evidence relating to either scheme. Besides some useful academicanalyses of issues associated with Direct Payment and Universal Banking Services (Coleman et al.,2002; Kempson and Whyley, 2001), the review draws on evidence from public sources(government departments, Hansard, Postcomm) and a range of voluntary sector organisations.
Evaluating the success of Direct Payment and Universal BankingServicesA key indicator of success for these schemes is the extent to which they have been taken up bypotential customers. Payment of pensions and benefits directly into bank accounts was introducedin the early 1980s. The proportion of Department for Work and Pensions customers making use ofsuch payments has increased steadily over time. In 1996, 26% of all customers used this paymentmethod (House of Commons, 2003b: 7). By June 2002, this proportion had increased to 43%. InAugust 2003, an estimated 12.3 million customers (47%) received their pension and benefitpayments by automated credit transfer (Department for Work and Pensions, 2003m: 223; Table 1).By April 04 the proportion of customers who received some or all of their benefits paid by DirectPayment is 69.9%. The proportion of customers who received all of their benefits by DirectPayment is 63.6%.12
Older people are as likely to use the Direct Payment scheme as younger age-groups are. Forty-seven per cent of pensioners (5.8 million people) received their benefits by such means(Department for Work and Pensions, 2003m: 223; Table 1). This proportion is higher among newpensioners; 60% of this group had opted for Direct Payment in 2002 (House of Commons,2003b: 7).
It is too soon to judge the take-up of the Post Office card account. However, the number of olderpeople opening such accounts has been increasing in recent months. The most recent Postcommreport suggests that of claimants responding to an initial letter sent by the Department for Workand Pensions to over 3.2 million customers, by end of June 2003 ‘14% (nearly 290,000) of childbenefit recipients had requested a card account. Also making such a request were 50% (74,000) ofpensioners, and about 40% (nearly 47,000) of Jobcentre Plus customers. The remainingrespondents gave bank account details, including accounts which can be used at a Post Office’(Postcomm, 2003: 6).
Customers receiving payment into an account are now the majority. There is a lot of work to bedone to achieve the target of paying 85% of customers by direct payment in 2005, but theprogramme is on schedule to deliver the PSA target and is likely to exceed it.
Some older people seem likely to prove resistant to the change to direct payments. In their survey,Coleman et al. (2002: 74) showed that around two thirds of those of pensionable age would bewilling to have their state pension paid directly into an account. This leaves about a third whomight be unwilling to accept direct payments.
Kempson and Whyley (2001) have studied the characteristics of benefit recipients who were notpaid by Direct Payment. Their study, based on a large-scale survey, sought to examine potentialcustomer concerns about a move to Direct Payment. While the overwhelming majority ofcustomers were likely to prove amenable to the shift to Direct Payment, the research identified tworelatively small groups who were likely to prove highly resistant to change:
The impact of government policy on social exclusion among older people
42
12 Latest DWP data, personal communication.
• A group who already hold a suitable account but are unlikely to be persuaded to have theirpensions or benefits paid into it. This group, representing around 6% of customers, weredescribed in the research as being ‘very elderly’ and as having ‘tenuous links with banking’.The group ‘found it difficult to access bank and building society branches, had a strongpreference for operating a cash budget and a deep-seated objection to being paid by[Automated Credit Transfer]’.
• A group who do not have a bank or building society account and are unlikely to open one toreceive their benefit or pension. Four per cent of customers fell into this category. According tothe research: ‘These people had a low level of mobility and a reliance on benefits as their solesource of income’ (Kempson and Whyley, 2001).
In relation to the concerns of older people, Kempson and Whyley (2001) showed that pensionerswere generally keen to maintain Post Office access to their pensions and benefits, and wished toretain the ability to collect their money weekly. The Direct Payment scheme introduced in April2003 has sought to meet each of these points.
Some – largely technical – difficulties have been identified in the early stages of introducingUniversal Banking Services. Many of these relate to the operation of the Post Office card accountscheme. Some organisations have drawn attention to the potentially off-putting bureaucraticprocedure associated with opening such an account (National Pensioners Convention, 2003: 2),with some suggesting that this reflects a Government preference for people to open basic bankaccounts. While consumer groups and Postwatch identify eight steps that claimants need to takebefore it is possible to operate a Post Office card account, the Department for Work and Pensionssuggests that only three steps are involved (Postcomm, 2003: 15). Government data suggest thattwo million people have ‘managed to get through that very difficult maze to open a Post OfficeCard Account, well in advance of the 2005 deadline’ and that ‘these figures disprove thesuggestion that we are trying to discourage people.’ (Hansard, 7 January 2004: Col. 109WH).However, it is evident that those with potentially limited knowledge of financial services are likelyto find parts of the Post Office card account scheme confusing.
Other criticisms arise from the speed with which the Direct Payment initiative has beenimplemented. The House of Commons Trade and Industry Committee commented that ‘thereremains a significant number of people for whom the traditional system of payment by means ofthe order book is the best option. This includes many elderly or disabled people, for whom theprospect of opening an account of any sort presents difficulties and anxieties. It also includes thosecustomers who rely on weekly cash payments as an integral part of their budgeting. We do not feelthat the Government took the needs of these people and the impact of a change in policy properlyinto account before Direct Payment was introduced’ (House of Commons, 2003b: 3).
An outcome of the shift to Direct Payment has been that procedures for a variety of individualcircumstances and needs have yet to be fully developed. This creates difficulties for a significantminority of older people. For example, present arrangements for the non-regular withdrawal offunds from Post Office accounts have been judged by a range of organisations as unsatisfactory.People who are unwell for a short period, or – as is increasingly common – those who arehousebound and have a number of different carers, are likely to experience difficulty accessingtheir pensions and benefits since the current system only takes account of the needs of individualswith a main carer (Postcomm, 2003: 17). This issue is being taken forward by organisations such asAge Concern (2003), and in discussions between DWP and customer representative groups.
Review of policies
43
The arrangements for those older people who forget their PIN numbers is likely to represent aparticular concern. Currently, users of the Post Office card account system can have three attemptsto key in their PIN before their card is withheld (for obvious security reasons). Since it can takeseveral days13 before the card and a new PIN are reissued, some older people may face severe,short-term financial hardship. While the option of applying for a Crisis Loan from the Social Fund isavailable to people facing such a situation, it remains unclear whether those who have difficultymanaging a Post Office card account will be able to negotiate their way through the process ofapplying for a Crisis Loan.
A further difficulty concerns the development of the Exceptions Service for those people who areunable to manage a bank account. The introduction of the Direct Payment scheme has proceededbefore precise details of the Exceptions Service have been publicised. This has lead to ‘uncertaintyand confusion over the means by which some groups of disadvantaged people will receive theirbenefits in future’ (House of Commons, 2003b: 31). While the Government is maintaining itscommitment to phase out order books in 2005 (Hansard, 7 January 2004: Col. 110WH), it remainsunclear what will happen to the 15% of Department for Work and Pensions who will need to betreated as ‘exceptions’ should the department meet its PSA target. This is a key issue in relation tothe financial exclusion agenda, since the exceptions service is likely to be used by some of society’smost vulnerable groups. According to Postcomm, such a service ‘needs to cater for people whomay not be familiar with banking and for vulnerable people for whom [the shift to Direct Payment]may be a major and challenging change, for example, very elderly people or those suffering frommental illnesses making employment difficult’ (Postcomm, 2003: 17). Organisations such as Helpthe Aged have identified the lack of detail about the Exceptions Service as being a central weaknessof the Direct Payment scheme, which it otherwise supports (Help the Aged, 2004).
Conclusions: impacts of policy initiatives relating to financial exclusionon the social exclusion of older peopleIn summary, recent government policy on promoting financial inclusion has focused mainly onproviding previously marginalised individuals and groups with access to basic financial products.While acknowledging the benefits linked to securing access to financial services concerningpromoting social inclusion, it is evident that the overriding aim of policy has been to reduce thetransaction costs associated with the payment of state pensions and benefits.
The speed with which Direct Payment and Universal Banking Services have been introduced hascreated difficulties for potential customers of these services. Particular concerns affecting olderpeople involve the lack of clarity concerning the emerging Exceptions Service and issues linked tothe collection of funds from accounts by third parties. Many of these issues have now beenresolved, or are under discussion.
While the Payment Modernisation Programme is likely to achieve its aim of greatly increasing theproportion of people with access to a basic account, the mechanisms for promoting financialliteracy among this group are relatively limited. People with relatively limited knowledge ofmanaging a bank or building society account are likely to benefit from a range of schemesdesigned to improve on their financial skills. This is a message that is made powerfully in recentstudies from the National Institute of Adult Continuing Education (Carlton et al., 2002; Soulsbyand Lee, 2002) and the Institute for Public Policy Research and Citizens Advice (Regan and Paxton,2003).
The impact of government policy on social exclusion among older people
44
13 The Service Level Agreement states that the replacement of cards and PINS is to be made within four days.
Addressing fuel poverty among older people: Warm FrontBackgroundUsing an official definition, fuel poverty is said to occur when a household needs to spend 10% ormore of its income on fuel in order to maintain satisfactory heating and other energy services.There are estimated to be over four million households in the UK currently experiencing such fuelpoverty. Help the Aged (2003: 2) suggest that half such households contain an older person. TheGovernment’s Fuel Poverty Strategy seeks to end fuel poverty among vulnerable households by2010 and to end fuel poverty completely by 2016. A key component of this strategy is the WarmFront scheme. It is included in the analysis here to reflect the close link between fuel poverty andincome poverty for vulnerable households. This is also reflected in the take-up mechanisms of theWarm Front scheme, which seek to target low-income households that receive means-testedbenefits.
Description of policyThe Warm Front scheme was established in June 2000, to replace the previous Home EnergyEfficiency Scheme (HEES). Originally called ‘new HEES’, it was rebranded ‘Warm Front’ formarketing purposes in February 2001.
The aim of Warm Front is to improve energy efficiency for vulnerable households in fuel poverty, inthe private rented and owner occupied sectors. The scheme provides grants of up to £1,500 forinsulation, energy efficiency measures and heating improvements. Warm Front plus is an extensionof the scheme available to the over 60s which also covers the installation of central heating and hasa grant maximum of £2,500.
Scope of Warm FrontWarm Front grants are available to private rented and owner-occupied households in receipt ofspecific benefits. The over 60s are eligible if they receive either means tested benefits (MinimumIncome Guarantee, Housing Benefit, Council Tax Benefit), or disability benefits (AttendanceAllowance, Disability Living Allowance, Industrial Injuries Disablement Benefit or War DisablementPension).
Fuel Poverty among those living in social housing is being addressed through programmes toimprove the quality of social housing and by programmes provided as part of the Energy EfficiencyCommitment negotiated with energy companies. These schemes are not considered in thefollowing discussion.
Warm Front is overseen and funded by the Department for Environment Food and Rural Affairs(DEFRA) and has an annual expenditure of around £150 million a year. The scheme is administeredon behalf of the Department by two scheme managers – the EAGA partnership and PowergenWarm Front Ltd (formerly TXU Warm Front Ltd).
DEFRA has a Public Service Agreement to improve the energy efficiency of 600,000 homesbetween 2001 and 2004. The Fuel Poverty Strategy aims to assist 800,000 households through theWarm Front scheme by 2004. The Department requires that around 60% of Warm Front grants goto the over 60s.
Warm Front grants are distributed on a first-come-first-served basis on application by thehouseholder. Warm Front Scheme Managers are encouraged to carry out marketing work andmake efforts to target potential recipients.
Review of policies
45
Research on Warm FrontThe National Audit Office (2003d) has recently carried out an investigation into the work of WarmFront. It has been assessing how well Warm Front is meeting the Government’s objectives ontackling fuel poverty. However there seems to be no evidence available as yet on Warm Front’swider impact on older people’s lives. Government commissioned research on the health effects ofthe Warm Front programme was due in late 2003.
Also due in 2003 were the interim results of an evaluation of the pilot Warm Zones schemes. Theschemes are bringing together different local projects to tackle fuel poverty with a target to reducefuel poverty by 50% overall and end severe fuel poverty (where 20% of total income is spent onfuel) completely.
Evaluating the success of Warm FrontAs noted above, the Government’s target is to end fuel poverty among vulnerable households by2010 and to end fuel poverty completely by 2016. A household is defined as in fuel poverty if, inorder to maintain a satisfactory heating regime, it is required to spend more than 10% of incomeon all household fuel use. There are two sub-definitions. The first considers income to include allbenefits. The second, which is sometimes necessary for comparison, considers income excludinghousing benefit and income support for mortgage interest.
According to figures from the National Audit Office (2003d), 40% of fuel poor households arehouseholds with one person over 60, another 13% comprise couples over 60.
There has been a reduction in fuel poverty in recent years, but the Government has acknowledgedthat this is largely due to increases in income and reduction in fuel prices, rather than the effect ofthe Warm Front programme. Older people’s incomes have been increased by a range of measures,in particular the Minimum Income Guarantee and the Winter Fuel Payment. In this respect, Hewett(2002) argues that recent government energy policy has focused too heavily on raising olderpeople’s incomes as a means of addressing fuel poverty rather than on tackling inadequacies in thehousing stock: ‘a much greater effort is being devoted to the income side of fuel poverty than theinvestment in insulation. The annual bill for the Winter Fuel Allowance to pensioners is £1.7 billion,whereas the already increased budget for the Home Energy Efficiency Scheme is currently £200million. Without denying the social benefit of the Winter Fuel Allowance of £200 for everypensioner, there does appear to be an imbalance of Government spending towards short termincome support above investment in the building infrastructure’ (Hewett, 2002: 12).
According to the Government’s First Progress Report on the Fuel Poverty Strategy, the Warm FrontScheme is on course to meet targets for the number of households benefiting. Between April 2001and December 2002, 470,000 households received Warm Front grants. In 2002 alone, 303,000households were helped by Warm Front, and the average grant was £445 and the averagepotential fuel saving per household was £150 a year. In 2001-02 Warm Front grants improved theenergy efficiency of recipients’ homes by 13 points on average (Department for Environment, Foodand Rural Affairs, 2003).
Beneficiaries of the Warm Front scheme report good levels of satisfaction. Ninety per cent reportbeing satisfied and 95% say they would recommend the scheme to a friend. However, theliterature suggests that, while the Warm Front scheme has the potential to reduce fuel poverty, it isnot currently making as much of an impact on the fuel poverty problem as it might. The NationalAudit Office (2003d) considers the main problems with the scheme to be that:
• there are problems with the match between eligibility for the scheme and fuel poverty. Arounda third of the fuel poor may be ineligible and up to two thirds of eligible households may notbe fuel poor;
The impact of government policy on social exclusion among older people
46
• the heating and insulation measures available under the Scheme may be insufficient to movehouseholds out of fuel poverty in at least 20% of cases;
• only 14% of grants reached the least energy efficient homes and there is limited targeting ofgrants towards those households in greatest need.
Problems arise because Warm Front grants are distributed on the basis of receipt of certain‘passport’ benefits, rather than on assessment of whether the household is in fuel poverty. Thismeans that some households that are in fuel poverty may not be eligible, while other householdsnot in fuel poverty will be.
Research carried out in the Warm Zones pilot areas showed that some 30% of those in fuel povertywere not eligible for the Warm Front scheme, while research carried out by Warm Front schememanager TXU concluded, more pessimistically, that some 60% of those in fuel poverty wereineligible.
The group of ineligible but fuel poor households can be split into three main categories:
• Those who ought to be eligible for Warm Front grants, but are not claiming benefits forwhich they are eligible, which would passport them to Warm Front. Scheme Managers foundthat some 20% to 40% of non-recipients fell into this category. This finding has led the FuelPoverty Advisory Group to call for the Warm Front programme to include benefit healthchecks.
• Those who are not considered ‘vulnerable’ – for example those near the benefits level, but notwithin it – including pensioners with small private pensions. Age Concern England (2001)report that 60% of single pensioner households are fuel poor, but only 47% are on meanstested benefits, leaving a significant number without help from Warm Front. The NationalAudit Office (2003d) point out that the introduction of the Pension Credit could assist thisgroup by bringing more into means-tested benefit. The National Audit Office and theDepartment for Environment, Food and Rural Affairs estimate Pension Credit may make afurther 300,000 older people eligible for the Warm Front scheme.
• Those who have very high heating costs – especially those living in homes which are hard toheat. The Fuel Poverty Advisory Group conclude, ‘fuel poverty is as much or more propertythan income related’ and recommend that measures should be retargeted on property ratherthan income.
Conversely some households that are not fuel poor may be eligible for, and receiving benefitsfrom, the Warm Front scheme. The Fuel Poverty Advisory Group estimate that about half of thosebenefiting from the Warm Front programme are not fuel poor. The National Audit Office (2003d)takes the more pessimistic view that only 30% of Warm Front grants reach those in fuel poverty.There are two main reasons for this:
• some of the benefits that passport to Warm Front are not means tested and therefore those inreceipt of them may not be fuel poor;
• because the scheme makes no assessment of the energy efficiency of the households itbenefits, some of those receiving grants may already have efficient homes and low heatingcosts.
In order to meet the Government’s targets for reducing fuel poverty, the National Audit Office(2003d) report that 90% of Warm Front grants would need to reach those in fuel poverty.
Review of policies
47
The National Audit Office (2003d) found that, in at least a fifth of cases, the improvements madeby Warm Front were not sufficient to lift recipients out of fuel poverty. More pessimistically, theFuel Poverty Advisory Group estimates that, of the 200,000 people helped by Warm Front everyyear, only 40,000 are taken out of fuel poverty.
The problems associated with the scheme can be divided as follows:
• Warm Front does not provide the right kind of measures to tackle fuel poverty:Both the National Audit Office (2003d) and Age Concern England point out that the WarmFront scheme is of limited value to those in ‘hard to treat’ properties – for example thosewithout a gas supply or with solid walls. That is because Warm Front does not cover externalwall insulation, covers only basic connection to a nearby gas supply and cannot providealternative forms of central heating – for example oil fired. However, 25% of those in fuelpoverty are not on mains gas and 44% of fuel poor homes have solid walls. The scheme is alsolimited by the fact that it provides only ‘like for like’ replacements, even when these are notthe most efficient. However, in some cases this problem is overcome by bringing in funds fromthe Energy Efficiency Commitment. Both Age Concern and the National Audit Office (2003d)also point out that the scheme cannot help those whose heating systems are inefficient due tomalfunction or which fail intermittently. That is because the system has to be completelybroken to be eligible for replacement.
• Warm Front does not provide enough to tackle fuel poverty: The National AuditOffice (2003d) point out that in 3% of cases the costs of measures provided under the WarmFront scheme exceed the grant ceiling. They also point out that this may represent anunderestimate of the problem as many more may choose not to take the full package offeredso as to avoid paying the top-up costs. This inflexibility can limit the effectiveness of thescheme. For example, a household may be assessed as needing central heating and insulation,but if the grant will not pay for both they are likely to take only the central heating. Howeverwithout insulation this may be expensive to run and therefore not reduce the household’s fuelpoverty. Costs may be particularly high where properties are in the ‘hard to treat’ category,and yet as discussed, fuel poverty levels are high in these properties. However, wheneverpossible, the scheme managers try to minimise the percentage of customer contributions bycovering the cost of works through other funds.
Both the National Audit Office (2003d) and ACE suggest that, no matter what the success of WarmFront is, other factors may also affect fuel poverty – for example, incomes changes and changes infuel costs. ACE contend that the fuel poverty problem cannot be solved by energy efficiencymeasures alone. They argue that an area based approach to fuel poverty – such as that taken byWarm Zones – is likely to be more effective in tackling fuel poverty.
The only target for how Warm Front grants should be distributed, beyond the eligibility criteria, isthe requirement that 60% of grants should go to the over 60s. However in 2002 only 49% ofgrants reached this group and the National Audit Office (2003d) recommend that DEFRA takeaction with Scheme Managers to ensure that this target is met.
The National Audit Office (2003d) also note that the lack of other mechanisms to target the mostneedy in fuel poverty or home energy efficiency terms, means that the funding allocated to WarmFront may not be being spent most effectively.
There is no assessment of the existing efficiency of the home. The scheme works on the basis ofproviding eligible households with whatever measures are not already in place, regardless of likelyimpact on energy efficiency. However, before offering measures, the property’s insulation andheating need is assessed and appropriate measures are recommended. Because of this, manyWarm Front grants go to homes that are already efficient and many grants provide only small-scalemeasures, which have little or no impact on home energy efficiency.
The impact of government policy on social exclusion among older people
48

The National Audit Office (2003d) report that in 2001-02:
• Twenty per cent of Warm Front grants led to an improvement of between 0 and 1 point onthe SAP (Standard Assessment Procedure) rating. Fifty per cent led to an improvement ofbetween 0 and 10 SAP points.
• Twenty per cent of cases received only draught proofing and light bulbs – neither of whichimprove the household’s SAP rating. Expenditure on these measures accounted for 9% of totalexpenditure.
• Thirteen per cent of homes helped by the scheme had a SAP rating of over 60 points. £8million was spent on these households. Eighty-six per cent of grants went to those with a SAPrating of over 20 points.
The National Audit Office (2003d) report a disproportionate focus on the distribution of urbanhousehold grants. They describe this as being due to the greater ease with which eligiblehouseholds in urban areas can be identified. While there is limited data on exact distribution,figures from Eaga suggest only 5% of their grants went to rural households. Their findings comedespite the fact that 28% of the fuel poor live in rural areas and 12% of households in rural areasare fuel poor compared with 8% in urban areas. However, Scheme Managers are now taking someinitiatives to promote Warm Front in rural areas – for example accompanying health workers andtaking buses out to villages to promote the scheme.
Problems also result from the fact that the scheme is run on a first-come-first-served basis, andthere is no official mechanism for prioritising the most needy or urgent cases. The National AuditOffice (2003d) report instances of Scheme Managers using their discretion to do this, butrecommend that this system should be formalised.
The Government’s First Annual Report on the Fuel Poverty Strategy acknowledged that Warm Fronthad got off to a slow start after its launch in June 2000. However, it is now on course to meettargets.
The success of Warm Front has been hindered by a skills shortage in the trades required to carryout work. This has led the Government to encourage Warm Front Scheme Managers to stimulatetraining of new tradesmen through the scheme.
The normal target for carrying out heating work is 120 working days and for insulation work it is40 days from the time of the survey. Around half the jobs completed by the Warm Front schemecurrently fall behind completion targets. These long waiting times exacerbate the problems causedby the lack of prioritisation.
Conclusions: impacts of Warm Front on the social exclusion of olderpeopleWhilst it is widely accepted that fuel poverty damages people’s quality of life and health, the fuelpoor suffer more illnesses such as influenza, heart disease and strokes. There is also an increasedrisk of winter death among those in fuel poverty. However, there is no research currently availableto assess the impact of the Warm Front scheme specifically on these issues.
However older people who are living in fuel poverty, are receiving the relevant passport benefitsand those whose homes are suitable for the kind of measure offered under the Warm Front scheme(in other words are on mains gas, or have cavity walls etc), theoretically should have more efficienthomes as a result of the scheme. They should therefore be benefiting from increased disposableincome, or a more comfortable and healthy living environment or both.
Review of policies
49
However, those who are not eligible, because they are not claiming benefits or because theirincomes just exceed benefit levels, and those whose homes are not suited to the measures offeredby the scheme, may still face the problems associated with fuel poverty.
In summary, the review of research on the Warm Front programme gives rise to a number of areasfor policy development:
• there are evidently some problems with the targeting of the scheme, and further refinementwould help to ensure funds are targeted on those most in need and that higher risk cases canbe prioritised;
• consideration should be given to making the scheme more flexible in order for it to meet theneeds of older people living in ‘hard to treat’ housing;
• benefits health checks are being conducted on a trial basis. They should usefully complementthe scheme both by increasing the number of people eligible for the scheme and, viaimproved incomes, by contributing to the fight against fuel poverty.The introduction of the Pension Credit should improve the position of those pensioners whohave small private pensions previously above benefits levels;
• further research would help assess the health and other effects of reducing fuel poverty andimproving energy efficiency.
Detailed discussion on the future of Warm Front will be set out in the Fuel Poverty ImplementationPlan. This will consider options for targeting, eligibility and the effectiveness of measures inresponse to the Public Accounts Committee and the National Audit Office reports. The final versionof this plan will now be issued after the Spending Review in Summer 2004.
Summary: the impact of policies relating to income inreducing social exclusion of older peopleThe review of policies on income is to be summarised in this section by examining the impact ofsuch policies on older people who are potentially vulnerable to social exclusion. Some themes,arising from the literature review, that cut across a range of policies are also explored.
A concern with tackling poverty lies at the heart of a range of policy measures on income. In thisrespect, the proportion of pensioners experiencing relative poverty, defined as receiving less than60% of median household income (before and after housing costs), represents a key indicator ofthe relative success of such policies in recent years. Current trends in older people’s experience ofpoverty should be viewed in the context of a steady rise in pensioner poverty through the 1980s.Since the beginning of the 1990s the proportion of older people experiencing low incomes hastended to fluctuate.
The impact of income maintenance policies can be judged by examining evidence on the threelow-income indicators highlighted in the annual Opportunity for All reports (Department forWork and Pensions, 2002, 2003c):
• the proportion of pensioners living in households with relative low incomes;
• the proportion of pensioners living in households with low incomes in an absolute sense;
• the proportion of pensioners living in households with persistent low incomes.
The impact of government policy on social exclusion among older people
50
Taking the relative low-income indicator, the evidence on trends in pensioner poverty since 1996-97 is mixed. Much depends on whether household incomes are measured on a before or afterhousing costs basis. On the after-housing costs measure, the percentage of pensioners living inlow-income households has fallen from 27% in 1996-97 to 21% in 2002-2003. The before-housingcosts measure shows little variation over this period. In 2002-2003, 21% of pensioners weredefined as poor using this measure – the same proportion as in 1996-97 (Department for Work andPensions, 2004b: 114). These differing trends in the household incomes of pensioners reflect theimpact on older people’s incomes of means-tested benefits. Since before-housing cost incomeincludes both Housing Benefit and Council Tax Benefit, any increases in rental or council tax costsperversely result in a higher household income, even though the recipient will be no better offfinancially. By contrast, a growing proportion of older people who own their homes outright –representing 61% of people aged 65 and over in 2001 – will have very low housing costs.Therefore they will be higher up the income distribution after taking account of housing costsrather than before-housing costs.
Government estimates show that in 2002-03, the latest year for which data are available, around2.2 million pensioners were living in households with below 60% of median household income onbefore and after housing costs bases (Department for Work and Pensions, 2004b: 115).
On the absolute low income measure – defined in relation to pensioners’ median income fixed at1996-97 levels in real terms – the evidence is clearer. On both before and after housing costs bases,the proportion of pensioners with absolute low incomes has declined greatly. After-housing costs,the respective proportion declined from 27% in 1996-97 to 11% in 2001-02 and to 9% in2002-03 (Department for Work and Pensions, 2004b: 114). This measure shows the impact onpensioner incomes of such policy measures as the Minimum Income Guarantee and above-inflationincreases in the value of the State Retirement Pension.
The third income measure against which the relative success or otherwise of income maintenancepolicies can be judged, concerns pensioners with persistent low incomes. They are defined ashaving lived in a household with a low income in at least three years out of a four-year period.Here too, the evidence is mixed. The proportion of pensioners with persistent low incomes hasfluctuated between 16 and 18% since the early 1990s. For the period 1998 to 2001, the relevantproportion was 18% (Department for Work and Pensions, 2003c: 200). It should be borne in mindthat the latest data for measuring persistent low income covers the period 1998 to 2001. That wasbefore the largest increases in the value of the Minimum Income Guarantee came into force.
Taking the three poverty measures together points to a persisting problem of poverty affecting asignificant proportion of older people in England. The absolute low income measure is useful inproviding evidence of real terms increases in pensioner incomes since 1996-97. But the relativepoverty indicators point to a continuing gap between pensioner incomes and those of thepopulation as a whole. Between a fifth and a quarter of pensioners are currently living in lowincome households, depending on whether a before or after housing costs measure is used.Around 18% have persistently low incomes. Also, the proportions experiencing relative low incomehave altered relatively little in recent years. This can in part be attributed to the strength of thenational economy in recent years. During times of economic growth, median incomes can riserapidly, making it difficult for those who have left the labour market, to keep pace financially. Inestimating that median income has grown by 2.6% a year since 1997, the Brewer et al. (2004: 2)make the point that: ‘Pensioners are also continuing to become richer relative to the rest of thepopulation. For the first time in almost 20 years, a pensioner drawn at random from the populationis less likely to be in poverty than a non-pensioner, measuring incomes [after housing costs].’ Evenso, in terms of achieving social inclusion, one can argue for the need to maintain the livingstandards of older people compared with those of the population as a whole. In this respect,policies such as the Minimum Income Guarantee and above-inflation increases in the StateRetirement Pension have been important in contributing towards a stabilisation of the proportions
Review of policies
51
of older people experiencing relative poverty. The Pension Credit system, introduced in October2003, is slightly more generous than the Minimum Income Guarantee and is likely to maintain thetrend towards a stabilisation/reduction of pensioner poverty.
Research shows that some groups of older people continue to be disproportionately affected bylow incomes. Indeed, the groups who have historically been most acutely affected by poverty arestill those most likely to live in low income households. This includes single female pensioners,people aged 75 and over, those belonging to black and ethnic minority groups, and older peopleliving in deprived urban and rural communities. The reasons for such poverty tend to be structuraland are consequently less amenable to change in the short-term. The big investment made bygovernment in alleviating pensioner poverty in recent years has succeeded in lifting a considerableproportion of those on the margins of poverty out of this state. However, there is a large, ‘hard toreach’ group of older people whose daily lives are still blighted by the experience of poverty.
Take-up of the Minimum Income Guarantee (now Pension Credit) and other means-tested benefitsis a further important indicator relating to the success of government policy. While the Departmentfor Work and Pensions has taken a number of important steps in recent years to improve take-up ofthe Minimum Income Guarantee, Housing Benefit, Council Tax Benefit, Attendance Allowance,Disability Living Allowance and the Social Fund, research suggests that low take-up continues to bean issue. This equally applies to schemes such as Warm Front. It is also evident that take-up ratesvary, often a lot, between the various benefits. Therefore, while Housing Benefit is claimed byaround nine out of ten entitled pensioners, the corresponding proportion for Council Tax Benefit isunder seven out of ten. Given the positive impact of the receipt of such benefits on householdincome, more clearly needs to be done to ensure that vulnerable households receive their fullbenefit entitlements.
There are particular concerns about key groups within the older population who are less likely toclaim benefit entitlements than others. According to the National Audit Office (2002a: 26), thisincludes those in the oldest age groups – who are disproportionately women – people belongingto black and ethnic minority groups, and those with disabilities. There are also geographicdifferences in benefit take-up, with older people in rural areas and those in deprived urban areasless likely to pursue a benefit claim (National Audit Office, 2002a: 26). Encouraging take-up withinthese groups is essential, since they are also the groups most likely to be prone to other forms ofsocial exclusion. An important step towards addressing some of these issues has already been takenby the Department for Work and Pensions in its recently published qualitative study exploring thedelivery of benefits and services for black and ethnic minority older people (Barnard and Pettigrew,2003). This study should be viewed alongside the earlier National Audit Office (2002a) analysiswhich highlights practical steps that could be taken to increase take-up rates.
There is now sufficient evidence available to show what works in terms of increasing benefit take-up among older people. Policy should now consider how best to translate this evidence into aseries of practical steps that target those whose lives would be improved most by an increase intheir benefit income. The emerging Third Age Service might play a useful role with this. Givenmany older people’s preference for face-to-face contact with welfare professionals, there is alsoscope to develop a system of personal advisers who could address some of the complex issuesfaced by older people in negotiating their way through the benefits system. This occurs already foryounger people through the Connexions service).
The review shows that significant progress has been made in recent years on the administration ofpolicies related to income. The procedures governing the operation of most state benefits havebeen streamlined and claim forms simplified. Direct Payment of pensions and benefits holds thepotential of improving the ability of older people to manage their finances independently and in adignified way. However, there are also shortcomings in such bureaucratic procedures that are likelyto have a disproportionate impact on those prone to social exclusion. For example, theintroduction of Direct Payments and the Universal Banking Service has occurred without sufficient
The impact of government policy on social exclusion among older people
52
consideration being given to the specific needs of those who are unable to manage a bank orbuilding society account. The Social Fund has retained much of its complexity, and is as a resultnot as well used by vulnerable older people as it should be.
2:2 Policies relating to health and social careIntroductionThis section brings together a range of policies falling under the broad heading of health and socialcare. These may have direct and indirect implications for tackling social exclusion in relation to thethree drivers of age-related, cumulative disadvantage and age-based discrimination. Communitycare policies are especially important in relation to the first of these, tackling a range of problemsaffecting older people that may cause social exclusion of some kind or another. Cumulativedisadvantage is also acknowledged in that some services, for example Care Direct, may addressconcerns about the under-use of services due to lack of awareness and/or low expectations.Confronting ageism is now an important feature of health and social care and is given particularprominence in the National Service Framework for Older People.
Community care policies and social exclusionBackgroundCommunity care may be seen as an important component of policies designed to combat socialexclusion. It has a direct role in assisting the participation of older people in mainstream socialactivities, notably through promoting access to a wide range of supportive services-informal as wellas formal. Community care policies are also charged with an explicit commitment to tackle age-discrimination and to maximise the involvement of users in the design and management of carepackages. The starting point for considering this strand of policy is the White Paper Caring forPeople, published in November 1989. This document laid down principles – subsequentlycodified in the 1990 National Health Service and Community Care Act – which may be seen ascentral to the task of assisting social integration in late life (Hughes, 1995). These principles werebuilt around the themes of home, choice and independence.
On the concept of home, the main aim of community care policy was described as ‘enabl[ing]people to live as normal a life as possible in their own homes or in a homely environment in thecommunity’ (Department of Health, 1989, 1.8). Choice was also seen as fundamental to the newapproach to community care, with a commitment to providing both users and carers with moresay in how they lived their lives and the services they needed, through the explicit aim of providingservices ‘that allow a range of choice for consumers’ (Ibid. 1.10). The final element was thepromotion of independence, expressed in the White Paper as ‘…provid[ing] the right amount ofcare and support to help people achieve maximum possible independence, and by acquiring orrequiring basic living skills, to help them to achieve their full potential’ (ibid, 1.8).
Description of community care policiesThe major objective of Government of policy in the field of community care remains that of‘promoting community-based alternatives to residential care and enhancing the independence ofservice users’ (Henwood, 2000: 15). This approach has been extended and refined through arange of legislation and policy documents through the 1990s and beyond. Some of the mostsignificant of these may be listed as follows:
Review of policies
53
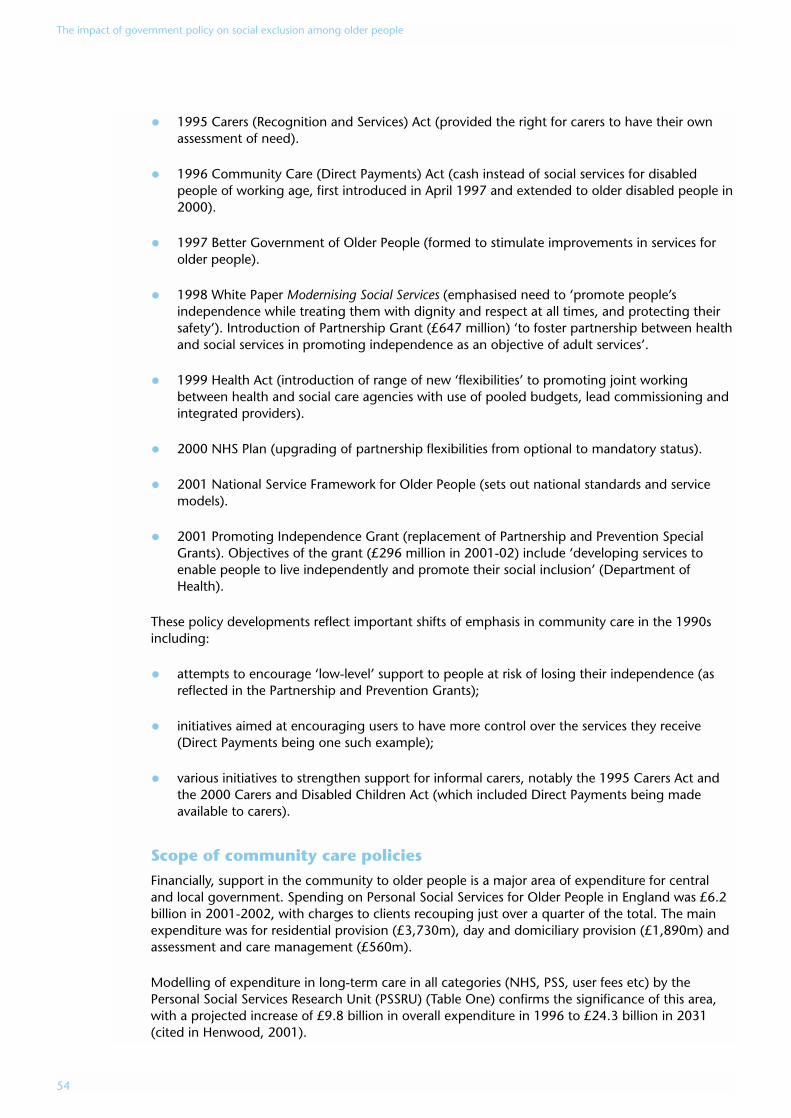
• 1995 Carers (Recognition and Services) Act (provided the right for carers to have their ownassessment of need).
• 1996 Community Care (Direct Payments) Act (cash instead of social services for disabledpeople of working age, first introduced in April 1997 and extended to older disabled people in2000).
• 1997 Better Government of Older People (formed to stimulate improvements in services forolder people).
• 1998 White Paper Modernising Social Services (emphasised need to ‘promote people’sindependence while treating them with dignity and respect at all times, and protecting theirsafety’). Introduction of Partnership Grant (£647 million) ‘to foster partnership between healthand social services in promoting independence as an objective of adult services’.
• 1999 Health Act (introduction of range of new ‘flexibilities’ to promoting joint workingbetween health and social care agencies with use of pooled budgets, lead commissioning andintegrated providers).
• 2000 NHS Plan (upgrading of partnership flexibilities from optional to mandatory status).
• 2001 National Service Framework for Older People (sets out national standards and servicemodels).
• 2001 Promoting Independence Grant (replacement of Partnership and Prevention SpecialGrants). Objectives of the grant (£296 million in 2001-02) include ‘developing services toenable people to live independently and promote their social inclusion’ (Department ofHealth).
These policy developments reflect important shifts of emphasis in community care in the 1990sincluding:
• attempts to encourage ‘low-level’ support to people at risk of losing their independence (asreflected in the Partnership and Prevention Grants);
• initiatives aimed at encouraging users to have more control over the services they receive(Direct Payments being one such example);
• various initiatives to strengthen support for informal carers, notably the 1995 Carers Act andthe 2000 Carers and Disabled Children Act (which included Direct Payments being madeavailable to carers).
Scope of community care policiesFinancially, support in the community to older people is a major area of expenditure for centraland local government. Spending on Personal Social Services for Older People in England was £6.2billion in 2001-2002, with charges to clients recouping just over a quarter of the total. The mainexpenditure was for residential provision (£3,730m), day and domiciliary provision (£1,890m) andassessment and care management (£560m).
Modelling of expenditure in long-term care in all categories (NHS, PSS, user fees etc) by thePersonal Social Services Research Unit (PSSRU) (Table One) confirms the significance of this area,with a projected increase of £9.8 billion in overall expenditure in 1996 to £24.3 billion in 2031(cited in Henwood, 2001).
The impact of government policy on social exclusion among older people
54
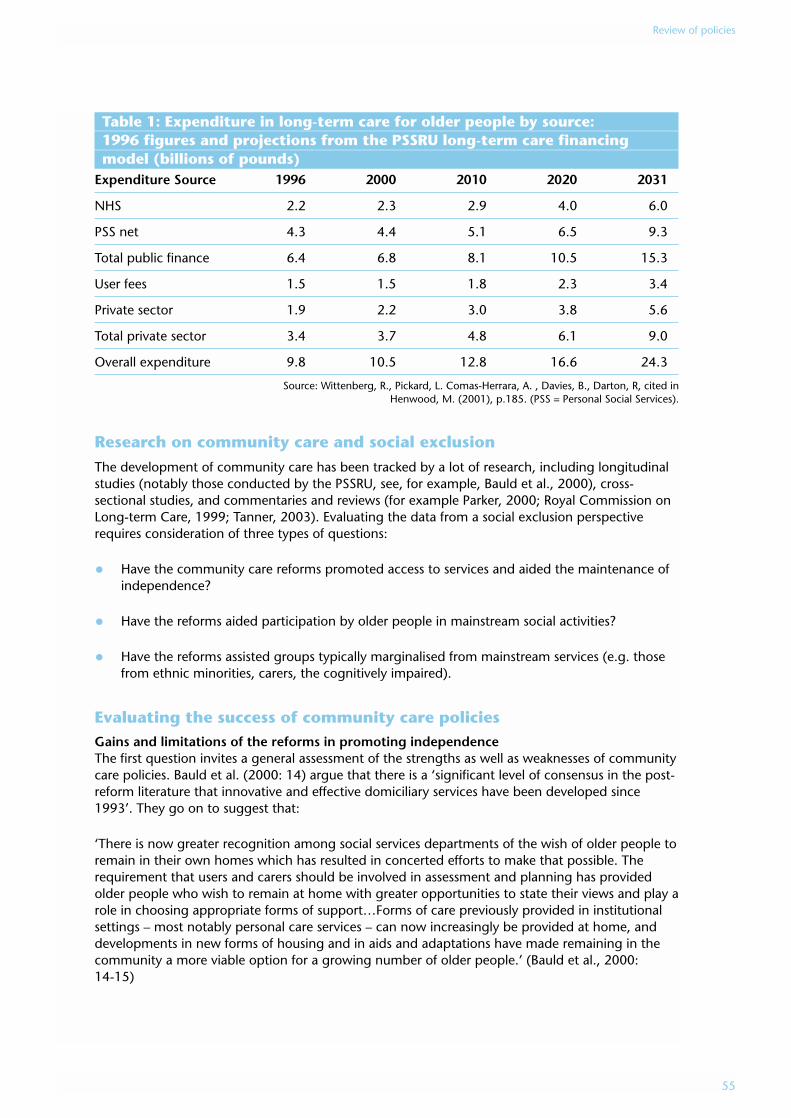
Table 1: Expenditure in long-term care for older people by source: 1996 figures and projections from the PSSRU long-term care financing model (billions of pounds)
Expenditure Source 1996 2000 2010 2020 2031
NHS 2.2 2.3 2.9 4.0 6.0
PSS net 4.3 4.4 5.1 6.5 9.3
Total public finance 6.4 6.8 8.1 10.5 15.3
User fees 1.5 1.5 1.8 2.3 3.4
Private sector 1.9 2.2 3.0 3.8 5.6
Total private sector 3.4 3.7 4.8 6.1 9.0
Overall expenditure 9.8 10.5 12.8 16.6 24.3
Source: Wittenberg, R., Pickard, L. Comas-Herrara, A. , Davies, B., Darton, R, cited inHenwood, M. (2001), p.185. (PSS = Personal Social Services).
Research on community care and social exclusionThe development of community care has been tracked by a lot of research, including longitudinalstudies (notably those conducted by the PSSRU, see, for example, Bauld et al., 2000), cross-sectional studies, and commentaries and reviews (for example Parker, 2000; Royal Commission onLong-term Care, 1999; Tanner, 2003). Evaluating the data from a social exclusion perspectiverequires consideration of three types of questions:
• Have the community care reforms promoted access to services and aided the maintenance ofindependence?
• Have the reforms aided participation by older people in mainstream social activities?
• Have the reforms assisted groups typically marginalised from mainstream services (e.g. thosefrom ethnic minorities, carers, the cognitively impaired).
Evaluating the success of community care policiesGains and limitations of the reforms in promoting independenceThe first question invites a general assessment of the strengths as well as weaknesses of communitycare policies. Bauld et al. (2000: 14) argue that there is a ‘significant level of consensus in the post-reform literature that innovative and effective domiciliary services have been developed since1993’. They go on to suggest that:
‘There is now greater recognition among social services departments of the wish of older people toremain in their own homes which has resulted in concerted efforts to make that possible. Therequirement that users and carers should be involved in assessment and planning has providedolder people who wish to remain at home with greater opportunities to state their views and play arole in choosing appropriate forms of support…Forms of care previously provided in institutionalsettings – most notably personal care services – can now increasingly be provided at home, anddevelopments in new forms of housing and in aids and adaptations have made remaining in thecommunity a more viable option for a growing number of older people.’ (Bauld et al., 2000:14-15)
Review of policies
55
Warburton and McCracken (1999) in a Department of Health review of the 1993 reforms for theRoyal Commission on Long-Term Care, suggested that evidence from inspections, research andother sources indicated that ‘innovative and effective services’ had begun to develop. Theyconcluded that: ‘There is greater recognition by SSDs of the wish of many older people to remainliving in their own homes as long as is feasible, and increasingly determined efforts by SSDs makethis possible’.
Recent reports from the PSSRU research suggest that community services are achieving importantgoals such as preventing institutionalisation, reducing caregiver burden and contributing to usersatisfaction. Davies and Fernandez (2003:27) note that: ‘Service contributions are particularly largefor the most dependent users, many of whom received more intensive service packages than pre-reform’.
Another important dimension concerns user involvement in the process of assessment. Datareported by Bauld et al. (2000: 372) found a high level of involvement reported by care managersand users: ‘Among care managers, 70% reported that users had been involved to a large extent inassessment, with an additional 17% reporting some involvement. A similar proportion (71%) ofusers themselves reported that they had a say in assessment, although the proportions wereslightly lower (60%) among more dependent users…’
High levels of satisfaction among users of home care services (with important exceptions noted onpage 57) have also been reported. Statistics on the experiences of older people of home care, havebeen gathered by the Department of Health, with 87,000 people responding to a surveyconducted through social service departments in England in 2003 (Department of Health, Bulletin2003/26). Overall, 57% of respondents said they were ‘extremely’ or ‘very’ satisfied with the helpthey receive from social services. Of those clients with physical disabilities, 58% answered‘extremely’ or ‘very’ satisfied. This was not significantly different to those clients in the learningdisability, mental health or other vulnerable group where 57% said they were ‘extremely’ or ‘very’satisfied. Overall, 89% of all respondents answered they were ‘extremely’, ‘very’ or ‘quite’ satisfiedwith the services they receive. High levels of satisfaction with services has also been reported inwork carried out by the Social Services Inspectorate (see, for example, Little, 2002: 11) and byPSSRU (Bauld et al., 2000).
Progress can also be reported on joint working between health and social care, with examples suchas Local Implementation Teams (formed to implement the NSF for older people), work aroundintermediate care, and integrated community equipment services (Social Services Inspectorate,2003). The Social Services Inspectorate’s most recent review of older people’s services found that:‘About half the councils inspected were making significant joint management arrangements withhealth to support the increased integration of operations and commissioning. These appointmentsaddressed joint accountabilities and promoted seamless delivery’ (Bainbridge and Ricketts,2003:61). Inspections by the Social Services Inspectorate in 2002-2003 concluded that: ‘Allcouncils were planning older people’s services [together] with health services’ (Social ServicesInspectorate, 2003: 30).
Finally, the Social Services Inspectorate, reviewing their latest round of inspections, report evidencefor the ‘…beginnings of a fundamental cultural shift in social care to one which is focused onpromoting independence. The shared values and beliefs of the staff are evolving from an era whenusers are offered what was available and were ‘looked after’ by services that cared for the individualand minimised risks’. The authors of the report conclude that: ‘The principle of person-centred,needs-led planning is starting to offer choice and empowerment (Bainbridge and Ricketts,2003: 1).
The impact of government policy on social exclusion among older people
56
Limitations of the community care reformsAlong with the apparent gains from the community care reforms, some limitations and problemshave also been reported. From a social exclusion perspective some significant areas of difficultyrelate to:
• first, meeting ‘high’ as opposed to ‘low’ intensity needs;
• second, lack of choice and involvement in services;
• third, problems with implementing reforms such as Direct Payments.
A consistent finding from research concerns the extent to which ‘the price of achieving moreintensive personal care has been paid for… by the removal of ‘low level’ support (AuditCommission, 1997; Royal Commission on Long Term Care Research Seminar, 1999). Parker (2000:1) argues that ‘within a resource-constrained system…better and more comprehensive packages ofhelp have gone to those with high levels of need’. Trends in home care support, reinforce theseobservations. An estimated 381,900 clients received home care during 2002. This represents a 3%decrease from the 2001 figure of 395,500 and an 8% decrease since 2000 (when the figure was414,700). On the other hand, both contact hours (Tables 2 and 3) and average number of visitshave increased greatly. In 2002, the average number of contact hours per household was 8.1hours. This was almost 1.5 times the average number of contact hours provided in 1997 (5.4hours). More than half of households received six or more visits during the week in 2002,compared with 38% in 1997. In 2002, 41% of all households had six or more visits and over fivecontact hours of home care, an increase from 28% in 1997 (Department of Health, 2003a).
Table 2: Average number of contact hours per household per week, 1992 to 2002
Year All Sectors CSSR Independent
1992 3.2 3.2 3.7
1993 3.5 3.4 4.6
1994 4.1 3.7 7.2
1995 4.7 4.0 7.5
1996 5.1 4.3 7.4
1997 5.4 4.5 7.6
1998 5.8 5.0 7.8
1999 6.3 5.2 8.1
2000 7.0 5.5 8.2
2001 7.5 6.0 8.4
2002 8.1 6.4 8.8
Source: HH1 FORM, Tables 1, 2A, 2B and 3A (for 2000 onwards)
Review of policies
57
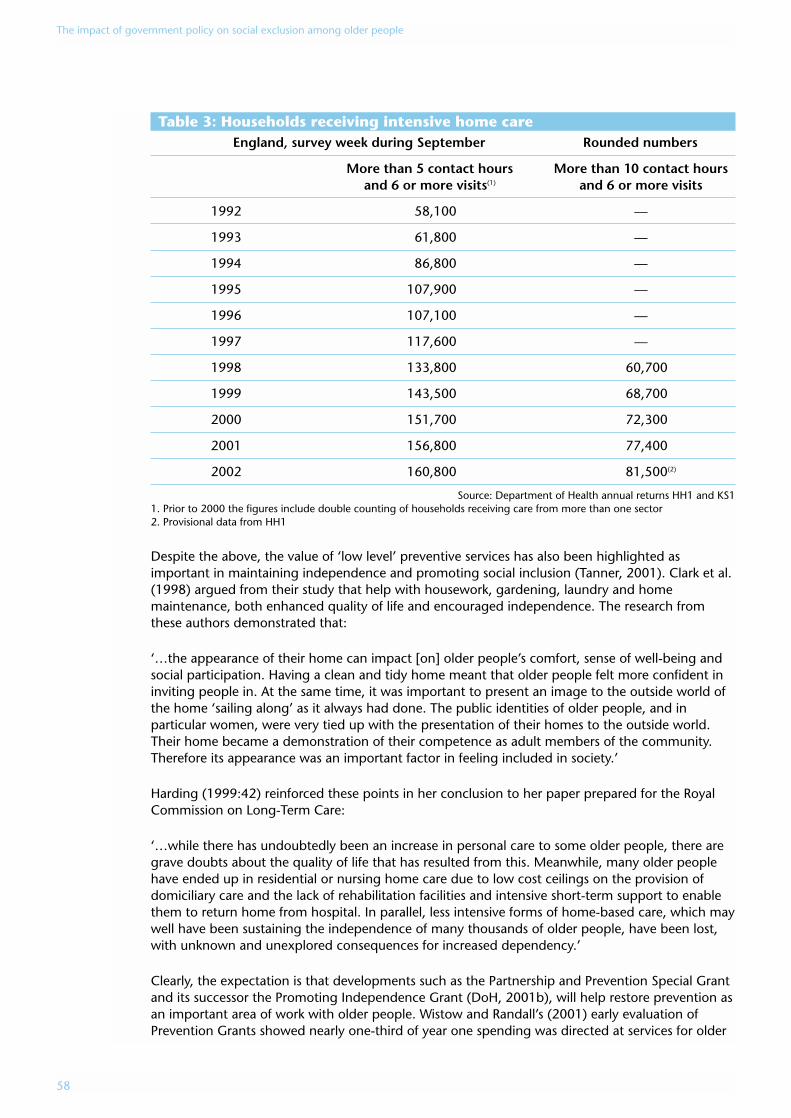
Table 3: Households receiving intensive home careEngland, survey week during September Rounded numbers
More than 5 contact hours More than 10 contact hours and 6 or more visits(1) and 6 or more visits
1992 58,100 —
1993 61,800 —
1994 86,800 —
1995 107,900 —
1996 107,100 —
1997 117,600 —
1998 133,800 60,700
1999 143,500 68,700
2000 151,700 72,300
2001 156,800 77,400
2002 160,800 81,500(2)
Source: Department of Health annual returns HH1 and KS11. Prior to 2000 the figures include double counting of households receiving care from more than one sector2. Provisional data from HH1
Despite the above, the value of ‘low level’ preventive services has also been highlighted asimportant in maintaining independence and promoting social inclusion (Tanner, 2001). Clark et al.(1998) argued from their study that help with housework, gardening, laundry and homemaintenance, both enhanced quality of life and encouraged independence. The research fromthese authors demonstrated that:
‘…the appearance of their home can impact [on] older people’s comfort, sense of well-being andsocial participation. Having a clean and tidy home meant that older people felt more confident ininviting people in. At the same time, it was important to present an image to the outside world ofthe home ‘sailing along’ as it always had done. The public identities of older people, and inparticular women, were very tied up with the presentation of their homes to the outside world.Their home became a demonstration of their competence as adult members of the community.Therefore its appearance was an important factor in feeling included in society.’
Harding (1999:42) reinforced these points in her conclusion to her paper prepared for the RoyalCommission on Long-Term Care:
‘…while there has undoubtedly been an increase in personal care to some older people, there aregrave doubts about the quality of life that has resulted from this. Meanwhile, many older peoplehave ended up in residential or nursing home care due to low cost ceilings on the provision ofdomiciliary care and the lack of rehabilitation facilities and intensive short-term support to enablethem to return home from hospital. In parallel, less intensive forms of home-based care, which maywell have been sustaining the independence of many thousands of older people, have been lost,with unknown and unexplored consequences for increased dependency.’
Clearly, the expectation is that developments such as the Partnership and Prevention Special Grantand its successor the Promoting Independence Grant (DoH, 2001b), will help restore prevention asan important area of work with older people. Wistow and Randall’s (2001) early evaluation ofPrevention Grants showed nearly one-third of year one spending was directed at services for older
The impact of government policy on social exclusion among older people
58
people. The authors suggested that a large number of authorities were at least beginning to fundservices associated with the development of community resources, healthy ageing, capacitybuilding and empowerment. On the other hand, the most recent survey of councils by the SocialServices Inspectorate (Bainbridge and Ricketts, 2003: 19) concluded that: ‘…most councilsinspected had made little investment in, and had no strategy for developing, low-level preventionand support services. Usually, the voluntary sector was providing an uncoordinated patchwork ofservices’. Also, the amount of money available for preventive work suggests that councils are likelyto struggle to expand such work. This may be reinforced by the difficulty of clearly demonstratingthe value of ‘low-level’ support. Lewis et al. (1999) observe in a study of local authorities that: ‘Inorder to obtain mainstream funding for “low level” services, managers often found that they wereunder pressure to demonstrate effectiveness and financial benefit’. The following comment from amanager illustrated this problem: ‘When you are battling for resources, it doesn’t matter howmuch you might believe in prevention if you can’t really prove the value of the outcome’.
The second general area of concern relates to choice and user involvement in services. These areimportant themes in the exclusion/inclusion agenda and are highlighted both in various elementsof community care legislation and in developments such as Better Government for Older People(BGOP). Research in the mid- to late-1990s suggested that significant degrees of tension remainedin respect of these areas. Parker (2000) cites the work of Myers and MacDonald who found thatwhile care managers sought to give service users and carers greater control over the caremanagement process, various factors, including resource availability and professional assessment ofrisk, could run counter to real empowerment. Parker’s (2000: 3) conclusion (reflecting findingsfrom research carried out by Hardy, Young and Wistow, 1999; Tanner, 1998; and Rummary andGlendinning, 1999) was that:
‘Assessment, which was seen as the cornerstone of good quality community care and responsiveservice commissioning, has, become a rationing device. Some people do not even manage to gainaccess to an assessment, never mind the services that might follow from it.’
Later research has refined aspects of this criticism, expressing concern about what is viewed as anoverly-bureaucraticised care management process (Challis et al., 2001). In particular, the argumentis made that while the original intention may have been to provide an integrated and holisticservice, in practice users often experience their care as ‘discontinuous and episodic’ (Ware et al.,2003: 421). Challis et al. (2001) suggest that the reality of care management is a lot different fromthe original projects which were typified by small caseloads and frequent contact with clients. Incontrast, Ware et al. (2003:421) summarise their research findings on this issue as follows:
‘In our sample of authorities, by contrast, we find a prime focus on financial controls and theroutinisation of tasks. There were examples of good practice where care managers recognised theimportance of continuing personal relationships and a holistic approach to user and carer needs.However, where care management essentially comprises the disparate short-term tasks, it isquestionable how far the continuity of relationships can be sustained and encouraged.’
These points were also brought out in the Social Services Inspectorate report (Little, 2002)Improving Older People’s Services, in the following comment relating to inspections carried out over2001-02:
‘Overall, assessments were of good standard, but with some important shortfalls such as the lack ofpersonal information. Care plans were too often service-led. This was linked to the volume of work,the need to complete it within reasonable timescales and to shortages of local resources. There wasalso a lack of creative thinking about how best to devise a personalised plan for older people,drawing on their strengths as well as their needs.’
Review of policies
59
Some of the problems associated with extending choice and control over services have beenreflected in difficulties associated with the implementation of the Direct Payments scheme. Thismeasure was first introduced for disabled adults of working age in 1997 and extended to olderdisabled people in 2000. However, by 2002-2003 there are still only 1,000 older people in Englandreceiving direct payments – just five people per council. The Social Services Inspectorate make theobservation that their inspections:
‘…found that many direct payments schemes had been designed for people of working age anddid not take the particular needs of older people into account. This limited the accessibility andusefulness of direct payments. Failure to offer direct payments systematically and poor publicinformation were further barriers. Some councils had no arrangements for advocacy or support byvoluntary organisations. In others that did fund support by voluntary-sector organisations, limitedfunding restricted access.’ (Bainbridge and Ricketts, 2003: 29)
Evaluation of a simulated Direct Payments scheme in Portsmouth confirmed a high level ofsatisfaction among participants (Patmore, 2002). But the qualifications expressed in the researchfindings are also noteworthy. They suggest that this kind of approach may create difficulties forthose especially vulnerable and/or socially isolated. Research by Patmore found that:
‘Some older people can feel daunted by new arrangements which, whatever gains they promise,sound as though they may burden one with having to make more decisions and organise one’sservices oneself. Also, while some older people resented care managers’ control of their services,there were others who actually feared loss of care managers’ presence as intermediaries who couldaddress any problems with the provider on their behalf. Reservations about managing services foroneself resulted in people declining to participate and in the relatively small number who would trythe simulated Direct Payments option, the option required most from the service user. In the DirectPayments option some older people encountered difficulties in finding a worker. They fearedrecruiting a stranger via advertising but, if one had few remaining social connections, it was hardto find a suitable person in any other way.’ (Patmore, 2002: 32)
A more positive experience of direct payments has been reported in a study by Clark et al. (2004)who concluded that they were a positive option for older people, resulting in greater choice andcontrol in respect of daily living. However, they noted some age discrimination in the operation ofthe scheme, with their sample having only limited access to the full range of social and leisureservices available to adults.
The balance of evidence about the community care reforms suggest some gains for those withcomplex needs but fewer improvements for those with lower levels of dependency. Bauld et al.(2000: 388) summarise the key trends as follows:
‘The greater emphasis on care management and planning has resulted in scarce resources beingtargeted more effectively than hitherto towards those older people with the greatestneeds…[There] is clear evidence that this resulted in tangible benefits for users…[However]…thefindings also make the point that in a system where resources in relation to needs have beenconstrained for many years, any gains will have their associated costs. In so far as targeting hasachieved many gains for particular groups of users, it may have been at the expense of appropriateinvestments in prevention and rehabilitation that have imposed costs on other parts of the healthand social care system and added to the burdens placed on some carers.’
Community care and social participationIncreased support within the home is clearly relevant to challenging social exclusion in late old age.However, another important question is whether the gains achieved assist participation inmainstream activities or whether they simply contribute to sustaining a tolerable standard of living.Some studies have advanced the view that community care is currently failing the test ofpromoting social inclusion, focusing instead on issues to do with what Harding (1999:42) refers to
The impact of government policy on social exclusion among older people
60
as ‘maintenance and safety’ and what Tanner (2003: 501) defines as ‘survival needs’. Harding(1999: 42) suggests that while the nature and objectives of services for younger people haveundergone radical change, reflecting awareness from professionals about the need to promote‘autonomy and inclusion in mainstream life and activities’, the same appears much less true aboutservices for older people. She illustrates this point with the example of day services which Hardingargues have become narrowly-focused on ‘care’ rather than inclusiveness. Against this: ‘Day careshould be one of the ways of enabling older people to retain their personal interests and theirinvolvement in life and create new opportunities for involvement in the wider community’.
A possible source for widening the focus of work with older people is the Single AssessmentProcess (SAP) (Department of Health, 2002c). It raises the possibility of a more ‘person-centred’approach to defining the needs of the individual. However, researchers such as Hunter (2001) andTanner (2003) have raised doubts about whether the SAP will demonstrate significantimprovements in the range of services that people receive. Tanner (2003: 508) for examplesuggests that:
‘…if ‘’needs’’ are only what councils will provide for in relation to their eligibility criteria, and theservice user’s definition of need falls outside this, we are not further forward in terms of the wideraccess to services (as opposed to assessment). Despite statements about the need to involve olderpeople in assessment…the emphasis is more on the roles and relationships of professional expertswho are driving the process. Even the new ‘case-finding’ proposal implies professionals may knowbetter than older people when they need help. It has been suggested, too, that the SingleAssessment Process will lead to greater confusion amongst older people about theresponsibilities of different agencies and about their legal entitlements and this is another potentialsource of disempowerment.’
Tanner (2001, 2003), Wistow (2003), Harding (1999), in response to the above concerns, arguethe case for shifting the focus of community care to that of ‘enhancing quality of life rather thanthe narrower one of reducing individually-defined risk’ (Tanner, 2003: 511). Wistow et al. (2003)link this with the framework developed by the World Health Organisation (2002) of ‘active ageing’,this defined as: the ‘process of optimising opportunities for health, participation and security inorder to enhance quality of life as people age’. Wistow et al. (2003) suggest that this approachimplies both a broader approach to community care, one focusing on strategies which canmaximise control, interdependence and social integration, as opposed to the virtues of choice andindependence which have been the traditional aims of public policy towards older people. Theauthors argue that:
‘There is evidence that mortality and morbidity are more strongly related to the experience ofcontrol over one’s life than the exposure to health risks per ser. In addition, there is some evidencethat community-based social capital is associated with better health status…From a number ofperspectives, therefore, it appears that the ability to live successfully in local communities is basedon interdependence to a greater extent than independence. Older people need to be able to giveas well as receive if they are to maintain their self-esteem and sense of purpose in life. In practice,therefore, it is the interdependence and social integration of individuals in local communities thatmake possible the independent lifestyles on which public policy has more traditionally focused.’(Wistow et al., 2003: 4-5; see, also, Scharf et al., 2002; Phillipson et al., 2004)
Tanner (2003:511) concludes that in respect of prevention, perspectives such as the above, wouldtranslate to a concern with the: ‘development of community resources, capacity-building, healthageing and empowerment… This is not about older people’s access to ‘care’ but about changingthe nature of the communities they live in and their involvement in them, as participants inhelping networks… Indeed it is argued that the very success of ‘’community care’’ policy must bemeasured by the extent to which care givers and receivers are enabled to achieve full-citizenshipwithin the community and control over the lives and services they use’.
Review of policies
61
This broader approach to community care confirms the importance of establishing linkages witharea-based strategies in the field of prevention – for example Health Action Zones – as well as workaround urban and rural regeneration. It also suggests the need to embed developments such asthe National Service Framework and the Single Assessment Process within a wider focus on socialintegration and empowerment at community and neighbourhood-based levels.
Community care and marginalised groupsA further question to ask of the community care reforms concerns the extent to which they havebeen successful in reaching groups who have traditionally missed out on support. Notably they arethose such as ethnic minorities, carers and those with complex mental health needs. The researchevidence for each of these groups will now be reviewed, beginning with findings relating tominority ethnic groups.
Support for Black and minority ethnic older peopleSuccessive studies through the 1990s pointed to major problems in service provision for olderpeople from ethnic minority groups (Askham et al., 1995; Carlin, 1994; Boneham et al., 1997;Patel, 1999). The Commission for Racial Equality concluded from their study that:
‘Ethnic minorities are both under-and over-represented as users of health and social care services.Typically, where care is more akin to control and brings restrictions on users’ autonomy, ethnicminorities are over-represented. Where the services are ‘caring’, ethnic minorities tend to be under-represented. This is particularly apparent in mental health services.’ (cited in Henwood, 2000: 59)
Patel (1999), in work for the Royal Commission on Long Term Care, highlighted the inadequacy ofmainstream providers ‘…and the compensatory effect of minority ethnic organisations whocontinue to act as ‘’primary providers’’. Qualitative research in the 1990s also indicated ethnicminorities as having limited knowledge about the full range of community health services andsocial services provision (see Boaz et al., 1999; Blakemore and Boneham, 1993). On the other handresearch also pointed to significant variations within the population of ethnic elders, a point oftenmissed in commentaries on this topic. Blakemore (2002), for example, argued that:
‘The position of minority ethnic communities has often been portrayed as one of commondisadvantage compared with the position facing the white majority. In this way existing researchhas tended to racialise the debate about minority needs, focusing on problems in community careas if they affect all black people equally. In fact some minority communities are in a much betterposition than others to lessen the impact of ‘race’ discrimination, inadequate care services andsocial disadvantage. All the signs point to increasing inequalities in community care amongBritain’s minority black and South Asian communities, while the black/white divide becomes lessdistinctive than it was.’
Even so, research and inspections over the past three years suggest continuing problems facingblack and minority ethnic elders. From their inspections for 2001-2002 the Social ServicesInspectorate reported some good examples of low-level community support services targeted atthis group. Yet there appeared ‘few councils which could offer people an intensive service whichprovided for their cultural and religious needs, such as long-residential care, a short-term break orhigh-level domiciliary care’ (Little, 2002: 21). Fruin’s (2000) review of provision for short-termbreaks for people with physical disabilities and older people, found users and carers from ethnicminority communities to be significantly under-represented as beneficiaries of short-term breaks.The most recent Social Services Inspectorate review came to the conclusion that:
‘Almost all the councils inspected had gaps in their provision for meeting needs arising fromminority cultures. These were particularly noteworthy for more intensive services including respiteand residential care. Where the services provided were not culturally sensitive, there was muchpotential for isolation and poor outcomes, exacerbated by language difficulties and potential staff
The impact of government policy on social exclusion among older people
62
misunderstandings. Services sensitive to cultural needs were often those providing less intensivecommunity support, meals, and day and domiciliary care.’ (Bainbridge and Ricketts, 2003: 27; see,also, Ware et al., 2003: 417)
Surveys of users of home care services suggest lower levels of satisfaction among ethnic elders.Results from a survey carried out for the Department of Health in 2002-2003 found 58% of whiterespondents ‘extremely’ or ‘very’ satisfied compared to 44% of black and minority ethnicrespondents. Just over one in ten of the latter expressed dissatisfaction with the nature of the helpthey received in their own home (Department of Health, 2003a).
Some evidence for improvement in the range of services for older people from ethnic minoritygroups has been found through Performance Assessment Framework (PAF) data on services foradults and older people, and carers: ‘The indicator for ethnicity [in relation to the former group]receiving services after an assessment, showed an improvement on 2001-2002, and is set toremain acceptably stable in 2002-2003’ (Social Services Inspectorate, 2003: 28). Findings on blackand ethnic minority carers were, however, much less satisfactory, with difficulties in recruitingrespite carers from black and ethnic minority groups, and delays in establishing department-wideminority ethnic strategies (see further page 64).
Henwood (2000) suggests that examples of innovative and responsive services have invariablyoriginated from black and minority ethnic-led voluntary organisations in a ‘bottom-up’ approach.She notes that even though there are examples of good providers, for example, from statutorybodies, these tend not to be incorporated into the mainstream. Henwood (2000:61) concludesthat:
‘There are probably many relevant factors, including pressures from existing and potential serviceusers, action from front-line staff and their managers, and effective advocacy by black and minorityethnic voluntary organisations. Encouraging the spread of innovative developments on the groundis critical, particularly if they are to become mainstream rather than ‘specialist’ and oftenmarginal…[thus] the challenge is not just about developing a range of different services to meetthe needs of black and minority ethnic groups, but also, more demandingly, that appropriate skills,knowledge and attitudes are developed in all workers.’
Although the general findings on the problems facing black and minority ethnic elders are clear,the experiences of particular groups needs further study. Phillipson et al. (2003) suggest thatpoverty and language difficulties may create particular difficulties for carers from the Bangladeshicommunity. Lindesay et al. (1997) report on the poor uptake of services among Asian Gujaratis.Scharf et al. (2002) have highlighted difficulties facing older Pakistani and Somali people living inareas characterised by high social deprivation. More detailed studies on the experiences of differentcohorts of ethnic minorities is, however, urgently required if a more accurate assessment of theirneeds is to be made.
Support for carersAcademic research in the 1980s highlighted the pressure on informal carers, women in particular.The importance of their role had been highlighted in the White Paper Caring for People but with nospecific recommendations for assistance. This changed with the passage of the 1995 Carers(Recognition and Services) Act which confirmed both new rights and a clear legal status. Inparticular, people providing a regular and substantial amount of care can ask for an assessmentof their ability to care when the person they are looking after is being assessed for community careservices. This right is also extended to people intending to care in the future.
Bauld et al. (2000) note that evidence from the Social Services Inspectorate and Kings Fund CarersImpact programme indicates that the number of carer assessments are increasing and specialinitiatives, such as support groups and designated workers for carers, are developing. Parker
Review of policies
63
(1999), in her review for the Royal Commission, found that carers had been incorporated intoSSDs’ thinking and practice in a way that was not evident ten years ago’. She also pointed to therange of special initiatives directed at carers which had begun to appear.
However, the Bauld et al. (2000) and Parker (1999) reviews covering the 1990s were critical aboutthe limitations of the support for carers. Bauld et al. (2000: 17) concluded that: ‘Despite greaterawareness of carers and their needs…there is limited research evidence of improved outcomes inthe post-reform period, or even of adequate support from services’. Parker (1999: 63) took theview that: ‘In all areas…there is a serious question mark over whether or not the changes havedelivered significant, rather than marginal, improvement in access to the core services whichsupport carers best’. Awareness of legislative changes remains a significant problem. Research byArksey et al. (2000) in a study of carers with ‘heavy caring responsibilities’ found most of thosesurveyed having only limited knowledge of the Carers Act and their entitlements. Bainbridge andRicketts (2003: 45) for the Social Services Inspectorate find that nationally performance remainedpoor in the provision of carers’ assessments with most councils not achieving their targets.
Some improvements are likely to have occurred since the research of the mid to late-1990s,though more recent reports from the Social Services Inspectorate suggest continuing difficulties forcarers over access to ‘practical help and general support’ (Little, 2002: 23). But we still knowrelatively little about the problems facing particular groups of carers such as those on low incomes,or from particular ethnic minorities, or those living in areas of high social deprivation. Exploring theimpact of social exclusion on caring responsibilities, or vice versa, would seem a useful steptowards developing further work in this area.
Support for people with mental health needsService responses to mental health needs is another area with major gaps both generally and forparticular groups (Audit Commission, 2002; Department of Health, 2000). Bainbridge and Ricketts(2003: 25) in SSI inspections over 2002-2003 noted that many councils reported a shortfall inservices designed to meet the needs of older people with mental health difficulties. Also, theycommented that: ‘All too often, where good services did exist, they were isolated anddisconnected’. Common problems cited in the report included:
• the mental health needs of black and minority ethnic elders were often unmet, particularly forintensive services;
• lack of strategic grasp and practical planning;
• shortfalls in the availability of services sometimes resulting in placements/provision that metneeds poorly;
• institutional options were often seen as the mainstay of provision;
• older people’s mental health services were usually unable to access intermediate care;
• some locations with community mental health teams lacked provider services;
• little focus on the needs of older people with functional mental health needs.
People with dementia as well as their carers may experience various forms of exclusion and servicediscrimination. Little (2002: 22) from the Social Services Inspectorate found that for the period2001-2002 ‘…few councils had yet developed specific domiciliary care services to assist peoplewith dementia to live in their own homes’. Bauld et al. (2000) highlighted the pressures on carers
The impact of government policy on social exclusion among older people
64
of cognitively impaired older people, particularly in respect of lower levels of satisfaction with theservices provided to them. The 12th Annual Report for the Social Services Inspectorate (2003)concluded that:
‘While good progress has been made towards the NSF milestone for reviewing eligibility criteria forservices to eliminate age-related discrimination, in some areas patchy or poor mental healthservices for older people remain. Isolated, uncoordinated, and inaccessible, these services could bedescribed as an indirect way of discriminating against older service users, and should be a priorityfor improvement.’
Ethnic elders may be particularly vulnerable in respect of access to services. Social ServicesInspectorate inspections in 2002-03 found that: ‘Representation of black and ethnic minorityperspectives in strategic planning for mental health services was very poor’. Part of the problemmay be lack of knowledge among providers of the types and range of problems facing ethnicelders in their local area. This was commented on in the research by Patel et al. (1998). It foundthat while much information exists about dementia experienced by the majority ethnic groups instatistical, economic cost and research terms, this is much less the case for older people from Blackand Asian ethnic groups.
Conclusions: impacts of community care policies on the social exclusionof older peopleDespite the important gains made by the reforms in community care, notably in helping tomaintain very dependent older people in their own homes for longer periods, the limitations froma social exclusion perspective are also apparent. In summary these may be listed as follows:
• limitations of low-level preventive work with older people;
• continuing problems in maximising user-involvement and empowerment;
• problem of continuing focus on survival needs to the detriment of inclusion of older peopleinto mainstream activities;
• limited integration of community care with community development;
• continuing difficulties faced by marginalised groups such as those with mental health needs,black and minority ethnic elders, and carers.
More generally, this review highlights the possibility of refocusing the community care debatearound social inclusion issues. This should be carried forward into specific areas such as assessmentand service delivery, as well as broader concerns that address the capacity of the communities inwhich people live to sustain independent/interdependent living.
Health Action ZonesDescription of programmeAttempts to tackle social exclusion through community change have taken a variety of forms. Theyinclude area health initiatives, anti-poverty programmes, activities around crime reduction, andcommunity development. Typically, programmes target geographically-defined areas with multipleproblems such as high levels of poverty and ill-health, poor services and infrastructure, high levelsof crime and unemployment (Howse, 2003). The development of Health Action Zones (HAZ) was
Review of policies
65

announced in 1997. These were viewed as a new way of tackling health inequalities in areas ofhigh levels of deprivation (Department of Health, 2001). In October 1997, health authoritiestogether with local authorities and other agencies were invited to submit bids to become HealthAction Zones. In the call for bids, the three strategic objectives of Health Action Zones wereoutlined as follows (Department of Health, 1997):
• to identify and address the public health needs of the local area;
• to increase the effectiveness, efficiency and responsiveness of services;
• to develop partnerships for improving people’s health and relevant services, adding valuethrough synergy between the work of different agencies.
In some instances the Health Action Zone initiative coincides or overlaps with other governmentprogrammes focused on inequalities and exclusion. Examples are Single Regeneration Budgets, theNeighbourhood Renewal Strategy, and Education Action Zones. Howse (2003:14) describes theunderlying theme behind the development of the Health Action Zone initiative as follows:
‘The engagement of local communities is one of the principles…of the structure and aims of theHAZs. They are to increase public involvement in the planning of services, and empower serviceusers and patients to take responsibility for their own health and decisions about care. That is whythey have been set up as partnerships between the NHS, local authorities, the voluntary andprivate sectors, and community groups. It is not surprising, therefore, that programmes forenhancing community involvement are cited by most of the HAZs as a central part of their work;nor that some of the local HAZ strategies should make an explicit commitment to a communitydevelopment approach to health.’
Scope of the Health Action Zones initiativeA total of 26 Health Action Zones were set up in two waves over 1998 and 1999. They range inpopulation from 180,000 to 1.4 million people and cover over 13 million people in total.Altogether more than £274 million was allocated to assist Health Action Zones in the three yearsfrom April 1999. This funding has also been used to leverage change in the more substantialbudgets of health and local authorities. Funding for Health Action Zones has been extended to2005-6 with further funding of £140 million but with Health Action Zone activities nowmainstreamed within the relevant Primary Care Trust (PCT). Another element is the FellowshipsScheme. The funding from that enables front line staff in the NHS, Social Services and theVoluntary Sector to take time out from their work to assess better ways of ‘tackling healthinequalities and modernising services’ (Department of Health, 2001).
The Health Action Zones initiative fits firmly within policies designed to tackle social exclusion.Health Action Zones are located in areas of high deprivation levels with some of the poorest healthlevels. Health Action Zone health authorities accounted for 15 out of the 25 most deprived areas inthe late 1990s. The majority also had illness and mortality rates greater than the national averagebased on Health Survey of England and ONS data (National Evaluation, 1999). On the other hand,the areas themselves are diverse ranging from inner cities, rural areas and ex-coalfield communities(Bauld and Judge, 2002).
Research on Health Action ZonesAn edited volume from Linda Bauld and Ken Judge has been produced which summarises HealthAction Zones work on collaboration, evaluation and innovation, although there is little material inthis collection specifically relating to older people (Bauld and Judge, 2002). Reports are howeveravailable providing information on the scope of activities involving older people, including somefrom the national evaluation of Health Action Zones (Bauld and Judge, 1999; Judge and Bauld,
The impact of government policy on social exclusion among older people
66
2002; Lawson et al., 2002) and evaluation reports from the local projects (Merseyside HealthAction Zone, 1999, 2001; Tyne and Wear Health Action Zone Partnership, 1999; Adams, 2001;Booth, 2001; Health Action Zones, 2001; McNally, 2001; Tyrer, 2001; Christie, 2002; Leicester CityHealth Action Zone, 2002; Tilford et al., 2002). This material has been accessed in the discussionthat follows.
Evaluating the success of the Health Action Zones initiative inincorporating issues affecting older peopleCoverage by Health Action Zones of issues affecting older people, needs to be considered in atleast three different ways:
• First, to what extent are the health concerns of older people directly covered in Health ActionZones (the age-related question)?
• Second, to what extent are general health issues affecting other groups (young people or theunemployed) also related to later life issues (the cumulative disadvantage issue)?
• Third, to what extent are links made between health concerns in old age and problems abouturban deprivation and regeneration policies aimed at tackling these (an age discriminationissue)?
Evidence from the first wave of Health Action Zones (Judge and Bauld, 1999) found the largestproportion of programmes (21%) tackling the determinants of poor health, such asunemployment, housing and education; 16% were concerned with improving the health ofspecific population groups. Almost half of these programmes focused on younger people, a smallernumber on older people and the remainder on ethnic minority groups or parents. The nationalevaluation of Health Action Zones provides further evidence on the focus of the programmes.Lawson et al. (2002: 4) in their presentation of preliminary findings from the integrated casestudies comment that:
‘The report describes the approaches that have been taken to addressing the health issuesassociated with children and young people, coronary heart disease (CHD) and employment. Therationale behind the selection of these topics was that the purpose-based analysis of the June 2000high level statement documentation showed that these were the most prevalent types of HAZactivities within the population focus, health problem and structural focus categories’.
On the other hand, a small number of Health Action Zones did identify work with older people as apriority group – for example, Hull and East Riding, Leicester, Cornwall, South Yorkshire and Tyneand Wear – and a larger number have included work with older people in their spectrum ofactivities. Our review of the 26 Health Action Zones websites indicates that this work falls into twomain categories: first, promoting health and independence; second, encouraging participation andpartnership. An example of the former is provided by Wolverhampton’s Older People’s workstreamwhich ‘aims to develop new ways of promoting the health, well-being and independence of olderpeople’. The objectives here are:
• to prevent ill health and disability through physical exercise, social activity and knowledge ofhealth issues;
• to help people to recover their independence after a spell of illness, through the provision oftherapy services and rehabilitation (Crockett, 2002: 16).
Review of policies
67

Howse (2003: 16) summarises some of the activity in Wolverhampton as follows:
‘A team of 12 Peer Health Mentors use their skills, knowledge and life experience to give advice topeople of their own age, and have so far spoken to over 1,000 people. The mentors provideinformation, give talks on numerous subjects and are involved in developing activities thatpromote healthy living among older people such as walking, alternative therapies andreminiscence groups. The project takes a holistic approach to health promotion. Besides addressingissues relating to the physical well-being of the over-50s, it also aims to generate new activities forolder people in order to promote their mental well-being. The Mount Shiloh project receivedmoney…to provide a wide range of activities for African Caribbean elders in a venue that wouldcater for their cultural preferences. Visiting speakers carry out informal health education work andgive advice on health, advocacy and welfare benefits’. The HAZ is also setting up several localOlder People’s Resource Centres, which will act as a basis for befriending projects, exercise classes,a café, support for carers…’
In terms of promoting independence in old age, the evaluation of the Merseyside Health ActionZone (Mackinnon, 2003: 26) highlighted what it described as an ‘innovative intervention known asThe Dawn Patrol’:
‘This scheme involved children checking the homes of older people on their way to school. If theolder person was up they would put a sign in the window and if there was no sign, the child wouldget somebody to go round and check that person was well. This scheme has ‘proved to have lotsof benefits and has been rolled out to other places’ .
Hull and East Riding Health Action Zone report ‘shifting the balance of support and service forolder people towards health improvement and retaining independence’. This Health Action Zonereports giving particular emphasis in achieving this goal to developing intermediate care servicesand work on falls prevention. Cornwall and Isles of Scilly Health Action Zone also highlightpromoting independence and preventing accidents as major activities, including communityrehabilitation, proactive risk assessments and medicines’ management.
The second major theme in Health Action Zone work around older people concerns issues aboutpartnership and participation. The Department of Health describes the Age Well programme inSandwell Health Action Zone as ‘typical of work partnership with older people within Health ActionZones to ensure that they have an equal voice in policy and practice at strategic and local levelswithin partner organisations. The commitment to older people extends to those at particular risk of‘’missing out’’, for example those who are disabled. The involvement of black and other ethnicminority older people is also a significant project. At the same time a programme of practical workhas been undertaken, including:
• publishing an A-Z of services for older people;
• developing an approved list of local builders and tradesmen;
• extending the availability of chiropody and similar services at a local level;
• enabling people to remain in their own homes by making increased investment to supporttheir needs; and
• piloting work to prevent accidents through Primary Care Teams….’
The impact of government policy on social exclusion among older people
68
Anticipated outcomes of this work (Allen, 2002: 37) are described as follows:
• increased sense of involvement and control among older people in Sandwell;
• evidence of active participation in organisational decision-making by older people;
• reduction in isolation of older people;
• increased quality of life, as reported by older people;
• improved health status of older people, including 20% reduction in accidents by 2010’.
The work of other Health Action Zones has included stakeholder conferences involving olderpeople, designed to shape future health policies and planning. Merseyside Health Action Zone(2001) provides a detailed example of one such event. Also, the description of the planning behindone particular conference reflects the theme of social inclusion running through the Health ActionZone:
‘In order to facilitate participation by older people there was attention to detail in the planning ofthe event. A sound system was used and translators and carers provided for those who requiredthem. Pre-conference materials were in large print and translated into appropriate languages andBraille according to the needs of the individual. Accessible transport was provided and theindividual’s cultural, religious and dietary requirements were met. A decision was made by thedesign team to invite groups of older people from two of the boroughs only, in order that thoseattending would be with friends and not isolated. Eighteen older people attended out of a total of86 participants. Age Concern Liverpool and Sefton Pensioners Advocacy helped prepare for theevent and provided support during the conference. A range of older people from fit to infirm andfrom diverse ethnic groups attended. The timing of the programme was adjusted to meet theirneeds. This attention to detail illustrates how HAZ principles of equity and community involvementcan be put into practice.’ (Merseyside Health Action Zone, 2001: 7-8)
Evaluating the success of Health Action Zones in reducing socialexclusion of older peopleThe evidence to date suggests that many Health Action Zones have incorporated issues affectingolder people and that these report success in involving people in campaigns and conferences onthe one side, and in promoting health awareness and access to services on the other. The followingexamples are cited for illustration:
‘The Health Action Zone joined forces with Eastern [Home Energy Efficiency Scheme] to organise aseminar to raise awareness and promote a government grant scheme aimed at subsidising thecosts of home heating. The purpose of the seminar was to ensure that disadvantaged householdsin Hull and East Riding had the opportunity to benefit from government grants of up to £2,000,which can be used for insulating lofts and walls, draught-proofing and installing a central heatingsystem…Referrals to the scheme from this area increased sharply following this seminar…500people benefited from the scheme as a direct result of this intervention’. (Hull and East RidingHAZ)
‘A forum to enable Wolverhampton’s over-50s to have their say, and influence the development ofservices for older people, has attracted over 60 members since it was set up in November 1999 …An event to engage older people from African Caribbean and Asian Communities attracted nearly100 participants and has resulted in the formation of the Black Elders partnership.’ (Frankel, 2003)
Review of policies
69

‘[Cornwall and Isles of Scilly Health Action Zone] Eldercare workstream … Intermediate outcomesas at March 2003 include:
• evidence of agencies switching funding to support co-ordination of signposting services;.
• safer and more supportive home environments for older people;
• increased range of care options available;
• improved professional knowledge of range of alternative services available;
• 1,000 elderly people benefiting from falls prevention work, including early interventions andpromoting exercise;
• development of care pathway.’
‘[Merseyside Health Action Zone’s (2001)] progress report on the follow-up to their Older People’sconference, find the positive changes identified as follows:
• involvement of older people, for example in selection and recruitment of professional staff;
• awareness of older people and their needs;
• enthusiasm for change;
• joined up working and creative services;
• positive attitudes to mental health issues for older people;
• transport reaching more areas and more routes;
• befriending and assessment of needs.’
The long-term impact of this work is rather more difficult to assess, notably in terms of the likelihoodof it being adopted by mainstream services. Also, much of the Health Action Zones activity for olderpeople is not itself innovatory nor designed to address inequalities in any basic sense. The strengthof the Health Action Zone work has been to focus on a relatively narrow range of issues to do withimproving the responsiveness of providers to the needs of older people. Alternatively, it has beentargeted at improving outcomes in specific areas such as accidents, falls and rehabilitation.
Conclusions: impacts of Health Action Zones on the social exclusion ofolder peopleHealth Action Zones have developed themes relevant to promoting social inclusion. The mostsignificant of these have been:
• encouraging participation in health care services among elderly people;
• developing health promotion schemes targeted at older people;
• stimulating work among black and minority ethnic elders;
• developing a community dimension to health promotion work in old age.
The impact of government policy on social exclusion among older people
70
From a social exclusion perspective, however, two main gaps in work to date might be identified:
• First, activity around tackling disadvantage which runs throughout the life courseand which may be cumulative in its effect. The problem here is that work around childrenand families, unemployment, coronary heart disease, and old age, are invariably treated asseparate topics, rather than a linked set of issues. Tyne and Wear Health Action Zoneacknowledge this point with their action theme on ‘Healthy Citizenship –adding years of life andimproving life capacity’. But even here, it is unclear how this particular theme is related tochallenging deprivation in old age given the focus on items such as improving assessment toolsfor the over- 80s, improving specialist housing provision, and providing focused and accessibleleisure. The implication of this is that much of the work of HAZs, where it has beenrelevant to older people, has focused on age-related issues along with the impactof age-based discrimination. Problems arising from the impact of cumulativedisadvantage through the life course have been given far less attention.
• Second, although the Health Action Zones are usually linked to neighbourhoodrenewal strategies and regeneration policies of various kinds, links to policiesaffecting older people are relatively rare. Thus the regeneration theme hardly figures inHealth Action Zone work with older people, despite the commitment to a communitydevelopment approach. This reinforces the more general finding from researchers such asRiseborough and Sribjlanin (2000: 22) about the extent to which older people have been left outof the debate around urban regeneration – a point discussed in more detail in the discussion onurban renewal. The danger here is that health policies will fail to address either how regenerationand renewal can be used to benefit the health of groups such as older people, or, conversely,how urban renewal schemes can themselves exacerbate health inequalities (Cave et al., 2002).
NHS Direct and Care Direct and Social Exclusion andOlder PeopleDescription of programmeNHS Direct and Care Direct may both be seen as relevant to the social exclusion agenda. Theframework for these policies was summarised by the White Paper Modernising Government, whichidentified the need to bring government services and information about them, closer to users andcarers. Emphasis was further placed on the need to achieve ‘seamless integration’ in provisionacross a range of social and health care needs. NHS Direct and Care Direct also reflect aspirationsto using information technology in the drive to make ‘government and its services more accessible’(McNeil, 2001: 2; see, also, Cabinet Office, 2000).
NHS Direct was launched in 1998 as a 24 hour-a-day/seven days-a-week service; nationaltelephone coverage was achieved in November 2000. The service came with the remit ofproviding: ‘… easier and faster health advice and information to the public’ (National Audit Office,2002b). NHS Direct is now the world’s largest provider of telephone healthcare advice. It received3.5 million calls in 2000-01, with call volumes set to double the following year. NHS Directemploys (2002 figures) around 0.5% of all full-time equivalent qualified nurses in the NHS, with20% of its nursing workforce coming from outside the NHS. By 2002 the annual cost of the servicewas £90 million per annum (National Audit Office, 2002b).
Care Direct was launched as a pilot by the Department of Health in the autumn of 2001 as asingle gateway or ‘one stop shop’, offering information and support to people over 60 and theircarers. The case for the service was identified in a Treasury and Cabinet Office-sponsored review ofways to improve information targeted at older people. The review identified the case for a singlephone number that would route callers to a network of advisers based either in NHS Direct callcentres or specialist centres. Call centres and help desks were to provide the same core information
Review of policies
71
about care and support services and social security benefits and be open out of hours. Also, peoplewho did not wish to, or could not, use the telephone should be able to see Care Direct advisers inperson at places that were easy to reach, for example, at the main help desk or potentially in theperson’s own home (McNeil, 2001). £30 million was allocated over the period 2001-02 to 2003-4to run pilot schemes in 20 local authority areas (six in phase one and 14 in phase two). The CareDirect pilots have now ended, with 12 months’ transitional funding put in place in preparation forthe Department of Work and Pensions’ Third Age Service. Formal evaluation of Care Direct hasbeen undertaken by the PSSRU at the University of Kent (Bebbington and Unell, 2003a, 2003b).The assessment below is based on the interim reports from this evaluation.
Scope of NHS Direct and Care DirectNHS Direct was launched in three first wave areas in 1998 covering 1.3 million people. Followingthis the service has been extended in successive waves and by November 2000 was available to thewhole of England and Wales. Munro et al. (2001: 1) list the objectives of the service as:
• Offering the public a confidential, reliable and consistent source of professional advice onhealthcare, 24 hours a day, so that people can manage their problems at home or know whereto turn for appropriate care.
• Providing simple and speedy access to a full and up-to-date range of health and relatedinformation.
• Helping to improve quality, increase cost-effectiveness and reduce unnecessary demands onother NHS services by providing a more appropriate response to the public’s needs.
• Allowing professionals to develop their role in enabling patients to be partners in self-care, andhelping them to focus on those patients for whom their skills are most needed.
Munro et al. (2001: 71) note from their evaluation of the service that NHS Direct has evolved intoa: ‘…well-used, functioning service whose pace of development shows no sign of slowing’. Theyfurther comment that: ‘…our evidence shows that the population’s use of NHS Direct is increasing.[That suggests] that it responds to unmet need, although the service is still a comparatively smallplayer in relation to the total volume of unscheduled health care, being used in about 5% of allepisodes of ill-health where unscheduled care is sought’.
Care Direct was itself partially modelled on NHS Direct with the development of a free-phonetelephone number with supplementary internet link. Unlike the latter however it has been pilotedaround specific localities, driven by partnerships within the local authority areas. According to theCare Direct Evaluation Newsletter (No.3: 5): ‘…there have been some differences in approach, and[in] the first year, differences in performance. Bournemouth subcontracted the service’s running toa local voluntary organisation serving older people and their carers. In Bristol and Gloucestershire,Care Direct has been integrated in different ways into a front end service for adults. The otherthree sites adopted a more freestanding approach under social services management, but allarrangements have been subject to development’.
Some of the Care Direct pilots gave a specific reference to the importance of their work for socialinclusion/exclusion strategies. Among the key values and principles of the BournemouthCAREdirect partnership were:
• To improve the independence, inclusion and quality of life of older people in the Borough.
• To reach all the communities of older people in Bournemouth, recognising ethnic culturaldiversity and including isolated vulnerable older people traditionally marginalised.
The impact of government policy on social exclusion among older people
72
CAREdirect Bristol (2001) included the following in its set of aims:
• To provide a service which will actively reach out to ‘excluded’ communities.
In terms of the service’s scope in the initial pilot areas, Bebbington and Unell (2003a) report thatby the end of 2002 the service was well ahead of the first-year target of ten calls per 100 peopleaged 65 plus. Most calls are made in office hours. During the first year the out-of-hours service wasdropped apart from an answering service provided by NHS Direct.
Evaluating the success of NHS Direct and Care Direct in responding toolder people’s needsMeasures of success with these services include:
• Are older people aware of the existence of the services?
• Are there variations in service use among different groups of older people?
• Do the services bring into mainstream services people who would under use or be excludedfrom existing services?
The National Audit Office (2002b) has reported data on awareness of NHS Direct, showingvariation by age, ethnic group and social class. Levels of awareness peak among those 55-64 (at70%) but are lowest for those 65-plus (at 51%). There are two kinds of explanation advanced forthis finding. First, the lower acceptability of the service may reflect the desire of elderly people tohave face-to-face contact with their GP (National Audit Office, 2002b). This itself reflects the factthat NHS Direct is a service for responding to acute conditions, in contrast with the long-termillnesses about which older people are consulting their GP. This is also suggested by the importanceof NHS Direct in responding to parents calling on behalf of children, where a telephone servicemay be especially effective in dealing with worries about accidents or acute episodes of illness.Second, there is the argument that the technologies involved may create difficulties for somegroups of older people. Munro et al. (2001: 71) argue here that:
‘Although the [underuse of the service by older people] may reflect the greater experience andknowledge of older people in dealing with health and health care, it is also possible that itrepresents an increasing marginalisation of older people from accessing services through ‘newtechnologies’ such as the telephone, the web, email or digital TV. If health care policymakers are tocontinue to develop the role of such technologies in accessing the health service, and if thisapproach becomes more widespread…then an understanding of how this will impact on olderusers of services is urgent.’
Roland (2002:4) reinforces the last point in his brief survey of nurse-led telephone advice. Hemakes the point that: ‘As in other countries, [for example Australia and the US], most callers [tendto be] young adults or parents calling on behalf of children. There is concern that the increasinguse of telephone advice may disadvantage elderly and ethnic people, who find it less easy to usethe telephone.’ The evidence here is though contradictory. Bebbington and Unell (2003b: 4) in theevaluation of CARE direct comment that: ‘[The service] has confounded those who believe thatolder people will not use a telephone helpline service. About six enquiries out of seven are frompeople aged 60 or over, with a median age of 80.’ On the other hand, age may interact with otherdimensions such as class and ethnicity to limit use of telephone services. In the case of NHS Direct,awareness of the service is lower among ethnic minority groups (at 45%) and social groups D andE (49%, as against 61% for the population as a whole). It is likely that older people within thesegroups may have even lower levels of awareness about the kind of service NHS Direct can provide.
Review of policies
73
In the case of Care Direct, Bebbington and Unell (2003a) report data on types of users, satisfactionwith the service and general effectiveness. Their survey of 600 callers confirmed that callers, orthose ringing on someone’s behalf, tended to have a level of dependency higher than older peoplein general. A third of those calling on their own were aged between 80 and 89 years. Main reasonsfor contacting the service included money and benefits (around 33%), social care (around 19%),and aids and adaptation (around 16%). Just over half of all enquiries were dealt with fully in thecourse of a single call. The remainder involved a ring-back to the caller following a simpleinvestigation or, in some cases, a referral to another agency, with about one third resulting in newservices or support, or at least moves in that direction by the time of the survey. In the survey of600 callers, 83% thought that Care Direct had provided the help they needed. This led to action inone-half of all cases, either via a referral for new services or support (32%), or by the caller takingfurther action on their behalf or, in some cases, both (Bebbington and Unell, 2003a: 20).
As an example of the last finding, CARE Direct Devon (2003) report that their service is now closeto its capacity receiving between 100 and 200 calls a day, with 97% of callers either very or quitesatisfied with the service received. They note that over a nine month period the service helpedcallers claim more than £2 million in additional benefit:
‘[Devon] CARE Direct aims to resolve every call at the point of contact or if necessary will researchand telephone the caller back making referrals to other agencies on the caller’s behalf ifappropriate. Advisers are able to offer advice about care and support at home, home security andsafety at home, as well as keeping well, and maintaining healthy lifestyles. Many people havecommented on how convenient it is to have one contact telephone number to deal with andresolve such a wide range of issues.’ (CARE Direct Devon, Report of the Director of Social Services,July 2003)
Despite problems over particular topics such as advice on housing, Bebbington and Unell (2003a:20) conclude that Care Direct has performed well against the evaluation criteria of (a) meetingtargets for call volumes; (b) providing an accessible and appropriate service for users; and (c)providing core information about a defined range of services. They conclude that: ‘As it hasbedded down in the six sites, it has demonstrated its capacity to respond to a broader repertoire ofissues, work together with local agencies in partnership initiatives (such as fast track schemes foraids and adaptations) and develop new ways for its target users to connect with the service’.
Evaluating the success of NHS Direct and Care Direct in reducing socialexclusionThe extent to which a telephone-led facility promotes access to services – especially among userswho experience exclusion – has yet to be fully answered in the existing research. Customersatisfaction appears high – both for NHS Direct (Munro et al., 2001; Commission for HealthImprovement, 2003) and Care Direct (Bebbington and Unell, 2003a). But there are significantgroups of non-users. They are almost certainly drawn from those already disadvantaged within thehealth and social care system. George (2002) makes the point that: ‘Rather than reach people whoare currently failed by the health system, NHS Direct may have discovered previously unexpresseddemand among the worried and well middle-classes’. Efforts are being made to improve useamong older people, ethnic minorities and younger people (Commission for Health Improvement,2003), but detailed research on the success of these efforts has to be reported.
There is some evidence that callers may already be familiar to, or integrated with, the statutory andvoluntary sector. Bebbington and Unell (2003a: 19) report that in their survey of 600 callers, one-third were already in contact with social services, and a similar proportion already received adisability benefit’.
The impact of government policy on social exclusion among older people
74
On a more positive note, the evaluation of Care Direct does suggest this type of service can play arole in promoting independence among older people. This reflects the role of the service inimproving the range of information and advice available to older people; facilitatingmultidisciplinary working between health and social care; and providing additional support toinformal carers of older people.
Conclusions: impacts of NHS Direct and Care Direct on the socialexclusion of older peopleBoth NHS Direct and Care Direct are still relatively new services and hence further research will beimportant in assessing the value of telephone-based services for widening options for advice andassistance to older people. The evidence thus far suggests that they may play a valuable supportiverole to mainstream services in maintaining independence. Whether this applies to all groups ofolder people remains unclear. NHS Direct is probably under-used by very elderly people, but thismay reflect the service’s limitations for those with chronic – as opposed to acute – conditions.Certainly, the technology itself is unlikely to be the problem, given experiences with Care Direct.On the other hand, there is a concern that investments at this level - an annual cost of £90 millionin the case of NHS Direct and an initial allocation of £30 million to Care Direct – may simply widenthe choices for already well-informed consumers rather than assist those excluded or marginalisedfrom health and social services.
2:3 Older people and neighbourhoodrenewalNeighbourhood Renewal and New Deal forCommunities
IntroductionUrban renewal and neighbourhood regeneration represent major strands within policies to combatsocial exclusion. A national strategy for neighbourhood renewal was established in 2001, the aimof which was to tackle ‘the unacceptably bad conditions in this country’s poor neighbourhoods’(Social Exclusion Unit, 2001a). This policy built on reports from the Social Exclusion Unithighlighting the large gap between England’s most deprived neighbourhoods and the rest of thecountry. This particularly concerned joblessness, sub-standard housing, poor health and lowincomes. The trends highlighted indicated a growing separation between rich and poor areas,especially over the 1980s and into the 1990s:
‘Over this period, communities became less mixed and more vulnerable, with poor people morelikely to be concentrated in the same places. Places that started with the highest unemploymentoften also saw the greatest rise in unemployment. Health inequalities widened. The proportion ofpeople living in relatively low income households more than doubled between the end of the1970s and the beginning of the 1990s.’ (Social Exclusion Unit, 2001a)
The problems facing people in poor communities were summarised as follows in the NationalStrategy Action Plan (Social Exclusion Unit, 2001a: 17):
Review of policies
75
‘Poor services in deprived neighbourhoods compound the misery of living on a low income, withpeople who already have trouble making ends meet also facing higher prices in shops, worseschools, fewer doctors and higher rates of crime. This can be particularly problematic for especiallyvulnerable groups including older people, lone parents, disabled people, and black and minorityethnic residents.’
Strategies on neighbourhood renewal may be highly significant for older people given the waythey may be affected by population turnover, accelerating rates of crime, and a decline in thestandard of housing (Hannan Foundation, 2001; Hardill, 2003; Scharf et al., 2002; Phillipson et al.,2000; Newman, 2003). A high proportion of elderly people will be long-term residents with strongattachments to their area. The study by Phillipson et al. (2000) of older people in three urban areasfound respondents had lived at their current address for nearly 25 years. In the Bethnal Greendistrict of London, white respondents had lived in their house or flat for an average of 22.3 years.That figure was virtually identical to that which had been reported by Townsend researching in thesame district some 50 years previously.
In some areas length of residence will be considerably longer. In a study of Wolverhampton, nearlyone in four elderly respondents had lived at the same address for 40 or more years, eight % hadbeen at the same address for 50 or more years (Phillipson et al., 2000). Even in areas of highdeprivation (such as those in the study by Scharf et al, 2002), older people are likely to report astrong degree of identification with their community. In the Scharf et al. (2002) study of districts inLiverpool, Manchester and Newham, three out of four respondents identified positive featuresabout their neighbourhood, with most of these commenting on the presence of good neighbours,friends and family. More than three-quarters of respondents (78%) indicated that they had at leastone friend in their community or neighbourhood. Of those people with local friends, almost half(47%) had a chat or did something with a friend every day.
Against the above finding, it is also clear that older people are highly sensitive to changes withintheir neighbourhood. Compared with younger age groups they are more likely to report that thearea has deteriorated within the past two years (Neighbourhood Renewal Unit, 2003a); and toexpress feelings of insecurity and fear about crime (Help the Aged, 2002b). Also, with increaseddependence on the immediate locality for shops and services of various kinds, changes in thequality and level of local provision may create additional problems for older people compared withother age groups.
Policy developmentPolicy initiatives on regeneration involve both expenditure to improve services in deprived areas.This includes efforts to ‘bend’ public spending in favour of areas experiencing high deprivation,and specific initiatives to support and stimulate change to assist in ‘kick starting the renewalprocess’ (Neighbourhood Renewal Unit, 2003b). The most important of these include theNeighbourhood Renewal Fund, the Community Empowerment Fund, New Deal for Communities,and the Neighbourhood Wardens Programme (discussed in the section on Crime and SocialExclusion). Much of the work of the neighbourhood renewal programme – predominantly urbanthough with some rural areas – has focused on England’s 88 most deprived local authority areas.The aim of activity in these areas is to deliver ‘long-term sustainable improvements to people’squality of life – including economic prosperity, safer communities, high quality schools, decenthousing and better health’ (Neighbourhood Renewal Unit, 2003c). The means of achieving thisdraws together:
‘…not only most of the public services, but also business, voluntary and community organisations.Residents and communities are at the heart of this process, and the strategy put their needs at thetop of the agenda, taking a ‘bottom up’ approach rather than imposing solutions from above. Itsimportant that everyone has a chance to get involved – men and women, older people, andpeople with disabilities, children and young people.’
The impact of government policy on social exclusion among older people
76
The 88 areas of high deprivation are eligible for a share of a Neighbourhood Renewal Fund thatprovides £900 million over the period 2001-02 to 2003-4. This money is distributed through localstrategic partnerships (LSPs) which set priorities for their areas and develop renewal strategies to fitlocal needs. An additional £96 million funding stream, the Community Empowerment Fund andCommunity Chest, has also been set up to help neighbourhood groups to develop activitiesthrough local strategic partnerships. The intention of this fund is to strengthen the activities ofvoluntary groups operating in areas with a high level of deprivation.
Among targeted renewal initiatives, New Deal for Communities (NDC) is the biggest. It representssome £2 billion investment over ten years in 39 severely deprived areas. Launched in 1998, NewDeal for Communities is seen to be a means both of directly benefiting the 39 communities butalso as a test bed to develop policies that may be relevant for urban renewal policies moregenerally. The New Deal for Communities operates through neighbourhood partnerships,particularly with community organisations but also with the public, business and voluntary sectors.The work of the New Deal for Communities is being evaluated around five outcome areas: crimereduction, health, education, problems of worklessness, and environmental issues (includinghousing). A national evaluation team to monitor progress of the New Deal for Communities wasestablished in 2001 and is producing annual reports (see, for example, Neighbourhood RenewalUnit, 2003d).
Evaluating the impact of regeneration policiesIt is too early to assess the impact of regeneration policies on specific groups. Even for the initialgroup of 17 New Deal for Communities launched in 1998, 2001-02 was the first year ofprogramme implementation, and evaluation reports are still focusing on the collection of generalstatistics about the different areas (although the National Audit Office have produced an earlyprogress report). Even so, some specific points might be made about the place of older people inregeneration policies and the extent to which their needs are likely to figure in the implementationof particular policies. A cautionary note has been expressed by Riseborough and Sribjlanin (2000)who reviewed the impact of programmes such as City Challenge and the Single RegenerationBudget, as well as from initial evidence about the links established by the Better Government forOlder People Programme with regeneration issues. The research presented findings from a deskstudy of secondary material and conclusions from original research interviews with keyorganisations on older people’s involvement in regeneration.
The study by Riseborough and Sribjlanin (2000) took the view that older people were often‘invisible’ in regeneration policies, as illustrated by their absence in the work of regionaldevelopment agencies. Very few of the Better Government for Older People pilots had establishedlinks with themes connected with urban renewal. In some cases the problem was less the absenceof older people, more an underlying ‘ageism’ in the construction of policies:
‘Looking more closely at the benefits from regeneration for older people there is a tendency incurrent and previous regeneration bids to stereotype older citizens. For example, older people arementioned only as service recipients, victims or are referred to largely as people who needed to be“cared for”, particularly in early SRB bids…It would be extreme to say that older people are castonly as recipients and victims but the tendency to depict them in this way is noticeable inregeneration plans and bids. It is also likely that these roles are accepted and even suggested byolder people themselves in some localities. However, the evidence suggests that experience ofageism and the effects on older people that lead them to internalise ageist stereotypes is notunderstood or recognised by most partnerships. Also, although an increasing proportion ofpartnerships work with and directly employ community workers, the work that there is with allsections of the community and all age groups, is relatively rare.’
Review of policies
77
The research’s conclusion was that older people had been at best marginalised in regenerationpolicy and practice and at worst excluded. This assessment was largely on the basis of policiesthrough the 1990s. The crucial test will be whether the community-focused approach adopted inNew Deal for Communities and neighbourhood renewal more generally is able to be inclusive ofall age and social groups.
There is limited information at present to assess whether older people have achieved greatervisibility in regeneration and renewal policies. What evidence there is suggests that partnerships –such as those associated with New Deal for Communities – will need to work hard to ensure thatolder people are fully involved. A surprising finding from the 2002-03 report of the nationalevaluation of New Deal for Communities was that levels of trust in NDCs were lowest among theover-65s and highest among 16-24 year olds (Neighbourhood Renewal Unit, 2003a). The AnnualReview of the New Deal for Communities for 2001-2002 (Neighbourhood Renewal Unit, 2003d)highlights a range of initiatives under development of relevance to older people.
However, the evaluation reports published thus far give relatively limited attention to age incontrast with other social and cultural factors influencing neighbourhoods. Also, there is stilllimited evidence that to quote the study from Riseborough and Sribjlanin (2000: 22): ’ …thepotential to use the community development expertise of older people’s organisations, and olderpeople’s experience from [neighbourhood projects] has…percolated through into regenerationpractice as a whole’.
A further concern is that older people are still – despite the lessons from research – being treated asone group within regeneration policies. That is despite the vast needs of the over-80s in contrastwith those in their 60s; differences between women and men; and contrasting needs of elderlypeople in different ethnic groups.
Older people are also likely to have different perspectives and concerns when contrasted with otherage groups. In comparison with younger age groups they are likely to have lived in the samecommunity for much of their lives. In the 39 New Deal for Communities areas, 43% of residents –taking all age groups – had lived in the locality for less than five years; only 22% had lived inthe area for more than 20 years, with most of these being elderly people. The Scharf et al (2002)study of localities with similar characteristics to those of the New Deal for Communities found 79%of older people had lived in their neighbourhood for 20 years or more, and 47% had been in thearea for 40 or more years.
On the above evidence it is not surprising that older people are more likely when compared withyounger groups to view the community as having deteriorated over the years. They are more likelyto have a historical basis for making an assessment. But they are also likely, as the research reviewat the beginning demonstrated, to have a significant attachment to their neighbourhood. Thisaspect could be turned into a positive force for change in the field of urban regeneration.
Conclusions: impacts of neighbourhood renewal policies on the socialexclusion of older peopleThese are still relatively early days in respect of judging the effectiveness of neighbourhood renewalpolicies. It is certainly not too late to ensure that older people become more directly involved inshaping renewal strategies at a local level, and that the impact of this is measured more directly inproject evaluations. It will be essential, however, that New Deal for Communities and similarprojects give fuller acknowledgement of the differences between older people and other agegroups, as well as differences within the older population.
The impact of government policy on social exclusion among older people
78
Also, it will be important to develop a clearer view of how elderly people are affected byurbanisation as an economic and social process. It will also be essential to clarify how regenerationpolicies can contribute directly to improving the quality of life in old age, with urban living beingseen as a positive rather than negative force in the lives of older people.
Home Improvement AgenciesDescription of policyHome Improvement Agencies (HIAs) are mostly small, not for profit organisations that assistvulnerable homeowners or private sector residents who are elderly, disabled or on low incomes, torepair, improve, maintain or adapt their homes. Home Improvement Agencies are also referred toas ‘Care and Repair’ agencies or ‘Staying Put’ schemes.
Scope of Home Improvement AgenciesHome Improvement Agencies started to receive central government funding from April 1987, andthis has gradually expanded. By 1999, a total of £5.2 million was helping 192 Home ImprovementAgencies. From April 2001, a new funding scheme began for three years, with a total of £8.5million helping 235 Home Improvement Agencies. From April 2003, all Office of the Deputy PrimeMinister funding will be paid to Home Improvement Agencies via the Supporting Peopleprogramme.
An important element of Home Improvement Agencies funding is that central funding is onlyprovided if it is matched by other funding sources, such as housing and health authorities, orcharities.
Home Improvement Agencies help eligible people carry out a range of improvements, from smallrepairs to major renovation or adaptation. Tasks range from fitting new locks to installing a newdownstairs bathroom. The actual tasks are funded from local authority grants, charities, the SocialFund, client’s savings and loans and equity release.
Many Home Improvement Agencies have developed services in addition to their ‘core ‘ service.Some of these include: handyperson schemes; ‘home to hospital’ schemes; gardening schemes;improving home security; energy efficiency improvements and approved builders’ lists.
Home Improvement Agencies exist in a changing policy environment. On one level, they areincreasingly part of a strategy to encourage private sector renewal, through local authority-ledhousing strategies. On another level, they are also a part of the Supporting People initiative. Atboth these levels, there is a lot of change in both policy and operating contexts. Also, there is anincreasing emphasis on equity release as a key mechanism for financing private sector renewal, anda changing system of available grants.
Research on Home Improvement AgenciesThere is relatively limited evidence available in relation to the overall impact of Home ImprovementAgencies. The most wide-ranging evaluation of their work was done at Bristol University in the late1980s to evaluate the pilot programme. There have been studies about particular initiatives, forexample, handyperson services and hospital discharge support. Often these are advocacydocuments rather than genuine critical evaluations.
Review of policies
79
Evaluating the success of Home Improvement AgenciesHome Improvement Agencies have been seen as successful in helping older people access a rangeof funding sources, for home improvements, and supporting them through the process. Theycontinue to receive central government funding, and a recent review by the Office of the DeputyPrime Minister (2003) emphasised their importance to both Supporting People agenda and privatesector renewal.
However, Home Improvement Agencies are relatively small scale operations, and are reliant onexisting grants available from the local authority and others. Two-fifths (40%) of HomeImprovement Agencies completed less than 90 jobs in 2001-2002, while 60% completed morethan 90 jobs. There are some key constraints on Home Improvement Initiatives, such as a lack of:branding; visibility to the public; capacity and funding; set service standards; and co-operationbetween managing agents.
Poor housing is an important risk factor for social exclusion. Most of current housing disrepair andunfitness exists in the private sector stock with older people more likely to be occupants of thispoor housing (Foundations, 2002).
There is evidence that Home Improvement Agencies can reach vulnerable clients (Foundationsfactsheet 2). The national co-ordinating body proposes that:
• three quarters of Home Improvement Agency clients are on £75 a week or on a means-testedbenefit;
• many agencies help clients take-up benefits. One agency added an average increase to theirweekly income of £44.60. Another claimed an additional £44,000 for their clients over a yearperiod.
Many older people in poor housing face other barriers to improving their housing situation:
• Cost. Most owners have no long-term maintenance plan or specific financial provision forfuture repair costs. Do-it-yourself work is not an option for many older people. People arereluctant to borrow money for building work, especially repairs. For low-income householdswithout savings, emergency repairs pose special problems, and the job is often botched orneglected.
• People sometimes delay tackling work because they cannot find a builder they can trust orbecause of the disruption involved.
• There is some lack of awareness of problems of the technical issues involved, especially forthose on low-incomes and older people.
Home Improvement Agencies play an active role in helping older people overcome these barriers.
The agencies also have an important part to play in the health and social care agenda. Housingimprovements can help improve health – for example through helping to prevent falls and coldrelated illnesses. They have also helped with discharge from hospital, and provide welfare benefitsadvice.
Theoretically, it appears that Home Improvement Agencies can help reduce social exclusion. Theydeal with vulnerable older people to improve their housing situation, which can have importantimpacts on their well-being and health. In addition, they can help to access grants and builders, ina way that many vulnerable older people would find difficult to do.
The impact of government policy on social exclusion among older people
80
Conclusions: impacts of Home Improvement Agencies on the socialexclusion of older peopleHealth Improvement Agencies appear to have an important role in reducing social exclusion in anumber of ways. That is especially so in terms of their helping to ensure the success of the privatesector renewal strategy. However, their effectiveness could be limited by partial coverage andmodest capacity.
2:4 Crime, social exclusion and older peopleIntroductionIssues about the experience and fear of crime form an important part of policies to combat socialexclusion. Worries about crime and fear of victimisation may have an important impact on thequality of daily life in old age, and this may be especially the case in areas of high socialdeprivation. The Home Office has set targets for reducing fear of crime (see Department for Workand Pensions, 2003c). Surveys of the extent of crime experienced by older people, drawing on theBritish Crime Survey, are now available (Chivite-Matthews and Maggs, 2002). At the same timepressure groups and charities have identified fear of crime as a major concern for different groupsof older people (Help the Aged, 2002b, 2002c).
Discussion about crime in relation to older people should be placed within the context ofimportant variables against which the impact of policies must be measured. Research evidencesuggests that age itself is less important than other variables in producing worries and fears aboutcrime. These include gender, past experiences of abuse and violence, and geographical location,.Help the Aged (2002c), in their report Older People and Fear of Crime, note forthcoming researchfrom Chadee and Ditton which found that when respondents’ ages were banded into ten-yearintervals, neither fear of property crime nor fear of personal crime increased progressively throughthe different age groups. If anything, the very old were the least afraid, at least in relation toproperty crime. On the other hand, gender does appear as an important variable. For example, inthe 2000 British Crime Survey 26% of women aged 60 and over, reported being very worriedabout being mugged, compared with 12% of men in this age group. In relation to being physicallyattacked, the comparable figures were 23% for women and 8% for men (see, also, Scharf et al.,2002).
The community/place dimension may also play an important role in experiences and fears aboutcrime. Successive reports from the British Crime Survey have shown that those living in inner cityneighbourhoods tend to report low levels of safety when compared with groups from other typesof areas (see also Silverman and Della-Gisutina, 2001). Scharf et al. (2002) confirmed this finding intheir study of older people living in areas of high deprivation. The 2001 British Crime Surveyemphasised that older people were much less likely to experience physical assaults than people inother age groups. Just 1% of adults living in households headed by a person aged 60 and over hadbeen a victim of violence in 1999 and 2000, compared with a figure of 3.9% of all households. Thestudy by Scharf et al. (2002) reported a significantly higher risk level in deprived urban areas with15% of older people having either experienced an assault or had something they were carryingstolen from them.
Feelings about crime may additionally reflect negative experiences encountered at different pointsacross the lifecourse. One survey (cited in Help the Aged, 2002c) found that middle-aged andolder women reported a slightly higher rate of violent attacks over a lifetime when compared withyounger women in the survey: ‘The research concluded that experiences of violence andharassment have an important and cumulative bearing on contemporary fear of crime, regardlessof when these experiences occurred within an individual’s lifespan. They can have the effect of
Review of policies
81
heightening older women’s perceptions of their personal risk, especially outside the home… This isparticularly true of older women who are in poor health and live alone on low incomes in deprivedareas’ (Help the Aged, 2002c:22).
Finally, health factors will also be a significant factor in relation to expressions of insecurity and fearof crime. Poor health may result in some older people feeling less able to defend themselves orbeing more vulnerable to physical attack. The British Crime Survey confirms that for all age groupsthose that perceive their health to be poor or very poor also tend to report higher levels of fear. Inthe case of older people, 32% of those 60 and over in bad/very bad health report being worriedabout being mugged, compared with 17% of those saying they were in fair/good/very goodhealth. Equivalent figures for worries about physical attack were 24% and 15% (Chivite-Matthewsand Maggs, 2002).
From this brief summary of the research literature it is clear that a range of factors associated withsocial exclusion may contribute to fears about crime. Hough (1995), from his analysis of the 1994British Crime Survey, summarises these as: ‘…being female, aged over 60, an inner city resident, inpoor health, aware of local disorder and having a neighbour who has been mugged…[all thesefactors] were all strongly associated with feeling unsafe’. Scharf et al. (2002:61) conclude that:‘While the majority of older people are not recent victims of crime, there are substantial numberswho have experienced serious types of crime. Our research points to the fact that not only areolder people fearful of crime in deprived areas but that they are justified in many of their anxieties’.
There is some evidence, albeit based on small samples, that where older people are subject toburglaries then the impact can be especially severe. Research by Donaldson (2003) under theReducing Burglary Initiative found that elderly victims of burglary decline in health faster than non-victims of similar age. In this particular study, covering sheltered housing tenants, two years afterthe crime had occurred, they were 2.4 times more likely to have died or to be in residential carethan their non-burgled neighbours.
Policies to reduce crime and fear of crimeTackling older people’s fear of crime is complex given the range of underlying factors such as poorhealth, low income and area deprivation. Crime reduction has occupied an important part ofgovernment social policy with the Crime Reduction Programme (CRP) focusing on burglary,targeted policing, CCTV, national initiatives, early interventions in the lives of those at risk ofoffending and domestic violence (Curtin et al., 2001). Policies that have been targeted atvulnerable groups such as older people include:
• The Reducing Burglary Initiative, £32 million has been targeted at neighbourhoods thatexperience high burglary rates with the aim of developing ‘innovative burglary reductionstrategies’ (Kodz and Pease, 2003).
• Neighbourhood Wardens: A Neighbourhood Warden Unit based in the ODPM (formerlyDETR) has been established with £18.5 million (2000-04) to support existing NeighbourhoodWarden schemes and help get new ones going (Social Exclusion Unit, 2001b).
• Locks for Pensioners: Complementing the DETR’s Home Energy Efficiency Scheme, theCrime Reduction Programme included £8 million to be spent on improving security for low-income pensioners in local authority areas that had burglary rates above the national average.
The impact of government policy on social exclusion among older people
82
• The Distraction Burglary Task Force. This was created by the Home Office in 2000, thishas had a particular focus on examining ways of reducing the vulnerability of older people todistraction burglary. These are those where the offenders trick the victims into letting theminto their home.
Before examining the impact of some of these policies, general trends regarding crime in relationto older people will first be reviewed.
Trends in crime affecting older peopleThe Government has set a target of reducing the ‘proportion of older people whose lives areaffected by fear of crime’ (Department for Work and Pensions, 2003c) using 1998 as the baselineyear. In 1998, drawing on data from the British Crime Survey, 10% of those 60 and over said thattheir life was greatly affected by crime. By 2002-3 this figure had dropped to 8%. For men thetrend was relatively stable throughout this period, with a high of 7% and a low of 6% in successiveyears from 2000-1. The trend for women showed a decline from 14% in 1998, to 9% in 2002-3.
The analysis of British Crime Survey (BCS) data by Chivite-Matthews and Maggs (2002) covers aten-year period from 1991 to 2001. Their analysis suggests that at least in the 1990s theexperience of crime among people 60 and over remained more or less constant – 12% to 14%from 1991 to 1999. In comparison with other age groups, older people’s risk of suffering from ahousehold or personal crime is generally much lower. Also, taking 1995 as a baseline there hasbeen a downward trend for key areas such as risk of vandalism, risk of burglary, and risk of vehicle-related thefts.
Generalised worries about different aspects of crime demonstrate a pattern of decline over theperiod 1992 to 2001. In 1992, 22% of women 60 or older were ‘very worried’ about burglary. Thisfigure rose to 25% in 1996 but has since declined to 18% in the 2001 BCS. The figures for menshow a drop from 18% very worried in 1996, to 13% in 2001. These trends are not confined toolder people but are consistent across all age groups. On the other hand, the extent to which olderpeople are ‘very worried’ about being mugged has remained unchanged at 18% across the period1992 to 2001. Women are more likely to express fears about being mugged in comparison withmen, although the per cent reporting being ‘very worried’ has declined at least since 1996 from26% to 22% in 2001.
If there is some evidence for a moderation in fears about crime, this appears less true of olderpeople’s feelings of safety in their immediate environment. Among women aged 60 and overaround one in three report feeling ‘very unsafe’ out at night. British Crime Survey data found 33%reporting this in 1994 with an identical figure being found in 2002-03 and little fluctuation in theintervening years. The figures for older men are much lower – at around one in ten saying they feel‘very unsafe’. Income plays a mediating role influencing feelings of safety: 36% of women inhouseholds with an income less than £10,000 report feeling very unsafe; the comparable figure forhouseholds with more than £10,000 a year is 22%. These figures are well in excess of other agegroups and confirm that for many older people their immediate locality is virtually a ‘no go area’by late afternoon.
Such findings from a general population of older people should be seen in the context of theresults from the study by Scharf et al. (2002) of older people in areas of severe deprivation. Here,the proportion expressing that they felt unsafe in moving around their community was muchhigher than in the British Crime Survey. The study found that most older people would feel unsafeif they had to go out alone in their neighbourhood after dark. Two-thirds of respondents wouldfeel either a bit unsafe or very unsafe under these circumstances. Very few people, 7% would feel
Review of policies
83
very safe when out alone after dark. Another important finding from this study was that bothgender and age were strongly associated with feelings of neighbourhood safety: 56% of womenreported that they would feel very unsafe if out in their neighbourhood after dark, compared with28% of men. In respect of age, 57% of those 75 years and over felt unsafe compared with 38% ofthose aged 60 to 74 years.
In contrast with the world outside, the home environment – at least on the basis of the BCS andstudies such as those by Scharf et al. (2002) – appears much more secure. In the 2000 BCS, 90%of respondents 60 and over reported feeling very or fairly safe when alone in their homes at night.In areas of high deprivation the figure is virtually identical at 87%. Nonetheless, even in the Scharfet al (2002) research 16% of women felt either a bit (11%) or very (5%) unsafe in their homes atnight. These figures are worrying given the projected growth in the population of older peopleliving alone and in particular that of very elderly women.
Evaluating the success of policy initiativesIn overall terms the research evidence seems to be pointing to a general moderation in worriesabout crime among older people. This change can be clearly identified as taking place from themid-1990s onwards. But it is difficult to isolate the precise factors that may have influencedchanges among older people, and whether they are different to those which appeared to haveaffected all age groups. Also, more general economic and social changes may also impact on crimetrends – both positively and negatively. On the other hand, the difficulties confronting those indeprived areas and elderly women living alone appear to have persisted for much of this period.Some of the issues raised by these groups have been covered in specific initiatives such as theReducing Burglary Initiative (RBI), funding for Neighbourhood Wardens and work in the area ofDistraction Burglary.
The first round of the RBI, funded 63 Strategic Development Projects (SDPs). The projectswere located in neighbourhoods that had experienced at least twice the national recordeddomestic burglary rate for each of the previous three years. A key aim of the RBI was to find outwhat burglary reduction strategies work best and in what type of area (Kodz and Pease, 2003). Theprojects themselves were encouraged to develop a range of innovative burglary reductionstrategies. Early reports on this initiative suggest some success in reducing burglary levels. Kodzand Pease (2003) report that 21 months after the launch of the RBI, burglaries declined in 55 SDPsby 20% compared with the pre-project period. The net reduction in burglaries was 7% in the SDPareas, when taking into account burglary reduction in the comparison areas.
From the reports covering individual projects in Birmingham (Stirchley), Sandwell, Solihull andRochdale, it is clear that much of the work has been highly relevant in tackling crime experiencedby older people. Some examples here include: free personal attack alarms for certain groupsdeemed vulnerable to burglary – such as the elderly or women living alone (Rochdale); targethardening vulnerable properties including OAP bungalows (Solihull); and environmental changesto protect neighbourhoods from burglary (Birmingham).
Work from the RBI has also been useful in clarifying the circumstances by which older people maybecome vulnerable to burglary even though on national statistics they are at less risk than otherage groups. Curtin et al (2002:3) in a report on examples from local crime reduction partnershipsdraw on Tilley et al’s (1999) notion of: ‘… ‘’virtual’’ communities of individuals sharing commonsocio-demographic characteristics but who do not necessarily live within a tight geographicallocation’. An interesting finding from their work in identifying populations at risk, concernedproblems facing elderly people living in small sheltered accommodation developments: ‘They werefound to be at high risk, notwithstanding the nationally lower than average burglary risk faced byolder people. The suggestion from this area was that the crucial factor was the grouping [together]
The impact of government policy on social exclusion among older people
84
of vulnerable victims’ (see, also, Donaldson, 2003). The resulting project aimed to reduce domesticburglary in the virtual communities identified by 25% within 12 months of commencement. Targethardening of the homes of older people was a key approach adopted by the project.
Neighbourhood Warden Schemes have been the subject of research reported by Jacobson andSaville (1999) and the Neighbourhood Renewal Unit (2004). The argument for such schemes wasput forward in the Social Exclusion Unit (1998) report Bringing Britain Together (1998) where it wassuggested that: ’ … some problems associated with crime and fear of crime can be tackled throughthe presence of a full-time, recognisable “warden” with the capacity to take preventive actionagainst crime and disorder and provide general assistance to residents’ (see, also, Social ExclusionUnit, 2001b). Jacobson and Saville (1999) studied 49 schemes, the majority of which had thefollowing core objectives to their work:
• Crime prevention – reducing levels of crime, anti-social behaviour and fear of crime.
• Environmental improvements – including the removal of litter and graffiti, improving theappearance and general state of repair of properties and public areas.
• Community development – involving, for example, the promotion of community solidarityand confidence in local agencies, and intolerance of crime and disorder.
From their review Jacobson and Saville (1999: vii) conclude that: ‘The emerging evidence…doessuggest that warden schemes can help to address many of the problems faced by deprivedneighbourhoods. It appears that schemes often in conjunction with other local crime preventioninitiatives, can contribute to bringing down levels of crime and fear of crime. Research undertakenon behalf of the Neighbourhood Renewal Unit (2004) found that wardens were especiallysuccessful at reducing fear of crime among older people. Warden schemes that encompassenvironmental and community-based aims, together with crime prevention elements, appear tohave the potential to reverse the social and physical decline of poor areas. In drawing in the skills,expertise and goodwill of a variety of local individuals and agencies, many schemes engage inconstructive and wide-ranging partnership activities which have tangible impacts on lives’.
At the same time, it remains unclear whether the positive impact on localities is long-lasting, andwhether it benefits some groups more than others.
Another important area of work has emerged from the Distraction Burglary Task Force formedin April 2000. The aim of the Taskforce was ‘to tackle distraction burglary and thereby improve thequality of life of vulnerable communities through a co-ordinated national partnership initiativewithin England and Wales’ (Thornton et al, 2003: i).14 A wide range of partners have been involvedin the taskforce including the police, local authorities and agencies, utility companies andorganisations with responsibilities to deliver services to older vulnerable people.
White older adults are assumed to be the prime targets of distraction burglary. Police statisticsshow some 19,400 recorded distraction burglary offences in 2001-2 (Thornton et al., 2003).Thornton et al. (2003) identified risk factors for those vulnerable to distraction burglary including:problems with mobility and activities of daily living; receiving more visits from professional carersthan from friends; receiving fewer regular visitors. Environmental risk factors included: neglectedgardens and outside maintenance; surrounding houses being in poor condition; front door notbeing visible to the street or neighbours. This report made recommendations aimed atprofessionals working with victims of distraction burglary, both in relation to raising awareness andreducing vulnerability (Thornton et al., 2003: 52-55; see, also, Home Office Development andPractice Report No.11).
Review of policies
85
14 The Distraction Burglary Task Force includes members from voluntary sector organisations such as Age Concern andHelp the Aged.
Help the Aged conducted an NOP Survey in 2003 to explore the extent to which older people areat risk from distraction burglary or ‘bogus caller crime’. Among the findings of this study were:
• over a twelve month period some 300,000 older people had been potentially approached bysuspicious callers;
• an estimated 180,000 of these incidents resulted in entry;
• approximately 122,000 people had money/possessions stolen;
• 51% of older people fail to report bogus caller incidents to the police;
• 42% of people aged 60 and over are unaware of campaigns aimed at raising public awarenessof doorstep etiquette to prevent distraction burglary;
• 25% of older people open the door without employing any precautions;
• 23% of women aged 60 and over worry every time they answer the door to unknown callers.
Some of the recommendations from this work include:
• the need for police forces to encourage older people to report bogus caller incidents;
• the potential role of neighbourhood wardens in publicising this type of crime;
• the importance of awareness campaigns directed at the problem of distraction burglary.
Conclusions: impacts of policies to reduce crime and fear of crime onthe social exclusion of older peopleIt is difficult from this review to trace particular factors that might have influenced trends relatingto crime experienced by older people. Clearly, general worries appear to be on a downward trend,as are experiences of problems such as physical violence, mugging and burglary. On the otherhand, there is still a significant problem relating to the fears that older people have about movingaround their neighbourhood after dark. This particular fear has proved fairly resistant to changeand is at a level that appears well in excess of other age groups, especially in high deprivationneighbourhoods.
A cautionary point is that existing crime surveys may overestimate the fear of crime, particularlyconcerning the frequency with which citizens feel fearful. Farrell and Gadd (2003) have tested newsurvey questions in this area which attempt to measure changes in the fear of crime over time. Incontrast with existing research suggesting that about a third of UK citizens were ‘very’ or ‘fairly’worried about the fear of crime, their study found that only some 15% had felt ‘very’ or ‘fairly’fearful in the last year, and of these only 8% felt so frequently. It remains unresolved, however,whether particular age/cohorts are more vulnerable to crime – especially those in their 70s and 80sand over, and women in particular.
A further difficulty in interpreting trends on crime and older people is that detailed studiesexamining particular groups within the older population have yet to be carried out. The study byChivite-Matthews and Maggs (2002) while a valuable review of the BCS on older people, has alimited range of comparisons within the population aged 60 and over. It would be helpful in thisregard to have more studies focusing on:
The impact of government policy on social exclusion among older people
86

• the experience of crime suffered by those 85 and older (mainly women);
• older people living in areas subject to significant population turnover (which may be a crucialvariable in respect of vulnerability to crime);
• those in poor health or who experience particular types of disability.
Review of policies
87
CHAPTER 3: ConclusionThis review has drawn on a wide range of evidence in order to assess the degree to whichgovernment policy has impacted on older people who are potentially vulnerable to forms of socialexclusion. Given the diverse nature of Britain’s older population, the review has adopted a broadconceptualisation of social exclusion in order to accommodate the range of ways in which olderpeople may experience marginalisation from social and economic life. However, a lack ofappropriate scientific evidence has meant that it is not always possible to assess the impact ofgovernment policy on particular groups. In this respect, there is a clear and urgent need for thepolicy and research communities to generate additional evidence relating to the circumstances ofolder people judged vulnerable to various forms of exclusion.
Taking the evidence reviewed in this report, what have been the strengths and limitations ofgovernment policy in the field of social exclusion and older people? To answer this, we need to goback to the drivers of exclusion discussed in Section One, namely, age-related characteristics,cumulative disadvantage, community characteristics, and age-based discrimination. Akey finding from our work is that the evidence suggests greater success in the first and last of thesein comparison with the second and third.
• Taking the age-related area, government policy can claim a number of successes.Particularly noteworthy, for example, have been the reduction in the proportion of olderpeople on absolute low incomes; the stabilisation/reduction in the proportion of pensionersexperiencing relative poverty; the enhanced support for people with high levels ofdependency; and the securing of innovations in the field of community care. All of these gainsmight be said to modify or reduce some of the pressures affecting people as they move intotheir 70s and beyond: for example, pressures that arise through the loss of income associatedwith retirement; problems stemming from chronic health conditions; and problems linked tothe impact of changes associated with life course transitions.
• In contrast, social exclusion arising from cumulative disadvantage through thelife course appears more resistant to change. The proportion of those on persistentlylow incomes has remained almost constant since the early 1990s. This suggests a hard core ofolder people who have probably encountered poverty at points throughout their life, and whogo on to experience high levels of deprivation in old age (Scharf et al., 2002). These are alsothe groups who fail in large numbers to claim means-tested benefits. Low expectations and alack of awareness of services (a product of cohort-rather than age-related differences) havepartly been addressed in the community care reforms and through innovations such as NHSDirect and Care Direct. But even here it is noticeable that key groups continue to excludethemselves, and that the ‘service-rich’ probably do considerably better than the ‘service poor’in utilising service innovations.
• Problems arising from community change remain a significant driver leading tosocial exclusion in old age. Some successes have been recorded with initiatives such asNeighbourhood Wardens, the Reducing Burglary Initiative, and individual projects under NewDeal for Communities. However, there is no clear evidence that the needs of older people arebeing given systematic attention in urban regeneration schemes. Areas characterised by highpopulation turnover and economic deprivation remain an important driver leading toexclusion in old age. This is reinforced where feelings of insecurity produce restrictions on dailyliving. While worries or fears about particular crimes may have receded, concern about the‘unsafe’ nature of urban communities remains high and may limit older people’s involvementin a range of activities.
88
• Measures designed to tackle age-based discrimination have been extensive andare beginning to produce a cultural shift in perceptions of older people. In somerespects this is not an easy target to measure and systematic evidence on the impact ofpolicies has yet to be collected. Moreover, some of the most significant policies designed tochallenge ageism (such as the National Service Framework) are still at an early stage ofassessment. But the range of activity is impressive, notably through the activities promoted byBetter Government for Older People, a number of community-based activities in Health ActionZones, work in the area of community care, and the development of a range of policiesaround older people and pensions in the Department for Work and Pensions.
Further research on all of the above areas is undoubtedly required. In particular, more research isneeded exploring the relationship between particular policies and their impact or otherwise onsocial exclusion in old age. While acknowledging the limitations of available research, however, theconclusion of this report is that the impact of policies on social exclusion has been uneven.Government policy has been stronger in tackling certain types of problems which cluster in oldage, and in challenging myths and stereotypes about older people. It has been less able to mitigatethe effects of inequalities which are carried through into old age and which reflect the impact ofcumulative disadvantage experienced over the life course. In addition, policy has been lesssuccessful – at least on the basis of current evidence – in limiting problems that arise fromcommunities affected by economic decline and high rates of population turnover.
Arising from these conclusions, we would suggest three types of policy development that might beimportant to consider:
• Policies that monitor the impact of new types of poverty and social exclusionwhich emerge in old age against which existing policies may prove inadequate. Totake two examples: first, at the current time there is the challenge of a substantial cohort ofpeople entering late old age who were part of the large groups swelling the ranks of the earlyretired in the 1970s and 1980s (Phillipson, 2002). Laczko (1990), for example, raised thepossibility that this group would represent the ‘new poor’ in the pensioner population and theextent to which this has emerged requires further investigation. Second, there is the genderednature of poverty in old age, highlighted in recent work by Arber and Ginn (2004). They giveparticular emphasis to the difficulties facing divorced women, who have no prospect ofinheriting a widow’s pension and who are much less likely than men to receive a privatepension. Each of the above groups will require attention in order to prevent newforms of social exclusion emerging over the next few years.
• Policies in the field of community care need to be broadened to embrace moreeffectively the social exclusion agenda. The extent of change in community care hasbeen extensive over the past ten years, with many forms of service innovation. Our reviewsuggests however a case for widening the scope of this work and extending the ambitions ofcare in the community. Tessa Harding’s point (1999) is important here: much communitycare remains built around ‘survival needs’ rather than moving older people intomainstream activities. This is further reflected in the continuing difficulties in ensuringeffective user-involvement and empowerment. Reports from the Social Services Inspectoratedo suggest that a cultural change is beginning to take place in Social Services Departmentsand elsewhere, but this work still needs to be more firmly tied to a view that promotingsocial inclusion is an integral part of community care practice.
• A third issue is that, in all areas, certain groups remain excluded still from keyservices and benefits. This applies, for example, to some minority ethnic groups, somegroups with mental health problems, people living in rural areas, and some groups withcertain forms of disability. The qualifications here are significant. The debate needs to move onfrom blanket descriptions of all individuals covered by these labels being affected by socialexclusion in some form or another. Rather, the variations are considerable, though as yet only
Conclusion
89

superficially grasped by policy or research. Too many reports tend to assume, to take oneexample, that all minority groups are equally deprived in respect of income or services. But thedifferences are immense, reflecting variations in migration histories, cultural factors,community-based issues, and economic factors. The next phase of the social exclusiondebate needs therefore to acknowledge the complex differences between groupsand the implications of this for new forms of exclusion in old age.
The impact of government policy on social exclusion among older people
90
REFERENCES
6, P. (1997) ‘Social exclusion: Time to be optimistic’, Demos Collection, 12, January 1997: 3-9.
Adams, L. (2001) ‘Poverty and Social Inclusion’. Advancing Health Together: 60 examples of innovativepartnerships from Health Action Zones across Yorkshire and Humber. Published by the 6 Health Action Zones ofYorkshire and Humber with support from the Department of Health,http://www.haznet.org.uk/hazs/hazmap/h_leeds.asp#publications
Age Concern (2000) Memorandum submitted by Age Concern England (HB15), Social Security Committee,Appendices to the Minutes of Evidence, Appendix 12, House of Commons, London, Stationery Office.
Age Concern (2001) The UK Fuel Poverty Strategy, Age Concern England, London.
Age Concern (2003) Changes to Pension and Benefit Payments, Information Sheet 16, April 2003, Age ConcernEngland, London.
Arber, S. and Ginn, J. (2004) ‘Ageing and Gender: Diversity and Change’, in Social Trends 34, Office forNational Statistics, Stationery Office, London: 1-14.
Arksey, H., Hepworth, D. and Qureshi, H. (2000) Carers’ Needs and the Carer’s Act: An Evaluation of the Processand Outcomes of Assessment’. York: SPRU.
Askham, J. (1995) Social and Health Authority Services for Elderly People from Black and Minority EthnicCommunities. London: HMSO.
Audit Commission (1997) The Coming of Age: Improving Care Services for Older People. Audit Commission,London.
Audit Commission (2000) Forget Me Not: Mental Health Services for Older People. Audit Commission, London.
Audit Commission (2002) ‘Forget Me Not’ 2002: Developing Mental Health Services for Older People, AuditCommission Update, Audit Commission, Wetherby.
Bainbridge, I. and Ricketts, A. (2003) Improving Older People’s Services: An Overview of Performance. London:Social Services Inspectorate.
Barnard, H. and Pettigrew, N. (2003) Delivering Benefits and Services for Black and Minority Ethnic Older People’,Research Report No. 201, Department for Work and Pensions, Corporate Document Services, Leeds.
Barnes, M., Bauld, L., Benzeval, M., Judge, K., Killoran, A., Robinson, R., Wigglesworth, R. and Zelig, H. (1999)Health Action Zones: Learning to Make a Difference. Health Action Zone National Evaluation Team, PSSRU.
Bauld, L. and Judge, K. (1999) National evaluation of Health Action Zones: Evaluating Policies to TackleInequalities in Health: The Contribution of Health Action Zones. Health Action Zone National Evaluation Team,PSSRU, University of Kent at Canterbury for the Department of Health.
Bauld, L. and Judge, K. (2002) Learning from Health Action Zones. Chichester: Aeneas.
Bauld, L., Chesterman, J., Davies, B., Judge, K. and Mangalore, R. (2000) Caring for Older People: AnAssessment of Community Care in the 1990s. Aldershot: Ashgate.
Bebbington, A. and Unell, J. (2003a) ‘Care Direct: An Integrated Route to Help for Older People’. GenerationsReview 13, 3: 18-21.
Bebbington, A. and Unell, J. (2003b) ‘Evaluation Report’. Care Direct Evaluation Newsletter 3: 4-6.
Blakemore, K. (2000) ‘Health and Social Care Needs in Minority Communities: An Over-problematised Issue’.Health and Social Care in the Community 8, 1: 22-30.
Blakemore, K. and Boneham, M. (1993) Age, Race and Ethnicity, Open University Press, Buckingham.
Boaz, A., Hayden, C and Bernard, M. (1999) Attitudes and Aspirations of Older People: A Review of the Literature.London: Department of Social Security, Research Report 101.
Boneham, M. et al. (1997) ‘Age, Race and Mental Health: Liverpool’s Elderly people from ethnic minorities’.Health and Social Care 2:113-115.
Booth, A. (2001) ‘Neighbourhood Renewal and Community Development’, in J. Callaghan (Ed.) AdvancingTogether for Health: 60 examples of innovative partnerships from Health Action Zones across Yorkshire andHumber. Published by the six Health Action Zones of Yorkshire and Humber with support from theDepartment of Health, http://www.haznet.org.uk/hazs/hazmap/h_leeds.asp#publications
Brewer, M., Goodman, A., Myck, M., Shaw, J. and Shephard, A. (2004) Poverty and inequality in Britain: 2004,Institute for Fiscal Studies, London.
91
Bunt, K., Adams, L. and Jones, A.-M. (2001) Evaluation of the Minimum Income Guarantee Claim Line. ResearchReport 147, Department for Work and Pensions, Corporate Document Services, Leeds.
Burchardt, T. (2000) ‘Social exclusion: concepts and evidence’, in D. Gordon and P. Townsend (eds) BreadlineEurope: The measurement of poverty, Policy Press, Bristol: 385-405.
Burchardt, T., Le Grand, J. and Piachaud, D. (1999) ‘Social exclusion in Britain 1991-1995’, Social Policy andAdministration 33, 3: 227-244.
Byrne, D. (1999) Social Exclusion, Open University Press, Buckingham.
Cabinet Office (2000) E-Government: A Strategic Framework for Public Services in the Information Age. London:The Stationery Office.
Care Direct Devon (2003) Care Direct Devon: Report of the Director of Social Services, Devon County Council, 15July 2003. http://www.devon.gov.uk/dcc/committee/reports/ss0322.html.
CAREdirect Bristol (2001). http://www.caredirect.gov.uk/Bristol.htm.
Carlin, H (1994) The Housing Needs of Older People from Ethnic Minorities: evidence from Glasgow.Occasional Papers on Housing No. 6 University of Stirling, Stirling.
Carlton, S., Soulsby, J. and Whitelegg, D. (2002) Old Money: Financial Understanding for Older Adult Learners,National Institute of Adult Continuing Education, Leicester.
Cebulla, A. with Beach, J., Heaver, C., Irving, Z. and Walker, R. (1999) Housing Benefit and SupportedAccommodation. Department of Social Security, Research Report No. 93, Corporate Document Services, Leeds.
Challis, D., Weiner, K., Darton, R., Hughes, J. and Stewart, K. (2001) Emerging Patterns of Care Management:Arrangements for Older People in England, Social Policy and Administration, 35, 6, pp.672-87.
Chivite-Matthews, N. and Maggs, P. (2002) Crime, Policing and Justice: the experience of older people. Findingsfrom the British Crime Survey, England and Wales. London: Home Office.
Christie, S. (2002) Transforming Sandwell. Sandwell Health Action Zone: Implementation Plan 1. 1998 – 2002.Sandwell Health Authority/Sandwell Metropolitan Borough Council,
http://www.haznet.org.uk/hazs/hazmap/Sandwell%20Imp%20plan.pdf
Citizens Advice (2003) Serious Benefits, National Association of Citizens Advice Bureaux, London.
Clark, H., Dyer, S. and Horwood, J. (1998) That Bit of Help. Bristol: The Policy Press.
Clark, H., Gough, H. and McFarlane, A (2004) It Pays Dividends. Direct Payments and Older People. The PolicyPress, Bristol.
Clark, T., Giles, C. and Hall, J. (1999) Does Council Tax Benefit Work? Findings, June 1999, Joseph RowntreeFoundation, York and Institute for Fiscal Studies, London.
Coleman, N., Jeeawody, F. and Wapshott, J. (2002) Electronic government at the Department for Work andPensions – Attitudes to electronic methods of conducting benefit business, Department for Work and PensionsResearch Report 176, Corporate Document Services, Leeds.
Commission for Health Improvement (2003) What CHI Has Found, in: NHS Direct Services Sector Report.London: Commission for Health Improvement.
Costigan, P., Finch, H., Jackson, B., Legard, R. and Ritchie, J. (1999) Overcoming Barriers: Older People andIncome Support, Department of Social Security Research Report 100, Corporate Document Services, Leeds.
Counsel and Care (2003a) Council Tax and Housing Benefit, Information from Counsel and Care Factsheet 22,Counsel and Care, London.
Counsel and Care (2003b) Attendance Allowance and Disability Living Allowance, Information from Counsel andCare Factsheet 3, Counsel and Care, London.
Counsel and Care (2003c) Help for Carers, Information from Counsel and Care Factsheet 10, Counsel andCare, London.
Cowan, D. and Marsh, A. (2001) ‘New Labour, same Old Tory housing policy?’, Modern Law Review 64, 2:260-279.
Cowell, F. A. (1986) ‘Welfare benefits and the economics of take-up’, LSE: Taxation, Incentives and theDistribution of Income Research Programme, discussion paper no. 89.
Craig, P. and Greenslade, M. (1998) First findings of the Disability Follow-Up to the Family Resources Survey,Research Summary 5, Department of Social Security, Analytical Service Directorate, London.
Crockett, J. (2002) Wolverhampton Health Action Zone Annual Report 2001/2002,http://www.haznet.org.uk/hazs/hazmap/wolv_annual-rpt-01-02.pdf
Croden, N., Costigan, P. and Whitfield, G. (1999) Helping Pensioners: Evaluation of the Income Support Pilots,Department of Social Security Research Report 105, Corporate Document Services, Leeds.
The impact of government policy on social exclusion among older people
92
Curtin, L., Tilley, N., Owen, M. and Pease, K. (2002) Developing Crime Reductions Plans: Some Examples fromthe Reducing Burglary Initiative. Home Office Crime Reduction Series Paper 7. London: Home Office.
Davies, B. and Fernandez, J.L. (2003) ‘Evaluating Community Care for Older People’. University of Kent PSSRUBulletin No. 14.
Department for Environment Food and Rural Affairs/Department for Trade and Industry (2003) The UK FuelPoverty Strategy – First Annual Progress Report 2003, London: Department for Trade and Industry.
Department for Work and Pensions (2001) Report on the Social Fund. Reply by the Government to the ThirdReport of the Social Security Committee, Session 2000-01 [HC 232], CM 5237, Department for Work andPensions, London.
Department for Work and Pensions (2002a) Opportunity for All: Fourth Annual Report 2002, Department forWork and Pensions, Stationery Office, London.
Department for Work and Pensions (2002b) The Pensioners’ Income Series 2000/1, Department for Work andPensions, Information and Analysis Directorate, London.
Department for Work and Pensions (2003m) Work and Pensions Statistics, Department for Work and Pensions,Information and Analysis Directorate, London.
Department for Work and Pensions (2003n) Low Income Dynamics 1991-2001, Department for Work andPensions, Information and Analysis Directorate, London.
Department for Work and Pensions (2003a) Client Group Analysis of the Population over State Pension Age: May2003, Department for Work and Pensions, Information and Analysis Directorate, London.
Department for Work and Pensions (2003b) Income-Related Benefits: Estimates of Take-up in 2000/2001,Department for Work and Pensions, Information and Analysis Directorate, London.
Department for Work and Pensions (2003c) Opportunity for All: Fifth Annual Report 2003, Department for Workand Pensions, Stationery Office, London.
Department for Work and Pensions (2003d) Households Below Average Income Statistics, Department for Workand Pensions, Information and Analysis Directorate, London.
Department for Work and Pensions (2003e) Annual Housing Benefit and Council Tax Benefit Statistics,Department for Work and Pensions, Information and Analysis Directorate, London.
Department for Work and Pensions (2003f) Quarterly Housing Benefit and Council Tax Benefit Statistics,Department for Work and Pensions, Information and Analysis Directorate, London.
Department for Work and Pensions (2003g) UK National Action Plan on Social Inclusion 2003-2005: TheAnnexes, Department for Work and Pensions, Stationery Office, London.
Department for Work and Pensions (2003h) Family Resources Survey, Great Britain, 2001-02, Department forWork and Pensions, Information and Analysis Directorate, London.
Department for Work and Pensions (2003i) Annual Report by the Secretary of State for Work and Pensions on theSocial Fund 2002/2003, CM5807, Department for Work and Pensions, London.
Department for Work and Pensions (2003j) Attendance Allowance Quarterly Statistics: August 2003, Departmentfor Work and Pensions, London.
Department for Work and Pensions (2003k) Disability Living Allowance Quarterly Statistics: August 2003,Department for Work and Pensions, London.
Department for Work and Pensions (2003l) Carer’s Allowance Quarterly Statistics: August 2003. Department forWork and Pensions, London.
Department for Work and Pensions (2004a) Income-Related Benefits: Estimates of Take-up in 2001/2002,Department for Work and Pensions, Information and Analysis Directorate, London.
Department for Work and Pensions (2004b) Households Below Average Income 2002/2003, Department forWork and Pensions, Information and Analysis Directorate, London.
Department of Health (1989) Caring for People: Community Care in the Decade and Beyond. Cmnd. 8173.London: HMSO.
Department of Health (1997) Health Action Zones: invitation to bid, EL (97) 65, 30 October, Leeds: Departmentof Health.
Department of Health (1999) Reducing Health Inequalities: An Action Report, Our Healthier Nation, Departmentof Health, London,
http://www.doh.gov.uk/pub/docs/doh/inequalities.pdf
Department of Health (2001a) National Service Framework for Older People. Department of Health, London.
Department of Health (2001b) Promoting Independence Grant 2001-02.
References
93
Department of Health (2001c) The Single Assessment Process: Guidance for Local Implementation. Departmentof Health, London.
Department of Health (2003) ‘Personal Social Services Expenditure and Unit Costs: England 2001-2002’.Department of Health Bulletin 2003/05. Department of Health, London.
Department of Health (2003a) ‘Personal Social Services Survey of Home Care Users in England Aged 65 orOver: 2002-03’. Department of Health Bulletin 2003/26. Department of Health, London.
Department of Health (2003) Tackling Health Inequalities: A programme for Action. Department of HealthPublications, London.
Department of Health/National Statistics (2003) Community Care Statistics 2002: Home Care Services for Adults,England.
Department of Social Security (1998) New Ambitions for Our Country, Stationery Office, London.
Department of Social Security (2000) The Changing Welfare State: Pensioner Incomes, Department of SocialSecurity Paper No. 2, Stationery Office, London.
Dickinson, P., Whitting, G. and The Housing Corporation (2002) The bIGPicture: Older People, The HousingCorporation, London.
Donnison, S. (2003) ‘CPAG Bulletin misled readers: no ‘fighting chance’ for appeals under new disabilityclaims system!’, Benefits and Work, 15 January 2004, Chippenham. (www.benefitsandwork.co.uk).
Donovan, N. and Palmer, G. (1999) Meaningful Choices: The Policy Options for Financial Exclusion, New PolicyInstitute, London.
Evason, E., Dowds, L. and Devine, P. (2002) ‘Pensioners and the Minimum Income Guarantee: Observationsfrom recent research’, Social Policy and Administration 36, 1: 36-45.
Falkingham, J. (1998) ‘Financial Security in Later Life’, in M. Bernard and J. Phillips (eds) The Social Policy of OldAge, Centre for Policy on Ageing, London.
Farrell, S. and Gadd, D. (2003) Measuring the Fear of Crime with Greater Accuracy. End of Award Report toEconomic and Social Research Council. Grant No. 000-22-0040.
Financial Services Authority (2000) In or out? Financial exclusion: a literature and research review, FinancialServices Authority, London.
Financial Services Authority (2003) No bank account? Why it could pay you to have one, Financial ServicesAuthority, London.
Findings (2002) The needs and aspirations of older people living in general housing. York: Joseph RowntreeFoundation.
Foundations (2002) Foundations Annual Review 2001-02, National Co-ordinating Body for Home ImprovementAgencies, Glossop.
Foundations, Factsheets 1-4, National Co-ordinating Body for Home Improvement Agencies, Glossop.
Frankel, A. (2003) HAZ in Brief. Wolverhampton Health Action Zone. Edition 14, March 2003, Wolverhampton,
http://www.healthactionzone.co.uk/graphics/pdfs/HAZ%20in%20brief%20March%202003.pdf
Fruin, D. (2000) Getting the Right Break: Inspection of Short-Term Break for People with Physical Disabilities andOlder People. London: Social Services Inspectorate.
Fry, V. and Stark, G. (1987) ‘The take-up of Supplementary Benefits: gaps in the safety net’, Fiscal Studies 8: 1-18.
Fry, V. and Stark, G. (1993) The take-up of means-tested benefits, 1984-90, Institute for Fiscal Studies Reportseries no. 41, London.
Fuel Poverty Advisory Group (for England) (2003) First Annual Report, Department for Trade and Industry.
George, S. (2002) ‘NHS Direct Audited’ British Medical Journal 324: pp. 558-559.
Goodman, A., Myck, M. and Shephard, A. (2003) Sharing the Nation’s Prosperity? Pensioner Poverty in Britain,Commentary 93, Institute for Fiscal Studies, London.
Gordon, D. et al. (2000) Poverty and Social Exclusion in Britain, Joseph Rowntree Foundation, York.
Greasley, P. and Small, N. (2002) Welfare advice in primary care, Nuffield Portfolio Programme Report No.17,School of Health Studies, University of Bradford, Bradford.
Hancock, R. and Weir, P. (1994) More ways than means: A guide to pensioners’ incomes in Great Britain, AgeConcern Institute of Gerontology, King’s College, London.
The impact of government policy on social exclusion among older people
94
Hancock, R., Pudney, S., Barker, G., Hernandez, M. and Sutherland, H. (2003) The Take-Up of Multiple Means-Tested Benefits by British Pensioners: Evidence from the Family Resources Surveys, Nuffield Community CareStudies Unit, University of Leicester, Leicester.
Hardill, I. (2003) Ageing and urban regeneration, paper prepared for the Region for All Ages Conference March11th, Birmingham.
Harding, T. (1999) ‘Enabling Older People to Live in Their Own Homes’. In With Respect to Older Age –Research Volume 3.
Hardy, B., Young, R. and Wistow, G (1999) ‘Dimensions of choice in the assessment and care managementprocess: the views of older people, carers and care managers’. Health and Social Care in the Community, 7 (6)483-491.
Health Action Zones (2001) Evidence Promoting Change. Health Action Zone Net Team, Department of Health.Health Development Agency, London.
Help the Aged (2001) Memorandum submitted by Help the Aged (SF36), Appendix 23 to the Minutes ofEvidence, Select Committee on Social Security, House of Commons, London.
Help the Aged (2002a) Age Discrimination, Policy Statement, Help the Aged, London.
Help the Aged (2002b) Tackling older people’s fear of crime. London: Help the Aged.
Help the Aged (2002c) Older People and Fear of Crime, Help the Aged, London.
Help the Aged (2003) Cold Homes: The UK’s Winter Death Scandal, Policy Statement, November 2003, London:Help the Aged.
Help the Aged (2004) Parliament discusses issues around payment of benefits, Policy Update 51, January 2004,Help the Aged, London: 5.
Henwood, M. (2001) ‘Future Imperfect?’ Report of the King’s Fund Care and Support Inquiry’. London: King’sFund Publishing.
Hewett, C. (2002) Low Carbon Legacy: developing the infrastructure to prevent climate change, Institute forPublic Policy Research, London.
Hills, J. (1998) Income and Wealth: The Latest Evidence, York, Joseph Rowntree Foundation.
Hills, J. (2001) ‘Inclusion or exclusion? The role of housing subsidies and benefits’, Urban Studies 38, 11: 1887-1902.
Hills, J. et al. (2001) Understanding Social Exclusion. Oxford: Oxford University Press.
Home Office Development and Practice Report No. 11, Home Office, London.
Home Owners and housing repair: behaviour and attitudes, Joseph Rowntree Foundation , May 1998.
Hough, M. (1995) Anxiety about Crime Survey: first report. Home Office Research Study No.147. London:Home Office.
House of Commons (2000) Inquiry into Housing Benefit, Social Security Committee, Sixth Report of Session1999-2000, London, Stationery Office.
House of Commons (2003a) The Future of UK Pensions, Work and Pensions Committee, Third Report of Session2002-03, Volume 1, London, Stationery Office.
House of Commons (2003b) People, Pensions and Post Offices: The impact of ‘Direct Payment’ on post offices andtheir customers, Trade and Industry Committee, House of Commons, Eleventh Report of Session 2002–03,HC718, 17 July 2003, Stationery Office, London.
Howse, K. (2003) Community Development and Older People: A Review. Beth Johnson Foundation, Stoke onTrent, http://www.centreforip.org.uk/PDFs/Community%20Development%20and%20Older%20People.pdf
Hughes, B. (1995) Older People and Community Care. Buckingham: Open University Press.
Hunter, M. (2001) ‘Will social services suffer in the new regime’. Community Care, 23-29 August, pp.10-11.
Care and Repair (2000) In Good Repair, Care and Repair, London.
Jacobson, J. and Saville, E. (1999) Neighbourhood Warden Schemes: An overview. Policing and Reducing CrimeUnit. Crime Reduction Research Series Paper 2. London: Home Office.
Jacobson, J., Maitland, L. and Hough, M. (2003) The Reducing Burglary Initiative: investigating burglary. HomeOffice Research Study 264. London: Home Office Research, Development and Statistics Directorate.
Kemp, P.A. (2000) ‘Housing benefit and welfare retrenchment in Britain’, Journal of Social Policy 29, 2: 263-279.
Kempson, E. and Whyley, C. (1999) Kept out or opted out? Understanding and combating financial exclusion,Joseph Rowntree Foundation, Policy Press, Bristol.
References
95
Kempson, E. and Whyley, C. (2001) Payment of Pensions and Benefits: A Survey of Social Security Recipients Paidby Order Book or Girocheque, Department for Work and Pensions Research Report 146, Corporate DocumentServices, Leeds.
Kempson, E., Collard, S. and Taylor, S. (2002) Social Fund Use Amongst Older People, Research Report 172,Department for Work and Pensions, Corporate Document Services, Leeds.
Kodz, J. and Pease, K. (2003) Reducing Burglary Initiative: early findings on burglary reduction. Findings 204.London: Home Office.
Laczko, F. (1990) ‘New poverty and the old poor: Pensioners’ incomes in the European Community’, Ageingand Society 10, 3: 261-277.
Lakin, C. (2003) The effects of taxes and benefits on household income, 2001–02, Social Analysis and ReportingDivision, Office for National Statistics, London.
Lawson, L., Mackenzie, M., Mackinnon, J., Meth, F. and Truman, J. (2002) National Evaluation of Health ActionZones. Health Action Zones: Integrated Case Studies-Preliminary Findings from Fieldwork in spring 2001. HealthPromotion Policy Unit, Department of Health University of Glasgow.
Leicester City Health Action Zone (2002) HAZIT 6: The Newsletter of the Leicester City Health Action Zone, Issue6, Winter 2002, http://www.haznet.org.uk/hazs/hazmap/leic_hazit6.pdf
Leisering, L. and Walker, R. (eds) (1998) The Dynamics of Modern Society, Policy Press, Bristol.
Levitas, R. (1998) The Inclusive Society? Social Exclusion and New Labour, Macmillan, Basingstoke.
Lewis, H., Hardy, B. and Waddington, E. (1999) Promoting well-being: developing a preventive approach witholder people. The Anchor Trust, Oxford.
Lindesay, J. et al. (1997) ‘Knowledge, Uptake and Availability of Health and Social Services Among AsianGujarati and While Elderly Persons’. Ethnicity and Health, 2: 59-69.
Little, M. (2002) Improving Older People’s Services – Policy into Practice. London: Social Services Inspectorate.
Lloyd, M., McLennan, D., Noble, M., Sigala, M. and Wright, G. (2003) Older people count: The Help the AgedIncome Index for older people in England and Wales 2003. London: Help the Aged.
Mack, M. and Lansley, S. (1985) Poor Britain, George Allen and Unwin, London.
Mackinnon, J. (2003) National Evaluation of Health Action Zones: Merseyside HAZ: A Case Study Final Report.Department of Health, HPPU University Glasgow.
Madanipour, A., Cars, G. and Allen, J. (eds) (1998) Social Exclusion in European Cities: Processes, Experiences,and Responses, Jessica Kingsley, London.
Mayhew, V. (2002) ‘Barriers to benefit take-up among older people: a summary of research’, in A. Fleiss (Ed.)The Department for Work and Pensions Research Yearbook 2000/2001, Social Research Branch, Department forWork and Pensions, London: 57-65.
McConaghy, M., Hill, C., Kane, C., Lader, D., Costigan, P. and Thornby, M. (2003) Entitled but not Claiming?Pensioners, the Minimum Income Guarantee and Pension Credit, Research Report No. 197, Department for Workand Pensions, London.
McCormick, J., Spencer, F. and Gamble, C. (2004) ‘Beyond the bounds: Resources for tackling disadvantage’,in Joseph Rowntree Foundation (Ed.) Overcoming disadvantage: An agenda for the next 20 years, JosephRowntree Foundation, York: 84-111.
McNally, D. (May, 2001) A review of older people’s views. Liverpool: Merseyside Health Action Zone,http://www.mhaz.org.uk/mhaz/docs/
McNeil, A. (2001) ‘Introduction’. Care Direct, Evaluation Newsletter 1. University of Kent: PSSRU, pp. 2-3.
Merseyside Health Action Zone (1999) Merseyside HAZ Implementation Plan – a comprehensive guide to theMHAZ programme, Merseyside Health Action Zone, Liverpool, http://www.mhaz.org.uk/mhaz/docs/
Merseyside Health Action Zone (2001) A step-by-step guide to community involvement for organisations: HOWWELL ARE WE DOING? Part one and two of our new ‘Community Involvement Toolkit’, Merseyside Health ActionZone, Liverpool, http://www.mhaz.org.uk/mhaz/docs/
Merseyside Health Action Zone (2001) Getting it right together: choice, control and independence. SummaryProgress Report, Merseyside Health Action Zone, Liverpool, http://www.mhaz.org.uk/mhaz/docs/
Merseyside Health Action Zone (2001). People… Choice, Control and Independence: A summary progress report,Merseyside Health Action Zone, Liverpool, http://www.mhaz.org.uk/mhaz/docs/
Munro, J., Nicholl, J., O’Cathain, A., Knowles, E. and Morgan, A. with the assistance of Dagnall, A. (2001)Evaluation of NHS Direct Trust Wave Sites: Final Report of the Phase 1 Research. University of Sheffield: MedicalCare Research Unit.
The impact of government policy on social exclusion among older people
96
National Audit Office (2002a) Tackling Pensioner Poverty: Encouraging Take-up of Entitlements. Report by theComptroller and Auditor General, HC 37 Session 2002-2003: 20 November 2002. London: Stationery Office.
National Audit Office (2002b) NHS Direct in England. Report by the Comptroller and Auditor General, HC 505Session 2001-2002: 25 January 2002. London: Stationery Office.
National Audit Office (2003a) Progress in improving the medical assessment of incapacity and disability benefits,Report by the Comptroller and Auditor General HC 1141 Session 2002-2003: 17 October 2003, StationeryOffice, London.
National Audit Office (2003b) Getting it right, putting it right: Improving decision-making and appeals in socialsecurity benefits, Report by the Comptroller and Auditor General HC 1142 Session 2002-2003: 7 November2003, Stationery Office, London.
National Audit Office (2003c) Developing Effective Services for Older People. Report by the Comptroller andAuditor General, HC 518 Session 2002-2003: 26 March 2003. London: Stationary Office.
National Audit Office (2003d) Warm Front: Helping to Combat Fuel Poverty. Report by the Comptroller andAuditor General, HC769 Session 2002-2003: 25 June 2003. London: Stationery Office.
National Pensioners Convention (2003) “Direct Payment” of the state pension into bank, building society andpost office accounts, NPC Briefing 29, July 2003, National Pensioners Convention, London.
Neighbourhood Renewal Unit (2003a) Research Report 7, New Deal for Communities, The National EvaluationAnnual Report 2002/03. Wetherby: Office of the Deputy Prime Minister.
Neighbourhood Renewal Unit (2003b) Factsheet 1: What is Neighbourhood Renewal? Wetherby: Office of theDeputy Prime Minister.
Neighbourhood Renewal Unit (2003c) Factsheet 2: The National Strategy for Neighbourhood Renewal.Wetherby: Office of the Deputy Prime Minister.
Neighbourhood Renewal Unit (2003d) New Deal for Communities Annual Review 2001/02. Wetherby: Office ofthe Deputy Prime Minister.
Neighbourhood Renewal Unit (2003e) Factsheet 9: New Deal for Communities. Wetherby: Office of the DeputyPrime Minister.
Neighbourhood Renewal Unit (2003f) Research Summary 7, New Deal for Communities, The National Evaluation2002/03: Key Findings. Wetherby: Office of the Deputy Prime Minister.
Neighbourhood Renewal Unit (2004) Research Summary 8, Neighbourhood Wardens Scheme Evaluation: Keyfindings and lessons. Wetherby: Office of the Deputy Prime Minister.
New Policy Institute (2003) The Impact of Council Tax on Older People’s Income: A Report for Help the Aged fromthe New Policy Institute. Help the Aged, London.
Newcastle Upon Tyne City Council (2001) Benefit Take-up Amongst Older People, paper submitted by WelfareRights Service, Newcastle upon Tyne City Council as evidence to the IRRV Committee of Inquiry into theoperation and structure of Housing Benefit and Council Tax Benefit in England, Scotland and Wales, Vol. 3,Institute of Revenues, Rating and Valuation, London.
Newman, K.S (2003) A Different Shade of Gray. New York: The New Press.
Office of the Deputy Prime Minister (2003) Review of HIA Sector: Interim Conclusions. Office of the DeputyPrime Minister, Stationery Office, London.
Office of Fair Trading (2001) Funerals. A Report of the OFT Inquiry into the Funerals Industry, Office of FairTrading, London.
Office of the Deputy Prime Minister Review of HIA Sector: Interim Conclusions.
Palmer, G., North, J., Carr, J. and Kenway, P. (2003) Monitoring Poverty and Social Exclusion 2003, New PolicyInstitute and Joseph Rowntree Foundation, York.
Palmer, G., Rahman, M. and Kenway, P. (2002) Monitoring Poverty and Social Exclusion 2002, Joseph RowntreeFoundation, York.
Parker, G. (1999) ‘Impact of the NHS and Community Care Act (1990) on Informal Carers. In With Respect toOld Age – Research Volume 3.
Parker, G. (2000) Health and Social Care in the Community.
Patel, N. (1999) ‘Black and Minority Ethnic Elderly: Perspectives on Long-Term Care’. Royal Commission onLong-Term Care – Research Volume 1.
Patel, N. et al. (1998) Dementia and Minority Ethnic Older People. Dorset: Russell House Publishing.
Patmore, C. (2002) Towards Flexible, Person-Centred Home Care Services. York: SPRU.
References
97
Performance and Innovation Unit (2000) Counter Revolution: Modernising the Post Office Network, Performanceand Innovation Unit, Cabinet Office, London.
Pettigrew, N., Thomas, A., Tovey, P. and Stone, V. (1999) Housing Benefit and Council Tax Benefit Delivery:Claimant Experiences, Department of Social Security, Research Report No. 97, Corporate Document Services,Leeds.
Phillipson, C. (1998) Reconstructing Old Age, Sage, London.
Phillipson, C., Bernard, M., Phillips, J. and Ogg, J. (1999) ‘Older people’s experiences of community life:patterns of neighbouring in three urban areas’, The Sociological Review, vol. 47, no. 4, pp. 715-743.
Phillipson, C., Bernard, M., Phillips, J. and Ogg, J. (2000) Family and Community Life of Older People, Routledge,London.
Phillipson, C. (2002) Transitions from work to retirement. Policy Press, Bristol.
Phillipson, C., Ahmed, N. and Latimer, J. (2003) Women in Transition: A study of the experiences of Bangladeshiwomen living in Tower Hamlets, Policy Press, Bristol.
Phillipson, C., Allan, G and Morgan, D (eds) (2004) Social Networks and Social Exclusion. Ashgate Publishing,Aldershot.
Policy Action Team 14 (1999) Access to Financial Services: The Report Of Policy Action Team 14, HM Treasury,Stationery Office, London.
Postcomm (2002) Access to Post Office Services: Time to Act, Postcomm’s Second Annual Report on theNetwork of Post Offices 2001-2002, Postal Services Commission, London.
Postcomm (2003) Banking on the Future, Postcomm’s Third Annual Report on the Network of Post Offices2002-2003, Postal Services Commission, London.
Power, A. and Wilson, W.J. (2000) Social Exclusion and the Future of Cities, CASE Paper 35. London: Centre forAnalysis of Social Exclusion, London School of Economics.
Pudney, S., Hernandez, M. and Hancock, R. (2002) The Welfare Cost of Means-testing: Pensioner participation inIncome Support, Nuffield Community Care Studies Unit, University of Leicester, Leicester.
Reducing Burglary Initiative Project Summary Fordbridge, Solihull. Supplement 2 to Findings 204. London: HomeOffice.
Reducing Burglary Initiative Project Summary Rochdale. Supplement 1 to Findings 204. London: Home Office.
Reducing Burglary Initiative Project Summary Stirchley, Birmingham. Supplement 4 to Findings 204. London:Home Office.
Reducing Burglary Initiative Project Summary Yew Tree, Sandwell. Supplement 3 to Findings 204. London: HomeOffice.
Regan, S. and Paxton W. (2003) Beyond Bank Accounts: full financial inclusion, Institute for Public PolicyResearch and Citizens Advice, Central Books, London.
Response of Foundations to ‘Home Improvement Agencies – Development and Reform’ Consultation Paper, Officeof the Deputy Prime Minister and Department of Health, September 2002.
Riseborough, M. and Sribjlanin, A. (2000) Overlooked and excluded? Older People and Regeneration. A Review ofPolicy and Practice. London: Age Concern England.
Roland, M. (2002) ‘Nurse-led Telephone Advice’. Medical Journal of Australia 176, February: 96.
Rowe, M. (2002) ‘Discretion and inconsistency: implementing the Social Fund’, Public Money andManagement 22, 4: 19-24.
Royal Commission on Long Term Care (1999) With Respect to Old Age: Long Term Care – Rights andResponsibilities, Royal Commission on Long Term Care, CM 4192-I, The Stationery Office, London.
Rummary, K. and Glendinning, C. (1999) ‘Negotiating needs, access and gatekeeping: Developments inhealth and community care policies in the UK and the rights of disabled and older citizens’. Critical SocialPolicy, 19 (3), pp.335-51.
Scharf, T., Phillipson, C., Kingston, P. and Smith, A.E. (2001) ‘Social exclusion and ageing’, Education andAgeing 16, 3: 303-320.
Scharf, T., Phillipson, C., Smith, A.E. and Kingston, P. (2002) Growing Older in Socially Deprived Areas: SocialExclusion in Later Life, Help the Aged, London.
Scharf, T. and Smith, A.E. (2004) ‘Older people in urban neighbourhoods: addressing the risk of socialexclusion in later life’, in C. Phillipson, G. Allan and D. Morgan (eds) Social Networks and Social Exclusion,Ashgate, Aldershot, 162-179.
The impact of government policy on social exclusion among older people
98
Shenton, J. (2002) ‘Affordable Warmth: Reality Or Fantasy’, Environmental Health Journal, September 2002:272-275.
Silverman, E. and Della-Giustina, J.-A. (2001) ‘Urban Policy and the Fear of Crime’, Urban Studies 38, (5-6), pp.941-57.
Simmons, J and Dodd, T. (2003) Crime in England and Wales 2002/2003. Home Office Statistical Bulletin.
Sims, L. (2001) Neighbourhood Watch: findings from the 2000 British Crime Survey. Findings 150. London:Home Office.
Social Exclusion Unit (1998) Bringing Britain Together: A National Strategy for Neighbourhood Renewal, SocialExclusion Unit, Stationery Office, London.
Social Exclusion Unit (2001a) A New Commitment to Neighbourhood Renewal: National Strategy Action Plan.London: Cabinet Office.
Social Exclusion Unit (2001b) Preventing Social Exclusion. London: Cabinet Office.
Social Security Select Committee (2001) Third Report of the Social Security Select Committee Session 2000-2001on the Social Fund. House of Commons, London.
Social Services Inspectorate (2003) Modern Social Services: a commitment to the future, 12th Annual Report ofthe Social Services Inspectorate 2002–2003, Chief Inspector of Social Services Department of Health,Stationery Office, London.
Soulsby, J. and Lee, N. (2002) It doesn’t add up: an analysis of the survey on institutions and organisationsoffering services/information/advice on financial matters, National Institute of Adult Continuing Education,Leicester.
Steele, B., Thornton, A., McKillop, C. and Dover, H. (2002) The Formulation of a Strategy to Prevent and DetectDistraction Burglary Offences Against Older People. Mimeo.
Swales, K. (1998) A Study of Disability Living Allowance and Attendance Allowance Awards, In-House Report No.41, Social Research Division, Department for Work and Pensions, London.
Tanner, D. (1998) ‘Empowerment and care management: Swimming against the tide’. Health and Social Carein the Community, 6 (6) pp.45-69.
Tanner, D. (2001) ‘Sustaining the Self in Later Life: Supporting Older People in the Community’. Ageing andSociety, 21: 255-278.
Tanner, D. (2003) ‘Older People and Access to Care’. British Journal of Social Work, 33: 499-515.
The Health Promotion Policy Unit, Department of Health Annual Report 1 July 2001 – 30 June 2002. HPPUUniversity of Glasgow.
Thornton A., Hatton C., Malone C., Fryer T., Walker D., Cunningham J. and Durrani N. (2003) Distractionburglary amongst older adults and ethnic minority communities. Home Office Research Study 269. London:Home Office Research, Development and Statistics Directorate.
Thornton, A., Walker, D. and Erol, R. (2003) Distraction burglary amongst older adults and minority ethniccommunities. Findings 197. London: Home Office.
Tilford, S., Percy-Smith, J., Moran, G. and Green, J. (2002) Thematic Evaluation of Leeds Health Action Zone.Centre for Health Promotion Research, Policy Research Institute, Leeds Metropolitan University, Leeds.
Tilley, N., Pease, K., Hough, M. and Brown, R. (1999) Burglary Prevention: Early Lessons from the CrimeReduction Programme. Crime Reduction Research Series Paper 1, London: Home Office.
Townsend, P. (1981) ‘The structured dependency of the elderly: the creation of policy in the twentiethcentury’, Ageing and Society 1, 1: 5-28.
Townsend, P. and Wedderburn, D. (1965) The Aged in the Welfare State. London: Bell.
Tyne and Wear Health Action Zone Partnership (1999) A Fairer Chance in Life: Tackling Health Inequalities inTyne and Wear. Tyne and Wear Health Action Zone, http://www.haz.co.uk/control/new.html
Tyrer, J. (2001) Merseyside Health Action Zone: Choice, Control and Independence for Older People. A MappingStudy on Merseyside. The Manchester Centre for Healthcare Management, University of Manchester,http://www.mhaz.org.uk/mhaz/docs/
Waddington, E. (1999) Promoting Well-being: Developing a Preventative Approach with Older People. Oxford:Anchor Trust.
Ware, T., Matosevic, T., Hardy, B., Knapp, M. Kendall, J. and Forder, J. (2003) ‘Commissioning Care Servicesfor Older People in England: The View from Care Managers, Users and Carers’. Ageing and Society, 23: 411-428.
References
99

Warburton, R. and McCracken, J. (1999) ‘An Evidence-based Perspective from the Department of Health onthe Impact of the 1993 Reforms on the Care of Frail Elderly People’. In With Respect to Old Age – ResearchVolume 3.
World Health Organisation (2002) Active ageing: a policy framework. Geneva, WHO.
Wistow, G. and Randall, T. (2001) ‘Spend now, save later’. Community Care, 1-7 March, pp.20-1.
Wistow, G., Callaghan, J., Randall, T. and Waddington, E. (2001) First Steps in Prevention: Review of the 1999-2000 Prevention Plans. Leeds: Nuffield Institute of Health.
Wistow, G., Waddington, E. and Godfrey, M. (2003) Living Well in Later Life: From Prevention to Promotion.Leeds: Nuffield Institute for Health.
The impact of government policy on social exclusion among older people
100
Other reports in this series: ISBN
Breaking the Cycle: taking stock of progress and priorities for the future. 1 85112 724 0
The drivers of social exclusion: review of the literature for theSocial Exclusion Unit in the Breaking the Cycle series. 1 85112 725 9
The impact of government policy on social exclusion among children aged 0–13 and their families: a review of the literature for the Social Exclusion Unit in the Breaking the Cycle series. 1 85112 726 7
The impact of government policy on social exclusion among young people: a review of the literature for the Social Exclusion Unit in the Breaking the Cycle series. 1 85112 727 5
The impact of government policy on social exclusion among working age people: a review of the literature for the Social Exclusion Unit in the Breaking the Cycle series. 1 85112 728 3
Making a difference to disadvantaged families? Qualitative case studies – a report for the Social Exclusion Unit in the Breaking the Cycle series. 1 85112 730 5
Low income and multiple disadvantage 1991–2001. Analysis of theBritish Household Panel Survey – a report for the Social Exclusion Unitin the Breaking the Cycle series. 1 85112 731 3
All are available from ODPM Publications. Telephone: 0870 1226 236.
This report presents a review of the literature about theimpact of government policy on social exclusion amongolder people.
The report contains a discussion about what socialexclusion means to the lives of older people and the keypolicies aimed at tackling it. It presents evidence of policyimpact and discusses some issues for the future directionof policy. The Centre for Social Gerontology at KeeleUniversity carried out this review.
ISBN: 1 85112 729 1Price: £15.00
The im
pact o
f go
vernm
ent p
olicy o
nso
cial exclusion
amo
ng
old
er peo
ple
OD
PM
SEU


![Planning with Goal-Conditioned Policies · trained to reach a goal state that is provided as an additional input [24, 55, 53, 48]. While in principle such policies can solve any goal-reaching](https://img.pdfslide.us/doc/110x75/5fa47f4bf42bfb239255ed2e/planning-with-goal-conditioned-policies-trained-to-reach-a-goal-state-that-is-provided.jpg)