Embed Size (px)
Citation preview
Center for Behavior, Institutions and the Environment
CBIE Working Paper Series
#CBIE-2016-002
Social Dilemmas Are Only Part of the Story to Explain Overharvesting ofRenewable Resources
Marco A. JanssenSchool of Sustainability
April 27, 2016
The Center for Behavior, Institutions and the Environment is a research center located within the Biosocial ComplexityInititive at ASU. CBIE can be found on the internet at: http://cbie.asu.edu.
c©2016 M.A. Janssen. All rights reserved.
Social Dilemmas Are Only Part of the Story to Explain Overharvesting of RenewableResources
Marco A. Janssena,
aSchool of Sustainability;
Corresponding author:Marco A. JanssenArizona State University, PO Box 875502, AZ [email protected]
Abstract:We report on experiments with a spatial explicit dynamic resource where individuals makeincentivized real-time decisions when and where to harvest the resource units. We test how individualsmake decisions when they manage the resource on their own, or share a resource twice the size withanother person. We find that most individuals do not harvest resources close to the optimal strategywhen they manage the resource individually, and this relates to their understanding of the instructionsand their social orientation. Cooperators let resources grow even when there is no social dilemma. Ingroup rounds, there is more overharvesting, especially if participants are selfish and have a lowunderstanding of the instructions. The results show that a better understanding of the motivations ofparticipants is needed to explain the observed behavior.
1
Social dilemmas are only part of the story to explain overharvesting of renewable
resources1
Marco A. Janssen2
Introduction
By 1970s the theory on the governance of common resources provided a grim perspective. Without the
establishment of private property rights or taxing the use of common resource, overharvesting was
inevitable, since users - assumed to be motivated by self-interest – will not self-organize (Gordon,
1954; Scott, 1955; Olson, 1965; Hardin, 1968; Dasgupta and Heal, 1979; Clark 1990). By the
1980s the accumulation of counter examples from case studies demonstrated that the
conventional model of human behavior did not hold since people are able to govern their
commons in sustainable ways without external interventions (McCay and Acheson, 1987; Feeny
et al. 1990; Ostrom, 1990; Bromley et al., 1992).
Since the late 1980s, laboratory and field experiments have been performed that confirm
the insights from the case studies Ostrom et al. (1992, 1994). The first finding from experiments
is that people cooperate more than the selfish rational actors predicts. This finding is finding is
robust among social dilemma experiments (Fischbacher et al. 2001; Fehr and Fischbacher et al.
2003, Camerer and Fehr, 2003). Cooperation not only happens in one-shot games, but also in
repeated games, where participants reciprocate cooperative behavior. Moreover, we find that the
majority of the participants in experiments can be classified as conditional cooperators, with
much smaller fractions as unconditional cooperators and free-riders (Fischbacher et al., 2001). A
second finding is that people cooperate more if they can communicate and commit to non-
binding agreements (Ostrom et al., 1992; Janssen et al. 2010).Those basic findings have been
replicated in field experiments with actual resource users (Cardenas et al., 2000; Rustago et al.,
2010).
However, when people are asked to manage a dynamic system, experiments show they
have difficulty with basic feedback systems (Sterman, 1989; Moxnes, 2000; Cronin et al., 2009;
Osman, 2010). Hence overharvesting of common resources is not only caused by the social
dilemma, but also because of the difficulty participants have by interacting with a dynamic
resource (Moxnes, 2000). In this paper we report on experiments with a dynamic resource with
one and two participants and test whether also one person experiment, where there is no social
dilemma, participants will overharvest the renewable resource.
Experimental design
1 Acknowledgements: This report is the result of a pretest performed in the context of the Behavior, Economics and Nature Network. The author wants to thank BENN and the Center for Behavior, Institutions and the Environment for financial support, Allen Lee for implementing the
experimental software ad Mady Tyson and Cathy Rubiños for assisting during the experimental sessions.
2 School of Sustainability, Center for Behavior, Institutions and the Environment, Arizona State University [email protected]
2
Janssen et al. (2010) used a dynamic spatial experiment of a renewable resource with five
participants. In this experiment we aim to test whether individuals will be able to manage a
dynamic spatial experiment close to the optimal solution. We then create groups of two to test
whether measurements of cooperative behavior could predict the outcome of two person rounds.
Finally, we allow communication and we expect to see an increase of cooperative behavior.
Our experimental environment is built up as follows. There is spatial map of the
resources. The resource’s renewal rate is density dependent to reflect simple ecological
dynamics. The more tokens around an empty cell the higher the probability of regeneration of the
resource unit. The participants collect tokens in real time by pressing the arrow keys (left, right,
up, and down) to move their avatars around the screen and press the space bar to collect a token
from the cell on which the avatar is located. Each token is worth 2 cents. Participants make
multiple decisions within each four-minute decision period.
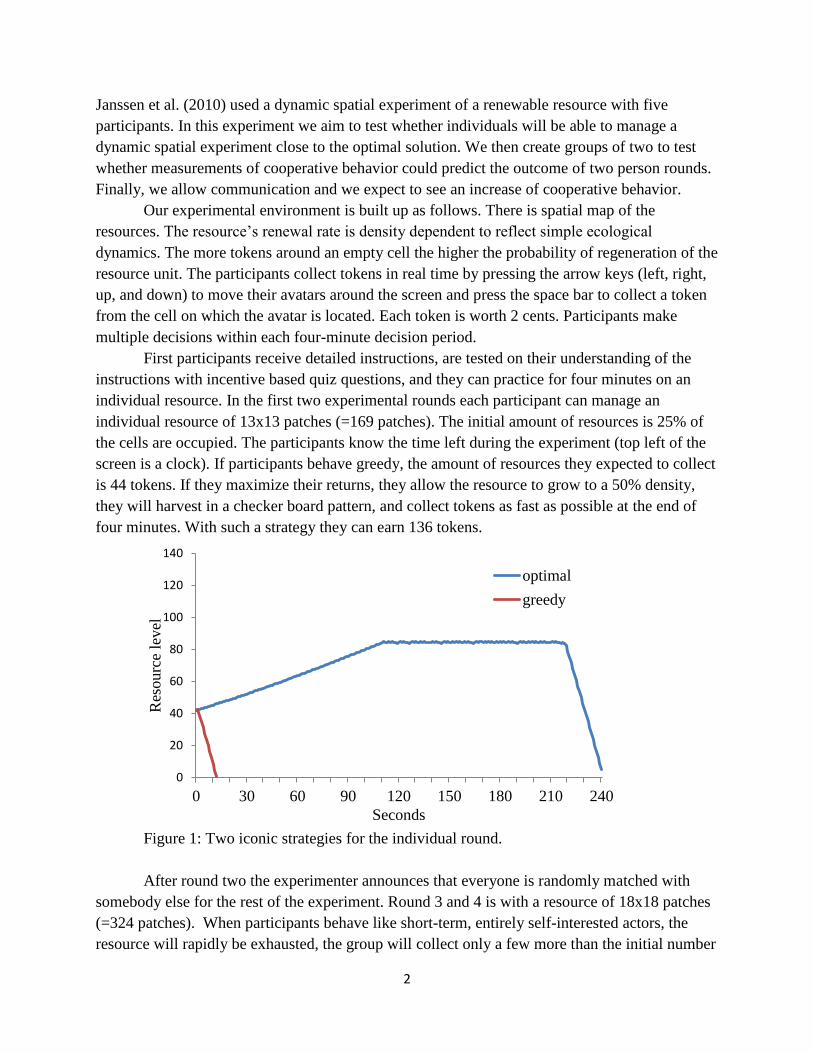
First participants receive detailed instructions, are tested on their understanding of the
instructions with incentive based quiz questions, and they can practice for four minutes on an
individual resource. In the first two experimental rounds each participant can manage an
individual resource of 13x13 patches (=169 patches). The initial amount of resources is 25% of
the cells are occupied. The participants know the time left during the experiment (top left of the
screen is a clock). If participants behave greedy, the amount of resources they expected to collect
is 44 tokens. If they maximize their returns, they allow the resource to grow to a 50% density,
they will harvest in a checker board pattern, and collect tokens as fast as possible at the end of
four minutes. With such a strategy they can earn 136 tokens.
Figure 1: Two iconic strategies for the individual round.
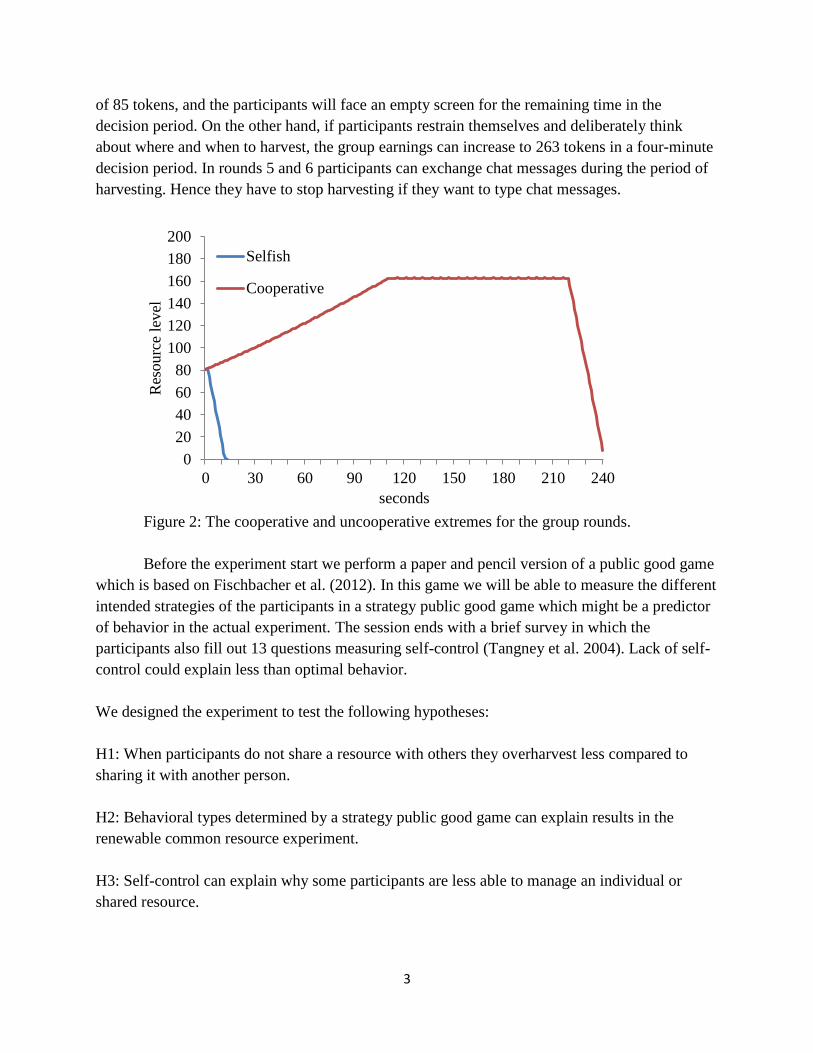
After round two the experimenter announces that everyone is randomly matched with
somebody else for the rest of the experiment. Round 3 and 4 is with a resource of 18x18 patches
(=324 patches). When participants behave like short-term, entirely self-interested actors, the
resource will rapidly be exhausted, the group will collect only a few more than the initial number
0
20
40
60
80
100
120
140
0 30 60 90 120 150 180 210 240
Res
ou
rce
lev
el
Seconds
optimal
greedy
3
of 85 tokens, and the participants will face an empty screen for the remaining time in the
decision period. On the other hand, if participants restrain themselves and deliberately think
about where and when to harvest, the group earnings can increase to 263 tokens in a four-minute
decision period. In rounds 5 and 6 participants can exchange chat messages during the period of
harvesting. Hence they have to stop harvesting if they want to type chat messages.
Figure 2: The cooperative and uncooperative extremes for the group rounds.
Before the experiment start we perform a paper and pencil version of a public good game
which is based on Fischbacher et al. (2012). In this game we will be able to measure the different
intended strategies of the participants in a strategy public good game which might be a predictor
of behavior in the actual experiment. The session ends with a brief survey in which the
participants also fill out 13 questions measuring self-control (Tangney et al. 2004). Lack of self-
control could explain less than optimal behavior.
We designed the experiment to test the following hypotheses:
H1: When participants do not share a resource with others they overharvest less compared to
sharing it with another person.
H2: Behavioral types determined by a strategy public good game can explain results in the
renewable common resource experiment.
H3: Self-control can explain why some participants are less able to manage an individual or
shared resource.
0
20
40
60
80
100
120
140
160
180
200
0 30 60 90 120 150 180 210 240
Res
ou
rce
lev
el
seconds
Selfish
Cooperative
4
H4: Understanding of the experiment can explain why some individuals do not harvest the
resource close to the optimal strategy in individual rounds.
H5: Allowing for communication during the four minute rounds leads to an increase of
performance of the groups.
5
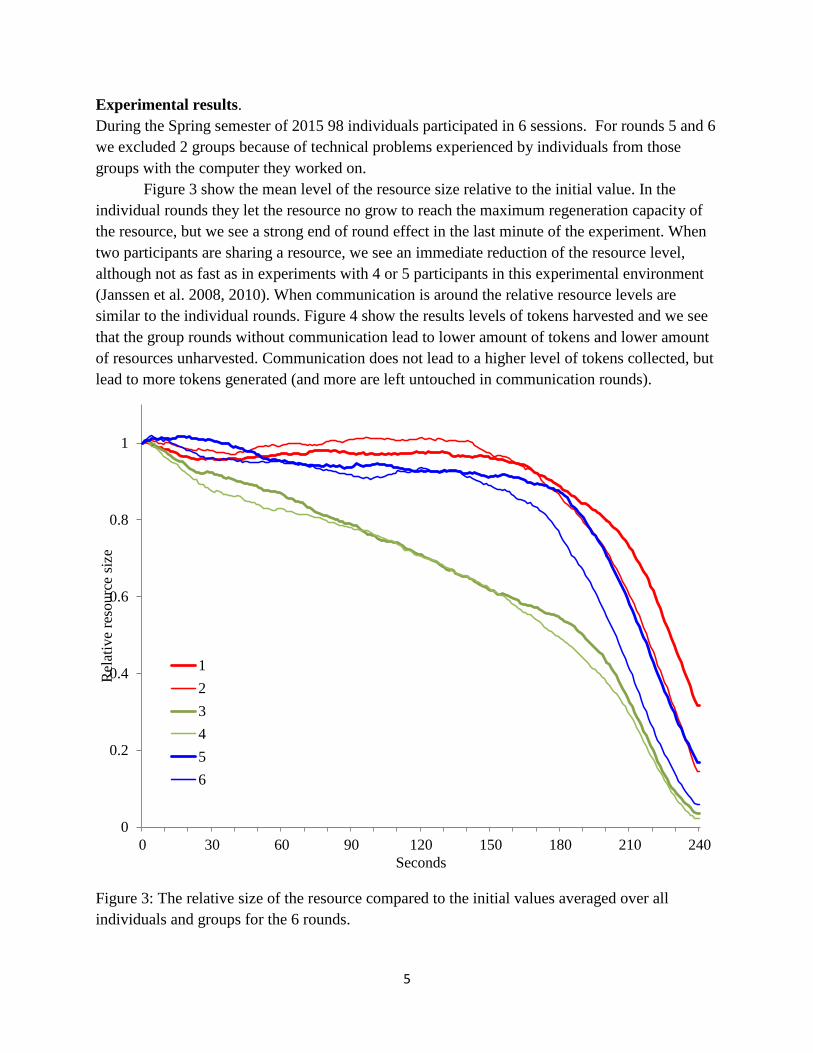
Experimental results.
During the Spring semester of 2015 98 individuals participated in 6 sessions. For rounds 5 and 6
we excluded 2 groups because of technical problems experienced by individuals from those
groups with the computer they worked on.
Figure 3 show the mean level of the resource size relative to the initial value. In the
individual rounds they let the resource no grow to reach the maximum regeneration capacity of
the resource, but we see a strong end of round effect in the last minute of the experiment. When
two participants are sharing a resource, we see an immediate reduction of the resource level,
although not as fast as in experiments with 4 or 5 participants in this experimental environment
(Janssen et al. 2008, 2010). When communication is around the relative resource levels are
similar to the individual rounds. Figure 4 show the results levels of tokens harvested and we see
that the group rounds without communication lead to lower amount of tokens and lower amount
of resources unharvested. Communication does not lead to a higher level of tokens collected, but
lead to more tokens generated (and more are left untouched in communication rounds).
Figure 3: The relative size of the resource compared to the initial values averaged over all
individuals and groups for the 6 rounds.
0
0.2
0.4
0.6
0.8
1
0 30 60 90 120 150 180 210 240
Rel
ativ
e re
sourc
e si
ze
Seconds
1
2
3
4
5
6
6
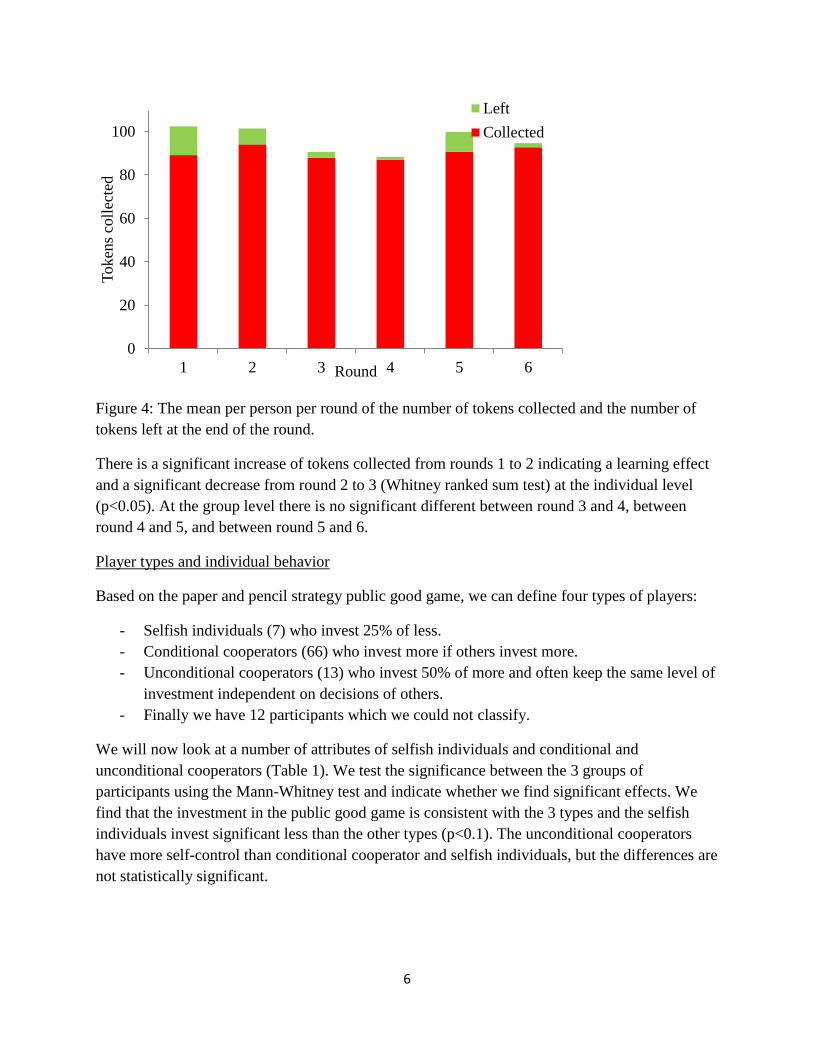
Figure 4: The mean per person per round of the number of tokens collected and the number of
tokens left at the end of the round.
There is a significant increase of tokens collected from rounds 1 to 2 indicating a learning effect
and a significant decrease from round 2 to 3 (Whitney ranked sum test) at the individual level
(p<0.05). At the group level there is no significant different between round 3 and 4, between
round 4 and 5, and between round 5 and 6.
Player types and individual behavior
Based on the paper and pencil strategy public good game, we can define four types of players:
- Selfish individuals (7) who invest 25% of less.
- Conditional cooperators (66) who invest more if others invest more.
- Unconditional cooperators (13) who invest 50% of more and often keep the same level of
investment independent on decisions of others.
- Finally we have 12 participants which we could not classify.
We will now look at a number of attributes of selfish individuals and conditional and
unconditional cooperators (Table 1). We test the significance between the 3 groups of
participants using the Mann-Whitney test and indicate whether we find significant effects. We
find that the investment in the public good game is consistent with the 3 types and the selfish
individuals invest significant less than the other types (p<0.1). The unconditional cooperators
have more self-control than conditional cooperator and selfish individuals, but the differences are
not statistically significant.
0
20
40
60
80
100
1 2 3 4 5 6
To
ken
s co
llec
ted
Round
Left
Collected
7
We find that the cooperators have a significant higher score on the quiz than selfish
individuals (p<0.01). This may indicate that selfish individuals relate to personality types that go
beyond the social preferences.
In the individual rounds of the harvesting experiment, we find differences between types
in the first round, but not the second round. We find that cooperators harvest significant more
than selfish individuals (p<0.01), although these rounds have no social dilemma. This reflect the
findings of Burton-Chellew et al. (2016) where individuals, when told they play a public good
game with a computer, still show different types of social preferences, which is partly explained
by differences in understanding of the instructions. We also find that cooperators let more tokens
grow during the experiment compared to selfish individuals (p<0.01) and let more tokens on the
screen when the round ends (p<0.01).
Table 1: The average score for a number of experimental results split up among 13 unconditional
cooperator, 66 conditional cooperators and 7 selfish individuals.
Unconditional
Cooperator
Conditional
Cooperator
Selfish individual
Investment in public good 78.8% 72.3% 50%
Score on self-control 43.08 41.34 38.71
Score on quiz questions 84.6% 85% 65.7%
Collected round 1 93.38 91.42 73.43
Collected round 2 93.31 96.80 85.71
Tokens grown round 1 71.92 62.09 36
Tokens grown round 2 60.31 61.48 47.71
Tokens left round 1 20.54 12.67 4.57
Tokens left round 2 9.00 6.68 4.00
Player types and group performance
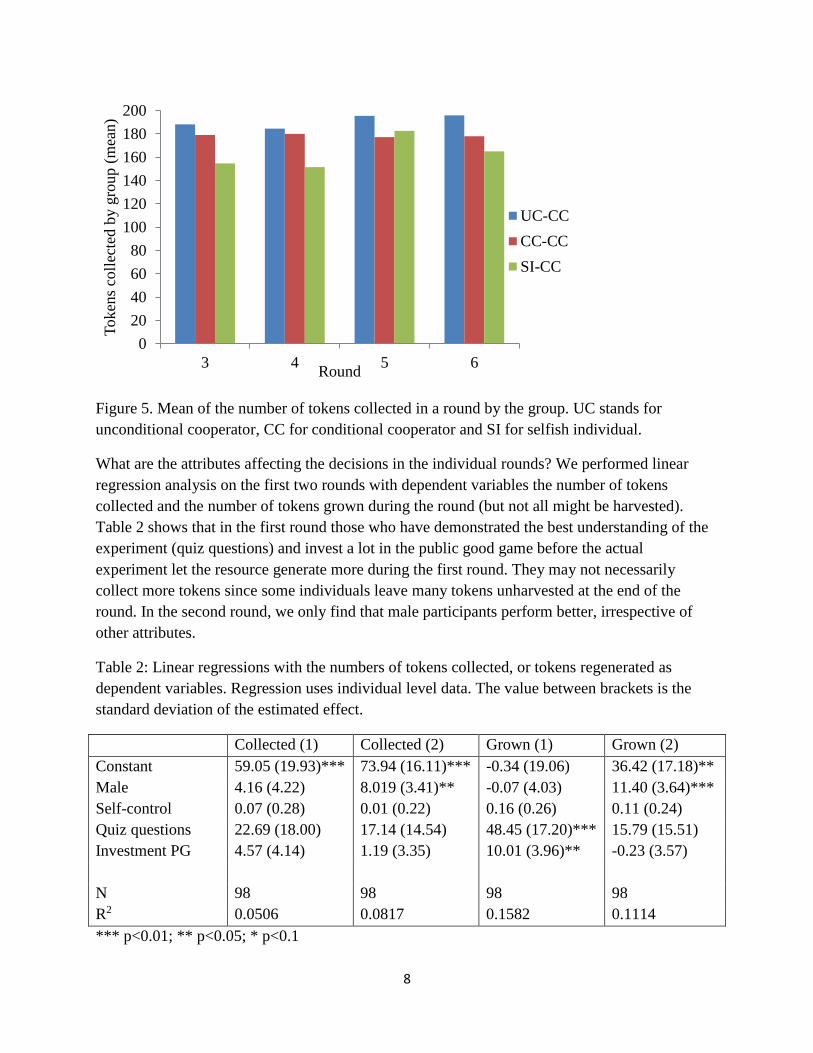
Does the combination of different types of participants predict the performance of the group?
Since participants are randomly combined, we have only limited observations. We have 20
combinations of conditional cooperators, 12 combinations of conditional and unconditional
cooperators, and 6 combinations of selfish individuals and conditional cooperators. Figure 5
shows that the expected results hold. Combining an unconditional cooperator with a conditional
cooperator leads to higher group performance compared to others, and the combination of a
selfish individual with a conditional cooperator lead to a significant lower performance of the
group.
8
Figure 5. Mean of the number of tokens collected in a round by the group. UC stands for
unconditional cooperator, CC for conditional cooperator and SI for selfish individual.
What are the attributes affecting the decisions in the individual rounds? We performed linear
regression analysis on the first two rounds with dependent variables the number of tokens
collected and the number of tokens grown during the round (but not all might be harvested).
Table 2 shows that in the first round those who have demonstrated the best understanding of the
experiment (quiz questions) and invest a lot in the public good game before the actual
experiment let the resource generate more during the first round. They may not necessarily
collect more tokens since some individuals leave many tokens unharvested at the end of the
round. In the second round, we only find that male participants perform better, irrespective of
other attributes.
Table 2: Linear regressions with the numbers of tokens collected, or tokens regenerated as
dependent variables. Regression uses individual level data. The value between brackets is the
standard deviation of the estimated effect.
Collected (1) Collected (2) Grown (1) Grown (2)
Constant 59.05 (19.93)*** 73.94 (16.11)*** -0.34 (19.06) 36.42 (17.18)**
Male 4.16 (4.22) 8.019 (3.41)** -0.07 (4.03) 11.40 (3.64)***
Self-control 0.07 (0.28) 0.01 (0.22) 0.16 (0.26) 0.11 (0.24)
Quiz questions 22.69 (18.00) 17.14 (14.54) 48.45 (17.20)*** 15.79 (15.51)
Investment PG 4.57 (4.14) 1.19 (3.35) 10.01 (3.96)** -0.23 (3.57)
N 98 98 98 98
R2 0.0506 0.0817 0.1582 0.1114
*** p<0.01; ** p<0.05; * p<0.1
0
20
40
60
80
100
120
140
160
180
200
3 4 5 6
To
ken
s co
llec
ted
by g
rou
p (
mea
n)
Round
UC-CC
CC-CC
SI-CC
9
If we use the types of participants as defined from the public good game we derive better fit with
the data. We do not include the investment level and the quiz questions since they are strongly
correlated with the behavioral types. Cooperators collect more tokens in individual rounds, and
still we find that male participants do better in round 2.
Table 3: Same as Table 2 but now using dummies for behavioral types as independent variables.
Collected (1) Collected (2) Grown (1) Grown (2)
Constant 70.55 (14.62)*** 69.76 (11.56)*** 39.87 (14.28)*** 33.77 (12.54)***
Male 6.37 (4.12) 9.65 (3.26)*** 3.97 (4.02) 12.68 (3.53)***
Self-control 0.14 (0.28) 0.15 (0.22) 0.19 (0.27) 0.20 (0.24)
UC 14.55 (8.00)* 13.43 (6.32)** 22.48 (7.81)*** 12.93 (6.86)*
CC 12.09 (6.29)* 16.07 (4.97)*** 12.52 (6.14)** 13.00 (5.39)**
SI -5.60 (10.11) 10.19 (7.99) -12.43 (9.87) 5.19 (8.67)
N 98 98 98 98
R2 0.0965 0.1630 0.1632 0.1627
*** p<0.01; ** p<0.05; * p<0.1
We now focus on the group rounds. First we will look at rounds 3 and 4. Does sharing a common
resource lead to a lower performance per person? The amount of tokens harvested in round 2 was
94.08 and this drops to 87.84 tokens which is a significant (p=0.01) drop using the Wilcoxon
Matched-Pairs Signed-Ranks Test.
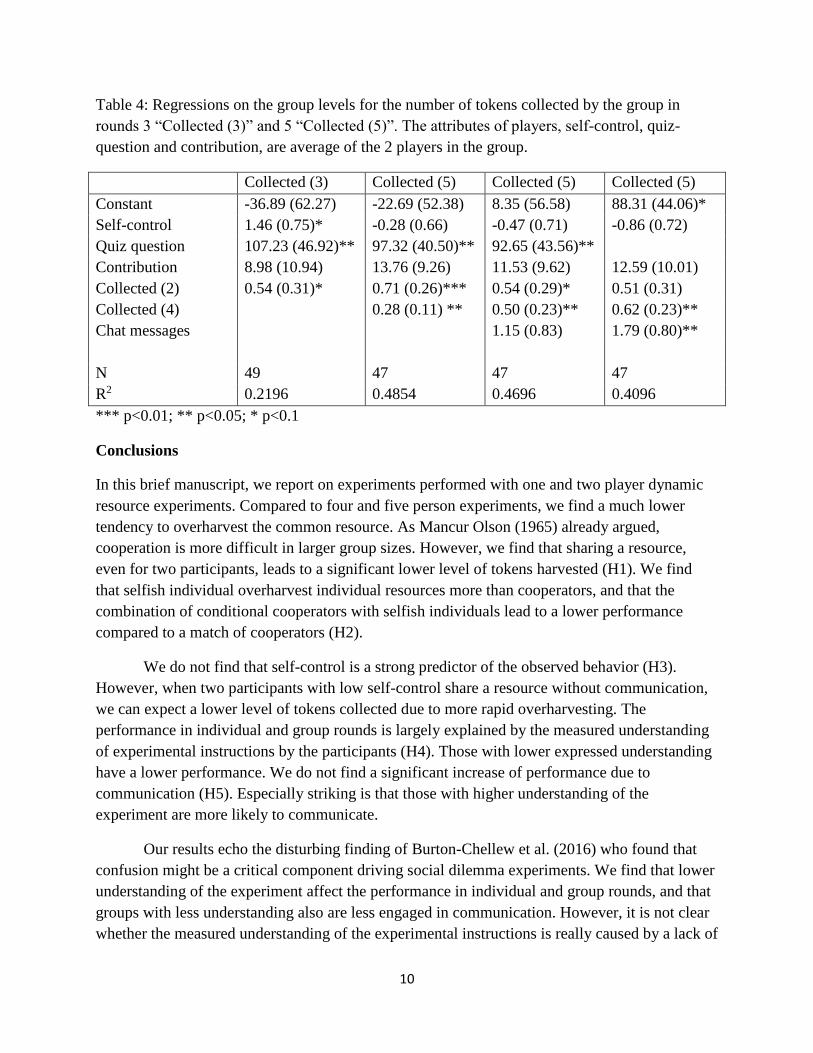
Regression analysis is used to test the factors that lead to better group performance. Table 4
shows that there is a small positive effect of self-control. Hence the higher the combines score of
self-control of both participants the better the group is doing. The effect of understanding of the
experimental instructions is more significant. We don’t find a significant effect of the
demonstrated level of cooperation in the public good game, but we do find a weak positive
significant effect of the performance of both players in the last individual round.
We do not find a significant effect of communication on the amount of tokens collected
(although the amount of tokens generated is increased due to communication). In the
communication rounds we still find a significant effect of the understanding of the experimental
instructions. We do not find a significant effect of the number of chat messages exchanges.
However, this is caused by the high correlation between communication and the understanding
of the instructions. The better the combined score on the quiz questions, the more chat messages
the participants exchange.
10
Table 4: Regressions on the group levels for the number of tokens collected by the group in
rounds 3 “Collected (3)” and 5 “Collected (5)”. The attributes of players, self-control, quiz-
question and contribution, are average of the 2 players in the group.
Collected (3) Collected (5) Collected (5) Collected (5)
Constant -36.89 (62.27) -22.69 (52.38) 8.35 (56.58) 88.31 (44.06)*
Self-control 1.46 (0.75)* -0.28 (0.66) -0.47 (0.71) -0.86 (0.72)
Quiz question 107.23 (46.92)** 97.32 (40.50)** 92.65 (43.56)**
Contribution 8.98 (10.94) 13.76 (9.26) 11.53 (9.62) 12.59 (10.01)
Collected (2) 0.54 (0.31)* 0.71 (0.26)*** 0.54 (0.29)* 0.51 (0.31)
Collected (4) 0.28 (0.11) ** 0.50 (0.23)** 0.62 (0.23)**
Chat messages 1.15 (0.83) 1.79 (0.80)**
N 49 47 47 47
R2 0.2196 0.4854 0.4696 0.4096
*** p<0.01; ** p<0.05; * p<0.1
Conclusions
In this brief manuscript, we report on experiments performed with one and two player dynamic
resource experiments. Compared to four and five person experiments, we find a much lower
tendency to overharvest the common resource. As Mancur Olson (1965) already argued,
cooperation is more difficult in larger group sizes. However, we find that sharing a resource,
even for two participants, leads to a significant lower level of tokens harvested (H1). We find
that selfish individual overharvest individual resources more than cooperators, and that the
combination of conditional cooperators with selfish individuals lead to a lower performance
compared to a match of cooperators (H2).
We do not find that self-control is a strong predictor of the observed behavior (H3).
However, when two participants with low self-control share a resource without communication,
we can expect a lower level of tokens collected due to more rapid overharvesting. The
performance in individual and group rounds is largely explained by the measured understanding
of experimental instructions by the participants (H4). Those with lower expressed understanding
have a lower performance. We do not find a significant increase of performance due to
communication (H5). Especially striking is that those with higher understanding of the
experiment are more likely to communicate.
Our results echo the disturbing finding of Burton-Chellew et al. (2016) who found that
confusion might be a critical component driving social dilemma experiments. We find that lower
understanding of the experiment affect the performance in individual and group rounds, and that
groups with less understanding also are less engaged in communication. However, it is not clear
whether the measured understanding of the experimental instructions is really caused by a lack of
11
comprehension or a lack of effort. Furthermore, we find that the measured types of players
related to social preferences predict the behavior in individual rounds, also similar to findings of
Burton-Chellew et al. (2016) who find participants express behavioral types even when they are
informed they interact with a computer, not a human person.
To conclude, the results of this study supports the notion that we don’t understand very
well what the participants are doing. We observe behavioral outcomes and interpret it in the
context of our theories, but when we dig deeper it seems we don’t know what the basic
motivations are of the participants during an experiment.
References
Bromley, D.W., D. Feeny, M. McKean, P. Peters, J. Gilles, R. Oakerson, C.F. Runge, and J.
Thomson (eds.) (1992) Making the Commons Work: Theory, Practice, and Policy. San
Francisco, CA: Institute for Contemporary Studies Press.
Burton-Chellew, M.N., C.E. Mouden and S.A. West (2016) Conditional cooperation and
confusion in public-goods experiments, Proceedings of the National Academy of Sciences
USA 113(5): 1291-1296.
Camerer C.F., E. Fehr (2006) When does “Economic Man” Dominate Social Behavior? Science
311: 47-52.
Cardenas J.C., J. Stranlund and C. Willis (2000) Local environmental control and institutional
crowding out, World Development 28(10): 1719-1733.
Clark, C.W. (1990) Mathematical bioeconomics: the optimal management of renewable
resources. 2nd edn., John Wiley & Sons, New York (1st edn. 1976).
Cronin, M.A., C. Gonzalez, and J.D. Sterman (2009) Why Don't Well-Educated Adults
Understand Accumulation? A Challenge to Researchers, Educators, and Citizens.
Organizational Behavior and Human Decision Processes 108:(1): 116-130.
Dasgupta P. and G. Heal (1979) Economic Theory and Exhaustible Resources. Cambridge
University Press.
Feeny, D., F. Berkes, B. J. McCay, and J.M. Acheson (1990) The Tragedy of the Commons:
Twenty-Two Years Later. Human Ecology 18(1):1-19.
Fehr E., and C.F. Camerer (2007) Social neuroeconomics: the neural circuitry of social
preferences. Trends in Cognitive Sciences 11(10): 419-427.
Fehr, E., and U. Fischbacher (2003) The nature of human altruism, Nature 425: 785-791.
Fischbacher U, S. Gächter, E. Fehr (2001) Are People Conditionally Cooperative? Evidence
From a Public Goods Experiment. Economics Letters 71(3): 397-404.
Fischbacher, U., S. Gächter, and S. Quercia (2012) The behavioral validity of the strategy
method in public good experiments, Journal of Economic Psychology 33: 897–913.
Gordon, H.S. (1954) The Economic Theory of a Common-Property Resource: The Fishery. The
Journal of Political Economy 62(2): 124–142.
Janssen, M.A., R.L. Goldstone, F. Menczer and E. Ostrom (2008), Effect of rule choice in
dynamic interactive spatial commons, International Journal of the Commons, 2(2): 288-312
Janssen M.A., R. Holahan, A. Lee, E. Ostrom (2010) Lab Experiments for the Study of Social-
Ecological Systems. Science 328: 613-617.
12
Hardin, G. (1968) The Tragedy of the Commons. Science 162, 1243-1248.
McCay, B.J., and J.M. Acheson (1987) The Question of the Commons: The Culture and Ecology
of Communal Resources. Tucson: University of Arizona Press.
Moxnes, E. (2000) Not only the tragedy of the commons: misperceptions of feedback and
policies for sustainable development, System Dynamics Review 16 (4): 325–348.
Olson, M. (1965) The Logic of Collective Action: Public Goods and the Theory of Groups,
Cambridge, MA: Harvard University Press.
Osman, M. (2010) Controlling uncertainty: A review of human behavior in complex dynamic
environments, Psychological Bulletin 136(1): 65-86.
Ostrom E. (1990) Governing the Commons: The Evolution of Institutions for Collective Action.
Cambridge University Press.
Ostrom E., R. Gardner, J. Walker (1994) Rules, Games and Common Pool Resources. University
of Michigan Press.
Ostrom, E., J. Walker and R Gardner (1992) Covenants with and without a Sword: Self
governance Is Possible. American Political Science Review 86(2): 404-417.
Rustagi D, S. Engel, M. Kosfel (2010) Conditional Cooperation and Costly Monitoring Explain
Success in Forest Commons Management. Science 330: 961-965.
Scott A.D. (1955) The fishery: the objectives of sole ownership. Journal of Political Economy,
63, 116-124.
Sterman J.D. (1989) Misperceptions of feedback in dynamic decision making. Organizational
Behavior and Human Decision Processes 43(3): 301–335.
Tangney, J.P., R.F. Baumeister and A.L. Boone, A.L. (2004) High Self-Control Predicts Good
Adjustment, Less Pathology, Better Grades, and Interpersonal Success. Journal of
Personality, 72, 271-324.
13
Appendix
First we list the instruments used. And subsequently provide some additional
results.
14
Instructions on the first part of the experiment
If you read the following instructions carefully, you can – depending on your decisions – earn
some more money in addition to the 5 dollars, which you can keep in any case. The entire
amount of money which you earned with your decisions will be added up and paid to you in cash
at the end of the experiment. These instructions are solely for your private information. You are
not allowed to communicate during the experiment. If you have any questions, please ask us.
Violation of this rule will lead to the exclusion from the experiment and all payments. If you
have questions, please raise your hand. A member of the experimenter team will come to you
and answer them in private.
In this experiment you will be matches with one other participant in the room. Except for us –
the experimenters – no one knows with whom you are matched.
The decision situation
You will learn how the experiment will be conducted later. We first introduce you to the basic
decision situation. You will be a member of a group consisting of 2 people. Each group member
has to decide on the allocation of 2 dollars.
You can put this 2 dollars into your private account or you can invest them fully or partially
into a project. Each dollar you do not invest into the project, will automatically remain in your
private account.
Your income from the private account
For example, if you put 2 dollars into your private account (and therefore do not invest into the
project) your income will amount to exactly 2 dollars out of your private account. If you put 0.5
dollar into your private account, your income from this account will be 0.5 dollar. No one except
you earns something from your private account.
Your income from the project
Each group member will profit equally from the amount you invest into the project. On the other
hand, you will also get a payoff from the other group members’ investments. The income for
each group member is the sum of all contributions
If, for example, the sum of all contributions to the project is 4 dollars, then you and the other
members of your group each earn 4 dollars out of the project. If both of you contribute a total of
1 dollar to the project, you and the other members of your group each earn 1 dollar.
Total income
Your total income is the sum of your income from your private account and that from the
project:
15
Income from your private account = ($2 - contribution to the project) + sum of all contributions
to the project
The experiment
The experiment includes the decision situation just described to you. You will be paid at the end
of the experiment based on the decisions you make in this experiment. The experiment will only
be conducted once. As you know, you will have 2 dollars at your disposal. You can put them into
a private account or you can invest them into a project. Each subject has to make two types of
decisions in this experiment, which we will refer to below as the ‘‘unconditional contribution’’
and ‘‘contribution table’’.
You decide how many of the 2 dollars you want to invest into the project in the unconditional
contribution. Please circle your decision
your contribution: $0 $0.5 $1 $1.5 $2
Your second task is to fill in a ‘‘contribution table’’ where you indicate how many dollars you
want to contribute to the project for each possible contribution of the other person). You can
condition your contribution on that of the other group member. This will be immediately clear to
you if you take a look at the following table.
Contribution of other group
member
Your conditional contribution
to the project
$0.00
$0.50
$1.00
$1.50
$2.00
The numbers are the possible contributions of the other group member to the project. You simply
have to insert how many dollars you will contribute to the project into each input box –
conditional on the indicated contribution. You have to make an entry into each input box. For
example, you will have to indicate how much you contribute to the project if the other contribute
0 dollars to the project, how much you contribute if the other contributes 0.5 dollars, 1 dollars,
1.5 dollars or 2 dollars. You can insert any numbers from $0 to $2 in each input box. Once you
have made an entry in each input box, click ‘‘OK’’.
After all participants of the experiment have made an unconditional contribution and have filled
in their contribution table, a random mechanism will select a group member from every group.
Only the contribution table will be the payoff relevant decision for the randomly determined
subject. Only the unconditional contribution will be the payoff-relevant decision for the other
group member not selected by the random mechanism. You obviously do not know whether the
16
random mechanism will select you when you make your unconditional contribution and when
you fill in the contribution table. You will therefore have to think carefully about both types of
decisions because both can become relevant for you.
Two examples should make this clear.
Example 1. Assume that the random mechanism selects you. This implies that your relevant
decision will be your contribution table. The unconditional contribution is the relevant decision
for the other group member. Assume she made an unconditional contribution 2 dollars. If you
indicated in your contribution table that you will contribute 1 dollar if the others contribute
dollars, then the total contribution to the project is given by 2 + 1 = 3 dollars. All group
members, therefore, earn 3 dollars from the project plus their respective income from the private
account. If, instead, you indicated in your contribution table that you would contribute 1 dollar if
the other contributed two dollars, then the total contribution of the group to the project is given
by 1 + 1 = 2 dollars. All group members therefore earn 2 dollars from the project plus their
respective income from the private account.
Example 2. Assume that the random mechanism did not select you, implying that the
unconditional contribution is taken as the payoff-relevant decision for you and other group
member. Assume your unconditional contribution is 1.5 dollars. If the group member whom the
random mechanism selected indicates in her contribution table that she will contribute 1 dollar if
the other member contributes on 1.50 dollars, then the total contribution of the group to the
project is given by 1 + 1.5 = 2.5 dollars. Both group members will therefore earn 2.5 dollars
from the project plus their respective income from the private account. If, instead, the randomly
selected group member indicates in her contribution table that she contributes 2 if the other
contributes 1.5 dollars, then the total contribution of that group to the project is 2 + 1.5 = 3.5
dollars. All group members will therefore earn 3.5 dollars from the project plus their respective
income from the private account.
17
Italic: Spoken
Normal: on screen
Welcome, I am Marco Janssen, a professor here at ASU and we will do some exercises today.
Before we go to the instructions I ask you to turn off any mobile phones and other mobile devices
that can disturb the experiment. I also ask you not to speak during the experiment. If you have a
question, raise your hand, and I will address your question.
The duration of the experiment is about an hour. Depending on the decisions you make you can
earn money that is paid in private at the end of the experiment.
We will now discuss the instructions on the screen. It is important for your earnings that you pay
attention to these instructions.
Welcome to the experiment. The experiment will begin shortly after everyone has been assigned
a station.
Please wait quietly and do not close this window or open any other applications. >
[We may be able to include the public good game in the computerized version of the experiment]
The main point of this first page of instructions is that you can collect tokens by moving your
avatar with the keys. The more tokens you collect the more money you earn. The tokens reappear
on empty cells if other tokens are available on the neighboring cells.
Please read the instructions carefully and answer the 10 quiz questions. For each correct answer
you get 10 cents. When everybody has finished and submitted the submit button the quiz
questions we continue.
18
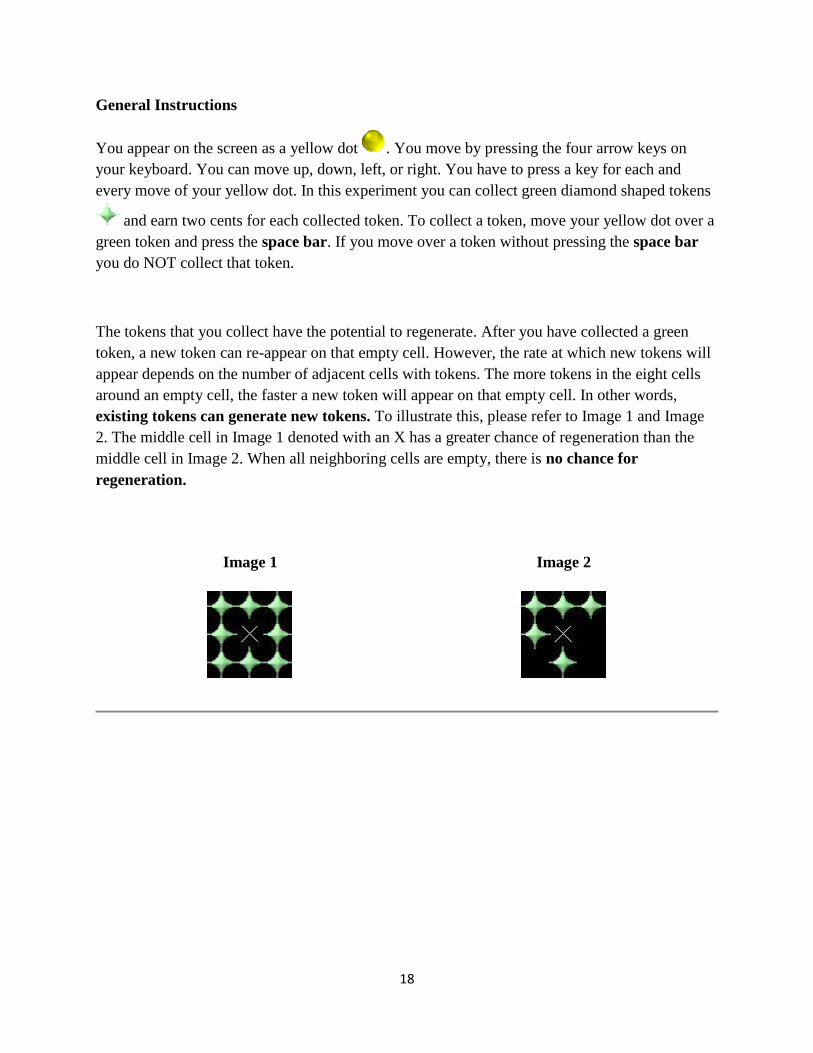
General Instructions
You appear on the screen as a yellow dot . You move by pressing the four arrow keys on
your keyboard. You can move up, down, left, or right. You have to press a key for each and
every move of your yellow dot. In this experiment you can collect green diamond shaped tokens
and earn two cents for each collected token. To collect a token, move your yellow dot over a
green token and press the space bar. If you move over a token without pressing the space bar
you do NOT collect that token.
The tokens that you collect have the potential to regenerate. After you have collected a green
token, a new token can re-appear on that empty cell. However, the rate at which new tokens will
appear depends on the number of adjacent cells with tokens. The more tokens in the eight cells
around an empty cell, the faster a new token will appear on that empty cell. In other words,
existing tokens can generate new tokens. To illustrate this, please refer to Image 1 and Image
2. The middle cell in Image 1 denoted with an X has a greater chance of regeneration than the
middle cell in Image 2. When all neighboring cells are empty, there is no chance for
regeneration.
Image 1 Image 2
19
Practice Round Instructions
You will now have four minutes to practice with the experimental environment. The decisions
you make in this round will NOT influence your earnings. At the beginning of the practice round
25% of the cells are occupied with green tokens. The environment is a 14 x 14 grid of cells.
During this practice round, and only during this practice round, you are able to reset the tokens
displayed on the screen by pressing the R key. When you press the R key you will reset the
resource to its initial distribution, randomly filling half of the cells.
Please do not communicate with any other participant.
If you have any questions please raise your hand. Do you have any questions so far?
Before we begin the practice round you need to answer for the following 10 statements whether
they are correct or incorrect. You have five minutes to answer those questions and you will get
10 cents for each correct answer.
1. Tokens grow from the middle of the screen.
A. Correct
B. Incorrect
2. In order to collect a token you need to press the space bar while your yellow dot is on a
cell with a token.
A. Correct
B. Incorrect
3. When you have collected all tokens on the screen, no new tokens will appear.
A. Correct
B. Incorrect
4. Your decisions of where to collect tokens affects the regeneration of tokens.
A. Correct
B. Incorrect
5. If the following sequence possible?
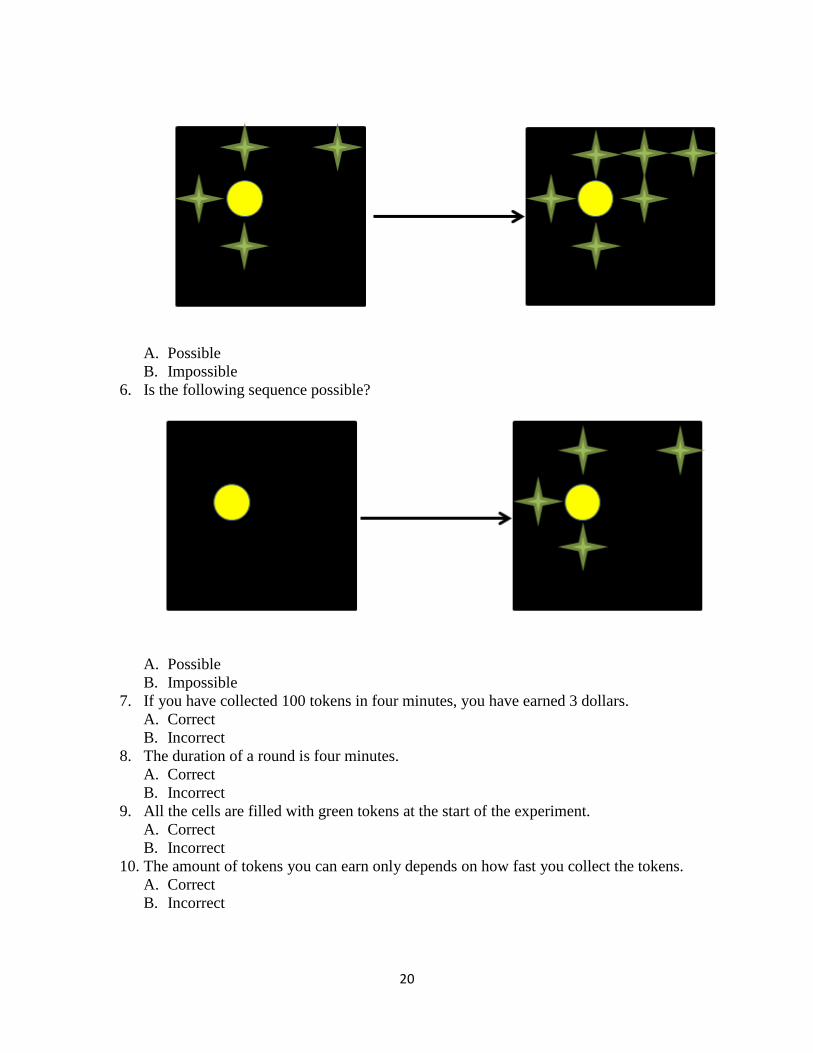
20
A. Possible
B. Impossible
6. Is the following sequence possible?
A. Possible
B. Impossible
7. If you have collected 100 tokens in four minutes, you have earned 3 dollars.
A. Correct
B. Incorrect
8. The duration of a round is four minutes.
A. Correct
B. Incorrect
9. All the cells are filled with green tokens at the start of the experiment.
A. Correct
B. Incorrect
10. The amount of tokens you can earn only depends on how fast you collect the tokens.
A. Correct
B. Incorrect
21
If you have any questions please raise your hand.
[Practice round]
We will now start with the actual experiment.
Round 1 instructions
This is the first round of the experiment. The length of the round is 4 minutes. Like in the
practice round you can collect green tokens. This time you earn two cents for each token
collected. This time you cannot reset the distribution of green tokens.
On the top right corner of the screen you can see how many tokens you have collected. On the
top left corner of the screen you can see a clock that displays the remaining time in the round.
If you have any questions please raise your hand.
[Round 1]
Round 2 instructions
The setting of round 2 is the same as round 1
[Round 2]
You will share a screen which is twice the size as the previous rounds with one other player. The
other player will show up as a blue dot. Thus each of you are connected with a random other
person in this room.
Please read the instructions carefully so that we can start the experiment.
Round 3 instructions
This is the third round of the experiment. The length of the round is again 4 minutes. Like in the
previous rounds you can collect green tokens.
In this round the renewable resource will become twice as big. You will share this larger
environment with one other player in this room that has been randomly selected. One group's
resource environment is distinct from the other groups.
The other player will appear on the screen as a blue dot . On the top right corner of the
screen you can see how many tokens each player has collected.
[Round 3]
22
Round 4 instructions
The setting of round 4 is the same as round 3
[Round 4]
Round 5 instructions
Round 5 is the same as the previous two rounds with one exception.
During the next round you can anonymously communicate by text messages with the other
participant in your group. To start writing a text message you have to click with the mouse cursor
in the text box at the right of the screen. To return to the collection of tokens you have to click
with the mouse on the area where tokens appear. You can use this opportunity to discuss the
experiment and coordinate your actions to improve your earnings. You may not promise side-
payments after the experiment is completed or make any threats. You are also not allowed to
reveal your real identity. We are monitoring the chat traffic while you chat.]
The length of this round is four minutes.
If you have any questions please raise your hand. Do you have any questions so far?
Round 6 instructions
Round 6 is the same as the previous round.
[Round 6]
This was the last round, but not the end of the experiment. We will now determine your
payments, and while we are doing this, you are asked to fill in carefully a brief survey.
When we are ready we will call you one by one to the front of this room. We will pay you there in
private. So, wait till your computer number will be called, and turn in your computer number,
and your survey. So please answer now the survey carefully.

23
Participant ID: ____________
Thank you for participating in this experiment.
While the experimenter is calculating your payment, please respond to the following questions. We would
really appreciate learning your views on these questions and about your experience in the experiment. All
information that you provide will be kept in strict confidence and all participants’ answers will be
combined and presented in the form of summary statistics, such as tables and graphs.
Please answer all questions. Please select ONE checkbox for each question, where appropriate.
1. How old are you? _______ years
2. What is your sex?
Female
Male
3. What is your major of study or research focus? _________________________________
4. Which year of study are you?
Freshman
Sophomore
Junior
Senior
Graduate Student
5. Using the scale provided, please indicate how closely each of the following statements reflects how you
typically act:
Please select ONE checkbox for each row.
Not
at all 1 2 3 4 5
Very
much
I am good at resisting temptation
I have a hard time breaking bad habits
I am lazy
I say inappropriate things
I do certain things that are bad for me, if they are fun
I refuse things that are bad for me
I wish I had more self-discipline
People would say that I have iron self- discipline
Pleasure and fun sometimes keep me from getting work
done
I have trouble concentrating
I am able to work effectively toward long-term goals
Sometimes I can’t stop myself from doing something,
even if I know it is wrong
I often act without thinking through all the alternatives
24
Public good experiment
Most of the participants invest 50% or more in the public good:
In the conditional contribution, participants give on average more if others give more. We can
split up the 98 participants into different categories:
- Selfish: 7: (0.5 or less investment)
- Conditional cooperators: 66: (invest more if others invest more)
- Unconditional cooperators: 13: (1 or more invested, same level for each level of
investment by others)
- Non classifiable: 12 (none of the above)
0
2
4
6
8
10
12
14
16
18
0 0.5 1 1.5 2
Nu
mb
er o
f p
arti
cip
ants
Investment in the public good
0
0.2
0.4
0.6
0.8
1
1.2
1.4
1.6
1.8
2
0 0.5 1 1.5 2
Inve
stm
ent
leve
l
Average investment others
AltruisticConditional CooperatorSelfishUnclassifiedmean
25
Quiz:
On average 83% of the quiz questions were answered correctly. Most of the participants had 9 of
10 questions correct.
The top 3 questions answered incorrectly are:
28% correct: All the cells are filled with green tokens at the start of the experiment (FALSE)
66% correct: When you have collected all tokens on the screen, no new tokens will appear
(TRUE).
77% correct: Tokens grow from the middle of the screen (FALSE)
0
5
10
15
20
25
30
35
40
45
50
0.4 0.5 0.6 0.7 0.8 0.9 1
Nu
mb
er o
f p
arti
cip
ants
Fraction of questions correct
26
Rounds 1 and 2:
Below you see the resource size over the four minute period for the 98 individuals for rounds 1
and 2.
0
20
40
60
80
100
120
140
1 11 21 31 41 51 61 71 81 91 101 111 121 131 141 151 161 171 181 191 201 211 221 231
Res
ou
rce
leve
l
0
20
40
60
80
100
120
140
1 11 21 31 41 51 61 71 81 91 101 111 121 131 141 151 161 171 181 191 201 211 221 231
27
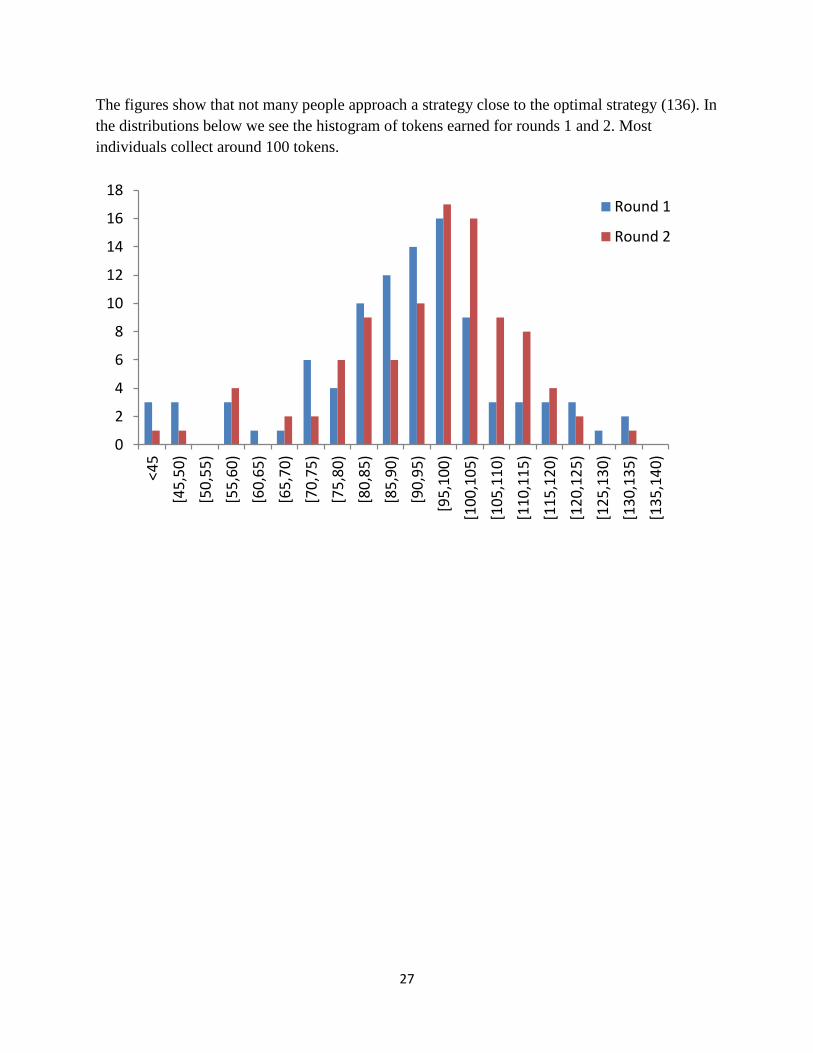
The figures show that not many people approach a strategy close to the optimal strategy (136). In
the distributions below we see the histogram of tokens earned for rounds 1 and 2. Most
individuals collect around 100 tokens.
0
2
4
6
8
10
12
14
16
18
<4
5
[45
,50
)
[50
,55
)
[55
,60
)
[60
,65
)
[65
,70
)
[70
,75
)
[75
,80
)
[80
,85
)
[85
,90
)
[90
,95
)
[95
,10
0)
[10
0,1
05
)
[10
5,1
10
)
[11
0,1
15
)
[11
5,1
20
)
[12
0,1
25
)
[12
5,1
30
)
[13
0,1
35
)
[13
5,1
40
)
Round 1
Round 2
28
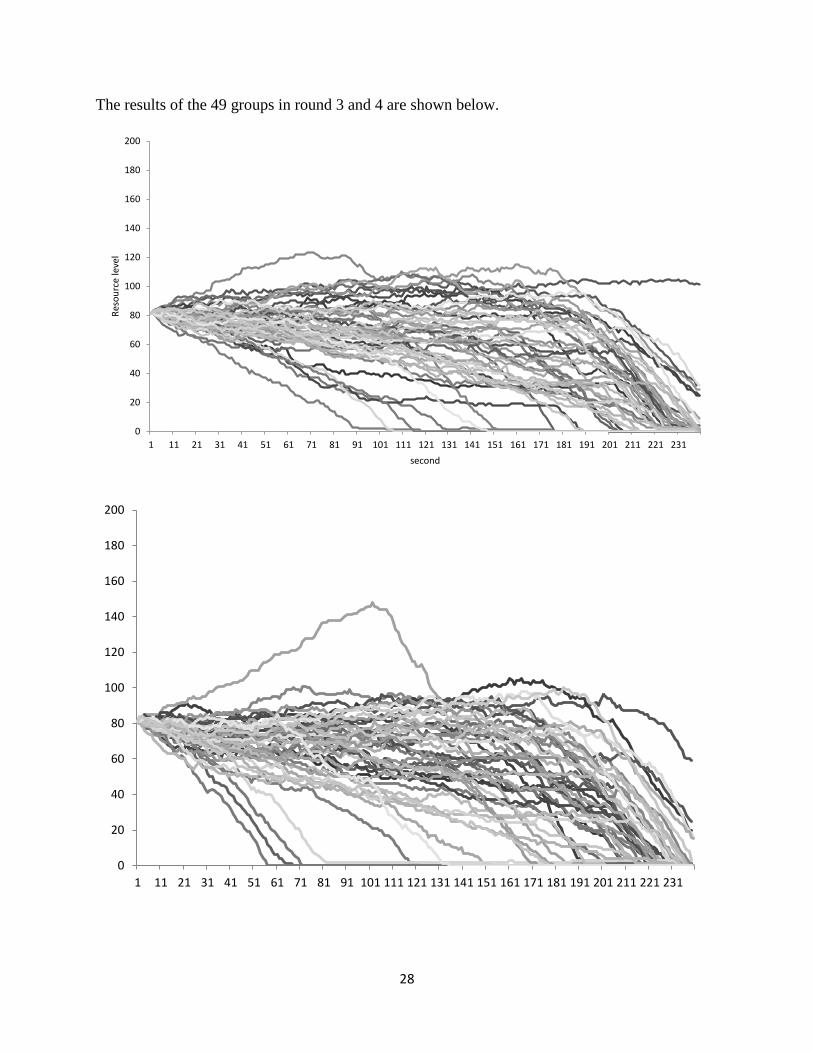
The results of the 49 groups in round 3 and 4 are shown below.
0
20
40
60
80
100
120
140
160
180
200
1 11 21 31 41 51 61 71 81 91 101 111 121 131 141 151 161 171 181 191 201 211 221 231
Res
ou
rce
leve
l
second
0
20
40
60
80
100
120
140
160
180
200
1 11 21 31 41 51 61 71 81 91 101 111 121 131 141 151 161 171 181 191 201 211 221 231
29
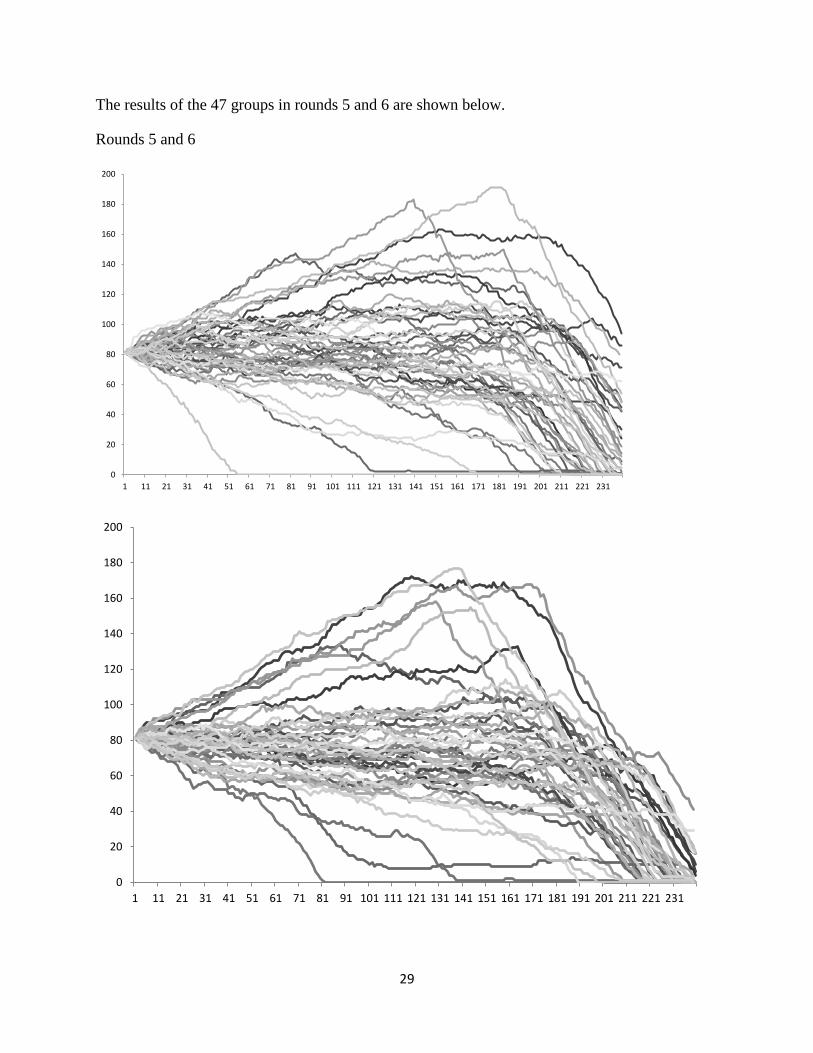
The results of the 47 groups in rounds 5 and 6 are shown below.
Rounds 5 and 6
0
20
40
60
80
100
120
140
160
180
200
1 11 21 31 41 51 61 71 81 91 101 111 121 131 141 151 161 171 181 191 201 211 221 231
0
20
40
60
80
100
120
140
160
180
200
1 11 21 31 41 51 61 71 81 91 101 111 121 131 141 151 161 171 181 191 201 211 221 231
30
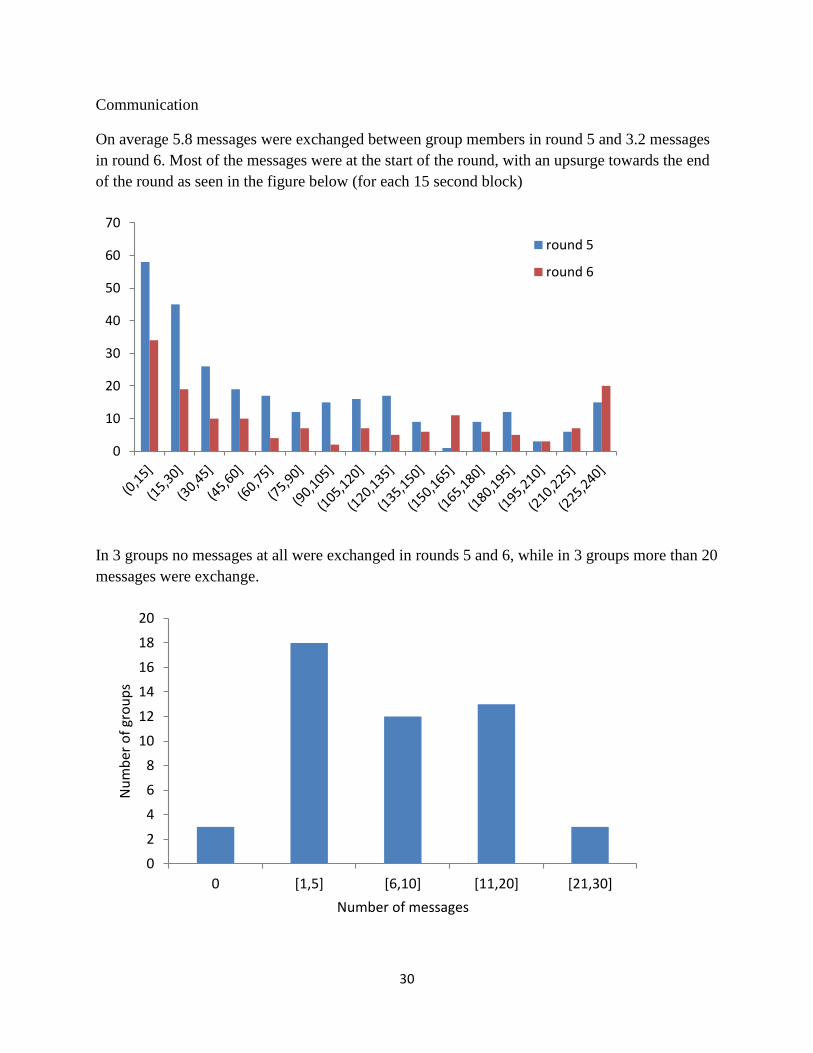
Communication
On average 5.8 messages were exchanged between group members in round 5 and 3.2 messages
in round 6. Most of the messages were at the start of the round, with an upsurge towards the end
of the round as seen in the figure below (for each 15 second block)
In 3 groups no messages at all were exchanged in rounds 5 and 6, while in 3 groups more than 20
messages were exchange.
0
10
20
30
40
50
60
70
round 5
round 6
0
2
4
6
8
10
12
14
16
18
20
0 [1,5] [6,10] [11,20] [21,30]
Nu
mb
er o
f gr
ou
ps
Number of messages
31
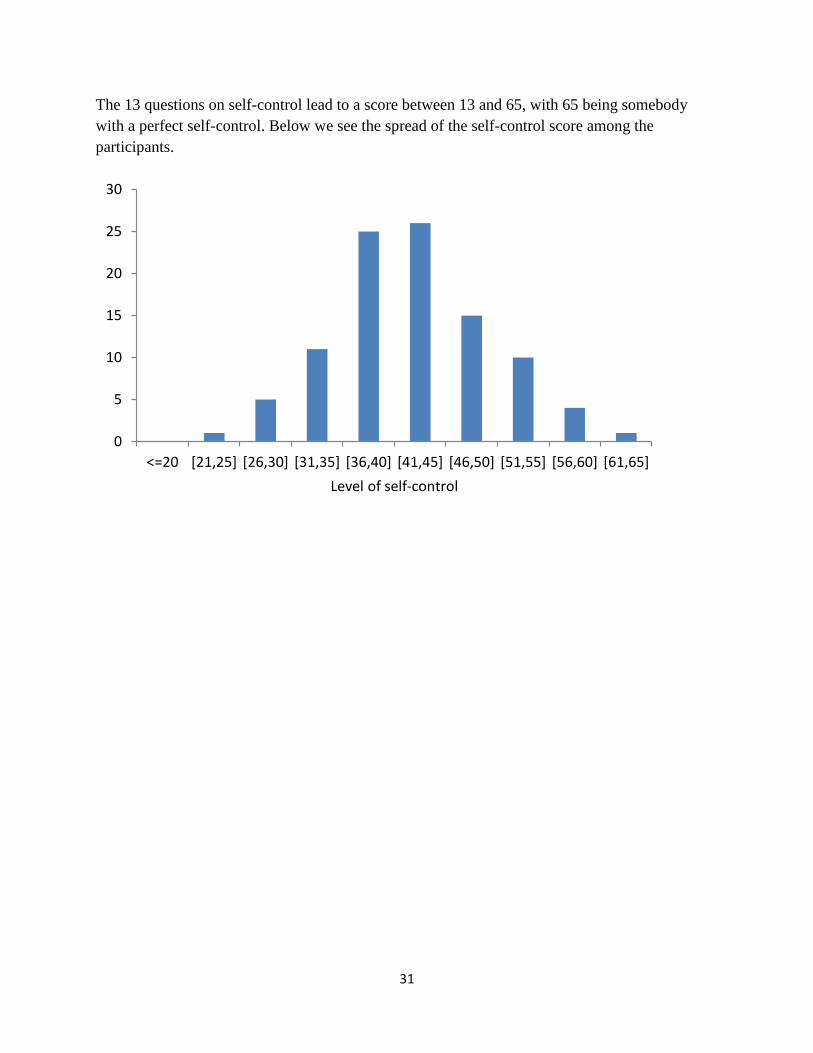
The 13 questions on self-control lead to a score between 13 and 65, with 65 being somebody
with a perfect self-control. Below we see the spread of the self-control score among the
participants.
0
5
10
15
20
25
30
<=20 [21,25] [26,30] [31,35] [36,40] [41,45] [46,50] [51,55] [56,60] [61,65]
Level of self-control