Embed Size (px)
Citation preview
Social Data Visualization with HTML5 and JavaScript
Simon Timms
Chapter No. 6
"Stack Overflow"

In this package, you will find: A Biography of the author of the book
A preview chapter from the book, Chapter NO.6 "Stack Overflow"
A synopsis of the book’s content
Information on where to buy this book
About the Author Simon Timms is a developer who works in the oil and gas industry in Calgary, Alberta.
He has a BSc in Computing Science from the University of Alberta and a Masters from
Athabasca University. He is interested in distributed systems, visualization, and the
acquisition of ice-cream.
This is his first book, but he blogs frequently on diverse topics such as code contracts and
cloud computing at . He is involved in the local .NET and
JavaScript community, and speaks frequently at conferences.
I would like to thank the countless open source developers who have
made books like this possible through their selfless creation of tools and
technologies , such as d3.js and node.js. These are the thinkers, the
makers, and the heroes who make the future possible.
Most of all, I would like to thank my wife and son for their undying
support while I spent my evenings writing. Without them, I would be
without purpose.
For More Information: www.packtpub.com/social-data-visualization-with-html5-and-javascript/book
Social Data Visualization with HTML5 and JavaScript The world is an interesting place, about this there can be no doubt. We experience the
world through our senses, which gather data to be processed by our brains. Frequently the
world is disordered, requiring us to think long and hard to get meaning out of things. To
ease this process, data can be transformed into other forms that are simpler to understand.
This book is about molding data into a form which is more understandable. It is about
taking some of the richest data sources of our time—social networks—and turning their
vast array of data into an understandable format. To that effect, we make use of the latest
in HTML and JavaScript.
What This Book Covers Chapter 1, Visualizing Data, introduces us to a world full of ever growing datasets. It
also discusses how this river of data can be navigated using visualizations as our canoe.
Chapter 2, JavaScript and HTML5 for Visualizations, looks at new features in HTML
and JavaScript that present opportunities for visualizing data. It discusses both canvas
and Scalable Vector Graphics.
Chapter 3, OAuth, examines the often confusing OAuth technology and shows how it can
be used to delegate authority to our application. This is because much of the data on
social media sites is private and there might be times when we need to get this data.
Chapter 4, JavaScript for Visualization, looks at Raphaël.js and d3.js which are great
JavaScript libraries that can reduce the pain involved in building visualizations by hand,
which is otherwise a time-consuming and error-prone task.
Chapter 5, Twitter, looks at how to retrieve data from Twitter and use it to build
a visualization.
Chapter 6, Stack Overflow, looks at how to retrieve the data API of the ever popular
Stack Overflow, which presents some tantalizing opportunities for visualization that can
be used to create an interactive graph.
Chapter 7, Facebook, explores the Facebook JavaScript API and how to use it to retrieve
data to use as the basis of our next visualization. In my mind, the original and still the
largest social media network on the planet is Facebook.
Chapter 8, Google+, looks at Google's latest foray into social media and how to retrieve
data to create a force-directed graph.
For More Information: www.packtpub.com/social-data-visualization-with-html5-and-javascript/book
Stack Overfl owIn 2008, the programming question market on the Internet was dominated by a company called Experts Exchange. Many were dissatisfi ed with the culture on the site and the requirement that people had to be registered to view answers. Programmers Jeff Atwood and Joel Spolsky launched the "question and answer" site, Stack Overfl ow. Since then, the site has, taken off, quickly growing to become one of the top 100 sites on the Internet. Users can ask and answer questions on the site about a wide variety of programming topics. Answering a question well or asking a well thought-out question wins reputation points, which are prominently displayed. Although, it's not a social media site like Facebook and Twitter, Stack Overfl ow's content is all user-created and user-moderated. Stack Overfl ow offers an API against which you can query for all sorts of interesting information.
AuthenticatingMuch of the query API is available without authenticating. However, if you want private information about users or want to write to the site, then you'll need to authenticate. There is also a much higher request limit for authenticated applications. Without authenticating, a single IP address is limited to 300 requests a day. With an authenticated application, this limit is raised to 10,000 requests.
Rate limitsMany social media sites use rate limits in their APIs. These limits are in place to prevent you from overloading the site, and also to save you from asking for too much data. Twitter processes more than 4,000 tweets a second. Without very special preparation, your infrastructure would quickly be overwhelmed if you were to process them all.
For More Information: www.packtpub.com/social-data-visualization-with-html5-and-javascript/book
Stack Overfl ow
[ 68 ]
Again, this is a site that makes use of OAuth to authorize users. However, they make use of OAuth 2.0, which is much easier than the OAuth 1.0a we used in the previous chapter. We'll limit ourselves to making use of public information to avoid authenticating. Should you wish to authenticate, I promise it is easier than Twitter. You can fi nd instructions at https://api.stackexchange.com/docs/authentication. Stack Overfl ow uses the same authorization system as Facebook, so the example from the OAuth chapter should work perfectly.
Creating a visualizationMany of the questions on Stack Overfl ow have a large number of answers. The site is not optimized to show the latest answers; the answers are ranked by being the most accepted answer then randomly. This is done to give all answers a chance at being shown near the top which should, in theory, encourage people to vote for the best answer instead of just the fi rst answer shown.
For this visualization, I would like to show how a question has been answered over time. Are more recent answers likely to get a higher score? Is the fi rst answer always the best?
Let's start by pulling down the data for an individual question which has a large number of answers. To do this, we'll make use of the questions API. All of the API endpoints are hosted on https://api.stackexchange.com. We're going to make use of the latest API which is Version 2.1. This is also encoded into the URI, as is the specifi c endpoint and the ID. Within the question API, we're interested in the answers, so we can query specifi cally for them, giving us a URI of https://api.stackexchange.com/2.1/questions/{id}/answers.
In the query string, we'll specify the site against which we want to query. Stack Exchange hosts several dozen question and answer sites modeled on Stack Overfl ow, all of which are served from the same API endpoint, so it is necessary to fi lter just for Stack Overfl ow by passing in site=stackoverflow:
function retrieveQuestionAnswers(id){ var page = 1; var has_more = true; var results = []; while(has_more) { $.ajax(https://api.stackexchange.com/2.1/questions/ + id + "/answers?site=stackoverflow&page=" + page,{ success: function(json){ has_more = json.has_more;
For More Information: www.packtpub.com/social-data-visualization-with-html5-and-javascript/book
Chapter 6
[ 69 ]
results = results.concat(json.items);}, failure: function() { has_more = false;}, async: false }); page++; } return results;}
Twitter provided us with the continuation tokens that we could pass back to Twitter to request the next page of data. Stack Overfl ow takes a different approach and assigns page numbers, allowing us to browse through the results with ease. Embedded in the response for every API call is a token called has_more, which is true whenever there are more pages of data that match the current query.
In this code, we make use of the continuation token and the page number to perform as many queries as necessary to retrieve all the answers. We are making use of the jQuery function ajax, instead of the more common getJson function, because we would like to retrieve the data synchronously. We do this because we want the entire dataset at one time. If your visualization allows for data to be added dynamically then you can relax the async:false requirement.
What's returned is an array of objects, each one of which represents an answer to a question. If we give the retrieveQuestionAnswers method an ID such as 901115, then we'll get back an array of 50 answers. These come back over the course of two requests and the code above merges them together into the results array which is returned.
Each Answer contains a number of fi elds. A list of the fi elds returned by default can be found at https://api.stackexchange.com/docs/types/answer. For the purpose of our visualization, we're most interested in when the answer was originally suggested, its score, and also whether it was chosen as the accepted answer. These bits of information can be found in the fi elds: creation_date, score, and is_accepted. We'll ignore the rest of the fi elds for now.
Now that we have some basic data, we can start thinking about the visualization. We're trying to convey the relationship between the age of a question and its score. This sounds a lot like a use for a scatter plot. The data points stand on their own and can be placed along two axis, date and points. My theory before starting on this that answers that are older will tend to have a higher score, because they've been around longer to gather points. People are programmed to believe that numbers going up are positive, so let's play to that and plot points versus age which will, if my theory holds, have higher values on the right.
For More Information: www.packtpub.com/social-data-visualization-with-html5-and-javascript/book
Stack Overfl ow
[ 70 ]
Of course, a scatter plot is boring and nothing we couldn't generate outside of Excel. We'll add some interactivity to it, but to start, we'll still need a simple scatter plot.
This is easily done with a couple of scales and some circles, as shown in the following code:
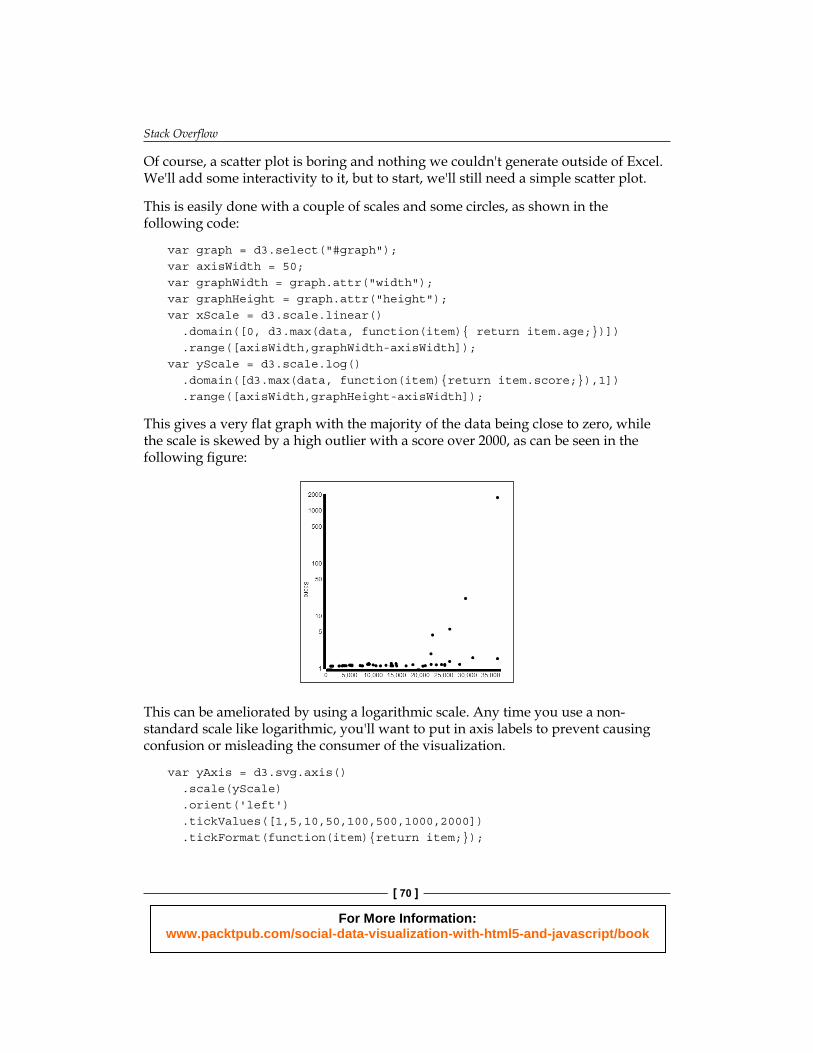
var graph = d3.select("#graph");var axisWidth = 50;var graphWidth = graph.attr("width");var graphHeight = graph.attr("height");var xScale = d3.scale.linear() .domain([0, d3.max(data, function(item){ return item.age;})]) .range([axisWidth,graphWidth-axisWidth]);var yScale = d3.scale.log() .domain([d3.max(data, function(item){return item.score;}),1]) .range([axisWidth,graphHeight-axisWidth]);
This gives a very fl at graph with the majority of the data being close to zero, while the scale is skewed by a high outlier with a score over 2000, as can be seen in the following fi gure:
This can be ameliorated by using a logarithmic scale. Any time you use a non-standard scale like logarithmic, you'll want to put in axis labels to prevent causing confusion or misleading the consumer of the visualization.
var yAxis = d3.svg.axis() .scale(yScale) .orient('left') .tickValues([1,5,10,50,100,500,1000,2000]) .tickFormat(function(item){return item;});
For More Information: www.packtpub.com/social-data-visualization-with-html5-and-javascript/book
Chapter 6
[ 71 ]
graph.append("g") .attr("transform", "translate(" + axisWidth +",0)") .call(yAxis);graph.append("text") .attr("x", "0") .attr("y", graphHeight/2) .attr("transform", "rotate(90, 0, " + graphHeight/2 + ")") .text("Score");
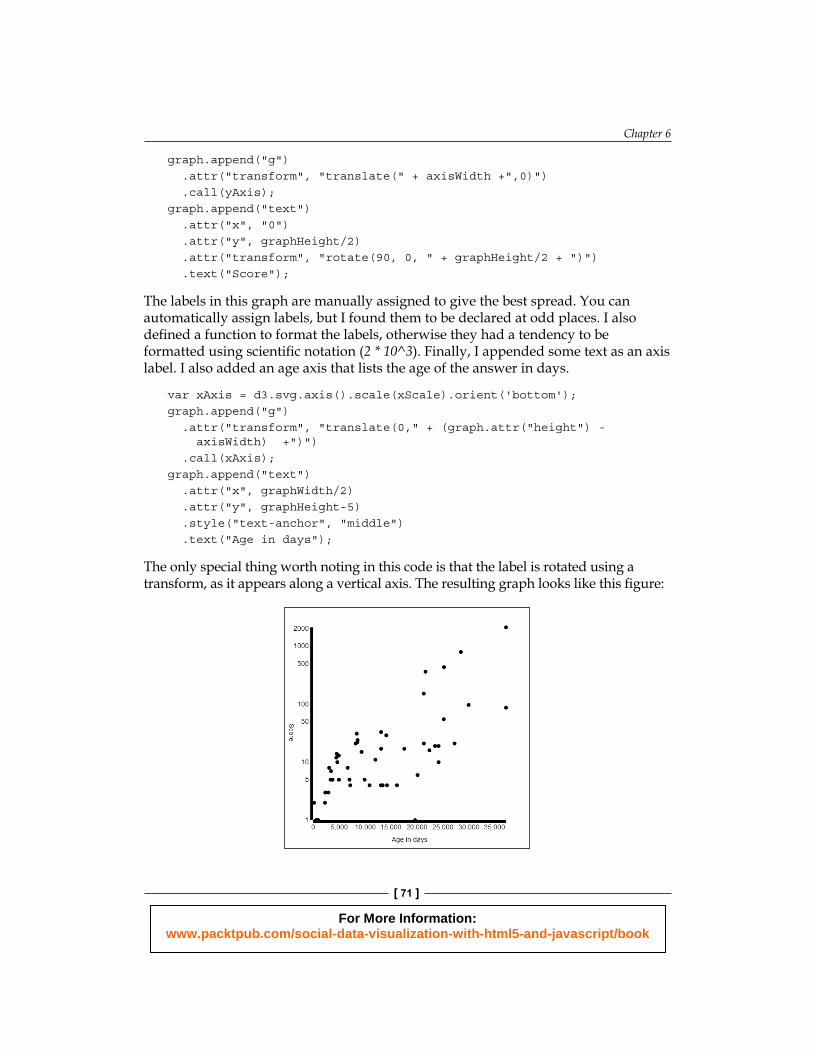
The labels in this graph are manually assigned to give the best spread. You can automatically assign labels, but I found them to be declared at odd places. I also defi ned a function to format the labels, otherwise they had a tendency to be formatted using scientifi c notation (2 * 10^3). Finally, I appended some text as an axis label. I also added an age axis that lists the age of the answer in days.
var xAxis = d3.svg.axis().scale(xScale).orient('bottom');graph.append("g") .attr("transform", "translate(0," + (graph.attr("height") - axisWidth) +")") .call(xAxis);graph.append("text") .attr("x", graphWidth/2) .attr("y", graphHeight-5) .style("text-anchor", "middle") .text("Age in days");
The only special thing worth noting in this code is that the label is rotated using a transform, as it appears along a vertical axis. The resulting graph looks like this fi gure:
For More Information: www.packtpub.com/social-data-visualization-with-html5-and-javascript/book
Stack Overfl ow
[ 72 ]
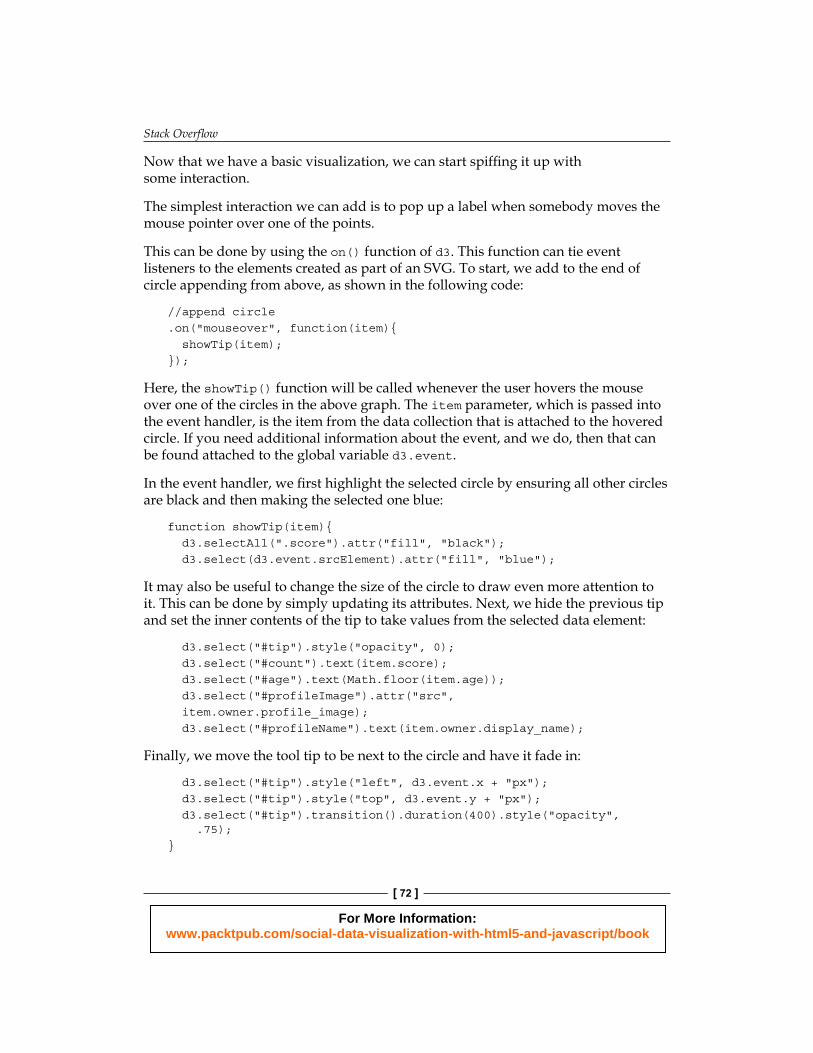
Now that we have a basic visualization, we can start spiffi ng it up with some interaction.
The simplest interaction we can add is to pop up a label when somebody moves the mouse pointer over one of the points.
This can be done by using the on() function of d3. This function can tie event listeners to the elements created as part of an SVG. To start, we add to the end of circle appending from above, as shown in the following code:
//append circle.on("mouseover", function(item){ showTip(item);});
Here, the showTip() function will be called whenever the user hovers the mouse over one of the circles in the above graph. The item parameter, which is passed into the event handler, is the item from the data collection that is attached to the hovered circle. If you need additional information about the event, and we do, then that can be found attached to the global variable d3.event.
In the event handler, we fi rst highlight the selected circle by ensuring all other circles are black and then making the selected one blue:
function showTip(item){ d3.selectAll(".score").attr("fill", "black"); d3.select(d3.event.srcElement).attr("fill", "blue");
It may also be useful to change the size of the circle to draw even more attention to it. This can be done by simply updating its attributes. Next, we hide the previous tip and set the inner contents of the tip to take values from the selected data element:
d3.select("#tip").style("opacity", 0); d3.select("#count").text(item.score); d3.select("#age").text(Math.floor(item.age)); d3.select("#profileImage").attr("src", item.owner.profile_image); d3.select("#profileName").text(item.owner.display_name);
Finally, we move the tool tip to be next to the circle and have it fade in:
d3.select("#tip").style("left", d3.event.x + "px"); d3.select("#tip").style("top", d3.event.y + "px"); d3.select("#tip").transition().duration(400).style("opacity", .75);}
For More Information: www.packtpub.com/social-data-visualization-with-html5-and-javascript/book
Chapter 6
[ 73 ]
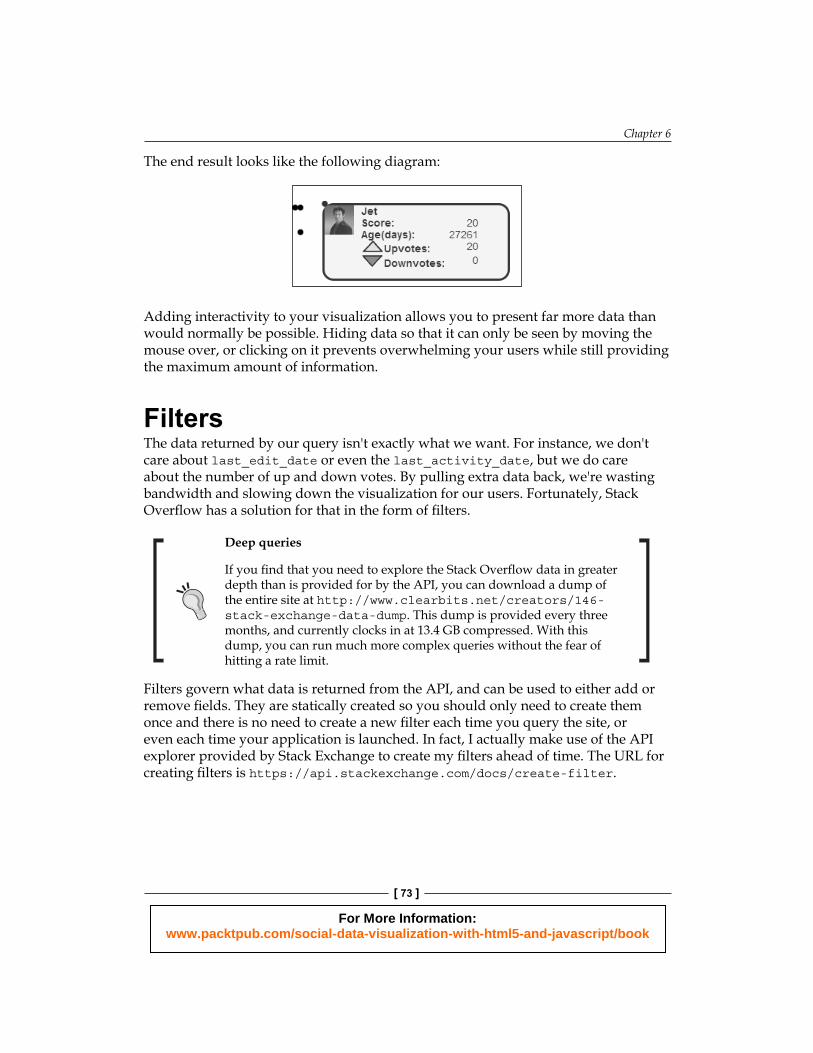
The end result looks like the following diagram:
Adding interactivity to your visualization allows you to present far more data than would normally be possible. Hiding data so that it can only be seen by moving the mouse over, or clicking on it prevents overwhelming your users while still providing the maximum amount of information.
FiltersThe data returned by our query isn't exactly what we want. For instance, we don't care about last_edit_date or even the last_activity_date, but we do care about the number of up and down votes. By pulling extra data back, we're wasting bandwidth and slowing down the visualization for our users. Fortunately, Stack Overfl ow has a solution for that in the form of fi lters.
Deep queries
If you fi nd that you need to explore the Stack Overfl ow data in greater depth than is provided for by the API, you can download a dump of the entire site at http://www.clearbits.net/creators/146-stack-exchange-data-dump. This dump is provided every three months, and currently clocks in at 13.4 GB compressed. With this dump, you can run much more complex queries without the fear of hitting a rate limit.
Filters govern what data is returned from the API, and can be used to either add or remove fi elds. They are statically created so you should only need to create them once and there is no need to create a new fi lter each time you query the site, or even each time your application is launched. In fact, I actually make use of the API explorer provided by Stack Exchange to create my fi lters ahead of time. The URL for creating fi lters is https://api.stackexchange.com/docs/create-filter.
For More Information: www.packtpub.com/social-data-visualization-with-html5-and-javascript/book
Stack Overfl ow
[ 74 ]
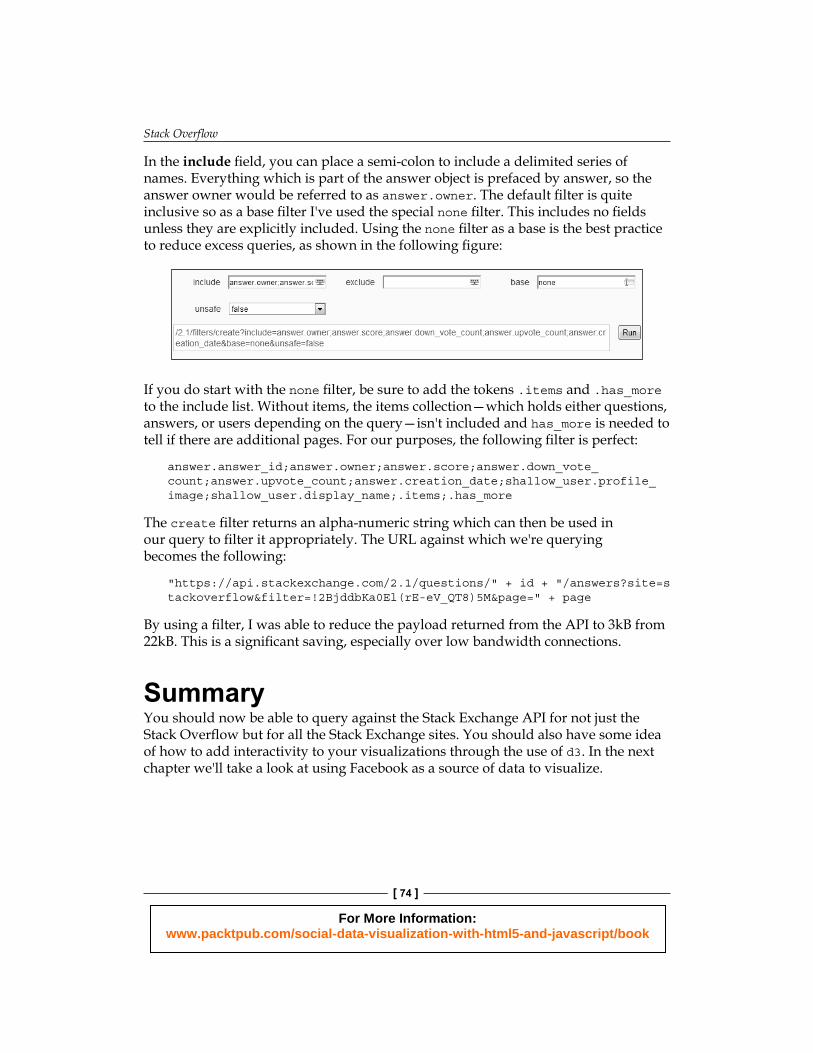
In the include fi eld, you can place a semi-colon to include a delimited series of names. Everything which is part of the answer object is prefaced by answer, so the answer owner would be referred to as answer.owner. The default fi lter is quite inclusive so as a base fi lter I've used the special none fi lter. This includes no fi elds unless they are explicitly included. Using the none fi lter as a base is the best practice to reduce excess queries, as shown in the following fi gure:
If you do start with the none fi lter, be sure to add the tokens .items and .has_more to the include list. Without items, the items collection—which holds either questions, answers, or users depending on the query—isn't included and has_more is needed to tell if there are additional pages. For our purposes, the following fi lter is perfect:
answer.answer_id;answer.owner;answer.score;answer.down_vote_count;answer.upvote_count;answer.creation_date;shallow_user.profile_image;shallow_user.display_name;.items;.has_more
The create fi lter returns an alpha-numeric string which can then be used in our query to fi lter it appropriately. The URL against which we're querying becomes the following:
"https://api.stackexchange.com/2.1/questions/" + id + "/answers?site=stackoverflow&filter=!2BjddbKa0El(rE-eV_QT8)5M&page=" + page
By using a fi lter, I was able to reduce the payload returned from the API to 3kB from 22kB. This is a signifi cant saving, especially over low bandwidth connections.
SummaryYou should now be able to query against the Stack Exchange API for not just the Stack Overfl ow but for all the Stack Exchange sites. You should also have some idea of how to add interactivity to your visualizations through the use of d3. In the next chapter we'll take a look at using Facebook as a source of data to visualize.
For More Information: www.packtpub.com/social-data-visualization-with-html5-and-javascript/book
Where to buy this book You can buy Social Data Visualization with HTML5 and JavaScript from the Packt
Publishing website:
.
Free shipping to the US, UK, Europe and selected Asian countries. For more information, please
read our shipping policy.
Alternatively, you can buy the book from Amazon, BN.com, Computer Manuals and
most internet book retailers.
www.PacktPub.com
For More Information: www.packtpub.com/social-data-visualization-with-html5-and-javascript/book