Embed Size (px)
Citation preview

UNIVERSITÀ DELLA CALABRIA
Dipartimento di Economia e Statistica Ponte Pietro Bucci, Cubo 0/C
87036 Arcavacata di Rende (Cosenza) Italy
http://www.ecostat.unical.it/
Working Paper n. 14 - 2010
SOCIAL COMPARISON AND SUBJECTIVE WELL-BEING:
DOES THE HEALTH OF OTHERS MATTER?
Vincenzo Carrieri Dipartimento di Economia and Statistica
Università della Calabria Ponte Pietro Bucci, Cubo 0/C
Tel.: +39 0984 492433 Fax: +39 0984 492421
e-mail: [email protected]
Luglio 2010

Social Comparison And Subjective Well-being
Social comparison and subjective well-being:
Does the health of others matter?(†)
Vincenzo Carrieri (*)
Department of Economics and Statistics
University of Calabria
Abstract
The importance of social comparison in shaping individual utility has been
widely documented by subjective well-being literature. So far, income has
been the main dimension considered in social comparison. This paper aims
to investigate whether subjective well-being is influenced by inter-personal
comparison with respect to health. Thus, we study the effects of the health
of others and relative health hypothesis on two measures of subjective well-
being: happiness and subjective health. Using data from the Italian Health
Conditions survey, we show that a high incidence of chronic conditions and
disability among reference groups negatively affects both happiness and
subjective health. Such effects are stronger among people in the same
conditions. These results, robust to different econometric specifications and
estimation techniques, suggest the presence of some sympathy in individual
preferences with respect to health and reveal that other people‟s health
status serves as a benchmark to assess one‟s own health conditions.
JEL classification: C21; D64; I31
Keywords: health conditions; social comparison; subjective well-being.
(†) I wish to thank Maria De Paola for her comments, ideas and suggestions on a preliminary version of this
paper. Thanks are also due to Elena Granaglia, Leandro Elia and Paolo Trevisan for their comments. The usual
disclaimers apply.
(*)Address: Department of Economics and Statistics, Ponte Bucci, Cubo 0/C, University of Calabria, 87036
Arcavacata di rende (CS). Tel (39) 0984-492433. E-mail: [email protected]

Social Comparison And Subjective Well-being
I. INTRODUCTION
Investigating the determinants of individual well-being is becoming a popular task among empirical
economists. Research on this topic has become even more popular in recent years, thanks to the
availability of surveys on self-rated happiness and life satisfaction for many countries.
However, measuring utility poses a number of relevant problems. Some scholars have
showed that self-rated happiness scores are not completely reliable, as they can be influenced by
contingent circumstances and recall bias due to the temporal sequence of relevant events. Others
argue that happiness scores are subject to important cultural biases among countries (Ostroot and
Snyder, 1985) 1
. Despite these difficulties, research on subjective well-being is important for many
reasons, especially on normative grounds. Measuring happiness permits, for instance, the evaluation
of the welfare net effects of policies which imply some kind of trade-off (ie inflation vs
unemployment) (Frey and Stutzer, 2002); it allows the estimation of the effects on utility of
institutional aspects, such as public governance (Helliwell 2003) or the estimation of the value that
people assign to non-marketable goods, such as health or environment (Ferrer-i-Carbonell and van
Praag, 2002; Clark and Oswald, 2002; De Mello and Tiongson, 2009). In addition, investigating the
determinants of subjective well-being can help “to shed new light on basic concepts and
assumptions of economic theory” (Frey and Stutzer, 2002, p. 403).
Leaving aside many important contributions by other research communities (mainly
philosophers, psychologist and sociologist) the main interest of economists on this topic has been
the investigation of the role of income on happiness. Standard neo-classical theory suggests, in fact,
that income positively affects utility, allowing individuals to buy consumption and investment
goods. The empirical research has provided support to this assumption showing that income plays a
crucial role in defining individual well-being.
More recently, with the intention to interpret the well-known Easterlin paradox (1974), well-
being literature has shown that relative income, more than absolute income, drives happiness.
People get utility not only by objective conditions (i.e. higher income) but also by social
comparison. In other words, it is not income per se that matters for utility but rather the position a
person has in society.
In the same period, similar conclusions have been reached by other research communities
(mainly epidemiologists and sociologists) focused on understanding health inequalities among
1 We recall just a few of the methodological criticisms on happiness scores. A detailed elaboration of this critique is
presented in Kahneman et al. (1999).

Social Comparison And Subjective Well-being
different social groups. This research stream has highlighted that relative income contributes to the
enhancement of both subjective and objective health conditions by reducing health-damaging
factors such as stress and social isolation and by increasing health-promoting factors such as a good
diet and physical exercise.
In summary, these two research streams suggest that inter-personal comparison strongly
influences the subjective assessment of happiness and health, but so far, income has been the only
dimension considered in social comparison.
This paper analyses the role of interpersonal comparison with respect to health on happiness
and subjective health using data from the Italian Health Conditions survey 2004-2005 (Condizioni
di salute e ricorso ai servizi sanitari) . Our approach follows the idea that happiness and health
present a lot of structural analogies, being two related dimensions of human well-being. Unlike
most literature focused on the influence of income in social comparison, we consider the role of
health as a dimension of social comparison. A social comparison with respect to health is to be
expected being that health is the main determinant of individual well-being, probably much more
than income (Ferrer-i-Carbonell and van Praag, 2002; Clark and Oswald, 2002; De Mello and
Tiongson ,2009; Frey and Stutzer, 2002). Furthermore, some interest in the health of others may
rely on two grounds. First, individuals might care about others‟ health status, because of altruism or
sympathy2. Second, other‟s health status may matter for individuals as a benchmark to assess their
own health conditions. This hypothesis is part of the debate around the reliability of subjective
health as a proxy of objective health (see Sen, 2002 or Bago d‟Uva et al. 2008, for a discussion)
Controlling for various conventional determinants of subjective well-being and using a
standard reference group identification criteria, we find that a high incidence of chronic and
disability conditions in the reference group affects negatively both happiness and subjective health
and that this effect is stronger among people with similar health conditions. These results are robust
to different econometric specifications and estimation techniques. In addition, despite some
peculiarities, our results are valid even across people with a likely different cultural background
(living in the North vs the South of the country).
2 The difference between these two concepts relies on the validity of the hypothesis of selfish individuals. According to
Sen‟s sympathy concept (1977), the presence of some interest on the well-being of others could be explained even
without relaxing the hypothesis of self-interested individuals. As Sen (op cit. p. 95) states “behaviour based on
sympathy is in an important sense egoistic for one is one-self pleased at others‟ pleasure and pained at others‟ pain and
the pursuit of one‟s own utility may thus be helped by sympathetic action” . Sympathy can be viewed, then in terms of
externalities. The importance of this concept in health care has been highlighted by Culyer (1976).

Social Comparison And Subjective Well-being
The rest of the paper is organized as follows. Section two briefly summarizes literature on the
importance of social comparison for subjective well-being. Section three presents the data. Section
four sketches out the empirical model and describes the variables used in the analysis, along with
some descriptive statistics. Section five presents and discusses the results along with some
robustness checks. The last section summarizes and concludes.
II. SOCIAL COMPARISON AND SUBJECTIVE WELL-BEING
After the Easterlin (1974) seminal paper, subjective-well being research has been deeply concerned
about the influence of social comparison in shaping individual utility. By showing the flat level of
happiness in the last 100 years even in the presence of a strong increase in absolute income,
Easterlin‟s paper (1974) has been a cornerstone for happiness research for two reasons. On the one
hand, it suggests that income plays a minor role in happiness once an individual rises above a
poverty line or „subsistence level‟, while on the other hand, it implies that happiness depends
strongly on relative status.
To put it formally, what seems to matter for happiness is individual income compared to the
income of a “reference group”:
(1)
where is individual income at time and is the income of individual i’s “reference group” at
time . Theoretical literature has suggested two definitions of reference income group, both internal
(past individual income) and external (where comparisons refer to distinct demographic groups such
as one‟s own family, other workers at the individual‟s place of employment, people in the same
neighbourhood, region, country, or even people across a whole set of countries). Both definitions
have lead to the same result, namely, that income cannot buy happiness per se, but relative income
can (Clark et al., 2007; Heady, 1991; Diener, et. al., 1993; Frey and Stutzer, 2000; Easterlin, 2001;
Van Praag and Ferrer-i-Carbonell, 2004).
Many scholars from various research communities (mainly epidemiologists and sociologists)
investigating the social determinants of health have reached similar conclusions, that is, social
comparison does matter. The bulk of literature found that, in richer countries, relative income is the
first predictor of health (both subjective and objective), even greater than any other individual risk
factor (Marmot and Wilkinson, 2006). People in lower relative status, in fact, are likely to be
exposed to behavioural risks (such as smoking, low exercise, diet) and to psychosocial risks such as
stress and social isolation that are health damaging, both on mental and physical grounds
Social Comparison And Subjective Well-being
(Kakwachi et al, 1997, Kakwachi and Kennedy, 1997, Wilkinson, 1996; Hsieh e Pugh, 1993). Such
factors also accumulate together, showing a high intergenerational persistence (Power et al. 1998).
Therefore, happiness and subjective health research seems to support the idea that social
comparison is a key factor for subjective well-being. So far, income has been the main dimension
considered. In this work we argue that this view is too restrictive because inter-personal comparison
is likely to be performed even with respect to other dimensions of well-being. Health status is
probably one of these for three reasons.
Firstly, health is the most important determinant of individual well-being. Clark and Oswald
(2002), for instance, show that the largest valuation in happiness comes from health status, and an
individual whose „„health declines from excellent to good would require a payment of tens of
thousands of pounds per month in order for the happiness score to remain unchanged‟‟. Frey and
Stutzer (2002, p.56) remark that “when people are asked to evaluate the importance of various areas
of their lives, good health obtains the higher rating”. Ferrer-i-Carbonell and van Praag, (2002) and
De Mello and Tiogson (2009) reach similar results. In addition, health conditions strongly correlate
with other dimensions of well-being such as job satisfaction (Sales and House, 1971; Wall et al.,
1978).
Secondly, one might be interested in the health of others both on altruism and sympathy
grounds. People might care about the health of others because they are not selfish or because
staying with people in good health increases their individual utility. As Culyer (1976) suggests,
others‟ illness influences well-being, not only because of the risk to be infected, but because most
people care.
Finally, other‟s health status might serve as a benchmark to assess one‟s own health
conditions. Indeed, self-assessment of health status is influenced by the expectations for one‟s own
health, that is likely to be based on the health conditions of some reference group. This idea is also
part of the debate around the reliability of subjective health as a proxy of objective health (see Sen,
2002 or Bago d‟Uva et al., 2008 for a discussion).
Hence, we believe that the role of health as a dimension of social comparison should be further
investigated. Such analysis is generally absent in subjective well-being literature and even studies
on altruism and happiness lack an explicit health dimension (see Schwarze and Winkelmann, 2005,
for a discussion). 3
This paper will try to fill this gap by exploring how health conditions of other
people affect individual happiness and subjective health.
3De Mello and Tiongson (2009) are a noteworthy exception given that they explore the effect of family‟s health on
individual happiness suggesting the presence of altruism in individual preferences. They don‟t consider, anyway,
relative health effects and they do explore family‟s health rather than health of a reference group. This casts some
doubts about the fact that a positive sign of family‟s health coefficient on happiness can be interpreted only on altruism
Social Comparison And Subjective Well-being
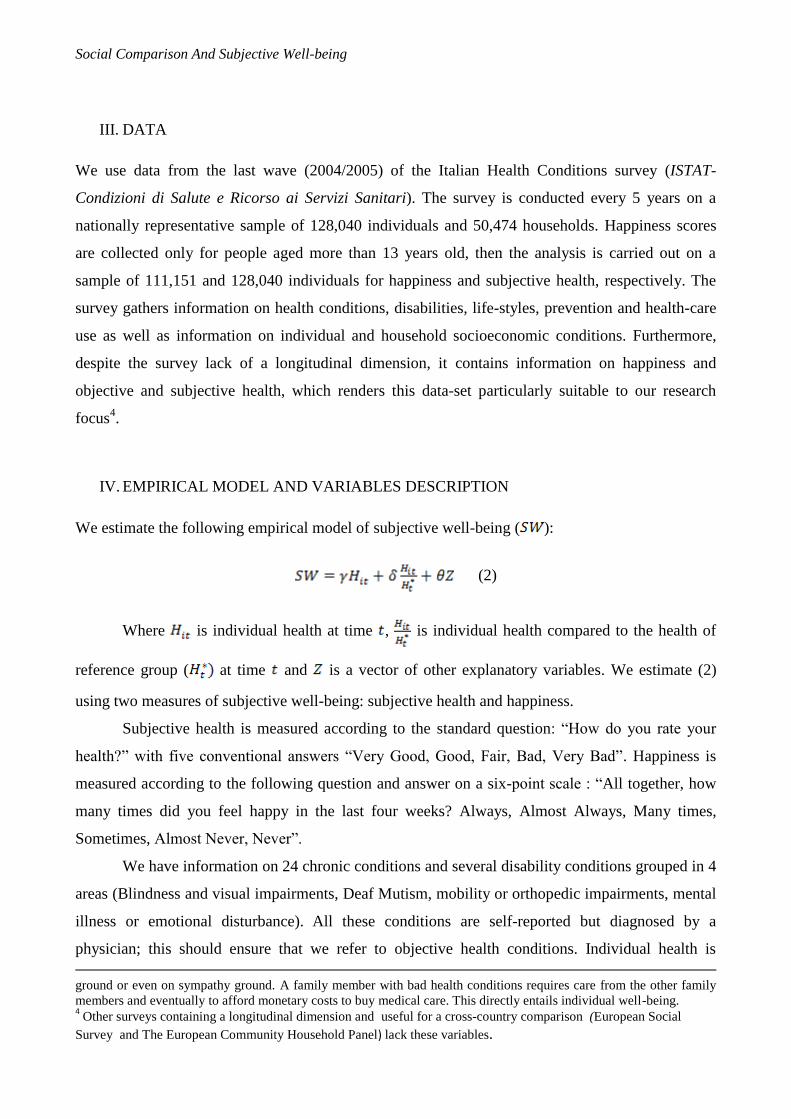
III. DATA
We use data from the last wave (2004/2005) of the Italian Health Conditions survey (ISTAT-
Condizioni di Salute e Ricorso ai Servizi Sanitari). The survey is conducted every 5 years on a
nationally representative sample of 128,040 individuals and 50,474 households. Happiness scores
are collected only for people aged more than 13 years old, then the analysis is carried out on a
sample of 111,151 and 128,040 individuals for happiness and subjective health, respectively. The
survey gathers information on health conditions, disabilities, life-styles, prevention and health-care
use as well as information on individual and household socioeconomic conditions. Furthermore,
despite the survey lack of a longitudinal dimension, it contains information on happiness and
objective and subjective health, which renders this data-set particularly suitable to our research
focus4.
IV. EMPIRICAL MODEL AND VARIABLES DESCRIPTION
We estimate the following empirical model of subjective well-being ( ):
(2)
Where is individual health at time , is individual health compared to the health of
reference group ( at time and is a vector of other explanatory variables. We estimate (2)
using two measures of subjective well-being: subjective health and happiness.
Subjective health is measured according to the standard question: “How do you rate your
health?” with five conventional answers “Very Good, Good, Fair, Bad, Very Bad”. Happiness is
measured according to the following question and answer on a six-point scale : “All together, how
many times did you feel happy in the last four weeks? Always, Almost Always, Many times,
Sometimes, Almost Never, Never”.
We have information on 24 chronic conditions and several disability conditions grouped in 4
areas (Blindness and visual impairments, Deaf Mutism, mobility or orthopedic impairments, mental
illness or emotional disturbance). All these conditions are self-reported but diagnosed by a
physician; this should ensure that we refer to objective health conditions. Individual health is
ground or even on sympathy ground. A family member with bad health conditions requires care from the other family
members and eventually to afford monetary costs to buy medical care. This directly entails individual well-being. 4 Other surveys containing a longitudinal dimension and useful for a cross-country comparison (European Social
Survey and The European Community Household Panel) lack these variables.

Social Comparison And Subjective Well-being
measured, then, through a dummy variable equal to one if an individual suffers from one or more
chronic or disability conditions and zero otherwise. We use two measures to define Health of
others. First, along with De Mello and Tiongson (2009), we refer to family health. One question in
the data-set explicitly asks if one household member had suffered or suffers from a severe illness;
we build a dummy equal to one in this case and equal to zero otherwise. As a second measure of the
Health of others, we use the proportion of persons that suffer from chronic and disability conditions
among the individual reference group. Reference group of individual i is identified by the people
who are 5 years older or younger than i, living in the same region, having attained a similar level of
education (one degree above or below ISCED category than individual i), are in the same socio-
professional status (unemployed, retired, etc.) and live in the same area (rural/urban). This reference
group identification is quite common in happiness literature (see Ferrer-I-Carbonell, 2005 and
Mcbride, 2001). The living area variable is probably less common, but we prefer to use it given that
generally health profiles are very different among people living in rural and urban areas. Then, the
effect of Relative health is measured by the interaction between individual health and the proportion
of people suffering from chronic diseases or disabilities in the reference group.
Vector contains the following variables: individual socio-professional status
(unemployed, employed, housekeeper, unable to work, retired, other categories), housing conditions
(problems with light, humidity, heating), living area (urban/rural), marital status (single, married,
divorced, separated, widow), sex, education (5 ISCED levels), a polynomial specification of age
and some measures of relational goods and social capital (namely, the feeling of presence/no
presence of relatives, friends, neighbours and volunteer organization in case of any personal need).
It is noteworthy to observe that the variables used to identify the reference group of individual i
(age, education, socio-professional status and living area) are all included in the regressors set. This
should ensure that the coefficient in equation (2) is not contaminated by the variables chosen to
identify the groups.
Unfortunately the data-set we use does not contain information on income but it provides
information with self-evaluation of family economic resources on a four point scale: optimum
circumstances, fair, insufficient, absolutely insufficient. We use four dummies to measure it.
In the subjective health equation we also add some variables of health care use, such as having had
a medical visit in the last four weeks and the days of hospitalization in the last three months. The
underlying hypothesis is that health care consumption can increase health status but it does not
generate utility per se. Summary statistics and a description of all variables are presented in Table
1A (Appendix). In the case of qualitative variables, the first category presented is always the one
chosen as a reference in the model.

Social Comparison And Subjective Well-being
We estimate equation (2) using both an OLS and ordered probit estimator. Both regressions are
run correcting covariance-matrix for intra-reference group correlation, in order to avoid the so-
called “Moulton problem” (Moulton, 1986). In section 4.1 and 4.2 some other empirical
specifications are used, in order to check the robustness of our results.
V. RESULTS
Estimates of equation (2) for happiness and subjective health are presented in Table 2and table 2A
(Appendix) 5
. Qualitatively, OLS and ordered probit estimations lead to similar results both with
respect to signs and statistical significance.
Before discussing the main variable of interest, we briefly have a look at the other explanatory
variables. The results we found are pretty standard in the empirical literature of subjective well-
being, but what is interesting is that happiness and subjective health seems to depend on very
similar factors. Indeed, we find that objective health, economic circumstances, education,
employment status, social capital and housing conditions are positive determinants of both
happiness and subjective health. A positive effect of education on happiness has been found also by
Easterlin (2005) while with respect to subjective health, our results are coherent with Furnèe et al.
(2008). The effect of employment on happiness is in line with other papers (Clark and Oswald,
1994; Darity and Goldsmith, 1996; Frey and Stutzer, 2002). Concerning relational goods, a positive
effect on happiness has been found by Bruni and Stanca (2008), while a positive role of relational
goods and social capital on health has been found by Joshi et al. (2000), Kakwachi et al. (1997),
Kakwachi and Kennedy (1997), Wilkinson (1996). Regarding studies on Italian data, the effects of
economic circumstances, education, employment status and social capital on happiness that we
found are coherent with Scoppa and Ponzo (2008). Finally, we find that happiness and subjective
health are higher among males and have a non-linear relation with respect to age (the non linear
relation between happiness and age has been found also by Blanchflower and Oswald, 2007). As a
non-standard result, we find that subjective well-being is negatively influenced by housing
problems. The relation between housing problems and health is well-documented in literature (see
Joshi et al., 2000), while the effect on happiness is novel. Once again, this finding supports the idea
that happiness and subjective health determinants are strongly comparable.
5 We show the results based on 104,342 and 109,129 individuals for happiness and subjective health analysis,
respectively. The figures are slightly different to the ones shown in section 2, because we retain only the reference
groups comprised of at least 10 individuals. We end-up, then, with 464 reference groups with an average of 269 peers
for each group. This choice relies on the belief that a reference group with very few individuals turns out to be
inappropriate for the social comparison process we have in mind. Anyway, we did not notice any important difference
when estimating the model including all the reference groups.

Social Comparison And Subjective Well-being
With respect to the key variable of our paper, we find (Table 2) that health strongly matters for
social comparison. We find that as the health of the reference group decreases (a higher proportion
of chronic and disabled individuals) both happiness and subjective health decreases. The same
occurs with respect to the health of family members which is also a positive determinant of both
happiness and subjective health. This last result is in line with De Mello and Tiongson (2009)
while, to the best of our knowledge, there are no previous papers that have investigated the relation
between the health of the reference group and subjective well-being. Furthermore, we find that the
effect of the health of the reference group is stronger among people in bad health conditions. This
result occurs both with respect to happiness and subjective health. It seems, then, that both
benchmark and sympathy hypotheses are confirmed. People seem to use others‟ health status as a
benchmark to assess one‟s own health conditions and because they care about others‟ health status.
In particular, the sympathy hypothesis seems to hold with respect to happiness results given that
people in bad health may have more consideration towards persons with similar conditions.
Table 2. Estimates results (Main covariates)- Health of reference group and relative health hypothesis
Main Covariates (1)
Happiness
OLS
(2)
Happiness
Ordered Probit
(3)
Subjective health
OLS
(4)
Subjective health
Ordered Probit
Proportion of sick
in the reference group
-0.359*** -0.362*** -0.293*** -0.573***
(-4.96) (-5.39) (-6.93) (-7.62)
Sick*proportion of sick
in the reference group
-0.255*** -0.176*** -0.251*** -0.320***
(-5.63) (-4.20) (-10.09) (-7.30)
N 104342 104342 109129 109129
Asjusted R2 0.167 0.431
Log-Likelihood -164372.1 -153523.0 -108502.7 -106223.2
Chi-Square Stat. 13011.2 30249.1
t- statistics in parentheses. Standard errors are clustered on 464 reference groups * p < .10, ** p < .05, *** p < 0.01

Social Comparison And Subjective Well-being
1. Robustness Check
In this section, we deal with one issue that might weaken the casual relationship we found between
the health of the reference group and subjective well-being. Indeed, it can be argued that this
relationship might arise because we do not consider the effect of the income of the reference group
in our regressions. Empirical evidence, in fact, shows that people in better economic circumstances
are even in better health (see Van Doorslaer and Koolman 2004, among others). An effect of the
income of the reference group on subjective well-being, then, could bias the coefficient of
equation (2).
To work-out such troubles, we re-run equation (2), adding as covariates, a measure of the
proportion of people reporting to be in optimum economic circumstances in the reference group.
Estimate results of such estimates are presented in Table 3 (All covariates are presented in Table 3A
in appendix).
In these new estimates, both the coefficients of health of the reference group and relative
health are still significant at 1%. In OLS estimates the effect is smaller in magnitude. This means
that a small part of the effect of the reference group‟s health is due to an income effect, but health
per se has a very significant effect on subjective well-being.
As for the income of the reference group, we find a slightly significant effect only on
subjective health (10% of significance). In any case, we would advise not to rely too strongly on
this coefficient, since a subjective evaluation of economic circumstances and endogeneity problems
may lead to biased estimates. For our concerns, what is important is that controlling for the income
of the reference group does not change our main results.

Social Comparison And Subjective Well-being
Table 3. Robustness check (Main Covariates)
Main Covariates (1)
Happiness
OLS
(2)
Happiness
Ordered Probit
(3)
Subjective health
OLS
(4)
Subjective health
Ordered Probit
Proportion of rich
in the reference group
0.117 0.146 -0.162* -0.267*
(0.58) (0.82) (-1.72) (-1.66)
Proportion of sick
in the reference group
-0.354*** -0.356*** -0.299*** -0.584***
(-4.88) (-5.28) (-7.03) (-7.71)
Sick*proportion of sick
in the reference group
-0.254*** -0.175*** -0.251*** -0.320***
(-5.62) (-4.18) (-10.11) (-7.32)
N 104342 104342 109129 109129
Asjusted R2 0.167 0.432
Log-Likelihood -164371.8 -153522.5 -108500.9 -106221.5
Chi-Square Stat. 13039.6 30091.6
t- statistics in parentheses. Standard errors are clustered on 464 reference groups * p < .10, ** p < .05, *** p < 0.01
2. Robustness to cultural differences
As a further robustness check, we try to deal with a potential cultural effect that may systematically
change the determinants of subjective well-being across people with different cultural backgrounds.
Indeed, one important criticism to the use of happiness scores for the assessment of human well-
being determinants relies on the possible presence of a cultural bias among countries (Ostroot and
Snyder,1985). Such cultural bias could depend on language differences, the familiarity with
concepts such as 'happiness' and 'satisfaction' and the social desirability of the responses. This fact
is strongly related to values and attitudes of people living in the same community which may
systematically affect the perception of what a happy life means. Ostroot and Snyder (1985)
demonstrate that cultural differences can deeply affect cross-country comparison of happiness
scores, contributing to the explanation of 40% of the differences in life satisfaction between the
French and the Americans, for instance.

Social Comparison And Subjective Well-being
Even for subjective health assessment, cultural aspects may be relevant. Let‟s think for
example about religious aspects that can affect the decision to undergo medical treatment (such as
the prohibition to accept blood donation for some religious groups) or “non conventional”
treatments that some indigenous groups receive when ill. To a greater extent, some have argued that
health itself is a cultural construct rather than just the physical well-being of the individual; in
which case it should be viewed as the emotional, social and cultural well-being of the whole
community (Mooney, 2009).
Our data, based on the Italian population, is evidently not suitable for cross-country
comparison, but can serve to check the validity of our results across people with different cultural
backgrounds. In fact, Italy presents relevant cultural differences between the North and the South
part of the country. The North part of the country is very developed with, on average, high levels of
education and it is geographically very closed to the heart of Europe. This contributes to the shaping
of a Western-European cultural background. On the other side, the South part of the country is quite
poor, less educated and geographically close to north-African and other Mediterranean countries.
People from the south are then more linked to a Mediterranean cultural background.
Hence, we run separate regressions for people living in the North and the South of the
country to see whether cultural differences affect the role of health as a dimension of social
comparison. In these regressions we control also for the income of the reference group. Estimation
results are shown in Tables 4 and 5 (all covariates are shown in Table 4A and Table 5A in the
Appendix). As it can be noted, it seems that the main results of our paper remain confirmed, but
with some particularities. We find that people in the South are more influenced by social
comparison with respect to health when assessing their subjective health conditions, while they do
not care in a significant way about the health of others in terms of individual utility. On the other
side, it seems that the reverse occurs in the North, where people seem to care about the health of
others for individual utility, but not to assess their own health. Anyway, in all regressions, both for
happiness and subjective health, people in poor health are significantly affected by the health of the
reference group. Hence, it seems that people from a Western-European cultural background
perform social comparison regardless of their own individual health conditions, while subjective
well-being of people from a Mediterranean cultural background is influenced only by the health of
people in similar conditions. Even with these differences, some interest in the health of others is
present for people both from a Mediterranean and Western-European cultural background.

Social Comparison And Subjective Well-being
Table 4. Estimates results. People living in the South of Italy
Main Covariates (1)
Happiness
OLS
(2)
Happiness
Ordered Probit
(3)
Subjective health
OLS
(4)
Subjective health
Ordered Probit
Proportion of rich
in the reference group
-0. 219
-0.166 -0.474*** -0.790***
(-0.84) (-0.71) (-3.77) (-3.69)
Proportion of sick
in the reference group
0.125 0.0801 -0.364*** -0.680***
(1.15) (0.80) (-6.08) (-6.59)
Sick*proportion of sick
in the reference group
-0.260*** -0.182*** -0.280*** -0.353***
(-3.90) (-3.02) (-7.35) (-5.57)
N 42223 42223 44470 44470
Asjusted R2 0.201 0.484
Log-Likelihood -65903.7 -61285.3 -44340.1 -43028.6
Chi-Square Stat. 7524.7 19801.2
t- statistics in parentheses. Standard errors are clustered on 464 reference groups . * p < .10, ** p < .05, *** p < 0.01

Social Comparison And Subjective Well-being
Table 5. Estimates results. People living in the North-Centre of Italy
Main Covariates (1)
Happiness
OLS
(2)
Happiness
Ordered Probit
(3)
Subjective health
OLS
(4)
Subjective health
Ordered Probit
Proportion of rich
in the reference group
0.343
0.349 0.206 0.327
(1.22) (1.42) (1.55) (1.42)
Proportion of sick
in the reference group
-0.405*** -0.383*** -0.0594 -0.154
(-3.76) (-3.93) (-1.02) (-1.51)
Sick*proportion of sick
in the reference group
-0.401*** -0.315*** -0.388*** -0.588***
(-5.83) (-5.01) (-12.55) (-10.66)
N 62119 62119 64659 64659
Asjusted R2 0.145 0.392
Log-Likelihood -98306.6 -92063.9 -63787.5 -62790.3
Chi-Square Stat. 7071.9 20116.4
t- statistics in parentheses. Standard errors are clustered on 464 reference groups. * p < .10, ** p < .05, *** p < 0.01
VI. FINAL REMARKS
This paper analyses the role of social comparison on happiness and self-assessed health using data
from the Italian Health Conditions survey (Condizioni di salute e ricorso ai servizi sanitari). We
test whether individuals are influenced by the health of their reference group in their self-evaluation
of happiness and subjective health. Our investigation might present two aspects of interest with
respect to previous literature on subjective well-being. First, we investigate the role of health as a
potential term of social comparison. Empirical literature on subjective well-being, in fact, has
focused mainly on income as a term of comparison between individuals. In this paper, we have
argued that an inter-personal comparison with respect to health is to be expected, given its
relevance for human well-being and because it could be indicative of some sympathy in individual
preferences or it could serve as a benchmark to assess one‟s own health conditions. Second, we test
the impact of the health of the reference group on happiness and subjective health, considering them
as two related dimensions of well-being.

Social Comparison And Subjective Well-being
We perform our analysis checking for other conventional determinants of subjective well
being, such as health, income, education, occupational status and social capital while using a
generally accepted measure of reference group identification (see Ferrer-I-Carbonell (2005) and
Mcbride (2001)). To check the robustness of our results, we even test for the effect of income of the
reference group. In addition, we perform the analysis on two separate samples of people living in
the North and the South of Italy, in order to check the stability of our results across people with
different cultural backgrounds.
The main result of the paper is that the health of the reference group does positively
influence subjective well-being. We find that a high incidence of chronic and disability conditions
among a reference group negatively affects both happiness and subjective health. This result seems
to show that individual preferences, with respect to health, elicit some altruism or sympathy and
demonstrate that people are influenced by other‟s health in assessing their own health conditions.
Regarding relative health, we found that people with bad health conditions are more negatively
influenced by the bad health of others than people in good health. This last result seems to support
the sympathy hypothesis given that people in bad health may have more consideration towards
persons with similar conditions.
As a secondary result, we found that underlying casual mechanisms of happiness and health
are somehow alike. Individual health, economic circumstances, education, employment status and
social capital are positive determinants of both the happiness and subjective health. Furthermore,
we found that housing problems are both health-damaging and happiness-reducing.
On a normative ground, our results might be consistent with Culyer‟s old argument (1976)
which supports the public financing of health care, ie. the institution of national health service.
Culyer‟s ideas rely on the presence of positive externalities with respect to health, namely, that
people might care for others‟ health. This hypothesis, confirmed here, is obvious with respect to
contagious diseases but perhaps it is interesting for non-contagious illness, such as the ones we
considered in this paper.
With regards to further research, it could be interesting to investigate the role of other
dimensions of social comparison in subjective well-being. Our paper has shown that health is
important, but other determinants could be at work. Furthermore, even if we try to check the
stability of our results across people with different cultural backgrounds, we have conducted the
research only on an Italian population. An empirical investigation across countries would be useful
to gain new insights on other dimensions of social comparison that influence subjective well-being.

Social Comparison And Subjective Well-being
REFERENCES
1. Bago D‟Uva, T. et al. (2008) Does reporting heterogeneity bias the measurement of the
health disparities? Health Economics, vol. 17(3), pages 351-375.
2. Blanchflower, D.G., Oswald, A.J. (2007) Is Well-being U-Shaped over the Life Cycle?
Warwick Economic Research Papers, No 826, Department of Economics, University of
Warwick.
3. Bruni, L., & Stanca, L. (2008). Watching Alone: Relational Goods, Television and
Happiness. Journal of Economic Behavior and Organization, 65(3-4), 506-528.
4. Clark, A.E., and A.J., Oswald, (1994), Unhappiness and Unemployment, Economic Journal,
vol.104. pp.648-659.
5. Clark, A E., Oswald A.J. (2002). A Simple Statistical Method for Measuring How Life
Events Affect Happiness, International Journal of Epidemiology, Vol. 31: pp. 1139–44.
6. Clark, A.E., Frijters, P., Shields, M. (2007), Relative Income, Happiness and Utility: An
Explanation for the Easterlin Paradox and Other Puzzles, IZA DP No. 2840, June 2007.
7. Culyer A.J. (1976) Need and the national service. Martin Robertson, Oxford.
8. Darity, W., and A.H. Goldsmith, (1996), Social Psychology, Unemployment and
Macroeconomics, Journal of Economic Perspectives, 10 (1), 121-40.
9. De Mello, L., Tiongson, E.R. (2009) What Is the Value of (My and My Family‟s) Good
Health?, Kyklos, Vol. 62 , No. 4,pp. 594–610.
10. Diener, E., Sandvik, E., Seidlitz, L., & Diener, M. (1993). The relationship between income
and subjective wellbeing: Relative or absolute? Social Indicators Research, 28, 195–223
11. Easterlin, R. (1974). Does economic growth improve the human lot? Some empirical
evidence. In P. A. David & M. W. Reder (Eds), Nations and households in economic growth
(pp.89-125). Academic Press.

Social Comparison And Subjective Well-being
12. Easterlin, R. (2001). Income and happiness: Toward a unified theory. Economic Journal
111, 464-84.
13. Easterlin, R.A. (2005), Building a Better Theory of Well-Being, in Bruni, L. and P.-L. Porta,
Economics and Happiness. Framing the analysis, pp.29-64, Oxford University Press,
Oxford.
14. Ferrer-i-Carbonell, A. van Praag, B.M.S ( 2002). The Subjective Costs of Health Losses due
to Chronic Diseases: An Alternative Model for Monetary Appraisal, Health Economics. Vol.
11: pp. 709–22.
15. Ferrer-i-Carbonell, A. (2005). Income and well being: an empirical analysis of the
comparison income effect. Journal of Public Economics, 89, 997-1019.
16. Frey, B., Stutzer, A. (2000). Happiness, economy and institutions. Economic Journal, 110,
918–938.
17. Frey, B., Stutzer, A. (2002). What Can Economists Learn from Happiness Research?,
Journal of Economic Literature, Vol. 40: pp. 402–35.
18. Furnèe, C.A., Groot, W., Van Den Brink,H.M. (2008), The health effects of education: a
meta-analysis, European Journal of Public Health, Vol. 18, No. 4, 417–421
19. Heady, B. (1991). An economic model of subjective well-being: Integrating economic and
psychological theories. Social Indicators Research, 28, 97-116.
20. Helliwell, J.F. (2003) How‟s life? Combining individual and national variables to explain
subjective well-being, Economic Modelling , 20 (2): 331-360.
21. Hsieh, CC., Pugh, M.D. (1993), Poverty, Income, inequality and violent crime: a meta-
analysis of recent aggregate data studies. Crim. Justice Rev 18:182-202.
22. Joshi, H., Wiggins, E., Bartely, M.m Mitchell, R., Gleave, S., Lynch, K., (2000) Putting
health inequalities on the map: does where you live matter, and why? In Graham, H., eds.,
Understanding health inequalities, Open University Press, pp. 143-155.

Social Comparison And Subjective Well-being
23. Kahneman D, Diener E, Schwarz N (eds) (1999) Well-being: The Foundations of Hedonic
Psychology. Russell Sage Foundation: New York.
24. Kawachi, B, Kennedy,P., Lochner, L., Prothrow-Stith, D. (1997), Social capital, income
inequality, and mortality, American Journal of Public Health, Vol. 87, Issue 9 1491-1498
25. Kawachi, B., Kennedy, P. (1997), Socioeconomic determinants of health : Health and social
cohesion: why care about income inequality? British Medical Journal ;314:1037.
26. Marmot, M e Wilkinson, R. (2006), Social Determinants of Health, 2nd Edition, Oxford:
Oxford University Press.
27. McBride, M. (2001). Relative-income effects on subjective well-being in the cross-section.
Journal of Economic Behavior and Organization, 45, 251-78.
28. Mooney, G. (2009) , Is it not time for health economists to rethink equity and access, Health
Economics, Policy and Law (2009), 4:209-221.
29. Moulton, B. (1986), Random Group Effects and the Precision of Regression Estimates,
Journal of Econometrics, 32, 385.97.
30. Ostroot, N. M. , Snyder, W. W.: 1985, 'Measuring cultural bias in a cross-national study',
Social Indicators Research 17, pp. 243- 251.
31. Power, C., Matthews, S., Manor, O. (1998) Inequalities in self-rated health: explanations
from different stages of life, Lancet, 351: 1009-14.
32. Sales, S.M. and J. House (1971). Job Dissatisfaction and a Possible Risk Factor in Coronary
Heart Disease, Journal of Chronic Diseases. Vol. 23: pp. 861–73.
33. Schwarze, Johannes and RainerWinkelmann 2005. „„What Can Happiness Research Tell Us
About Altruism? Evidence from the German Socio-Economic Panel‟‟, IZA Discussion
Papers No. 1487 (Bonn: Institute for the Study of Labor, IZA).

Social Comparison And Subjective Well-being
34. Scoppa, V., Ponzo, M. (2008), An Empirical Study of Happiness in Italy, The B.E. Journal
of Economic Analysis & Policy, Vol. 8 : Iss. 1 (Contributions), Article 15.
35. Sen, A. (1977) Rational Fools: A critique of the behavioral foundation of economic theory,
Philosophy and Public Affairs, 6 (4): 317-344.
36. Sen, A. (2002) Health: perception Vs Observation, British Medical Journal, 2002, 324: 860-
861.
37. Van Doorsaler, E., e Koolman, X.,(2004) Explaining the differences in income related
health inequalities across European countries, Health Economics,13, pp. 609-628.
38. Van Praag, B.M.S. & Ferrer-i-Carbonell, A. (2004), Happiness quantified: A satisfaction
calculus approach. Oxford University Press.
39. Wall, T.D., C.W. Clegg and P.R. Jackson 1978. An Evaluation of the Job Characteristics
Model, Journal of Occupational Psychology, Vol. 51: pp. 183–96.
40. Wilkinson, R.G. (1996), Unhealthy Societies: The Afflictions of inequality. New York:
Routledge

Social Comparison And Subjective Well-being
APPENDIX
Table 1A. Summary Statistics and Variable Description
Variable
Description
Variable
Name
Mean SD N°
Obs.
Dependent Variables
Self-rated
happiness
Happiness 4.05 1.28 111,151
Subjective
Health
Subjective
health
3.8 0.88 128,340
Covariates
Gender Female 51.65% 0.49 128,040
Male 48.35% 0.49 128,040
Age Age 47.58 19.35 128,040
Education
(Highest ISCED
level attained)
Illiterate 9.95% 0.3 121,145
Primary 23.81% 0.42 121,145
Junior 30.30% 0.46 121,145
High 27.90% 0.45 121,145
College 8.04% 0.27 121,145
Self-assessed
Economic
Circumstances
Absolutely
Insufficient
4.50% 0.2 128,040
Insufficient 26.46% 0.44 128,040
Fair 65.39% 0.47 128,040
Optimum 3.67% 0.19 128,040
Professional
Status
Unemployed 4.83% 0.21 128,040
Employed 39.27% 0.49 128,040
Retired 16.57% 0.37 128,040
other_occup 2.00% 0.14 128,040
unable 1.39% 0.12 128,040
housekeeper 14.75% 0.35 128,040
Individual
Health (one or
more chronic or
disability
conditions)
sick 50% 0.50 128,040
No sick 50% 0.50 128,040
Living in rural
areas
Rural 3.96% 0.20 128,040

Social Comparison And Subjective Well-being
No rural 96.04% 0.20 128,040
Family
members in bad
health
Nohealthrel 21.08% 0.41 128,040
Healthrel 78.92% 0.41 128,040
Marital Status Single 34.16% 0.47 128,040
Married 47.93% 0.50 128,040
Separated 3.00% 0.17 128,040
Divorced 1.46% 0.12 128,040
Widow 8.07% 0.27 128,040
House Problems
(Lighting,
Humidity,
Heating
shortage)
Houseproblems 3.98% 0.20 128,040
No House
problems
96.02% 0.20 128,040
Relational
Goods (Feeling
of absence of
relatives,friends,
neighbours and
volunteer
organizations)
Norel 15.98% 0.37 128,040
Yesrel 84.02% 0.37 128,040
Nofriend 37.35% 0.48 128,040
Yesfriend 62.65% 0.48 128,040
Noneigh 51.32% 0.50 128,040
Yesneigh 48.68% 0.50 128,040
Novoulun 87.83% 0.33 128,040
Yesvoulun 12.17% 0.33 128,040
Proportion of
rich in the
reference group
Meanpoor 36.39 0.03 128,040
Proportion of
sick in the
reference group
meansick 53.35 0.24 128,040
Medical visit in
the last four
weeks
Visit 16.46% 0.37 128,040
No Visit 83.54% 0.37 128,040
Hospitalization
days in the last
three months
Hospitalization 0.275 2.56 128,040

Social Comparison And Subjective Well-being
Table 2A. Estimates Results (All Covariates)
(1) (2) (3) (4)
Happiness
OLS
Happiness
Ordered Probit
Subjective Health
OLS
Subjective Health
Ordered Probit
male 0.148*** 0.132*** 0.0920*** 0.160***
(16.88) (16.53) (17.98) (17.87)
eta -0.0757*** -0.0726*** -0.0311*** -0.0582***
(-12.11) (-12.12) (-10.14) (-10.15)
eta2 0.00123*** 0.00120*** 0.000396*** 0.000763***
(9.71) (9.99) (5.96) (6.28)
eta3 -0.00000712*** -0.00000695*** -0.00000230*** -0.00000433***
(-9.06) (-9.40) (-5.24) (-5.50)
primary 0.0777*** 0.0682*** 0.0693*** 0.113***
(3.87) (3.85) (7.06) (6.90)
junior 0.107*** 0.0914*** 0.113*** 0.184***
(5.14) (4.96) (9.80) (9.40)
high 0.0893*** 0.0742*** 0.174*** 0.289***
(4.05) (3.80) (15.03) (14.82)
college 0.0134 0.00729 0.251*** 0.422***
(0.52) (0.32) (17.50) (17.16)
Optimum circ. 0.529*** 0.475*** 0.305*** 0.523***
(18.38) (18.13) (17.00) (17.13)
Fair circ. 0.401*** 0.352*** 0.200*** 0.332***
(17.69) (17.12) (13.47) (13.47)
Insufficient circ. 0.129*** 0.114*** 0.0869*** 0.140***
(5.86) (5.73) (6.24) (6.06)
employed 0.0875*** 0.0764*** 0.00380 0.000276
(3.99) (3.81) (0.29) (0.01)
retired 0.221*** 0.193*** -0.00446 -0.0151
(6.69) (6.51) (-0.23) (-0.45)
other_occup 0.0512 0.0419 -0.138*** -0.226***
(1.22) (1.12) (-5.53) (-5.62)
unable -0.517*** -0.485*** -0.709*** -1.028***
(-8.97) (-8.86) (-19.12) (-17.44)
housekeeper 0.184*** 0.163*** 0.0189 0.0272
(6.58) (6.37) (1.20) (0.99)
sick -0.264*** -0.261*** -0.299*** -0.563***
(-11.24) (-11.95) (-21.08) (-22.87)
rural 0.0124 0.00903 0.00223 -0.000325
(0.46) (0.38) (0.11) (-0.01)
Nohealthrel -0.230*** -0.205*** -0.0722*** -0.124***
(-25.14) (-25.14) (-13.69) (-13.78)
married 0.150*** 0.133*** -0.0348*** -0.0587***
(11.46) (11.35) (-4.93) (-4.79)
Separ. -0.0413* -0.0342 0.000433 0.00126
(-1.67) (-1.56) (0.03) (0.06)
divorced -0.0661** -0.0559* -0.0173 -0.0255
(-2.01) (-1.95) (-0.92) (-0.80)
Widow -0.119*** -0.102*** -0.0242** -0.0371**
(-5.70) (-5.58) (-2.19) (-2.02)
houseproblems -0.170*** -0.150*** -0.0574*** -0.0977***
(-8.52) (-8.46) (-5.20) (-5.27)
Norel -0.0988*** -0.0863*** -0.0230*** -0.0393***
(-9.37) (-9.08) (-3.91) (-3.95)
Nofriend -0.0477*** -0.0429*** -0.0381*** -0.0647***
(-4.79) (-4.82) (-7.84) (-7.75)
Noneigh -0.0431*** -0.0400*** -0.00223 -0.00328

Social Comparison And Subjective Well-being
(-4.88) (-5.10) (-0.49) (-0.42)
Novoulun -0.0369*** -0.0327*** 0.0124* 0.0211*
(-3.04) (-2.98) (1.84) (1.81)
meansick -0.359*** -0.362*** -0.293*** -0.573***
(-4.96) (-5.39) (-6.93) (-7.62)
sick_meansick -0.255*** -0.176*** -0.251*** -0.320***
(-5.63) (-4.20) (-10.09) (-7.30)
Visit -0.220*** -0.366***
(-37.28) (-38.14)
Hosp. days -0.0268*** -0.0435***
(-20.55) (-18.80)
_cons 5.516*** 4.706***
(59.67) (106.63)
cut1
_cons -3.625*** -5.000***
(-39.91) (-58.84)
cut2
_cons -2.788*** -3.937***
(-30.64) (-46.38)
cut3
_cons -1.694*** -2.167***
(-18.69) (-25.54)
cut4
_cons -1.264*** -0.556***
(-13.89) (-6.49)
cut5
_cons -0.122
(-1.34)
N 104342 104342 109129 109129
Adjusted R2 0.167 0.431
Log-Likelihood -164372.1 -153523.0 -108502.7 -106223.2
Chi-square stat. 13011.2 30249.1
t statistics in parentheses. Standard errors are clustered on 464 reference groups
* p < .10, ** p < .05, *** p < 0.01

Social Comparison And Subjective Well-being
Table 3A. Robustness Check (All covariates )
(1) (2) (3) (4)
Happiness
OLS
Happiness
Ordered Probit
Subjective Health
OLS
Subjective Health
Ordered Probit
male 0.147*** 0.132*** 0.0921*** 0.160***
(16.90) (16.54) (18.03) (17.91)
eta -0.0753*** -0.0721*** -0.0315*** -0.0589***
(-12.04) (-12.03) (-10.29) (-10.28)
eta2 0.00122*** 0.00118*** 0.000406*** 0.000780***
(9.62) (9.87) (6.13) (6.43)
eta3 -0.00000707*** -0.00000688*** -0.00000237*** -0.00000444***
(-8.96) (-9.29) (-5.40) (-5.64)
primary 0.0778*** 0.0683*** 0.0693*** 0.113***
(3.87) (3.86) (7.08) (6.91)
junior 0.107*** 0.0913*** 0.113*** 0.185***
(5.14) (4.95) (9.85) (9.44)
high 0.0880*** 0.0725*** 0.176*** 0.292***
(3.97) (3.69) (15.29) (15.08)
college 0.00900 0.00177 0.257*** 0.433***
(0.35) (0.08) (17.70) (17.38)
Optimum circ. 0.527*** 0.472*** 0.308*** 0.527***
(18.13) (17.89) (17.13) (17.28)
fairinc 0.401*** 0.352*** 0.201*** 0.332***
(17.68) (17.11) (13.48) (13.49)
badinc 0.129*** 0.114*** 0.0869*** 0.140***
(5.86) (5.73) (6.24) (6.06)
employed 0.0875*** 0.0762*** 0.00381 0.000334
(3.99) (3.80) (0.29) (0.01)
retired 0.222*** 0.194*** -0.00558 -0.0168
(6.72) (6.55) (-0.29) (-0.51)
other_occup 0.0506 0.0411 -0.137*** -0.225***
(1.20) (1.10) (-5.46) (-5.54)
unable -0.517*** -0.485*** -0.709*** -1.028***
(-9.01) (-8.92) (-19.03) (-17.38)
housekeeper 0.184*** 0.163*** 0.0185 0.0267
(6.58) (6.37) (1.17) (0.97)
sick -0.264*** -0.261*** -0.298*** -0.562***
(-11.25) (-11.97) (-21.06) (-22.85)
rural 0.0132 0.0101 0.00107 -0.00223
(0.50) (0.42) (0.05) (-0.06)
Nohealthrel -0.230*** -0.205*** -0.0722*** -0.124***
(-25.13) (-25.14) (-13.69) (-13.78)
married 0.150*** 0.132*** -0.0345*** -0.0582***
(11.42) (11.31) (-4.90) (-4.76)
separ -0.0415* -0.0345 0.000690 0.00168
(-1.68) (-1.58) (0.05) (0.07)
divorced -0.0664** -0.0562* -0.0170 -0.0250
(-2.02) (-1.96) (-0.90) (-0.79)
widow -0.119*** -0.103*** -0.0241** -0.0369**
(-5.70) (-5.58) (-2.18) (-2.02)
houseproblems -0.170*** -0.150*** -0.0574*** -0.0977***
(-8.52) (-8.47) (-5.19) (-5.26)
Norel -0.0988*** -0.0863*** -0.0230*** -0.0392***
(-9.37) (-9.08) (-3.91) (-3.95)
Nofriend -0.0477*** -0.0428*** -0.0382*** -0.0648***
(-4.79) (-4.82) (-7.85) (-7.76)
noneigh -0.0430*** -0.0399*** -0.00236 -0.00348

Social Comparison And Subjective Well-being
(-4.87) (-5.09) (-0.51) (-0.44)
novoulun -0.0370*** -0.0328*** 0.0126* 0.0213*
(-3.06) (-2.99) (1.86) (1.83)
meanrich 0.117 0.146 -0.162* -0.267*
(0.58) (0.82) (-1.72) (-1.66)
meansick -0.354*** -0.356*** -0.299*** -0.584***
(-4.88) (-5.28) (-7.03) (-7.71)
sick_meansick -0.254*** -0.175*** -0.251*** -0.320***
(-5.62) (-4.18) (-10.11) (-7.32)
visit -0.220*** -0.366***
(-37.27) (-38.13)
Hosp. days -0.0268*** -0.0435***
(-20.54) (-18.79)
_cons 5.508*** 4.717***
(58.77) (106.31)
cut1
_cons -3.614*** -5.018***
(-39.42) (-58.97)
cut2
_cons -2.778*** -3.954***
(-30.21) (-46.40)
cut3
_cons -1.683*** -2.185***
(-18.38) (-25.62)
cut4
_cons -1.253*** -0.573***
(-13.64) (-6.66)
cut5
_cons -0.111
(-1.21)
N 104342 104342 109129 109129
Adjusted R2 0.167 0.432
Log-likelihood -164371.8 -153522.5 -108500.9 -106221.5
Chi-square stat. 13039.6 30091.6
t statistics in parentheses. Standard errors are clustered on 464 reference groups
* p < .10, ** p < .05, *** p < 0.01

Social Comparison And Subjective Well-being
Table 4A. Estimates Results. People living in the South (All covariates )
(1) (2) (3) (4)
Happiness
OLS
Happiness
Ordered Probit
Subjective Health
OLS
Subjective Health
Ordered Probit
main
male 0.129*** 0.118*** 0.101*** 0.178***
(9.84) (9.71) (11.55) (11.68)
eta -0.0838*** -0.0841*** -0.0341*** -0.0662***
(-9.76) (-10.30) (-10.69) (-11.48)
eta2 0.00124*** 0.00128*** 0.000464*** 0.000936***
(6.72) (7.40) (6.39) (7.37)
eta3 -0.00000699*** -0.00000726*** -0.00000287*** -0.00000560***
(-5.95) (-6.61) (-5.79) (-6.64)
primary -0.00553 -0.00445 0.0264* 0.0409*
(-0.21) (-0.20) (1.80) (1.68)
junior 0.0636** 0.0555** 0.0680*** 0.109***
(2.33) (2.30) (4.09) (3.89)
high 0.0772*** 0.0657** 0.142*** 0.233***
(2.67) (2.53) (7.83) (7.76)
college 0.0155 0.00984 0.209*** 0.349***
(0.38) (0.26) (8.91) (8.76)
Optimum circ. 0.521*** 0.472*** 0.284*** 0.497***
(14.27) (13.70) (11.53) (11.62)
fairinc 0.398*** 0.354*** 0.155*** 0.257***
(15.13) (14.50) (8.31) (8.29)
badinc 0.132*** 0.118*** 0.0598*** 0.0942***
(4.96) (4.83) (3.33) (3.15)
employed 0.122*** 0.109*** 0.0469*** 0.0771***
(4.11) (4.00) (3.15) (2.89)
retired 0.142*** 0.126*** 0.0320 0.0473
(3.02) (2.99) (1.46) (1.27)
other_occup -0.0115 -0.00822 -0.0344 -0.0534
(-0.21) (-0.17) (-1.06) (-1.02)
unable -0.600*** -0.562*** -0.571*** -0.806***
(-8.66) (-8.48) (-11.08) (-10.10)
housekeeper 0.141*** 0.130*** 0.0751*** 0.127***
(3.94) (3.96) (4.09) (4.03)
sick -0.288*** -0.284*** -0.347*** -0.637***
(-9.05) (-9.81) (-17.50) (-19.34)
Rural 0.00867 -0.00230 0.0382** 0.0637*
(0.23) (-0.07) (1.99) (1.96)
Nohealthrel -0.260*** -0.235*** -0.0875*** -0.149***
(-17.31) (-17.37) (-10.45) (-10.43)
Married 0.124*** 0.113*** -0.0711*** -0.118***
(5.73) (5.85) (-6.81) (-6.53)
Separ -0.0881* -0.0778* -0.0414** -0.0689**
(-1.89) (-1.88) (-1.99) (-1.98)
Divorced -0.118** -0.0942* -0.0226 -0.0316
(-2.00) (-1.79) (-0.64) (-0.54)
Widow -0.127*** -0.104*** -0.0667*** -0.105***
(-4.01) (-3.68) (-4.05) (-3.92)
Houseproblems -0.205*** -0.182*** -0.0521*** -0.0878***
(-7.46) (-7.42) (-3.69) (-3.73)
norel -0.0754*** -0.0661*** -0.0212** -0.0380**
(-4.53) (-4.30) (-2.23) (-2.33)

Social Comparison And Subjective Well-being
nofriend -0.0615*** -0.0509*** -0.0367*** -0.0617***
(-3.92) (-3.55) (-4.60) (-4.53)
noneigh -0.00431 -0.00764 -0.00117 -0.00149
(-0.32) (-0.62) (-0.15) (-0.11)
novoulun -0.0543*** -0.0508*** 0.0267** 0.0467**
(-2.60) (-2.60) (2.54) (2.58)
meanrich -0.219 -0.166 -0.474*** -0.790***
(-0.84) (-0.71) (-3.77) (-3.69)
meansick 0.125 0.0801 -0.364*** -0.680***
(1.15) (0.80) (-6.08) (-6.59)
sick_meansick -0.260*** -0.182*** -0.280*** -0.353***
(-3.90) (-3.02) (-7.35) (-5.57)
visit -0.217*** -0.356***
(-21.05) (-21.66)
Hosp. days -0.0294*** -0.0468***
(-12.51) (-10.99)
_cons 5.708*** 4.869***
(46.56) (99.15)
cut1
_cons -3.911*** -5.293***
(-32.93) (-55.97)
cut2
_cons -3.009*** -4.213***
(-25.43) (-44.48)
cut3
_cons -1.925*** -2.434***
(-16.37) (-25.97)
cut4
_cons -1.500*** -0.890***
(-12.77) (-9.58)
cut5
_cons -0.349***
(-2.95)
N 42223 42223 44470 44470
Adjusted R2 0.201 0.484
Log-likleihood -65903.7 -61285.3 -44340.1 -43028.6
Chi-square stat. 7524.7 19801.2
t statistics in parentheses. Standard errors are clustered on 464 reference groups
* p < .10, ** p < .05, *** p < 0.01

Social Comparison And Subjective Well-being
Table 5A. Estimates Results. People living in the North-Center (All covariates )
(1) (2) (3) (4)
Happiness
OLS
Happiness
Ordered Probit
Subjective Health
OLS
Subjective Health
Ordered Probit
main
male 0.129*** 0.118*** 0.101*** 0.178***
(9.84) (9.71) (11.55) (11.68)
eta -0.0838*** -0.0841*** -0.0341*** -0.0662***
(-9.76) (-10.30) (-10.69) (-11.48)
eta2 0.00124*** 0.00128*** 0.000464*** 0.000936***
(6.72) (7.40) (6.39) (7.37)
eta3 -0.00000699*** -0.00000726*** -0.00000287*** -0.00000560***
(-5.95) (-6.61) (-5.79) (-6.64)
primary -0.00553 -0.00445 0.0264* 0.0409*
(-0.21) (-0.20) (1.80) (1.68)
junior 0.0636** 0.0555** 0.0680*** 0.109***
(2.33) (2.30) (4.09) (3.89)
high 0.0772*** 0.0657** 0.142*** 0.233***
(2.67) (2.53) (7.83) (7.76)
college 0.0155 0.00984 0.209*** 0.349***
(0.38) (0.26) (8.91) (8.76)
Optimum circ. 0.521*** 0.472*** 0.284*** 0.497***
(14.27) (13.70) (11.53) (11.62)
fairinc 0.398*** 0.354*** 0.155*** 0.257***
(15.13) (14.50) (8.31) (8.29)
badinc 0.132*** 0.118*** 0.0598*** 0.0942***
(4.96) (4.83) (3.33) (3.15)
employed 0.122*** 0.109*** 0.0469*** 0.0771***
(4.11) (4.00) (3.15) (2.89)
retired 0.142*** 0.126*** 0.0320 0.0473
(3.02) (2.99) (1.46) (1.27)
other_occup -0.0115 -0.00822 -0.0344 -0.0534
(-0.21) (-0.17) (-1.06) (-1.02)
unable -0.600*** -0.562*** -0.571*** -0.806***
(-8.66) (-8.48) (-11.08) (-10.10)
housekeeper 0.141*** 0.130*** 0.0751*** 0.127***
(3.94) (3.96) (4.09) (4.03)
sick -0.288*** -0.284*** -0.347*** -0.637***
(-9.05) (-9.81) (-17.50) (-19.34)
rural 0.00867 -0.00230 0.0382** 0.0637*
(0.23) (-0.07) (1.99) (1.96)
Nohealthrel -0.260*** -0.235*** -0.0875*** -0.149***
(-17.31) (-17.37) (-10.45) (-10.43)
married 0.124*** 0.113*** -0.0711*** -0.118***
(5.73) (5.85) (-6.81) (-6.53)
separ -0.0881* -0.0778* -0.0414** -0.0689**
(-1.89) (-1.88) (-1.99) (-1.98)
divorced -0.118** -0.0942* -0.0226 -0.0316
(-2.00) (-1.79) (-0.64) (-0.54)
widow -0.127*** -0.104*** -0.0667*** -0.105***
(-4.01) (-3.68) (-4.05) (-3.92)
houseproblems -0.205*** -0.182*** -0.0521*** -0.0878***
(-7.46) (-7.42) (-3.69) (-3.73)
Norel -0.0754*** -0.0661*** -0.0212** -0.0380**
(-4.53) (-4.30) (-2.23) (-2.33)
nofriend -0.0615*** -0.0509*** -0.0367*** -0.0617***
(-3.92) (-3.55) (-4.60) (-4.53)

Social Comparison And Subjective Well-being
noneigh -0.00431 -0.00764 -0.00117 -0.00149
(-0.32) (-0.62) (-0.15) (-0.11)
novoulun -0.0543*** -0.0508*** 0.0267** 0.0467**
(-2.60) (-2.60) (2.54) (2.58)
meanrich -0.219 -0.166 -0.474*** -0.790***
(-0.84) (-0.71) (-3.77) (-3.69)
meansick 0.125 0.0801 -0.364*** -0.680***
(1.15) (0.80) (-6.08) (-6.59)
sick_meansick -0.260*** -0.182*** -0.280*** -0.353***
(-3.90) (-3.02) (-7.35) (-5.57)
visit -0.217*** -0.356***
(-21.05) (-21.66)
Hosp. days -0.0294*** -0.0468***
(-12.51) (-10.99)
_cons 5.708*** 4.869***
(46.56) (99.15)
cut1
_cons -3.911*** -5.293***
(-32.93) (-55.97)
cut2
_cons -3.009*** -4.213***
(-25.43) (-44.48)
cut3
_cons -1.925*** -2.434***
(-16.37) (-25.97)
cut4
_cons -1.500*** -0.890***
(-12.77) (-9.58)
cut5
_cons -0.349***
(-2.95)
N 42223 42223 44470 44470
Adjusted R2 0.201 0.484
Log-likelihood -65903.7 -61285.3 -44340.1 -43028.6
Chi-square stat. 7524.7 19801.2
t statistics in parentheses. Standard errors are clustered on 464 reference groups
* p < .10, ** p < .05, *** p < 0.01