Embed Size (px)
Citation preview
Summary Report SR-PK-pn2-05
Pakistan
Social audit of governance and delivery of public services
Anne Cockcroft, Neil Andersson, Khalid Omer, Noor Ansari, Amir Khan, Ubaid Ullah Chaudhry and
Sohail Saeed
Social audit of governance and
delivery of public services
Pakistan 2004/05
National report: Summary
Islamabad, September 2005 A Cockcroft, N Andersson, K Omer, N Ansari, A Khan, UU Chaudhry S Saeed
DTCE/CIET: social audit 2004/05, summary 1
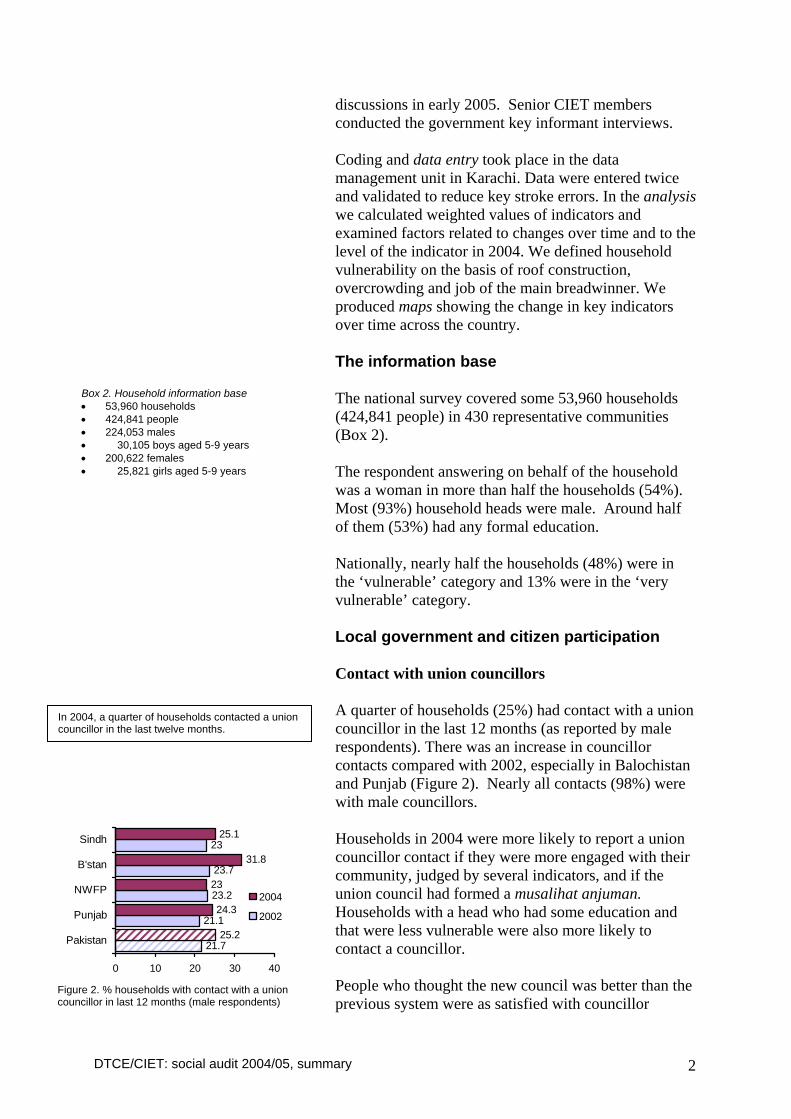
Summary The 2004/5 social audit follows the baseline social audit of 2001/2 and allows comparisons over time in citizens’ views, use and experience of public services under devolved local government. It allows assessment of the level of engagement of the public with local government and their participation in local development in their communities. The views of local elected representatives and government officials, who have been implementing the new local government arrangements, are also included. Methods The sample for the 2004 survey was based on that of the baseline social audit in 2001/02, with re-selection of a random 25% of communities within the sample union councils (Figure 1). The design is a stratified random sample of at least four union councils within every district, with the proportion of urban and rural sites allocated according to the urban/rural proportions in the census. Within each selected union council one community (site) is randomly selected. There is no sub-sampling within the selected sites. The sample gives representation nationally, as well as within each province and each district. The 2004 sample included all districts, except Kohlu and Dera Bugti, which could not be surveyed for security reasons, and Islamabad, which is not yet included in the new local government system. To take into account the disproportion in the sample population distribution, we calculated a weight for each district. All the indicator percentages mentioned in this report at provincial or national level are the weighted values. We deliberately kept the instruments mostly the same as those developed for the baseline social audit in 2001/2, to allow direct comparisons over time (Box 1). We added some questions and instruments to elaborate on certain issues. We recruited and trained field teams regionally in each province, to conduct the household interviews, institutional reviews, and focus group discussions. The teams carried out household data collection from August to October 2004 and feedback focus group
Figure 1. Sample sites for the national social audit 2004/5
Box 1. Instruments in the 2004/5 social audit: • Household questionnaire • Community profile • Institutional review of health facilities • Institutional review of schools • Key informant interview schedules for:
o Zila nazims o District Coordinating Officers o District Police Officers o Chairmen of District Public Safety and Police
Complaints Commissions o Tehsil nazims o Tehsil Municipal Officers o Union nazims o Female union councillors o Chairmen of CCBs in the community
• Guides for male and female focus group discussions
DTCE/CIET: social audit 2004/05, summary 2
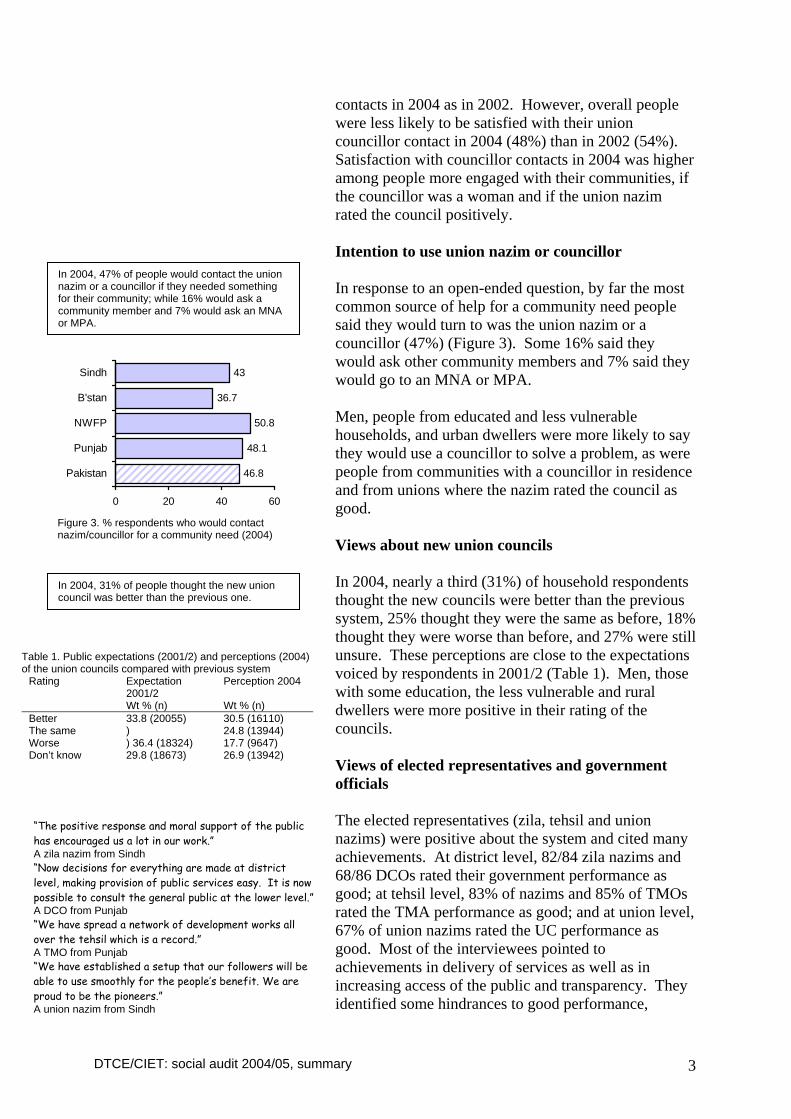
discussions in early 2005. Senior CIET members conducted the government key informant interviews. Coding and data entry took place in the data management unit in Karachi. Data were entered twice and validated to reduce key stroke errors. In the analysis we calculated weighted values of indicators and examined factors related to changes over time and to the level of the indicator in 2004. We defined household vulnerability on the basis of roof construction, overcrowding and job of the main breadwinner. We produced maps showing the change in key indicators over time across the country. The information base The national survey covered some 53,960 households (424,841 people) in 430 representative communities (Box 2). The respondent answering on behalf of the household was a woman in more than half the households (54%). Most (93%) household heads were male. Around half of them (53%) had any formal education. Nationally, nearly half the households (48%) were in the ‘vulnerable’ category and 13% were in the ‘very vulnerable’ category. Local government and citizen participation Contact with union councillors A quarter of households (25%) had contact with a union councillor in the last 12 months (as reported by male respondents). There was an increase in councillor contacts compared with 2002, especially in Balochistan and Punjab (Figure 2). Nearly all contacts (98%) were with male councillors. Households in 2004 were more likely to report a union councillor contact if they were more engaged with their community, judged by several indicators, and if the union council had formed a musalihat anjuman. Households with a head who had some education and that were less vulnerable were also more likely to contact a councillor. People who thought the new council was better than the previous system were as satisfied with councillor
Box 2. Household information base • 53,960 households • 424,841 people • 224,053 males • 30,105 boys aged 5-9 years • 200,622 females • 25,821 girls aged 5-9 years
21.7
21.1
23.2
23.7
23
25.2
24.3
23
31.8
25.1
0 10 20 30 40
Pakistan
Punjab
NWFP
B'stan
Sindh
2004
2002
Figure 2. % households with contact with a union councillor in last 12 months (male respondents)
In 2004, a quarter of households contacted a union councillor in the last twelve months.
DTCE/CIET: social audit 2004/05, summary 3
contacts in 2004 as in 2002. However, overall people were less likely to be satisfied with their union councillor contact in 2004 (48%) than in 2002 (54%). Satisfaction with councillor contacts in 2004 was higher among people more engaged with their communities, if the councillor was a woman and if the union nazim rated the council positively. Intention to use union nazim or councillor In response to an open-ended question, by far the most common source of help for a community need people said they would turn to was the union nazim or a councillor (47%) (Figure 3). Some 16% said they would ask other community members and 7% said they would go to an MNA or MPA. Men, people from educated and less vulnerable households, and urban dwellers were more likely to say they would use a councillor to solve a problem, as were people from communities with a councillor in residence and from unions where the nazim rated the council as good. Views about new union councils In 2004, nearly a third (31%) of household respondents thought the new councils were better than the previous system, 25% thought they were the same as before, 18% thought they were worse than before, and 27% were still unsure. These perceptions are close to the expectations voiced by respondents in 2001/2 (Table 1). Men, those with some education, the less vulnerable and rural dwellers were more positive in their rating of the councils. Views of elected representatives and government officials The elected representatives (zila, tehsil and union nazims) were positive about the system and cited many achievements. At district level, 82/84 zila nazims and 68/86 DCOs rated their government performance as good; at tehsil level, 83% of nazims and 85% of TMOs rated the TMA performance as good; and at union level, 67% of union nazims rated the UC performance as good. Most of the interviewees pointed to achievements in delivery of services as well as in increasing access of the public and transparency. They identified some hindrances to good performance,
46.8
48.1
50.8
36.7
43
0 20 40 60
Pakistan
Punjab
NWFP
B'stan
Sindh
Figure 3. % respondents who would contact nazim/councillor for a community need (2004)
Table 1. Public expectations (2001/2) and perceptions (2004) of the union councils compared with previous system
Expectation 2001/2
Perception 2004 Rating
Wt % (n) Wt % (n) Better 33.8 (20055) 30.5 (16110) The same 24.8 (13944) Worse
) ) 36.4 (18324) 17.7 (9647)
Don’t know 29.8 (18673) 26.9 (13942)
In 2004, 47% of people would contact the union nazim or a councillor if they needed something for their community; while 16% would ask a community member and 7% would ask an MNA or MPA.
In 2004, 31% of people thought the new union council was better than the previous one.
“The positive response and moral support of the public has encouraged us a lot in our work.” A zila nazim from Sindh “Now decisions for everything are made at district level, making provision of public services easy. It is now possible to consult the general public at the lower level.” A DCO from Punjab “We have spread a network of development works all over the tehsil which is a record.” A TMO from Punjab “We have established a setup that our followers will be able to use smoothly for the people’s benefit. We are proud to be the pioneers.” A union nazim from Sindh
DTCE/CIET: social audit 2004/05, summary 4
especially lack of timely funding and bureaucratic and political interference, especially in transfers and postings. Social capital In 2004 3.3% of households had a male member in a voluntary group and 0.9% of households had a female member in a group. This is a small increase from 2001/2, when 2.1% of households had a male in a voluntary group and 0.6% had a female in a group. In 2004, 12% of male respondents and 6% of female respondents had taken part in a development project during the last 12 months. Some 87% of men and 78% of women thought that people in their community were willing to help each other. Over half the respondents (57%) would report to someone if they came to know about a case of corruption: 22% would report to the nazim or councillor and 16% to the police or DPS&PCC etc. Awareness and participation in CCBs Between 2001/2 and 2004, awareness of CCBs among men increased by 71% from 3.4% to 5.8%, while awareness among women increased by 47% from 1.5% to 2.2%. Awareness increased in all provinces except Sindh. In 2004, people rating the union council positively were more likely to have heard of CCBs, as were those from communities where the union nazim (or representative) had heard of CCBs. About a quarter of the union nazims (or councillors) interviewed had not heard of CCBs themselves. Men were more likely to have heard of CCBs, as were those who were less vulnerable, those who came from more educated households, and urban dwellers (in Sindh). Interviewers gave the respondents a brief description about CCBs and asked if they would be interested to join a CCB. Between 2001/2 and 2004, the interest among men increased from 50% to 57% (Figure 4) and the interest among women from 30% to 38%. Men and the more educated were more willing to join a CCB, but the vulnerable were as likely as the non-vulnerable to be willing to join. The CCB chairmen interviewed generally indicated that registration was easy but they described some difficulties getting proposals funded and implemented.
decreaseno changeincreaseno data
change in % who would be willing to join a CCB
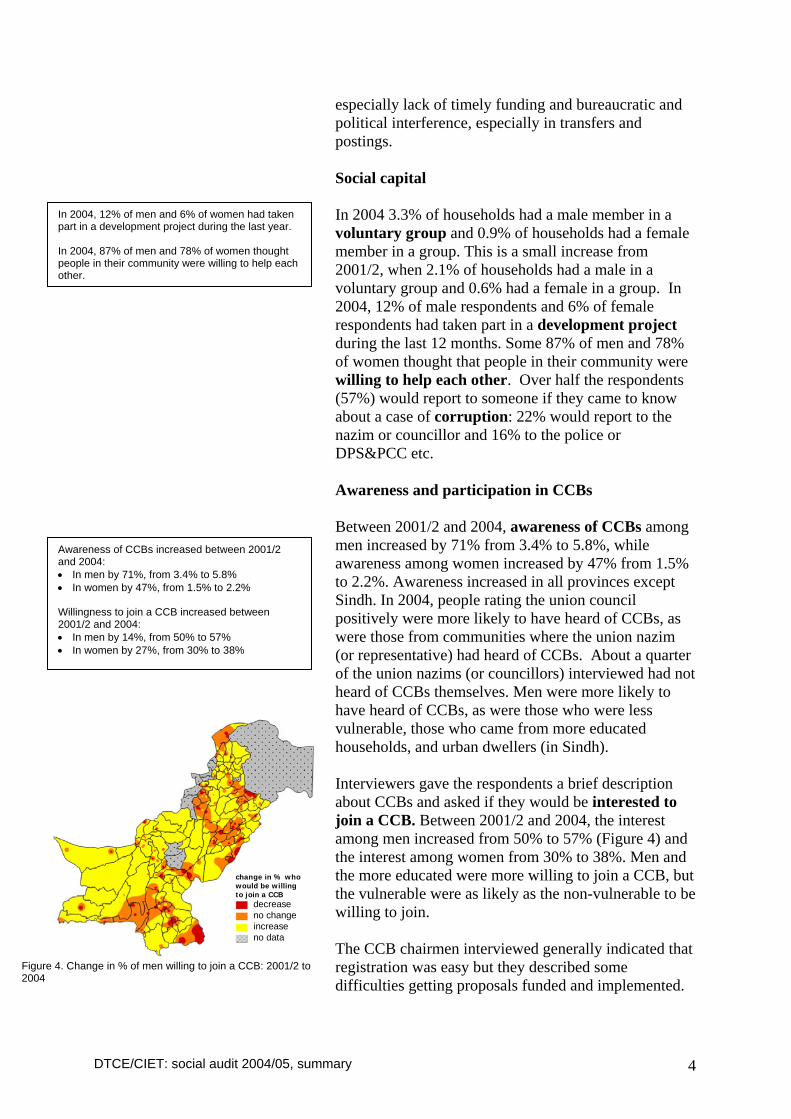
Figure 4. Change in % of men willing to join a CCB: 2001/2 to 2004
In 2004, 12% of men and 6% of women had taken part in a development project during the last year. In 2004, 87% of men and 78% of women thought people in their community were willing to help each other.
Awareness of CCBs increased between 2001/2 and 2004: • In men by 71%, from 3.4% to 5.8% • In women by 47%, from 1.5% to 2.2% Willingness to join a CCB increased between 2001/2 and 2004: • In men by 14%, from 50% to 57% • In women by 27%, from 30% to 38%
DTCE/CIET: social audit 2004/05, summary 5
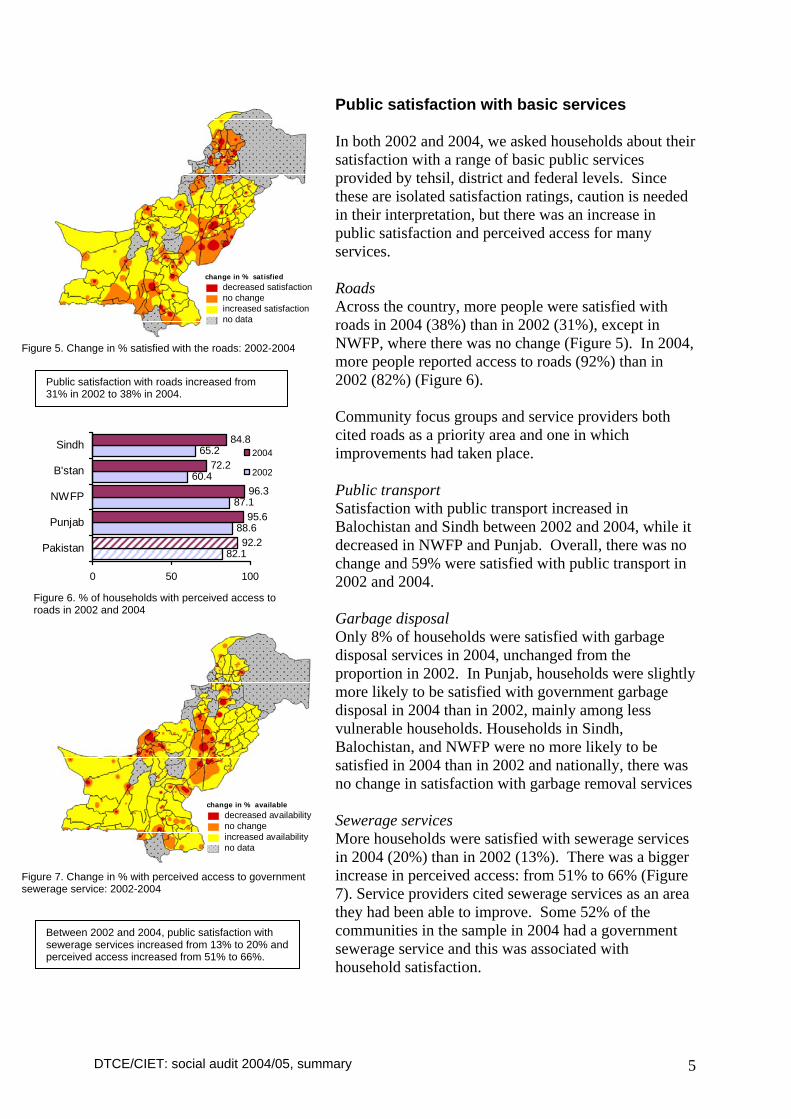
Public satisfaction with basic services In both 2002 and 2004, we asked households about their satisfaction with a range of basic public services provided by tehsil, district and federal levels. Since these are isolated satisfaction ratings, caution is needed in their interpretation, but there was an increase in public satisfaction and perceived access for many services. Roads Across the country, more people were satisfied with roads in 2004 (38%) than in 2002 (31%), except in NWFP, where there was no change (Figure 5). In 2004, more people reported access to roads (92%) than in 2002 (82%) (Figure 6). Community focus groups and service providers both cited roads as a priority area and one in which improvements had taken place. Public transport Satisfaction with public transport increased in Balochistan and Sindh between 2002 and 2004, while it decreased in NWFP and Punjab. Overall, there was no change and 59% were satisfied with public transport in 2002 and 2004. Garbage disposal Only 8% of households were satisfied with garbage disposal services in 2004, unchanged from the proportion in 2002. In Punjab, households were slightly more likely to be satisfied with government garbage disposal in 2004 than in 2002, mainly among less vulnerable households. Households in Sindh, Balochistan, and NWFP were no more likely to be satisfied in 2004 than in 2002 and nationally, there was no change in satisfaction with garbage removal services Sewerage services More households were satisfied with sewerage services in 2004 (20%) than in 2002 (13%). There was a bigger increase in perceived access: from 51% to 66% (Figure 7). Service providers cited sewerage services as an area they had been able to improve. Some 52% of the communities in the sample in 2004 had a government sewerage service and this was associated with household satisfaction.
decreased satisfactionno changeincreased satisfactionno data
change in % satisfied
Figure 5. Change in % satisfied with the roads: 2002-2004
decreased availabilityno changeincreased availabilityno data
change in % available
Figure 7. Change in % with perceived access to government sewerage service: 2002-2004
Public satisfaction with roads increased from 31% in 2002 to 38% in 2004.
Between 2002 and 2004, public satisfaction with sewerage services increased from 13% to 20% and perceived access increased from 51% to 66%.
82.1
88.6
87.1
60.4
65.2
92.2
95.6
96.3
72.2
84.8
0 50 100
Pakistan
Punjab
NWFP
B'stan
Sindh2004
2002
Figure 6. % of households with perceived access to roads in 2002 and 2004
DTCE/CIET: social audit 2004/05, summary 6
23
23
27
17
22
27
28
24
23
25
0 5 10 15 20 25 30 35
Pakistan
Punjab
NWFP
B'stan
Sindh20042001/2
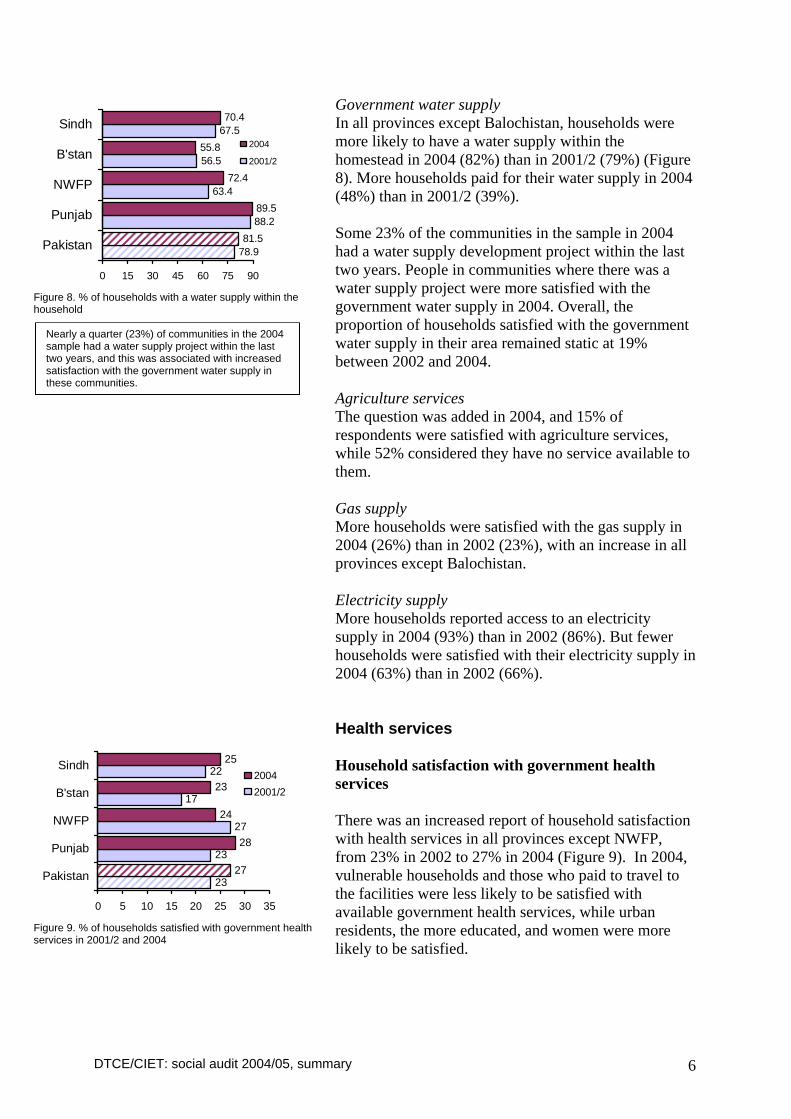
Figure 9. % of households satisfied with government health services in 2001/2 and 2004
Government water supply In all provinces except Balochistan, households were more likely to have a water supply within the homestead in 2004 (82%) than in 2001/2 (79%) (Figure 8). More households paid for their water supply in 2004 (48%) than in 2001/2 (39%). Some 23% of the communities in the sample in 2004 had a water supply development project within the last two years. People in communities where there was a water supply project were more satisfied with the government water supply in 2004. Overall, the proportion of households satisfied with the government water supply in their area remained static at 19% between 2002 and 2004. Agriculture services The question was added in 2004, and 15% of respondents were satisfied with agriculture services, while 52% considered they have no service available to them. Gas supply More households were satisfied with the gas supply in 2004 (26%) than in 2002 (23%), with an increase in all provinces except Balochistan. Electricity supply More households reported access to an electricity supply in 2004 (93%) than in 2002 (86%). But fewer households were satisfied with their electricity supply in 2004 (63%) than in 2002 (66%). Health services Household satisfaction with government health services There was an increased report of household satisfaction with health services in all provinces except NWFP, from 23% in 2002 to 27% in 2004 (Figure 9). In 2004, vulnerable households and those who paid to travel to the facilities were less likely to be satisfied with available government health services, while urban residents, the more educated, and women were more likely to be satisfied.
Nearly a quarter (23%) of communities in the 2004 sample had a water supply project within the last two years, and this was associated with increased satisfaction with the government water supply in these communities.
78.9
88.2
63.4
56.5
67.5
81.5
89.5
72.4
55.8
70.4
0 15 30 45 60 75 90
Pakistan
Punjab
NWFP
B'stan
Sindh2004
2001/2
Figure 8. % of households with a water supply within the household
DTCE/CIET: social audit 2004/05, summary 7
29.8
38.2
8.5
16.1
22.1
0 10 20 30 40
Pakistan
Punjab
NWFP
B'stan
Sindh
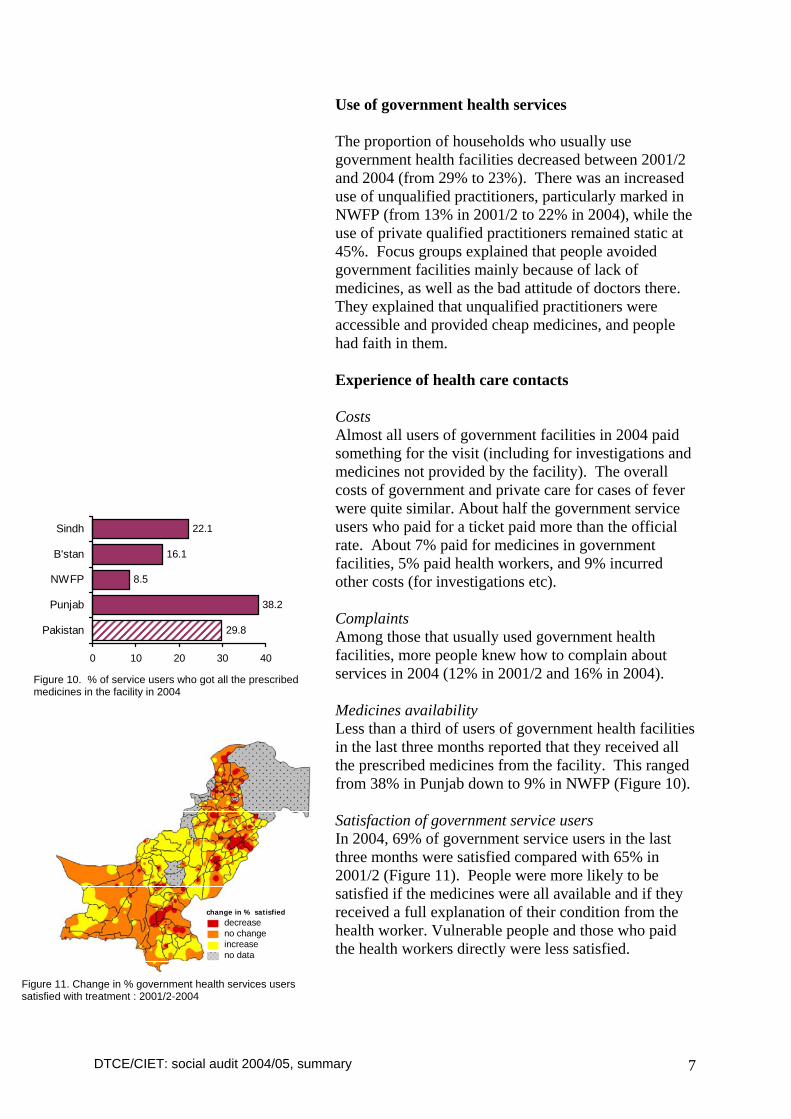
Figure 10. % of service users who got all the prescribed medicines in the facility in 2004
Use of government health services The proportion of households who usually use government health facilities decreased between 2001/2 and 2004 (from 29% to 23%). There was an increased use of unqualified practitioners, particularly marked in NWFP (from 13% in 2001/2 to 22% in 2004), while the use of private qualified practitioners remained static at 45%. Focus groups explained that people avoided government facilities mainly because of lack of medicines, as well as the bad attitude of doctors there. They explained that unqualified practitioners were accessible and provided cheap medicines, and people had faith in them. Experience of health care contacts Costs Almost all users of government facilities in 2004 paid something for the visit (including for investigations and medicines not provided by the facility). The overall costs of government and private care for cases of fever were quite similar. About half the government service users who paid for a ticket paid more than the official rate. About 7% paid for medicines in government facilities, 5% paid health workers, and 9% incurred other costs (for investigations etc). Complaints Among those that usually used government health facilities, more people knew how to complain about services in 2004 (12% in 2001/2 and 16% in 2004). Medicines availability Less than a third of users of government health facilities in the last three months reported that they received all the prescribed medicines from the facility. This ranged from 38% in Punjab down to 9% in NWFP (Figure 10). Satisfaction of government service users In 2004, 69% of government service users in the last three months were satisfied compared with 65% in 2001/2 (Figure 11). People were more likely to be satisfied if the medicines were all available and if they received a full explanation of their condition from the health worker. Vulnerable people and those who paid the health workers directly were less satisfied.
decreaseno changeincreaseno data
change in % satisfied
Figure 11. Change in % government health services users satisfied with treatment : 2001/2-2004
DTCE/CIET: social audit 2004/05, summary 8
0.3
1.5
26.9
41.2
1
2.6
29.9
43.0
0 10 20 30 40 50 60
Non-formal
Madaris
Private
Government
20042002
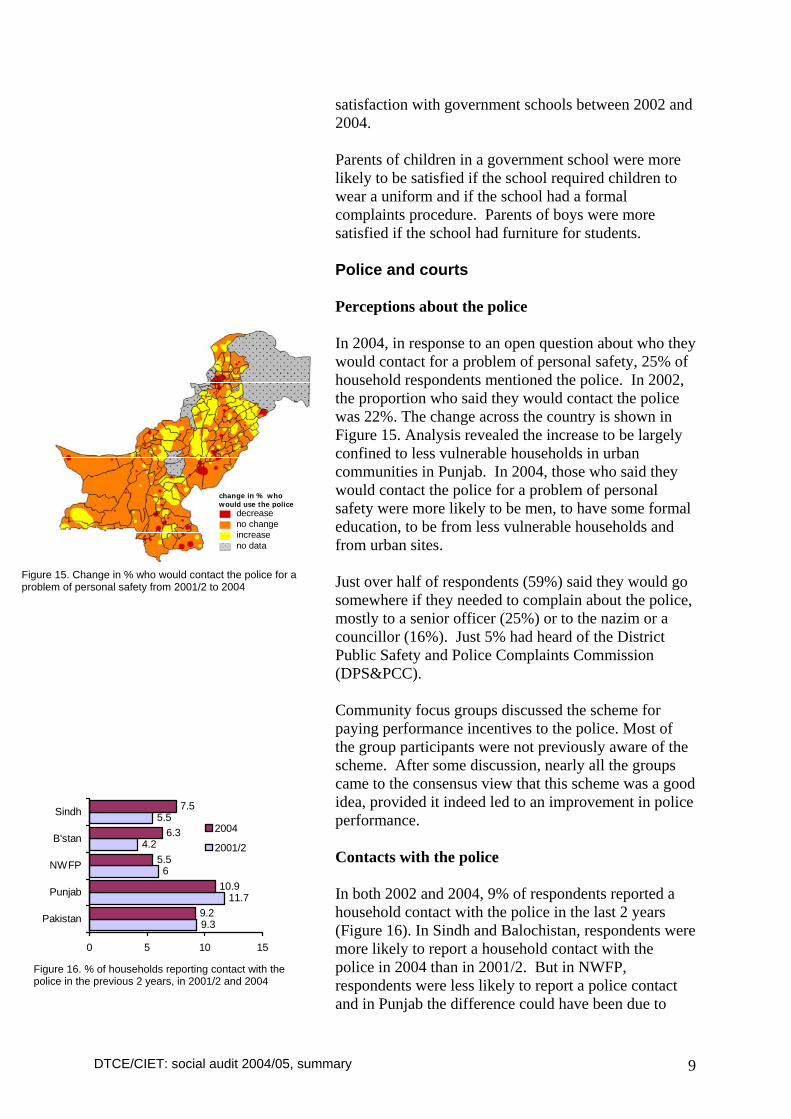
Figure 13. % enrolment in different types of schools among children aged 5-9 years in 2002 and 2004
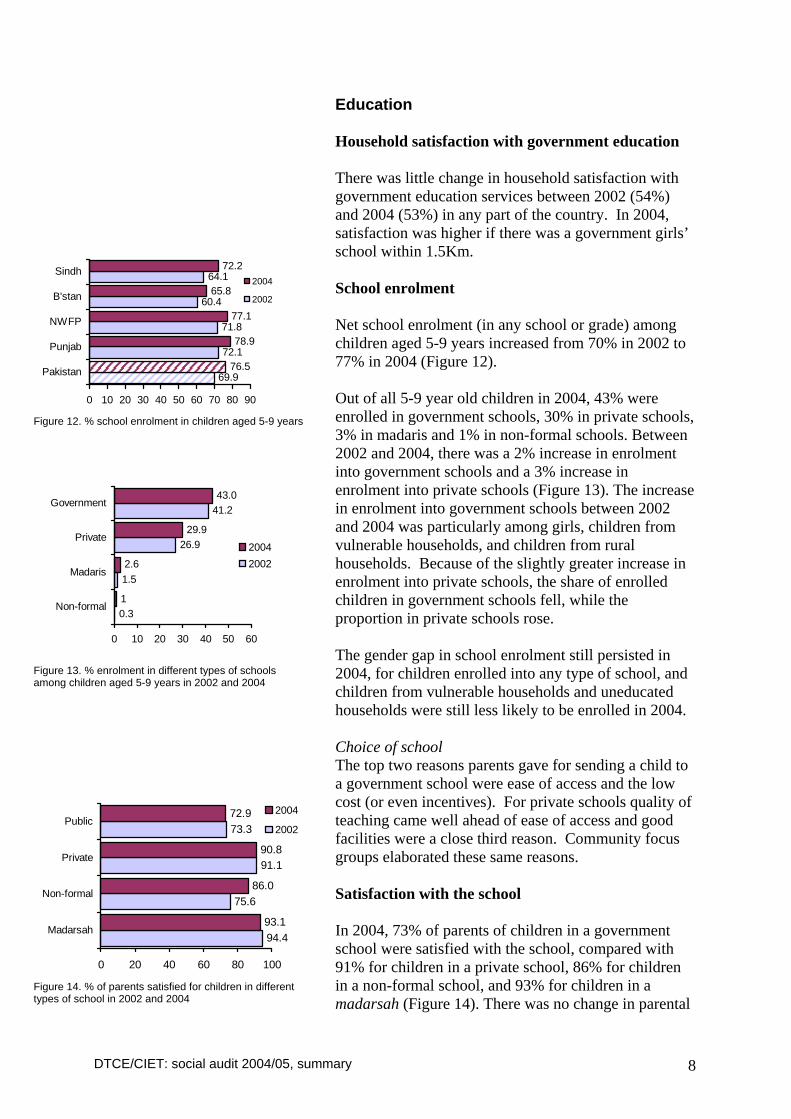
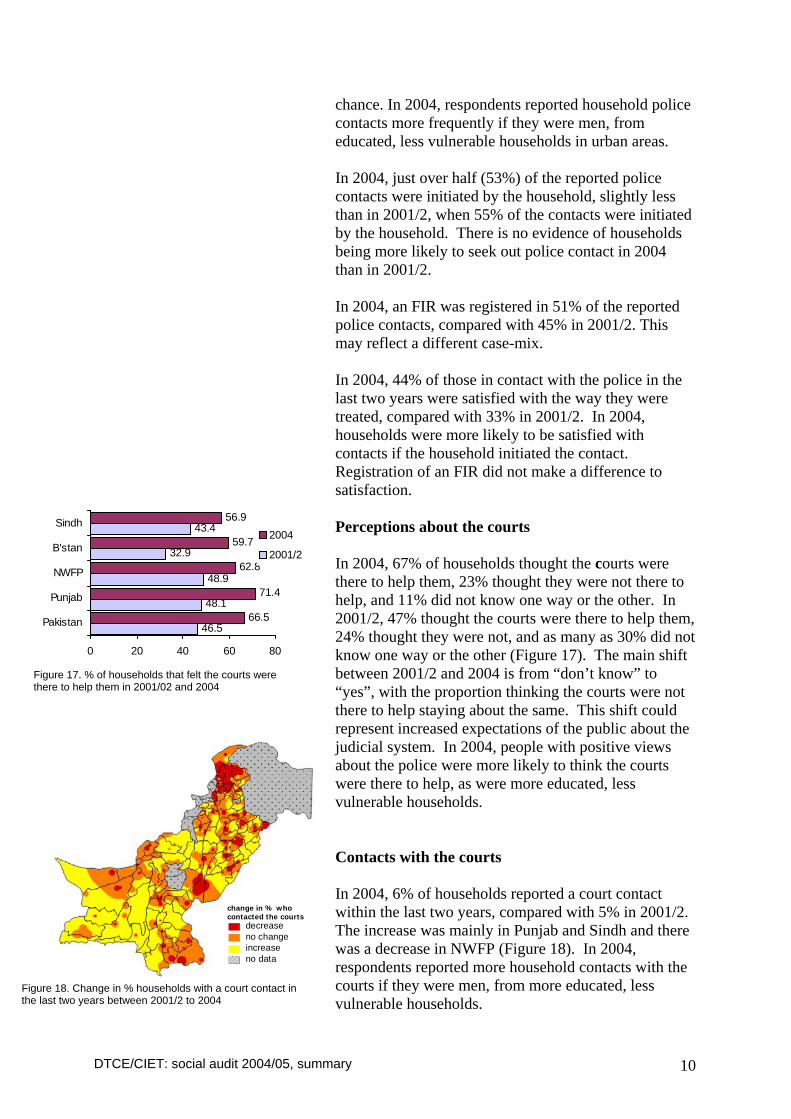
Education Household satisfaction with government education There was little change in household satisfaction with government education services between 2002 (54%) and 2004 (53%) in any part of the country. In 2004, satisfaction was higher if there was a government girls’ school within 1.5Km. School enrolment Net school enrolment (in any school or grade) among children aged 5-9 years increased from 70% in 2002 to 77% in 2004 (Figure 12). Out of all 5-9 year old children in 2004, 43% were enrolled in government schools, 30% in private schools, 3% in madaris and 1% in non-formal schools. Between 2002 and 2004, there was a 2% increase in enrolment into government schools and a 3% increase in enrolment into private schools (Figure 13). The increase in enrolment into government schools between 2002 and 2004 was particularly among girls, children from vulnerable households, and children from rural households. Because of the slightly greater increase in enrolment into private schools, the share of enrolled children in government schools fell, while the proportion in private schools rose. The gender gap in school enrolment still persisted in 2004, for children enrolled into any type of school, and children from vulnerable households and uneducated households were still less likely to be enrolled in 2004. Choice of school The top two reasons parents gave for sending a child to a government school were ease of access and the low cost (or even incentives). For private schools quality of teaching came well ahead of ease of access and good facilities were a close third reason. Community focus groups elaborated these same reasons. Satisfaction with the school In 2004, 73% of parents of children in a government school were satisfied with the school, compared with 91% for children in a private school, 86% for children in a non-formal school, and 93% for children in a madarsah (Figure 14). There was no change in parental
69.9
72.1
71.8
60.4
64.1
76.5
78.9
77.1
65.8
72.2
0 10 20 30 40 50 60 70 80 90
Pakistan
Punjab
NWFP
B'stan
Sindh2004
2002
Figure 12. % school enrolment in children aged 5-9 years
94.4
75.6
91.1
73.3
93.1
86.0
90.8
72.9
0 20 40 60 80 100
Madarsah
Non-formal
Private
Public2004
2002
Figure 14. % of parents satisfied for children in different types of school in 2002 and 2004
DTCE/CIET: social audit 2004/05, summary 9
satisfaction with government schools between 2002 and 2004. Parents of children in a government school were more likely to be satisfied if the school required children to wear a uniform and if the school had a formal complaints procedure. Parents of boys were more satisfied if the school had furniture for students. Police and courts Perceptions about the police In 2004, in response to an open question about who they would contact for a problem of personal safety, 25% of household respondents mentioned the police. In 2002, the proportion who said they would contact the police was 22%. The change across the country is shown in Figure 15. Analysis revealed the increase to be largely confined to less vulnerable households in urban communities in Punjab. In 2004, those who said they would contact the police for a problem of personal safety were more likely to be men, to have some formal education, to be from less vulnerable households and from urban sites. Just over half of respondents (59%) said they would go somewhere if they needed to complain about the police, mostly to a senior officer (25%) or to the nazim or a councillor (16%). Just 5% had heard of the District Public Safety and Police Complaints Commission (DPS&PCC). Community focus groups discussed the scheme for paying performance incentives to the police. Most of the group participants were not previously aware of the scheme. After some discussion, nearly all the groups came to the consensus view that this scheme was a good idea, provided it indeed led to an improvement in police performance. Contacts with the police In both 2002 and 2004, 9% of respondents reported a household contact with the police in the last 2 years (Figure 16). In Sindh and Balochistan, respondents were more likely to report a household contact with the police in 2004 than in 2001/2. But in NWFP, respondents were less likely to report a police contact and in Punjab the difference could have been due to
decreaseno changeincreaseno data
change in % who would use the police
Figure 15. Change in % who would contact the police for a problem of personal safety from 2001/2 to 2004
9.3
11.7
6
4.2
5.5
9.2
10.9
5.5
6.3
7.5
0 5 10 15
Pakistan
Punjab
NWFP
B'stan
Sindh2004
2001/2
Figure 16. % of households reporting contact with the police in the previous 2 years, in 2001/2 and 2004
DTCE/CIET: social audit 2004/05, summary 10
chance. In 2004, respondents reported household police contacts more frequently if they were men, from educated, less vulnerable households in urban areas. In 2004, just over half (53%) of the reported police contacts were initiated by the household, slightly less than in 2001/2, when 55% of the contacts were initiated by the household. There is no evidence of households being more likely to seek out police contact in 2004 than in 2001/2. In 2004, an FIR was registered in 51% of the reported police contacts, compared with 45% in 2001/2. This may reflect a different case-mix. In 2004, 44% of those in contact with the police in the last two years were satisfied with the way they were treated, compared with 33% in 2001/2. In 2004, households were more likely to be satisfied with contacts if the household initiated the contact. Registration of an FIR did not make a difference to satisfaction. Perceptions about the courts In 2004, 67% of households thought the courts were there to help them, 23% thought they were not there to help, and 11% did not know one way or the other. In 2001/2, 47% thought the courts were there to help them, 24% thought they were not, and as many as 30% did not know one way or the other (Figure 17). The main shift between 2001/2 and 2004 is from “don’t know” to “yes”, with the proportion thinking the courts were not there to help staying about the same. This shift could represent increased expectations of the public about the judicial system. In 2004, people with positive views about the police were more likely to think the courts were there to help, as were more educated, less vulnerable households. Contacts with the courts In 2004, 6% of households reported a court contact within the last two years, compared with 5% in 2001/2. The increase was mainly in Punjab and Sindh and there was a decrease in NWFP (Figure 18). In 2004, respondents reported more household contacts with the courts if they were men, from more educated, less vulnerable households.
decreaseno changeincreaseno data
change in % who contacted the courts
Figure 18. Change in % households with a court contact in the last two years between 2001/2 to 2004
46.5
48.1
48.9
32.9
43.4
66.5
71.4
62.8
59.7
56.9
0 20 40 60 80
Pakistan
Punjab
NWFP
B'stan
Sindh2004
2001/2
Figure 17. % of households that felt the courts were there to help them in 2001/02 and 2004
DTCE/CIET: social audit 2004/05, summary 11
Overall, court users were more likely to be satisfied in 2004 (56%) than in 2001/2 (49%). But the difference between 2001/2 and 2004 was significant only in Punjab. Alternative mechanisms In 2004, 8% of households said they had used union council mechanisms to solve a legal matter. The figure was higher in Balochistan and NWFP than in Punjab and Sindh (Figure 19). Except in Punjab, the proportions of households using the UC for a legal matter were higher than the proportions of households who had a court contact within the last two years. Commentary The high level of engagement of the public with the new local governments, especially the union councils, is encouraging. The councils have not done badly in coming up to expectations but frustration could set in if they are not able to solve the problems brought to them by the public. So far the councils are being used more by people who were already more active in their communities and efforts are necessary to make sure they reach the most disadvantaged. Similarly, while it is encouraging to see evidence of an increasing citizen participation in communities, it will be important to try to find mechanisms to draw in those more disadvantaged people presently less likely to be involved. The picture for delivery of public services is generally positive. There is no evidence of services getting worse and for some, like roads and sewerage services in particular, there is evidence from several sources of improvement. Services from tehsils in particular seem to be doing well. There is increased public satisfaction (users and non-users) with government health services, and increased satisfaction of service users. But the continuing lower levels of satisfaction with government services compared with private and unqualified practitioners are apparently driving people away from government services towards unqualified practitioners. The means to reverse this trend could include mechanisms to reduce system leakage and ensure more medicines are
8.2
7.5
14.8
14
5.5
0 5 10 15 20
Pakistan
Punjab
NWFP
B'stan
Sindh
Figure 19. % of households who used the union council to solve a legal matter (2004)
DTCE/CIET: social audit 2004/05, summary 12
available in government facilities, as well as efforts to train health providers to be more “customer-oriented”. There is a continuing increase in net school enrolment among 5-9 year old children. While the increase since 2002 is more into private schools, government schools are apparently catering more for girls and children from vulnerable households. Some of this is likely to be related to the various incentives in place. There is little evidence of increased public willingness to contact the police; the increase in those who said they would use the police for a problem of personal safety was confined to non-vulnerable households in Punjab and there was no increase in actual police contacts, especially not those initiated by households. The police continue to have a bad reputation among the public and this will be hard to change, even as the service from the police improves. It is encouraging that the public are in favour of the police incentives scheme, provided it actually delivers a better performance from the police. A more realistic evaluation of the effects of devolution on police services will be possible once the Police Order 2002, with its amendments, is fully implemented. While there is evidence that people believe the courts ought to help them, the use of the courts remains low. It seems that people are choosing to use alternative dispute resolution mechanisms provided through the union councils rather than going through the conventional legal system and there is potential for this trend to increase in the future. In summary, there are encouraging signs from the social audit enquiry after two years or more of devolved local government. This is despite the problems with full implementation described by elected representatives and government officials. It will be important to continue to track progress as full implementation is achieved. Meanwhile, the social audit of 2004/5 provides some pointers for issues requiring attention to increase the chances of achieving the goals of devolution.