Embed Size (px)
Citation preview
FACULTY OF ENGINEERING AND SUSTAINABLE DEVELOPMENT Department of Building, Energy and Environmental Engineering
SOCIAL AND ENVIRONMENTAL EFFECTS OF BUJAGALI DAM
MUWUMUZA LINDA
2014
MASTER OF SCIENCE THESIS, Credits: H.E 30
DIVISION OF SUSTAINABLE ENERGY
Supervisor: DR. JEEVAN JAYASURIYA A/PROF DR. JOHN BAPTIST KIRABIRA

Dedication Well yes Mum, I did as we discussed and so this is for you. You spoke, I listened and this is the outcome. I pray you are proud of me. Love you always.

Acknowledgements
I would love to thank the following people for their contribution towards the finishing
of my project. I would not have finished it successfully without you.
My Family
Daddy
Angella
Stephen
Amanda
College of Engineering, Design, Art and Technology
My local facilitators
Dr. Sabiiti Adam
Hillary Kasedde
My Supervisors
Dr. Jeevan Jayasuriya
Dr. John Baptist Kirabira
The Ministry of Energy and Mineral Development especially:
Eng. Moses Murengezi: Advisor to the Chairman Energy and Mining Sector
Working group
Eng. Paul Mubiru: Permanent Secretary, Ministry of Energy and Mineral
Development
The Bujagali Energy Limited Company especially:
Mr. John Berry: Chief Executive Officer of BEL
Ms. Achanga Jennifer: Environmental Engineer of BEL
Francis Mwangi: Technical Manager
Allan Ikahu: Infrastructure and Project Engineer
My Friends:
John, Anthony, Mue, Winnie, Arthur, Vincent, Hajarah, Fildah, Winnie, Richard and all
the rest
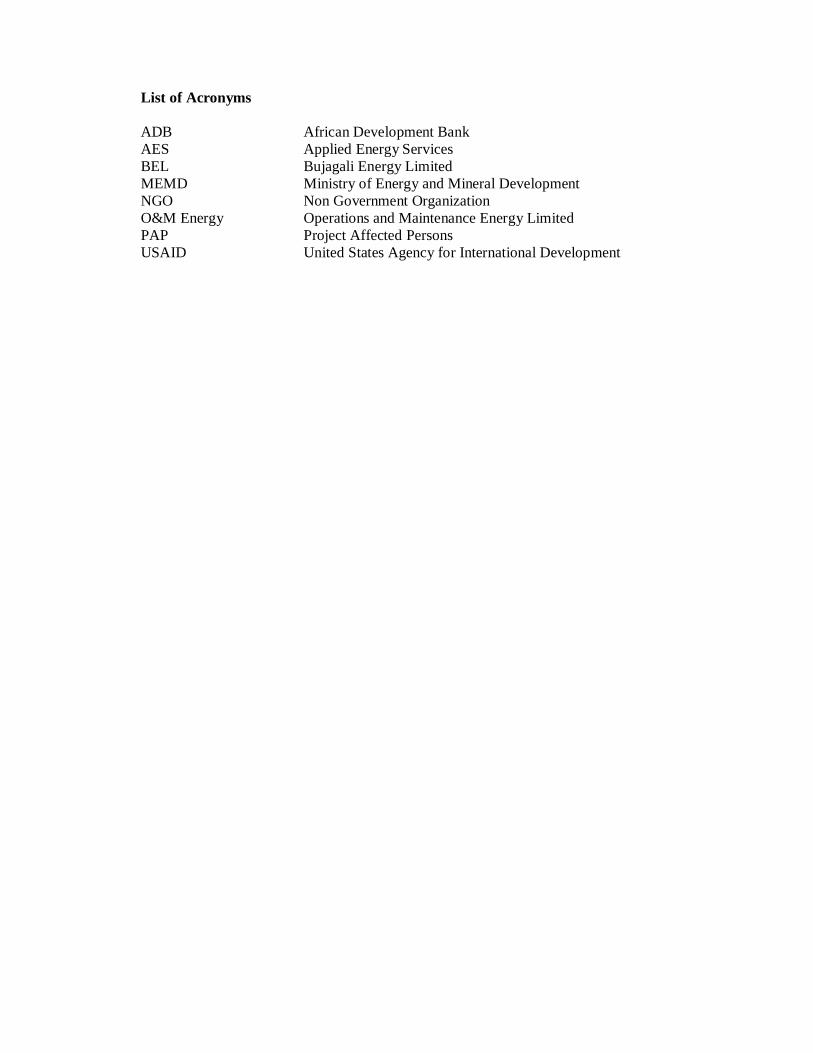
List of Acronyms
ADB African Development Bank AES Applied Energy Services BEL Bujagali Energy Limited MEMD Ministry of Energy and Mineral Development NGO Non Government Organization O&M Energy Operations and Maintenance Energy Limited PAP Project Affected Persons USAID United States Agency for International Development
Abstract There has been a steady increment in economic growth in Uganda and as the economy
is on the rise, the demand for energy also increases. Hydro power energy production has
been growing in Uganda as a result of the different types of dams created in Uganda
along the River Nile. Uganda has been trying to reach the target of electricity capacity
so as to ensure that her people get the energy required to improve on their livelihoods.
Uganda as a whole has different energy sources but in this thesis, Bujagali dam will be
at the center of the focus. Looking at the social and environmental impacts made upon
its construction in Jinja.
The main objective of this thesis was therefore to show how the livelihoods of the
people dwelling in the neighborhood and the environment were affected by the
construction of the dam. The livelihoods of the people before the construction of the
dam were reviewed in regard to their social life as well as the environment from past
literature provided. The different aspects in which the people and environment were
affected after the construction of the dam were also reviewed through different
interviews with the residents of Bujagali.
There were both positive and negative effects, socially, environmentally and
economically due to the construction of the Bujagali. The positive social effects were:
provision of land for farming, provision of employment opportunities for the residents,
increase in tourism at the dam, the falls and the cultural centers, community
development including education, health facilities, skill training, water supply and
power supply while the negative effects were loss of land, cultural loss, and less access
to different points of the river for fishing purposes for the residents.
The positive environmental effects were increase in fish species, more health and safety
awareness, and thermal plants closure hence less green house gases effects on the ozone
layer, the noise levels effects due to the dam construction, were of no consequence as
they were in the required standard. The negative environmental effects were majorly
water levels fluctuation that affects the head of water which in turn affects the capacity
of power produced at the dam and air quality of the area during and after the
construction of the dam especially air emissions.
The positive economic effects were: increment of power to the national grid, lower
electricity costs, closure of thermal plants as they were expensive to run and maintain
and reduction of load shedding. The negative effect was the financial loan that the
government of Uganda obtained to construct the dam that has to be paid back.
TABLE OF CONTENTS
Dedication ................................................................................................................... 2
Acknowledgements ..................................................................................................... 3
Abstract ........................................................................................................................ 5
TABLE OF CONTENTS ........................................................................................... 7
List of Figures.............................................................................................................. 9
List of Tables ............................................................................................................. 10
1.0 BACKGROUND ............................................................................................... 11 1.1 Power Generation in Uganda ...................................................................... 13 1.2 Bujagali Hydro Power Project .................................................................... 15 1.3 Bujagali Hydro Power Plant Location ........................................................ 16 1.4 Problem Statement ...................................................................................... 18 1.5 Objectives .................................................................................................... 18
1.5.1 Main Objective ....................................................................................... 18 1.5.2 Specific Objectives .................................................................................. 18
1.6 Scope............................................................................................................ 19
2.0 LITERATURE REVIEW............................................................................... 20 2.1 Dams and Hydro Power History ................................................................ 20 2.2 Basic Energy conversions for Hydro Power .................................................... 22 2.3 Three of the Largest Hydro Power Stations in the world ........................... 24
2.3.1 The Three Gorges Dam .......................................................................... 25 2.3.2 Itaipu Power Station ............................................................................... 26 2.3.3 Guri Power Station ................................................................................. 27
2.4 Effects of the Hydro Power Project in an area............................................ 28 2.4.1 Introduction ........................................................................................... 28 2.4.2 Economic Effects ................................................................................... 28 2.4.3 Social Effects .......................................................................................... 28 2.4.4 Environmental Effects ............................................................................ 29 2.4.5 Context of the study ............................................................................... 32
3.0 METHODOLOGY......................................................................................... 32 3.1 Identification of the lifestyle of people before the dam construction ......... 32 3.2 Identification of impacts of dam construction elsewhere in the world ...... 33 3.3 Identification of the social and environmental effects of Bujagali Dam .... 33
3.3.1 Data acquisition of social effects .............................................................. 33 3.3.2 Data analysis of social effects................................................................... 35 3.3.3 Data acquisition of Environmental effects ................................................ 35
4.0 FINDINGS AND DISCUSSIONS ................................................................. 36 4.1 Social effects of Bujagali Dam .................................................................... 36
4.1.1 Resettlement and loss of Land ................................................................. 36 4.1.2 Community development ........................................................................ 40 4.1.2 Cultural loss ............................................................................................ 44
4.1.3 Life alteration ......................................................................................... 46 4.1.4 Fishing ................................................................................................... 48 4.1.5 Farming .................................................................................................. 49 4.1.6 Employment opportunities ...................................................................... 50 4.1.7 Tourism ................................................................................................. 51
4.2 Environmental impacts of Bujagali Dam ................................................... 53 4.2.1 Noise pollution ....................................................................................... 53 4.2.2 Water quality and levels ........................................................................... 53 4.2.3 Fish species migration ............................................................................. 55 4.2.4 Health and safety .................................................................................... 55 4.2.5 Air quality ............................................................................................... 56 4.2.6 Thermal plants closure ............................................................................ 56
4.3 Economic effects of Bujagali dam .............................................................. 57 4.3.1 Addition of power to the national power grid ........................................... 57 4.3.2 Lower Electricity costs ............................................................................ 57 4.3.3 Removal of thermal plants ....................................................................... 57 4.3.4 Reduction of Load Shedding ................................................................... 58
5 CONCLUSION AND RECOMMENDATIONS ......................................... 59 5.1 Conclusions ................................................................................................. 59 5.2 Recommendations....................................................................................... 61
Bibliography .............................................................................................................. 63
Reference Websites ...................................................................................................... 64
Appendix ................................................................................................................... 65 Questionnaire and also Interview guide ............................................................... 65

List of Figures Figure 1: Map of North East Africa showing the River Nile. .................................................................. 11
Figure 2: Post showing the source of the Nile ..................................................................................... 12
Figure 3: Spot that marks the source of the Nile ....................................................................................... 12
Figure 4: Owen Falls Dam Bridge ................................................................................................................ 13
Figure 5: Owen Falls Dam in Jinja District ................................................................................................. 14
Figure 6: Location of Bujagali Dam on the Ugandan Map....................................................................... 16
Figure 7: Bujagali Falls in Jinja District ........................................................................................................ 17
Figure 8: Aerial View of Bujagali Dam during construction .................................................................... 17
Figure 9: Bujagali Dam during construction ............................................................................................... 18
Figure 10: Diagram showing the workings of a conventional hydroelectric facility. (Tomia, 2007) .. 20
Figure 11: Hydro power among the renewable, accounting for roughly 15% of the world's energy usage. (B.P. Statistical Review, 2008)............................................................................................................ 21
Figure 12: Top hydro power producing countries (http://www.worldenergy.org, 2014) ................... 21
Figure 13: Hydropower installed capacity by region. (World energy, 2014) .......................................... 21
Figure 14: Diagram showing Embankment dam. ...................................................................................... 22
Figure 15: Diagram showing Earth Fill Dam .............................................................................................. 23
Figure 16: Diagram showing Rock Fill Dam .............................................................................................. 23
Figure 17: Figure showing Pelton Turbine .................................................................................................. 23
Figure 18: Figure showing Karplan Turbine ............................................................................................... 23
Figure 19: Figure showing Francis Turbine ................................................................................................ 23
Figure 20: Figure showing Turgo turbine .................................................................................................... 24
Figure 21: Figure showing Fixed Pitch Propeller ....................................................................................... 24
Figure 22: Graph showing specific speed verses head for the different turbines (CompEdu, 2011) 24
Figure 23: Photograph of Three Gorges Dam. (Wikipedia) ..................................................................... 25
Figure 24: Map showing the Three Gorges Dam location. (Wikipedia)................................................. 25
Figure 25: Photograph showing the aerial view of Itaipu Power Station with the spillway on the left, in Brazil (Wikipedia) ........................................................................................................................................ 26
Figure 26: Photograph showing the location of Itaipu Dam. .................................................................. 26
Figure 27: Photograph showing the Guri Power Station in Venezuela .................................................. 27
Figure 28: Photograph showing the aerial view of Guri Dam in Venezuela ......................................... 27
Figure 29: Diagram showing the different effects of Dam construction ............................................... 29
Figure 30: Resource centre at BEL Company ............................................................................................ 32
Figure 31: Researcher in the Bujagali Power Station in Jinja .................................................................... 34
Figure 32: Photograph of Eng. Murengezi and Linda Muwumuza at the MEMD .............................. 34
Figure 33: A photograph of Linda Muwumuza with local supervisors during a field visit ................. 35
Figure 34: Photograph showing one of the households’ plots with agriculture practice in Naminya Village ................................................................................................................................................................ 37
Figure 35: A photograph showing the interior of a house before the new houses were built for residents ............................................................................................................................................................ 38
Figure 36: A photograph showing a resettlement house developed in the Naminya Village.............. 38
Figure 37: A toilet for one of the houses in Naminya Village .................................................................. 39
Figure 38: A graph showing the number of people who took part in the research interview ............ 39
Figure 39: A graph showing the number of people who liked the resettlement and those who did not ...................................................................................................................................................................... 40
Figure 40: A photograph of a resident outside the Health Centre .......................................................... 41
Figure 41: A photograph of a school refurbished in the resettlement village (Naminya) for the children .............................................................................................................................................................. 41
Figure 42: Some of the residents that took part in the training courses with their certificates after completion. ....................................................................................................................................................... 42
Figure 43: A young boy collecting water at the borehole constructed in the resettlement village. .... 43
Figure 44: A water tank provided to help in water storage in the resettlement village. ....................... 43
Figure 45: Workmen placing transmission lines on an electricity pole in Bujagali area ....................... 44
Figure 46: Electricity transmission lines in Bujagali area........................................................................... 44
Figure 47: A photograph showing the spiritual leaders and the officials in consultation about the appeasement of the spirits .............................................................................................................................. 45
Figure 48: The spiritual leader Bujagali consulting the spirits at night. “Spirits are awake only at night." ................................................................................................................................................................ 46
Figure 49: Modern shrines agreed upon that were constructed for the Spirits after appeasement .... 46
Figure 50: Photograph of an interior of a house showing a bed used by one of the residents before. ............................................................................................................................................................................ 47
Figure 51: Beddings provided by the BEL Company ................................................................................ 48
Figure 52: An elderly in his shop in Bujagali.............................................................................................. 48
Figure 53: A pie chart showing the percentage of occupation of the residents that took part in the research ............................................................................................................................................................. 49
Figure 54: A farm of a resident in Naminya village ................................................................................... 50
Figure 55: Workers during the construction of the dam in 2009 ............................................................ 51
Figure 56: White Water Rafting at Bujagali Falls ........................................................................................ 52
Figure 57: A photograph of the Busoga cultural center being constructed ........................................... 52
Figure 58: Removal of water hyacinth by BEL employees at Bujagali ................................................... 54
Figure 59: Researcher at the Bujagali Power Station wearing Safety equipment supplied by BEL.... 55
Figure 60: Fog at Bujagali in the early morning hours............................................................................... 56
List of Tables Table 1: Small hydro Power Stations and their capacities (MEMD, 2013) ........................................... 15
Table 2: Showing the environmental and social impacts during dam construction. (Salomon, 2011) ............................................................................................................................................................................ 30
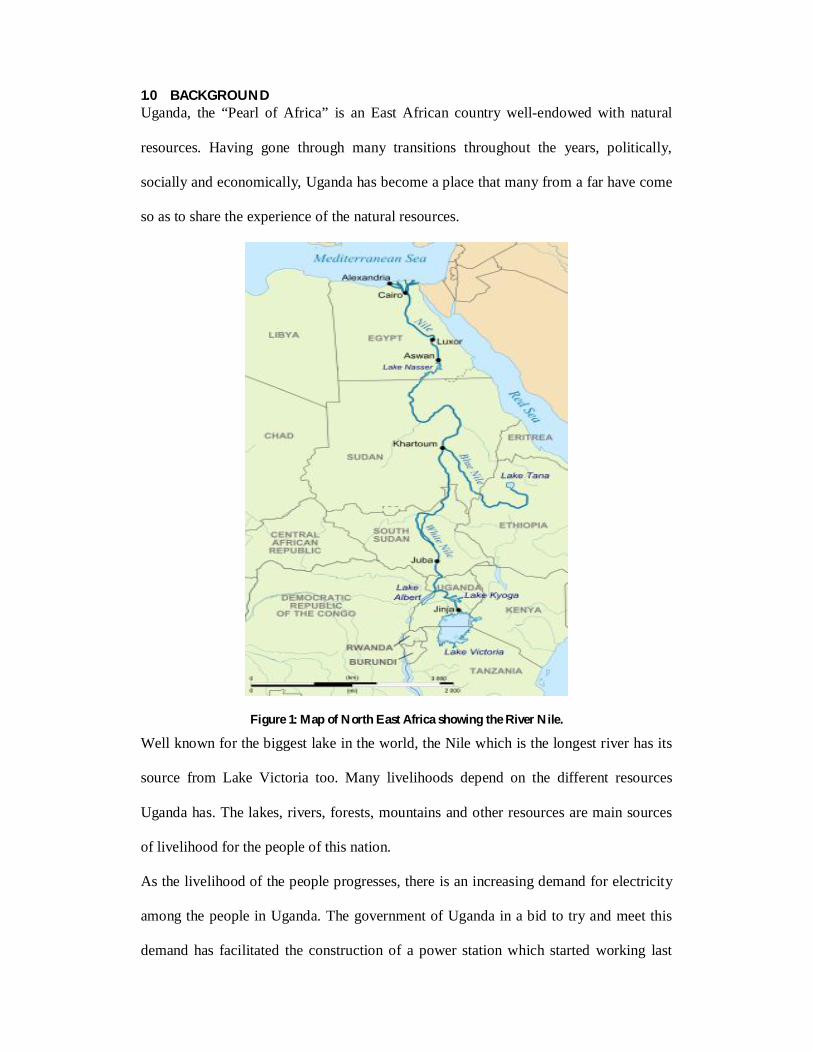
1.0 BACKGROUND Uganda, the “Pearl of Africa” is an East African country well-endowed with natural
resources. Having gone through many transitions throughout the years, politically,
socially and economically, Uganda has become a place that many from a far have come
so as to share the experience of the natural resources.
Figure 1: Map of North East Africa showing the River Nile.
Well known for the biggest lake in the world, the Nile which is the longest river has its
source from Lake Victoria too. Many livelihoods depend on the different resources
Uganda has. The lakes, rivers, forests, mountains and other resources are main sources
of livelihood for the people of this nation.
As the livelihood of the people progresses, there is an increasing demand for electricity
among the people in Uganda. The government of Uganda in a bid to try and meet this
demand has facilitated the construction of a power station which started working last
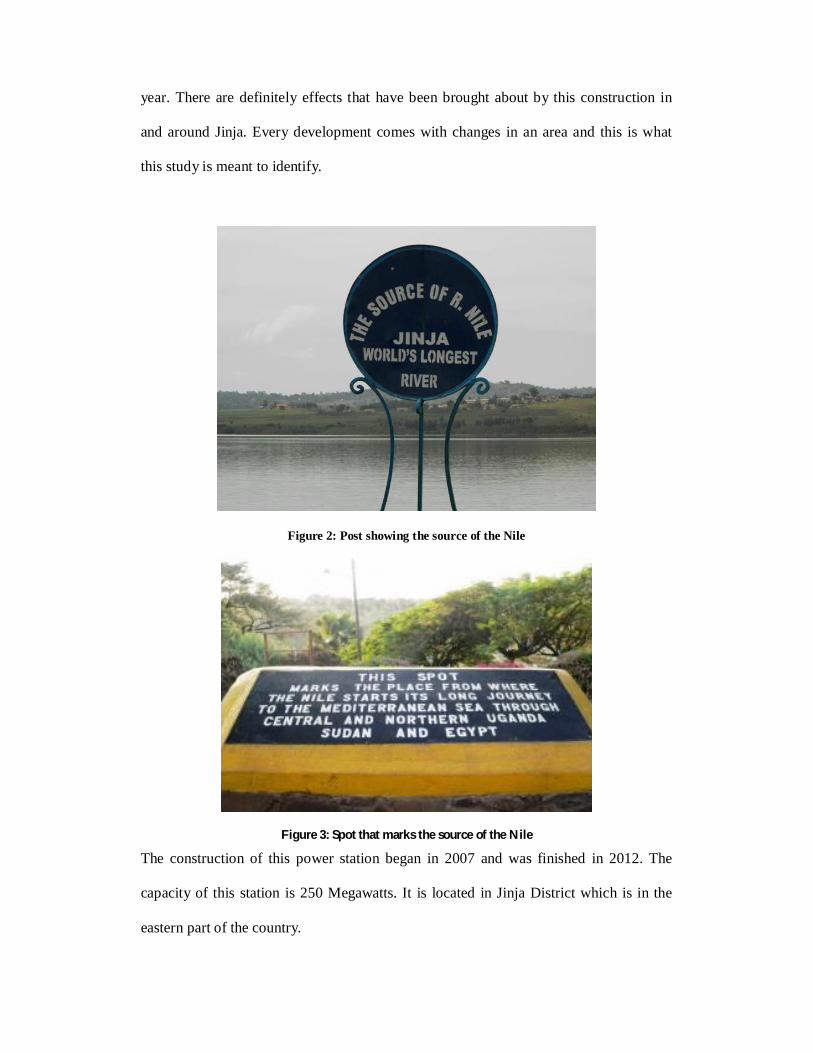
year. There are definitely effects that have been brought about by this construction in
and around Jinja. Every development comes with changes in an area and this is what
this study is meant to identify.
Figure 2: Post showing the source of the Nile
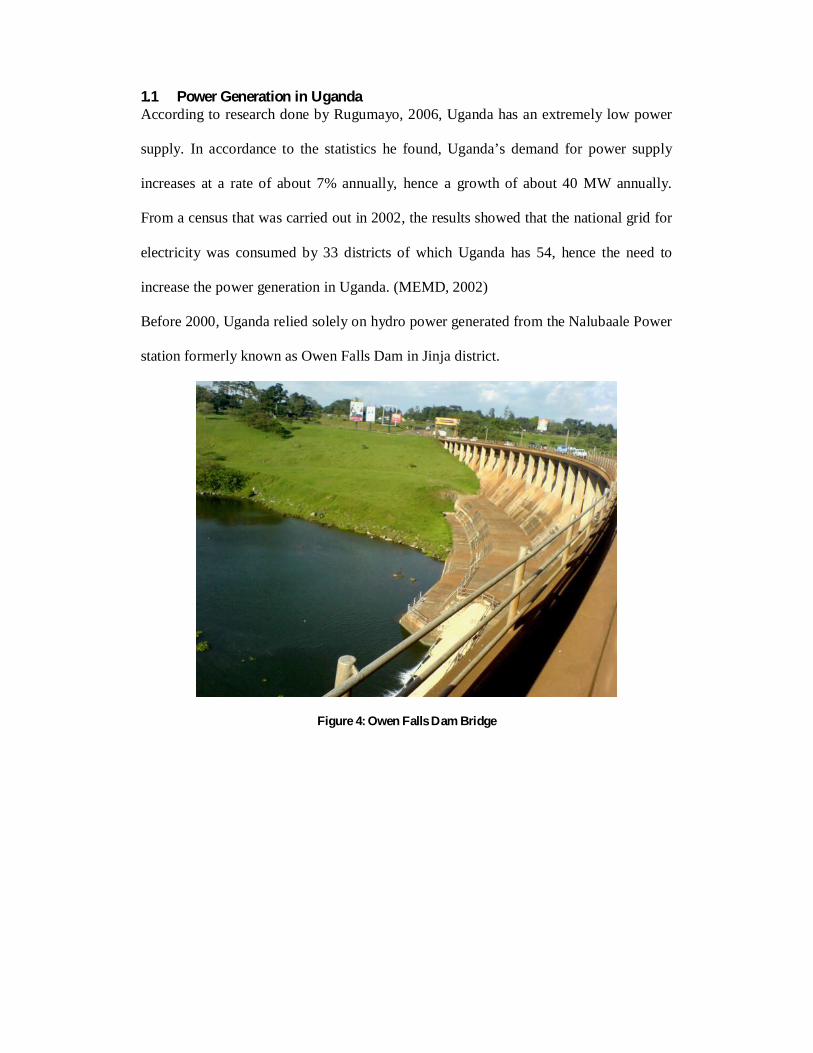
Figure 3: Spot that marks the source of the Nile
The construction of this power station began in 2007 and was finished in 2012. The
capacity of this station is 250 Megawatts. It is located in Jinja District which is in the
eastern part of the country.
1.1 Power Generation in Uganda According to research done by Rugumayo, 2006, Uganda has an extremely low power
supply. In accordance to the statistics he found, Uganda’s demand for power supply
increases at a rate of about 7% annually, hence a growth of about 40 MW annually.
From a census that was carried out in 2002, the results showed that the national grid for
electricity was consumed by 33 districts of which Uganda has 54, hence the need to
increase the power generation in Uganda. (MEMD, 2002)
Before 2000, Uganda relied solely on hydro power generated from the Nalubaale Power
station formerly known as Owen Falls Dam in Jinja district.
Figure 4: Owen Falls Dam Bridge
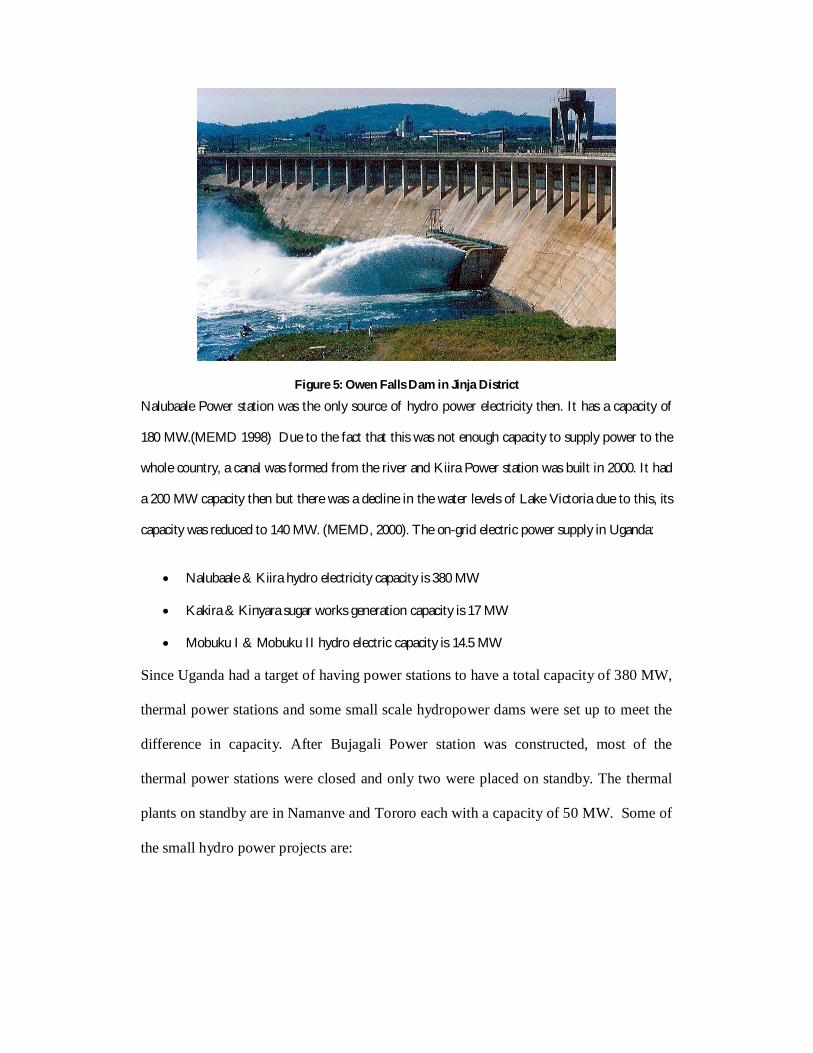
Figure 5: Owen Falls Dam in Jinja District
Nalubaale Power station was the only source of hydro power electricity then. It has a capacity of
180 MW.(MEMD 1998) Due to the fact that this was not enough capacity to supply power to the
whole country, a canal was formed from the river and Kiira Power station was built in 2000. It had
a 200 MW capacity then but there was a decline in the water levels of Lake Victoria due to this, its
capacity was reduced to 140 MW. (MEMD, 2000). The on-grid electric power supply in Uganda:
Nalubaale & Kiira hydro electricity capacity is 380 MW
Kakira & Kinyara sugar works generation capacity is 17 MW
Mobuku I & Mobuku II hydro electric capacity is 14.5 MW
Since Uganda had a target of having power stations to have a total capacity of 380 MW,
thermal power stations and some small scale hydropower dams were set up to meet the
difference in capacity. After Bujagali Power station was constructed, most of the
thermal power stations were closed and only two were placed on standby. The thermal
plants on standby are in Namanve and Tororo each with a capacity of 50 MW. Some of
the small hydro power projects are:
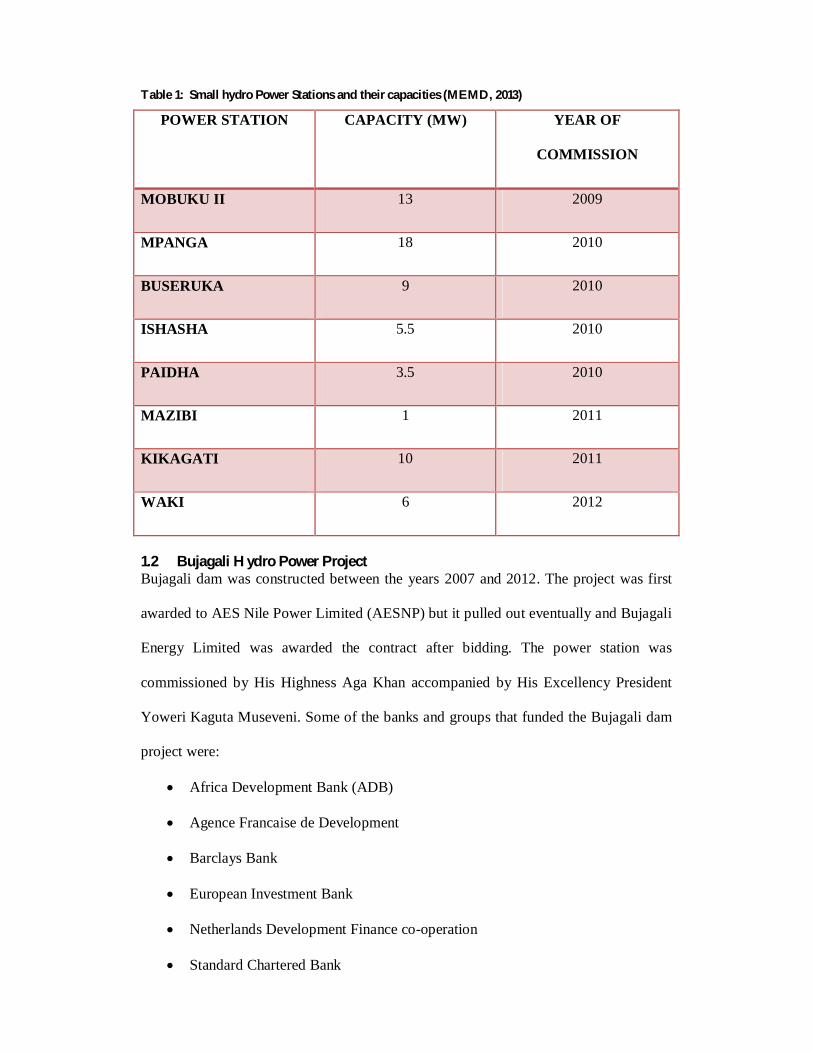
Table 1: Small hydro Power Stations and their capacities (MEMD, 2013)
POWER STATION CAPACITY (MW) YEAR OF
COMMISSION
MOBUKU II 13 2009
MPANGA 18 2010
BUSERUKA 9 2010
ISHASHA 5.5 2010
PAIDHA 3.5 2010
MAZIBI 1 2011
KIKAGATI 10 2011
WAKI 6 2012
1.2 Bujagali Hydro Power Project Bujagali dam was constructed between the years 2007 and 2012. The project was first
awarded to AES Nile Power Limited (AESNP) but it pulled out eventually and Bujagali
Energy Limited was awarded the contract after bidding. The power station was
commissioned by His Highness Aga Khan accompanied by His Excellency President
Yoweri Kaguta Museveni. Some of the banks and groups that funded the Bujagali dam
project were:
Africa Development Bank (ADB)
Agence Francaise de Development
Barclays Bank
European Investment Bank
Netherlands Development Finance co-operation
Standard Chartered Bank
World Bank Group
Hence the Bujagali Hydropower Project is a 250-megawatt power-generating facility
built by Bujagali Energy Limited and operated and maintained by Operations and
Maintenance Energy Uganda Limited (O&M Energy). (USAID, Bujagali 2007)
The project’s objective is: “to increase accessibility of less expensive and more reliable
electricity supply to the national grid hence meeting the energy needs of Uganda’s
population for social and economic development.”
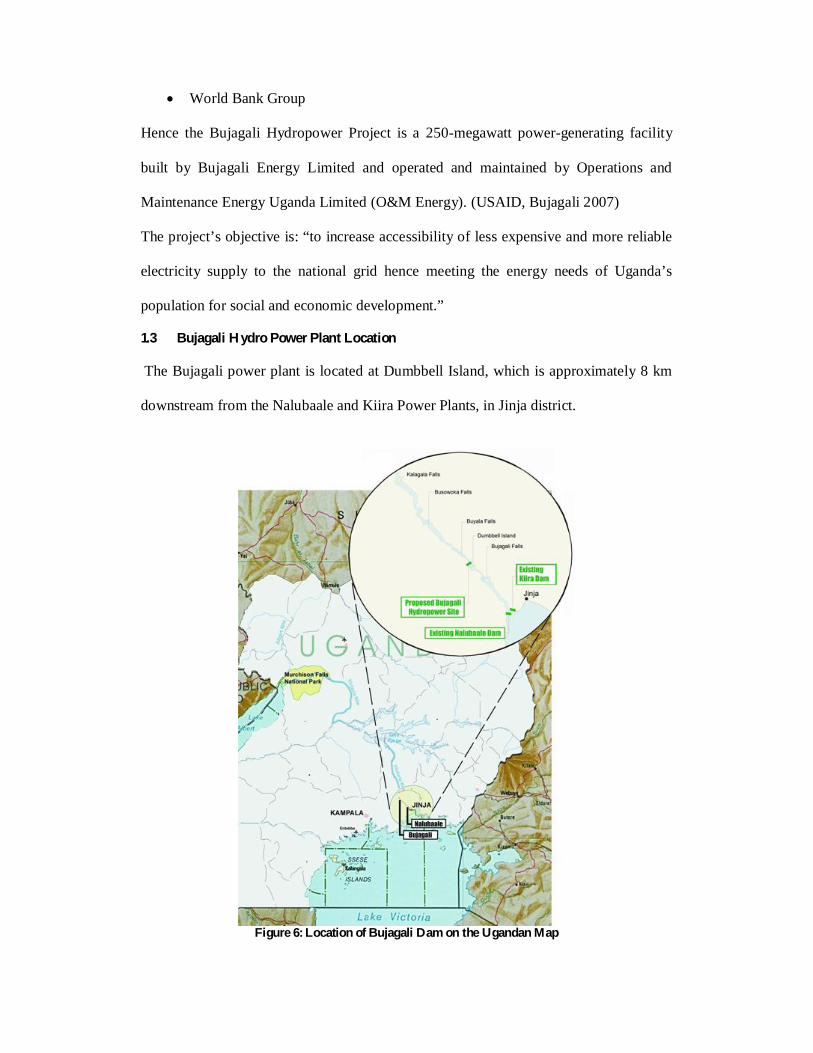
1.3 Bujagali Hydro Power Plant Location
The Bujagali power plant is located at Dumbbell Island, which is approximately 8 km
downstream from the Nalubaale and Kiira Power Plants, in Jinja district.
Figure 6: Location of Bujagali Dam on the Ugandan Map
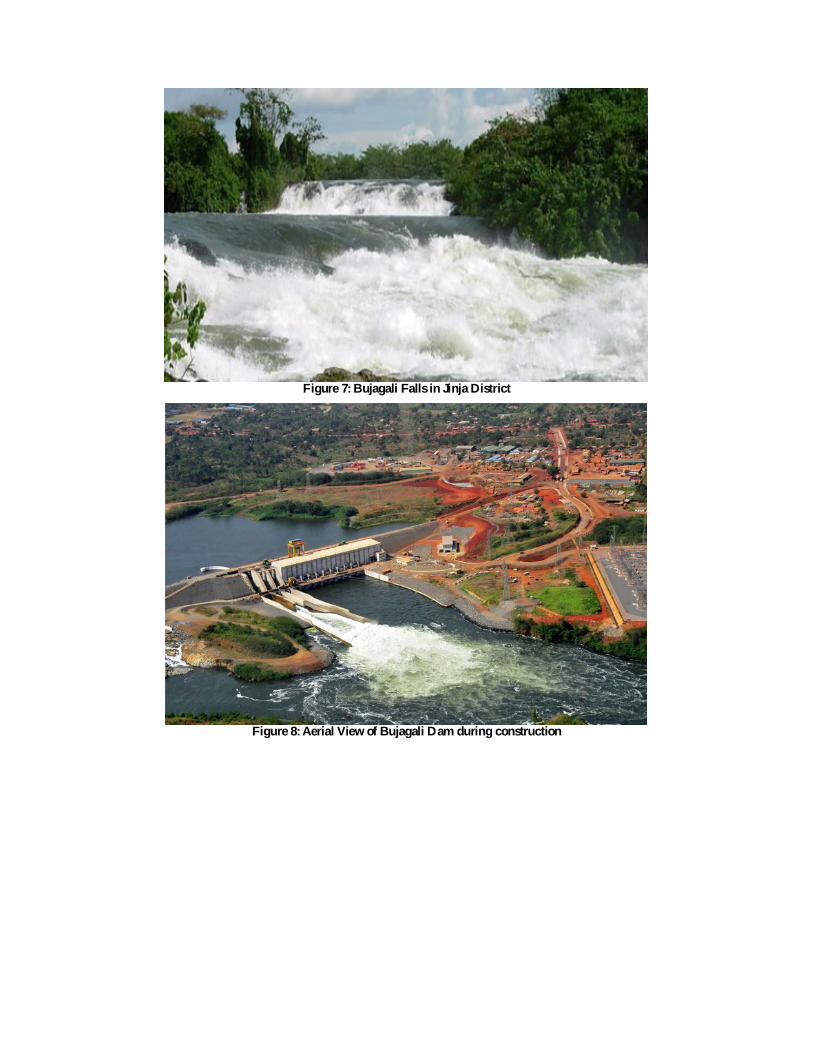
Figure 7: Bujagali Falls in Jinja District
Figure 8: Aerial View of Bujagali Dam during construction
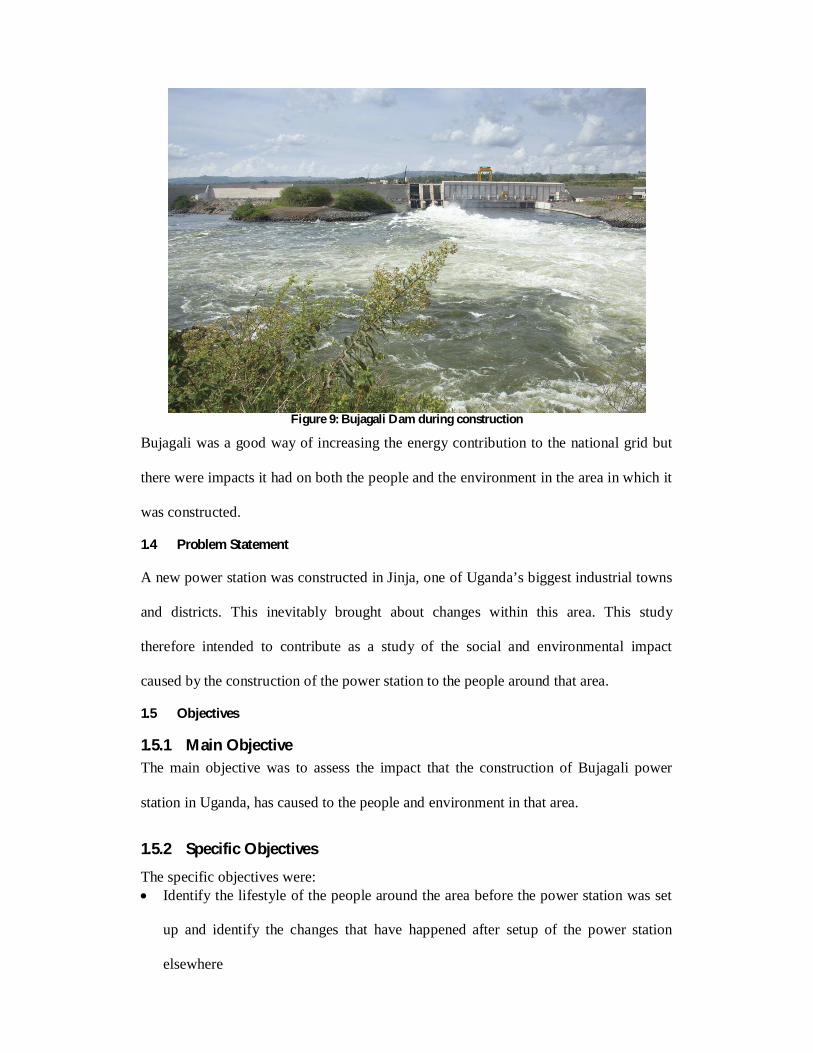
Figure 9: Bujagali Dam during construction
Bujagali was a good way of increasing the energy contribution to the national grid but
there were impacts it had on both the people and the environment in the area in which it
was constructed.
1.4 Problem Statement
A new power station was constructed in Jinja, one of Uganda’s biggest industrial towns
and districts. This inevitably brought about changes within this area. This study
therefore intended to contribute as a study of the social and environmental impact
caused by the construction of the power station to the people around that area.
1.5 Objectives
1.5.1 Main Objective The main objective was to assess the impact that the construction of Bujagali power
station in Uganda, has caused to the people and environment in that area.
1.5.2 Specific Objectives
The specific objectives were: Identify the lifestyle of the people around the area before the power station was set
up and identify the changes that have happened after setup of the power station
elsewhere
Identify the environmental and social changes that have happened after
setup of the Bujagali power station
Make recommendations in regards to improving the social and
environmental impacts of Bujagali dam.
1.6 Scope The study was conducted in the residential areas surrounding the Bujagali Power
Station and at the station itself so as to attain the required information. The focus was
mainly on the residents that actually lived in the resettlement villages especially
Naminya village: where the Bujagali power station was setup.
2.0 LITERATURE REVIEW
2.1 Dams and Hydro Power History A wall or barrier of solid material across a river valley is what can be termed as a dam.
A dam is meant to form a stable flow of water downstream. A dam is meant to weather
any water pressure and weather conditions so as to prevent it from bursting. (SeqWater,
2012) Dams are usually constructed so as to either give flood mitigation, water storage
while others are for the production of hydro power of which is important in this thesis.
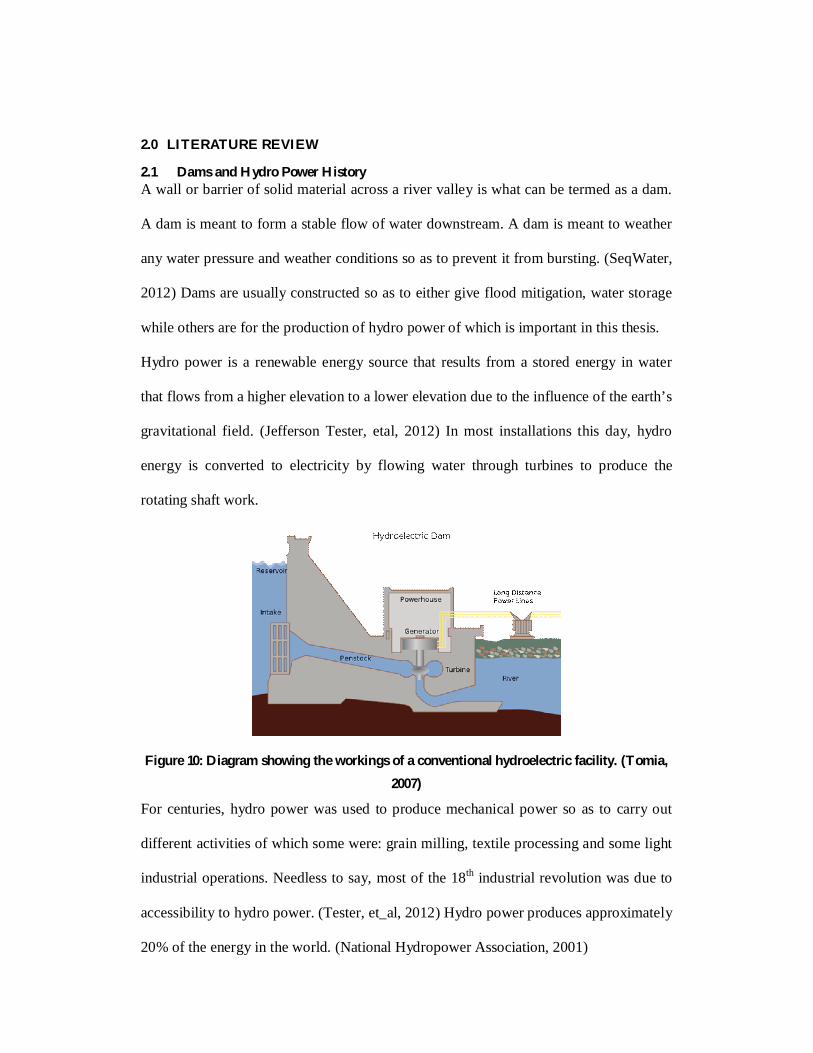
Hydro power is a renewable energy source that results from a stored energy in water
that flows from a higher elevation to a lower elevation due to the influence of the earth’s
gravitational field. (Jefferson Tester, etal, 2012) In most installations this day, hydro
energy is converted to electricity by flowing water through turbines to produce the
rotating shaft work.
Figure 10: Diagram showing the workings of a conventional hydroelectric facility. (Tomia,
2007)
For centuries, hydro power was used to produce mechanical power so as to carry out
different activities of which some were: grain milling, textile processing and some light
industrial operations. Needless to say, most of the 18th industrial revolution was due to
accessibility to hydro power. (Tester, et_al, 2012) Hydro power produces approximately
20% of the energy in the world. (National Hydropower Association, 2001)
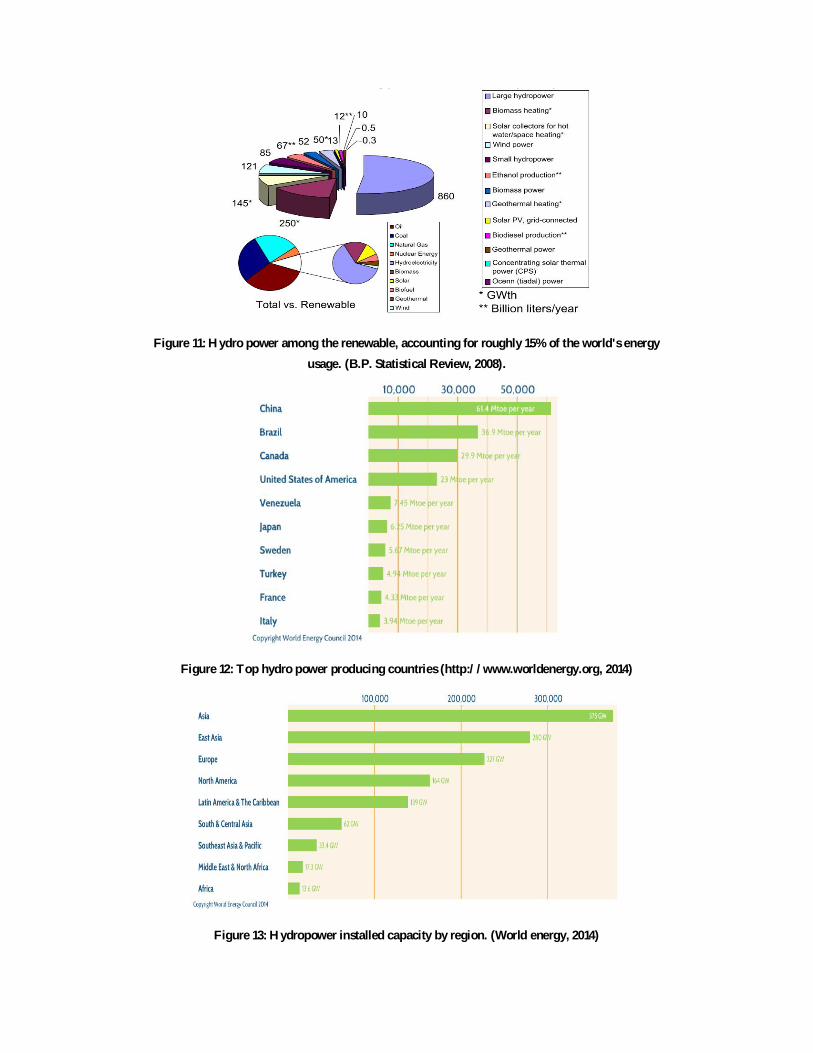
Figure 11: Hydro power among the renewable, accounting for roughly 15% of the world's energy
usage. (B.P. Statistical Review, 2008).
Figure 12: Top hydro power producing countries (http://www.worldenergy.org, 2014)
Figure 13: Hydropower installed capacity by region. (World energy, 2014)

2.2 Basic Energy conversions for Hydro Power
The potential and kinetic energy are used to create mechanical energy that in turn drives
the generator so as to create hydro power. The formula for potential energy is:
P (W) = ρ g H Q ηt ………………………………………….. Equation I
Where, ρ = water density = 1000 kg/m3, g = gravitational const. = 9.81 m/s2, H = head
(m), Q = water flow (m3/s) and ηt = turbine efficiency. It is important to note that the
head of the flow matters in order to produce the capacity of power required. (CompEdu,
2011)
There are three types of hydro power systems which include:
Impoundment systems: these use man made dams for water supply maintenance.
Pumped storage systems: water is pumped from a source to a storage reservoir
located at a higher elevation.
Diversion systems: intercept a portion of the natural water flow without use of
an artificial dam.
The types of dams include:
Gravity dams
Arch dams
Buttress dams
Embankment dams which are subdivided into earth fill and rock fill dams. These
are the most constructed dams.
Figure 14: Diagram showing Embankment dam.
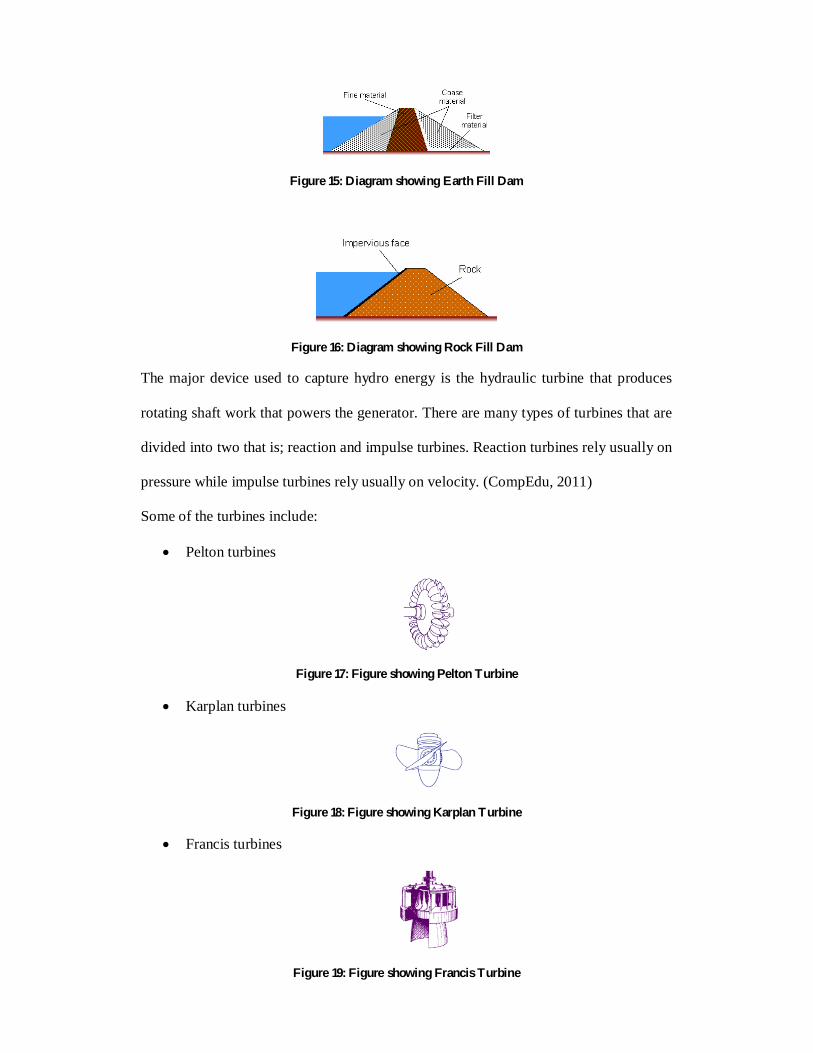
Figure 15: Diagram showing Earth Fill Dam
Figure 16: Diagram showing Rock Fill Dam
The major device used to capture hydro energy is the hydraulic turbine that produces
rotating shaft work that powers the generator. There are many types of turbines that are
divided into two that is; reaction and impulse turbines. Reaction turbines rely usually on
pressure while impulse turbines rely usually on velocity. (CompEdu, 2011)
Some of the turbines include:
Pelton turbines
Figure 17: Figure showing Pelton Turbine
Karplan turbines
Figure 18: Figure showing Karplan Turbine
Francis turbines
Figure 19: Figure showing Francis Turbine
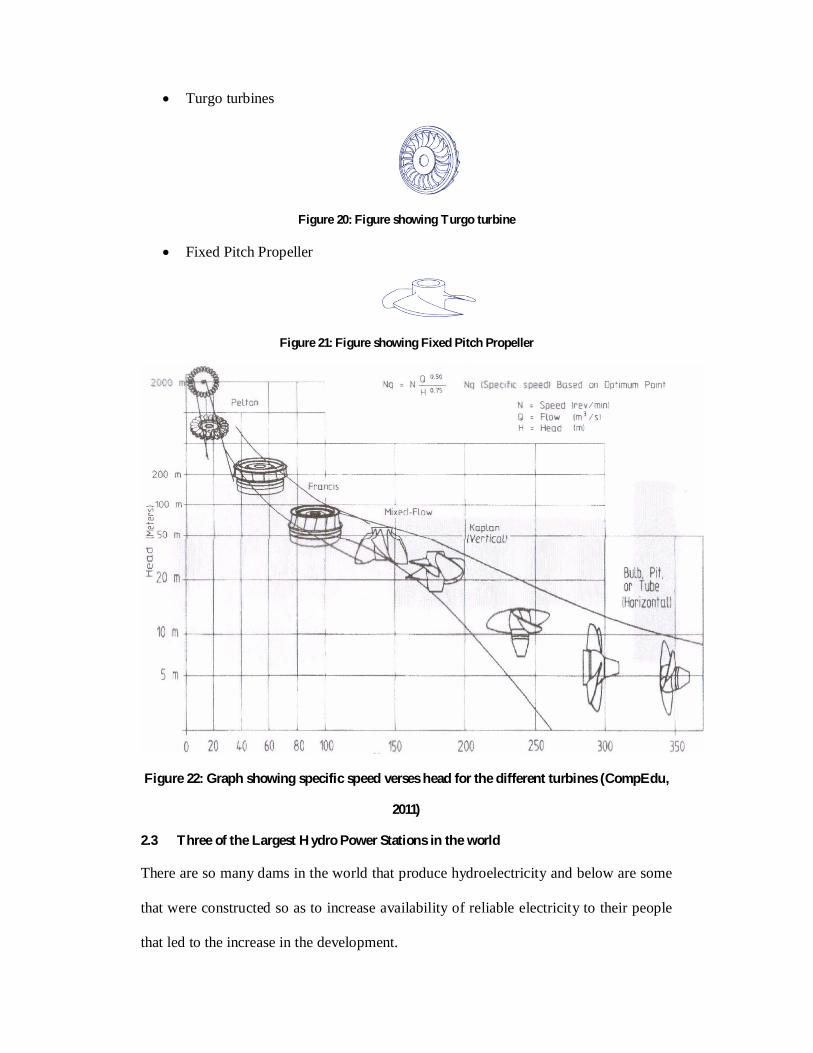
Turgo turbines
Figure 20: Figure showing Turgo turbine
Fixed Pitch Propeller
Figure 21: Figure showing Fixed Pitch Propeller
Figure 22: Graph showing specific speed verses head for the different turbines (CompEdu,
2011)
2.3 Three of the Largest Hydro Power Stations in the world
There are so many dams in the world that produce hydroelectricity and below are some
that were constructed so as to increase availability of reliable electricity to their people
that led to the increase in the development.
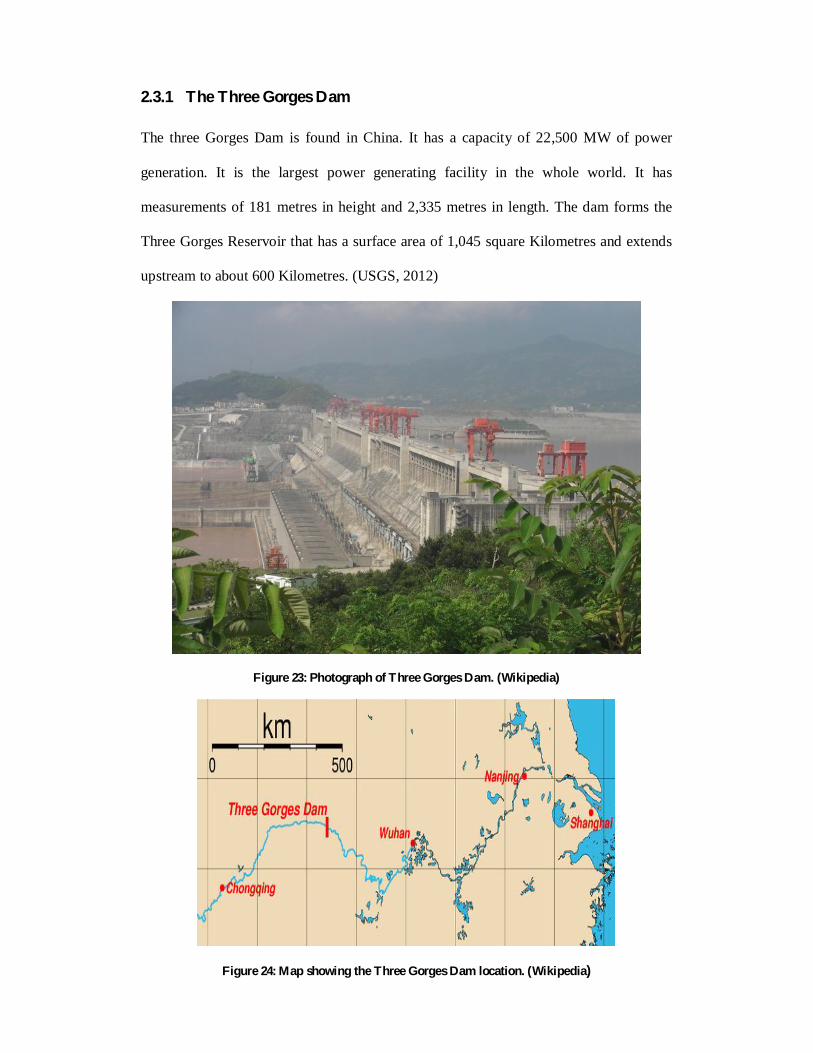
2.3.1 The Three Gorges Dam
The three Gorges Dam is found in China. It has a capacity of 22,500 MW of power
generation. It is the largest power generating facility in the whole world. It has
measurements of 181 metres in height and 2,335 metres in length. The dam forms the
Three Gorges Reservoir that has a surface area of 1,045 square Kilometres and extends
upstream to about 600 Kilometres. (USGS, 2012)
Figure 23: Photograph of Three Gorges Dam. (Wikipedia)
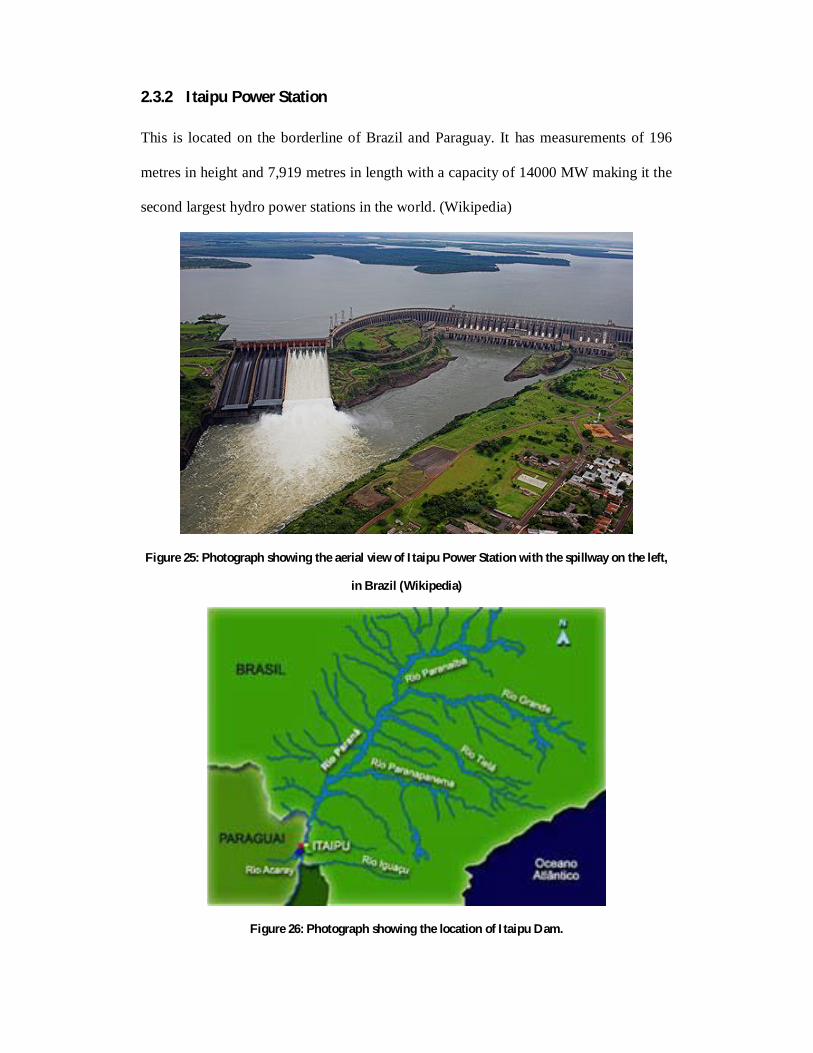
Figure 24: Map showing the Three Gorges Dam location. (Wikipedia)
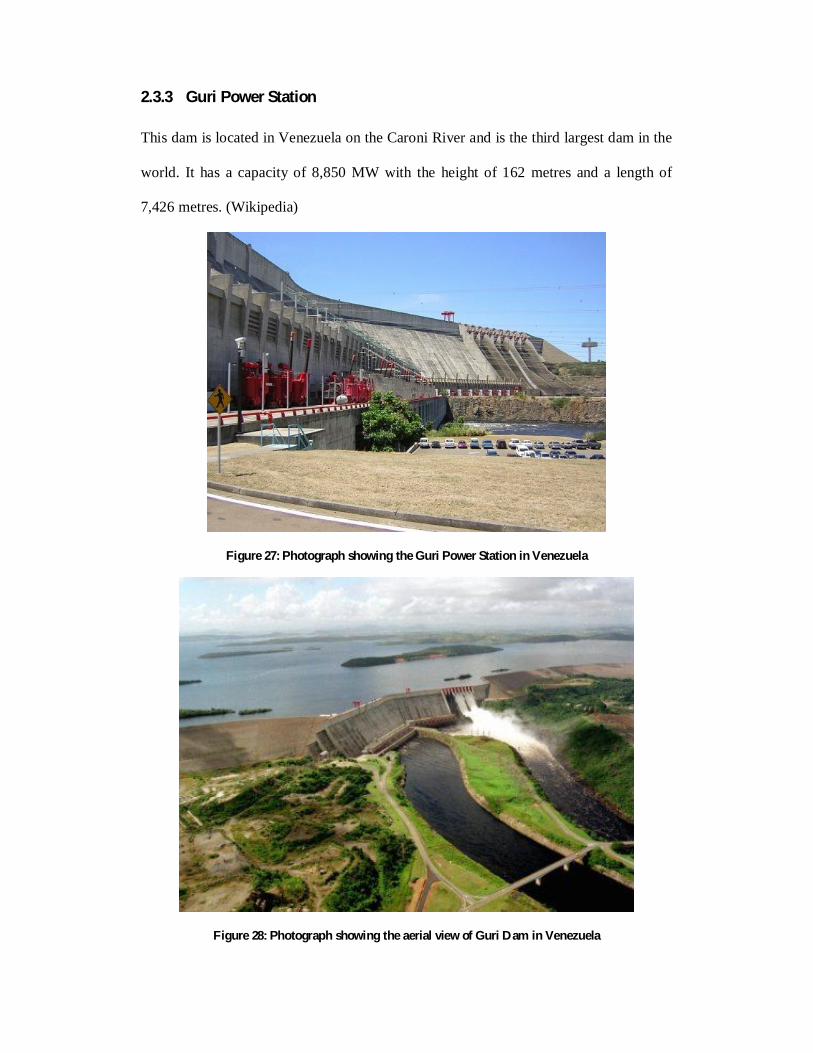
2.3.2 Itaipu Power Station
This is located on the borderline of Brazil and Paraguay. It has measurements of 196
metres in height and 7,919 metres in length with a capacity of 14000 MW making it the
second largest hydro power stations in the world. (Wikipedia)
Figure 25: Photograph showing the aerial view of Itaipu Power Station with the spillway on the left,
in Brazil (Wikipedia)
Figure 26: Photograph showing the location of Itaipu Dam.
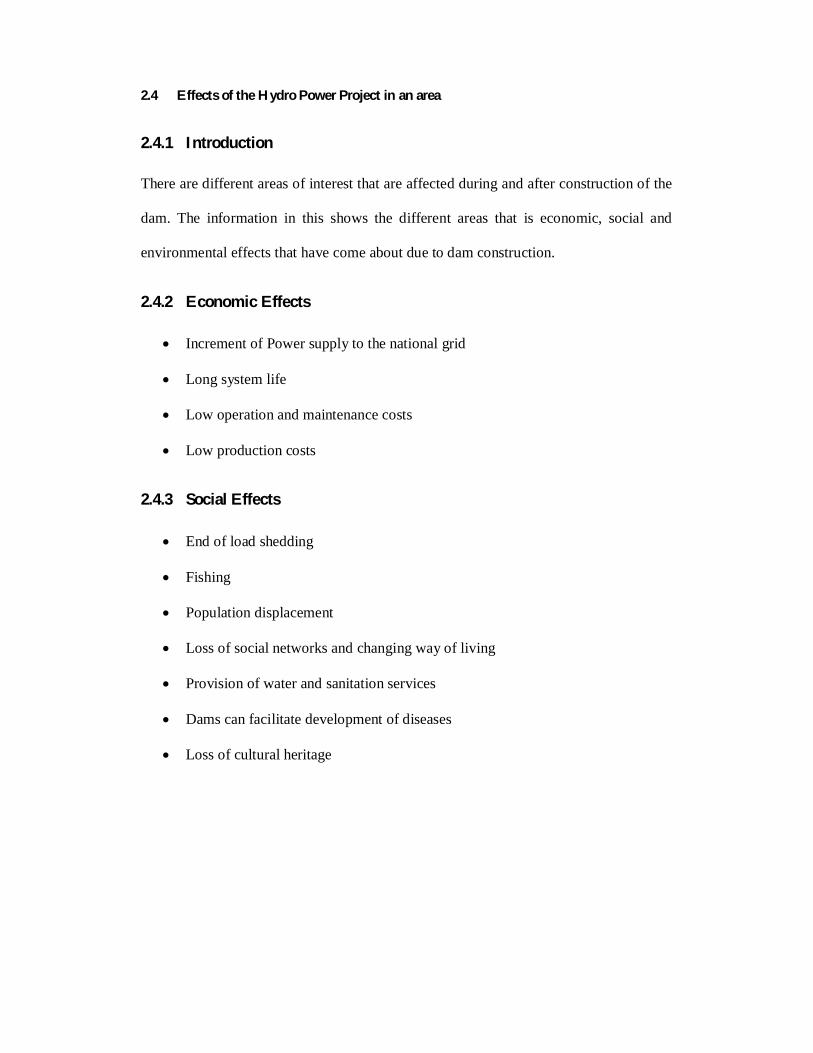
2.3.3 Guri Power Station
This dam is located in Venezuela on the Caroni River and is the third largest dam in the
world. It has a capacity of 8,850 MW with the height of 162 metres and a length of
7,426 metres. (Wikipedia)
Figure 27: Photograph showing the Guri Power Station in Venezuela
Figure 28: Photograph showing the aerial view of Guri Dam in Venezuela
2.4 Effects of the Hydro Power Project in an area
2.4.1 Introduction
There are different areas of interest that are affected during and after construction of the
dam. The information in this shows the different areas that is economic, social and
environmental effects that have come about due to dam construction.
2.4.2 Economic Effects
Increment of Power supply to the national grid
Long system life
Low operation and maintenance costs
Low production costs
2.4.3 Social Effects
End of load shedding
Fishing
Population displacement
Loss of social networks and changing way of living
Provision of water and sanitation services
Dams can facilitate development of diseases
Loss of cultural heritage
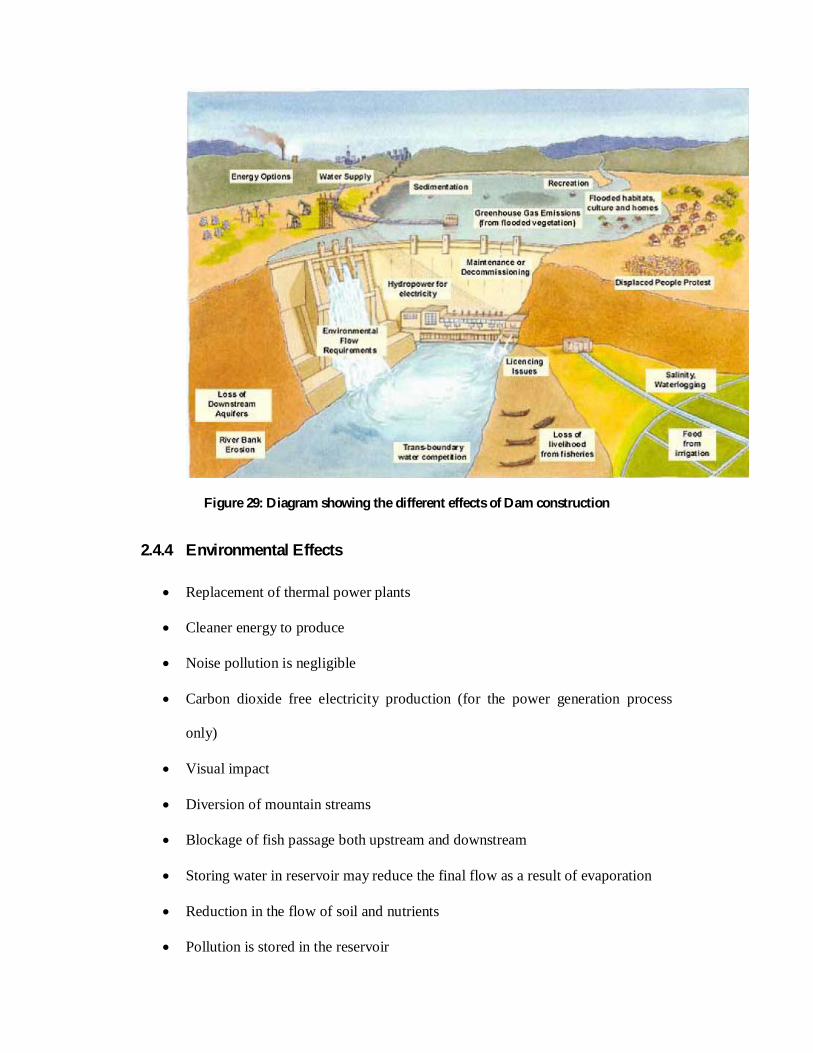
Figure 29: Diagram showing the different effects of Dam construction
2.4.4 Environmental Effects
Replacement of thermal power plants
Cleaner energy to produce
Noise pollution is negligible
Carbon dioxide free electricity production (for the power generation process
only)
Visual impact
Diversion of mountain streams
Blockage of fish passage both upstream and downstream
Storing water in reservoir may reduce the final flow as a result of evaporation
Reduction in the flow of soil and nutrients
Pollution is stored in the reservoir
Possible dam failure
Local increase in water vapor and some temperature effects
Vegetation rotting under water produces methane
High levels of total dissolved gas causes bubble disease in aquatic organisms
and can lead to their death
Erosion of riverbed
Water turbidity
Eutrophication
Super saturation
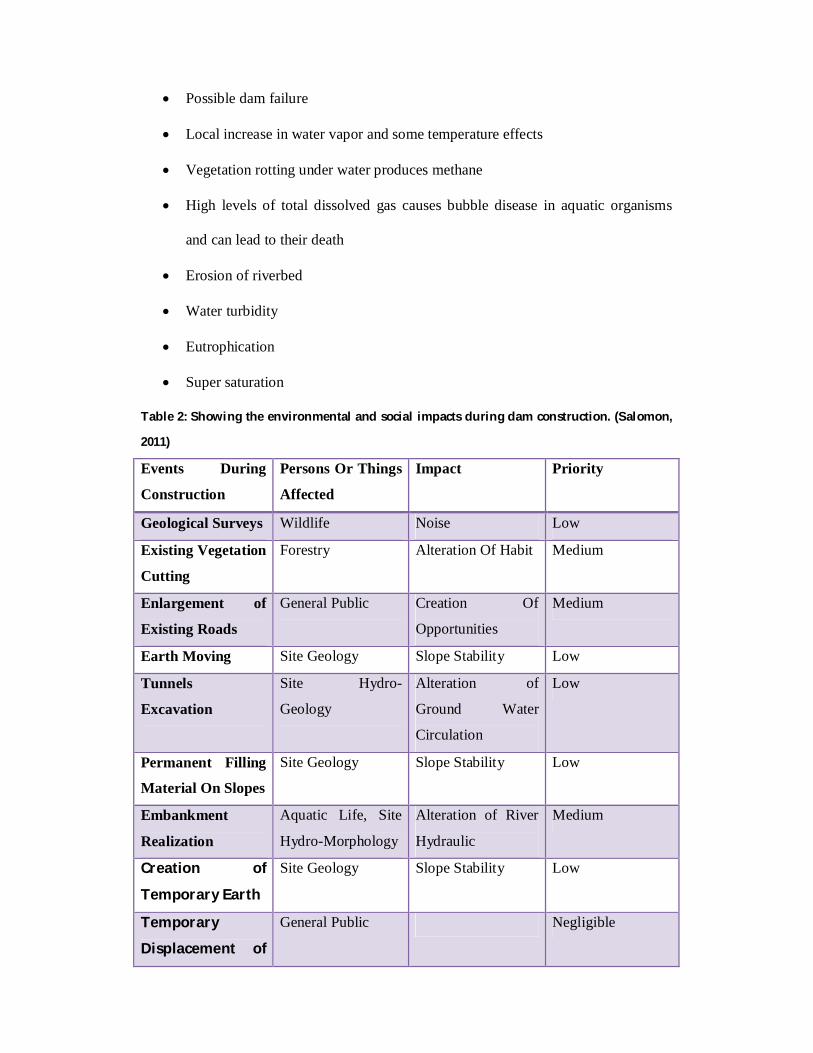
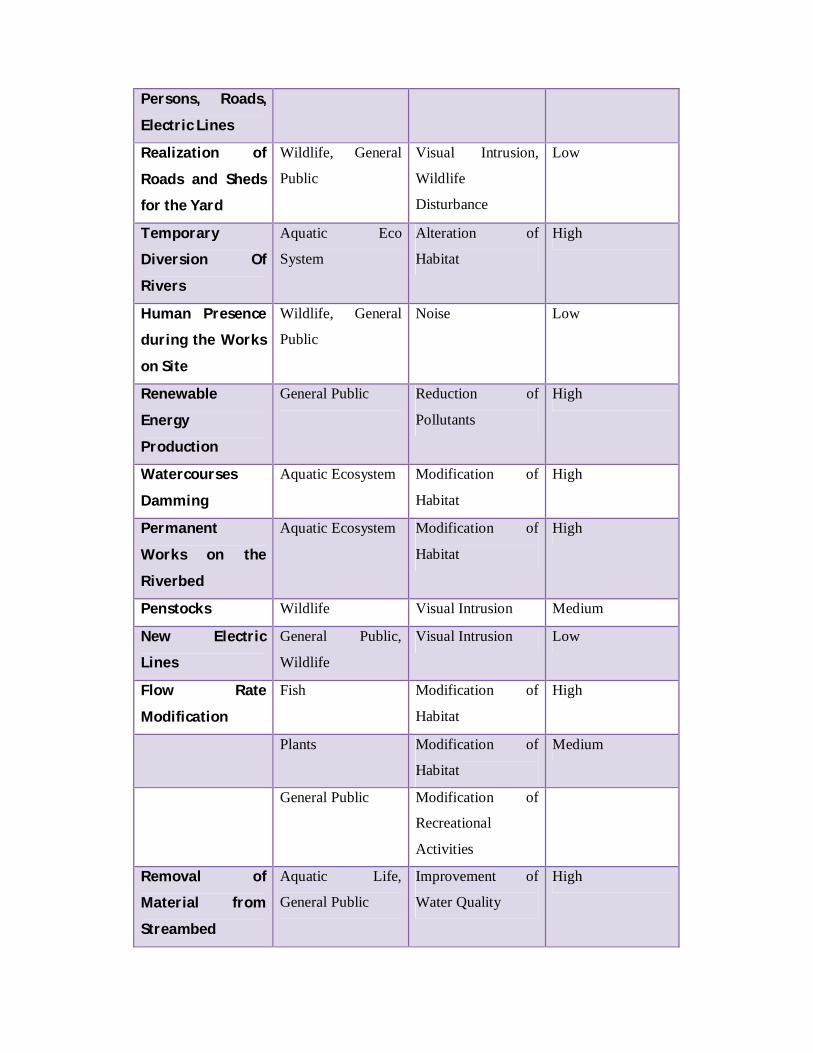
Table 2: Showing the environmental and social impacts during dam construction. (Salomon,
2011)
Events During
Construction
Persons Or Things
Affected
Impact Priority
Geological Surveys Wildlife Noise Low
Existing Vegetation
Cutting
Forestry Alteration Of Habit Medium
Enlargement of
Existing Roads
General Public Creation Of
Opportunities
Medium
Earth Moving Site Geology Slope Stability Low
Tunnels
Excavation
Site Hydro-
Geology
Alteration of
Ground Water
Circulation
Low
Permanent Filling
Material On Slopes
Site Geology Slope Stability Low
Embankment
Realization
Aquatic Life, Site
Hydro-Morphology
Alteration of River
Hydraulic
Medium
Creation of
Temporary Earth
Site Geology Slope Stability Low
Temporary
Displacement of
General Public Negligible
Persons, Roads,
Electric Lines
Realization of
Roads and Sheds
for the Yard
Wildlife, General
Public
Visual Intrusion,
Wildlife
Disturbance
Low
Temporary
Diversion Of
Rivers
Aquatic Eco
System
Alteration of
Habitat
High
Human Presence
during the Works
on Site
Wildlife, General
Public
Noise Low
Renewable
Energy
Production
General Public Reduction of
Pollutants
High
Watercourses
Damming
Aquatic Ecosystem Modification of
Habitat
High
Permanent
Works on the
Riverbed
Aquatic Ecosystem Modification of
Habitat
High
Penstocks Wildlife Visual Intrusion Medium
New Electric
Lines
General Public,
Wildlife
Visual Intrusion Low
Flow Rate
Modification
Fish Modification of
Habitat
High
Plants Modification of
Habitat
Medium
General Public Modification of
Recreational
Activities
Removal of
Material from
Streambed
Aquatic Life,
General Public
Improvement of
Water Quality
High
2.4.5 Context of the study
This study is meant to show the social and environmental outcomes of the construction
of the Bujagali Power Station in Jinja district along the River Nile at the Bujagali Falls.
3.0 METHODOLOGY
The following methodology was adapted in order to achieve the objectives mentioned
above. The methodology was divided into qualitative and quantitative methods so as to
ensure good results were acquired.
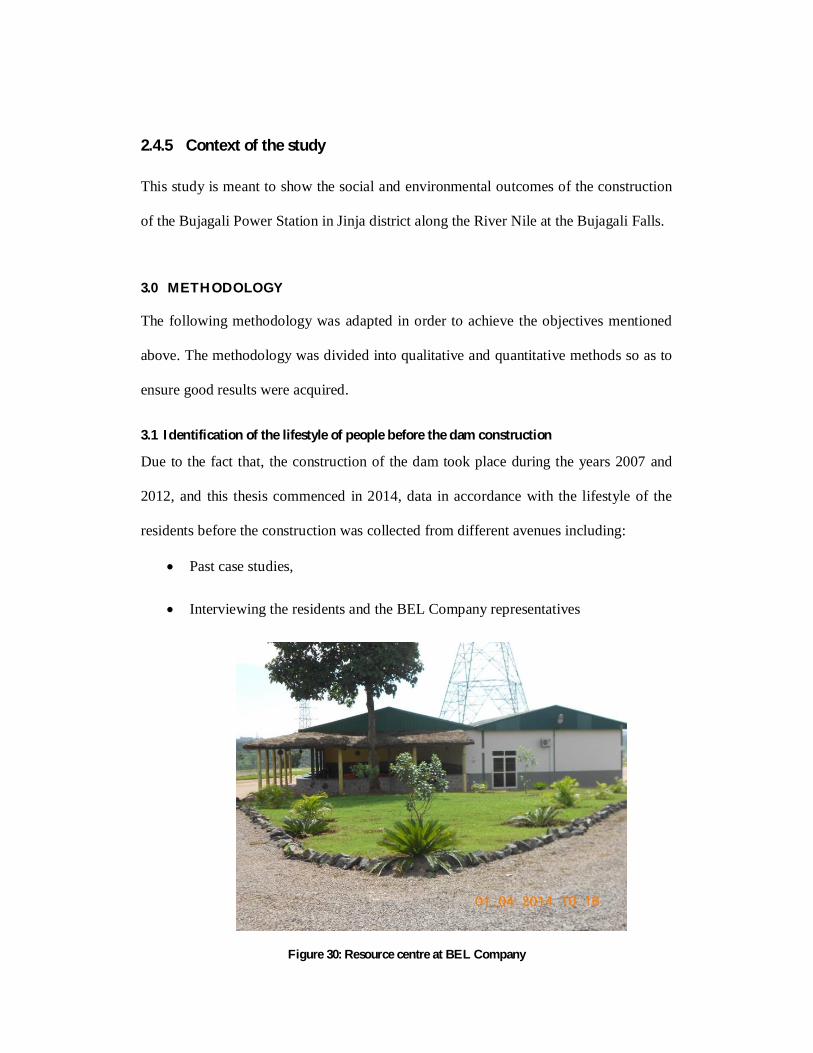
3.1 Identification of the lifestyle of people before the dam construction
Due to the fact that, the construction of the dam took place during the years 2007 and
2012, and this thesis commenced in 2014, data in accordance with the lifestyle of the
residents before the construction was collected from different avenues including:
Past case studies,
Interviewing the residents and the BEL Company representatives
Figure 30: Resource centre at BEL Company
Review of past reports.
3.2 Identification of impacts of dam construction elsewhere in the world
The impacts of dam construction elsewhere in the world were majorly covered in
chapter two. The different avenues in which the data was collected were:
Reviewing past reports
Reading different case studies made in accordance to dam construction in the
world
Visiting energy resource centers having different books in accordance to dam
construction
Internet browsing showing the different dam projects in the world
3.3 Identification of the social and environmental effects of Bujagali Dam
3.3.1 Data acquisition of social effects
The data was collected using different avenues which included:
Visitation of resettlement villages and holding interviews especially in Naminya
village in Jinja district
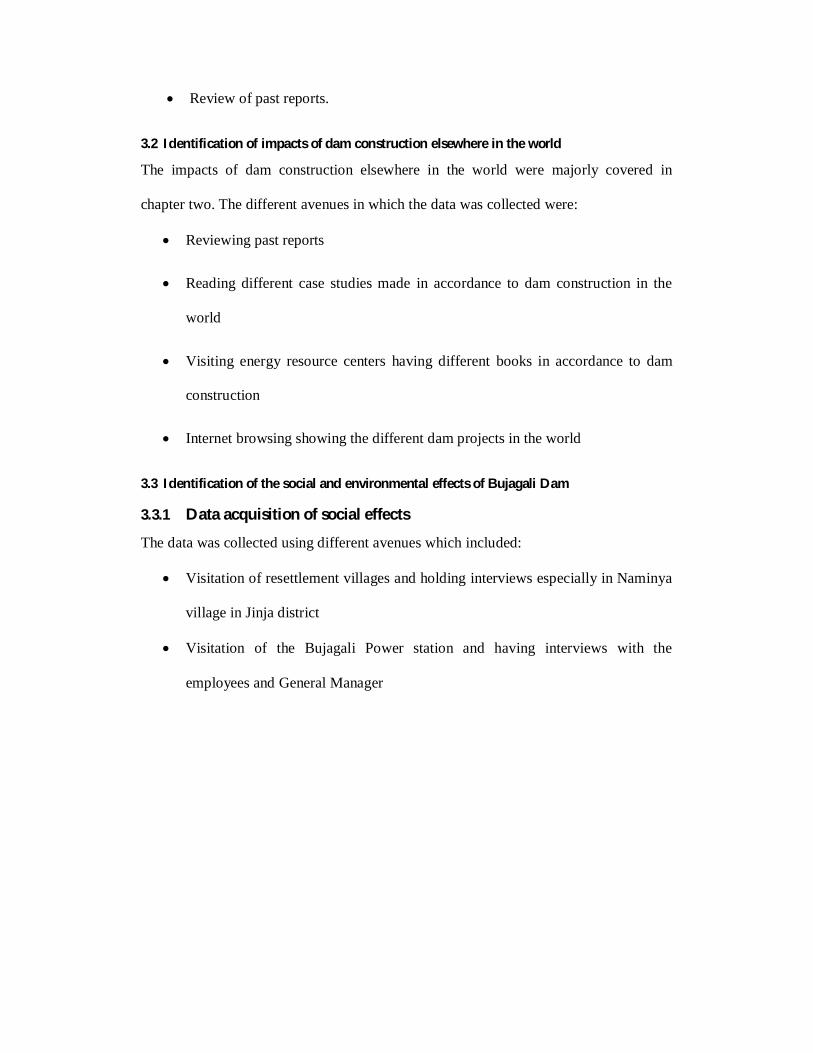
Visitation of the Bujagali Power station and having interviews with the
employees and General Manager
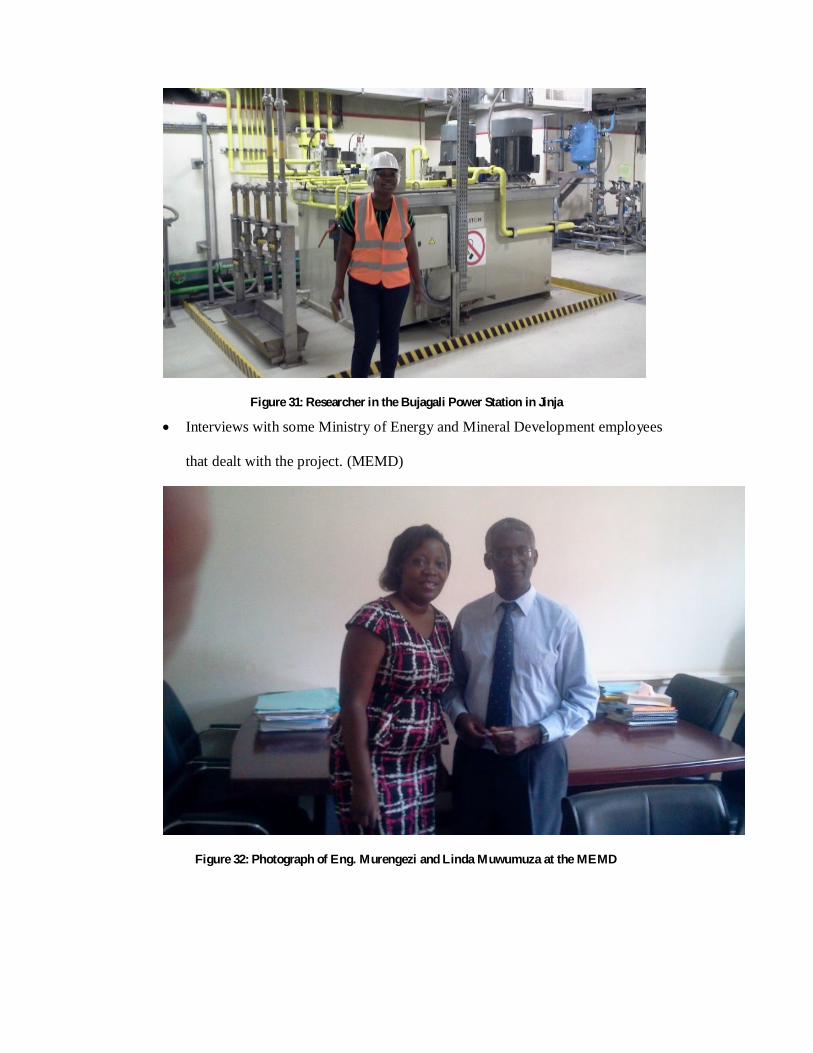
Figure 31: Researcher in the Bujagali Power Station in Jinja
Interviews with some Ministry of Energy and Mineral Development employees
that dealt with the project. (MEMD)
Figure 32: Photograph of Eng. Murengezi and Linda Muwumuza at the MEMD
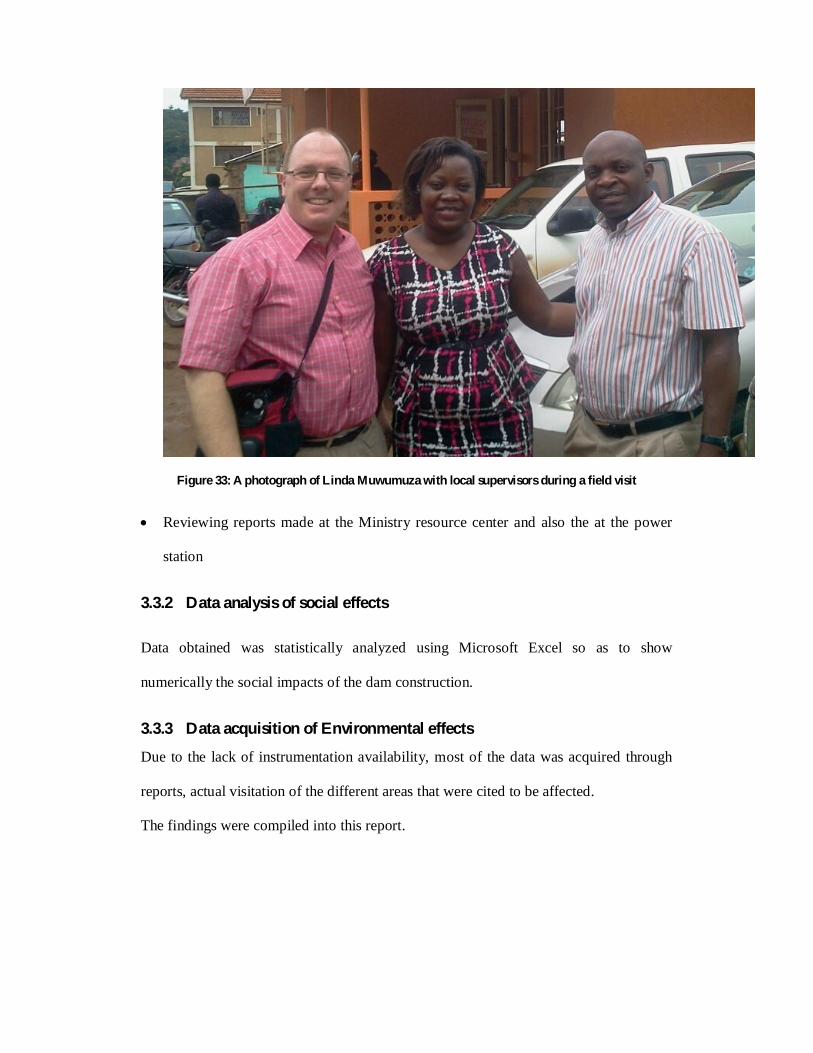
Figure 33: A photograph of Linda Muwumuza with local supervisors during a field visit
Reviewing reports made at the Ministry resource center and also the at the power
station
3.3.2 Data analysis of social effects
Data obtained was statistically analyzed using Microsoft Excel so as to show
numerically the social impacts of the dam construction.
3.3.3 Data acquisition of Environmental effects
Due to the lack of instrumentation availability, most of the data was acquired through
reports, actual visitation of the different areas that were cited to be affected.
The findings were compiled into this report.
4.0 FINDINGS AND DISCUSSIONS
4.1 Social effects of Bujagali Dam
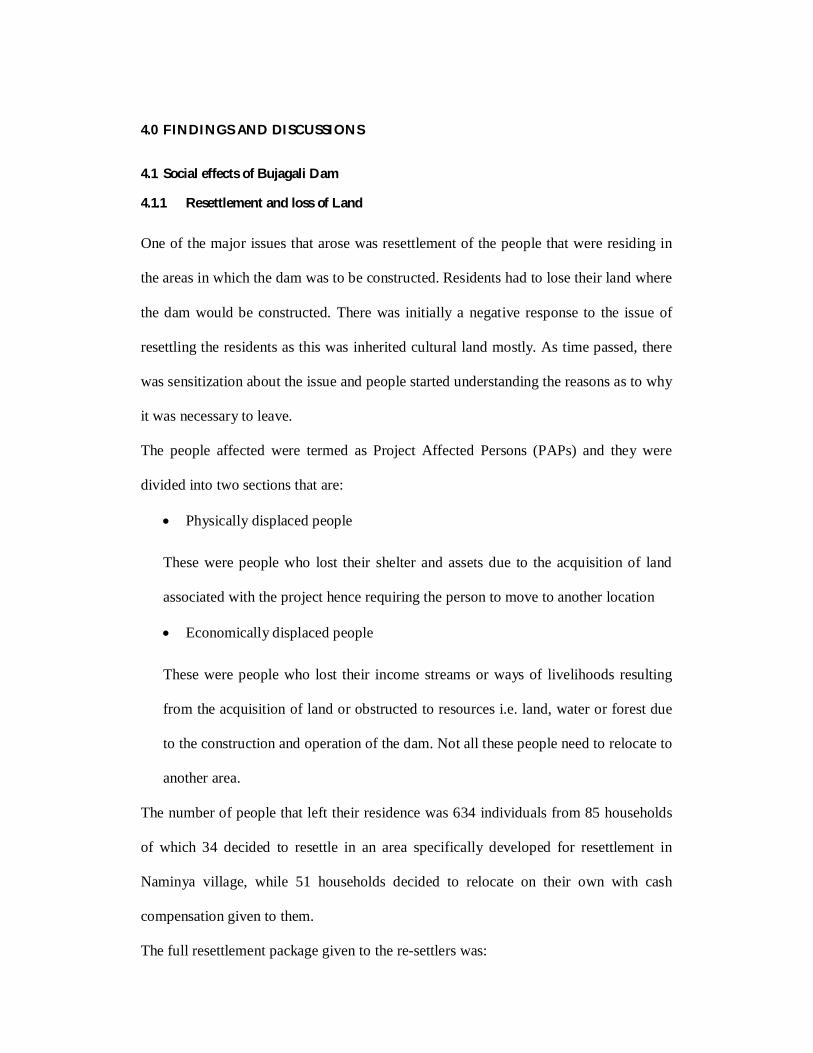
4.1.1 Resettlement and loss of Land
One of the major issues that arose was resettlement of the people that were residing in
the areas in which the dam was to be constructed. Residents had to lose their land where
the dam would be constructed. There was initially a negative response to the issue of
resettling the residents as this was inherited cultural land mostly. As time passed, there
was sensitization about the issue and people started understanding the reasons as to why
it was necessary to leave.
The people affected were termed as Project Affected Persons (PAPs) and they were
divided into two sections that are:
Physically displaced people
These were people who lost their shelter and assets due to the acquisition of land
associated with the project hence requiring the person to move to another location
Economically displaced people
These were people who lost their income streams or ways of livelihoods resulting
from the acquisition of land or obstructed to resources i.e. land, water or forest due
to the construction and operation of the dam. Not all these people need to relocate to
another area.
The number of people that left their residence was 634 individuals from 85 households
of which 34 decided to resettle in an area specifically developed for resettlement in
Naminya village, while 51 households decided to relocate on their own with cash
compensation given to them.
The full resettlement package given to the re-settlers was:
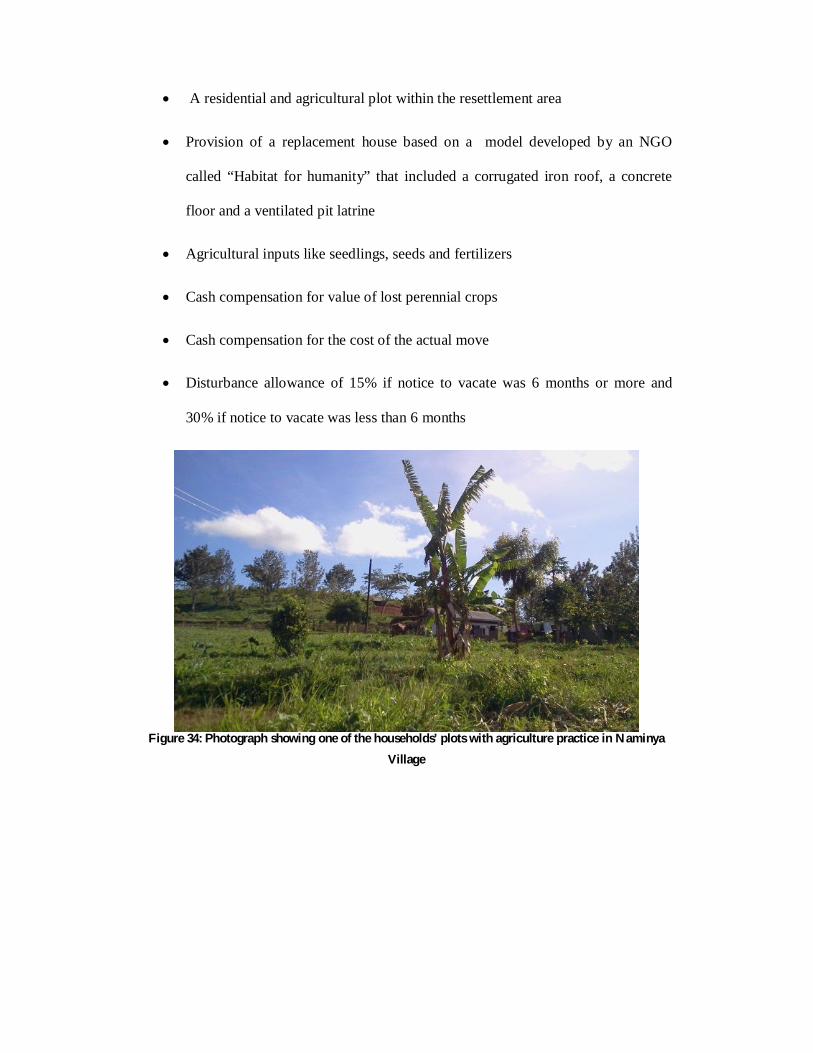
A residential and agricultural plot within the resettlement area
Provision of a replacement house based on a model developed by an NGO
called “Habitat for humanity” that included a corrugated iron roof, a concrete
floor and a ventilated pit latrine
Agricultural inputs like seedlings, seeds and fertilizers
Cash compensation for value of lost perennial crops
Cash compensation for the cost of the actual move
Disturbance allowance of 15% if notice to vacate was 6 months or more and
30% if notice to vacate was less than 6 months
Figure 34: Photograph showing one of the households’ plots with agriculture practice in Naminya
Village
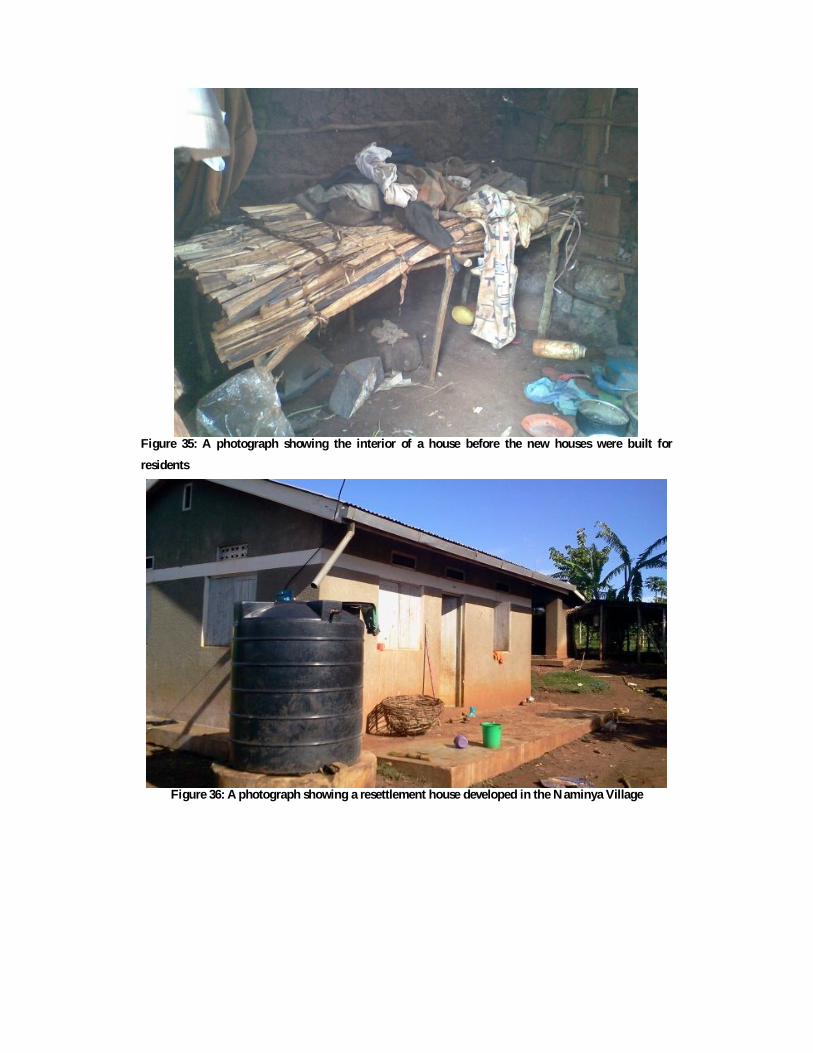
Figure 35: A photograph showing the interior of a house before the new houses were built for
residents
Figure 36: A photograph showing a resettlement house developed in the Naminya Village
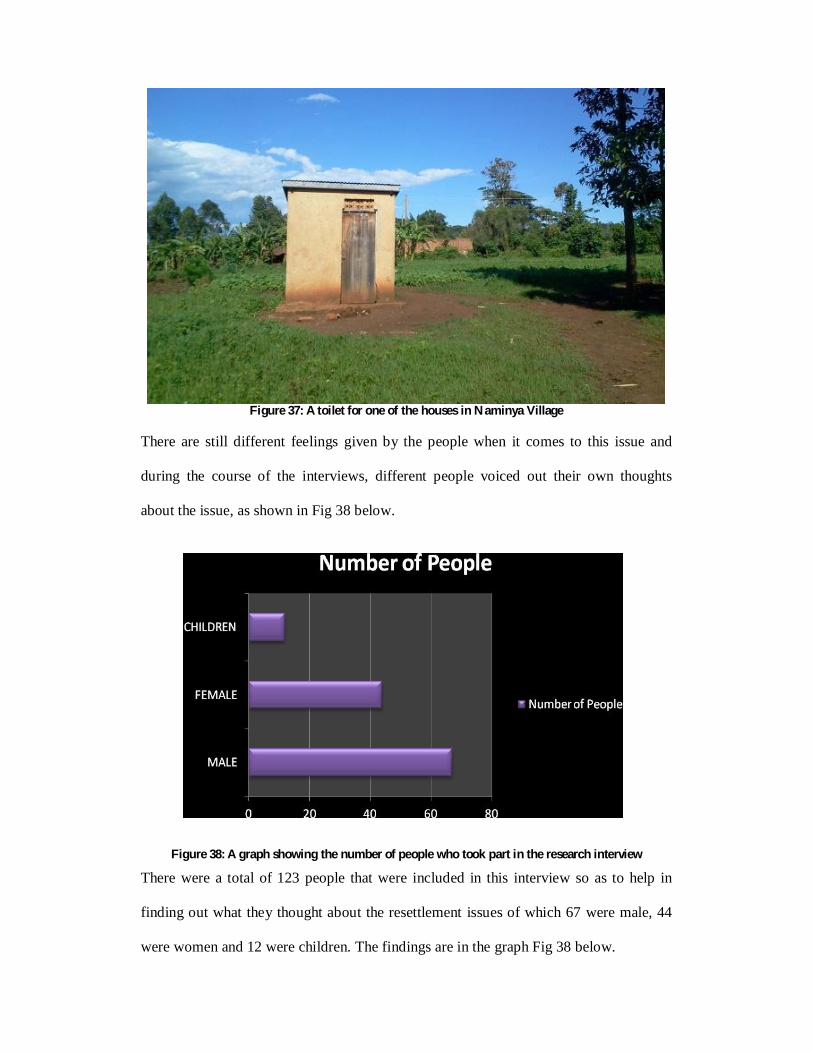
Figure 37: A toilet for one of the houses in Naminya Village
There are still different feelings given by the people when it comes to this issue and
during the course of the interviews, different people voiced out their own thoughts
about the issue, as shown in Fig 38 below.
Figure 38: A graph showing the number of people who took part in the research interview
There were a total of 123 people that were included in this interview so as to help in
finding out what they thought about the resettlement issues of which 67 were male, 44
were women and 12 were children. The findings are in the graph Fig 38 below.
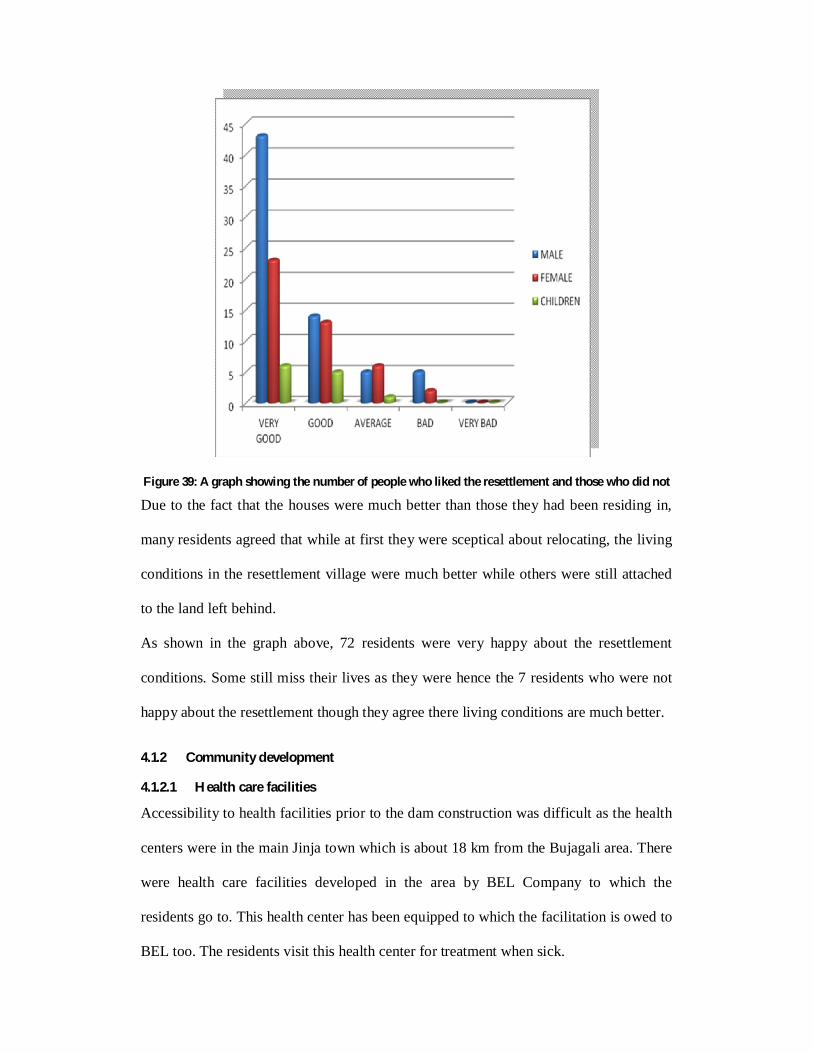
Figure 39: A graph showing the number of people who liked the resettlement and those who did not
Due to the fact that the houses were much better than those they had been residing in,
many residents agreed that while at first they were sceptical about relocating, the living
conditions in the resettlement village were much better while others were still attached
to the land left behind.
As shown in the graph above, 72 residents were very happy about the resettlement
conditions. Some still miss their lives as they were hence the 7 residents who were not
happy about the resettlement though they agree there living conditions are much better.
4.1.2 Community development
4.1.2.1 Health care facilities
Accessibility to health facilities prior to the dam construction was difficult as the health
centers were in the main Jinja town which is about 18 km from the Bujagali area. There
were health care facilities developed in the area by BEL Company to which the
residents go to. This health center has been equipped to which the facilitation is owed to
BEL too. The residents visit this health center for treatment when sick.
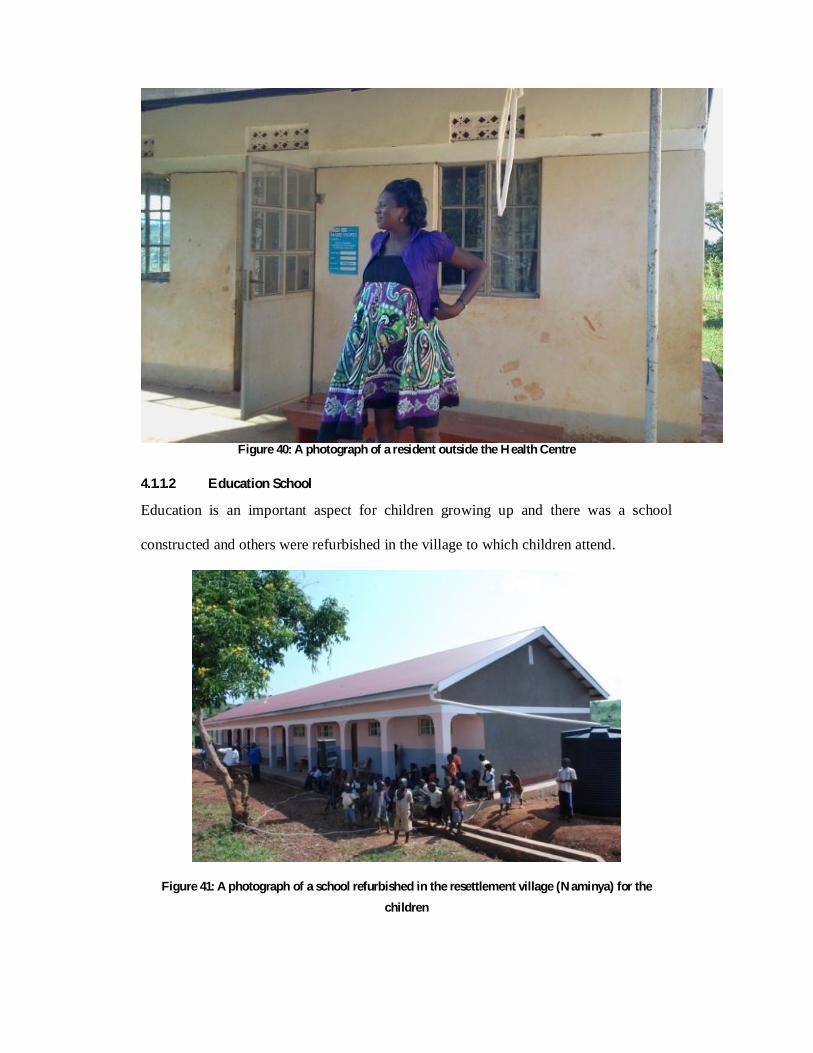
Figure 40: A photograph of a resident outside the Health Centre
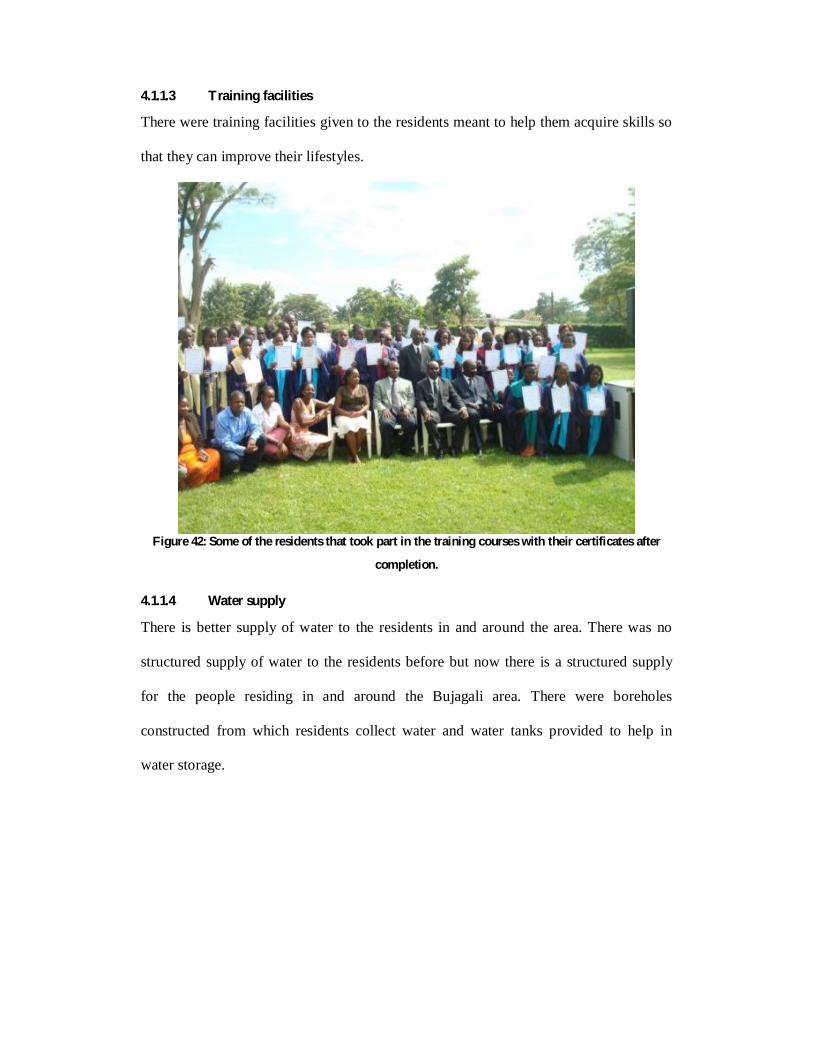
4.1.1.2 Education School
Education is an important aspect for children growing up and there was a school
constructed and others were refurbished in the village to which children attend.
Figure 41: A photograph of a school refurbished in the resettlement village (Naminya) for the
children
4.1.1.3 Training facilities
There were training facilities given to the residents meant to help them acquire skills so
that they can improve their lifestyles.
Figure 42: Some of the residents that took part in the training courses with their certificates after
completion.
4.1.1.4 Water supply
There is better supply of water to the residents in and around the area. There was no
structured supply of water to the residents before but now there is a structured supply
for the people residing in and around the Bujagali area. There were boreholes
constructed from which residents collect water and water tanks provided to help in
water storage.
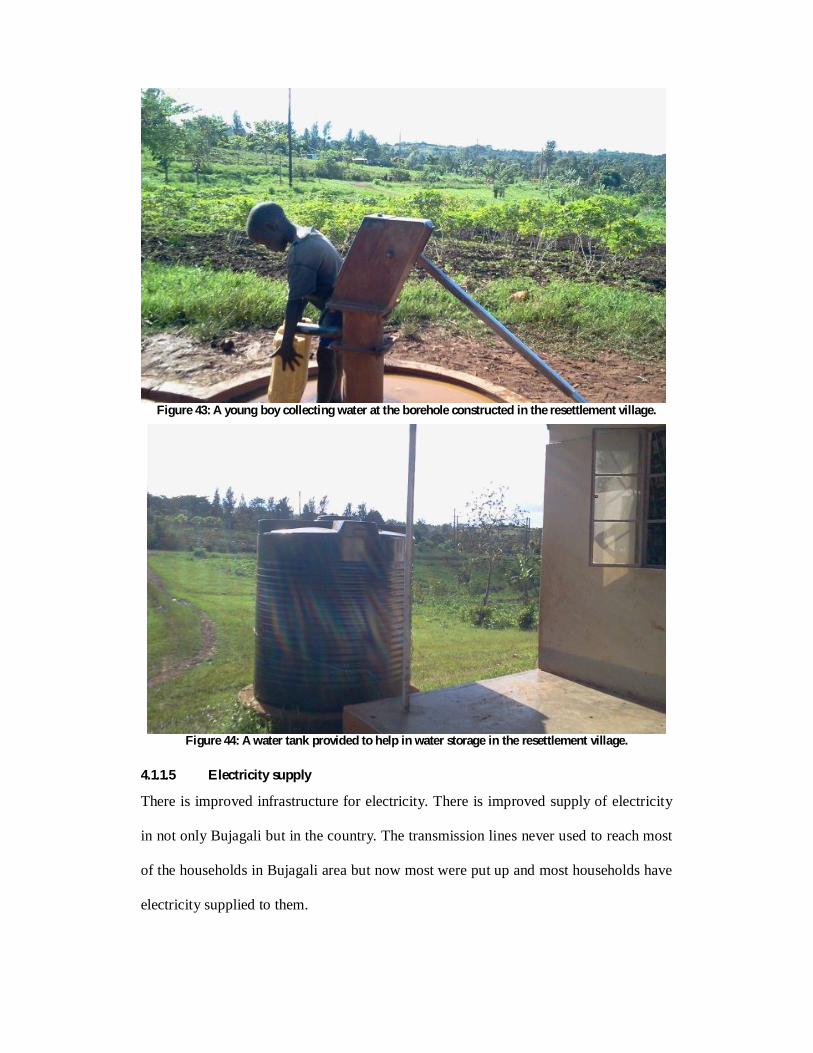
Figure 43: A young boy collecting water at the borehole constructed in the resettlement village.
Figure 44: A water tank provided to help in water storage in the resettlement village.
4.1.1.5 Electricity supply
There is improved infrastructure for electricity. There is improved supply of electricity
in not only Bujagali but in the country. The transmission lines never used to reach most
of the households in Bujagali area but now most were put up and most households have
electricity supplied to them.
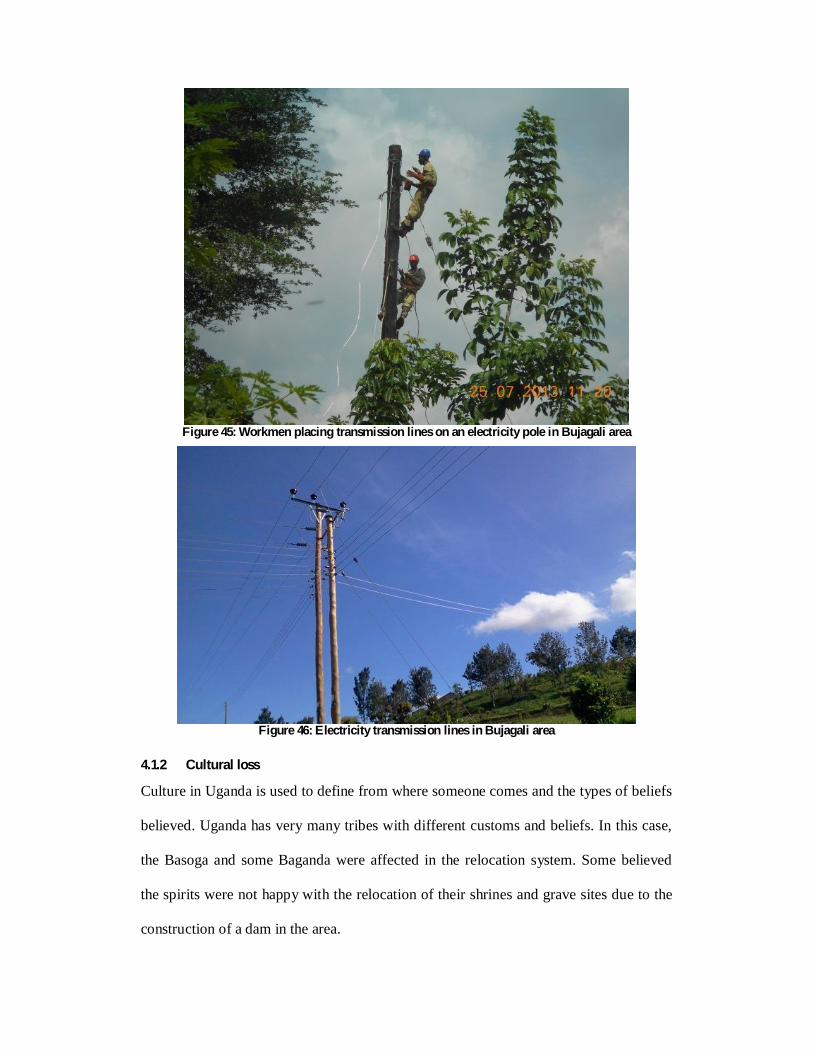
Figure 45: Workmen placing transmission lines on an electricity pole in Bujagali area
Figure 46: Electricity transmission lines in Bujagali area
4.1.2 Cultural loss
Culture in Uganda is used to define from where someone comes and the types of beliefs
believed. Uganda has very many tribes with different customs and beliefs. In this case,
the Basoga and some Baganda were affected in the relocation system. Some believed
the spirits were not happy with the relocation of their shrines and grave sites due to the
construction of a dam in the area.
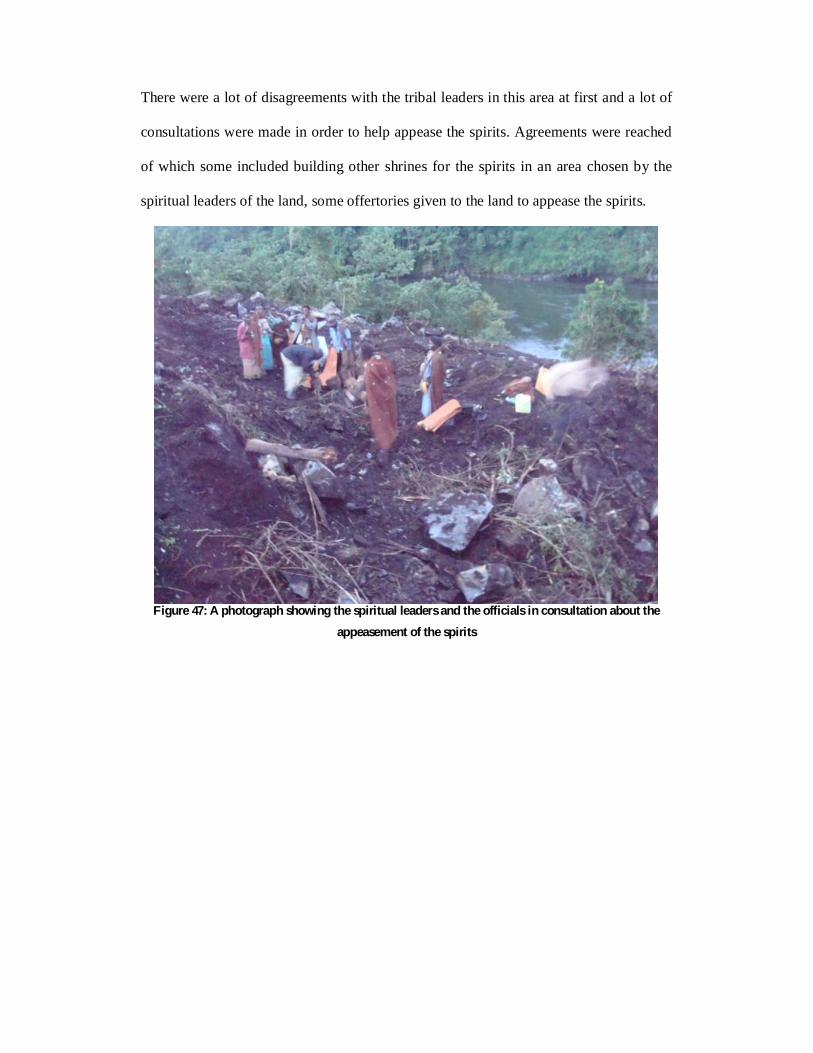
There were a lot of disagreements with the tribal leaders in this area at first and a lot of
consultations were made in order to help appease the spirits. Agreements were reached
of which some included building other shrines for the spirits in an area chosen by the
spiritual leaders of the land, some offertories given to the land to appease the spirits.
Figure 47: A photograph showing the spiritual leaders and the officials in consultation about the
appeasement of the spirits
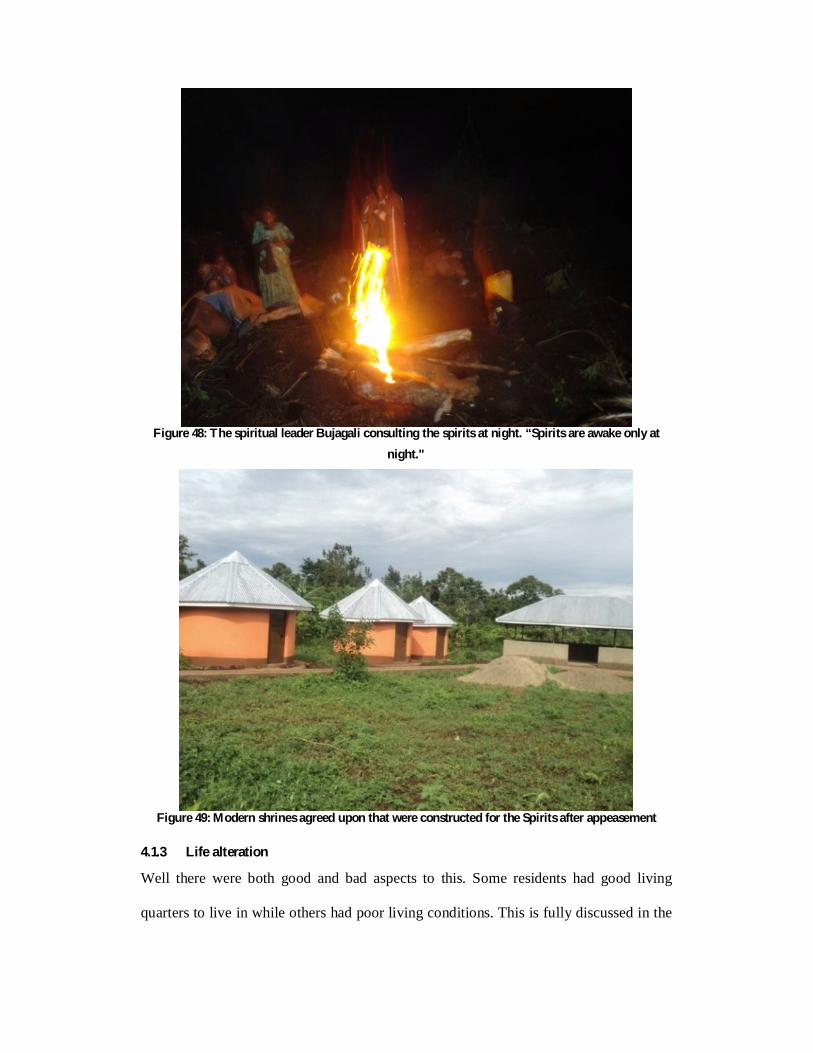
Figure 48: The spiritual leader Bujagali consulting the spirits at night. “Spirits are awake only at
night."
Figure 49: Modern shrines agreed upon that were constructed for the Spirits after appeasement
4.1.3 Life alteration
Well there were both good and bad aspects to this. Some residents had good living
quarters to live in while others had poor living conditions. This is fully discussed in the
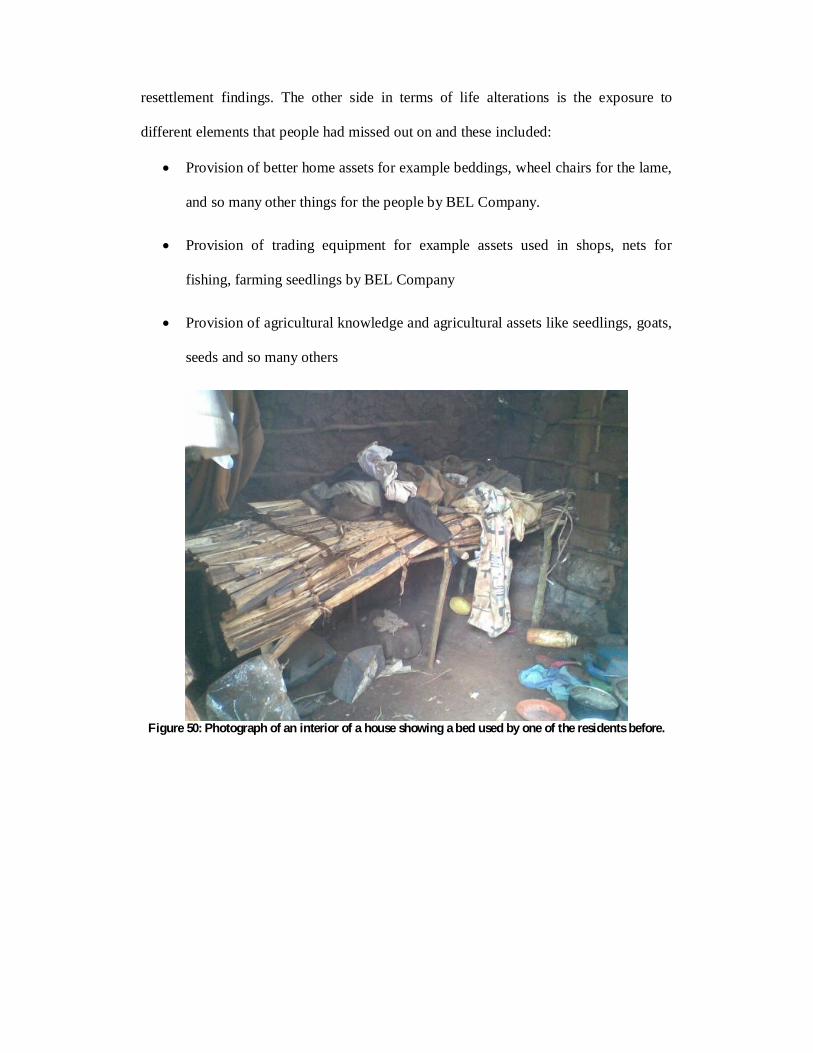
resettlement findings. The other side in terms of life alterations is the exposure to
different elements that people had missed out on and these included:
Provision of better home assets for example beddings, wheel chairs for the lame,
and so many other things for the people by BEL Company.
Provision of trading equipment for example assets used in shops, nets for
fishing, farming seedlings by BEL Company
Provision of agricultural knowledge and agricultural assets like seedlings, goats,
seeds and so many others
Figure 50: Photograph of an interior of a house showing a bed used by one of the residents before.
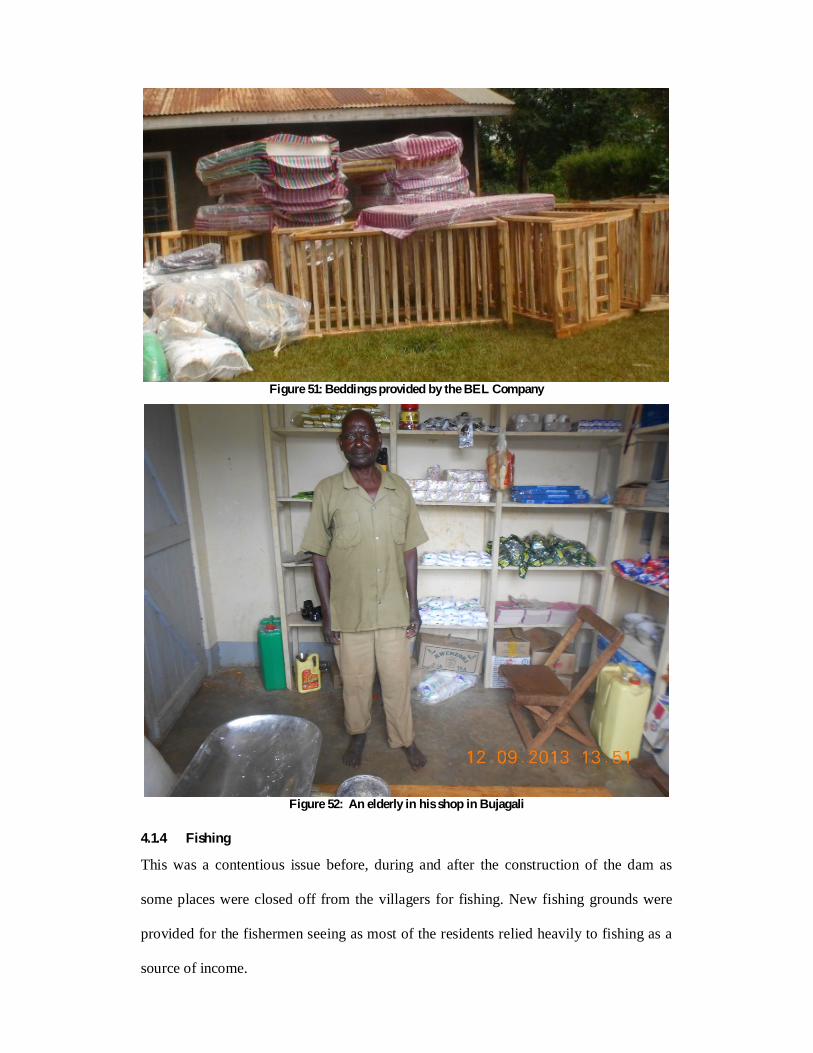
Figure 51: Beddings provided by the BEL Company
Figure 52: An elderly in his shop in Bujagali
4.1.4 Fishing
This was a contentious issue before, during and after the construction of the dam as
some places were closed off from the villagers for fishing. New fishing grounds were
provided for the fishermen seeing as most of the residents relied heavily to fishing as a
source of income.
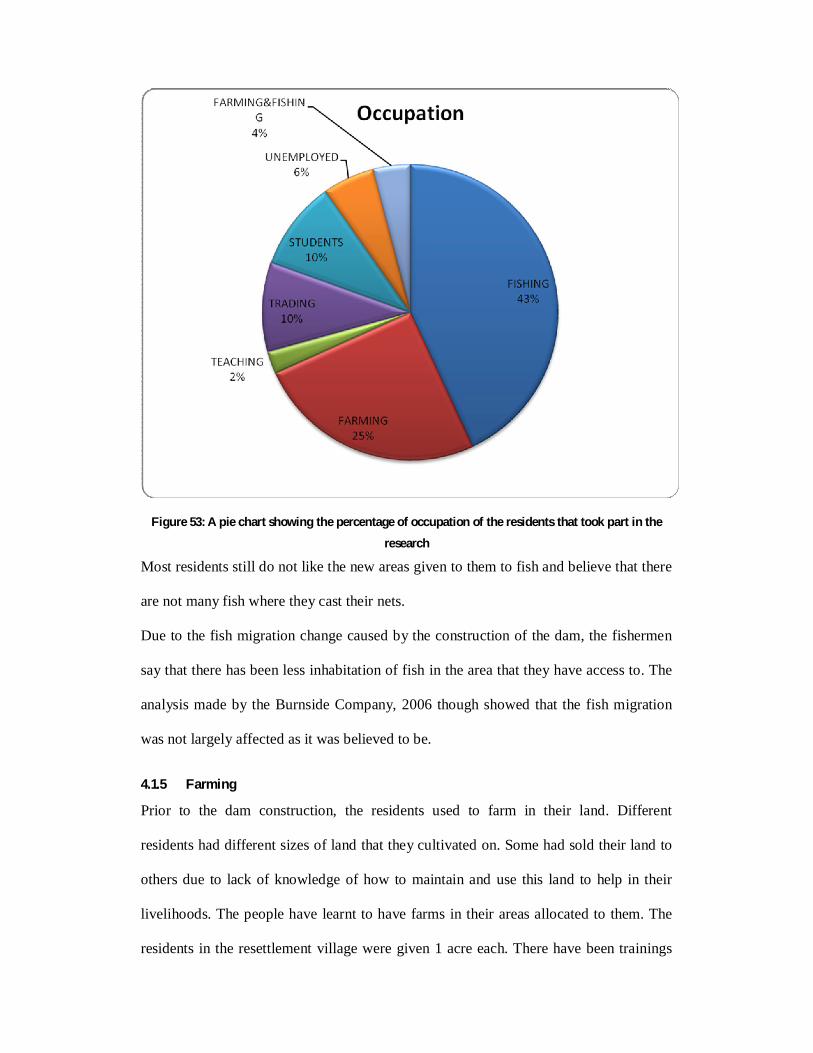
Figure 53: A pie chart showing the percentage of occupation of the residents that took part in the
research
Most residents still do not like the new areas given to them to fish and believe that there
are not many fish where they cast their nets.
Due to the fish migration change caused by the construction of the dam, the fishermen
say that there has been less inhabitation of fish in the area that they have access to. The
analysis made by the Burnside Company, 2006 though showed that the fish migration
was not largely affected as it was believed to be.
4.1.5 Farming
Prior to the dam construction, the residents used to farm in their land. Different
residents had different sizes of land that they cultivated on. Some had sold their land to
others due to lack of knowledge of how to maintain and use this land to help in their
livelihoods. The people have learnt to have farms in their areas allocated to them. The
residents in the resettlement village were given 1 acre each. There have been trainings
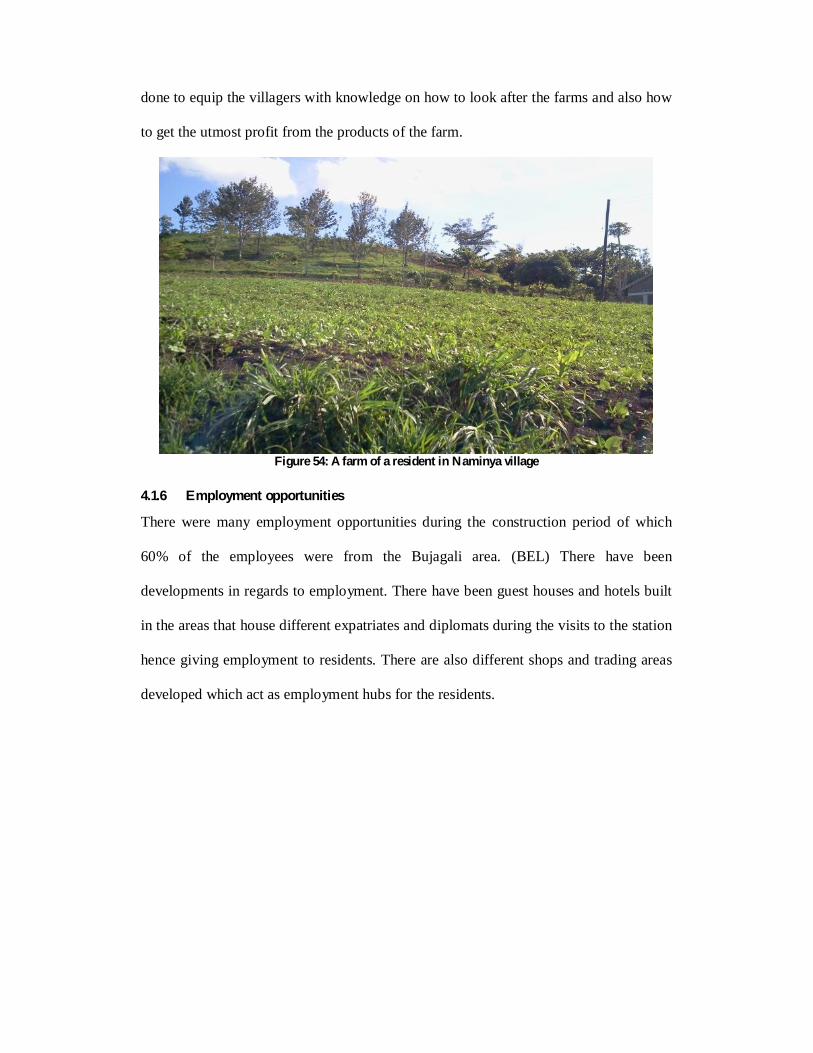
done to equip the villagers with knowledge on how to look after the farms and also how
to get the utmost profit from the products of the farm.
Figure 54: A farm of a resident in Naminya village
4.1.6 Employment opportunities
There were many employment opportunities during the construction period of which
60% of the employees were from the Bujagali area. (BEL) There have been
developments in regards to employment. There have been guest houses and hotels built
in the areas that house different expatriates and diplomats during the visits to the station
hence giving employment to residents. There are also different shops and trading areas
developed which act as employment hubs for the residents.
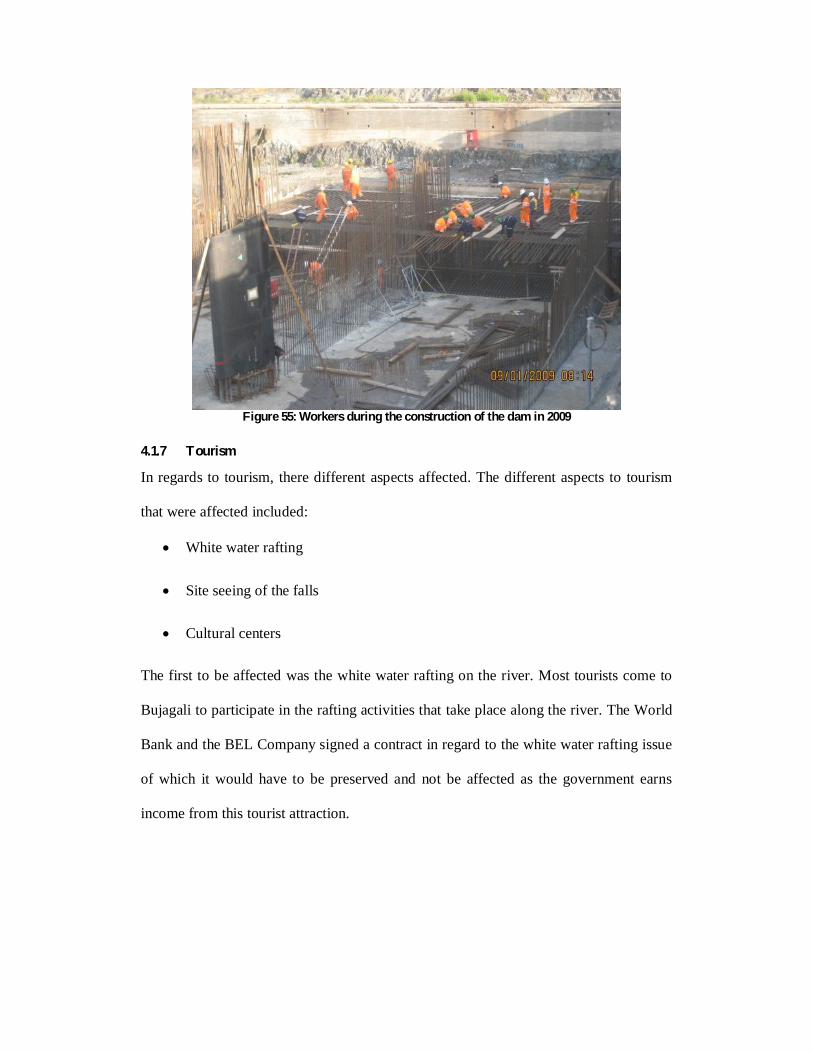
Figure 55: Workers during the construction of the dam in 2009
4.1.7 Tourism
In regards to tourism, there different aspects affected. The different aspects to tourism
that were affected included:
White water rafting
Site seeing of the falls
Cultural centers
The first to be affected was the white water rafting on the river. Most tourists come to
Bujagali to participate in the rafting activities that take place along the river. The World
Bank and the BEL Company signed a contract in regard to the white water rafting issue
of which it would have to be preserved and not be affected as the government earns
income from this tourist attraction.
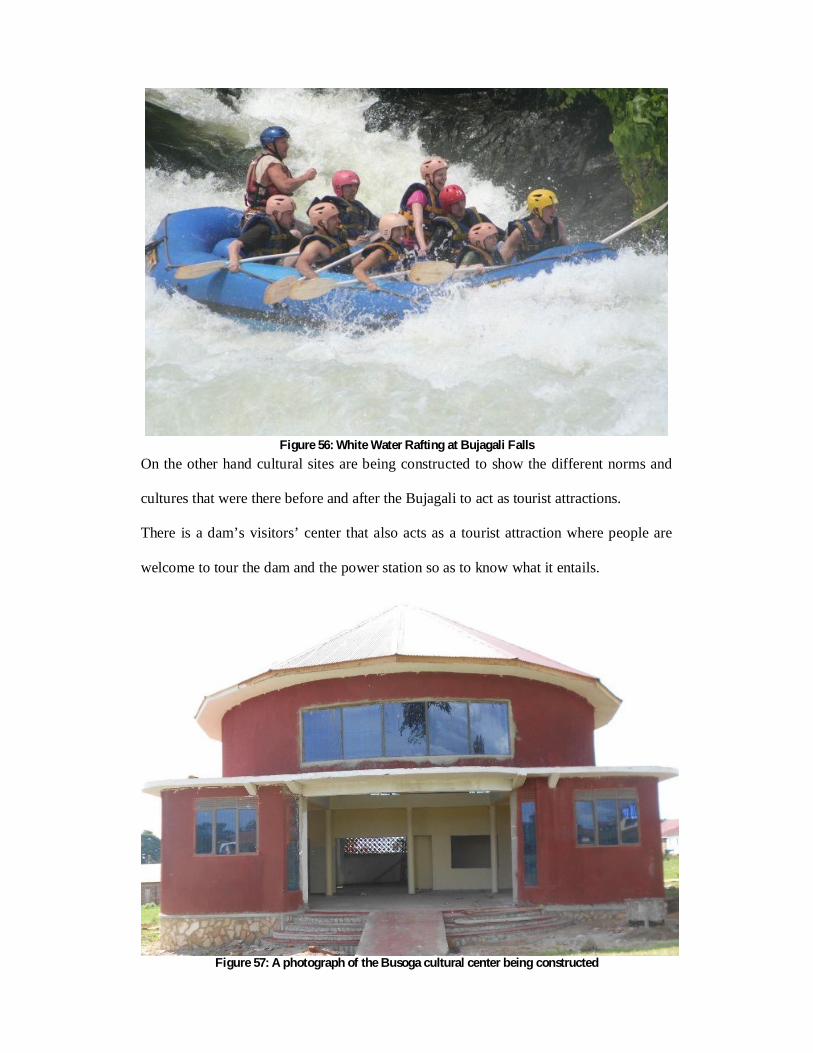
Figure 56: White Water Rafting at Bujagali Falls
On the other hand cultural sites are being constructed to show the different norms and
cultures that were there before and after the Bujagali to act as tourist attractions.
There is a dam’s visitors’ center that also acts as a tourist attraction where people are
welcome to tour the dam and the power station so as to know what it entails.
Figure 57: A photograph of the Busoga cultural center being constructed
4.2 Environmental impacts of Bujagali Dam
4.2.1 Noise pollution
Well during the construction of the dam, there was noise pollution in the surrounding as
there were blasts and construction work that entailed high levels of noise. The noise
levels then were between Laeq of 70 dB and 75dB (BEL). This according to the
standards is good as the highest limit allowed is 75dB.
After construction, the noise levels of the power plant are 55dB (BEL) during the day
and 45Db (BEL) in the night. This is during operational hours. This facility does not
contribute significant noise to any sensitive receptors.
4.2.2 Water quality and levels
The water level has been fluctuating by approximately 2-3 metres (BEL) and this in turn
affects the head at the dam. Before it was estimated that the water depth would increase
to approximately 6m in the east channel of the river due to the diversion of the river at
the west channel at Dumbbell Island hence increasing the velocities on the east side.
After monitoring of the water levels, it was found that the water levels fluctuate by 2 to
3 metres (BEL) and this affects the head which affects the capacity of power that is
obtained at the power station. The lower water levels are usually experienced in the
afternoon and the higher levels are experienced in the morning and night time.
During the construction process so many activities that affected the river that led to its
pollution and also affected to its quality. The water quality of the river was affected due
to different activities at the dam and some environmental reasons namely:
Suspended material falling in the river during the construction process of the
power station.
Erosion of coffer dam facings
Erosion of the river bed
Erosion of newly submerged river banks
Pollution due to sewerage system
Surface and seepage water
Process water especially from concrete batching, washing, and so many other
activities.
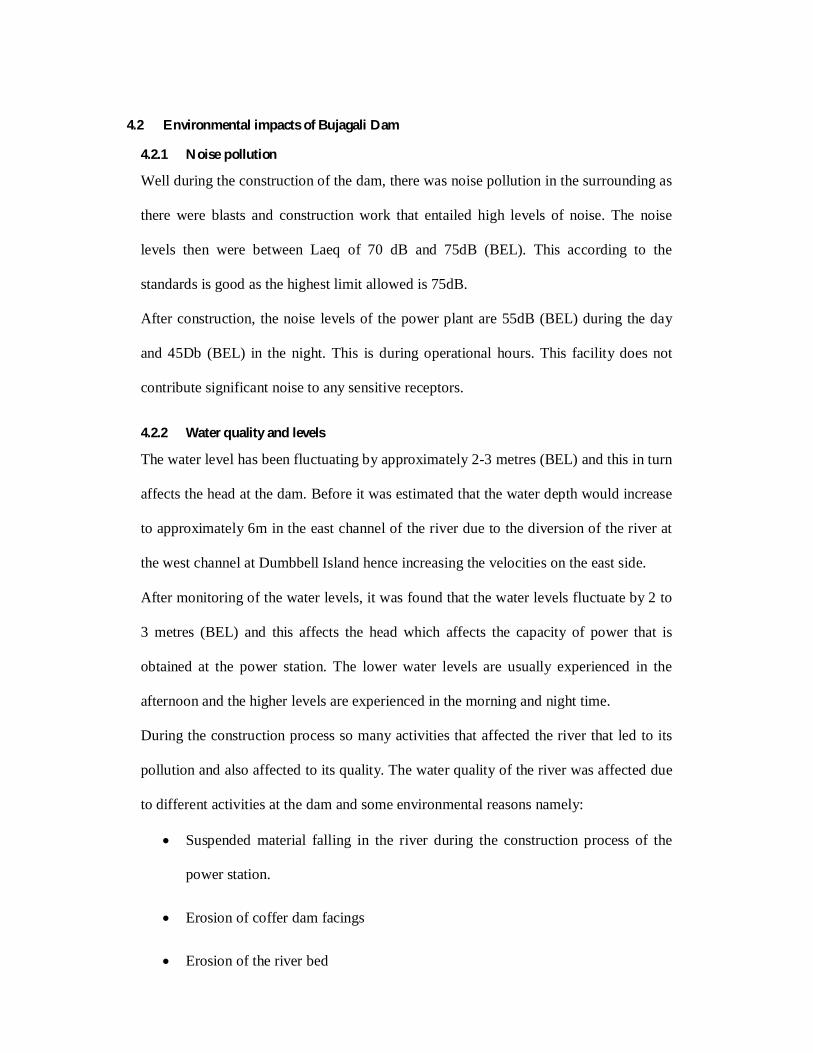
During the period, there were measures placed to reduce the different elements that can
affect the water quality and these included:
Treatment of the streams so as to achieve an effluent quality that met standards
so as to be released into the river
Chemicals such as oil, diesel, additives and so many others were securely stored
In terms of erosion, there was replanting on the river banks so as to cub soil
erosion.
Figure 58: Removal of water hyacinth by BEL employees at Bujagali
4.2.3 Fish species migration
River Nile has many fish species namely: Nile perch, tilapia, cat fish, tiger fish, and so
many others. Due to the construction of the dam on the river, there was alternation of
the fish migration.
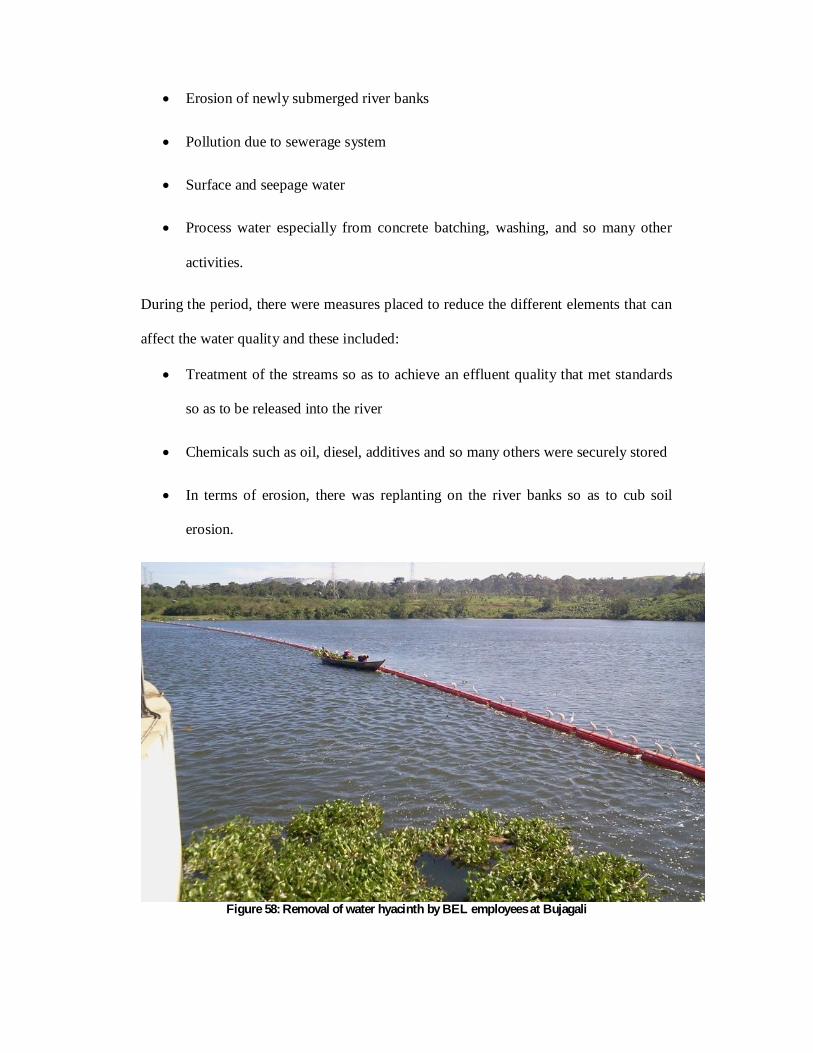
4.2.4 Health and safety
Health and safety is an important aspect in every environment. There were strict
regulations placed so as to ensure there is good health and safety, especially during the
construction period. Safety equipment was supplied to the workers of whom 75% were
locals.
Figure 59: Researcher at the Bujagali Power Station wearing Safety equipment supplied by BEL
There is susceptibility to different diseases especially malaria, bilharzias due to stagnant
water during and after construction not forgetting diseases like pneumonia that are
caused by cold areas and with no proper resources to waive off the cold, the residents
are susceptible to the weather related diseases. There are health centers that have been
placed in the area and sensitization of the diseases, prevention and treatment required in
the area.
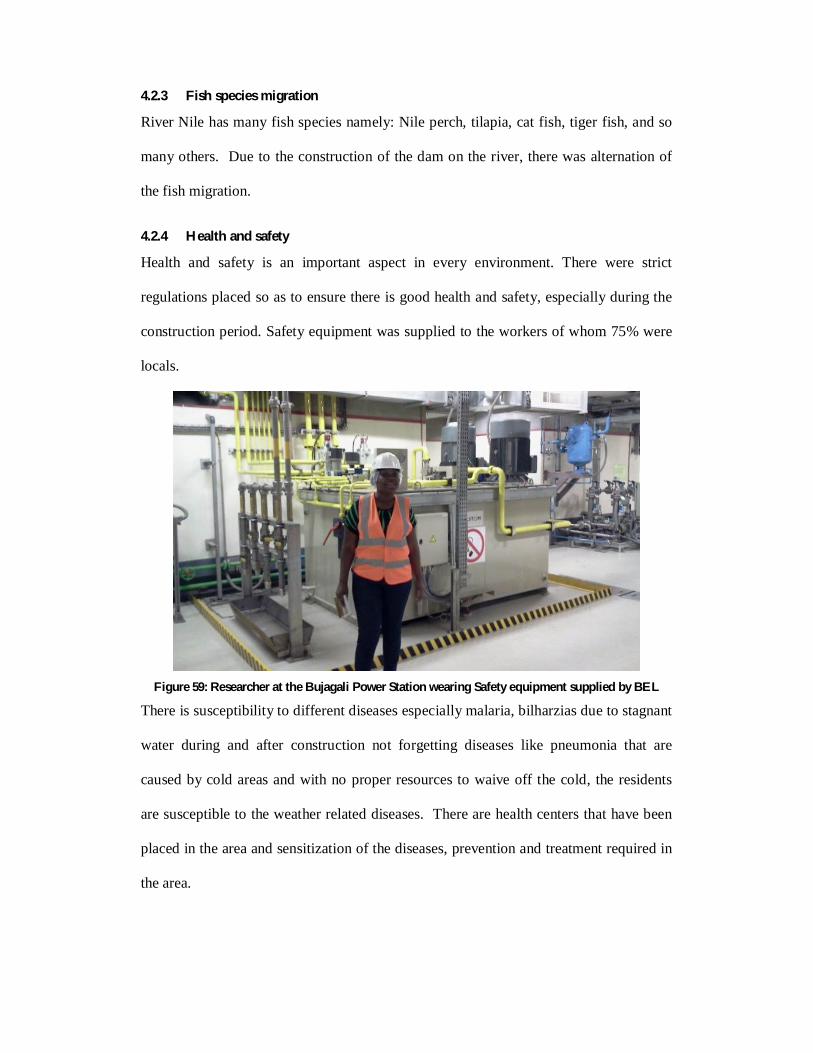
4.2.5 Air quality
During the construction period, the air quality was not good due to the dust collected
though there were measures placed to reduce its effects on the environment through the
use of wetting agents, use of grassing stockpiles to prevent the wind raised dust and so
many other measures. The vehicles used also were maintained regularly so as to reduce
exhaust emissions.
Due to the fact that Bujagali Power is a hydroelectricity dam, there is really a high
reduction of green house gases emissions effects. Hence there is no significant effect on
the air quality in the area.
Figure 60: Fog at Bujagali in the early morning hours
4.2.6 Thermal plants closure
Thermal plants use heavy fuel oils, coal and many others that are hazardous to the
environment. The use of these fuels lead to pollution which in turn affects the ozone
layer negatively. This is due to the oxides formed for example sulphur oxides, carbon
oxides, which are green house gases. With the closure of the thermal plants, there was
the reduction in pollution in the environment.
4.3 Economic effects of Bujagali dam
4.3.1 Addition of power to the national power grid
The amount of hydro electricity that used to be provided by the Kiira Dam and the
Owen Falls Dam was not adequate for the country. The capacity of the two dams
combined was approximately 380 MW (MEMD). With the addition of the Bujagali
Power Dam, the power supply increased by 250 MW (BEL). There were more
transmission lines of 220 kV wired from Bujagali to Kawanda hence increasing the
supply of power to the National power grid.
4.3.2 Lower Electricity costs
The cost of electricity was reduced. Due to the fact that thermal plants were built so as
to help increase on the power supply in the country, it was more expensive as it costs 25
U.S Cents per unit of electricity for thermal plants to run. With the introduction of
Bujagali Power Dam, the cost reduced to 11 U.S Cents. For hydro power plants, it
should be 6 U.S Cents but due to the loans accumulated that are to be repaid due to the
construction of the dam, it is slightly higher. Therefore the government subsidized the
tariffs of electricity.
4.3.3 Removal of thermal plants
There was the decommissioning of all thermal power plants after the construction of
Bujagali Power dam except two that are on standby. The two thermal power plants on
standby are:
Namanve having 50 MW capacity
Tororo having 50 MW capacity
Thermal power plants use heavy fuel oil; hence the removal of the plants helped in the
reduction of the running costs and maintenance costs of the thermal plants. Not
forgetting the effect on the ozone layer.
4.3.4 Reduction of Load Shedding
There was a reduction in load shedding. Most companies would have higher running
costs due to the recurring load shedding practices before the dam was constructed. Most
companies had to rely on generators that required fuel to run hence incurring costs. The
companies that used to have great difficulty were majorly manufacturing and processing
companies. There used to be spoilage of different raw materials or products due to load
shedding. With the addition of the power from Bujagali power dam, there was no more
load shedding. The only load shedding that happens is due to maintenance required and
not due to shortage of electricity supply and this is scheduled and timed, so companies
are prepared to handle the load shedding accordingly.
5 CONCLUSION AND RECOMMENDATIONS
5.1 Conclusions
The main reason as to why the Bujagali dam was constructed was for the supply of
hydro electricity which could be added to the national grid. This was a good thing but
there were different aspects that affected the people, the environment and economy of
the area that have been discussed in this report.
Prior to the construction of the dam, the residents of Bujagali relied heavily on fishing
and farming for their livelihoods. The residents living in the area had limitations though
in terms of inaccessibility to health facilities, power supply, good education facilities,
and clean water. This was majorly due to the fact that it was approximately 18 km away
from the town center. The lack of power supply was due to lack of transmission lines in
the area for the residents. They also relied on the traditional spirits, hence the spiritual
leader “Bujagali” who was always consulted by the residents for guidance.
After the construction of Bujagali Power station, there were changes in the livelihoods
of the residents in surrounding the area. There was loss of land leading to the
resettlement of the residents. This was a contentious issue as most residents did not
want to leave the land of their heritage. There was also the issue of cultural loss as most
people are linked to their culture. Culture had to be respected as it was believed that the
spirits of the land would not be happy with the construction of the dam. The spirits had
to be appeased through the spiritual leaders.
On the positive side a lot of establishments were constructed including health facilities,
new homes for the residents in the resettlement villages, there was refurbishment of
schools, there was supply of power due to provision of transmission lines, there was a
clean supply of water due to the water boreholes constructed, there was also better
storage of water due to the water tanks provided for the residents. Employment
opportunities were created during the construction of the dam, and after. Some residents
took part in the construction process and others are employed now as the plant runs.
Some guest houses and shops have been built so as to house some visitors and also
where people can buy necessities hence creating employment for the residents too.
The residents have received training skills and now have different ways of improving
their lives and some have changed their livelihoods through the use of the knowledge
obtained from the skills obtained. This has shown in their farming methods, fishing
methods, their entrepreneurship methods and so many other aspects.
In terms of the environment effects, there were several area looked at. In this case there
were noise levels, during construction and after the dam was constructed of which they
were found to be within the noise level limits required for the area. The air quality was
not affected due to the fact that hydro power dams do not produce a lot of green house
gases that could affect the ozone layer. Air quality was mostly not good during the
construction period due to air emissions from the motor vehicles and blasts.
One of the contentious issues was the water level and quality. The water levels fluctuate
within 2 metres higher or lower than the level. The water head of the dam is
approximately 25 metres and since it is downstream, the fluctuation usually does not
affect the power capacity of the dam.
Health and safety was found to be good as most people were sensitized about the
requirements for having clean water and the power station too. Water from the power
station is treated before it enters the river again and animal cultivation is limited along
the banks of the river so as to prevent the different diseases for example bilharzias.
Economically, there have been more positives than negatives in terms of effects for not
only the residents of Bujagali but the government of Uganda and all the residents of
Uganda. The positive impacts were: increment of power to the national power grid,
there was reduction of load shedding; the closure of the thermal plants reduced the costs
of power as it was very expensive to run the thermal plants. Hydro power plants do not
have very expensive maintenance costs, so the power tariffs were reduced making it
affordable for different residents to pay for the electricity bills.
The negative economic effect was the financial debt that has to be paid back to the
different banks that helped us with their capital to construct the dam.
In conclusion, there were both positive and negative social, environmental and
economic effects of the Bujagali Power Station as stated in this report.
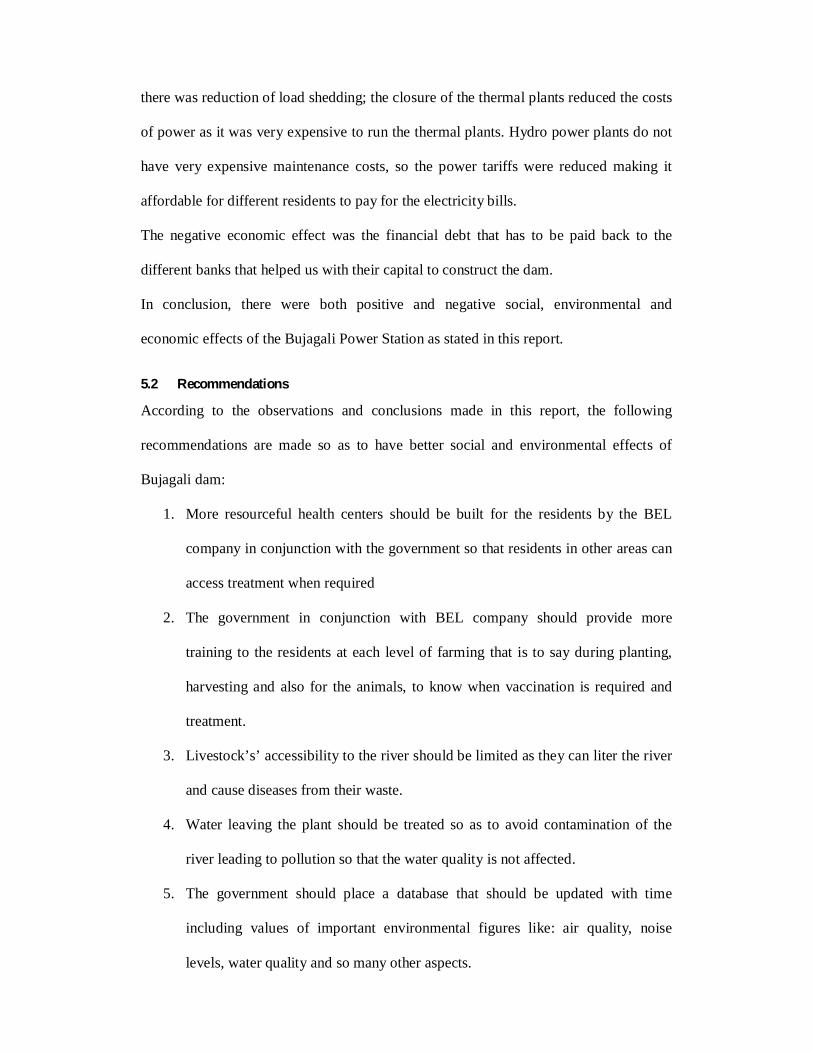
5.2 Recommendations
According to the observations and conclusions made in this report, the following
recommendations are made so as to have better social and environmental effects of
Bujagali dam:
1. More resourceful health centers should be built for the residents by the BEL
company in conjunction with the government so that residents in other areas can
access treatment when required
2. The government in conjunction with BEL company should provide more
training to the residents at each level of farming that is to say during planting,
harvesting and also for the animals, to know when vaccination is required and
treatment.
3. Livestock’s’ accessibility to the river should be limited as they can liter the river
and cause diseases from their waste.
4. Water leaving the plant should be treated so as to avoid contamination of the
river leading to pollution so that the water quality is not affected.
5. The government should place a database that should be updated with time
including values of important environmental figures like: air quality, noise
levels, water quality and so many other aspects.

6. The cultural centers’ construction should be finished so that there is more
income collected from them as tourist centers.
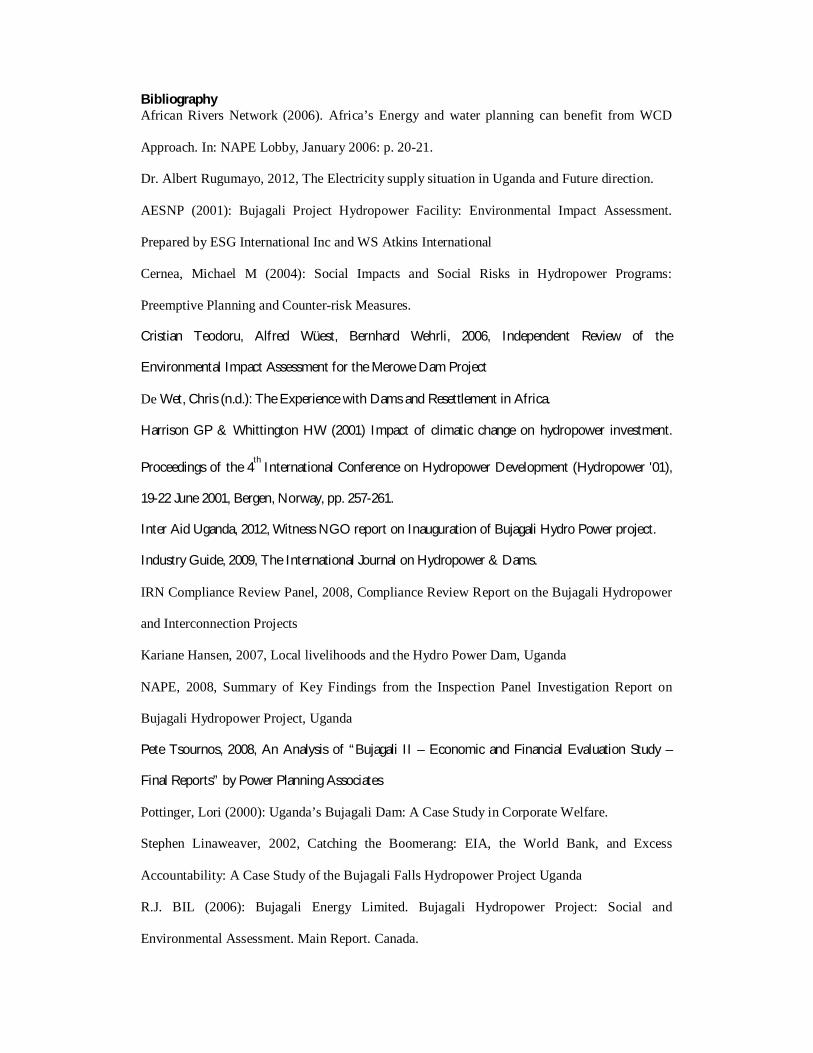
Bibliography African Rivers Network (2006). Africa’s Energy and water planning can benefit from WCD
Approach. In: NAPE Lobby, January 2006: p. 20-21.
Dr. Albert Rugumayo, 2012, The Electricity supply situation in Uganda and Future direction.
AESNP (2001): Bujagali Project Hydropower Facility: Environmental Impact Assessment.
Prepared by ESG International Inc and WS Atkins International
Cernea, Michael M (2004): Social Impacts and Social Risks in Hydropower Programs:
Preemptive Planning and Counter-risk Measures.
Cristian Teodoru, Alfred Wüest, Bernhard Wehrli, 2006, Independent Review of the
Environmental Impact Assessment for the Merowe Dam Project
De Wet, Chris (n.d.): The Experience with Dams and Resettlement in Africa.
Harrison GP & Whittington HW (2001) Impact of climatic change on hydropower investment.
Proceedings of the 4th
International Conference on Hydropower Development (Hydropower '01),
19-22 June 2001, Bergen, Norway, pp. 257-261.
Inter Aid Uganda, 2012, Witness NGO report on Inauguration of Bujagali Hydro Power project.
Industry Guide, 2009, The International Journal on Hydropower & Dams.
IRN Compliance Review Panel, 2008, Compliance Review Report on the Bujagali Hydropower
and Interconnection Projects
Kariane Hansen, 2007, Local livelihoods and the Hydro Power Dam, Uganda
NAPE, 2008, Summary of Key Findings from the Inspection Panel Investigation Report on
Bujagali Hydropower Project, Uganda
Pete Tsournos, 2008, An Analysis of “Bujagali II – Economic and Financial Evaluation Study –
Final Reports” by Power Planning Associates
Pottinger, Lori (2000): Uganda’s Bujagali Dam: A Case Study in Corporate Welfare.
Stephen Linaweaver, 2002, Catching the Boomerang: EIA, the World Bank, and Excess
Accountability: A Case Study of the Bujagali Falls Hydropower Project Uganda
R.J. BIL (2006): Bujagali Energy Limited. Bujagali Hydropower Project: Social and
Environmental Assessment. Main Report. Canada.

Reference Websites http://books.google.co.ug/books?id=AIbLqsJrW-QC&pg=PA520&lpg=PA520&dq
http://www.ciel.org/Ifi/ifccaseuganda.html
http://www.dams.org/docs/kbase/contrib/soc199.pdf
http://en.wikipedia.org/wiki/Bujagali_Hydroelectric_Power_Station
http://www.eoearth.org/view/article/152538/
http://www.enzenglobal.com/pdf_downloads/environmental_impact.pdf
www.hydropower-dams.com
http://www.indexmundi.com/uganda/electricity_production.html
http://www.newvision.co.ug/news/636071-evolution-of-the-250mw-bujagali-dam.html
pdf.usaid.gov/pdf_docs/Pnady474.pdf
http://public.ises.org/PREA/2_Presentations/1_KeyNote/4_Rugamayo_EnergySupply.pdf
http://www.see.ed.ac.uk/~gph/publications/Hydro01.pdf
http://www.un.org/esa/sustdev/sdissues/energy/op/hydro_cernea_social%20impacts_backgroun
dpaper.pdf
http://www.unep.org/transport/pcfv/PDF/icct_2012/ICCT_EnergySituation_JamesBanaabe_ME
MD.pdf
http://www.upadrygully.com.au/res/FactSheets/Seqwater/What_%20is_a%20_dam.pdf
www.waterpowermagazine.com, March 2013
http://www.worldenergy.org/data/resources/resource/hydropower/
http://news.nationalgeographic.com/news/energy/2012/02/120221-hydroelectric-power-nile-
dam-in-uganda/
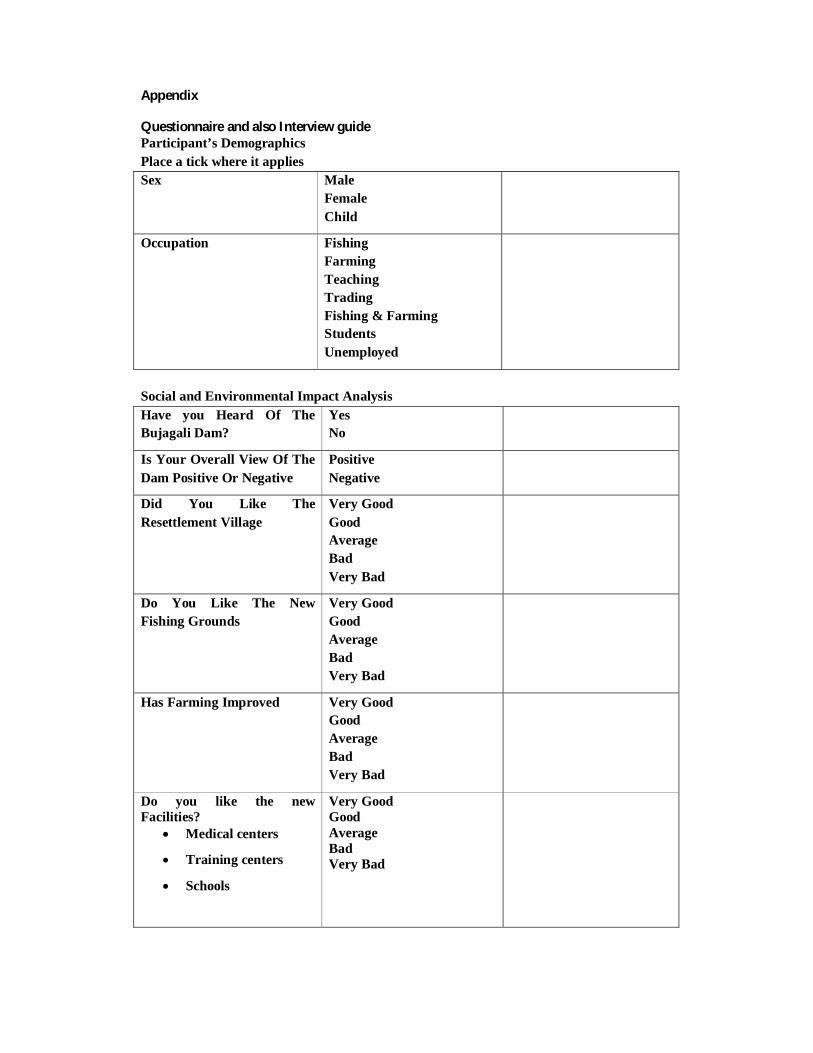
Appendix
Questionnaire and also Interview guide Participant’s Demographics Place a tick where it applies Sex Male
Female Child
Occupation Fishing Farming Teaching Trading Fishing & Farming Students Unemployed
Social and Environmental Impact Analysis Have you Heard Of The Bujagali Dam?
Yes No
Is Your Overall View Of The Dam Positive Or Negative
Positive Negative
Did You Like The Resettlement Village
Very Good Good Average Bad Very Bad
Do You Like The New Fishing Grounds
Very Good Good Average Bad Very Bad
Has Farming Improved Very Good Good Average Bad Very Bad
Do you like the new Facilities?
Medical centers
Training centers
Schools
Very Good Good Average Bad Very Bad

1