Embed Size (px)
Citation preview

Detailed Island Risk Assessment in Maldives
Social and Economic Assessment Report
(Final Draft V1)
Volume II: Methodology
DIRAM team
Disaster Risk Management Programme
UNDP Maldives
August 2009

DIRAM 2 – Socio-economic Assessment Report: Methodology
ii
Table of Contents
1 Introduction .................................................................................................................................... 3
2 Social Vulnerability Assessment ...................................................................................................... 3
2.1 Methodology ........................................................................................................................... 3
2.1.1 Overall Assessment Framework ...................................................................................... 3
2.1.2 The Conceptual Framework ............................................................................................ 4
2.1.3 Social Component Assessment Framework .................................................................... 5
2.2 Working Procedures................................................................................................................ 9
2.2.1 In-house data collection .................................................................................................. 9
2.2.2 Field Surveys ................................................................................................................. 10
2.3 Results interpretation and Presentation .............................................................................. 12
3 Economic Vulnerability ................................................................................................................. 14
3.1 Introduction .......................................................................................................................... 14
3.1.1 The Conceptual Framework .......................................................................................... 14
3.1.2 Economic Component Assessment Framework ........................................................... 15
3.2 Data Needs and Requirement ............................................................................................... 18
3.3 Working Procedures.............................................................................................................. 19
3.3.1 In-house data collection & literature review ................................................................ 19
3.3.2 Field Surveys ................................................................................................................. 21
3.4 Results interpretation and Presentation .............................................................................. 23
References ............................................................................................................................................ 24
APPENDIX 1 – Household Questionnaire Survey .................................................................................. 25
APPENDIX 2 – Island Information Form ................................................................................................ 26
APPENDIX 3 - Business Establishments Survey Form ........................................................................... 27

DIRAM 2 – Socio-economic Assessment Report: Methodology
3
1 Introduction This volume presents the methodologies used to assess the socio-economic vulnerability of the
selected islands. The two components (social and economic) are an extension of DHIRAM1 and
therefore follow the broad framework proposed in the initial study. The material presented in this
volume is intended as a methodological framework to guide future risk assessments in other
inhabited islands of Maldives. This volume is organized into two broad sections: Social and Economic
Vulnerability Assessments.
2 Social Vulnerability Assessment Disaster vulnerability is socially constructed; that is, it arises out of social and economic
circumstances of everyday living (Morrow, 1999). The basis of natural hazard and disaster
vulnerability are predominantly recognized as linked to existing patterns of community settlement
and development (Varley, 1994). The impact of natural events on specific settlements or
communities is not arbitrary, but determined by everyday patterns of social interaction, population
characteristics and social organization (Wisner et al., 2003). Hence, the impact on any given
household is a result of complex interactions between a number of conditions including, geography
and location, physical condition of structures, economic characteristics, social interactions and
physical characteristics of its inhabitants (Wisner et al., 2003; Smith, 2004).
The proposed methodology is designed to explore these specific aspects of social vulnerability. It is
specifically designed to suit the social set-up of Maldives and limitations in long-term data
requirements for risk assessment. It is also based on international best practices in both the
developed and developing countries with key emphasis on appropriate transfer of such practices
into the Maldivian setting.
2.1 Methodology
2.1.1 Overall Assessment Framework
The broad assessment framework follows the composite risk assessment framework adopted in the
first part of the risk assessment project (see figure 2.1). In this framework the social assessment is
considered as a separate component which, based on its own results, will feed into the composite
risk assessment covering all components of the study. Hence, there is no specific limitation on the
methodology or model to be used. However, the end results need to be expressed as a standardized
risk index across the various components, so that it could feed into the overall risk assessment. The
methodological framework presented here will take these specific factors into account in their
design.
DIRAM 2 – Socio-economic Assessment Report: Methodology
4
Figure 2.1 An extended framework for composite risk assessment (source: (UNDP, 2007).
Hazard event
Exposure
Physica l damage
Functiona l impact
Economic impact
Socia l impact
Composite risk
Physica lVulnerab ility
Functiona lVulnerab ility
EconomicVulnerab ility
Socia lVulnerab ility
Hazardzone
Vulnerab ilitymodel
Scenario Outputs
In tens ity, frequency,probability, hazard zone
Population, property,facilities, environment
Damage to property,
facilities, environment
Disruption o f communication,power supply, water supply,
public services...
L ive lihood, GDP...
Panic, breakdown of socia lorder, housing, popula tion
d isp lacement...
Risk profiles
2.1.2 The Conceptual Framework
Figure 2.2 The conceptual framework of social vulnerability assessment.
Social Vulnerability Assessment
Environmentalsetting
Shelter Sustenance orcritical facilities
Individual orhousehold
characteristics
CommunityCharacteristics
Completed assessments
NaturalHazards

DIRAM 2 – Socio-economic Assessment Report: Methodology
5
Social vulnerability assessment requires a number of key information, which is best conducted as
individual assessments within a broad framework. Four of the major assessments were already
completed before this study began. They are hazard assessment, environmental vulnerability
assessment, critical facilities or lifeline facilities vulnerability assessment and structural vulnerability
assessment of buildings. The two remaining assessments – community or society characteristics and
individual household characteristics – were conducted during this assessment.
The six key sets of data provide variables for the social vulnerability assessment. The hazard
assessment will provide major hazards faced on the island, their scenarios and likely impacts. The
environmental assessment will provide vulnerable areas on the island and in combination with
hazard assessment, it will provide hazard zones for the island. Physical vulnerability assessments will
provide the relative vulnerability of the lifeline infrastructures such as harbor, hospital, schools,
power, sewerage and drinking water supply. It will also provide detailed structural vulnerability of
buildings on the island, identifying specific households most vulnerable in physical terms. This
assessment will be designed to understand the societal characteristics including individuals,
households or families and community as a whole. This will include identifying the most vulnerable
groups, their spatial distribution, their risk perceptions, coping capacities and their attitudes towards
mitigation. In addition community characteristics not covered in other assessments such as food
security and economic security assessment will also be conducted.
2.1.3 Social Component Assessment Framework
The broad framework for assessment is outlined in figure 2.3. The reality of the social risk
assessment field is the lack of research into globally applicable and standardized models. It is difficult
to identify a single cohesive model that could fit the Maldivian context given the smallness of the
settlement concerned and the social capital characteristics. The framework presented here is
inspired by existing models but devised independently to suit the island conditions. It is also
specifically designed with simplicity in mind, since the whole idea of this entire project is to create a
set of methodologies which could be easily replicated by less technical staff on to other islands.
The framework is essentially divided into five main components: 1) identifying key population and
societal characteristics; 2) identifying and assessing potential vulnerable groups; 3) assessing
community capacity and coping mechanisms; 4) assessing social consequences of disasters and; 5)
evaluating risk management options.

DIRAM 2 – Socio-economic Assessment Report: Methodology
6
Figure 2.3: Social component assessment framework
Identify Key Population & SocietalCharacteristics
In-house dataanalysis
Field Surveys(household surveysPRAs)
Assessment ComponentMethod Output
- Key indicatorsof population characteristics- Spatial level of
assessment (householdor block)- Other Social capitalcharacteristics
Identify and Assess Potential Vulnerable Groups
Assess Community Capacity &Coping Mechanisms
Pre-identified vulnerable Groupsbased on literature
Field assessmentfor any new groups(interviews & islandoffice data)
- List of potentialVulnerable groups- List of households/blocks in each group
Sample basedStructured & semi structured fieldinterviews in
households
semi-structuredinterviews withcommunity groups
- Adjusted Final list of vulnerable groups- Factors enhancingvulnerability
- factors reducing vulnerability- Risk perception ofgroups & community- Coping capacity- Coping mechanisms
during disasters &everyday life.
Assess Social Consequencesof Disaster
Data on: - Access to basic services- Vulnerable groups- unsafe conditions- organization and networks- trust and solidarity- political and civic participation- perception of risks- wealth- coping strategies- administrative capacity- historical impacts ofdisasters- Hazard, environmental andphysical vulnerability
- Socio-demographicimpacts- Socio-political impacts- Factors enhancing
disaster effects- Factors reducing disaster effects
Identification of risk managementoptions
Expert judgement
Past experiences ofMaldives andother countries
Potential options for- Risk reduction and management- mitigation
- preparedness- response and recovery

DIRAM 2 – Socio-economic Assessment Report: Methodology
7
Each of these components is discussed in detail below.
Identifying Key Societal and Population Characteristics
This component of the assessment essentially involves understanding the social capital of each
island. A comprehensive list of data elements and their sources is presented later in the ‘Working
Procedures’ section.
The data can be collected from key statistical surveys including Census 2006 data, Vulnerability and
poverty assessment data for 2004 and Household Income and Expenditure Survey. These reports
and datasets are available from the Department of National Planning. Further collection of data
should be undertaken during field visits, specifically using household questionnaire surveys and
stakeholder consultations. Additional sources of information are the island office and NGOs.
Moreover household level economic assessment, such as economic linkages (see section on
Economic assessment), will be used to assess the economic conditions as relevant to the social
component.
Identify and Assess Potential Vulnerable Groups
Vulnerable groups could be pre-identified based on studies undertaken in other developing
countries and Maldives. Initial desk assessments can be targeted at studying these vulnerable
groups.
There are two key levels of assessment: household and community level. Most people experience
and respond to major natural hazards as households first. Trying to save the family members
becomes the first priority followed by community responsibility in helping out both during and after
a disaster.
The pre-identified vulnerability groups are:
1. Poor households
2. Female headed households
3. Households with disabled persons
4. Household with majority elderly and children
5. Households with single source of income and based on a vulnerable industry
6. Household in vulnerable areas of the island
7. Newly re-settled groups
8. Expatriates
Information on these groups can be filtered using the existing census data at household level and
Island Office data. Any gaps in data can be filled during community consultations. At present, the
data is expected to be of high resolution and high accuracy.
Initial work on pre-identification will be done in-house and final compilation of the groups will be
undertaken during the field visits. Trained enumerators will need to be used to conduct the survey in
a timely manner.
The main outputs of the component would be a comprehensive snap shot of the vulnerable groups
and households on the island.

DIRAM 2 – Socio-economic Assessment Report: Methodology
8
Assessing Community Capacity and Coping Mechanisms
This assessment will be undertaken using stakeholder consultations, household questionnaires and
semi-structured individual interviews. The key elements that would be determined are as follows:
1. Determine availability of food on the island and in vulnerable homes, stockpiling/storage of
emergency food supply and any issues related to accessibility.
2. Determine availability and access to basic services, lifeline infrastructure and emergency
services, and analyzing the mechanisms of service delivery.
3. Determine physical and economic resources on the island.
4. Making an in-depth analysis of elements of social cohesion, community social processes,
social networking, community groups and their interactions, political and civic participation,
trust and solidarity.
5. Determine community and household perception of disasters, mitigation and coping
mechanisms.
6. Determine the perception of community members about integrating outsiders in their
community which may affect or influence island’s social cohesion and stability. This should
be done in islands with resettlement programmes.
7. Determine existing community response and recovery mechanisms during a potential
disaster.
8. Examining informal institutional mechanisms or island level formations existing in the islands
that may or may have played a crucial role in disaster response and recovery.
More details of the field procedures and analysis techniques are provided in the next section.
Assessing Social Consequences of Disaster
The social consequences from disaster will be constructed by evaluating the existing socio-economic
characteristics and community capacity against past impacts of disasters in other islands and in
other countries (with similar social settings). Impacts will also be largely influenced by community
views and their perceptions of disaster situation on the island. If the island has experienced a
disaster event in the past then those experiences will form a basis for impact assessment albeit after
accounting for new social changes.
The entire study was initially designed to have a spatial perspective. It was designed to suit a spatial
model whereby a Geographic Information System (GIS) could be used to undertake essential spatial
analyses. Hence, all the households in specific islands were be geocoded onto a basemap, and linked
to the Census database and data collected on individual households. However, the Department of
National Planning advised us that would not be possible due to privacy restrictions to Census
database. We were also advised not to identify individual households against certain socio-economic
characteristics like income, particularly in a document that would be published. The spatial
perspective was therefore abandoned.
Identification of risk management options
The final component of the assessment will involve identifying risk management options based on
the study. These assessments will be based on community suggestions, expert judgment,
experiences of other countries and findings from other similar studies in Maldives.

DIRAM 2 – Socio-economic Assessment Report: Methodology
9
Key areas of concentration would be identifying options for risk reduction and management,
mitigation, preparedness and response and recovery.
2.2 Working Procedures
2.2.1 In-house data collection
As noted above data collection will be undertaken both in-house and in the field. Table 2.1 below
summarises the key data that could be collected in-house, their sources and reliability.
Table 2.1: List of data collected during desk study
Parameter Data Source Contact
Person or
Agency
Reliability
Infrastructure data - Databases in
Department of
National Planning
(DNP), National
Disaster
management Centre
(NDMC), Ministry of
Home Affairs;
- Island data form
- DNP;NDMC
- Ministry of
Home Affairs;
Island Office
Good
Very good
Migrant community data
(number of migrants; origin;
date of relocation and type of
relocation)
- NDMC and Island
Office assistance
lists
- Census 2006
NDMC; Island
Office
DNP
Good but some
persons are missing if
they have relocated
on their own outside
Govt assistance.
Community NGOs Official list of NGOs Ministry of
Home Affairs
Good; needs to be
verified during field
survey as some are
non-active.
Vulnerable groups data at
household level (young
population; elderly; Female
headed households;
households with single
persons; households with only
dependents; people lacking
education skills; temporary
residents; unemployment)
Census 2006 DNP V. Good; but the data
is outdated by two
years which may be
significant given high
out migration from all
outer islands.
Expatriates Island Office; Census
2006
Island Office;
DNP
Poor; There is no
official registrar of
foreigners and some
remain illegally.
Wealth (income) and poverty Vulnerability and
Poverty Assessment
2004 (VPAII);
Household Income
DNP Average; Small
sample in VPAII; HIES
is done only for a
limited number of
DIRAM 2 – Socio-economic Assessment Report: Methodology
10
and Expenditure
Survey (HIES).
islands
Economic Groups Census 2006 DNP Good
Population and migration
characteristics
Census 2006 DNP Good
Housing Data (no. of
households; plot size; available
plots; etc..)
Census 2006; Island
office
Island Office;
DNP
Good
Land use (existing and
planned)
Land use maps;
Census maps
DNP Good; most islands do
not have a finalised
land use plan.
Crime Atoll police outposts Police Average; difficult to
break down to
various time periods.
Cannot effectively
evaluate trends.
Social conflicts and major
crimes (last 5 years)
Newspaper reports HaveeruOnline Good
Natural hazard risks;
Environmental vulnerability;
Physical (infrastructure and
housing) vulnerability
DHIRAM1 UNDP and
DNP
Good
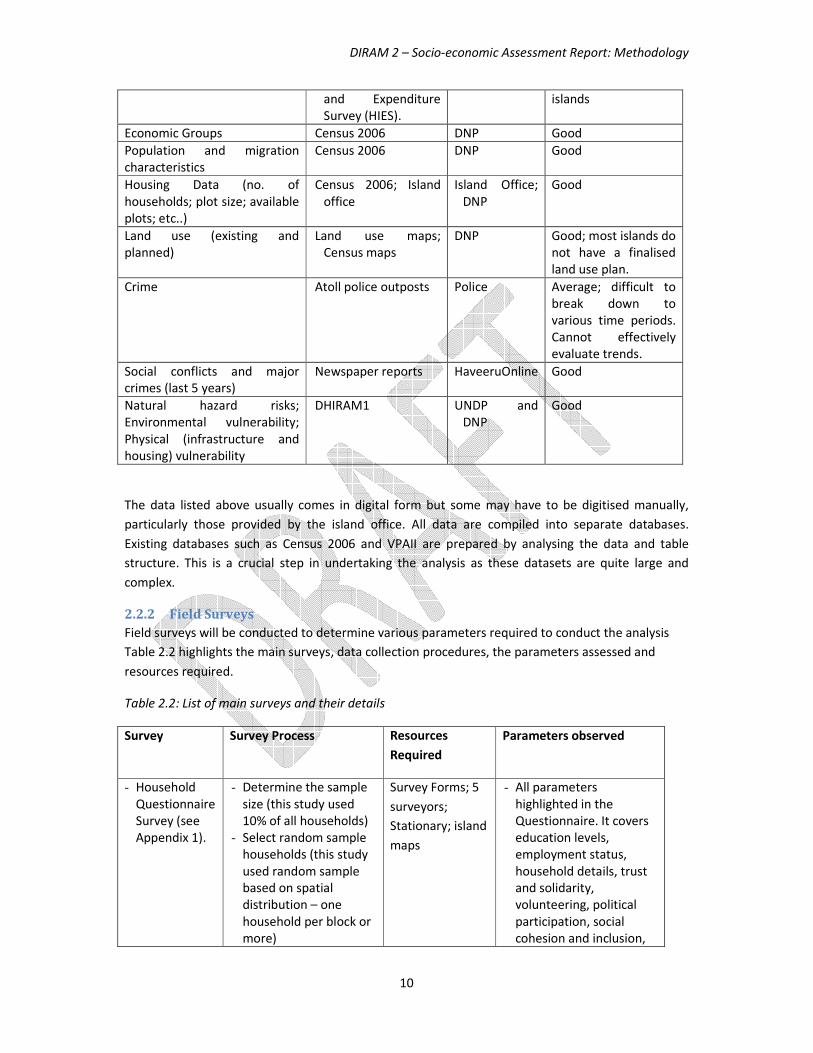
The data listed above usually comes in digital form but some may have to be digitised manually,
particularly those provided by the island office. All data are compiled into separate databases.
Existing databases such as Census 2006 and VPAII are prepared by analysing the data and table
structure. This is a crucial step in undertaking the analysis as these datasets are quite large and
complex.
2.2.2 Field Surveys
Field surveys will be conducted to determine various parameters required to conduct the analysis
Table 2.2 highlights the main surveys, data collection procedures, the parameters assessed and
resources required.
Table 2.2: List of main surveys and their details
Survey Survey Process Resources
Required
Parameters observed
- Household
Questionnaire
Survey (see
Appendix 1).
- Determine the sample
size (this study used
10% of all households)
- Select random sample
households (this study
used random sample
based on spatial
distribution – one
household per block or
more)
Survey Forms; 5
surveyors;
Stationary; island
maps
- All parameters
highlighted in the
Questionnaire. It covers
education levels,
employment status,
household details, trust
and solidarity,
volunteering, political
participation, social
cohesion and inclusion,

DIRAM 2 – Socio-economic Assessment Report: Methodology
11
Survey Survey Process Resources
Required
Parameters observed
- Train surveyors
- Conduct surveys
concurrently
throughout the island.
Visiting times should
avoid prayer times and
consider visiting in the
afternoon (outside
working hours) to avoid
interviewing only
women.
- Daily field meeting to
summarise main
findings.
- Data entry
collective action and
cooperation, coping
strategies and disaster
perception of individual
households.
- Additionally, visual
observation of housing
construction, their
location on the island
and neighbourhood is
also undertaken.
Stakeholder
consultations
(semi-
structured
discussions)
- Identify key
stakeholders on the
island during the initial
meeting with the island
office. This usually
includes IDC, WDC,
NGOs, influential
persons (businessmen,
elderly), economic
groups – fishermen,
traders, farmers, civil
servants and
construction workers.
- Request for
stakeholder meetings.
- Conduct stakeholder
meetings, preferably
separately but usually
IDC and key
businessmen are the
same.
Trained social
scientist
Flip charts
Island maps
Digital voice
recorder
Questions sheet
- Questions relating to the
access to services,
community organization,
social activities, past
natural hazards, political
activism, solidarity, social
cohesion, collective
actions, perception of
risks, coping
mechanisms, community
resources to cope,
perceptions on risk
management, mitigation,
preparedness and
recovery.
Transect Walks - Identify two major
roads for surveying (for
an island less than 50
Ha). It should not be
the main road as they
have an inherent
business advantage
(locational).
- Conduct interviews
with random
Aerial
photograph or
map of the
island.
Five support staff
Stationary
- Questions relating to the
access to services,
community organization,
social activities, seasonal
calendar, past natural
hazards, political
activism, solidarity, social
cohesion, collective
actions, perception of
risks, coping

DIRAM 2 – Socio-economic Assessment Report: Methodology
12
Survey Survey Process Resources
Required
Parameters observed
individuals from each
block. The household
questionnaire should
be used as a guide.
mechanisms, community
resources to cope,
perceptions on risk
management, mitigation,
preparedness and
recovery.
Island Survey
form
(see Appendix
2)
- Submit to Island office
for completion;
completion by survey
team with the island
office staff is preferred.
One staff
Island survey
form
Stationary
- See island Form in
Appendix 2
Island office
meeting
- Conduct a meeting with
senior island office staff
Survey team
- All gaps remaining in
island data.
- Expatriates information
2.3 Results interpretation and Presentation
The basis of the analysis should be the data collected in the field. It will have to be supported by
existing detailed surveys, particularly the Census 2006 and VPAII. General socio-economic setting
should be derived from the Island Survey Form, Island Form and other parameters identified in the
in-house assessments.
Data analysis for the Questionnaire Survey should ideally be undertaken using a statistical package
to evaluate the correlation. However, to facilitate easy duplication of the method, simple
percentages could be used interpret the results. There are significant limitations in this approach but
the end result could still be within a reasonable error range. The analysis should be centred upon
determining the key trends in each of the categories identified in the questionnaire.
The findings from the stakeholder consultations should be used to determine the community
capacity and coping mechanisms.
The assessment could be organized and presented into 4 main groups: i) baseline social conditions;
ii) evaluation of the potential social effects on the community of a disaster - eg. tsunami event; iii)
measures to reduce vulnerability to disasters.
The baseline social conditions should cover the following information. They should be based on the
questionnaire survey, island survey form and other background data highlighted in the previous
section.
1. Access to basic services
2. Migrant Communities
3. Organizations and Networks
DIRAM 2 – Socio-economic Assessment Report: Methodology
13
4. Trust and Solidarity
5. Political and Civic Participation
6. Vulnerable groups
7. Wealth
8. Perception of risks
9. How they cope
10. Perception of Risks and Coping Strategies
The potential social effects of disasters on the community should be based on at least one high
magnitude event. Ideally impacts should be measured separately for all potential hazards and
scenarios but the social assessments would tend to provide similar results.
1. Physical Impacts
2. Socio-demographic Impacts
3. Socio-political Impacts
4. Factors enhancing the effects of a Disaster
5. Factors reducing the effects of a Disaster
Measures to reduce social vulnerability to disasters should cover four broad categories as follows:
1. Risk reduction and management
2. Mitigation
3. Preparedness
4. Response & recovery

DIRAM 2 – Socio-economic Assessment Report: Methodology
14
3 Economic Vulnerability
3.1 Introduction
Economic vulnerability assessment is increasingly becoming an important component in community
level risk assessment. Traditionally, economic assessments were limited to national level
assessments and were mostly used within the insurance community. With the advent of new
research into the social impacts of economic loss during natural hazards, especially in smaller
communities, attention to economic vulnerability assessments in public risk assessment projects is
gathering pace.
This project aims to understand the economic vulnerability of the nine selected islands by
forecasting the economic and social impacts from given hazard scenarios. The methodology
proposed below revolves around an ‘Island Economic Linkage Model’ which is designed to identify
the economic networking within islands and consequences of failure in various nodes of the
networks during natural hazards. Assessments will be carried out by quantifying and valuing various
nodes and linkages within the economy.
3.1.1 The Conceptual Framework
Fig. 3.1 The conceptual framework of economic vulnerability assessment
Economic Vulnerability Assessment
Socialsetting
Physical vulnerabilityof investment
assets
Sustenance orcritical facilities
Quantified EconomicLinkages
Model
Completed and to-be-completed assessments
Hazard Scenarios&
Hazard Zones
As noted above, the economic vulnerability assessment will revolve around a quantified Island
Economic Linkage Model (IELM). A number of other key information is required which would provide
information on natural hazards, physical vulnerability and social setting. This information will be
utilized from outputs of the already completed components. The most crucial data includes hazards
scenario, hazard zones, physical vulnerability of investment assets (public and private enterprises),
critical infrastructure and social set-up.
Once a quantitative IELM is constructed for each island, impacts from a selected scenario for each
natural hazard combined with physical vulnerability data will be used to assess effects on the model.

DIRAM 2 – Socio-economic Assessment Report: Methodology
15
These effects when quantified in monetary terms provide the economic impacts of any given
scenario on a range of levels including internal, external and national levels.
3.1.2 Economic Component Assessment Framework
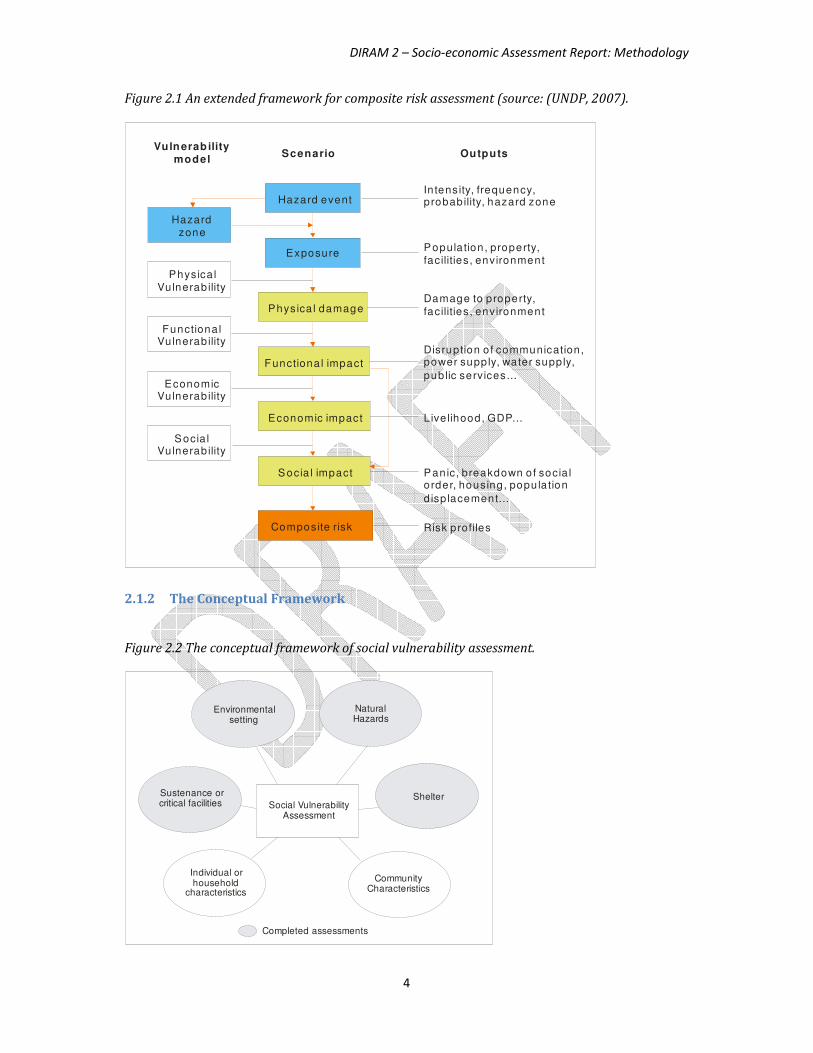
Figure 3.2 Economic component assessment framework
Compile Key Economic Data
SecondaryEconomic Data
Field Data
Assessment ComponentInput Output
- Key economiccategories and groups- estimated
Economic valueof individualactivities- Production- Employment
Establish Island Economic LinkageModel
Quantify Island Economic LinkageModel
Key economic data
Key business
infrstrucure,entities & industries
Forward & backward linkages
- IELM
Financial valuesof assets, productionemployment
Hazard Scenarios,hazard zones
Physical Vuln. Identify & Quantify Economic Impacts forVarious Hazards & Scenarios
Outputs frompreviouscomponent
- List of recommend.for reducing econvulnerability- Preliminary
action plan
Identify Recommendations
- Env. mitigationoptions
- social mitigation
options
- physc. mitigationoptions
- safe island components
- Cost and benefits of mitigation- Budget implications- Policy implications
Benefit-cost analysis of all mitigation measures
- Quantified IELM
Quantified IELM
Loss estimates &probabilities
- Quantified impactsfor each hazard,economic sector &social group
- most econ. vulnerablesectors, key vulner.factors, social groups.- composite index ofvulnerabi lity

DIRAM 2 – Socio-economic Assessment Report: Methodology
16
The broad framework for assessment is outlined above in figure 5. The framework is divided into 6
main components: 1) compiling key economic data; 2) establishing IELM; 3) quantifying IELM; 4)
identifying and quantifying economic impacts for various hazards and scenarios; 5) identifying
recommendations and; 6) benefit-cost analysis of mitigation options.
Compiling key economic data
The first component of the assessment involves data collection. The reality in Maldives is that there
are almost no substantial economic data collected at island level. Most available economic data are
aggregated to the atoll or national level. A considerable amount of the data will have to be collected
on the field and a number of estimations are expected to fill the data gaps at island level.
Studies such as the census, Vulnerability and Poverty Assessment and Household Income and
Expenditure Survey provide some base data for the study. The final compilation will be done on the
field using questionnaire surveys of all economic sectors.
Establishing Island Economic Linkage Model
The IELM will be based on a generic network model, where key elements of the economy will be
defined as nodes and their interactions and dependencies defined as links. The identification of
nodes and links would require substantial qualitative interviews with community groups and
questionnaire surveys of the economic sectors within the island. This process eases after the first
two or three islands as most islands of Maldives have a generic pattern of linkages. An example of
the model is provided in figure 3.3 below.
Figure 3.3. Economic component assessment framework
Private Sector
Public Sector
External
Resorts
Internal
Households
Small Business
Tourism(hotels)
Key infrastructure
PublicService
inter-islandcargovessels
Fishing
Agriculture
Fishprocessing
infrastructure
Fishingbusiness
assetsMale'Port
Infrastructure
Natural resources
Agriculturebusiness
assets
The example above provides a simplified example of a linkage model. The elements within the
model are further sub-categorized for simplicity, depending on the resolution of data available and
collectable within the given timeframe. Once the model could be established with substantial
accuracy, it provides a snapshot of economic interactions being undertaken within the island. Based
on this model it is possible to predict the links and nodes affected if one of the nodes fails. From the
above example, if a key infrastructure such as harbor fails, it affects the inter-island supply of goods

DIRAM 2 – Socio-economic Assessment Report: Methodology
17
and all major industries on the island. These inter-linkages and potential impacts of failure of various
nodes will be tested using community input during field consultations.
Quantifying Island Economic Linkage Model
The IELM model in its initial form will only be able to identify the potential chain of economic
impacts, but not the actual scale of the impact. In order to do this, the model will be further
developed to assign quantitative values to each node and interaction. Following the example from
previous section, it would be possible to quantify the economic value of fishing and agricultural
industry by valuing the production and assets of these two industries. When a specific node such as
a harbor fails, it would then be possible to predict the proportion of production lost due to the
strong linkage with harbor for business continuity. Hence, an economic value can be placed on the
loss of a specific node in this manner. In another example, we could assume that a resort closes
down due to a swell wave event. If the resort decides to lay off staff for the duration of
reconstruction, the direct links to the households could be measured by estimating the remittance
values. The follow-on effects on the small businesses will also become evident with the loss of
income.
It would require considerable knowledge of the local economic settings to establish an efficient
model. The results provided in the island reports are a good knowledge base to continue future
studies.
Identify and quantify economic impacts for various hazards and scenarios
This stage of the assessment will undertake the specific economic risk assessments for the island for
the given hazards and hazard scenarios. This assessment will used the hazard scenarios, hazard
zones, physical vulnerability data and the quantified IELM model to assess the impacts on various
nodes and linkages and value the cost of those impacts. The hazard scenarios provides the most
likely impacts on the island - such as percentage loss of agricultural areas or damage to harbor - for
any given hazard intensity. This data can be easy input into the IELM model to identify failure points
and quantified values due to those failures. A number of loss estimates including probability analysis
will be required wherever the hazard scenario fails to provide them. In addition, the hazard zones
will allow us to identify visually, where high impacts are going to take place and whether the
buildings where the businesses are located are vulnerable to a give hazard scenario. A GIS is used to
overlay various layers of information over the hazard zones to derive the losses.
The outputs from this assessment provide the quantified costs for a range of categories or
classifications. It could provide loss based on economic sector, social groups and specific hazards. It
will also identify high impact establishments which if affected could impact large sections of the
community.
Identifying recommendations
The fifth stage will involve identifying key recommendations and action plans based on the findings
from economic vulnerability assessment. These assessments will be based on expert judgment,
experiences of other countries, experience from past disasters and other similar studies in Maldives.

DIRAM 2 – Socio-economic Assessment Report: Methodology
18
Key areas of concentration would be identifying mitigation options, policy implications for exiting
national development plans and implications on existing settlement planning processes, especially
within Population and Development Consolidation Policy. Cost-effectiveness studies will be
undertaken where appropriate.
Benefit –cost analysis of mitigation options
This stage of the analysis will attempt to undertake a preliminary benefit-cost analysis for the
quantifiable mitigation options presented in this and other components of this study. Moreover, it
will attempt to undertake benefit-cost analysis for the proposed generic safe-island concept and the
components proposed in it. This will give strong policy backing and realistic view of all risk
management options proposed in this project for each island.
3.2 Data Needs and Requirement
Table 3.1 summarizes the key data required, their availability and gaps.
Table 3.1 Economic data requirements, availability and gaps.
Data Required Data Availability & potential sources Gaps
Gross Domestic
Product
- Unavailable at island level
- Calculation may be impossible there is
lack of island level data on
expenditures and exports.
- Not possible to calculate an
island level GDP without at
least an years worth of data.
Inventory of business
establishments and
investments.
- Some data available at island office but
are not up-to-date.
- Field survey required
- Very limited data
Inventory of
infrastructure, public
services, housing and
other public
investments
- Infrastructure and service data
available from island office and
relevant Govt agencies.
- Housing data available from census and
island office.
- Recent infrastructure requires updating
during field surveys.
- Road length and sewerage network
size needs to be calculated using a GIS.
- Newly developed
infrastructure
- Only infrastructure
maintained by the Island
Office is recorded: excludes
roads, neru etc..
Value of public
investments
(infrastructure and
administrative
facilities)
- Available in a compiled form in (Shaig,
2009).
- Government agencies, particularly
DNP, NDMC, Ministry of Construction
(former), Ministry of Atolls
Administration.
- Government publications: PSIP, project
documents, Aid agency documents
- Base year is 2005.
- Most data has to be based on
replacement values as exact
values are rarely available.
-
Value of private
investments (houses,
personal property)
- Housing replacement value available
from NDMC and DNP
- Personal property values from VPAII
and filed surveys
- Replacement values do not
necessarily equal the original
value of the households, so all
households get assigned the
same value.

DIRAM 2 – Socio-economic Assessment Report: Methodology
19
Data Required Data Availability & potential sources Gaps
- Personal property values are
difficult to fix as it varies
significantly between
households.
Value of business
investments
- Not available from any other source.
- Has to be collected during field surveys
- Cannot value physically survey
all establishments; sample
survey of 10% business from
each sector is undertaken.
Monthly Income and
Expenditure of
businesses and
economic activities
(productivity values
and profits).
- Not available for private businesses;
field survey required.
-
- Salaries vary, so an average
value is used for each
economic activity and
wherever, possible to key
roles in sector. Eg. boat owner
and fisherman for fishing.
Statistical Value of
Life
- Shaig (2009) - No official data
Monthly Income
(employees and self-
employed) and
remittances
- Public service data available from State
Budget document and island office.
- For the rest, field surveys required.
- Only average values possible.
Employment and
occupational data
- Census 2006 - Based year is 2006
Economic linkages
between various
sectors
- Not available; field surveys required. - No data.
3.3 Working Procedures
3.3.1 In-house data collection & literature review
In house data collection mainly involves collecting all major publications, project documents and
previous consultancy reports undertaken for the study island. It also involves collecting values on
financial values of public infrastructure, housing data and replacement values and employment data.
The key documents referred were as follows:
Socio-economic data
1. Maldives Population and Housing Census 2000 Expanded Dataset (Census 2000) and Census 2006
Expanded Dataset in electronic format received from Ministry of Planning and National
Development (MPND).

DIRAM 2 – Socio-economic Assessment Report: Methodology
20
2. Maldives Vulnerability and Poverty Assessment 1998 (VPA I) dataset and questionnaires in
electronic format (Microsoft Access Database and Acrobat format), received from MPND.
3. Maldives Vulnerability and Poverty Assessment 2004 (VPA II) dataset and questionnaires in
electronic format (Microsoft Access Database and Acrobat format), received from MPND.
4. Education sector statistics of 2004 and 2005 in digital e-Book format (Adobe Acrobat) from
Ministry of Education (MoE, , 2004; MoE, , 2005).
5. Health sector information from Maldives Health Report 2005 in digital e-Book format (Adobe
Acrobat) from Ministry of Education (MoH, , 2005).
7. Existing island level infrastructure data in digital format (9 Excel files) from MPND and Ministry of
Atolls Administration. These files contained the details of main infrastructure in the outer islands:
existing infrastructure of access facilities (harbours, channels and jetties), education, health services,
administration, judicial services, religious facilities, power, sanitation, water and housing.
8. Damages to infrastructure caused by the tsunami from National Disaster Management Centre
(NDMC) in digital format (16 excel files).
10. Maldives Vulnerability and Poverty Assessment Report 1998 (MPND and UNDP, 1999).
11. Maldives Vulnerability and Poverty Assessment Report 2004 (MPND and UNDP, 2004).
12. Maldives Housing and Population Census 2000 and 2006 Analytical Report (MPND, 2001).
13. National Recovery and Reconstruction Plan 2005 (MPND, , 2005), developed following the Indian
Ocean Tsunami of 2004.
14. National Development Plan 2007-2012 (MPND, , 2006)
16. Infrastructure Development for Poverty Alleviation Project Report (BCL,, 2005)
Financial Data
1. Public Sector Investment Programme (PSIP) data in digital format (Excel) from MPND.
2. State Budgets of 2005 and 2006 (MoFT, , 2005; MoFT, , 2006) from Ministry of Finance and
Treasury in digital e-Book format (Acrobat).
3. Maldives Health Report 2005 (see above) provided data on health expenditure (both capital and
recurrent) at various hierarchies of health services.
4. Household Income and Expenditure Survey (HIES) dataset, questionnaires and report (MPND, ,
2003) in electronic format (Microsoft Access Database and Acrobat format) from MPND. HIES is
country wide income and expenditure survey carried out with a relatively small sampling. The
following limitations were provided by the author (MPND):
“the survey design was such that the results are representative for Male' and at the regional level
(the five development regions) in the atolls. Thus, no conclusions can be drawn from the information

DIRAM 2 – Socio-economic Assessment Report: Methodology
21
on the situation in any particular atoll. Also, it is important to note that the sample size of the survey
is rather small when analyzing the information at the regional level where only 120 observations are
available for each region”.
6. Infrastructure costs as of 2005 provided by National Disaster Management Centre in digital format
(Excel files). These included housing, road development, electricity infrastructure, schools, health
centres, community centre construction, social protection infrastructure, religious facilities, land
reclamation, waste management, coastal protection and judicial infrastructure. Since the figures
provided by NDMC were based on tsunami reconstruction costs of 2005, they reflect the actual costs
that would be incurred in a consolidation programme.
7. Access infrastructure and coastal protection costs (harbours, jetties, access channel dredging and
breakwaters) provided by MPND and Ministry of Environment and Construction (MEC) in digital
format (excel files).
9. Cost of sewerage and desalination systems provided by Ministry of Health (MoH), Maldives Water
and Sanitation Authority (MWSA) and NDMC in digital format (Excel files).
Additional Documents Reviewed
1. Maldives Public Expenditure Review (WB, ADB & GoM,, 2002). This is the most comprehensive
review of the public expenditure in Maldives and provides trends, key sectoral proportions of
expenditure and key aggregates of both capital and recurrent expenditure.
3. Regional Development Project reports (OPUS, , 1999a; , 1999bOPUS, ). These reports contain
sectoral policy summaries and detailed analysis of infrastructure costs associated with a major
regional development project in two regions of Maldives.
4. Outer Island Electrification Project Report (ADB, , 2001). This report provided the electricity
infrastructure development costs.
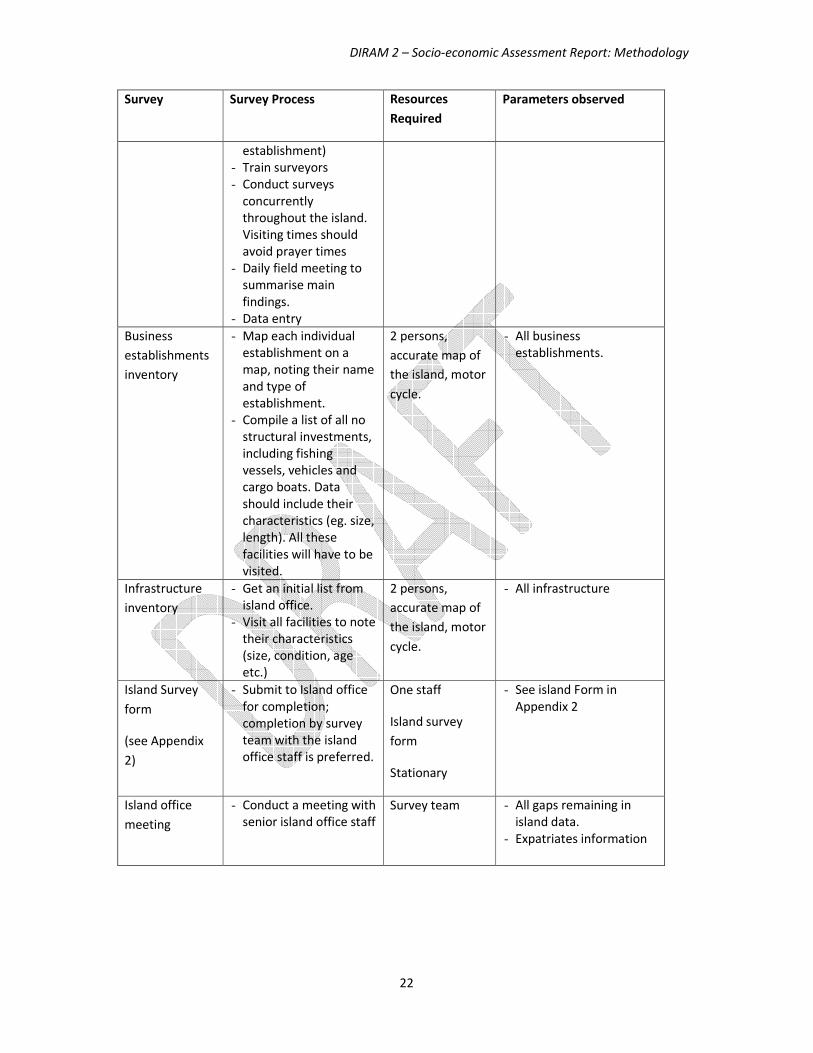
3.3.2 Field Surveys
Table 3.2 highlights the main surveys, data collection procedures, the parameters assessed and
resources required.
Table 3.2: Field surveys for economic assessment
Survey Survey Process Resources
Required
Parameters observed
- Business
establishment
Questionnaire
Survey (see
Appendix 3).
- Determine the sample
size (this study used
10% of each economic
sector)
- Select random sample
establishments (this
study used random
sample chosen based
on spatial distribution
and the size of the
Survey Forms; 5
surveyors;
Stationary; island
maps
- All highlighted in 3.2
- See Questionnaire
(appendix 3).
- Additionally, visual
observation of structure,
their location on the
island and storage of
stock is also undertaken.
DIRAM 2 – Socio-economic Assessment Report: Methodology
22
Survey Survey Process Resources
Required
Parameters observed
establishment)
- Train surveyors
- Conduct surveys
concurrently
throughout the island.
Visiting times should
avoid prayer times
- Daily field meeting to
summarise main
findings.
- Data entry
Business
establishments
inventory
- Map each individual
establishment on a
map, noting their name
and type of
establishment.
- Compile a list of all no
structural investments,
including fishing
vessels, vehicles and
cargo boats. Data
should include their
characteristics (eg. size,
length). All these
facilities will have to be
visited.
2 persons,
accurate map of
the island, motor
cycle.
- All business
establishments.
Infrastructure
inventory
- Get an initial list from
island office.
- Visit all facilities to note
their characteristics
(size, condition, age
etc.)
2 persons,
accurate map of
the island, motor
cycle.
- All infrastructure
Island Survey
form
(see Appendix
2)
- Submit to Island office
for completion;
completion by survey
team with the island
office staff is preferred.
One staff
Island survey
form
Stationary
- See island Form in
Appendix 2
Island office
meeting
- Conduct a meeting with
senior island office staff
Survey team
- All gaps remaining in
island data.
- Expatriates information
DIRAM 2 – Socio-economic Assessment Report: Methodology
23
3.4 Results interpretation and Presentation
The basis of the analysis should be conceptual Island Economic Linkages Model identified earlier in
the section. One the model is established based on the field survey findings and Census data, it
should be valued using values from the numerous sources identified in this study. This study has
already compiled the bulk of the baseline data so that future studies could use those values.
Data analysis for the Questionnaire Survey should ideally be undertaken using a statistical package
or spreadsheet (this study used a spread sheet and GIS database querying system). A number of
spreadsheets will need to be compiled to prepare the overall study. These sheets are provided in the
island reports.
Once the model is established some of these values could be entered into a GIS and overlaid on top
of the hazard zones. Based on the hazard intensity predicted in the hazard zones, physical losses to
various sectors of the economy could be estimated. These figures can be further enhanced using the
IELM to determine knock-on effects of losses through the economic linkages. Losses should be
estimated for all major hazards using a severe magnitude event as an example.
The mitigation measures should be suggested based on these losses and based on past projects and
concept documents related to mitigation. The costs of the mitigation should be calculated using the
financial data gathered (see previous sections).
A preliminary cost-benefit analysis should include all the estimated losses from the disasters as
benefits against the costs of mitigation measures. This should be done for single event and multiple
events and should consider a 25 year timeframe.
The assessment could be organized and presented into 4 main groups: i) island economic setting and
baseline economic conditions; ii) value of the economy; iii) economic linkages; iv) economic
establishments and their physical distribution; v) economic elements at risk and their vulnerability;
vi) local consequences of a disaster; vii)potential mitigation measures and; viii) costs and benefits of
mitigation measures.

DIRAM 2 – Socio-economic Assessment Report: Methodology
24
References Asian Development Bank (ADB), 2001. Outer Island Electrification Programme: Final Report. Asian
Development Bank, Manila.
Bangladesh Consultants Limited (BCL), 2005. Infrastructure Development for Poverty Alleviation,
Volume I. Ministry of Planning and National Development, Male', Maldives.
Ministry of Education (MoE), 2004. Education Statistics 2004, Ministry of Education, Male', Maldives.
Ministry of Education (MoE), 2005. Education Statistics 2005, Ministry of Education, Male', Maldives.
Ministry of Finance and Treasury (MoFT), 2005. Dhaulathuge Budget 2005 [State Budget 2005],
MoFT, Male', Maldives.
Ministry of Finance and Treasury (MoFT), 2006. Dhaulathuge Budget 2006 [State Budget 2006],
MoFT, Male', Maldives.
Ministry of Health (MoH), 2005. The Maldives Health Report 2005. Ministry of Health, Male,
Maldives.
Ministry of Planning and National Development (MPND), 2003. Household Income and Expenditure
Survey 2002-2003. MPND, Male, Maldives.
Ministry of Planning and National Development (MPND), 2005. National Recovery and
Reconstruction Plan. MPND, Male', Maldives.
Ministry of Planning and National Development (MPND), 2006. Sixth National Development Plan
2007-2012, Ministry of Planning and National Development, Male', Maldives.
Morrow, B. H., 1999. 'Identifying and Mapping Community Vulnerability'. Disasters, 23 (1), 1-18.
MPND, 2001. Population and Housing Census 2000 of the Maldives Analytical Report, Ministry of
Planning and National Development, Male', Maldives.
MPND & UNDP, 1999. Ministry of Planning and National Development
United Nations Development Programme, Maldives, Male', Maldives.
MPND & UNDP, 2004. Ministry of Planning and National Development
United Nations Development Programme, Maldives, Male', Maldives.
Opus International Consultants Limited (Opus), 1999a. Final Report for the Atoll Development
Project. Ministry of Finance and Treasury, Government of Maldives, Male'.
Opus International Consultants Limited (Opus), 1999b. Final Report for the Atoll Development
Project. Ministry of Finance and Treasury, Government of Maldives, Male'.
Shaig, A., 2009. 'Settlement Planning for Natural Hazard Resilience in Small Island States: The
Population and Development Consolidation Approach', Draft PhD Thesis, James Cook
University, Townsville.
Smith, K., 2004. Environmental Hazards: Assessing Risk and Reducing Disaster, Routledge, New York.
The World Bank The Asian Development Bank and Government of Maldives, 2002. Maldives Public
Expenditure Survey (Report No. 24238-Mv). The World Bank, Washington.
UNDP, 2007. Detailed Island Risk Assessment Maldives, Volume Ii: Methodologies (Final Draft).
UNDP, Male'.
Varley, A., 1994. 'The Exceptional and the Everyday: Vulnerability Analysis in the the International
Decade of Natural Disaster Reduction'. In: Varley, A. (Ed.) Disaters, Development and
Environment. Wiley, New York.
Wisner, B., Blaikie, P., Cannon, T. & Davis, I., 2003. At Risk: Natural Hazards, People's Vulnerability
and Disasters, Routledge, New York.
DIRAM 2 – Socio-economic Assessment Report: Methodology
25
APPENDIX 1 – Household Questionnaire Survey

DIRAM 2 – Socio-economic Assessment Report: Methodology
26
APPENDIX 2 – Island Information Form

DIRAM 2 – Socio-economic Assessment Report: Methodology
27
APPENDIX 3 - Business Establishments Survey Form