Embed Size (px)
Citation preview
Doc#297661
Company: Southern California Gas Company (U904G) Proceeding: 2016 General Rate Case Application: A.14-11-004 Exhibit: SCG-211
SOCALGAS
REBUTTAL TESTIMONY OF EVAN D. GOLDMAN
CUSTOMER SERVICE OFFICE OPERATIONS (CSOO)
June 2015
BEFORE THE PUBLIC UTILITIES COMMISSION OF THE STATE OF CALIFORNIA
EDG-i Doc#297661
TABLE OF CONTENTS
I. SUMMARY OF DIFFERENCES ................................................................................... 1
II. INTRODUCTION............................................................................................................. 1
A. ORA ........................................................................................................................ 1
B. UWUA .................................................................................................................... 2
III. REBUTTAL TO PARTIES’ O&M PROPOSALS ........................................................ 3
A. Non-Shared Services O&M .................................................................................. 3
1. Disputed Cost .................................................................................................. 3
a. ORA ............................................................................................................ 3
B. Shared Services O&M ........................................................................................ 31
1. Disputed Cost ................................................................................................ 31
a. ORA .......................................................................................................... 32
IV. REBUTTAL TO PARTIES’ CAPITAL PROPOSALS .............................................. 32
V. CONCLUSION ............................................................................................................... 32
Appendix Attachment A. SEU Data Request, SEU-ORA-DR-04 Question 2
Appendix Attachment B. ORA Data Request, ORA-SCG-DR-070-TLG, Question 12
Appendix Attachment C. ORA Data Request, ORA-SCG-DR-070-TLG, Question 7,
Attachment 1
Appendix Attachment D. ORA Data Request, ORA-SCG-DR-070-TLG, Question 1
Appendix Attachment E. Customer Insight Panel – Residential
EDG-1 Doc#297661
SOCALGAS REBUTTAL TESTIMONY OF EVAN D GOLDMAN 1
(CUSTOMER SERVICE OFFICE OPERATIONS) 2
I. SUMMARY OF DIFFERENCES 3
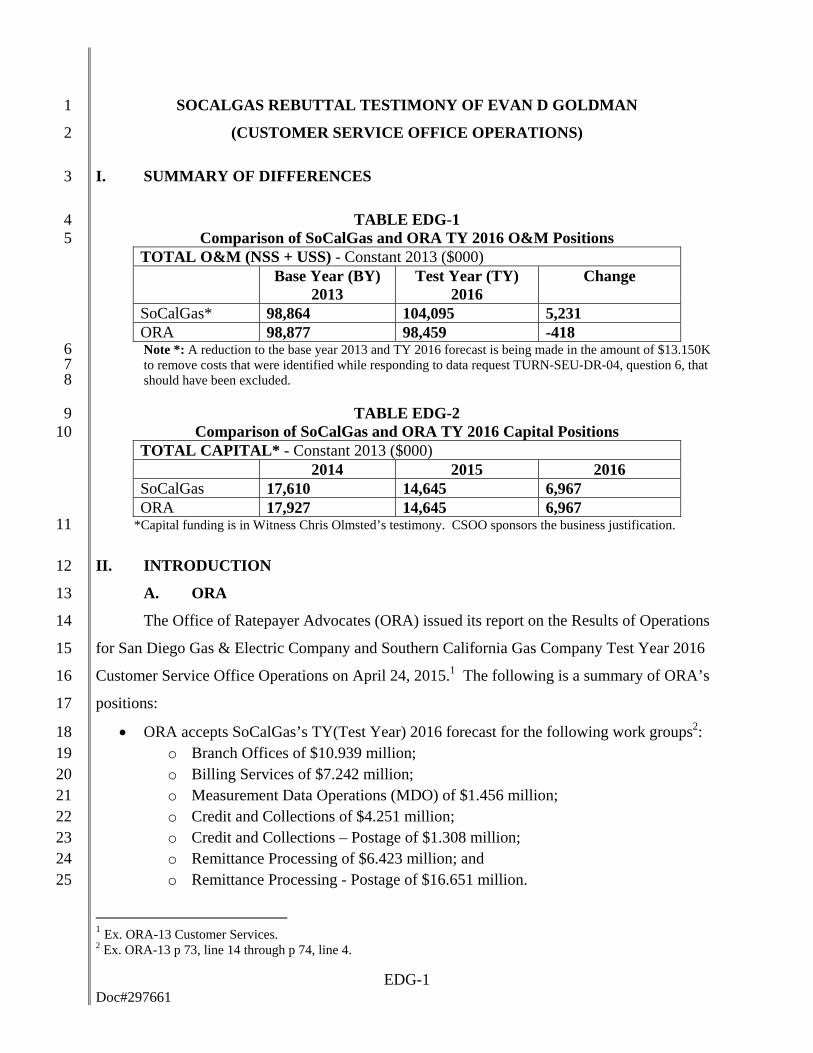
TABLE EDG-1 4 Comparison of SoCalGas and ORA TY 2016 O&M Positions 5
TOTAL O&M (NSS + USS) - Constant 2013 ($000)
Base Year (BY)
2013 Test Year (TY)
2016 Change
SoCalGas* 98,864 104,095 5,231 ORA 98,877 98,459 -418 Note *: A reduction to the base year 2013 and TY 2016 forecast is being made in the amount of $13.150K 6 to remove costs that were identified while responding to data request TURN-SEU-DR-04, question 6, that 7 should have been excluded. 8
TABLE EDG-2 9 Comparison of SoCalGas and ORA TY 2016 Capital Positions 10
TOTAL CAPITAL* - Constant 2013 ($000) 2014 2015 2016 SoCalGas 17,610 14,645 6,967 ORA 17,927 14,645 6,967
*Capital funding is in Witness Chris Olmsted’s testimony. CSOO sponsors the business justification. 11
II. INTRODUCTION 12
A. ORA 13
The Office of Ratepayer Advocates (ORA) issued its report on the Results of Operations 14
for San Diego Gas & Electric Company and Southern California Gas Company Test Year 2016 15
Customer Service Office Operations on April 24, 2015.1 The following is a summary of ORA’s 16
positions: 17
ORA accepts SoCalGas’s TY(Test Year) 2016 forecast for the following work groups2: 18 o Branch Offices of $10.939 million; 19 o Billing Services of $7.242 million; 20 o Measurement Data Operations (MDO) of $1.456 million; 21 o Credit and Collections of $4.251 million; 22 o Credit and Collections – Postage of $1.308 million; 23 o Remittance Processing of $6.423 million; and 24 o Remittance Processing - Postage of $16.651 million. 25
1 Ex. ORA-13 Customer Services. 2 Ex. ORA-13 p 73, line 14 through p 74, line 4.
EDG-2 Doc#297661
The work groups where ORA accepts SoCalGas’ forecasts represent a net reduction of 1
$832,000 from BY 2013 adjusted recorded expenses for these areas. 2
ORA disputes SoCalGas’ funding request for the following work groups: 3
o Customer Contact Center (CCC) Operations: SoCalGas’ TY 2016 request is 4 $34.924 million. ORA utilized SoCalGas’ 2013 adjusted-recorded expenses as a 5 basis for its estimate of $31.223 million (Labor of $30.875 million and Non-Labor 6 of $0.348 million) or a recommended disallowance of $3.7 million (10.6%) 7 reduction for SCG’s Customer Contact Center – Operations O&M expenses. 8
o Customer Contact Center – Support: SoCalGas’ TY 2016 request is $10.381 9 million. ORA utilized SCG’s 2013 adjusted-recorded expenses as a basis for its 10 estimate of $9.190 million (Labor of $6.923 million and Non-Labor of $3.458 11 million) or a recommended disallowance of $1.2 million (11.5%) reduction for 12 SCG’s Customer Contact Center – Support O&M expenses. 13
o Customer Service Other Office Operations and Technology: SoCalGas’ TY 2016 14 request is $4.489 million. ORA utilized SCG’s 2014 adjusted-recorded expenses 15 as a basis for its estimate of $3.744 million (Labor of $2.718 million and Non-16 Labor of $1.026 million) or a recommended disallowance of $0.757 million 17 (16.8%) reduction for SoCalGas’ Customer Service Office Operations and 18 Technology O&M expenses. 19
Uncollectable Rate - ORA recommends a TY 2016 uncollectible expense rate of 0.298% 20 based on a three year (2011-2013) average, where SoCalGas has proposed an expense 21 rate of 0.312% based on a five year (2009-2013) average. 22
ORA does not object to SoCalGas’ capital forecast for CSOO projects. 23
B. UWUA 24
UWUA submitted testimony on May 15, 2015.3 The following is a summary of 25
UWUA’s position(s): 26
UWUA supports in full SoCalGas’ CSOO revenue request.4 27
UWUA reiterates opposition to SoCalGas’ Branch Office Optimization application A.13-28 09-010. 5 (SoCalGas notes that A.13-090-010 is pending a decision from the Commission 29 and the record has been closed.) 30 31
3 Utility Workers Union of America (“UWUA”), Ex. UWUA-1 through UWUA-10 4 Ex. UWUA-1 Testimony of Carl Wood, p. 3, lines 16-18 and Ex. UWUA-2 Testimony of Jerry Acosta, p. 2, lines 30-33. 5 Ex. UWUA-2, p. 5, lines 5-11.
EDG-3 Doc#297661
III. REBUTTAL TO PARTIES’ O&M PROPOSALS 1
A. Non-Shared Services O&M 2
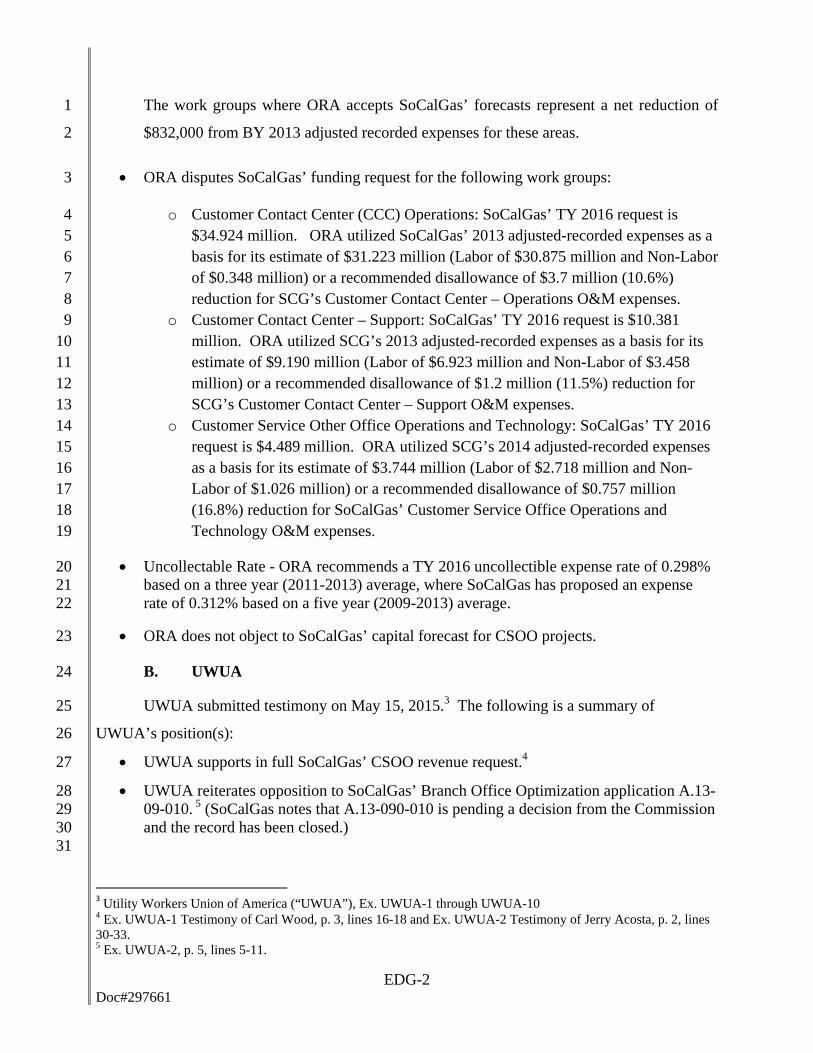
TABLE EDG-3 3 Comparison of SoCalGas and ORA 4
CSOO Non-Shared Services O&M Positions 5 NON-SHARED O&M - Constant 2013 ($000)
Base Year
2013 Test Year
2016 Change
SoCalGas* 92,862 98,063 5,201 ORA 92,875 92,427 -448 Note *: A reduction to the base year 2013 and TY 2016 forecast is being made in the amount of $13.150K 6 to remove costs that were identified while responding to data request TURN-SEU-DR-04, question 6, that 7 should have been excluded. 8
1. Disputed Cost 9
a. ORA 10
For the majority of disputed work groups, ORA asserts that Customer Service Office 11
Operations BY 2013 funding should be sufficient for TY 2016 activities. ORA has ventured a 12
step further and proposed an overall reduction of $448,000 from SoCalGas CSOO BY 2013 13
adjusted recorded results. ORA forecasts a net reduction by accepting work groups where 14
SoCalGas forecasts flat or declining costs and then disputing the work groups where the majority 15
of incremental costs are projected. ORA’s conclusions are based on unsubstantiated and flawed 16
assumptions as well as undocumented analysis that selectively considers historic costs and 17
trends. ORA does not address the impact of changing customer needs and preferences or 18
increased regulation. 19
SoCalGas has thoroughly explained in prepared direct testimony (Ex. SCG-11), 20
associated workpapers (Ex. SCG-11-WP) and in responses to ORA data requests why adjusted 21
recorded 2013 (“BY 2013”) expenses are not sufficient to fund proposed activities in the TY 22
2016 forecast. SoCalGas has also provided detailed calculations and other evidence to support 23
forecasts for incremental activities. ORA does not consider SoCalGas’ evidence or calculations 24
when making forecast recommendations and has failed to provide any evidence or alternate 25
calculations to support their lower forecasts. Instead, ORA has only provided generalizations and 26
undocumented assumptions. 27
EDG-4 Doc#297661
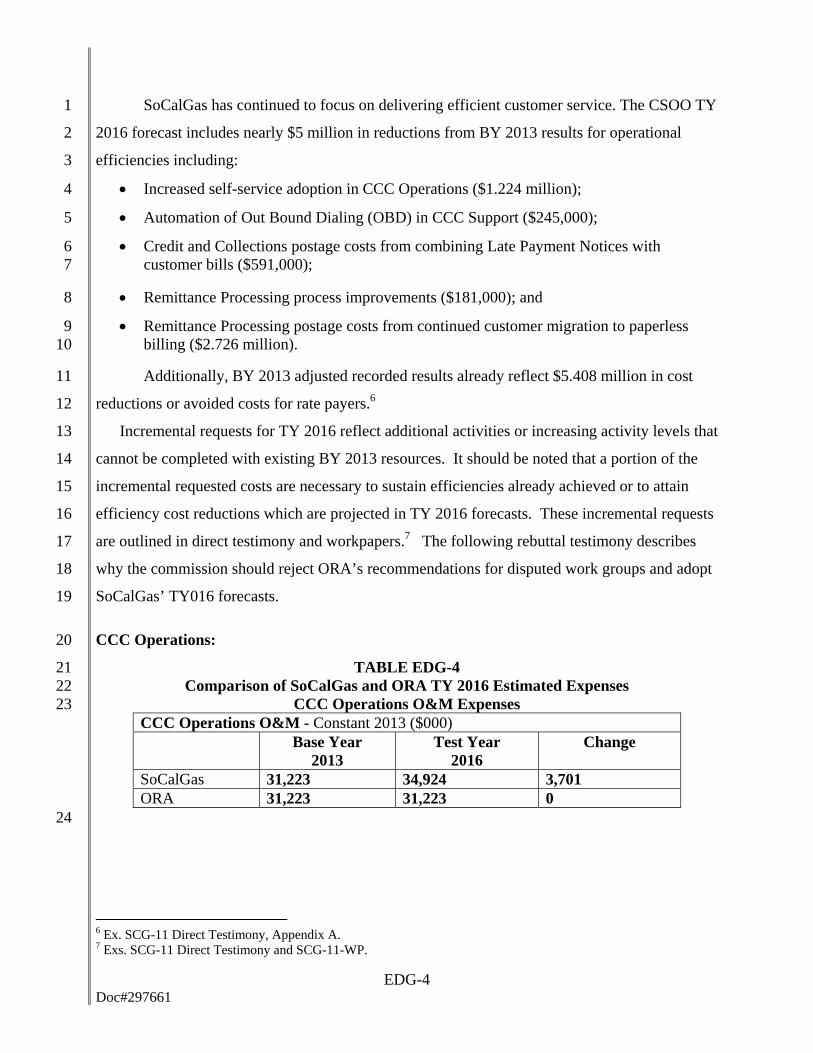
SoCalGas has continued to focus on delivering efficient customer service. The CSOO TY 1
2016 forecast includes nearly $5 million in reductions from BY 2013 results for operational 2
efficiencies including: 3
Increased self-service adoption in CCC Operations ($1.224 million); 4
Automation of Out Bound Dialing (OBD) in CCC Support ($245,000); 5
Credit and Collections postage costs from combining Late Payment Notices with 6 customer bills ($591,000); 7
Remittance Processing process improvements ($181,000); and 8
Remittance Processing postage costs from continued customer migration to paperless 9 billing ($2.726 million). 10
Additionally, BY 2013 adjusted recorded results already reflect $5.408 million in cost 11
reductions or avoided costs for rate payers.6 12
Incremental requests for TY 2016 reflect additional activities or increasing activity levels that 13
cannot be completed with existing BY 2013 resources. It should be noted that a portion of the 14
incremental requested costs are necessary to sustain efficiencies already achieved or to attain 15
efficiency cost reductions which are projected in TY 2016 forecasts. These incremental requests 16
are outlined in direct testimony and workpapers.7 The following rebuttal testimony describes 17
why the commission should reject ORA’s recommendations for disputed work groups and adopt 18
SoCalGas’ TY016 forecasts. 19
CCC Operations: 20
TABLE EDG-4 21 Comparison of SoCalGas and ORA TY 2016 Estimated Expenses 22
CCC Operations O&M Expenses 23 CCC Operations O&M - Constant 2013 ($000)
Base Year
2013 Test Year
2016 Change
SoCalGas 31,223 34,924 3,701 ORA 31,223 31,223 0
24
6 Ex. SCG-11 Direct Testimony, Appendix A. 7 Exs. SCG-11 Direct Testimony and SCG-11-WP.
EDG-5 Doc#297661
ORA incorrectly claims that SoCalGas’ requested increase is not justified due to historical 1
declining costs. ORA fails to account for fluctuations in weather, economic conditions, and 2
average bill amount. 3
ORA asserts: 4 “SCG’s request for an increase of 11.85% over 2013 adjusted-recorded expenses is not 5 justified based on historical trends that will continue in the TY.”8 6
ORA further speculates: 7 “This declining trend in costs and activity will continue in the TY, and additional funding 8 over 2013 recorded levels is not required.”9 9
ORA has not provided any documented analysis or evidence to support these assertions. 10
Although several factors contribute to CCC Operations costs, the two primary drivers 11
responsible for the recent decline have been: 12
1. Reduced CSR10 call volume and 13
2. Reduced CSR Level of Service 14
CSR call volume is impacted by multiple variables. Increased self-service has 15
contributed to the decline in CSR answered call volume, and SoCalGas has forecasted that TY 16
2016 self-service adoption will avoid an additional 287,465 CSR calls ($1.224 million) from BY 17
2013. Although SoCalGas believes customers will continue to migrate to self-service, the rate of 18
increase in adoption will not be sustained. SoCalGas has expanded web, mobile and IVR11 19
functionality providing customers self-service options to complete many routine transactions. 20
Sustaining an increasing rate of self-service adoption at historical growth rates becomes more 21
difficult as remaining CSR calls are from customers who are less willing or able to use self-22
service. Additionally, a larger proportion of the types of remaining CSR calls are complex and 23
are not as well suited to self-service channels. 24
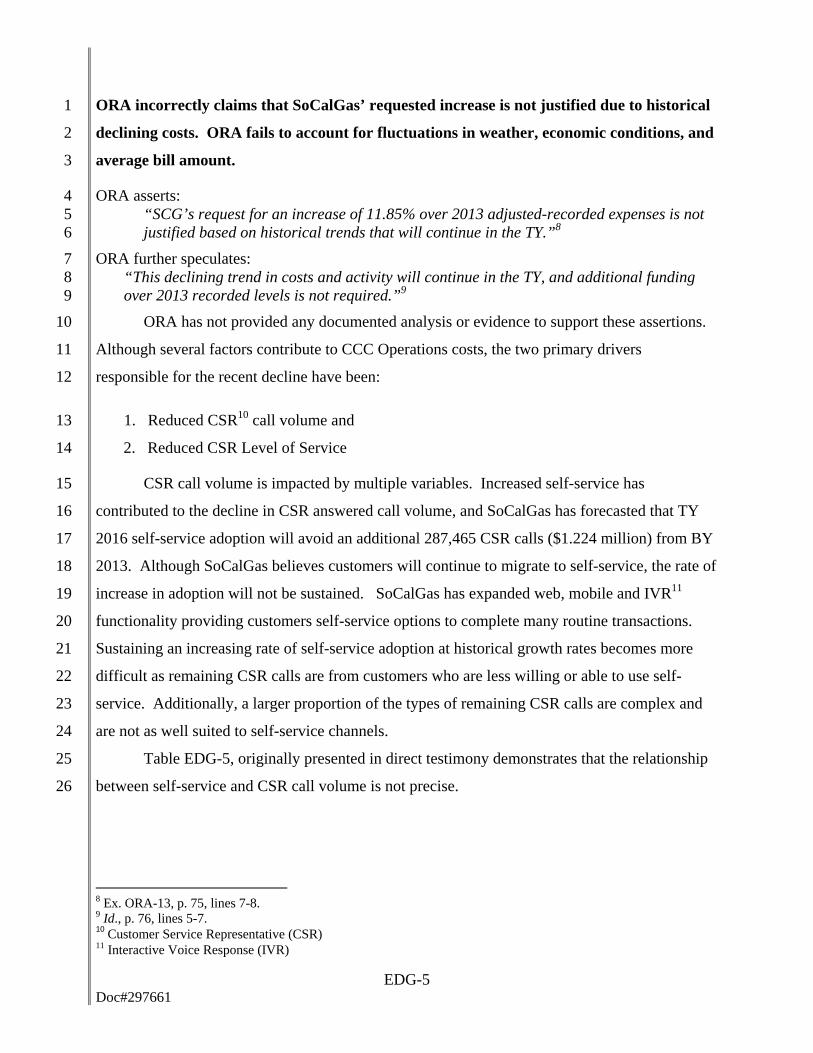
Table EDG-5, originally presented in direct testimony demonstrates that the relationship 25
between self-service and CSR call volume is not precise. 26
8 Ex. ORA-13, p. 75, lines 7-8. 9 Id., p. 76, lines 5-7. 10 Customer Service Representative (CSR) 11 Interactive Voice Response (IVR)
EDG-6 Doc#297661
TABLE EDG-5 1
Changes in CSR Answered Calls & Web/IVR Transactions 2
Year
CSR Answered Calls (a)
Change from
Previous Year (b)
Web and IVR Transactions
(c)
Change from
Previous Year (d)
Net Change = (b) + (d)
2009 7,215,157 1,650,272 -
2010 7,215,202 45 1,958,227 307,955 308,000
2011 7,023,482 (191,720) 2,478,947 520,720
329,000
2012 6,245,767 (777,715) 2,903,154 424,207
(353,508)
2013 6,312,561 66,794 3,705,822 802,668 869,462
3
Other variables, such as economic conditions, the price of natural gas commodity and 4
weather also significantly influence CSR Call volume. A stronger economy improves 5
customers’ ability to pay bills which, in turn, reduces payment related calls. Lower natural gas 6
commodity prices and warmer weather reduce the average customer bill amount. Lower bills 7
result in fewer customer billing concerns, and customers are less likely to call with billing 8
questions. The current period of economic expansion coupled with lower commodity costs and 9
warmer weather have all contributed to a decline in CSR call volume since 2009. In particular, 10
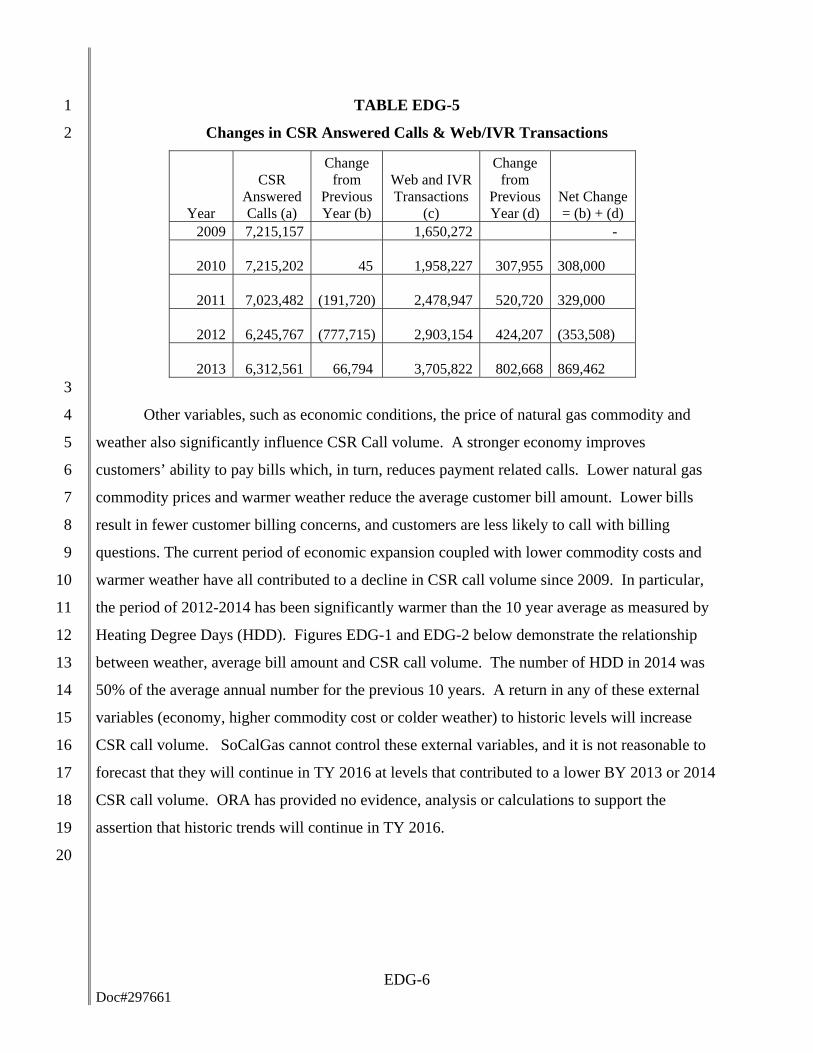
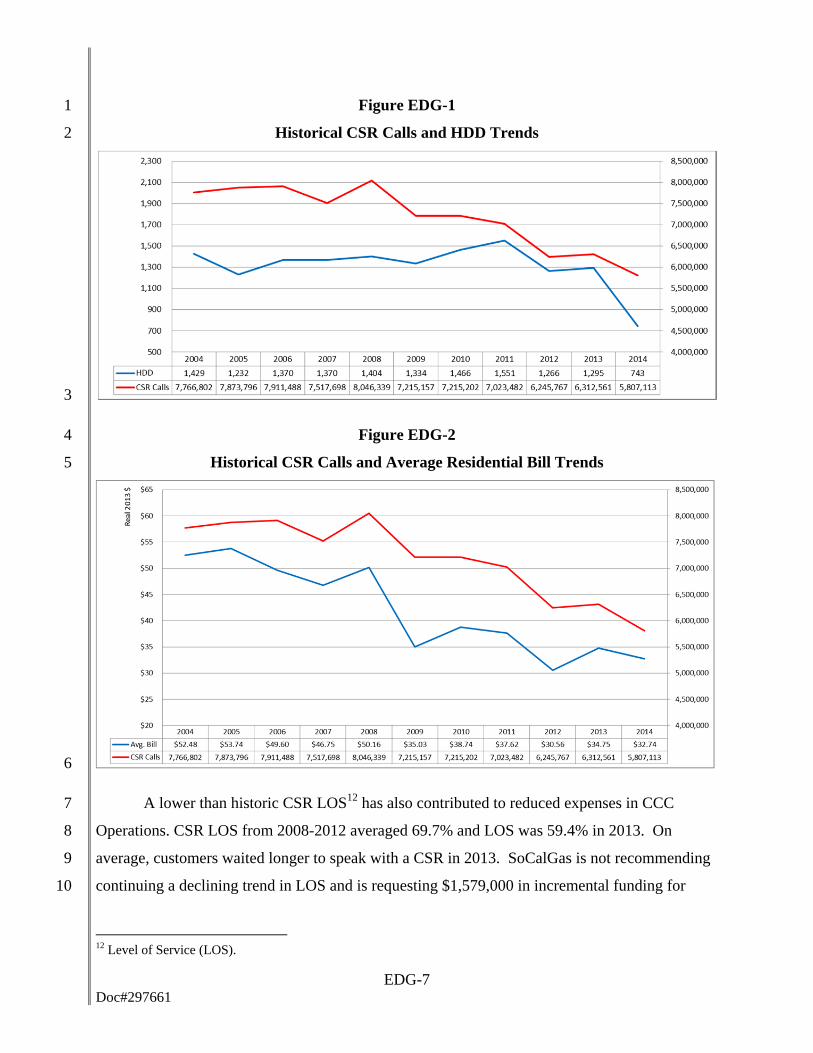
the period of 2012-2014 has been significantly warmer than the 10 year average as measured by 11
Heating Degree Days (HDD). Figures EDG-1 and EDG-2 below demonstrate the relationship 12
between weather, average bill amount and CSR call volume. The number of HDD in 2014 was 13
50% of the average annual number for the previous 10 years. A return in any of these external 14
variables (economy, higher commodity cost or colder weather) to historic levels will increase 15
CSR call volume. SoCalGas cannot control these external variables, and it is not reasonable to 16
forecast that they will continue in TY 2016 at levels that contributed to a lower BY 2013 or 2014 17
CSR call volume. ORA has provided no evidence, analysis or calculations to support the 18
assertion that historic trends will continue in TY 2016. 19
20
EDG-7 Doc#297661
Figure EDG-1 1
Historical CSR Calls and HDD Trends 2
3
Figure EDG-2 4
Historical CSR Calls and Average Residential Bill Trends 5
6
A lower than historic CSR LOS12 has also contributed to reduced expenses in CCC 7
Operations. CSR LOS from 2008-2012 averaged 69.7% and LOS was 59.4% in 2013. On 8
average, customers waited longer to speak with a CSR in 2013. SoCalGas is not recommending 9
continuing a declining trend in LOS and is requesting $1,579,000 in incremental funding for 10
12 Level of Service (LOS).
EDG-8 Doc#297661
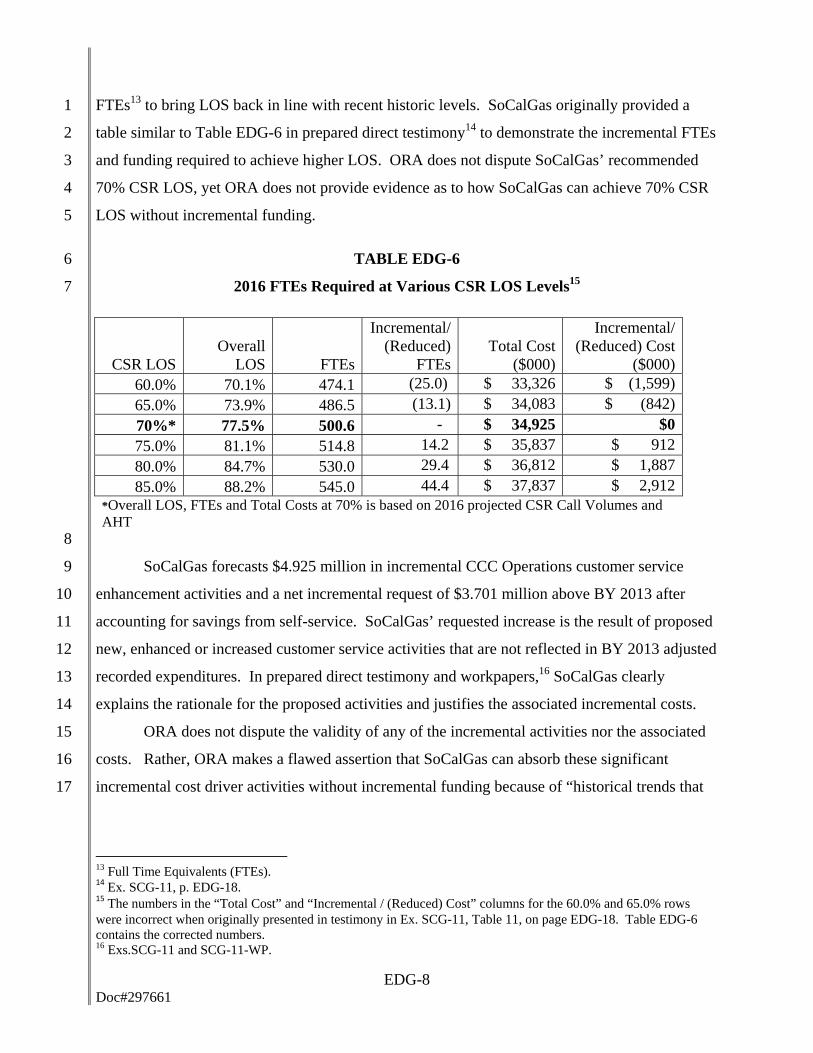
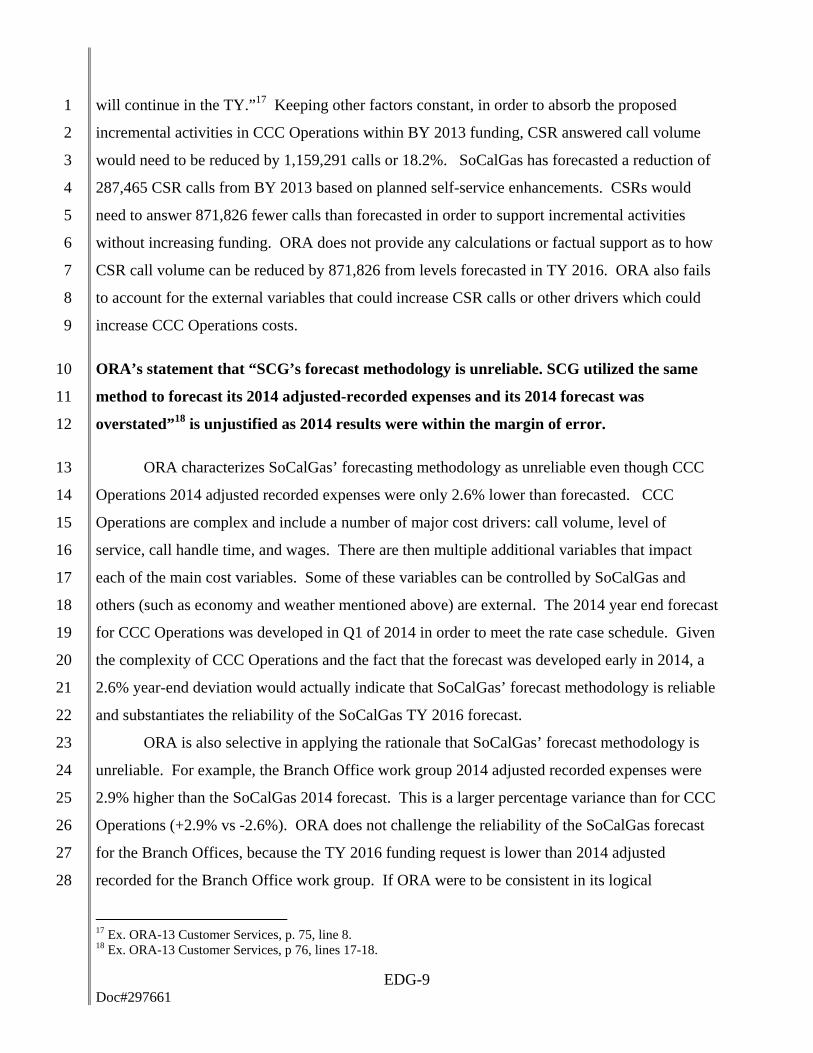
FTEs13 to bring LOS back in line with recent historic levels. SoCalGas originally provided a 1
table similar to Table EDG-6 in prepared direct testimony14 to demonstrate the incremental FTEs 2
and funding required to achieve higher LOS. ORA does not dispute SoCalGas’ recommended 3
70% CSR LOS, yet ORA does not provide evidence as to how SoCalGas can achieve 70% CSR 4
LOS without incremental funding. 5
TABLE EDG-6 6
2016 FTEs Required at Various CSR LOS Levels15 7
CSR LOS Overall
LOS FTEs
Incremental/ (Reduced)
FTEsTotal Cost
($000)
Incremental/ (Reduced) Cost
($000)60.0% 70.1% 474.1 (25.0) $ 33,326 $ (1,599)65.0% 73.9% 486.5 (13.1) $ 34,083 $ (842)70%* 77.5% 500.6 - $ 34,925 $075.0% 81.1% 514.8 14.2 $ 35,837 $ 912 80.0% 84.7% 530.0 29.4 $ 36,812 $ 1,887 85.0% 88.2% 545.0 44.4 $ 37,837 $ 2,912
*Overall LOS, FTEs and Total Costs at 70% is based on 2016 projected CSR Call Volumes and AHT 8
SoCalGas forecasts $4.925 million in incremental CCC Operations customer service 9
enhancement activities and a net incremental request of $3.701 million above BY 2013 after 10
accounting for savings from self-service. SoCalGas’ requested increase is the result of proposed 11
new, enhanced or increased customer service activities that are not reflected in BY 2013 adjusted 12
recorded expenditures. In prepared direct testimony and workpapers,16 SoCalGas clearly 13
explains the rationale for the proposed activities and justifies the associated incremental costs. 14
ORA does not dispute the validity of any of the incremental activities nor the associated 15
costs. Rather, ORA makes a flawed assertion that SoCalGas can absorb these significant 16
incremental cost driver activities without incremental funding because of “historical trends that 17
13 Full Time Equivalents (FTEs). 14 Ex. SCG-11, p. EDG-18. 15 The numbers in the “Total Cost” and “Incremental / (Reduced) Cost” columns for the 60.0% and 65.0% rows were incorrect when originally presented in testimony in Ex. SCG-11, Table 11, on page EDG-18. Table EDG-6 contains the corrected numbers. 16 Exs.SCG-11 and SCG-11-WP.
EDG-9 Doc#297661
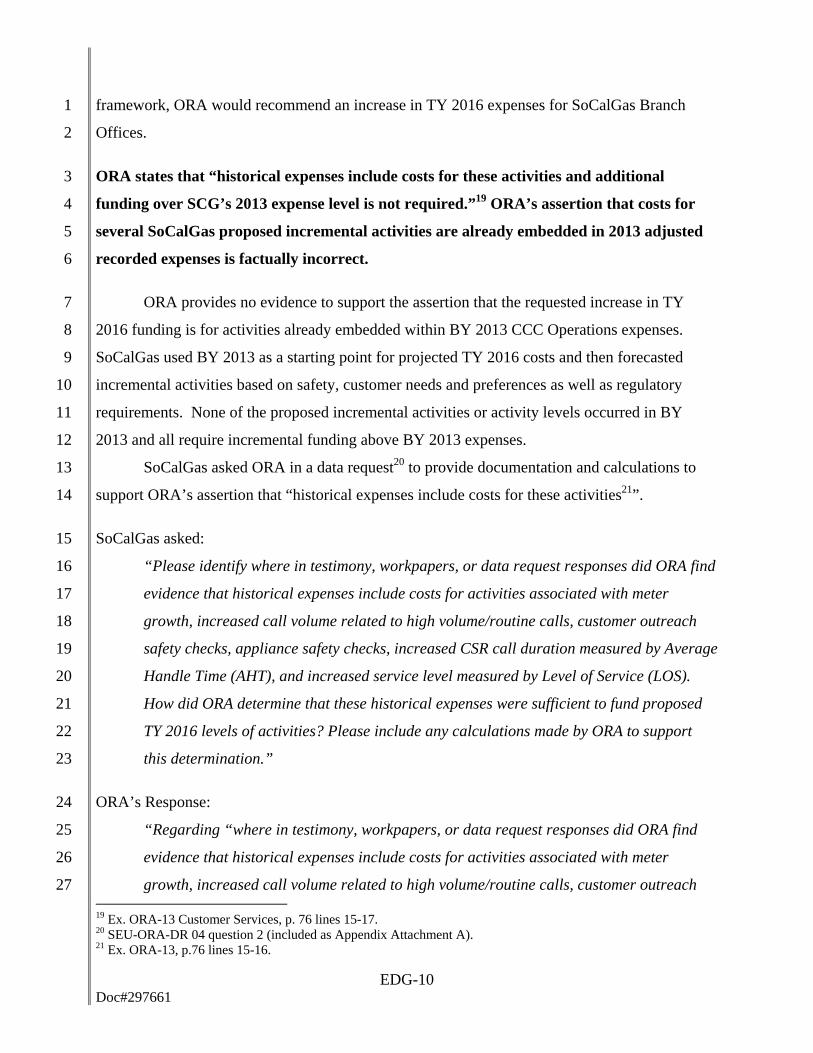
will continue in the TY.”17 Keeping other factors constant, in order to absorb the proposed 1
incremental activities in CCC Operations within BY 2013 funding, CSR answered call volume 2
would need to be reduced by 1,159,291 calls or 18.2%. SoCalGas has forecasted a reduction of 3
287,465 CSR calls from BY 2013 based on planned self-service enhancements. CSRs would 4
need to answer 871,826 fewer calls than forecasted in order to support incremental activities 5
without increasing funding. ORA does not provide any calculations or factual support as to how 6
CSR call volume can be reduced by 871,826 from levels forecasted in TY 2016. ORA also fails 7
to account for the external variables that could increase CSR calls or other drivers which could 8
increase CCC Operations costs. 9
ORA’s statement that “SCG’s forecast methodology is unreliable. SCG utilized the same 10
method to forecast its 2014 adjusted-recorded expenses and its 2014 forecast was 11
overstated”18 is unjustified as 2014 results were within the margin of error. 12
ORA characterizes SoCalGas’ forecasting methodology as unreliable even though CCC 13
Operations 2014 adjusted recorded expenses were only 2.6% lower than forecasted. CCC 14
Operations are complex and include a number of major cost drivers: call volume, level of 15
service, call handle time, and wages. There are then multiple additional variables that impact 16
each of the main cost variables. Some of these variables can be controlled by SoCalGas and 17
others (such as economy and weather mentioned above) are external. The 2014 year end forecast 18
for CCC Operations was developed in Q1 of 2014 in order to meet the rate case schedule. Given 19
the complexity of CCC Operations and the fact that the forecast was developed early in 2014, a 20
2.6% year-end deviation would actually indicate that SoCalGas’ forecast methodology is reliable 21
and substantiates the reliability of the SoCalGas TY 2016 forecast. 22
ORA is also selective in applying the rationale that SoCalGas’ forecast methodology is 23
unreliable. For example, the Branch Office work group 2014 adjusted recorded expenses were 24
2.9% higher than the SoCalGas 2014 forecast. This is a larger percentage variance than for CCC 25
Operations (+2.9% vs -2.6%). ORA does not challenge the reliability of the SoCalGas forecast 26
for the Branch Offices, because the TY 2016 funding request is lower than 2014 adjusted 27
recorded for the Branch Office work group. If ORA were to be consistent in its logical 28
17 Ex. ORA-13 Customer Services, p. 75, line 8. 18 Ex. ORA-13 Customer Services, p 76, lines 17-18.
EDG-10 Doc#297661
framework, ORA would recommend an increase in TY 2016 expenses for SoCalGas Branch 1
Offices. 2
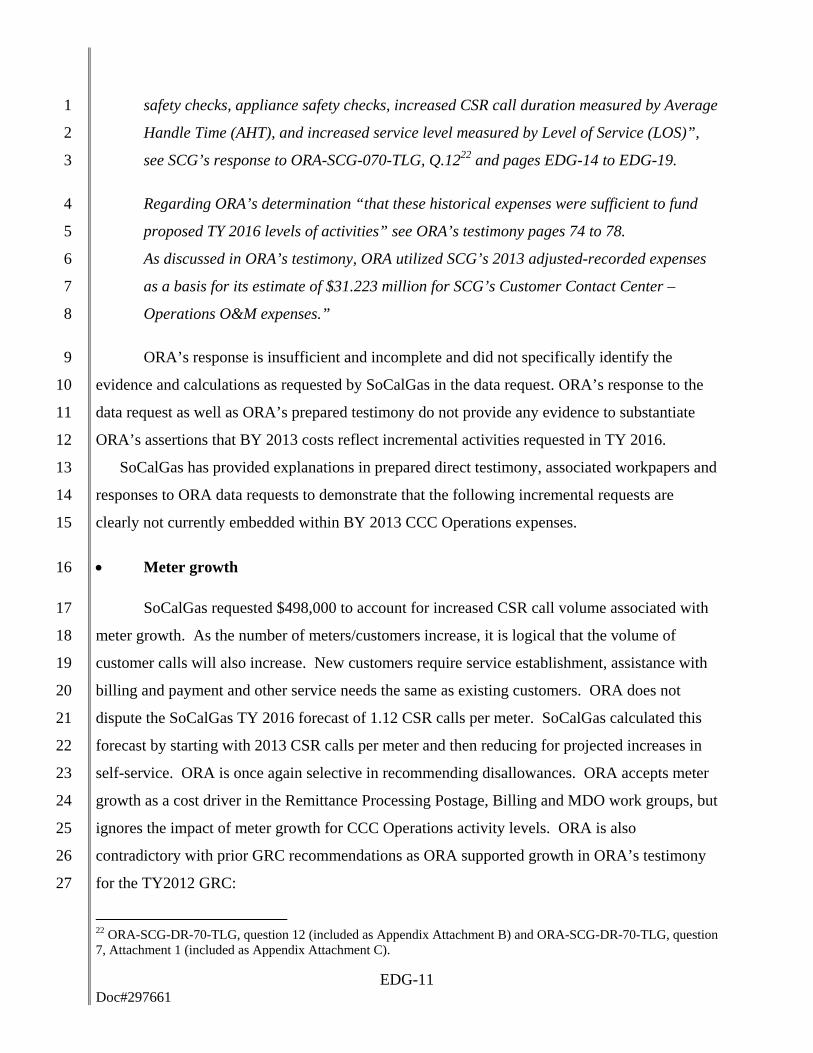
ORA states that “historical expenses include costs for these activities and additional 3
funding over SCG’s 2013 expense level is not required.”19 ORA’s assertion that costs for 4
several SoCalGas proposed incremental activities are already embedded in 2013 adjusted 5
recorded expenses is factually incorrect. 6
ORA provides no evidence to support the assertion that the requested increase in TY 7
2016 funding is for activities already embedded within BY 2013 CCC Operations expenses. 8
SoCalGas used BY 2013 as a starting point for projected TY 2016 costs and then forecasted 9
incremental activities based on safety, customer needs and preferences as well as regulatory 10
requirements. None of the proposed incremental activities or activity levels occurred in BY 11
2013 and all require incremental funding above BY 2013 expenses. 12
SoCalGas asked ORA in a data request20 to provide documentation and calculations to 13
support ORA’s assertion that “historical expenses include costs for these activities21”. 14
SoCalGas asked: 15
“Please identify where in testimony, workpapers, or data request responses did ORA find 16
evidence that historical expenses include costs for activities associated with meter 17
growth, increased call volume related to high volume/routine calls, customer outreach 18
safety checks, appliance safety checks, increased CSR call duration measured by Average 19
Handle Time (AHT), and increased service level measured by Level of Service (LOS). 20
How did ORA determine that these historical expenses were sufficient to fund proposed 21
TY 2016 levels of activities? Please include any calculations made by ORA to support 22
this determination.” 23
ORA’s Response: 24
“Regarding “where in testimony, workpapers, or data request responses did ORA find 25
evidence that historical expenses include costs for activities associated with meter 26
growth, increased call volume related to high volume/routine calls, customer outreach 27 19 Ex. ORA-13 Customer Services, p. 76 lines 15-17. 20 SEU-ORA-DR 04 question 2 (included as Appendix Attachment A). 21 Ex. ORA-13, p.76 lines 15-16.
EDG-11 Doc#297661
safety checks, appliance safety checks, increased CSR call duration measured by Average 1
Handle Time (AHT), and increased service level measured by Level of Service (LOS)”, 2
see SCG’s response to ORA-SCG-070-TLG, Q.1222 and pages EDG-14 to EDG-19. 3
Regarding ORA’s determination “that these historical expenses were sufficient to fund 4
proposed TY 2016 levels of activities” see ORA’s testimony pages 74 to 78. 5
As discussed in ORA’s testimony, ORA utilized SCG’s 2013 adjusted-recorded expenses 6
as a basis for its estimate of $31.223 million for SCG’s Customer Contact Center – 7
Operations O&M expenses.” 8
ORA’s response is insufficient and incomplete and did not specifically identify the 9
evidence and calculations as requested by SoCalGas in the data request. ORA’s response to the 10
data request as well as ORA’s prepared testimony do not provide any evidence to substantiate 11
ORA’s assertions that BY 2013 costs reflect incremental activities requested in TY 2016. 12
SoCalGas has provided explanations in prepared direct testimony, associated workpapers and 13
responses to ORA data requests to demonstrate that the following incremental requests are 14
clearly not currently embedded within BY 2013 CCC Operations expenses. 15
Meter growth 16
SoCalGas requested $498,000 to account for increased CSR call volume associated with 17
meter growth. As the number of meters/customers increase, it is logical that the volume of 18
customer calls will also increase. New customers require service establishment, assistance with 19
billing and payment and other service needs the same as existing customers. ORA does not 20
dispute the SoCalGas TY 2016 forecast of 1.12 CSR calls per meter. SoCalGas calculated this 21
forecast by starting with 2013 CSR calls per meter and then reducing for projected increases in 22
self-service. ORA is once again selective in recommending disallowances. ORA accepts meter 23
growth as a cost driver in the Remittance Processing Postage, Billing and MDO work groups, but 24
ignores the impact of meter growth for CCC Operations activity levels. ORA is also 25
contradictory with prior GRC recommendations as ORA supported growth in ORA’s testimony 26
for the TY2012 GRC: 27
22 ORA-SCG-DR-70-TLG, question 12 (included as Appendix Attachment B) and ORA-SCG-DR-70-TLG, question 7, Attachment 1 (included as Appendix Attachment C).
EDG-12 Doc#297661
“DRA does not object to expenses necessary to maintain service levels with customer 1
growth and to ensure SCG’s customer service personnel operate efficiently and 2
effectively.”23 3
Customer outreach safety checks and expanded appliance safety checks 4
SoCalGas requested $216,000 ($169,000 and $47,000) for increased call volume and 5
increased handle time for new customer outreach safety checks and expanded appliance safety 6
checks in TY 2016.24 These activities are new and incremental, and ORA’s assertion that these 7
activities are embedded in BY 2013 costs is incorrect. ORA does not dispute the forecast 8
methodology for additional CSR answered calls and AHT forecasted for these new activities. If 9
these incremental activities are approved for the Customer Service Field organization, the 10
associated CCC costs must also be approved in order to implement these new activities. 11
Increased CSR call duration measured by Average Handle Time (AHT) 12
SoCalGas requested $441,000 for CSRs to provide incremental value added customer 13
services such as collecting customer communication preferences (customer desire to be notified 14
by email, text, etc.) and signing customers up for My Account (important to achieving paperless 15
billing and self-service targets). Incremental AHT was shown explicitly in prepared direct 16
testimony and workpapers.25 These activities were not performed in BY 2013 and are 17
incremental to BY 2013 adjusted recorded expenses. ORA does not dispute the validity of the 18
additional handle time activities, but does not allow for the incremental funding required to 19
achieve them. 20
Increased service level measured by Level of Service (LOS) 21
CSR LOS was 59.4% in 2013 and SoCalGas has proposed a 70% CSR LOS in TY 2016. 22
As described in prepared direct testimony26 and as discussed above, 70% LOS is based on the 23
five year average from 2008-2012, which SoCalGas believes is appropriate. ORA does not 24
dispute 70% as a reasonable level for LOS, but does not allow for the associated incremental 25
23 A.10-12-005/006 Ex. DRA-48, p. 3, lines 18-20. 24 Ex. SCG-10, pp. SAF-15 to SAF-17; Ex. SCG-11, p. EDG-18. 25 Ex. SCG-11-WP, p. 10-12. 26 Ex. SCG-11, p. EDG-16, line 15 through p. EDG-17, line 12.
EDG-13 Doc#297661
funding required to reach a 70% LOS. SoCalGas requested $1,579,000 above BY 2013 adjusted 1
recorded for additional FTEs required to support a 70% CSR LOS. It is not logical for ORA to 2
assume that SoCalGas can achieve a 70% LOS with the same funding that resulted in 59.4% 3
LOS in 2013. Table EDG-6 above demonstrates the funding required to achieve the higher LOS. 4
ORA completely ignores other cost drivers requested in prepared direct testimony 5
In addition to the items above that ORA claims are included in BY 2013 historical costs, 6
SoCalGas proposed other activities in TY 2016 that are incremental cost drivers above BY 2013 7
adjusted recorded. ORA has failed to address how these incremental or increased activities 8
should be funded. 9
BY 2013 numbers reflect partial year staffing of 2 supervisor positions and 1 clerical 10
position. SoCalGas requested $96,000 in labor for the full year staffing impact of positions that 11
were staffed for only part of the year in 2013. Since SoCalGas utilized a base year forecast as 12
the starting point for the CCC Operations instead of a historical average, it is necessary to 13
account for full year historical expenses for positions that were staffed for less than twelve 14
months in 2013. These two supervisor positions and one administrative support position are 15
necessary to maintain CCC Operations performance in TY 2016. The positions have been filled 16
and are expected to remain filled for the entire year in TY 2016. Therefore, these positions 17
should be funded based on full year expense levels. ORA is also selective in not allowing 18
adjustments for full year staffing in CCC Operations as ORA has accepted incremental staffing 19
adjustment forecasts in Billing, Credit & Collections and Major Market Credit and Collections 20
work groups. 21
SoCalGas also requested $45,000 in non-labor to account for an increase in employee 22
non-labor costs associated with an increase in the number of FTEs. ORA did not contest using 23
BY 2013 average non labor dollars per employee to forecast TY 2016 incremental non labor 24
expenses. Since SoCalGas is forecasting incremental FTEs due to increased activities, 25
incremental non-labor costs are required to support items such as office equipment, office 26
furniture, headsets and travel for the incremental FTEs. 27
28
EDG-14 Doc#297661
ORA’s assertion that “SCG can reallocate the costs incurred for overtime in the TY for its 1
proposed 56 positions”27 is factually incorrect. 2
ORA does not understand that some use of overtime is mandated by collective bargaining 3
agreement and other use of overtime within CCC Operations actually helps contain CCC 4
Operations costs. Overtime is primarily used in CCC Operations in 3 scenarios: 5
1. Holiday staffing – The CCC is staffed to answer customer calls 365 days a year and 6
therefore both CSRs and Lead CSRs are required to work on 11 company 7
holidays. CSRs and Lead CSRs are paid overtime for hours worked on 8
holidays. Overtime pay for holiday staffing is part of the collective bargaining agreement 9
and cannot be avoided or reallocated to incremental CCC Operations positions. Overtime 10
incurred in BY 2013 for holiday staffing amounted to almost $320,000. 11
2. Unplanned absences for lead CSRs on weekends - SoCalGas has Lead CSR positions at 12
both contact center sites. Lead CSRs assist the general population of CSRs with 13
understanding procedures, advise CSRs on handling complex calls and answer escalated 14
customer calls. When a Lead CSR has an unplanned absence and is unable to work their 15
assigned weekend schedule, another lead must fill-in on the shift. Since Lead CSRs are 16
planned and scheduled for a 40 hour week, they must be paid overtime rates for fill-in 17
shifts where total hours exceed 40. Overtime expense incurred in BY 2013 for unplanned 18
weekend Lead CSR absences was almost $117,000. 19
3. High call volume days during peak season – Call volumes fluctuate throughout the year. 20
Winter months have significantly higher call volumes than summer months due to 21
incremental seasonal orders and customer concerns about higher bills. As a result, the 22
number of FTEs required to answer calls is significantly higher in winter than in summer. 23
If incremental headcount was added instead of using overtime to meet peak month call 24
volumes, those resources would not be fully utilized during non-peak periods. Overtime 25
in BY 2013 for peak season staffing amounted to 10,408 hours and almost $586,000. 26
2013 peak season would have required 15 incremental CSRs had overtime not been used. 27
The cost of 15 incremental CSRs in BY 2013 for one year would have been almost 28
$927,000 which is $341,000 more than BY 2013 seasonal overtime expenses. SoCalGas 29
27 Ex. ORA-13 Customer Services, p 76, lines 20-21.
EDG-15 Doc#297661
believes that overtime is a more efficient and less costly option to meet peak seasonal call 1
volumes. 2
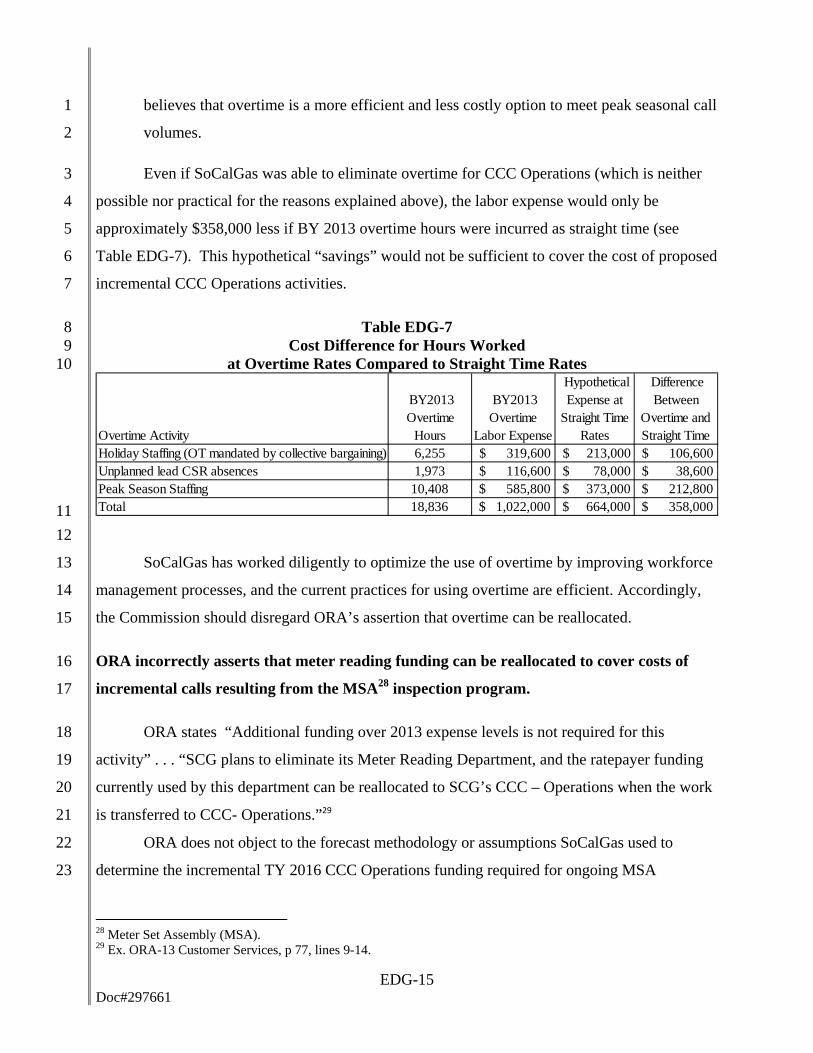
Even if SoCalGas was able to eliminate overtime for CCC Operations (which is neither 3
possible nor practical for the reasons explained above), the labor expense would only be 4
approximately $358,000 less if BY 2013 overtime hours were incurred as straight time (see 5
Table EDG-7). This hypothetical “savings” would not be sufficient to cover the cost of proposed 6
incremental CCC Operations activities. 7
Table EDG-7 8 Cost Difference for Hours Worked 9
at Overtime Rates Compared to Straight Time Rates 10
11
12
SoCalGas has worked diligently to optimize the use of overtime by improving workforce 13
management processes, and the current practices for using overtime are efficient. Accordingly, 14
the Commission should disregard ORA’s assertion that overtime can be reallocated. 15
ORA incorrectly asserts that meter reading funding can be reallocated to cover costs of 16
incremental calls resulting from the MSA28 inspection program. 17
ORA states “Additional funding over 2013 expense levels is not required for this 18
activity” . . . “SCG plans to eliminate its Meter Reading Department, and the ratepayer funding 19
currently used by this department can be reallocated to SCG’s CCC – Operations when the work 20
is transferred to CCC- Operations.”29 21
ORA does not object to the forecast methodology or assumptions SoCalGas used to 22
determine the incremental TY 2016 CCC Operations funding required for ongoing MSA 23
28 Meter Set Assembly (MSA). 29 Ex. ORA-13 Customer Services, p 77, lines 9-14.
Overtime Activity
BY2013 Overtime
Hours
BY2013 Overtime
Labor Expense
Hypothetical Expense at
Straight Time Rates
Difference Between
Overtime and Straight Time
Holiday Staffing (OT mandated by collective bargaining) 6,255 $ 319,600 $ 213,000 $ 106,600 Unplanned lead CSR absences 1,973 $ 116,600 $ 78,000 $ 38,600 Peak Season Staffing 10,408 $ 585,800 $ 373,000 $ 212,800 Total 18,836 $ 1,022,000 $ 664,000 $ 358,000
EDG-16 Doc#297661
inspections post-AMI30 implementation. Rather, ORA incorrectly asserts that Meter Reading 1
funding (which will not exist after AMI deployment is completed) can be used for this purpose. 2
ORA fails to understand that the Meter Reading expenses that incorporate components of the 3
current MSA inspection process have or will be eliminated as SoCalGas completes AMI 4
deployment31. The Meter Reading costs to which ORA refers are treated as a benefit and 5
eliminated pursuant to the Commission’s AMI decision (D.10-04-027). When AMI deployment 6
is completed, no embedded Meter Reading costs will exist to be reallocated to handling calls for 7
the new MSA Inspection Program. If the Commission disallows incremental funding for MSA 8
inspections and reallocates Meter Reading costs that are eliminated as a result of AMI, then the 9
Commission has effectively disallowed Meter Reading costs and a double benefit occurs. The 10
Commission recognized this fact in D.10-04-027, wherein the Commission states: 11
11.2.3.5.3. Discussion 12 We agree with SoCalGas’ position on the test year 2012 forecasts of the meter reading 13 costs, and that DRA’s recommended disallowances should not be adopted. As SoCalGas’ 14 witness explained in Exhibit 143, the test year 2012 forecast of metering reading 15 expenses do not include the SoCalGas advanced metering infrastructures costs or 16 benefits. D.10-04-027 includes the meter reading benefits which reflect the increases 17 requested and authorized in SoCalGas’ test year 2008 GRC. “To remain consistent with 18 the benefits approved and authorized in…D.10-04-027,” SoCalGas included the 19 expenses authorized in SoCalGas’ 2008 GRC in the test year 2012 forecast. (Ex. 143 at 20 45.) As explained by SoCalGas: 21
To ensure that neither SCG nor ratepayers are disadvantaged from the TY 2012 22 authorization for estimated operational expenses, SCG will reconcile the final TY 23 2012 GRC authorization with the SCG AMI operating benefits assumed in D.10-24 04-027. SCG will then adjust the SCG AMI operating benefits multiplier factor 25 accordingly in an updated SCG AMI revenue requirements AL to reflect the 26 outcome of the TY 2012 GRC. (Ex. 143 at 46.) 27
If we adopt the two disallowances recommended by DRA, this will result in a double 28 reduction to SoCalGas’ revenue requirement. Since the DRA disallowances are part of 29 the operating benefits in SoCalGas’ advanced metering infrastructure program, the 30 adjustment process described above will ensure that ratepayers are not disadvantaged by 31 having these costs included in the test year 2012 forecast. Accordingly, DRA’s 32 recommendation to disallow the $440,000 for additional management personnel, and 33 $636,000 for meter reading staff, is not adopted. 34
30 Advanced Metering Infrastructure (AMI). 31 Please see Ex SCG-239, Rebuttal Testimony of Witness Rene F. Garcia for details on why SoCalGas cannot reallocate meter reading funding for MSA inspections as AMI-related meter reading savings are already accounted for in customer rates.
EDG-17 Doc#297661
Based on all of the evidence, we find SoCalGas’ forecast of meter reading expenses in the 1 amount of $32.917 million to be reasonable.32 2
ORA makes an unfounded recommendation to deny SoCalGas’ request for funding for 3
CSRs to enroll customers into CARE because “The Commission ordered utilities, including 4
SCG, to seek funding for this activity through the Low Income Programs proceeding.”33 5
ORA’s assertion that SoCalGas was ordered to recover funding for CSRs to enroll 6
customers in CARE34 through the Low Income Programs proceeding is not supported by 7
evidence and does not constitute justification for denying the proposed funding in this GRC. In 8
making this recommendation, ORA has either failed to understand or else simply ignored the 9
explanation provided by SoCalGas. First, SoCalGas is not aware of any Commission order that 10
SoCalGas will be granted approval through the Low Income Programs proceeding for CARE 11
enrollment using CSRs. The Settlement Agreement in the Residential Disconnection Proceeding 12
contained a provision indicating that utilities that do not currently provide access to a live 13
representative for CARE enrollment will “seek” funding through the Low Income Programs 14
proceeding. SoCalGas has complied with this provision, but ORA fails to recognize that the 15
Commission is not required to approve funding through the Low Income Programs proceeding 16
for SoCalGas. In prior instances, such a request has been denied, and although more recently 17
this has been approved for other utilities, the Commission has yet to specifically approve funding 18
for SoCalGas. 19
As explained by SoCalGas in prepared direct testimony,35 a similar funding request for 20
CSRs to enroll customers in CARE was made in the GRC in the event the Commission prefers to 21
consider such funding in the context of a GRC. ORA requested clarification in a data request36 22
as to why SoCalGas was requesting funding for CSR CARE enrollment in two different 23
proceedings. SoCalGas provided the following response: 24
SoCalGas clarifies that that the statement quoted from page EDG-23 is contained in the 25 Settlement Agreement that was adopted by D.14-06-036. 26
32 D.10-04-027 page. 507-508. 33 Ex. ORA-13 Customer Services, p. 77, line 20 through p. 78, line 2. 34 California Alternative Rates for Energy (CARE). 35 Ex. SCG-11, p. EDG-22, lines 20-23. 36 ORA-SCG-DR-70-TLG, question 1b (included as Appendix Attachment D).
EDG-18 Doc#297661
SoCalGas is compliant with the Settlement Agreement provision to propose CSR funding for 1 CARE enrollment in its Low Income Programs application (A.) 14-11-011 2
The Commission, in D.05-04-052, did not allow call center costs to be charged to the CARE 3 Program. Although more recently, in D.12-08-044, the Commission authorized Southern 4 California Edison to recover these costs through the Low Income Proceeding, the 5 Commission has not yet authorized this treatment for SoCalGas. SoCalGas has thus made a 6 concurrent request in its test year 2016 GRC in the event the Commission rejects the funding 7 request in A.14-11-011. This ensures the proposal receives consideration and can be acted 8 upon in the proceeding deemed prudent by the Commission. 9
SoCalGas also indicated the following in A.14-11-011, the testimony of SoCalGas witnesses 10 Carmen Rudshagen and Hugh Yao: 11
SoCalGas has also requested concurrent funding for this effort as part of its Test Year 2016 12 General Rate Case (“GRC”) Application to be filed in November 2014. Should funding be 13 approved as part of this Low-Income Application proceeding, SoCalGas will remove its 14 funding request for this effort in the GRC. 15
SoCalGas is thus clear and explicit that it does not propose “double recovery” of the 16 proposed costs. 17
Again, SoCalGas is not seeking double recovery for CSR CARE enrollment and only seeks 18
to ensure funding is authorized for this important Commission mandated activity in either this 19
GRC proceeding or in the Low Income proceeding. SoCalGas has committed to removing the 20
CSR CARE incremental request if the funding for CARE CSRs is approved in the above 21
SoCalGas CARE application, A.14-11-011. It should also be noted that ORA does not dispute 22
the validity of the CSR CARE enrollment activity or SoCalGas’ projection of the required 23
incremental FTEs and associated costs. 24
ORA’s cost reallocation assumptions for CCC Operations do not add up. 25
SoCalGas requested $3.701 million ($4.995 million additional expense offset by $1.224 26
million savings) for incremental CCC Operations activities in TY 2016. ORA proposed denying 27
the incremental funding based on disallowance of costs for one activity (CSR CARE enrollment) 28
and then reallocating funding to support the remainder of SoCalGas proposed incremental 29
activities. ORA has failed to provide calculations demonstrating how costs can be reallocated. 30
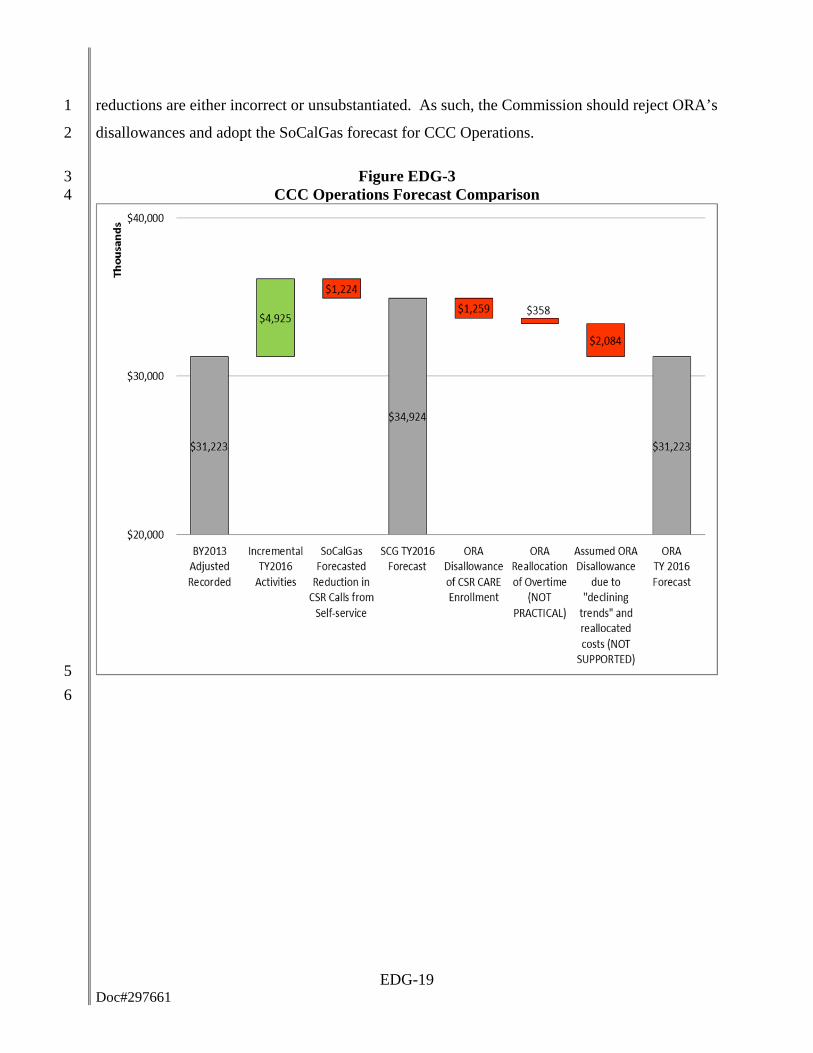
Figure EDG-3 identifies ORA’s proposed reductions. SoCalGas has provided evidence to 31
support incremental requests and also demonstrated that ORA’s assumptions for proposed 32
EDG-19 Doc#297661
reductions are either incorrect or unsubstantiated. As such, the Commission should reject ORA’s 1
disallowances and adopt the SoCalGas forecast for CCC Operations. 2
Figure EDG-3 3 CCC Operations Forecast Comparison 4
5
6
EDG-20 Doc#297661
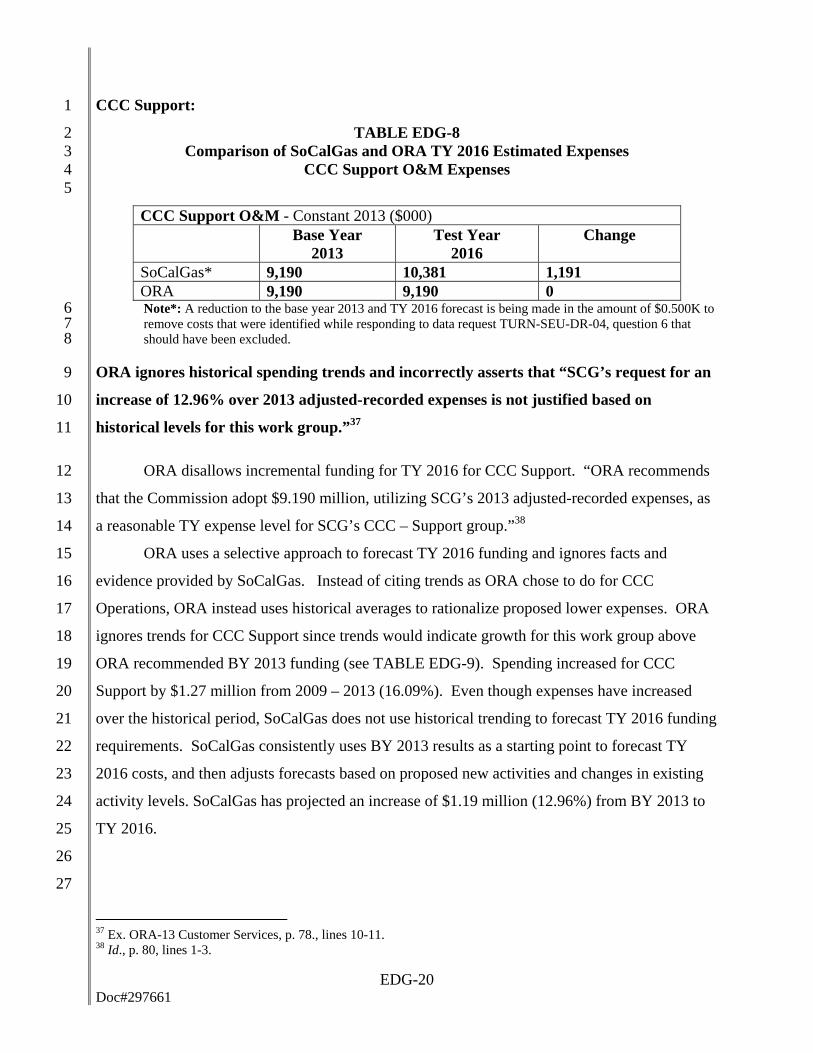
CCC Support: 1
TABLE EDG-8 2 Comparison of SoCalGas and ORA TY 2016 Estimated Expenses 3
CCC Support O&M Expenses 4 5
CCC Support O&M - Constant 2013 ($000)
Base Year
2013 Test Year
2016 Change
SoCalGas* 9,190 10,381 1,191 ORA 9,190 9,190 0 Note*: A reduction to the base year 2013 and TY 2016 forecast is being made in the amount of $0.500K to 6 remove costs that were identified while responding to data request TURN-SEU-DR-04, question 6 that 7 should have been excluded. 8
ORA ignores historical spending trends and incorrectly asserts that “SCG’s request for an 9
increase of 12.96% over 2013 adjusted-recorded expenses is not justified based on 10
historical levels for this work group.”37 11
ORA disallows incremental funding for TY 2016 for CCC Support. “ORA recommends 12
that the Commission adopt $9.190 million, utilizing SCG’s 2013 adjusted-recorded expenses, as 13
a reasonable TY expense level for SCG’s CCC – Support group.”38 14
ORA uses a selective approach to forecast TY 2016 funding and ignores facts and 15
evidence provided by SoCalGas. Instead of citing trends as ORA chose to do for CCC 16
Operations, ORA instead uses historical averages to rationalize proposed lower expenses. ORA 17
ignores trends for CCC Support since trends would indicate growth for this work group above 18
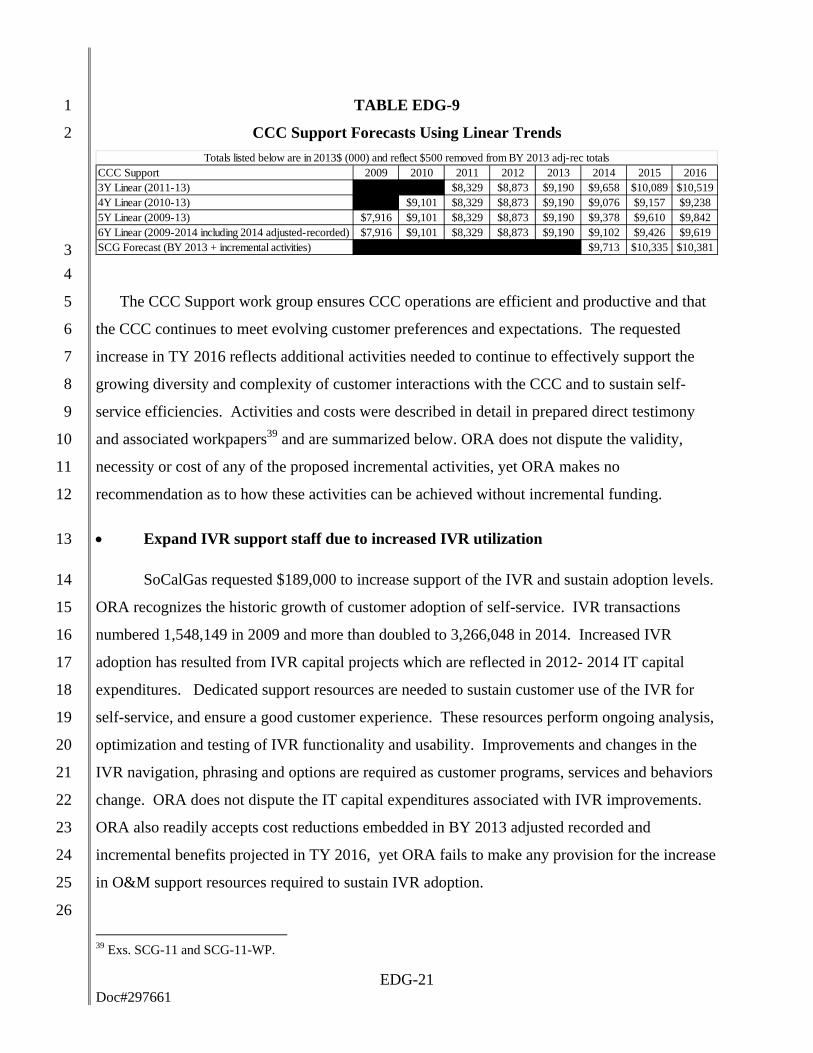
ORA recommended BY 2013 funding (see TABLE EDG-9). Spending increased for CCC 19
Support by $1.27 million from 2009 – 2013 (16.09%). Even though expenses have increased 20
over the historical period, SoCalGas does not use historical trending to forecast TY 2016 funding 21
requirements. SoCalGas consistently uses BY 2013 results as a starting point to forecast TY 22
2016 costs, and then adjusts forecasts based on proposed new activities and changes in existing 23
activity levels. SoCalGas has projected an increase of $1.19 million (12.96%) from BY 2013 to 24
TY 2016. 25
26
27
37 Ex. ORA-13 Customer Services, p. 78., lines 10-11. 38 Id., p. 80, lines 1-3.
EDG-21 Doc#297661
TABLE EDG-9 1
CCC Support Forecasts Using Linear Trends 2
3
4
The CCC Support work group ensures CCC operations are efficient and productive and that 5
the CCC continues to meet evolving customer preferences and expectations. The requested 6
increase in TY 2016 reflects additional activities needed to continue to effectively support the 7
growing diversity and complexity of customer interactions with the CCC and to sustain self-8
service efficiencies. Activities and costs were described in detail in prepared direct testimony 9
and associated workpapers39 and are summarized below. ORA does not dispute the validity, 10
necessity or cost of any of the proposed incremental activities, yet ORA makes no 11
recommendation as to how these activities can be achieved without incremental funding. 12
Expand IVR support staff due to increased IVR utilization 13
SoCalGas requested $189,000 to increase support of the IVR and sustain adoption levels. 14
ORA recognizes the historic growth of customer adoption of self-service. IVR transactions 15
numbered 1,548,149 in 2009 and more than doubled to 3,266,048 in 2014. Increased IVR 16
adoption has resulted from IVR capital projects which are reflected in 2012- 2014 IT capital 17
expenditures. Dedicated support resources are needed to sustain customer use of the IVR for 18
self-service, and ensure a good customer experience. These resources perform ongoing analysis, 19
optimization and testing of IVR functionality and usability. Improvements and changes in the 20
IVR navigation, phrasing and options are required as customer programs, services and behaviors 21
change. ORA does not dispute the IT capital expenditures associated with IVR improvements. 22
ORA also readily accepts cost reductions embedded in BY 2013 adjusted recorded and 23
incremental benefits projected in TY 2016, yet ORA fails to make any provision for the increase 24
in O&M support resources required to sustain IVR adoption. 25
26
39 Exs. SCG-11 and SCG-11-WP.
CCC Support 2009 2010 2011 2012 2013 2014 2015 20163Y Linear (2011-13) $7,916 $9,101 $8,329 $8,873 $9,190 $9,658 $10,089 $10,5194Y Linear (2010-13) $7,916 $9,101 $8,329 $8,873 $9,190 $9,076 $9,157 $9,2385Y Linear (2009-13) $7,916 $9,101 $8,329 $8,873 $9,190 $9,378 $9,610 $9,8426Y Linear (2009-2014 including 2014 adjusted-recorded) $7,916 $9,101 $8,329 $8,873 $9,190 $9,102 $9,426 $9,619SCG Forecast (BY 2013 + incremental activities) $7,916 $9,101 $8,329 $8,873 $9,190 $9,713 $10,335 $10,381
Totals listed below are in 2013$ (000) and reflect $500 removed from BY 2013 adj-rec totals
EDG-22 Doc#297661
SoCalGas filled the IVR lead position in November 2014 and the IVR advisor position in 1
Q1 2015. Costs for these IVR positions are not reflected in BY 2013 and are only minimally 2
reflected in 2014 adjusted recorded. These resources currently support and will continue to 3
support the IVR in TY 2016. ORA’s expectation that SoCalGas can sustain the level of IVR 4
effectiveness without continued investment in IVR support is misguided. 5
Expand the Special Investigations team 6
SoCalGas requested $569,000 to expand the capabilities of the Special Investigations 7
team in order to comprehensively handle customer issues, complaints and escalations. New 8
resources are required to conduct broad, trend-based analysis based on multiple sources of 9
customer feedback data. The incremental need was recognized during a 2013 Lean-Six-Sigma 10
project to identify customer comment tracking process improvements. Due to resource 11
constraints, customer complaints, issues and escalations from the contact center, branch offices, 12
and local district offices are currently addressed on a case-by-case basis. No evaluation is 13
currently performed to identify trends, recurring process errors or other systemic issues that 14
impact service. Additionally, the growth of social media and other expanded customer feedback 15
channels has increased awareness of SoCalGas’ need for a root cause approach to identify and 16
proactively address customer issues. By expanding the Investigations Team to include analysts 17
who can track trends and identify opportunities to optimize SoCalGas’ systems or procedures, 18
SoCalGas can increase overall customer service levels and satisfaction. Costs are not reflected 19
in BY 2013 adjusted recorded results because this request is for additional resources to perform 20
new analysis and also expand assistance with social media and executive complaints40 beyond 21
normal business hours. 22
Add online web chat capability 23
SoCalGas requested $185,000 to provide responsive service to customers through an 24
online web chat service. Chat functionality is a common feature offered by major service 25
organizations including: SCE, SDG&E, other electric and gas utilities, and telephone and cable 26
television providers. Chat will allow SoCalGas to provide immediate assistance to a customer 27
40 Executive Complaints are phone calls, letters and emails directed toward SoCalGas company executives that are handled by Special Investigations team supervisors.
EDG-23 Doc#297661
interacting with SoCalGas on the web by enabling online communication between the customer 1
and a company representative. SoCalGas customers have also expressed a positive view of web 2
chat as an option for customer service.41 Chat is a forecasted activity for late 2015 and requires 3
incremental software technology licensing that is not reflected in SoCalGas BY 2013 adjusted 4
recorded results. 5
Increase Quality Assurance support 6
SoCalGas requested $301,000 to improve CSR Quality Assurance (“QA”) call 7
monitoring. Currently, the QA team monitors 0.25% of the total volume of incoming CSR 8
handled calls or approximately 15,000 calls per year. This equates to QA reviews of 9
approximately 27 calls per year for each CSR. Contact center industry guidance suggests the 10
ideal volume of QA monitored calls is 0.75% - 1% of total CSR calls. SoCalGas requested 11
additional resources to double the amount of calls that receive quality assurance reviews to 12
increase compliance and improve customer satisfaction. Since this request is to expand the 13
number of resources that perform QA activities, costs are not reflected in BY 2013 adjusted 14
recorded results. 15
Adjustments for full year staffing to the Customer Experience team 16
SoCalGas requested $107,000 to account for full year staffing of the Customer 17
Experience team for two positions that were not fully staffed in BY 2013. The positions have 18
been filled and are expected to remain filled in TY 2016. Therefore, these positions should be 19
funded based on full year expense levels. ORA is again selective in not allowing adjustments for 20
full year staffing of these positions in CCC Support while accepting incremental staffing 21
adjustment forecasts in Billing, Credit & Collections and Major Market Credit and Collections 22
work groups. 23
Incremental software maintenance and hosting fees 24
SoCalGas requested $35,000 for additional channel analytics software maintenance and 25
hosting fees. This software is used to analyze customer behavior in CSR and self-service 26
41 SoCalGas conducted a primary research residential customer insight panel to determine customer attitudes and preferences for web chat. Please see APPENDIX Attachment E for the SCG Customer Insight Panel-Residential.
EDG-24 Doc#297661
channels and identify areas for improvement. Licensing costs have increased as a result of 1
higher utilization of self-service channels and also the increased variety of data used to analyze 2
customer behavior. SoCalGas purchased additional licensing in 201442 which has increased 3
maintenance and hosting fees. These incremental fees are expected to continue in TY 2016, and 4
they are not reflected BY 2013 expenses. 5
Increase in telecommunications costs 6
SoCalGas requested $22,000 for a net increase in telecommunication carrier costs 7
resulting from higher combined CSR offered and IVR answered call volume and increased call 8
handle time. BY 2013 telecommunication expenses only reflect the call volume and call handle 9
time for calls received in 2013. Incremental costs associated with a projected increase in the 10
combination of CSR and IVR calls are not embedded in BY 2013 adjusted recorded expenses. 11
Increase in telecommunications costs related to CARE enrollment 12
SoCalGas requested $28,000 in telecommunication carrier costs resulting from increased 13
call handle time for CSRs to enroll customers in CARE. As stated above, SoCalGas has 14
committed to removing the CSR CARE enrollment incremental request if funding for this 15
activity is approved in the SoCalGas CARE application, A.14-11-011. CSR CARE enrollment 16
did not take place in 2013 and associated telecommunications costs are not embedded in BY 17
2013 adjusted recorded expenses. 18
Cost reductions due to automating Outbound Dialing (“OBD”) calls 19
SoCalGas projected a reduction of $245,000 due to automation of the OBD 48 hour 20
notification process resulting in a reduced need for staffing of OBD positions. These reductions 21
were forecasted to occur beginning in 2015 but were realized earlier than projected. The early 22
benefit realization contributed to lower than projected expenses in CCC Support in 2014. 23
42 The specific software license agreements were provided to ORA in response to a data request: ORA-SCG-DR-070-TLG_Q7_Attachment 4-CONFIDENTIAL.pdf .
EDG-25 Doc#297661
Customer Service Other Office Operations and Technology 1
TABLE EDG-10 2 Comparison of SoCalGas and ORA TY 2016 Estimated Expenses 3
CS Other Office Operations and Technology O&M Expenses 4 5
CS Other Office Operations and Technology O&M - Constant 2013 ($000)
Base Year
2013 Test Year
2016 Change
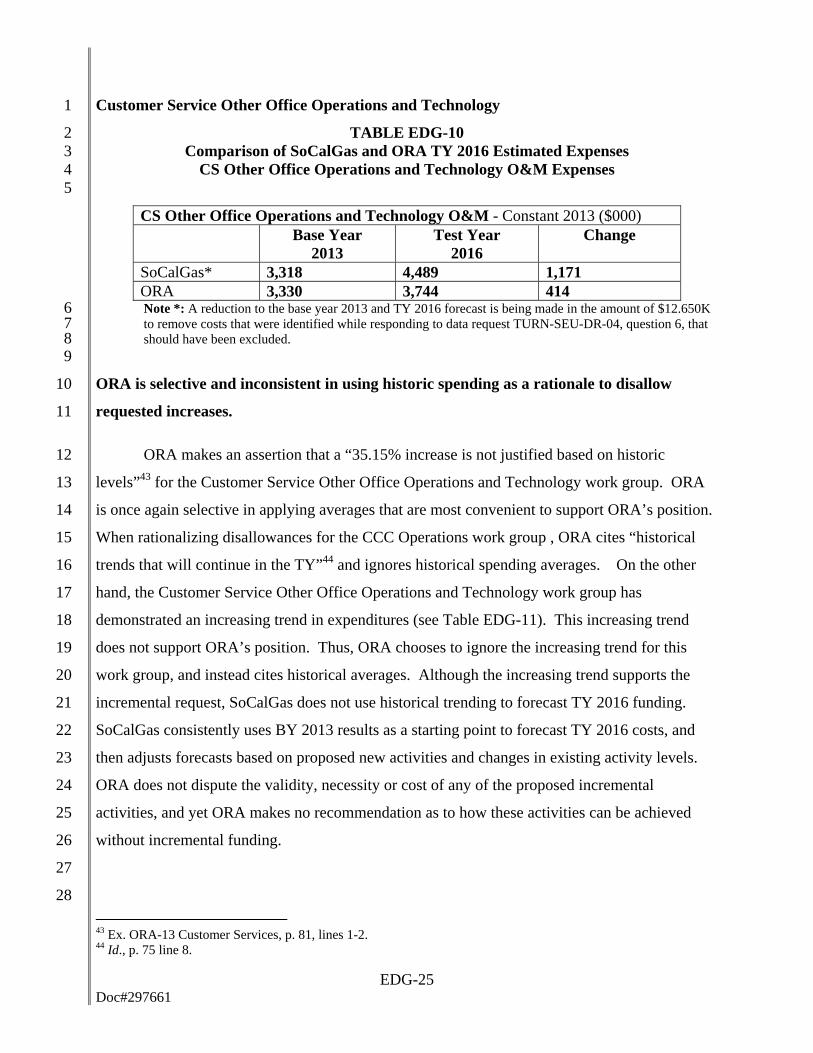
SoCalGas* 3,318 4,489 1,171 ORA 3,330 3,744 414 Note *: A reduction to the base year 2013 and TY 2016 forecast is being made in the amount of $12.650K 6 to remove costs that were identified while responding to data request TURN-SEU-DR-04, question 6, that 7 should have been excluded. 8
9
ORA is selective and inconsistent in using historic spending as a rationale to disallow 10
requested increases. 11
ORA makes an assertion that a “35.15% increase is not justified based on historic 12
levels”43 for the Customer Service Other Office Operations and Technology work group. ORA 13
is once again selective in applying averages that are most convenient to support ORA’s position. 14
When rationalizing disallowances for the CCC Operations work group , ORA cites “historical 15
trends that will continue in the TY”44 and ignores historical spending averages. On the other 16
hand, the Customer Service Other Office Operations and Technology work group has 17
demonstrated an increasing trend in expenditures (see Table EDG-11). This increasing trend 18
does not support ORA’s position. Thus, ORA chooses to ignore the increasing trend for this 19
work group, and instead cites historical averages. Although the increasing trend supports the 20
incremental request, SoCalGas does not use historical trending to forecast TY 2016 funding. 21
SoCalGas consistently uses BY 2013 results as a starting point to forecast TY 2016 costs, and 22
then adjusts forecasts based on proposed new activities and changes in existing activity levels. 23
ORA does not dispute the validity, necessity or cost of any of the proposed incremental 24
activities, and yet ORA makes no recommendation as to how these activities can be achieved 25
without incremental funding. 26
27
28
43 Ex. ORA-13 Customer Services, p. 81, lines 1-2. 44 Id., p. 75 line 8.

EDG-26 Doc#297661
Table EDG-11 1
CS Other Office Ops and Tech Forecasts Using Linear Trends 2
3
ORA fails to acknowledge continued growth in Customer Service Other Office Operations 4
and Technology work group. 5
ORA arbitrarily decides that 2014 adjusted-recorded expenses are appropriate for TY 6
2016 because, “ORA’s use of SCG’s 2014 adjusted-recorded expenses of $3.744 million is more 7
than SCG’s base year expenses, and the five year (2009-2013) and six year (2009-2014) 8
averages.”45 ORA does not recognize that although some incremental costs above BY 2013 are 9
reflected in 2014 adjusted recorded expenses, a substantial portion of TY 2016 requested 10
increases are for activities that did not incur full-year expenses in 2014. Forecasted activities 11
either began during 2014 (in which case only a partial year of activity is reflected) or else are not 12
forecasted to begin until after 2014. ORA ignores justification and timing of incremental 13
activities provided by SoCalGas that are described in detail in prepared direct testimony and 14
associated workpapers.46 15
The incremental expenses for the Other Office Operations and Technology work group 16
are primarily a function of the volume and complexity of technology, process and regulations 17
required to meet customer and business needs. The complexity of customer interaction channels 18
(Web, mobile, texting, etc.) and volume of customer related data is increasing. 19
Awareness and regulatory concern around customer privacy and protecting customer 20
information has also intensified. New and updated technology, data and business processes are 21
required to meet these increasing demands. At the same time, existing systems and processes 22
must be operated, maintained and supported. SoCalGas Information Technology capital 23
expenditures related to Customer Service have significantly increased in 2014 above historical 24
levels, and expenditures will continue in 2015 and 2016 (see Table EDG-12). Increased Project 25
45 Ex. ORA-13 Customer Services, p. 81, lines 8-10. 46 Exs. SCG-11 and SCG-11-WP.
Other Office Ops and Tech Expenses 2009 2010 2011 2012 2013 2014 2015 20163Y Linear (2011-13) $2,675 $2,357 $2,798 $3,581 $3,318 $3,752 $4,012 $4,2724Y Linear (2010-13) $2,675 $2,357 $2,798 $3,581 $3,318 $3,930 $4,297 $4,6635Y Linear (2009-13) $2,675 $2,357 $2,798 $3,581 $3,318 $3,699 $3,950 $4,2016Y Linear (2009-2014 including 2014 adjusted-recorded) $2,675 $2,357 $2,798 $3,581 $3,318 $3,744 $3,980 $4,237SCG Forecast (BY 2013 + incremental activities) $2,675 $2,357 $2,798 $3,581 $3,330 $3,870 $4,305 $4,489
Totals listed below are in 2013$ (000) and reflect $12,650 removed from BY 2013 adj-rec totals
EDG-27 Doc#297661
Management and Operations Technology resources are necessary to ensure that the assets 1
developed through IT capital expenditures deliver intended business value and function properly. 2
For many technology implementations, the O&M expense begins once the technology has been 3
placed in-service and business processes have been implemented. Ongoing enhancement, 4
maintenance and operations of these new systems and processes ensure that they continue to 5
support customer and business requirements. 6
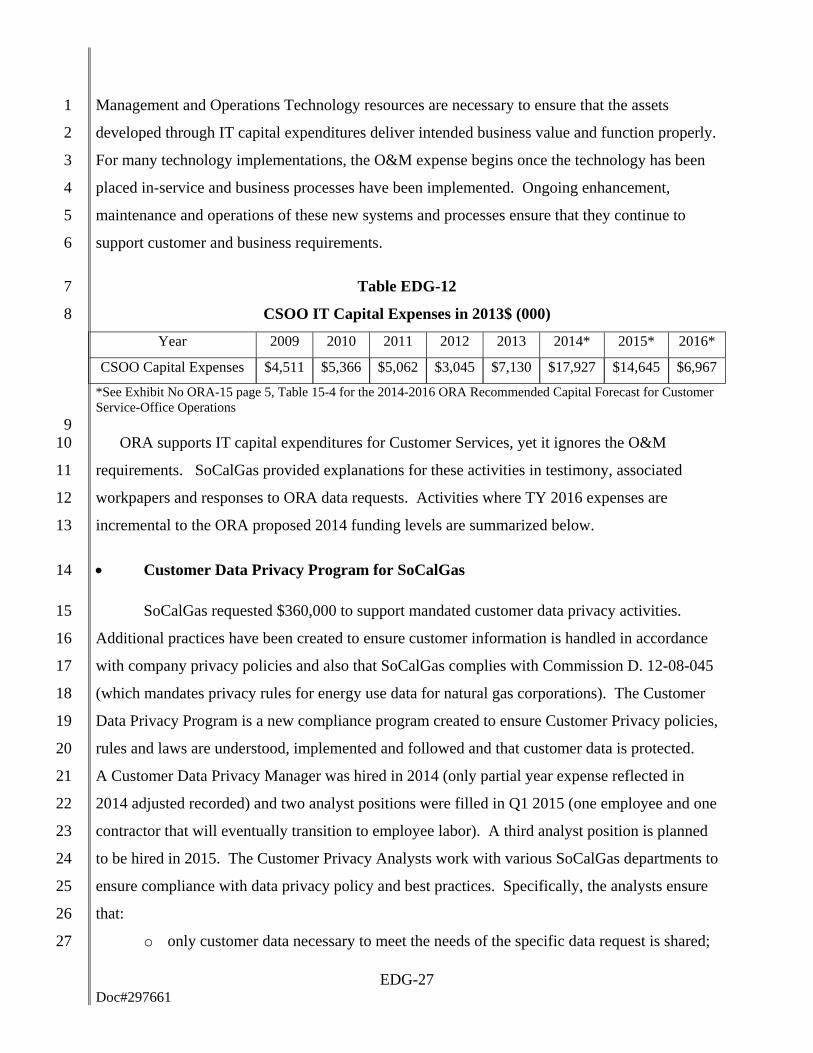
Table EDG-12 7
CSOO IT Capital Expenses in 2013$ (000) 8
Year 2009 2010 2011 2012 2013 2014* 2015* 2016*
CSOO Capital Expenses $4,511 $5,366 $5,062 $3,045 $7,130 $17,927 $14,645 $6,967
*See Exhibit No ORA-15 page 5, Table 15-4 for the 2014-2016 ORA Recommended Capital Forecast for Customer Service-Office Operations 9
ORA supports IT capital expenditures for Customer Services, yet it ignores the O&M 10
requirements. SoCalGas provided explanations for these activities in testimony, associated 11
workpapers and responses to ORA data requests. Activities where TY 2016 expenses are 12
incremental to the ORA proposed 2014 funding levels are summarized below. 13
Customer Data Privacy Program for SoCalGas 14
SoCalGas requested $360,000 to support mandated customer data privacy activities. 15
Additional practices have been created to ensure customer information is handled in accordance 16
with company privacy policies and also that SoCalGas complies with Commission D. 12-08-045 17
(which mandates privacy rules for energy use data for natural gas corporations). The Customer 18
Data Privacy Program is a new compliance program created to ensure Customer Privacy policies, 19
rules and laws are understood, implemented and followed and that customer data is protected. 20
A Customer Data Privacy Manager was hired in 2014 (only partial year expense reflected in 21
2014 adjusted recorded) and two analyst positions were filled in Q1 2015 (one employee and one 22
contractor that will eventually transition to employee labor). A third analyst position is planned 23
to be hired in 2015. The Customer Privacy Analysts work with various SoCalGas departments to 24
ensure compliance with data privacy policy and best practices. Specifically, the analysts ensure 25
that: 26
o only customer data necessary to meet the needs of the specific data request is shared; 27
EDG-28 Doc#297661
o customer data is securely transmitted; 1
o customer data is securely destroyed when it is no longer useful; and 2
o customers are informed/reminded that their data is being shared under a consent 3
arrangement if applicable. 4
2014 adjusted recorded expenses for the Customer Data Privacy Program do not reflect 5
full activity levels and are not sufficient for SoCalGas to carry out customer data privacy 6
mandates and controls in TY 2016. 7
Increased support for mobile customer applications 8
SoCalGas requested $114,000 for increased support for mobile customer applications. In 9
2014, year over year mobile device visits to SoCalGas My Account grew by almost 133% to 10
more than 3.1 million. Additionally, 827,237 bills were paid in 2014 through a mobile device. 11
SoCalGas mobile apps have been downloaded by more than 100,000 users on the Android 12
(Google) and iOS (Apple) platforms. SoCalGas must test customer applications on a growing 13
combination of different browsers (Internet Explorer, Chrome, Safari, etc.), platforms (Windows, 14
Android, Apple, etc.) and hardware (PC, Mac, iPhone, iPad, Samsung, etc.). Currently a 15
minimum of 11 combinations are tested to ensure that applications function properly for 16
customers. The increase in the amount of mobile and SMS (text) functionality that SoCalGas 17
continues to make available to customers also requires an increase in support. As mobile 18
technologies evolve and customer usage continues to increase, SoCalGas anticipates that future 19
GRCs will include additional capital funding requests for mobile technology enhancements, 20
upgrades and new applications. 21
SoCalGas expenditures for mobile testing increased in 2014 in line with GRC forecasts, 22
but 2014 staffing does not reflect the full TY 2016 projected funding requirements. Mobile 23
testing expenditures are projected to increase in 2015 as the My Account Mobile 1c IT capital 24
project (#81423) expands the amount of functionality on mobile devices; and once again in TY 25
2016 as the My Business Account and My Account Technology Refresh IT capital projects 26
(#81436 & #81435) provide the full functionality of My Account on mobile devices to 27
residential and business customers. 2014 adjusted recorded expenses to support mobile 28
customer facing applications are not sufficient for SoCalGas to continue to support growing 29
mobile adoption and associated forecasted TY 2016 activity levels. ORA accepts SoCalGas’ 30
EDG-29 Doc#297661
funding for all of the above IT Capital projects47, but has not recognized the need for the 1
accompanying increase in O&M support. 2
Increased data analytics support 3
SoCalGas requested $186,000 for increased data analytics support. By TY 2016, the 4
volume of customer meter read data (often referred to as interval usage data) that SoCalGas 5
manages will have increased by an order magnitude for SoCalGas customers with installed 6
advanced meter modules. Specifically, prior to SoCalGas Advanced Meter Infrastructure (AMI) 7
deployment, a customer had approximately 12 monthly meter reads per year. A customer with 8
an AMI capable meter will now have 8,760 (24 hourly reads x 365 days) meter reading data 9
points. SoCalGas AMI deployment is projected to be completed by 2017 for all 5.9 million 10
customers. 11
The Integrated Customer Data & Analytics (“ICDA”) IT capital project (#14826) will 12
improve the availability and accuracy of customer data used by SoCalGas to make business 13
decisions that support customer service and operational improvements. Specifically, ICDA will 14
integrate customer usage data with SoCalGas customer information and third party customer 15
databases. This integrated data repository will require additional business system analyst 16
resources to support the design, development, and maintenance of the Integrated Customer Data 17
Analytics system. New support is required to maintain data, manage data quality, train and 18
communicate changes to data analysts and provide support for reporting tools and processes. 19
SoCalGas expects data governance support positions to be filled in 2015. These positions are not 20
reflected in 2014 adjusted recorded expenditures. ORA accepts SoCalGas funding for the ICDA 21
IT Capital project but has not recognized the need for the accompanying O&M support. 22
23
Uncollectable Rate 24
ORA’s assertion that a 3 year average “shows the fluctuations in the recorded uncollectible 25
expenses associated with the most current economic and cyclical variables”48 is 26
unsubstantiated. 27
28 47 Ex. ORA-15 Information Technology p 5, Table 15-4, row “Customer Service - Office Operations.” 48 Ex. ORA-13 Customer Services, p. 82, lines 15-17.
EDG-30 Doc#297661
ORA recommends a three year average for the uncollectable rate because “it shows the 1
fluctuations in the recorded uncollectible expenses associated with the most current economic 2
and cyclical variables.”49 ORA provides no evidence to substantiate this assertion. 3
According to the National Bureau of Economic Research (NBER),50 the average length 4
of the 33 business cycles in the United States since 1854 has been 56.4 months. If older historic 5
data is excluded, the average length of the 11 business cycles since 1945 has been 68.5 months. 6
This data would indicate that five years is a more appropriate measure of economic and cyclical 7
variables. 8
The 2014 uncollectable rate was .305% which is higher than the ORA recommended 9
3YA rate. Additionally, The Q1 2015 uncollectable rate was .447%, which is higher than Q1 10
2014 uncollectable rate and comparable to the Q1 2009 rate. ORA rationalizes excluding 2009 11
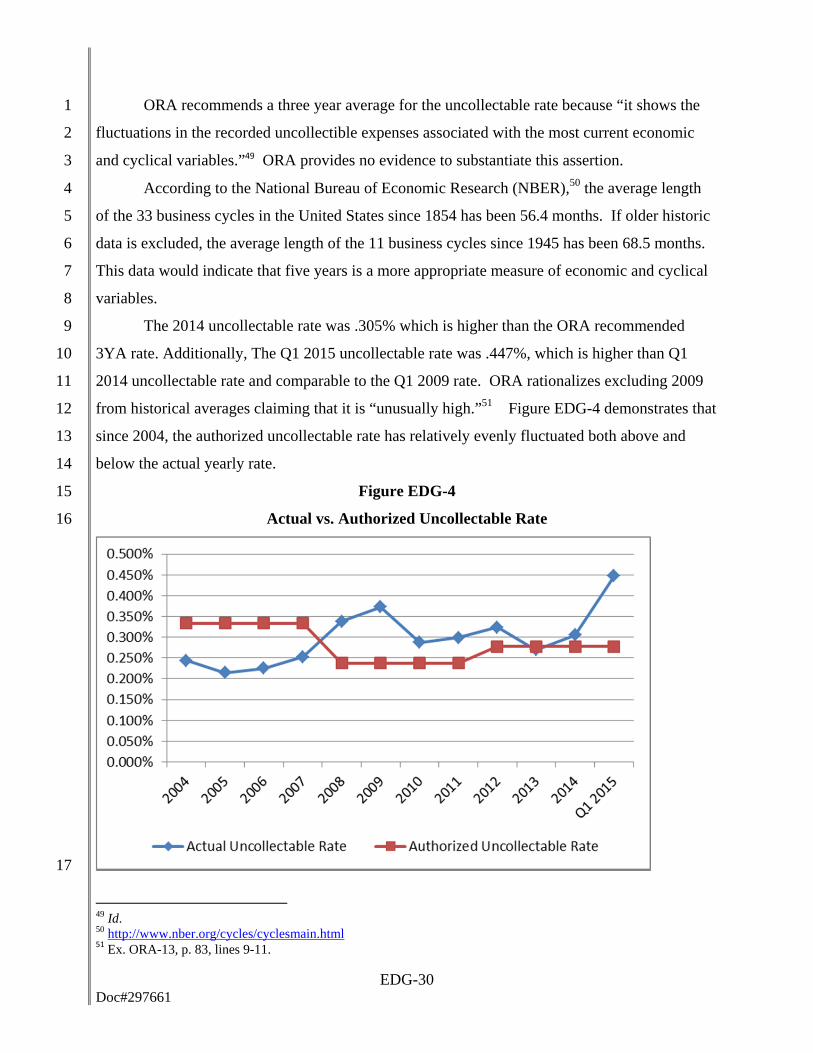
from historical averages claiming that it is “unusually high.”51 Figure EDG-4 demonstrates that 12
since 2004, the authorized uncollectable rate has relatively evenly fluctuated both above and 13
below the actual yearly rate. 14
Figure EDG-4 15
Actual vs. Authorized Uncollectable Rate 16
17
49 Id. 50 http://www.nber.org/cycles/cyclesmain.html 51 Ex. ORA-13, p. 83, lines 9-11.
EDG-31 Doc#297661
1
ORA’s inaccurately asserts that “SoCalGas statements are contradictory and should not be 2
relied upon.”52 3
For reasons stated above, SoCalGas believes that a five year average is more appropriate 4
than shorter average periods (i.e., a 3 year average) because it better reflects economic and 5
cyclical variables. SoCalGas also believes that a five year average is more appropriate than 6
longer periods (i.e., a ten year average) because a longer average does not reflect current 7
collections practices (e.g., the Disconnection OIR policies and practices). ORA fails to 8
understand that these are not contradictory statements. 9
ORA makes inconsistent recommendations in the TY 2012 and TY 2016 GRCs as well as 10
between SoCalGas and SDG&E in the TY 2016 GRC. 11
In the TY 2012 GRC, SoCalGas also proposed a five year average uncollectable rate 12
which was adopted by the Commission.53 The five year average for TY 2012 was lower than the 13
three year average, so ORA did not oppose a five year average in TY 2012. ORA also currently 14
supports SDG&E’s proposed five year average and makes no claim that a 3 year is more 15
appropriate for SDG&E. ORA has provided no explanation as to why SDG&E and SoCalGas 16
should use different averages for the uncollectable rate. 17
B. Shared Services O&M 18
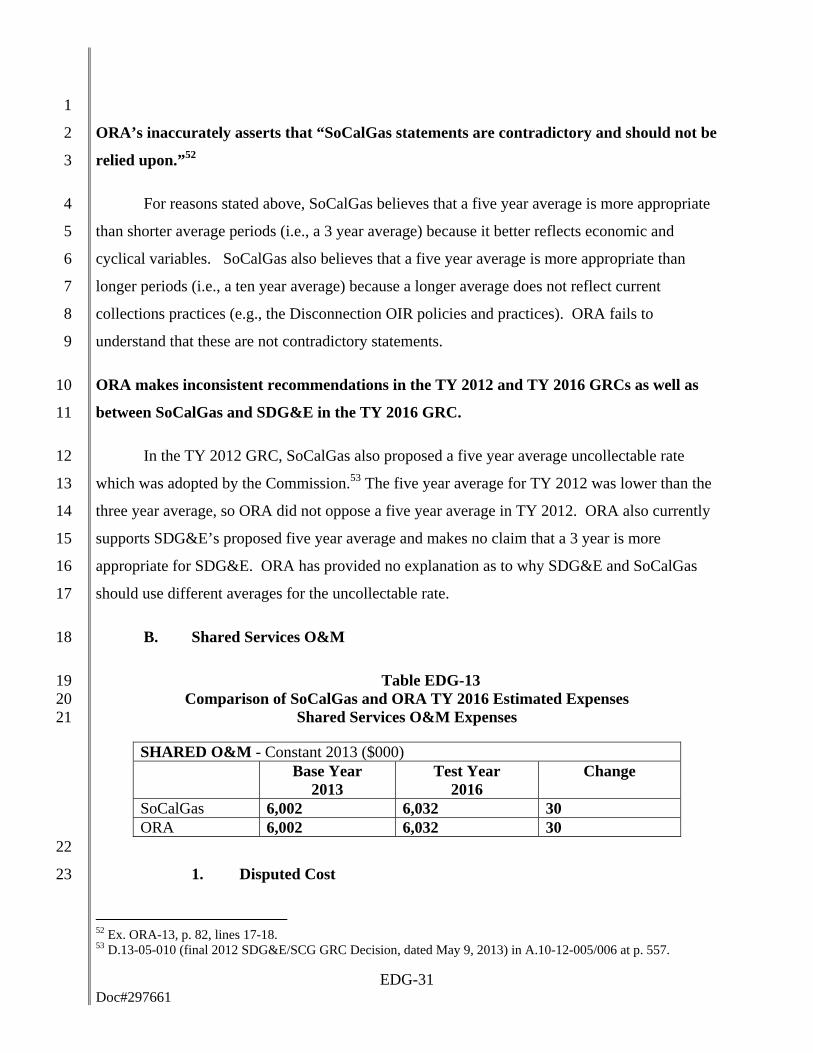
Table EDG-13 19 Comparison of SoCalGas and ORA TY 2016 Estimated Expenses 20
Shared Services O&M Expenses 21
SHARED O&M - Constant 2013 ($000)
Base Year
2013 Test Year
2016 Change
SoCalGas 6,002 6,032 30 ORA 6,002 6,032 30
22
1. Disputed Cost 23
52 Ex. ORA-13, p. 82, lines 17-18. 53 D.13-05-010 (final 2012 SDG&E/SCG GRC Decision, dated May 9, 2013) in A.10-12-005/006 at p. 557.
EDG-32 Doc#297661
a. ORA 1
ORA agrees54 with SoCalGas’ TY 2016 forecast for all CSOO shared service work 2
groups. The Commission should adopt SoCalGas’ forecast as reasonable. 3
4
IV. REBUTTAL TO PARTIES’ CAPITAL PROPOSALS 5
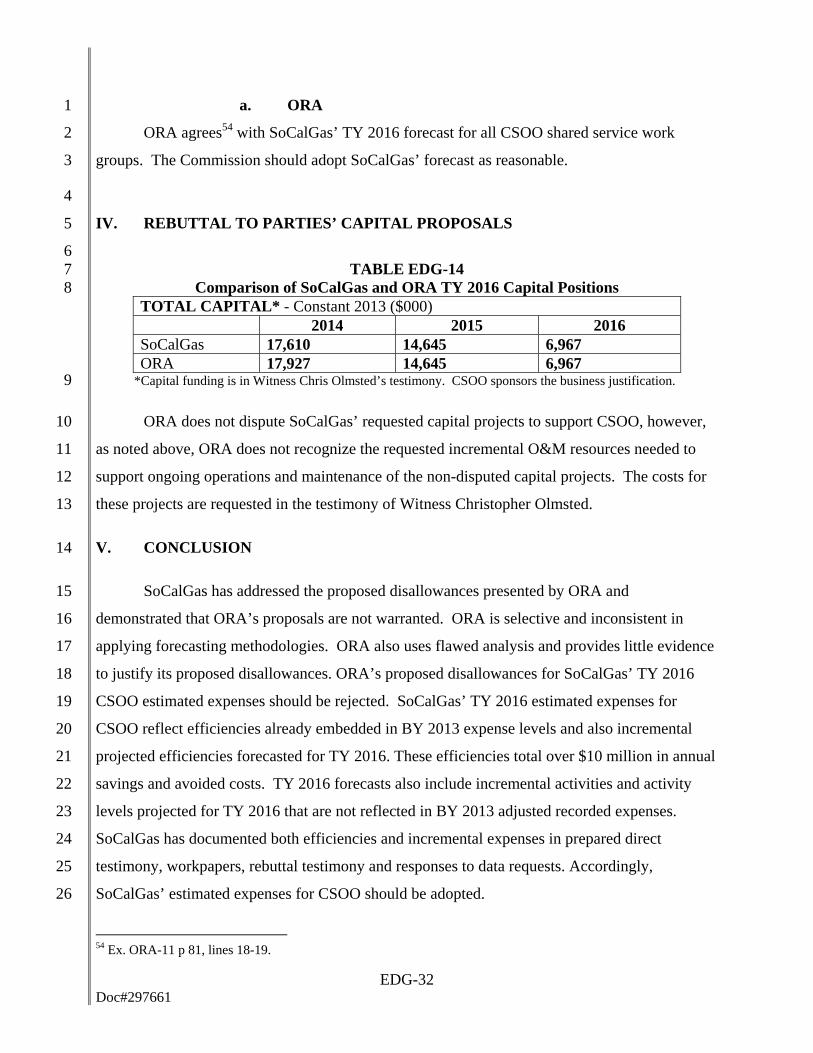
6 TABLE EDG-14 7
Comparison of SoCalGas and ORA TY 2016 Capital Positions 8 TOTAL CAPITAL* - Constant 2013 ($000) 2014 2015 2016 SoCalGas 17,610 14,645 6,967 ORA 17,927 14,645 6,967
*Capital funding is in Witness Chris Olmsted’s testimony. CSOO sponsors the business justification. 9
ORA does not dispute SoCalGas’ requested capital projects to support CSOO, however, 10
as noted above, ORA does not recognize the requested incremental O&M resources needed to 11
support ongoing operations and maintenance of the non-disputed capital projects. The costs for 12
these projects are requested in the testimony of Witness Christopher Olmsted. 13
V. CONCLUSION 14
SoCalGas has addressed the proposed disallowances presented by ORA and 15
demonstrated that ORA’s proposals are not warranted. ORA is selective and inconsistent in 16
applying forecasting methodologies. ORA also uses flawed analysis and provides little evidence 17
to justify its proposed disallowances. ORA’s proposed disallowances for SoCalGas’ TY 2016 18
CSOO estimated expenses should be rejected. SoCalGas’ TY 2016 estimated expenses for 19
CSOO reflect efficiencies already embedded in BY 2013 expense levels and also incremental 20
projected efficiencies forecasted for TY 2016. These efficiencies total over $10 million in annual 21
savings and avoided costs. TY 2016 forecasts also include incremental activities and activity 22
levels projected for TY 2016 that are not reflected in BY 2013 adjusted recorded expenses. 23
SoCalGas has documented both efficiencies and incremental expenses in prepared direct 24
testimony, workpapers, rebuttal testimony and responses to data requests. Accordingly, 25
SoCalGas’ estimated expenses for CSOO should be adopted. 26
54 Ex. ORA-11 p 81, lines 18-19.
EDG-33 Doc#297661
UWUA supports SoCalGas’ requested increases for CSOO in full. 1
This concludes my prepared rebuttal testimony.2
Doc#297661
APPENDIX TO
REBUTAL TESTIMONY OF EVAN GOLDMAN
ON BEHALF OF SOCALGAS CUSTOMER SERVICE OFFICE OPERATIONS
EDG Doc#297661
APPENDIX ATTACHMENTS
A. SEU Data Request, SEU-ORA-DR-04 Question 2
B. ORA Data Request, ORA-SCG-DR-070-TLG, Question 12
C. ORA Data Request, ORA-SCG-DR-070-TLG, Question 7, Attachment 1
D. ORA Data Request, ORA-SCG-DR-070-TLG, Question 1
E. Customer Insight Panel – Residential

ATTACHMENT A
SEU Data Request, SEU-ORA-DR-04 Question 2
EDG A-1
ORA Office of Ratepayer Advocates
California Public Utilities Commission
Dana S. Appling, Director
505 Van Ness Avenue
San Francisco, CA 94102 Phone: (415) 703-2544
Fax: (415) 703-2057
http://ora.ca.gov
ORA Response to Sempra Energy Utilities’ Data Request
San Diego Gas & Electric Co. Test Year 2016 General Rate Case, A.14-11-003
Southern California Gas Co. Test Year 2016 General Rate Case, A.14-11-004
Origination Date: April 30, 2015
Due Date: May 14, 2015
Response Date: May 14, 2015
To: Chuck Manzuk Billie Overturf
[email protected] [email protected] 1-858-654-1782 1-858-654-1779
From: Clayton Tang and Truman Burns, Project Coordinators Office of Ratepayer Advocates 505 Van Ness Avenue, Room 4205 San Francisco, CA 94102 Response by: Tamera Godfrey
Phone: 415-703-1367
Email: [email protected]
Data Request No: SEU-ORA-DR-4
Exhibit Reference: ORA-13
Subject: Customer Service Office Operations
The following is ORA’s response to Sempra’s data request. If you have any questions, please contact the responder at the phone number and/or email address shown above. Q.2: According to Exhibit No: ORA-13 p. 76, lines 11-15 “The positions are to address
activities associated with meter growth, increased call volume related to high volume/routine calls, customer outreach safety checks, appliance safety checks, increased CSR call duration measured by Average Handle Time (AHT), and increased service level measured by Level of Service (LOS). SCG’s historical

EDG A-2
expenses include costs for these activities and additional funding over SCG’s 2013 expense level is not required.”
a. Please identify where in testimony, workpapers, or data request responses
does SoCalGas forecast increased call volume for high volume/routine calls?
b. Please identify where in testimony, workpapers, or data request responses did ORA find evidence that historical expenses include costs for activities associated with meter growth, increased call volume related to high volume/routine calls, customer outreach safety checks, appliance safety checks, increased CSR call duration measured by Average Handle Time (AHT), and increased service level measured by Level of Service (LOS). How did ORA determine that these historical expenses were sufficient to fund proposed TY 2016 levels of activities? Please include any calculations made by ORA to support this determination.
A.2-a: Regarding “where in testimony, workpapers, or data request responses does SoCalGas forecast increased call volume for high volume/routine calls” see pages EDG-14 to EDG-20.
A.2-b: Regarding “where in testimony, workpapers, or data request responses did ORA
find evidence that historical expenses include costs for activities associated with meter growth, increased call volume related to high volume/routine calls, customer outreach safety checks, appliance safety checks, increased CSR call duration measured by Average Handle Time (AHT), and increased service level measured by Level of Service (LOS)”, see SCG’s response to ORA-SCG-070-TLG, Q.12 and pages EDG-14 to EDG-19.
Regarding ORA’s determination “that these historical expenses were sufficient to
fund proposed TY 2016 levels of activities” see ORA’s testimony pages 74 to 78. As discussed in ORA’s testimony, ORA utilized SCG’s 2013 adjusted-recorded expenses as a basis for its estimate of $31.223 million for SCG’s Customer Contact Center – Operations O&M expenses.
END OF RESPONSE ________________________________________________________________________

ATTACHMENT B
ORA Data Request, ORA-SCG-DR-070-TLG, Question 12
ORA DATA REQUEST ORA-SCG-DR-070-TLG
SOCALGAS 2016 GRC – A.14-11-004 SOCALGAS RESPONSE
DATE RECEIVED: FEBRUARY 23, 2015 DATE RESPONDED: MARCH 2, 2015
EDG B-1
12. Provide documentation that explains in detail and demonstrates why SCG’s current staffing levels are insufficient to perform the work activities proposed for Test Year 2016.
SoCalGas Response: SoCalGas believes the Base Year 2013 resources will not be sufficient for incremental requests in the TY2016 forecast. BY2013 numbers represent ongoing costs that are expected to reoccur in TY2016 and subsequent years. In the TY2016 forecast, SoCalGas has taken reductions totaling ($4,967K) from 2013 base year adjusted recorded results for self-service adoption in CCC Operations ($1,224K); the automation of Out Bound Dialing in CCC Support ($245K); reduction of postage costs in Credit and Collections Postage that are associated with combining Late Payment Notices with customer bills ($591K); and reductions in Remittance Processing ($181K) and Remittance Processing Postage ($2,726K) for savings associated with continued migration towards paperless billing. Additionally, the BY2013 adjusted recorded results and FTEs used as a starting point for TY2016 forecasts already reflect additional efficiencies that resulted in $5,408K in avoided costs for rate payers (Please see Appendix A in Exhibit No SCG-11 for details.) The CSOO 2016 GRC testimony and workpapers of SoCalGas witness Evan Goldman (SCG-11 and SCG-WP-11) describe both reductions (resulting in fewer required FTEs) and increases (resulting in additional required FTEs) to 2013 base year work in anticipation of changes to activities in TY2016. Detailed documentation and explanations justifying these changes are provided in the testimony and workpapers along with “ORA-SCG-DR-070-TLG Q7 Attachment 1.pdf”. SoCalGas does not have additional documentation beyond that which has been provided.

ATTACHMENT C
ORA Data Request, ORA-SCG-DR-070-TLG, Question 7, Attachment 1
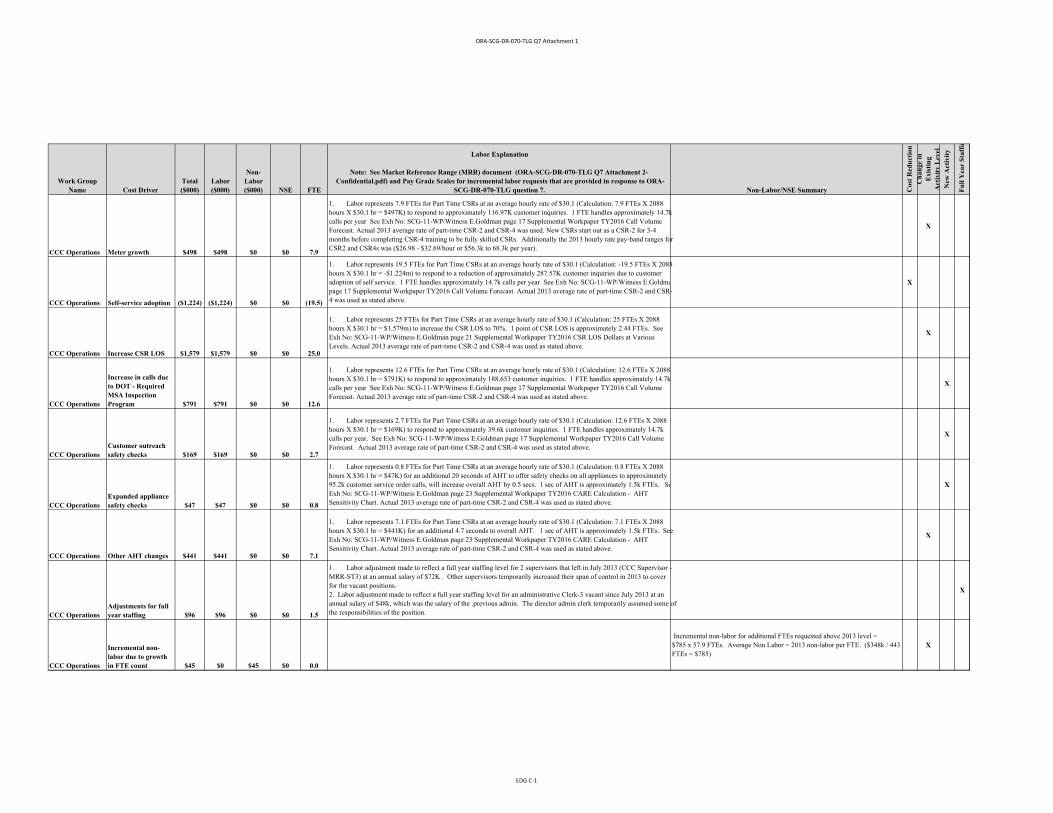
ORA‐SCG‐DR‐070‐TLG Q7 Attachment 1
Work Group Name Cost Driver
Total($000)
Labor ($000)
Non-Labor($000) NSE FTE
Labor Explanation
Note: See Market Reference Range (MRR) document (ORA-SCG-DR-070-TLG Q7 Attachment 2-Confidential.pdf) and Pay Grade Scales for incremental labor requests that are provided in response to ORA-
SCG-DR-070-TLG question 7. Non-Labor/NSE Summary Cos
t R
edu
ctio
n
Ch
ange
in
Exi
stin
g A
ctiv
ity
Lev
elN
ew A
ctiv
ity
Fu
ll Y
ear
Sta
ffin
CCC Operations Meter growth $498 $498 $0 $0 7.9
1. Labor represents 7.9 FTEs for Part Time CSRs at an average hourly rate of $30.1 (Calculation: 7.9 FTEs X 2088 hours X $30.1 hr = $497K) to respond to approximately 116.97K customer inquiries. 1 FTE handles approximately 14.7k calls per year See Exh No: SCG-11-WP/Witness E.Goldman page 17 Supplemental Workpaper TY2016 Call Volume Forecast. Actual 2013 average rate of part-time CSR-2 and CSR-4 was used. New CSRs start out as a CSR-2 for 3-4 months before completing CSR-4 training to be fully skilled CSRs. Additionally the 2013 hourly rate pay-band ranges for CSR2 and CSR4s was ($26.98 - $32.69/hour or $56.3k to 68.3k per year).
X
CCC Operations Self-service adoption ($1,224) ($1,224) $0 $0 (19.5)
1. Labor represents 19.5 FTEs for Part Time CSRs at an average hourly rate of $30.1 (Calculation: -19.5 FTEs X 2088 hours X $30.1 hr = -$1.224m) to respond to a reduction of approximately 287.57K customer inquiries due to customer adoption of self service. 1 FTE handles approximately 14.7k calls per year See Exh No: SCG-11-WP/Witness E.Goldmapage 17 Supplemental Workpaper TY2016 Call Volume Forecast. Actual 2013 average rate of part-time CSR-2 and CSR-4 was used as stated above.
X
CCC Operations Increase CSR LOS $1,579 $1,579 $0 $0 25.0
1. Labor represents 25 FTEs for Part Time CSRs at an average hourly rate of $30.1 (Calculation: 25 FTEs X 2088 hours X $30.1 hr = $1.579m) to increase the CSR LOS to 70%. 1 point of CSR LOS is approximately 2.44 FTEs. See Exh No: SCG-11-WP/Witness E.Goldman page 21 Supplemental Workpaper TY2016 CSR LOS Dollars at Various Levels. Actual 2013 average rate of part-time CSR-2 and CSR-4 was used as stated above.
X
CCC Operations
Increase in calls due to DOT - Required MSA Inspection Program $791 $791 $0 $0 12.6
1. Labor represents 12.6 FTEs for Part Time CSRs at an average hourly rate of $30.1 (Calculation: 12.6 FTEs X 2088 hours X $30.1 hr = $791K) to respond to approximately 188,653 customer inquiries. 1 FTE handles approximately 14.7k calls per year See Exh No: SCG-11-WP/Witness E.Goldman page 17 Supplemental Workpaper TY2016 Call Volume Forecast. Actual 2013 average rate of part-time CSR-2 and CSR-4 was used as stated above.
X
CCC OperationsCustomer outreach safety checks $169 $169 $0 $0 2.7
1. Labor represents 2.7 FTEs for Part Time CSRs at an average hourly rate of $30.1 (Calculation: 12.6 FTEs X 2088 hours X $30.1 hr = $169K) to respond to approximately 39.6k customer inquiries. 1 FTE handles approximately 14.7k calls per year. See Exh No: SCG-11-WP/Witness E.Goldman page 17 Supplemental Workpaper TY2016 Call Volume Forecast. Actual 2013 average rate of part-time CSR-2 and CSR-4 was used as stated above.
X
CCC OperationsExpanded appliance safety checks $47 $47 $0 $0 0.8
1. Labor represents 0.8 FTEs for Part Time CSRs at an average hourly rate of $30.1 (Calculation: 0.8 FTEs X 2088 hours X $30.1 hr = $47K) for an additional 20 seconds of AHT to offer safety checks on all appliances to approximately 95.2k customer service order calls, will increase overall AHT by 0.5 secs. 1 sec of AHT is approximately 1.5k FTEs. SeExh No: SCG-11-WP/Witness E.Goldman page 23 Supplemental Workpaper TY2016 CARE Calculation - AHT Sensitivity Chart. Actual 2013 average rate of part-time CSR-2 and CSR-4 was used as stated above.
X
CCC Operations Other AHT changes $441 $441 $0 $0 7.1
1. Labor represents 7.1 FTEs for Part Time CSRs at an average hourly rate of $30.1 (Calculation: 7.1 FTEs X 2088 hours X $30.1 hr = $441K) for an additional 4.7 seconds to overall AHT. 1 sec of AHT is approximately 1.5k FTEs. See Exh No: SCG-11-WP/Witness E.Goldman page 23 Supplemental Workpaper TY2016 CARE Calculation - AHT Sensitivity Chart. Actual 2013 average rate of part-time CSR-2 and CSR-4 was used as stated above.
X
CCC OperationsAdjustments for full year staffing $96 $96 $0 $0 1.5
1. Labor adjustment made to reflect a full year staffing level for 2 supervisors that left in July 2013 (CCC Supervisor - MRR-ST3) at an annual salary of $72K . Other supervisors temporarily increased their span of control in 2013 to cover for the vacant positions. 2. Labor adjustment made to reflect a full year staffing level for an administrative Clerk-3 vacant since July 2013 at an annual salary of $48k, which was the salary of the .previous admin. The director admin clerk temporarily assumed some of the responsibilities of the position.
X
CCC Operations
Incremental non-labor due to growth in FTE count $45 $0 $45 $0 0.0
Incremental non-labor for additional FTEs requested above 2013 level =$785 x 57.9 FTEs. Average Non Labor = 2013 non-labor per FTE. ($348k / 443 FTEs = $785)
X
EDG C‐1
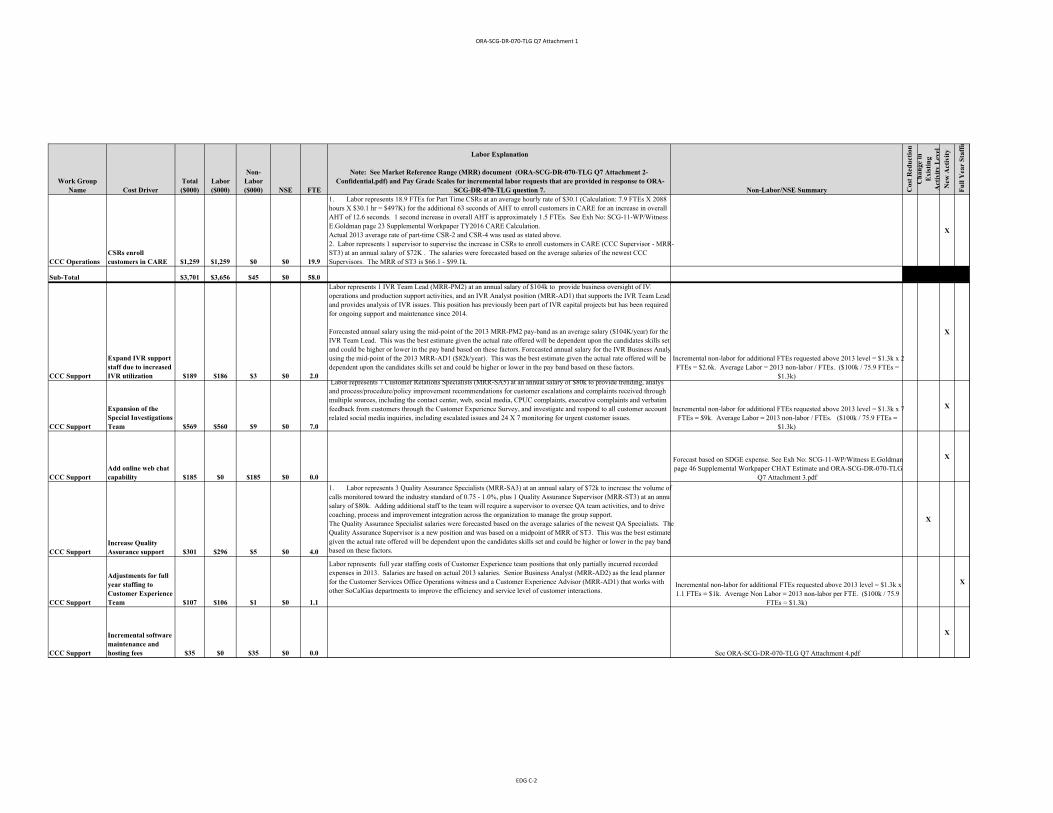
ORA‐SCG‐DR‐070‐TLG Q7 Attachment 1
Work Group Name Cost Driver
Total($000)
Labor ($000)
Non-Labor($000) NSE FTE
Labor Explanation
Note: See Market Reference Range (MRR) document (ORA-SCG-DR-070-TLG Q7 Attachment 2-Confidential.pdf) and Pay Grade Scales for incremental labor requests that are provided in response to ORA-
SCG-DR-070-TLG question 7. Non-Labor/NSE Summary Cos
t R
edu
ctio
n
Ch
ange
in
Exi
stin
g A
ctiv
ity
Lev
elN
ew A
ctiv
ity
Fu
ll Y
ear
Sta
ffin
CCC OperationsCSRs enroll customers in CARE $1,259 $1,259 $0 $0 19.9
1. Labor represents 18.9 FTEs for Part Time CSRs at an average hourly rate of $30.1 (Calculation: 7.9 FTEs X 2088 hours X $30.1 hr = $497K) for the additional 63 seconds of AHT to enroll customers in CARE for an increase in overall AHT of 12.6 seconds. 1 second increase in overall AHT is approximately 1.5 FTEs. See Exh No: SCG-11-WP/Witness E.Goldman page 23 Supplemental Workpaper TY2016 CARE Calculation. Actual 2013 average rate of part-time CSR-2 and CSR-4 was used as stated above. 2. Labor represents 1 supervisor to supervise the increase in CSRs to enroll customers in CARE (CCC Supervisor - MRR-ST3) at an annual salary of $72K . The salaries were forecasted based on the average salaries of the newest CCC Supervisors. The MRR of ST3 is $66.1 - $99.1k.
X
Sub-Total $3,701 $3,656 $45 $0 58.0
CCC Support
Expand IVR support staff due to increased IVR utilization $189 $186 $3 $0 2.0
Labor represents 1 IVR Team Lead (MRR-PM2) at an annual salary of $104k to provide business oversight of IVRoperations and production support activities, and an IVR Analyst position (MRR-AD1) that supports the IVR Team Lead and provides analysis of IVR issues. This position has previously been part of IVR capital projects but has been required for ongoing support and maintenance since 2014.
Forecasted annual salary using the mid-point of the 2013 MRR-PM2 pay-band as an average salary ($104K/year) for the IVR Team Lead. This was the best estimate given the actual rate offered will be dependent upon the candidates skills set and could be higher or lower in the pay band based on these factors. Forecasted annual salary for the IVR Business Analyusing the mid-point of the 2013 MRR-AD1 ($82k/year). This was the best estimate given the actual rate offered will be dependent upon the candidates skills set and could be higher or lower in the pay band based on these factors.
Incremental non-labor for additional FTEs requested above 2013 level = $1.3k x 2 FTEs = $2.6k. Average Labor = 2013 non-labor / FTEs. ($100k / 75.9 FTEs =
$1.3k)
X
CCC Support
Expansion of the Special Investigations Team $569 $560 $9 $0 7.0
Labor represents 7 Customer Relations Specialists (MRR-SA5) at an annual salary of $80k to provide trending, analysiand process/procedure/policy improvement recommendations for customer escalations and complaints received through multiple sources, including the contact center, web, social media, CPUC complaints, executive complaints and verbatim feedback from customers through the Customer Experience Survey, and investigate and respond to all customer account related social media inquiries, including escalated issues and 24 X 7 monitoring for urgent customer issues.
Incremental non-labor for additional FTEs requested above 2013 level = $1.3k x 7 FTEs = $9k. Average Labor = 2013 non-labor / FTEs. ($100k / 75.9 FTEs =
$1.3k)
X
CCC SupportAdd online web chat capability $185 $0 $185 $0 0.0
Forecast based on SDGE expense. See Exh No: SCG-11-WP/Witness E.Goldman page 46 Supplemental Workpaper CHAT Estimate and ORA-SCG-DR-070-TLG
Q7 Attachment 3.pdf
X
CCC SupportIncrease Quality Assurance support $301 $296 $5 $0 4.0
1. Labor represents 3 Quality Assurance Specialists (MRR-SA3) at an annual salary of $72k to increase the volume of calls monitored toward the industry standard of 0.75 - 1.0%, plus 1 Quality Assurance Supervisor (MRR-ST3) at an annuasalary of $80k. Adding additional staff to the team will require a supervisor to oversee QA team activities, and to drive coaching, process and improvement integration across the organization to manage the group support. The Quality Assurance Specialist salaries were forecasted based on the average salaries of the newest QA Specialists. The Quality Assurance Supervisor is a new position and was based on a midpoint of MRR of ST3. This was the best estimate given the actual rate offered will be dependent upon the candidates skills set and could be higher or lower in the pay band based on these factors.
X
CCC Support
Adjustments for full year staffing to Customer Experience Team $107 $106 $1 $0 1.1
Labor represents full year staffing costs of Customer Experience team positions that only partially incurred recorded expenses in 2013. Salaries are based on actual 2013 salaries. Senior Business Analyst (MRR-AD2) as the lead planner for the Customer Services Office Operations witness and a Customer Experience Advisor (MRR-AD1) that works with other SoCalGas departments to improve the efficiency and service level of customer interactions.
Incremental non-labor for additional FTEs requested above 2013 level = $1.3k x 1.1 FTEs = $1k. Average Non Labor = 2013 non-labor per FTE. ($100k / 75.9
FTEs = $1.3k)
X
CCC Support
Incremental software maintenance and hosting fees $35 $0 $35 $0 0.0 See ORA-SCG-DR-070-TLG Q7 Attachment 4.pdf
X
EDG C‐2
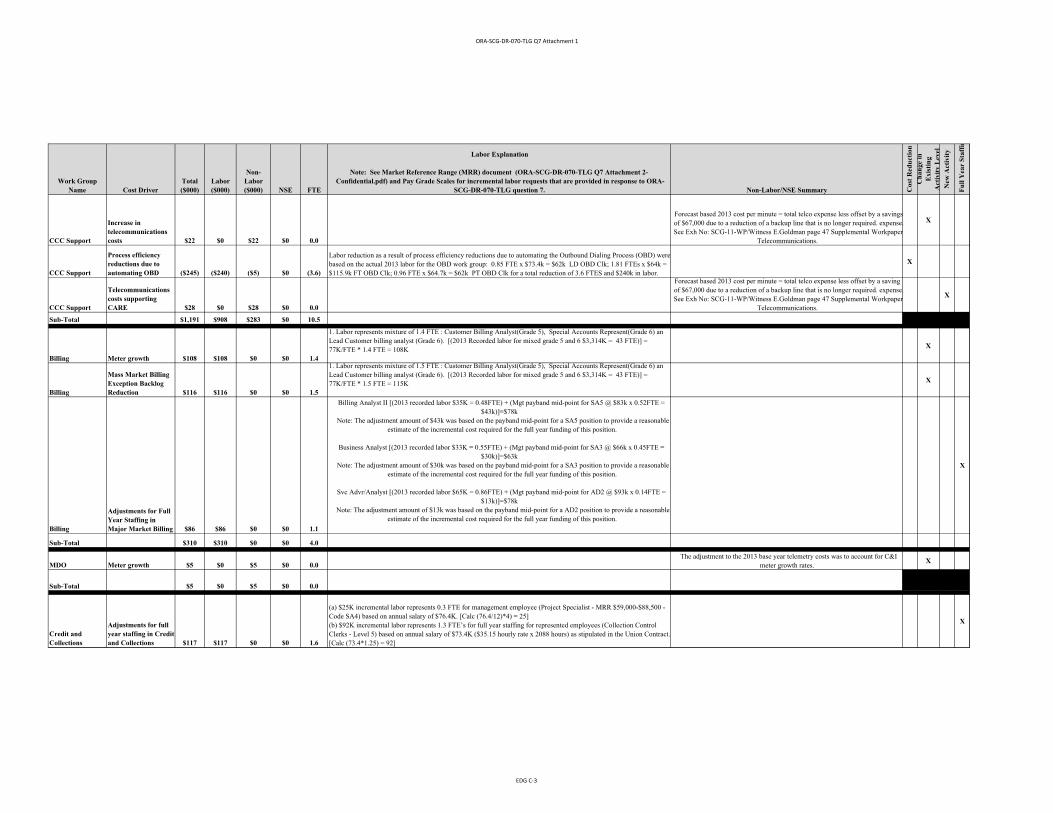
ORA‐SCG‐DR‐070‐TLG Q7 Attachment 1
Work Group Name Cost Driver
Total($000)
Labor ($000)
Non-Labor($000) NSE FTE
Labor Explanation
Note: See Market Reference Range (MRR) document (ORA-SCG-DR-070-TLG Q7 Attachment 2-Confidential.pdf) and Pay Grade Scales for incremental labor requests that are provided in response to ORA-
SCG-DR-070-TLG question 7. Non-Labor/NSE Summary Cos
t R
edu
ctio
n
Ch
ange
in
Exi
stin
g A
ctiv
ity
Lev
elN
ew A
ctiv
ity
Fu
ll Y
ear
Sta
ffin
CCC Support
Increase in telecommunications costs $22 $0 $22 $0 0.0
Forecast based 2013 cost per minute = total telco expense less offset by a savings of $67,000 due to a reduction of a backup line that is no longer required. expense. See Exh No: SCG-11-WP/Witness E.Goldman page 47 Supplemental Workpaper
Telecommunications.
X
CCC Support
Process efficiency reductions due to automating OBD ($245) ($240) ($5) $0 (3.6)
Labor reduction as a result of process efficiency reductions due to automating the Outbound Dialing Process (OBD) were based on the actual 2013 labor for the OBD work group: 0.85 FTE x $73.4k = $62k LD OBD Clk; 1.81 FTEs x $64k = $115.9k FT OBD Clk; 0.96 FTE x $64.7k = $62k PT OBD Clk for a total reduction of 3.6 FTES and $240k in labor.
X
CCC Support
Telecommunications costs supporting CARE $28 $0 $28 $0 0.0
Forecast based 2013 cost per minute = total telco expense less offset by a savingof $67,000 due to a reduction of a backup line that is no longer required. expense. See Exh No: SCG-11-WP/Witness E.Goldman page 47 Supplemental Workpaper
Telecommunications.
X
Sub-Total $1,191 $908 $283 $0 10.5
Billing Meter growth $108 $108 $0 $0 1.4
1. Labor represents mixture of 1.4 FTE : Customer Billing Analyst(Grade 5), Special Accounts Represent(Grade 6) anLead Customer billing analyst (Grade 6). [(2013 Recorded labor for mixed grade 5 and 6 $3,314K = 43 FTE)] = 77K/FTE * 1.4 FTE = 108K X
Billing
Mass Market Billing Exception Backlog Reduction $116 $116 $0 $0 1.5
1. Labor represents mixture of 1.5 FTE : Customer Billing Analyst(Grade 5), Special Accounts Represent(Grade 6) anLead Customer billing analyst (Grade 6). [(2013 Recorded labor for mixed grade 5 and 6 $3,314K = 43 FTE)] = 77K/FTE * 1.5 FTE = 115K X
Billing
Adjustments for Full Year Staffing in Major Market Billing $86 $86 $0 $0 1.1
Billing Analyst II [(2013 recorded labor $35K = 0.48FTE) + (Mgt payband mid-point for SA5 @ $83k x 0.52FTE = $43k)]=$78k
Note: The adjustment amount of $43k was based on the payband mid-point for a SA5 position to provide a reasonable estimate of the incremental cost required for the full year funding of this position.
Business Analyst [(2013 recorded labor $33K = 0.55FTE) + (Mgt payband mid-point for SA3 @ $66k x 0.45FTE = $30k)]=$63k
Note: The adjustment amount of $30k was based on the payband mid-point for a SA3 position to provide a reasonable estimate of the incremental cost required for the full year funding of this position.
Svc Advr/Analyst [(2013 recorded labor $65K = 0.86FTE) + (Mgt payband mid-point for AD2 @ $93k x 0.14FTE = $13k)]=$78k
Note: The adjustment amount of $13k was based on the payband mid-point for a AD2 position to provide a reasonable estimate of the incremental cost required for the full year funding of this position.
X
Sub-Total $310 $310 $0 $0 4.0
MDO Meter growth $5 $0 $5 $0 0.0 The adjustment to the 2013 base year telemetry costs was to account for C&I
meter growth rates.X
Sub-Total $5 $0 $5 $0 0.0
Credit and Collections
Adjustments for full year staffing in Credit and Collections $117 $117 $0 $0 1.6
(a) $25K incremental labor represents 0.3 FTE for management employee (Project Specialist - MRR $59,000-$88,500 - Code SA4) based on annual salary of $76.4K. [Calc (76.4/12)*4) = 25](b) $92K incremental labor represents 1.3 FTE’s for full year staffing for represented employees (Collection Control Clerks - Level 5) based on annual salary of $73.4K ($35.15 hourly rate x 2088 hours) as stipulated in the Union Contract. [Calc (73.4*1.25) = 92]
X
EDG C‐3
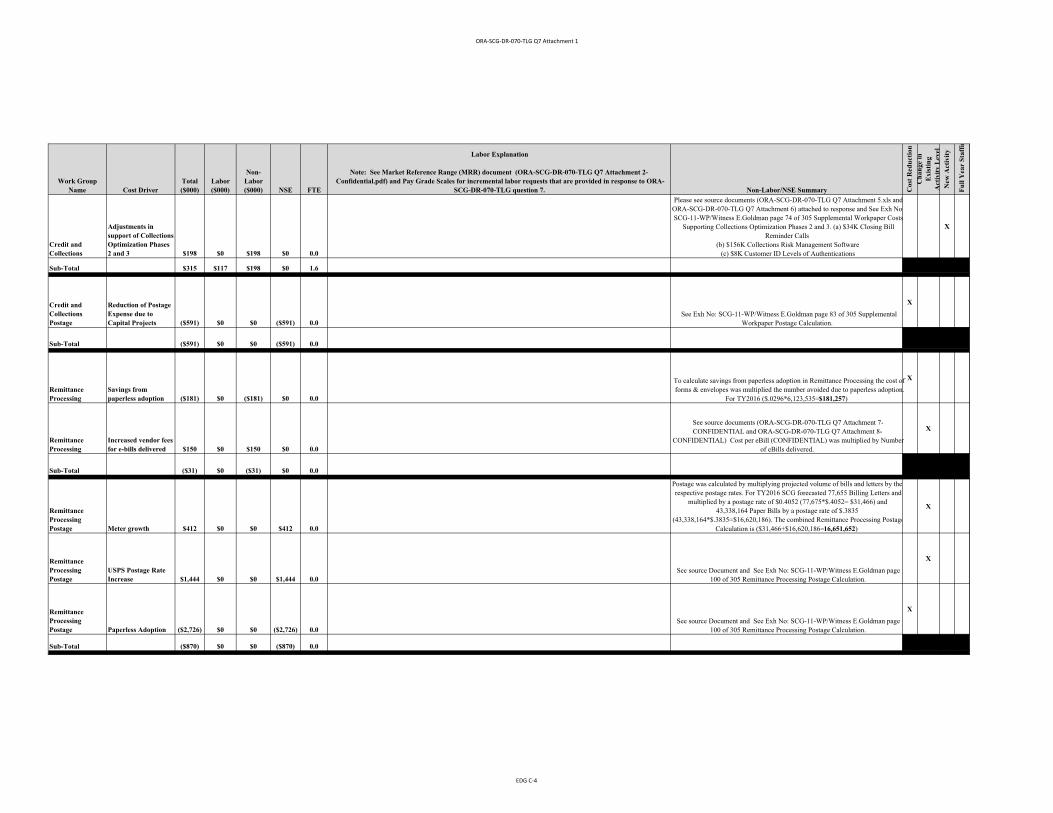
ORA‐SCG‐DR‐070‐TLG Q7 Attachment 1
Work Group Name Cost Driver
Total($000)
Labor ($000)
Non-Labor($000) NSE FTE
Labor Explanation
Note: See Market Reference Range (MRR) document (ORA-SCG-DR-070-TLG Q7 Attachment 2-Confidential.pdf) and Pay Grade Scales for incremental labor requests that are provided in response to ORA-
SCG-DR-070-TLG question 7. Non-Labor/NSE Summary Cos
t R
edu
ctio
n
Ch
ange
in
Exi
stin
g A
ctiv
ity
Lev
elN
ew A
ctiv
ity
Fu
ll Y
ear
Sta
ffin
Credit and Collections
Adjustments in support of Collections Optimization Phases 2 and 3 $198 $0 $198 $0 0.0
Please see source documents (ORA-SCG-DR-070-TLG Q7 Attachment 5.xls and ORA-SCG-DR-070-TLG Q7 Attachment 6) attached to response and See Exh NoSCG-11-WP/Witness E.Goldman page 74 of 305 Supplemental Workpaper Costs
Supporting Collections Optimization Phases 2 and 3. (a) $34K Closing Bill Reminder Calls
(b) $156K Collections Risk Management Software(c) $8K Customer ID Levels of Authentications
X
Sub-Total $315 $117 $198 $0 1.6
Credit and Collections Postage
Reduction of Postage Expense due to Capital Projects ($591) $0 $0 ($591) 0.0
See Exh No: SCG-11-WP/Witness E.Goldman page 83 of 305 Supplemental Workpaper Postage Calculation.
X
Sub-Total ($591) $0 $0 ($591) 0.0
Remittance Processing
Savings from paperless adoption ($181) $0 ($181) $0 0.0
To calculate savings from paperless adoption in Remittance Processing the cost of forms & envelopes was multiplied the number avoided due to paperless adoption.
For TY2016 ($.0296*6,123,535=$181,257)
X
Remittance Processing
Increased vendor fees for e-bills delivered $150 $0 $150 $0 0.0
See source documents (ORA-SCG-DR-070-TLG Q7 Attachment 7-CONFIDENTIAL and ORA-SCG-DR-070-TLG Q7 Attachment 8-
CONFIDENTIAL) Cost per eBill (CONFIDENTIAL) was multiplied by Number of eBills delivered.
X
Sub-Total ($31) $0 ($31) $0 0.0
Remittance Processing Postage Meter growth $412 $0 $0 $412 0.0
Postage was calculated by multiplying projected volume of bills and letters by therespective postage rates. For TY2016 SCG forecasted 77,655 Billing Letters and
multiplied by a postage rate of $0.4052 (77,675*$.4052= $31,466) and 43,338,164 Paper Bills by a postage rate of $.3835
(43,338,164*$.3835=$16,620,186). The combined Remittance Processing PostageCalculation is ($31,466+$16,620,186=16,651,652)
X
Remittance Processing Postage
USPS Postage Rate Increase $1,444 $0 $0 $1,444 0.0
See source Document and See Exh No: SCG-11-WP/Witness E.Goldman page 100 of 305 Remittance Processing Postage Calculation.
X
Remittance Processing Postage Paperless Adoption ($2,726) $0 $0 ($2,726) 0.0
See source Document and See Exh No: SCG-11-WP/Witness E.Goldman page 100 of 305 Remittance Processing Postage Calculation.
X
Sub-Total ($870) $0 $0 ($870) 0.0
EDG C‐4
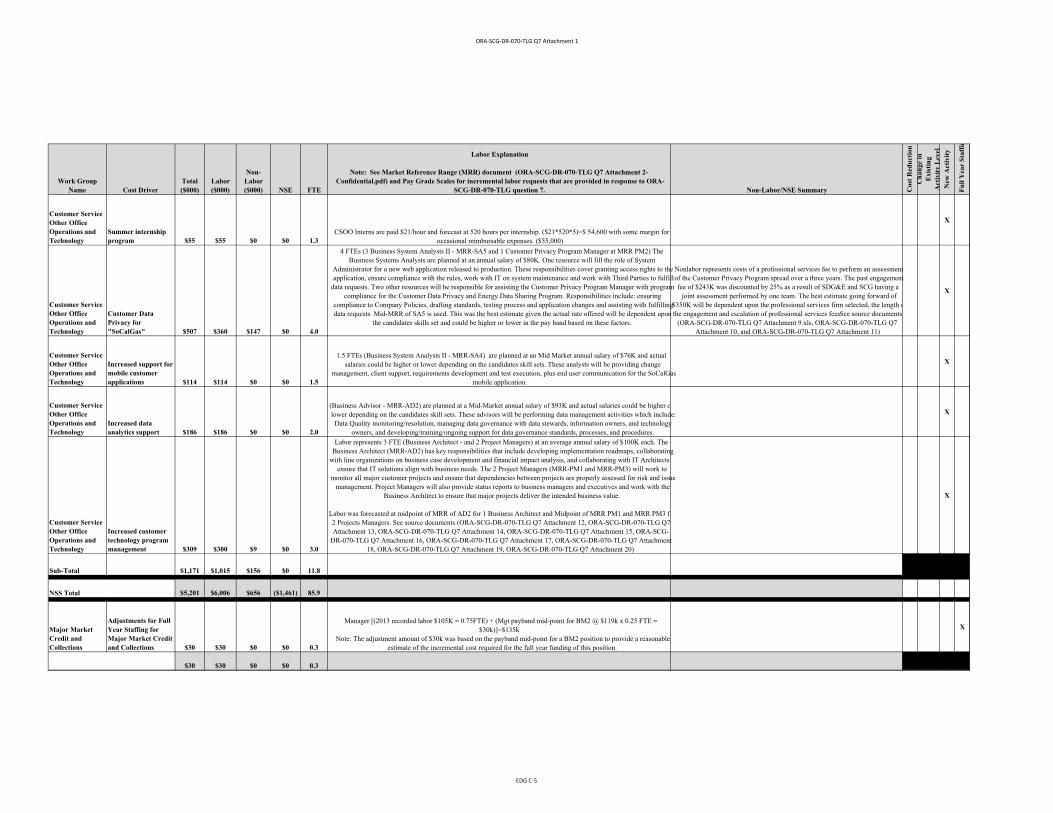
ORA‐SCG‐DR‐070‐TLG Q7 Attachment 1
Work Group Name Cost Driver
Total($000)
Labor ($000)
Non-Labor($000) NSE FTE
Labor Explanation
Note: See Market Reference Range (MRR) document (ORA-SCG-DR-070-TLG Q7 Attachment 2-Confidential.pdf) and Pay Grade Scales for incremental labor requests that are provided in response to ORA-
SCG-DR-070-TLG question 7. Non-Labor/NSE Summary Cos
t R
edu
ctio
n
Ch
ange
in
Exi
stin
g A
ctiv
ity
Lev
elN
ew A
ctiv
ity
Fu
ll Y
ear
Sta
ffin
Customer Service Other Office Operations and Technology
Summer internship program $55 $55 $0 $0 1.3
CSOO Interns are paid $21/hour and forecast at 520 hours per internship. ($21*520*5)=$ 54,600 with some margin for occasional reimbursable expenses. ($55,000)
X
Customer Service Other Office Operations and Technology
Customer Data Privacy for "SoCalGas" $507 $360 $147 $0 4.0
4 FTEs (3 Business System Analysts II - MRR-SA5 and 1 Customer Privacy Program Manager at MRR PM2) The Business Systems Analysts are planned at an annual salary of $80K. One resource will fill the role of System
Administrator for a new web application released to production. These responsibilities cover granting access rights to the application, ensure compliance with the rules, work with IT on system maintenance and work with Third Parties to fulfill
data requests. Two other resources will be responsible for assisting the Customer Privacy Program Manager with program compliance for the Customer Data Privacy and Energy Data Sharing Program. Responsibilities include: ensuring
compliance to Company Policies, drafting standards, testing process and application changes and assisting with fulfilling data requests. Mid-MRR of SA5 is used. This was the best estimate given the actual rate offered will be dependent upon
the candidates skills set and could be higher or lower in the pay band based on these factors.
Nonlabor represents costs of a professional services fee to perform an assessment of the Customer Privacy Program spread over a three years. The past engagement fee of $243K was discounted by 25% as a result of SDG&E and SCG having a
joint assessment performed by one team. The best estimate going forward of $350K will be dependent upon the professional services firm selected, the length othe engagement and escalation of professional services fees. See source documents
(ORA-SCG-DR-070-TLG Q7 Attachment 9.xls, ORA-SCG-DR-070-TLG Q7 Attachment 10, and ORA-SCG-DR-070-TLG Q7 Attachment 11)
X
Customer Service Other Office Operations and Technology
Increased support for mobile customer applications $114 $114 $0 $0 1.5
1.5 FTEs (Business System Analysts II - MRR-SA4) are planned at an Mid Market annual salary of $76K and actual salaries could be higher or lower depending on the candidates skill sets. These analysts will be providing change
management, client support, requirements development and test execution, plus end user communication for the SoCalGas mobile application.
X
Customer Service Other Office Operations and Technology
Increased data analytics support $186 $186 $0 $0 2.0
(Business Advisor - MRR-AD2) are planned at a Mid-Market annual salary of $93K and actual salaries could be higher olower depending on the candidates skill sets. These advisors will be performing data management activities which include: Data Quality monitoring/resolution, managing data governance with data stewards, information owners, and technology
owners, and developing/training/ongoing support for data governance standards, processes, and procedures.
X
Customer Service Other Office Operations and Technology
Increased customer technology program management $309 $300 $9 $0 3.0
Labor represents 3 FTE (Business Architect - and 2 Project Managers) at an average annual salary of $100K each. The Business Architect (MRR-AD2) has key responsibilities that include developing implementation roadmaps, collaborating
with line organizations on business case development and financial impact analysis, and collaborating with IT Architects ensure that IT solutions align with business needs. The 2 Project Managers (MRR-PM1 and MRR-PM3) will work to
monitor all major customer projects and ensure that dependencies between projects are properly assessed for risk and issue management. Project Managers will also provide status reports to business managers and executives and work with the
Business Architect to ensure that major projects deliver the intended business value.
Labor was forecasted at midpoint of MRR of AD2 for 1 Business Architect and Midpoint of MRR PM1 and MRR PM3 fo2 Projects Managers. See source documents (ORA-SCG-DR-070-TLG Q7 Attachment 12, ORA-SCG-DR-070-TLG Q7 Attachment 13, ORA-SCG-DR-070-TLG Q7 Attachment 14, ORA-SCG-DR-070-TLG Q7 Attachment 15, ORA-SCG-
DR-070-TLG Q7 Attachment 16, ORA-SCG-DR-070-TLG Q7 Attachment 17, ORA-SCG-DR-070-TLG Q7 Attachment 18, ORA-SCG-DR-070-TLG Q7 Attachment 19, ORA-SCG-DR-070-TLG Q7 Attachment 20)
X
Sub-Total $1,171 $1,015 $156 $0 11.8
$5,201 $6,006 $656 ($1,461) 85.9
Major Market Credit and Collections
Adjustments for Full Year Staffing for Major Market Credit and Collections $30 $30 $0 $0 0.3
Manager [(2013 recorded labor $105K = 0.75FTE) + (Mgt payband mid-point for BM2 @ $119k x 0.25 FTE = $30k)]=$135k
Note: The adjustment amount of $30k was based on the payband mid-point for a BM2 position to provide a reasonable estimate of the incremental cost required for the full year funding of this position.
X
$30 $30 $0 $0 0.3
NSS Total
EDG C‐5
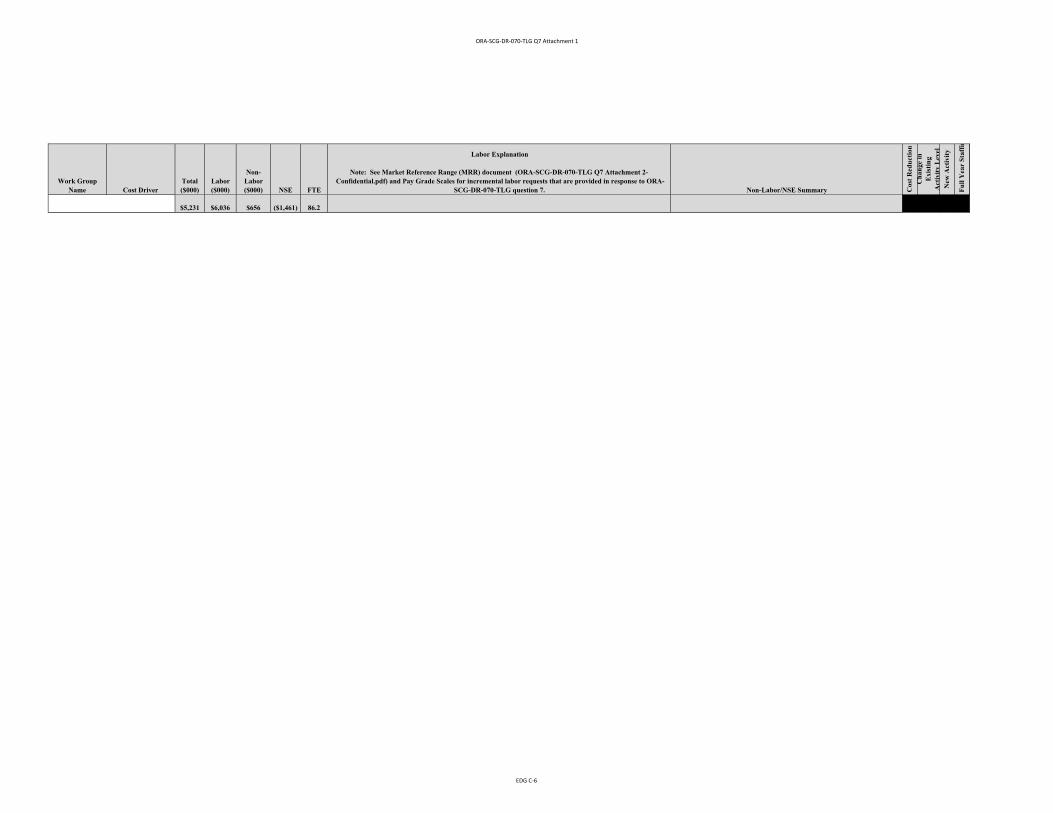
ORA‐SCG‐DR‐070‐TLG Q7 Attachment 1
Work Group Name Cost Driver
Total($000)
Labor ($000)
Non-Labor($000) NSE FTE
Labor Explanation
Note: See Market Reference Range (MRR) document (ORA-SCG-DR-070-TLG Q7 Attachment 2-Confidential.pdf) and Pay Grade Scales for incremental labor requests that are provided in response to ORA-
SCG-DR-070-TLG question 7. Non-Labor/NSE Summary Cos
t R
edu
ctio
n
Ch
ange
in
Exi
stin
g A
ctiv
ity
Lev
elN
ew A
ctiv
ity
Fu
ll Y
ear
Sta
ffin
$5,231 $6,036 $656 ($1,461) 86.2
EDG C‐6

ATTACHMENT D
ORA Data Request, ORA-SCG-DR-070-TLG, Question 1
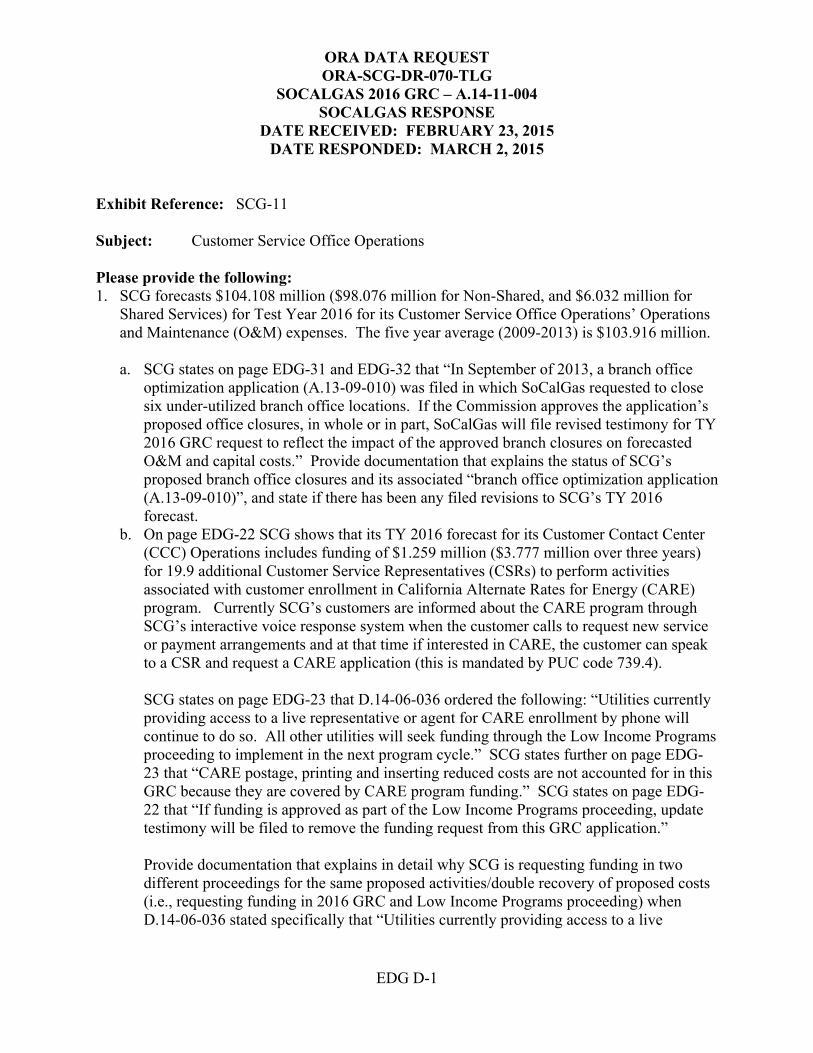
ORA DATA REQUEST ORA-SCG-DR-070-TLG
SOCALGAS 2016 GRC – A.14-11-004 SOCALGAS RESPONSE
DATE RECEIVED: FEBRUARY 23, 2015 DATE RESPONDED: MARCH 2, 2015
EDG D-1
Exhibit Reference: SCG-11 Subject: Customer Service Office Operations Please provide the following: 1. SCG forecasts $104.108 million ($98.076 million for Non-Shared, and $6.032 million for
Shared Services) for Test Year 2016 for its Customer Service Office Operations’ Operations and Maintenance (O&M) expenses. The five year average (2009-2013) is $103.916 million.
a. SCG states on page EDG-31 and EDG-32 that “In September of 2013, a branch office
optimization application (A.13-09-010) was filed in which SoCalGas requested to close six under-utilized branch office locations. If the Commission approves the application’s proposed office closures, in whole or in part, SoCalGas will file revised testimony for TY 2016 GRC request to reflect the impact of the approved branch closures on forecasted O&M and capital costs.” Provide documentation that explains the status of SCG’s proposed branch office closures and its associated “branch office optimization application (A.13-09-010)”, and state if there has been any filed revisions to SCG’s TY 2016 forecast.
b. On page EDG-22 SCG shows that its TY 2016 forecast for its Customer Contact Center (CCC) Operations includes funding of $1.259 million ($3.777 million over three years) for 19.9 additional Customer Service Representatives (CSRs) to perform activities associated with customer enrollment in California Alternate Rates for Energy (CARE) program. Currently SCG’s customers are informed about the CARE program through SCG’s interactive voice response system when the customer calls to request new service or payment arrangements and at that time if interested in CARE, the customer can speak to a CSR and request a CARE application (this is mandated by PUC code 739.4). SCG states on page EDG-23 that D.14-06-036 ordered the following: “Utilities currently providing access to a live representative or agent for CARE enrollment by phone will continue to do so. All other utilities will seek funding through the Low Income Programs proceeding to implement in the next program cycle.” SCG states further on page EDG-23 that “CARE postage, printing and inserting reduced costs are not accounted for in this GRC because they are covered by CARE program funding.” SCG states on page EDG-22 that “If funding is approved as part of the Low Income Programs proceeding, update testimony will be filed to remove the funding request from this GRC application.” Provide documentation that explains in detail why SCG is requesting funding in two different proceedings for the same proposed activities/double recovery of proposed costs (i.e., requesting funding in 2016 GRC and Low Income Programs proceeding) when D.14-06-036 stated specifically that “Utilities currently providing access to a live
ORA DATA REQUEST ORA-SCG-DR-070-TLG
SOCALGAS 2016 GRC – A.14-11-004 SOCALGAS RESPONSE
DATE RECEIVED: FEBRUARY 23, 2015 DATE RESPONDED: MARCH 2, 2015
EDG D-2
Question 1 (Continued)
representative or agent for CARE enrollment by phone will continue to do so. All other utilities will seek funding through the Low Income Programs proceeding to implement in the next program cycle.”
c. Regarding SCG’s Integrated Customer Data & Analytics project, SCG states on page EDG-63 that “The current system constrains SoCalGas’ ability to manage, sort and analyze customer data for business decision making. The current data warehouse is a collection of many sources, requiring business analysts to navigate multiple databases and spend excessive time manually integrating data to answer basic business questions…Due to the size of the data, the duplication of locations and the age of the data management and report generation technology, it can require several days or longer to run and compile large reports.” Provide documentation that demonstrates all costs incurred by SCG’s business analysts (provide the number of FTEs performing the activity) during 2009-2013 “to navigate multiple databases and spend excessive time manually integrating data to answer basic business questions” and required “several days or longer to run and compile large reports.”
d. Provide documentation that explains specifically and demonstrates where in SCG’s TY 2016 GRC, SCG shows the incorporation of the calculated savings from costs that were incurred during 2009-2013 from SCG’s business analysts that no longer will be required “to navigate multiple databases and spend excessive time manually integrating data to answer basic business questions” and no longer being required to “several days or longer to run and compile large reports.”
e. SCE’s 2016 forecast includes incremental funding for additional FTEs, provide documentation that explains in detail why SCG is not able to reallocate embedded funding from eliminated projects, maintenance costs from eliminated projects/programs, costs incurred for eliminated procedures and processes, and overtime costs to fund proposed activities and additional FTEs in TY 2016.
SoCalGas Response:
a. SoCalGas’ proposed branch office closures are pending in A.13-09-010. Pursuant to the Ruling of ALJ Halligan dated July 16, 2014 in A.13-09-010, SoCalGas submitted Opening and Reply Briefs in August 2014. SoCalGas is awaiting issuance of a proposed decision in A.13-09-010. There have been no filed revisions to SoCalGas’ TY2016 forecast in the Branch Offices.
ORA DATA REQUEST ORA-SCG-DR-070-TLG
SOCALGAS 2016 GRC – A.14-11-004 SOCALGAS RESPONSE
DATE RECEIVED: FEBRUARY 23, 2015 DATE RESPONDED: MARCH 2, 2015
EDG D-3
SoCalGas Response (Continued):
b. SoCalGas clarifies that that the statement quoted from page EDG-23 is contained in the Settlement Agreement that was adopted by D.14-06-036.
SoCalGas is compliant with the Settlement Agreement provision to propose CSR funding for CARE enrollment in its Low Income Programs application (A.) 14-11-011
The Commission, in D.05-04-052, did not allow call center costs to be charged to the CARE Program. Although more recently, in D.12-08-044, the Commission authorized Southern California Edison to recover these costs through the Low Income Proceeding, the Commission has not yet authorized this treatment for SoCalGas. SoCalGas has thus made a concurrent request in its test year 2016 GRC in the event the Commission rejects the funding request in A.14-11-011. This ensures the proposal receives consideration and can be acted upon in the proceeding deemed prudent by the Commission.
SoCalGas also indicated the following in A.14-11-011, the testimony of SoCalGas witnesses Carmen Rudshagen and Hugh Yao:
SoCalGas has also requested concurrent funding for this effort as part of its Test Year 2016 General Rate Case (“GRC”) Application to be filed in November 2014. Should funding be approved as part of this Low-Income Application proceeding, SoCalGas will remove its funding request for this effort in the GRC.
SoCalGas is thus clear and explicit that it does not propose “double recovery” of the proposed costs.
c. The Integrated Customer Data Analytics (ICDA) project is being implemented in order to improve the availability and accuracy of data used by SCG to make business decisions. The business case for the ICDA project did not include cost savings related to reducing costs or headcount of business analysts at the company. However SoCalGas anticipates that providing better access to data and better tools for analysis will create greater efficiencies for business analysts, thereby allowing analysts to conduct more timely and frequent analysis and focus on more complex analytical problems.
ORA DATA REQUEST ORA-SCG-DR-070-TLG
SOCALGAS 2016 GRC – A.14-11-004 SOCALGAS RESPONSE
DATE RECEIVED: FEBRUARY 23, 2015 DATE RESPONDED: MARCH 2, 2015
EDG D-4
SoCalGas Response Question 1c (Continued):
SCG does not track business analyst work hours to the level of detail that would be required to provide specific costs associated with these activities. In the industry-standard CRISP-DM (Cross Industry Standard Process for Data Mining) methodology, IBM identifies the Data Preparation phase as accounting for up to 70% of the total time spent for almost every data analysis effort. Based on observations and internal interviews, this cross-industry norm holds true at SCG. Similar to other companies in the U.S. and globally, SCG is working to address these problems and manage our customer data in way that reduces the time required for data preparation.
The volume of data that SCG is managing is increasing at a rapid rate, especially with the introduction of customer interval usage data provided by Advanced Meters. Since 2010, the volume of customer data that SCG manages has more than doubled and is projected to triple again between now and 2019. It is critical that SCG have the appropriate tools to manage that data to validate data quality, ensure customer privacy, and leverage data to gain business insights that will help us manage costs and enhance customer experience.
d. SCG does not anticipate reducing business analyst headcount. ICDA will enable business analysts to have access to more accurate and timely data, and to spend more time doing analysis and less time on data preparation activities.
e. Even though this question refers to SCE, SoCalGas interprets this question to relate to the SoCalGas request and responds accordingly. SoCalGas believes the Base Year 2013 resources will not be sufficient for incremental requests in the TY2016 forecast. BY2013 numbers represent ongoing costs that are expected to reoccur in TY2016 and subsequent years. In the TY2016 forecast, SoCalGas has taken reductions totaling ($4,967K) from 2013 base year adjusted recorded results for self-service adoption in CCC Operations ($1,224K); the automation of Out Bound Dialing in CCC Support ($245K); reduction of postage costs in Credit and Collections Postage that are associated with combining Late Payment Notices with customer bills ($591K); and reductions in Remittance Processing ($181K) and Remittance Processing Postage ($2,726K) for savings associated with continued migration towards paperless billing. Additionally, the BY2013 adjusted recorded results and FTEs used as a starting point for TY2016 forecasts already reflect additional efficiencies that resulted in $5,408K in avoided costs for rate payers (Please see Appendix A in Exhibit No SCG-11 for details.)
Incremental requests reflect additional forecasted activities in TY2016 that cannot be completed with existing resources. These incremental requests are outlined in the testimony and workpapers of witness Evan Goldman in Exhibit No: SCG-11 and SCG-11-WP.
ORA DATA REQUEST ORA-SCG-DR-070-TLG
SOCALGAS 2016 GRC – A.14-11-004 SOCALGAS RESPONSE
DATE RECEIVED: FEBRUARY 23, 2015 DATE RESPONDED: MARCH 2, 2015
EDG D-5
SoCalGas Response Question 1c (Continued):
The TY2016 forecast for the following areas of CSOO is at or below BY2013 adjusted recorded levels: Branch Offices, Remittance Processing, Remittance Processing Postage, USS cost centers 2200-0355 (Payment Processing), 2200-2240 (SR VP Customer Service Innovation and Strategy), and 2200-2247 (Manager of Remittance Processing).

ATTACHMENT E
Customer Insight Panel – Residential
Web Chat Usage
socalgas.com Web Chat
August 8, 2014
Customer Insight Panel- Residential
EDG E-1
Web Chat Usage and Attitudes
EDG E-2
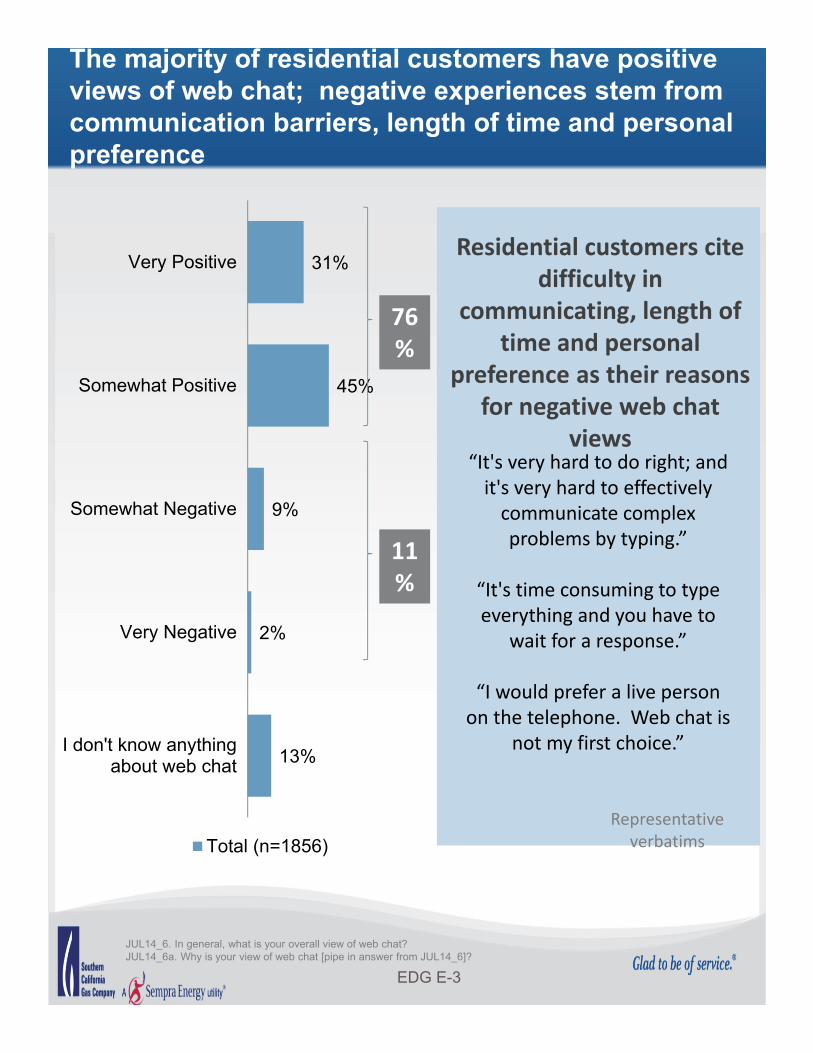
31%
45%
9%
2%
13%
Very Positive
Somewhat Positive
Somewhat Negative
Very Negative
I don't know anythingabout web chat
Total (n=1856)
JUL14_6. In general, what is your overall view of web chat?JUL14_6a. Why is your view of web chat [pipe in answer from JUL14_6]?
EDG E-3
The majority of residential customers have positive views of web chat; negative experiences stem from communication barriers, length of time and personal preference
76%
“It's very hard to do right; and it's very hard to effectively communicate complex problems by typing.”
“It's time consuming to type everything and you have to
wait for a response.”
“I would prefer a live person on the telephone. Web chat is
not my first choice.”
Residential customers cite difficulty in
communicating, length of time and personal
preference as their reasons for negative web chat
views
Representative verbatims
11%
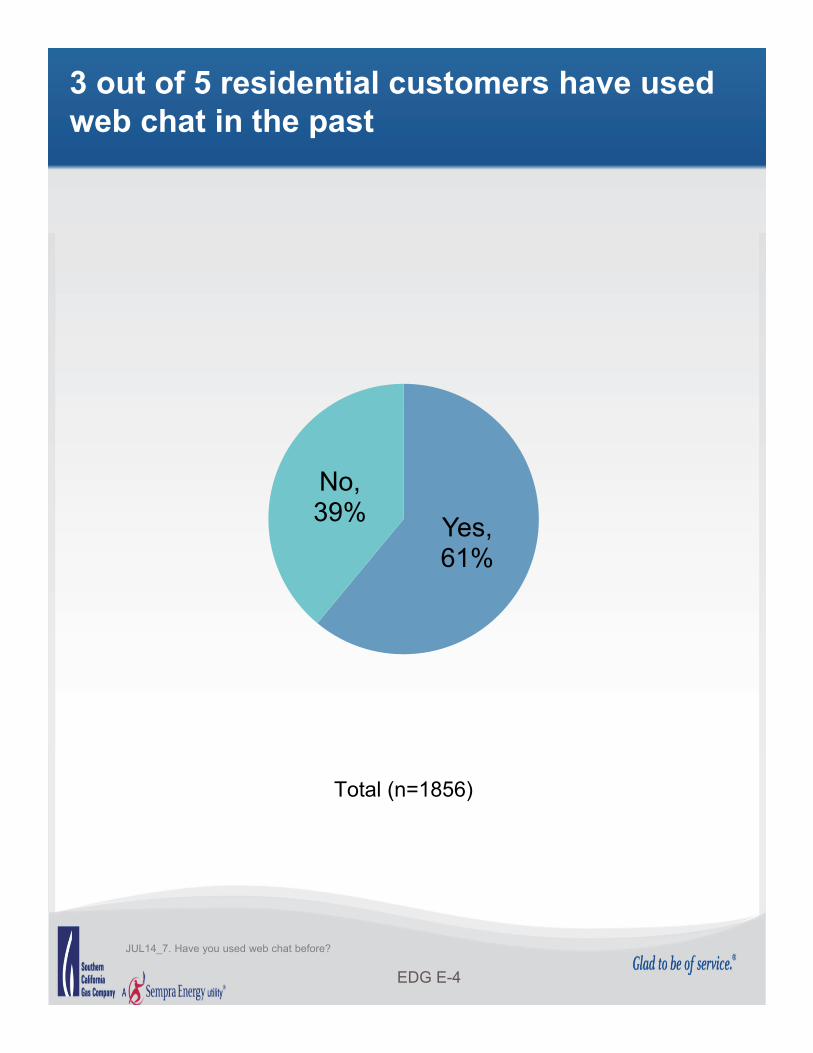
JUL14_7. Have you used web chat before?
3 out of 5 residential customers have used web chat in the past
Yes, 61%
No, 39%
Total (n=1856)
EDG E-4
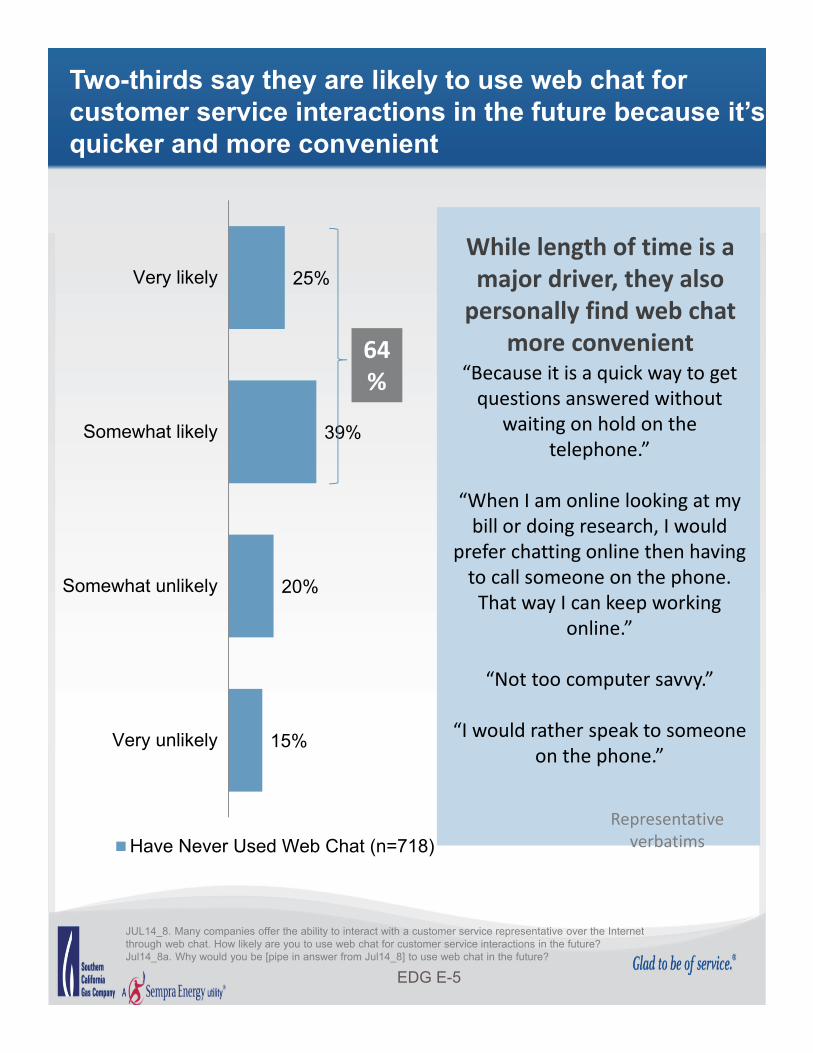
25%
39%
20%
15%
Very likely
Somewhat likely
Somewhat unlikely
Very unlikely
Have Never Used Web Chat (n=718)
JUL14_8. Many companies offer the ability to interact with a customer service representative over the Internet through web chat. How likely are you to use web chat for customer service interactions in the future?Jul14_8a. Why would you be [pipe in answer from Jul14_8] to use web chat in the future?
Two-thirds say they are likely to use web chat for customer service interactions in the future because it’s quicker and more convenient
64% “Because it is a quick way to get
questions answered without waiting on hold on the
telephone.”
“When I am online looking at my bill or doing research, I would
prefer chatting online then having to call someone on the phone. That way I can keep working
online.”
“Not too computer savvy.”
“I would rather speak to someone on the phone.”
While length of time is a major driver, they also personally find web chat
more convenient
Representative verbatims
EDG E-5
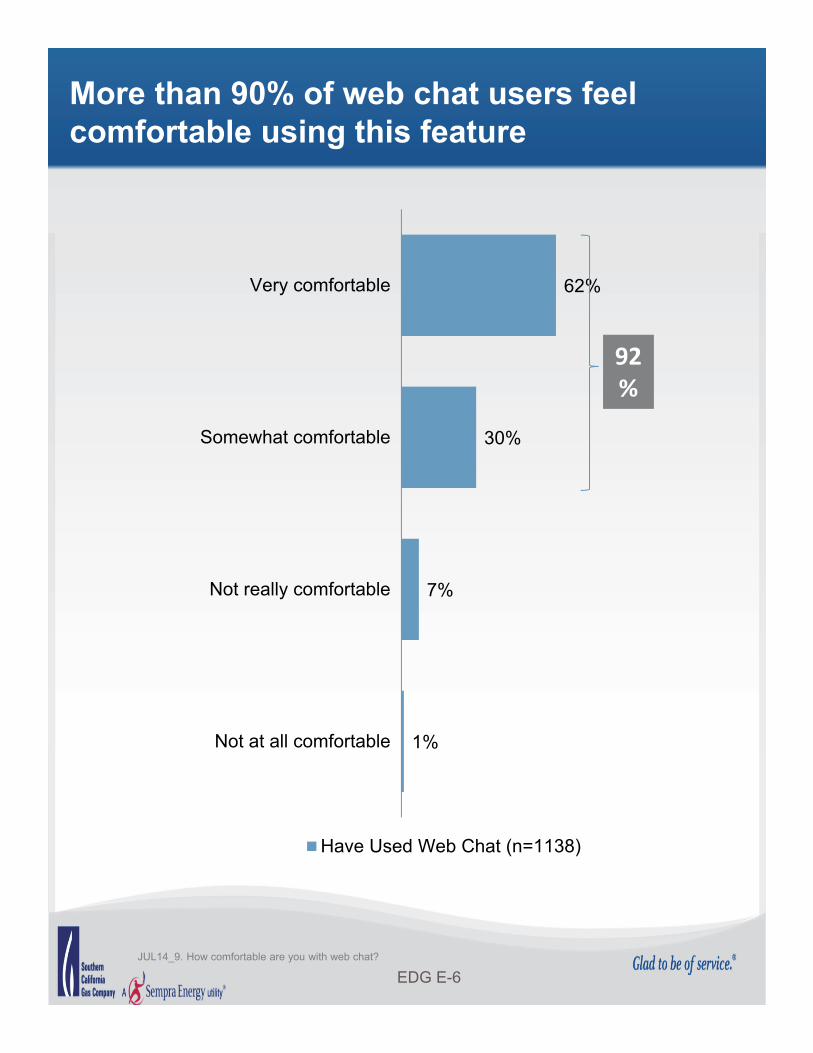
JUL14_9. How comfortable are you with web chat?
More than 90% of web chat users feel comfortable using this feature
62%
30%
7%
1%
Very comfortable
Somewhat comfortable
Not really comfortable
Not at all comfortable
Have Used Web Chat (n=1138)
92%
EDG E-6
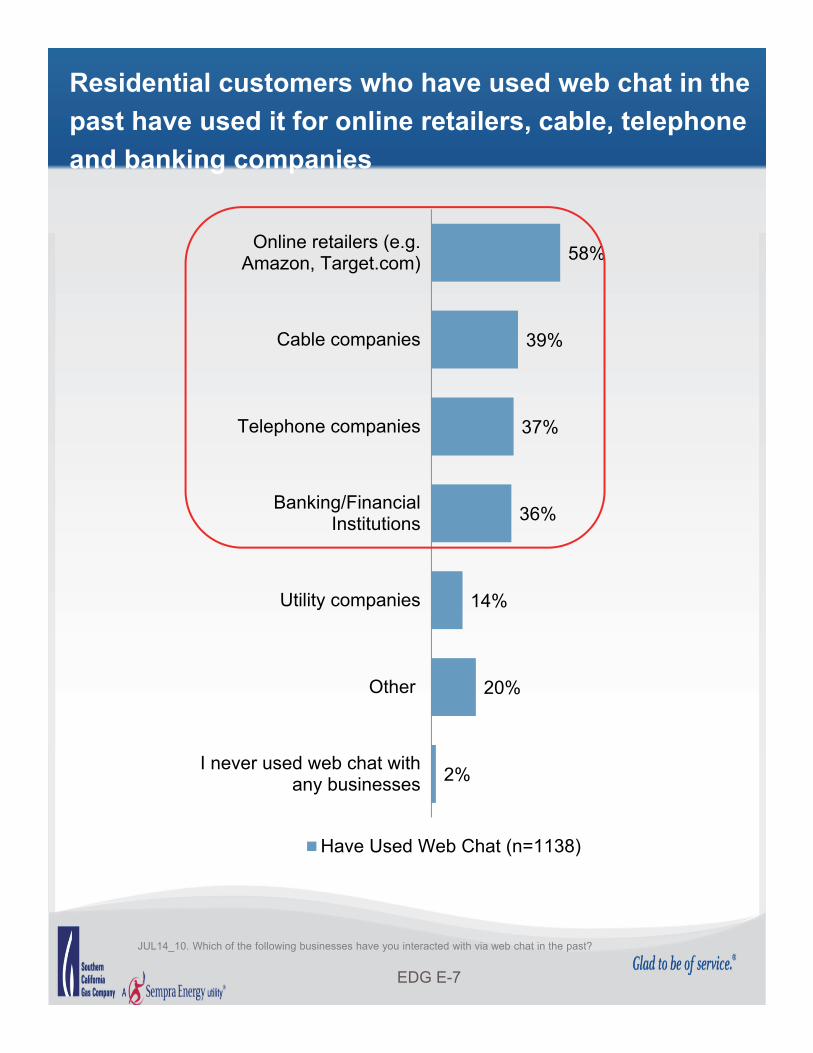
JUL14_10. Which of the following businesses have you interacted with via web chat in the past?
Residential customers who have used web chat in the
past have used it for online retailers, cable, telephone
and banking companies
58%
39%
37%
36%
14%
20%
2%
Online retailers (e.g.Amazon, Target.com)
Cable companies
Telephone companies
Banking/FinancialInstitutions
Utility companies
Other
I never used web chat withany businesses
Have Used Web Chat (n=1138)
EDG E-7
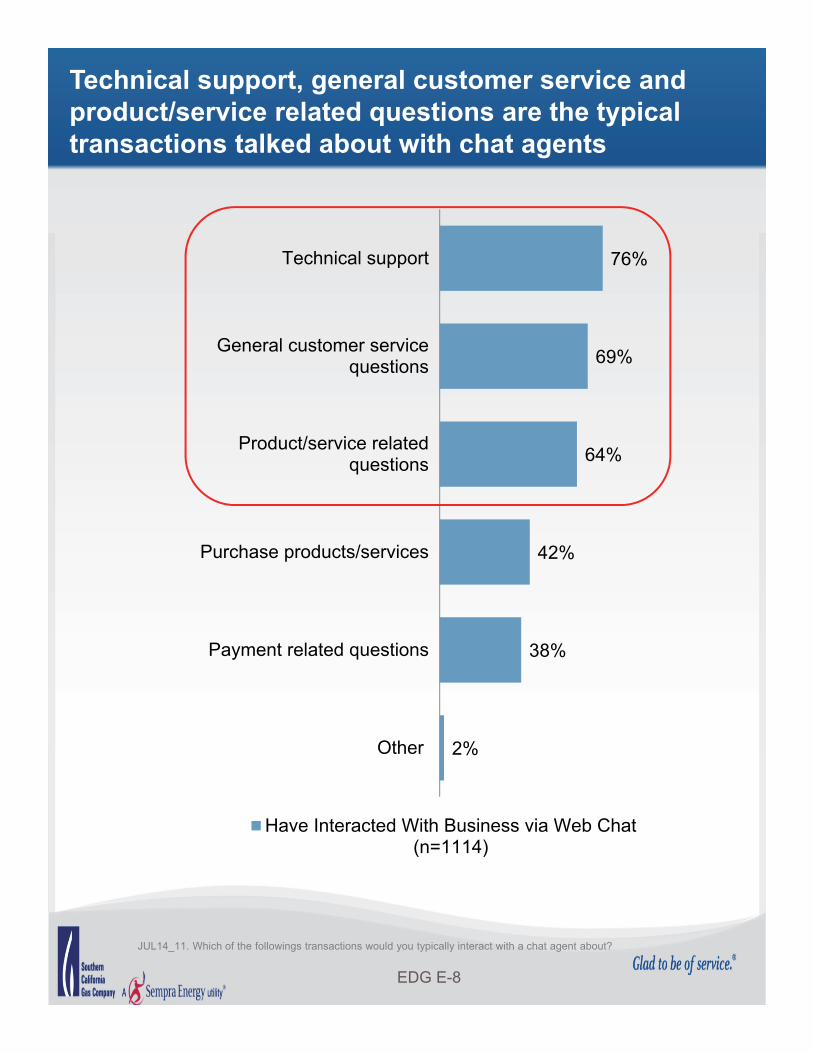
JUL14_11. Which of the followings transactions would you typically interact with a chat agent about?
Technical support, general customer service and product/service related questions are the typical transactions talked about with chat agents
76%
69%
64%
42%
38%
2%
Technical support
General customer servicequestions
Product/service relatedquestions
Purchase products/services
Payment related questions
Other
Have Interacted With Business via Web Chat(n=1114)
EDG E-8
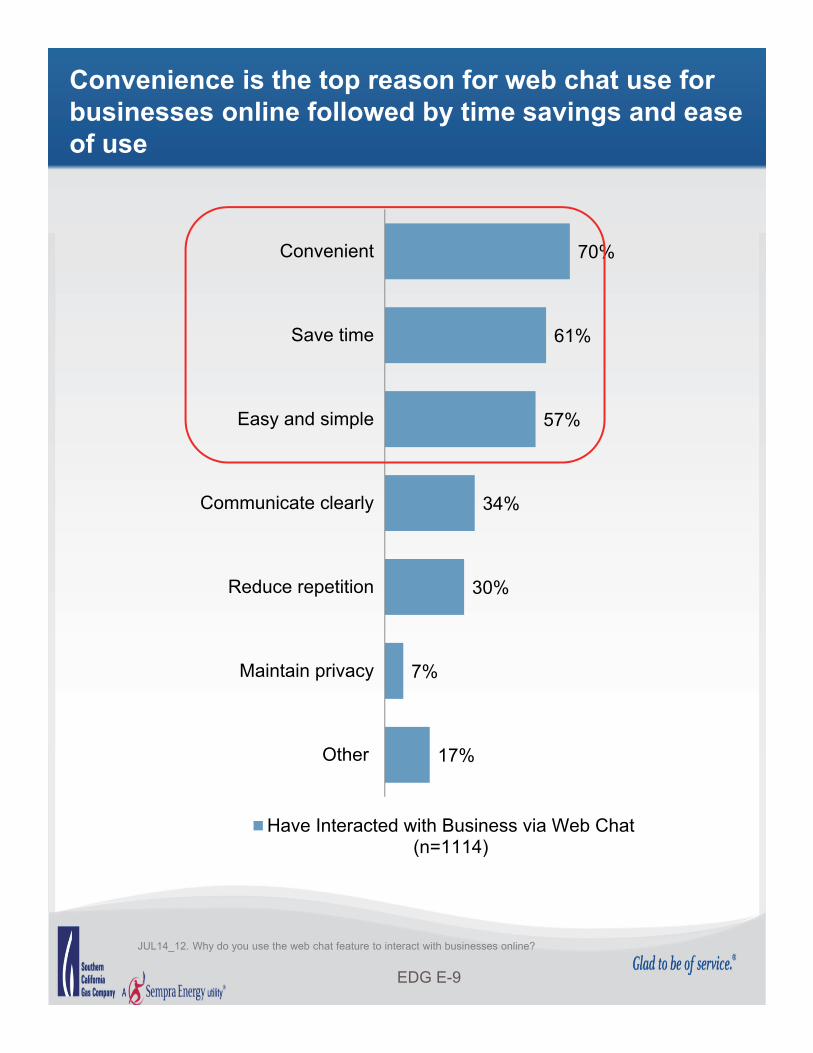
JUL14_12. Why do you use the web chat feature to interact with businesses online?
Convenience is the top reason for web chat use for businesses online followed by time savings and ease of use
70%
61%
57%
34%
30%
7%
17%
Convenient
Save time
Easy and simple
Communicate clearly
Reduce repetition
Maintain privacy
Other
Have Interacted with Business via Web Chat(n=1114)
EDG E-9
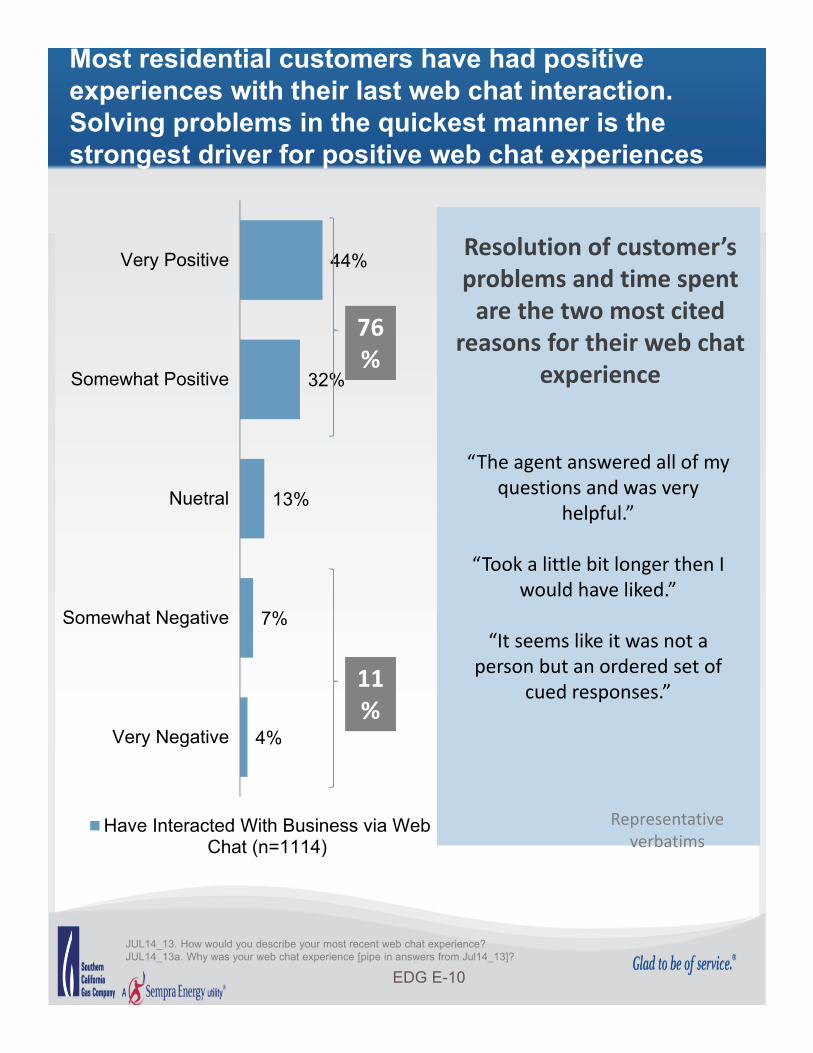
44%
32%
13%
7%
4%
Very Positive
Somewhat Positive
Nuetral
Somewhat Negative
Very Negative
Have Interacted With Business via WebChat (n=1114)
JUL14_13. How would you describe your most recent web chat experience?JUL14_13a. Why was your web chat experience [pipe in answers from Jul14_13]?
Most residential customers have had positive experiences with their last web chat interaction. Solving problems in the quickest manner is the strongest driver for positive web chat experiences
76%
“The agent answered all of my questions and was very
helpful.”
“Took a little bit longer then I would have liked.”
“It seems like it was not a person but an ordered set of
cued responses.”
Resolution of customer’s problems and time spent are the two most cited
reasons for their web chat experience
Representative verbatims
11%
EDG E-10
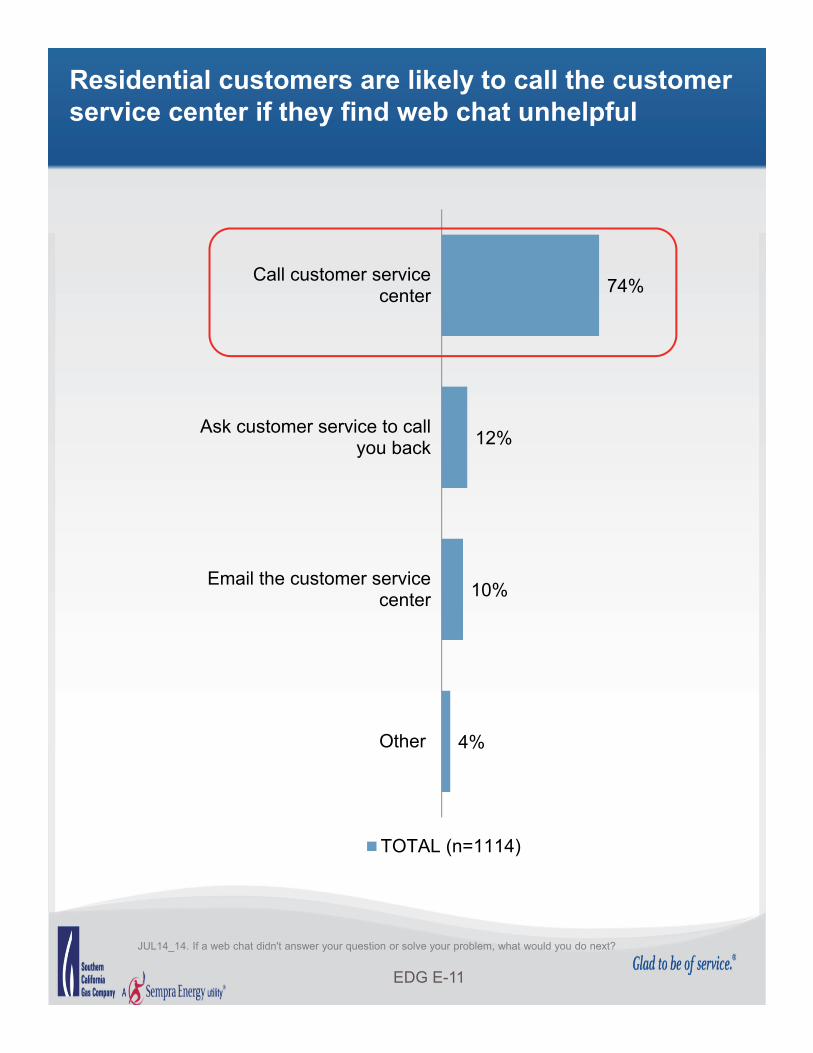
JUL14_14. If a web chat didn't answer your question or solve your problem, what would you do next?
Residential customers are likely to call the customer service center if they find web chat unhelpful
74%
12%
10%
4%
Call customer servicecenter
Ask customer service to callyou back
Email the customer servicecenter
Other
TOTAL (n=1114)
EDG E-11
socalgas.com Web Chat
EDG E-12
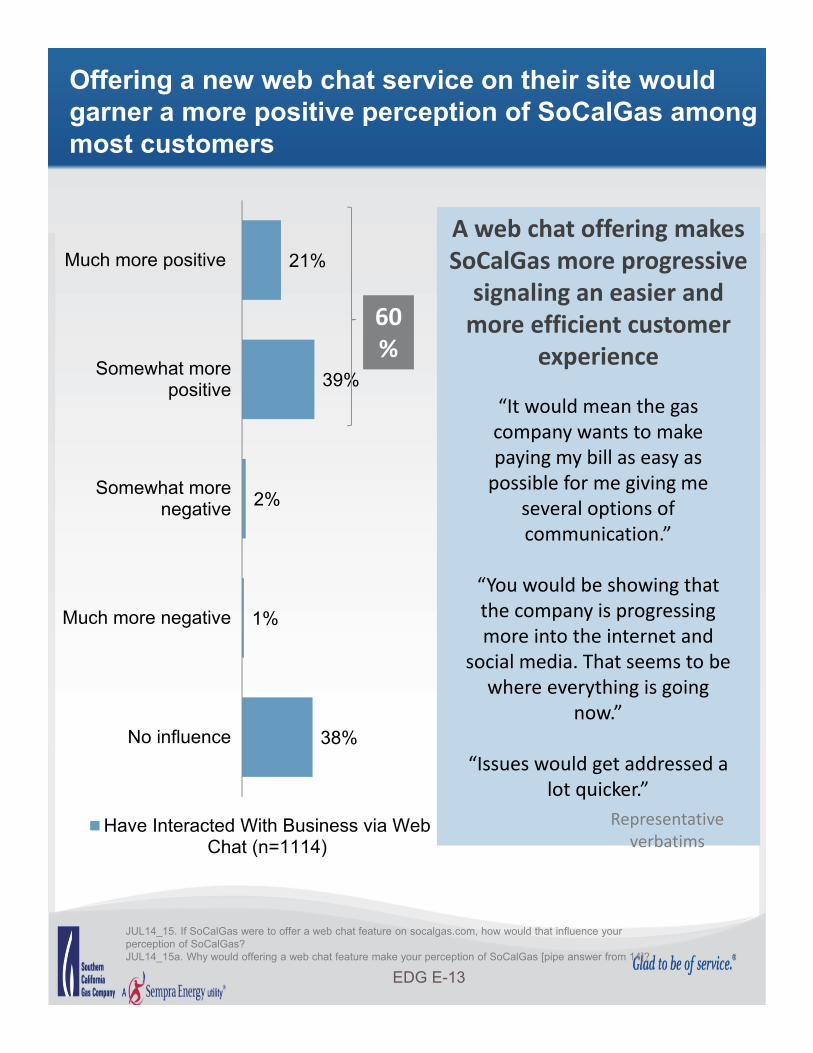
21%
39%
2%
1%
38%
Much more positive
Somewhat morepositive
Somewhat morenegative
Much more negative
No influence
Have Interacted With Business via WebChat (n=1114)
JUL14_15. If SoCalGas were to offer a web chat feature on socalgas.com, how would that influence your perception of SoCalGas?JUL14_15a. Why would offering a web chat feature make your perception of SoCalGas [pipe answer from 14]?
Offering a new web chat service on their site would garner a more positive perception of SoCalGas among most customers
60%
“It would mean the gas company wants to make paying my bill as easy as possible for me giving me
several options of communication.”
“You would be showing that the company is progressing more into the internet and
social media. That seems to be where everything is going
now.”
“Issues would get addressed a lot quicker.”
A web chat offering makes SoCalGas more progressive signaling an easier and more efficient customer
experience
Representative verbatims
EDG E-13
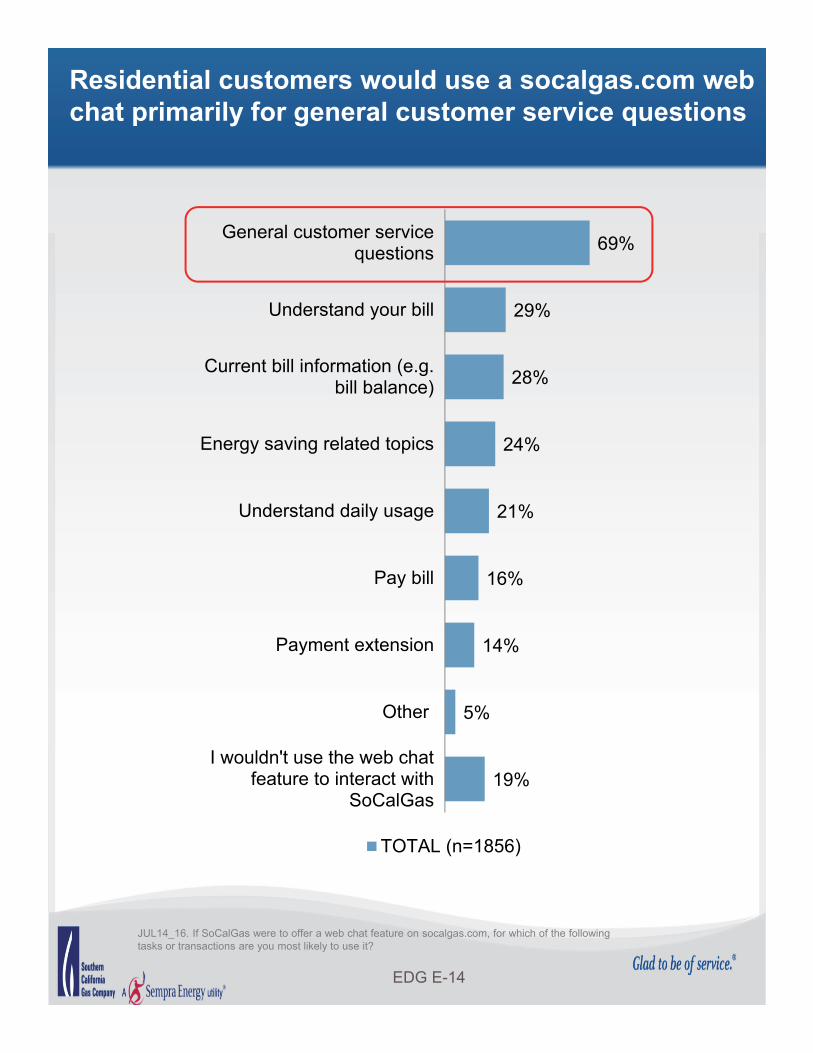
JUL14_16. If SoCalGas were to offer a web chat feature on socalgas.com, for which of the following tasks or transactions are you most likely to use it?
Residential customers would use a socalgas.com web chat primarily for general customer service questions
69%
29%
28%
24%
21%
16%
14%
5%
19%
General customer servicequestions
Understand your bill
Current bill information (e.g.bill balance)
Energy saving related topics
Understand daily usage
Pay bill
Payment extension
Other
I wouldn't use the web chatfeature to interact with
SoCalGas
TOTAL (n=1856)
EDG E-14
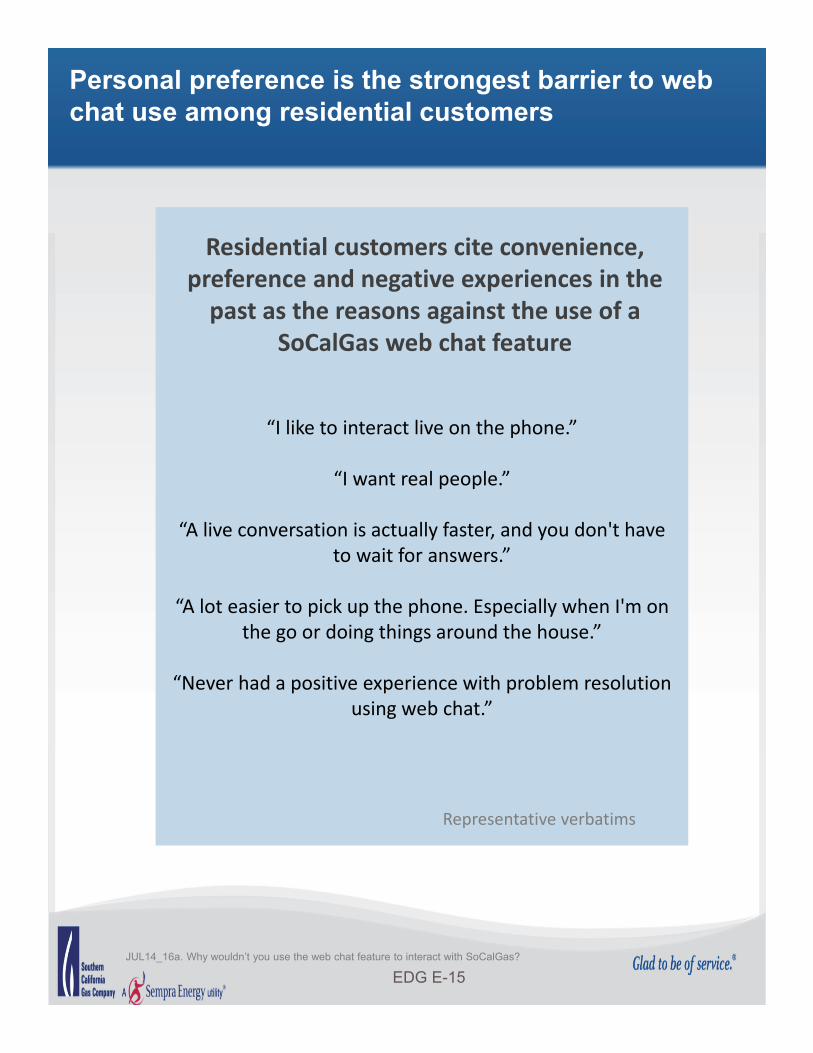
JUL14_16a. Why wouldn’t you use the web chat feature to interact with SoCalGas?
Personal preference is the strongest barrier to web chat use among residential customers
“I like to interact live on the phone.”
“I want real people.”
“A live conversation is actually faster, and you don't have to wait for answers.”
“A lot easier to pick up the phone. Especially when I'm on the go or doing things around the house.”
“Never had a positive experience with problem resolution using web chat.”
Residential customers cite convenience, preference and negative experiences in the past as the reasons against the use of a
SoCalGas web chat feature
Representative verbatims
EDG E-15
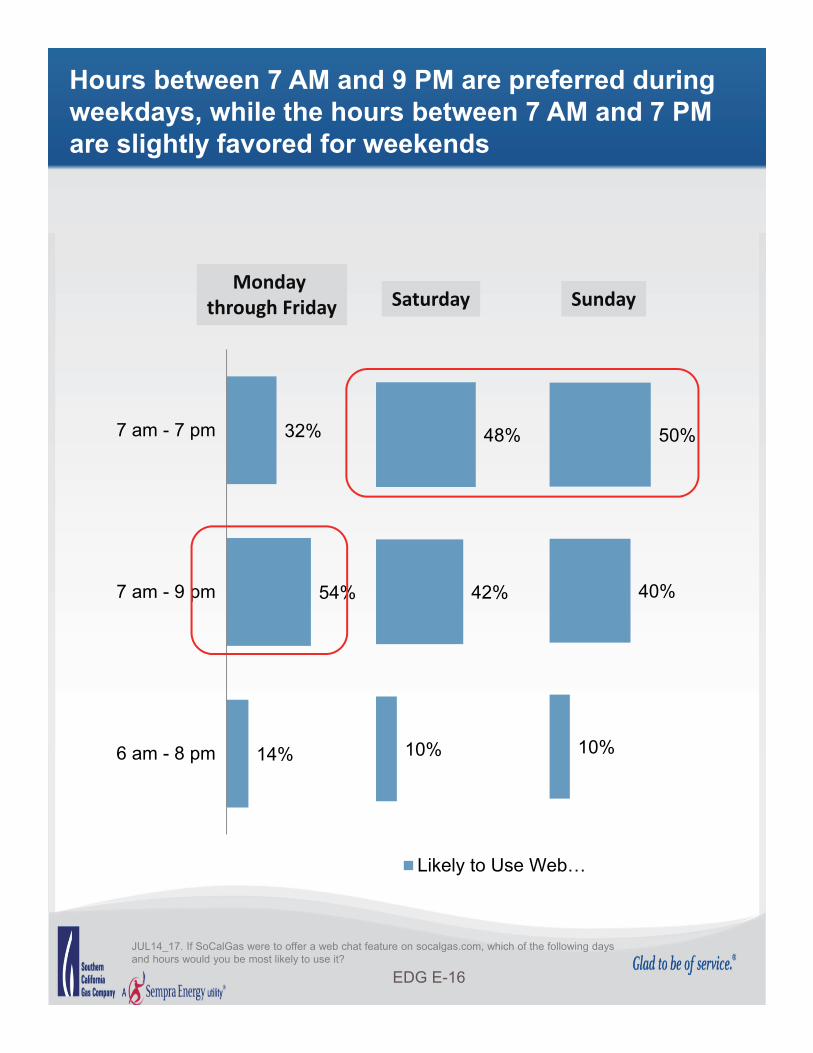
JUL14_17. If SoCalGas were to offer a web chat feature on socalgas.com, which of the following days and hours would you be most likely to use it?
Hours between 7 AM and 9 PM are preferred during weekdays, while the hours between 7 AM and 7 PM are slightly favored for weekends
32%
54%
14%
7 am - 7 pm
7 am - 9 pm
6 am - 8 pm
48%
42%
10%
Likely to Use Web…
50%
40%
10%
Monday through Friday Saturday Sunday
EDG E-16
2014 Residential PanelBackground
• The 2014 residential panel is made up of 3,514 residentialcustomers that represent SoCalGas service territory.
• Random selected residential customers were invited to jointhe 2014 residential panel in January 2014. The 2014residential online panel is the 6th year of SoCalGasCustomer Insight Panel.
• Residential panelists agree to participate in approximately1 online survey per month for a period of 1 year.
• The web chat survey was conducted in July 2014 (July 9 –July 23) and 1,856 residential panelists completed thesurvey.
• Results are based on independent T-Test for means (equalvariances), and independent Z-Test for percentages (pooledproportions). The significance is at the 95% level.
• SoCalGas Customer Insight Panel is managed by an outsidevendor, Vision Critical. All data panel data collected arehosted on their sites.
EDG E-17