Embed Size (px)
Citation preview
1
USC
C S E University of Southern CaliforniaCenter for Software Engineering
SoCal SPIN – 5/2/03
Southern California Software Process Improvement Network (SPIN)CSU Long Beach
May 2, 2003
Ricardo ValerdiUniversity of Southern CaliforniaCenter for Software Engineering

2
USC
C S E University of Southern CaliforniaCenter for Software Engineering
SoCal SPIN – 5/2/03
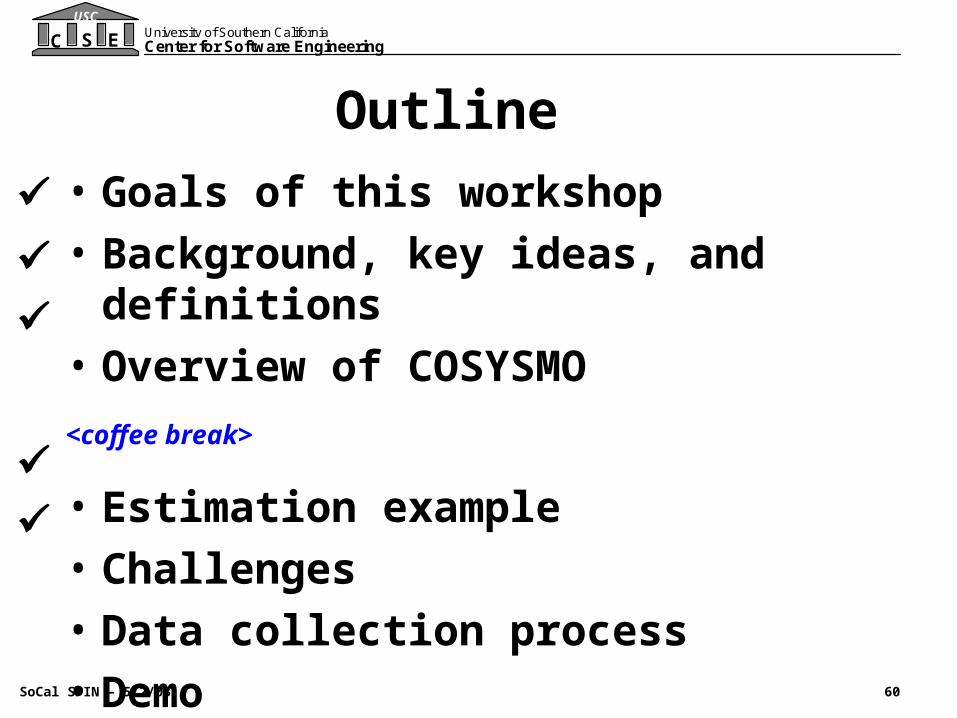
Outline
• Goals of this workshop
• Background, key ideas, and definitions
• Overview of COSYSMO
<coffee break>
• Estimation example
• Challenges
• Data collection process
• Demo
3
USC
C S E University of Southern CaliforniaCenter for Software Engineering
SoCal SPIN – 5/2/03
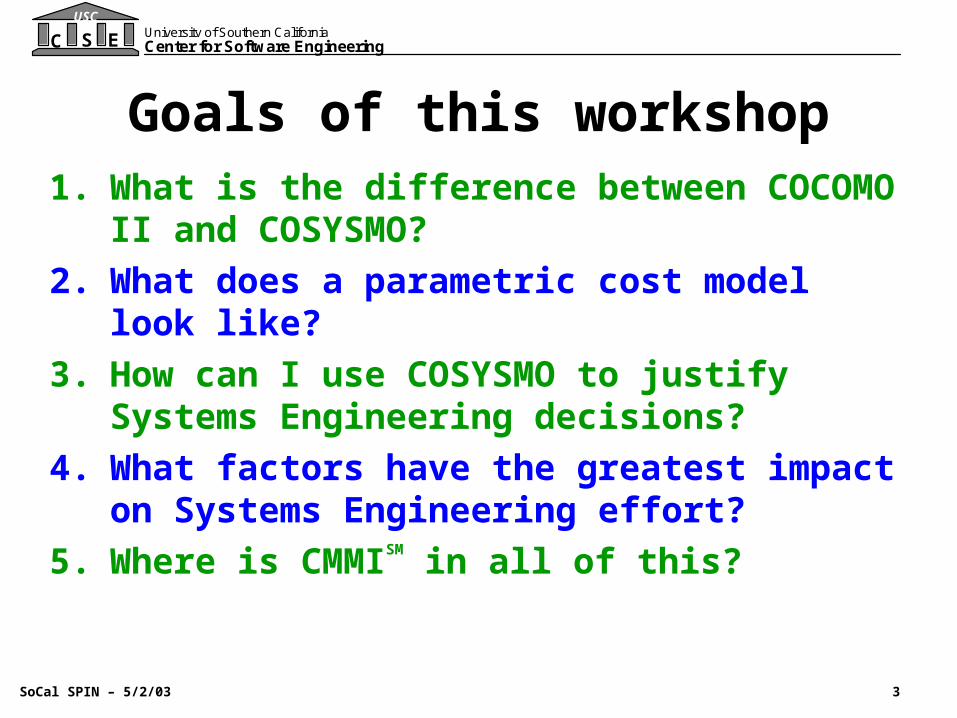
Goals of this workshop1. What is the difference between COCOMO II
and COSYSMO?
2. What does a parametric cost model look like?
3. How can I use COSYSMO to justify Systems Engineering decisions?
4. What factors have the greatest impact on Systems Engineering effort?
5. Where is CMMISM in all of this?

4
USC
C S E University of Southern CaliforniaCenter for Software Engineering
SoCal SPIN – 5/2/03
“All models are wrong, but some of them
are useful”
- W. E. Deming
Source: www.deming.org
5
USC
C S E University of Southern CaliforniaCenter for Software Engineering
SoCal SPIN – 5/2/03
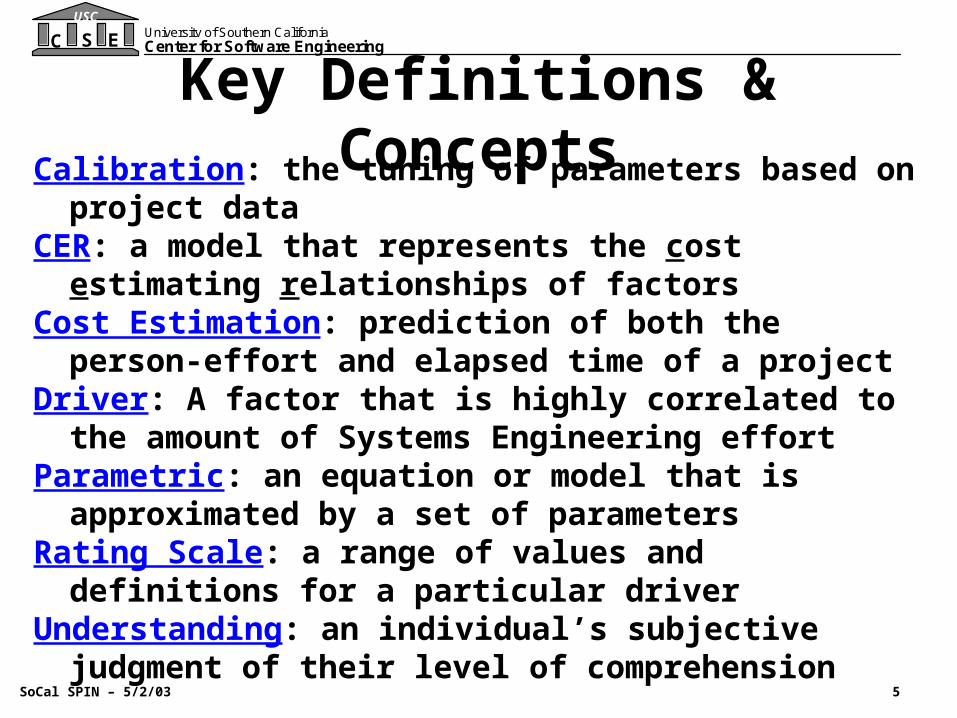
Key Definitions & ConceptsCalibration: the tuning of parameters based on project
data CER: a model that represents the cost estimating
relationships of factorsCost Estimation: prediction of both the
person-effort and elapsed time of a projectDriver: A factor that is highly correlated to the amount of
Systems Engineering effortParametric: an equation or model that is approximated by
a set of parametersRating Scale: a range of values and definitions for a
particular driverUnderstanding: an individual’s subjective judgment of
their level of comprehension
6
USC
C S E University of Southern CaliforniaCenter for Software Engineering
SoCal SPIN – 5/2/03
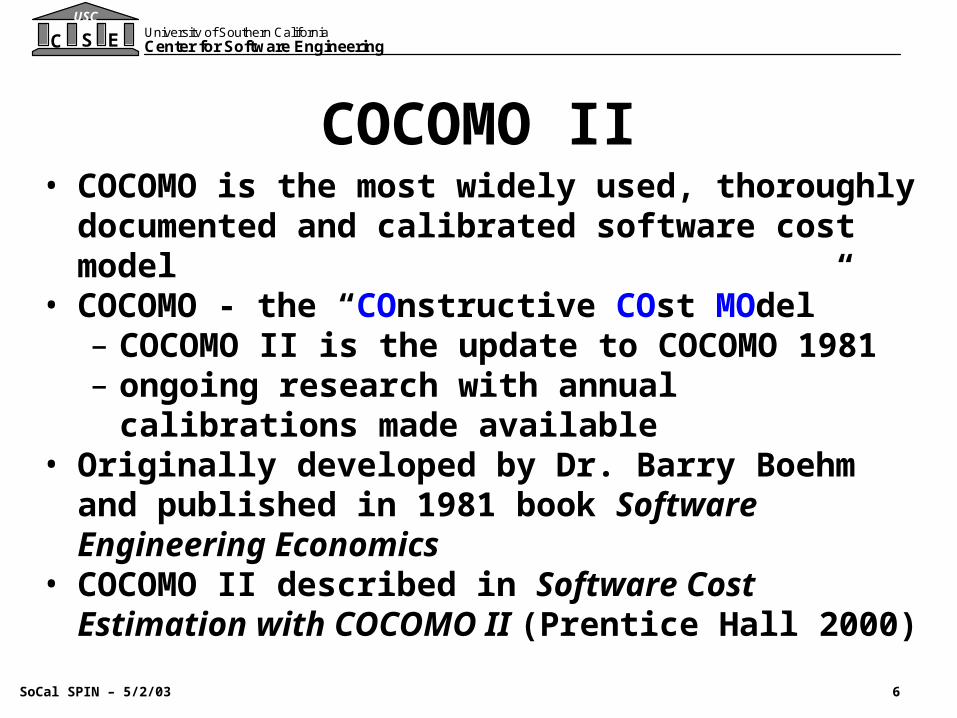
COCOMO II• COCOMO is the most widely used, thoroughly
documented and calibrated software cost model• COCOMO - the “COnstructive COst MOdel”
– COCOMO II is the update to COCOMO 1981– ongoing research with annual calibrations made
available • Originally developed by Dr. Barry Boehm and
published in 1981 book Software Engineering Economics
• COCOMO II described in Software Cost Estimation with COCOMO II (Prentice Hall 2000)
7
USC
C S E University of Southern CaliforniaCenter for Software Engineering
SoCal SPIN – 5/2/03
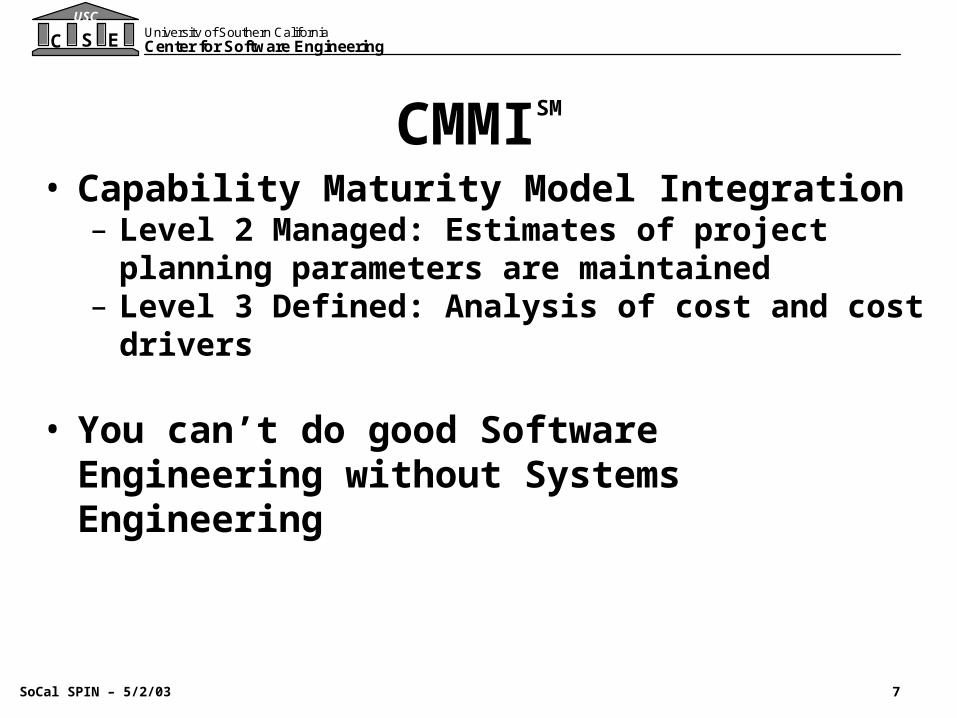
CMMISM
• Capability Maturity Model Integration– Level 2 Managed: Estimates of project planning
parameters are maintained– Level 3 Defined: Analysis of cost and cost drivers
• You can’t do good Software Engineering without Systems Engineering

8
USC
C S E University of Southern CaliforniaCenter for Software Engineering
SoCal SPIN – 5/2/03
The CMMI Software Paradigm Shift
• The traditional software paradigm
– Relation to SW CMM v.1.1
• Problems with traditional paradigm
• The CMMI software paradigm
– Specific process area differences
– Resulting implementation challenge
Source : CS577b Course - USC
9
USC
C S E University of Southern CaliforniaCenter for Software Engineering
SoCal SPIN – 5/2/03
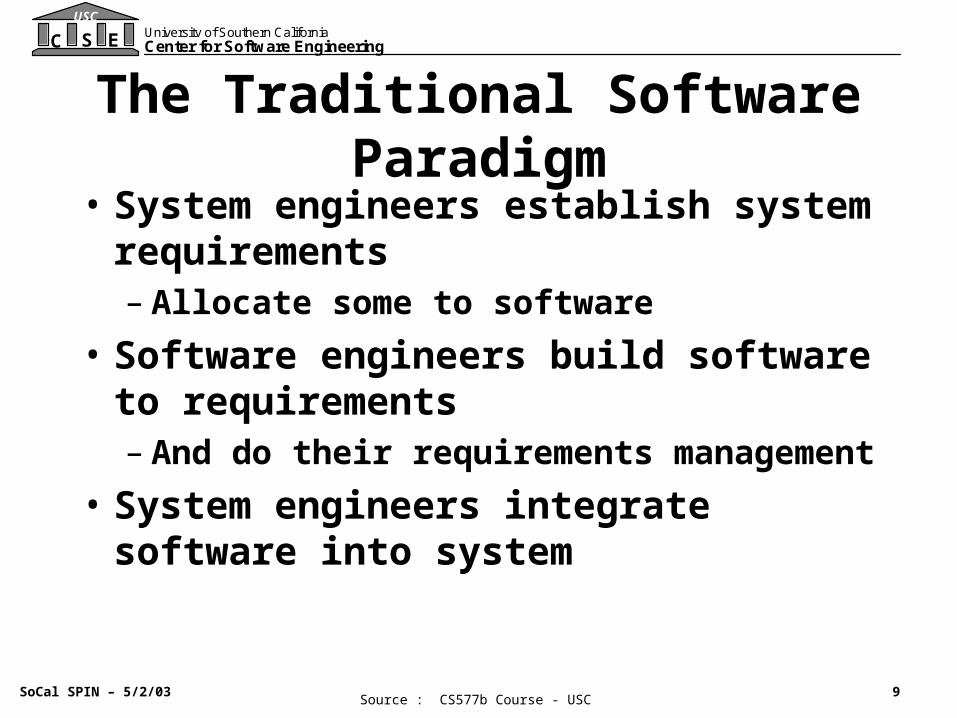
The Traditional Software Paradigm
• System engineers establish system requirements– Allocate some to software
• Software engineers build software to requirements– And do their requirements management
• System engineers integrate software into system
Source : CS577b Course - USC
10
USC
C S E University of Southern CaliforniaCenter for Software Engineering
SoCal SPIN – 5/2/03
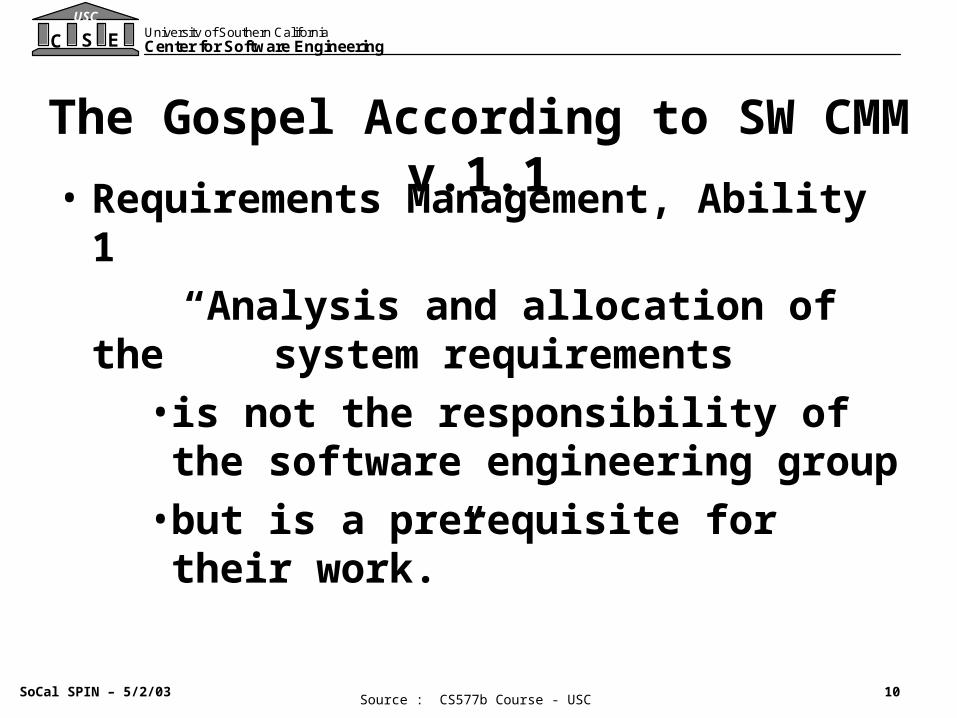
The Gospel According to SW CMM v.1.1• Requirements Management, Ability 1
“Analysis and allocation of the system requirements
• is not the responsibility of the software engineering group
• but is a prerequisite for their work.”
Source : CS577b Course - USC

USC
C S E University of Southern CaliforniaCenter for Software Engineering
SoCal SPIN – 5/2/03
Resulting Project Social Structure
SOFTWARE
MGMT.
AERO. ELEC. G & C
MFG.
COMM PAYLOAD
I wonder whenthey'll give us ourrequirements?
Source : CS577b Course - USC
USC
C S E University of Southern CaliforniaCenter for Software Engineering
SoCal SPIN – 5/2/03
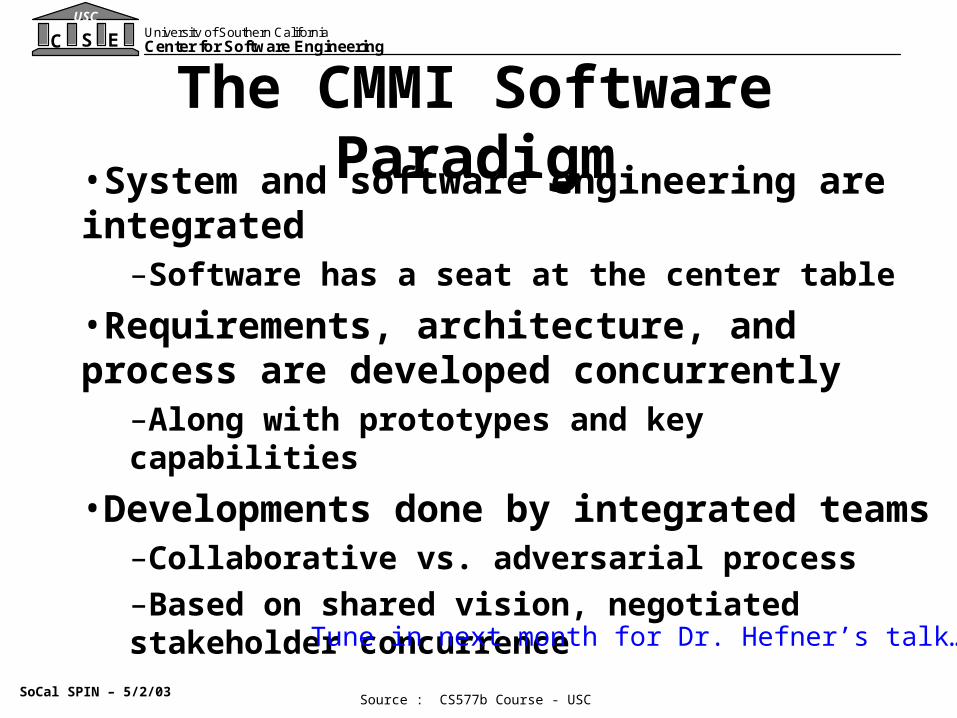
The CMMI Software Paradigm•System and software engineering are integrated
–Software has a seat at the center table
•Requirements, architecture, and process are developed concurrently
–Along with prototypes and key capabilities
•Developments done by integrated teams–Collaborative vs. adversarial process–Based on shared vision, negotiated stakeholder concurrence
Tune in next month for Dr. Hefner’s talk…
Source : CS577b Course - USC

13
USC
C S E University of Southern CaliforniaCenter for Software Engineering
SoCal SPIN – 5/2/03
USC Center for Software Engineering (CSE)• Researches, teaches, and practices CMMI-based Software
engineering
– Systems and software engineering fully integrated • Collaborative efforts between Computer Science (CS) and
Industrial Systems Engineering (ISE) Departments• COCOMO Suite of models
– Cost, schedule: COCOMO II, CORADMO, COCOTS– Quality: COQUALMO– Systems Engineering: COSYSMO
• Applies and extends research on major programs (DARPA/Army, FCS, FAA ERAM, NASA Missions)
• Uses mature 7-step model development methodology

14
USC
C S E University of Southern CaliforniaCenter for Software Engineering
SoCal SPIN – 5/2/03
7-step Modeling MethodologyAnalyze Existingliterature
1
2
3
4
5
6
7
PerformBehavioral Analysis
Identify RelativeSignificance
Perform Expert-Judgement, DelphiAssessment
Gather Project Data
Determine BayesianA-Posteriori Update
Gather more data;refine modelDetermine statistical significance

15
USC
C S E University of Southern CaliforniaCenter for Software Engineering
SoCal SPIN – 5/2/03
• Commercial Industry (1)– Galorath
• Aerospace Industry (5)– BAE, Lockheed Martin, Northrop Grumman,
Raytheon, SAIC• Government (2)
– NAVAIR, US Army Research Labs• FFRDC’s and Consortia (2)
– Aerospace, SPC• Technical Societies (3)
– INCOSE, ISPA, PSM
Organizations actively involved with COSYSMO

16
USC
C S E University of Southern CaliforniaCenter for Software Engineering
SoCal SPIN – 5/2/03
Estimation Accuracy
Feasibility Plans/Rqts. Design Develop and Test
Phases and Milestones
Relative Size
Range
OperationalConcept
Life Cycle Objectives
Life Cycle Architecture
Initial Operating Capability
x
0.5x
0.25x
4x
2x

17
USC
C S E University of Southern CaliforniaCenter for Software Engineering
SoCal SPIN – 5/2/03
COCOMO II• Software• Development phases• 20+ years old• 200+ calibration points• 23 Drivers• Variable granularity• 3 anchor points• Size is driven by SLOC
COSYSMO• Systems Engineering• Entire Life Cycle• 2 years old• ~3 calibration points• 18 drivers• Fixed granularity• No anchor points• Size is driven by
requirements, I/F, etc
Model Differences

18
USC
C S E University of Southern CaliforniaCenter for Software Engineering
SoCal SPIN – 5/2/03
Outline
• Goals of this workshop
• Background, key ideas, and definitions
• Overview of COSYSMO
<coffee break>
• Estimation example
• Challenges
• Data collection process
• Demo
19
USC
C S E University of Southern CaliforniaCenter for Software Engineering
SoCal SPIN – 5/2/03
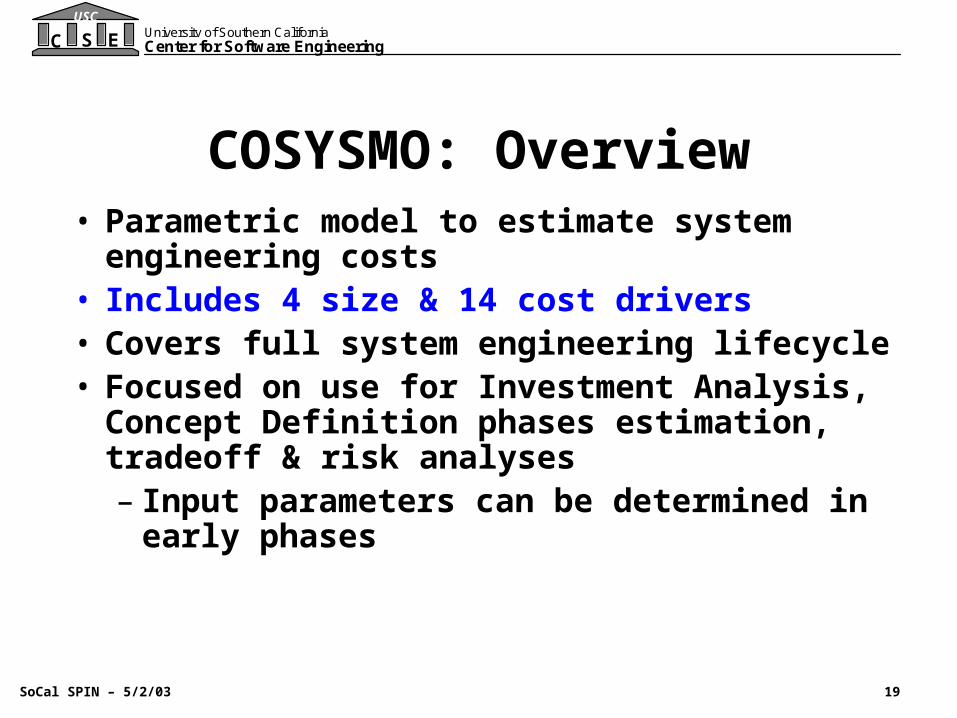
COSYSMO: Overview• Parametric model to estimate system
engineering costs• Includes 4 size & 14 cost drivers• Covers full system engineering lifecycle• Focused on use for Investment Analysis,
Concept Definition phases estimation, tradeoff & risk analyses– Input parameters can be determined in
early phases

20
USC
C S E University of Southern CaliforniaCenter for Software Engineering
SoCal SPIN – 5/2/03
COSYSMO
SizeDrivers
EffortMultipliers
Effort
Calibration
# Requirements# Interfaces# Scenarios# Algorithms
+Volatility Factor
- Application factors-8 factors
- Team factors-6 factors
- Schedule driver WBS guided by ISO/IEC 15288
COSYSMO Operational Concept

21
USC
C S E University of Southern CaliforniaCenter for Software Engineering
SoCal SPIN – 5/2/03
EIA/ANSI 632
EIA/ANSI 632 - Provide an integrated set of fundamental processes to aid a developer in the engineering or re-engineering of a system
Breadth and Depth of Key SE StandardsSystem life
ISO/IEC 15288
Level of
deta
il
Conceptualize DevelopTransition to
Operation
Operate,Maintain,
or EnhanceReplace
or Dismantle
Processdescription
High levelpractices
Detailedpractices
ISO/IEC 15288 - Establish a common framework for describing the life cycle of systems
Purpose of the Standards:Purpose of the Standards:
IEEE 1
220
IEEE 1220 - Provide a standard for managing systems engineeringSource : Draft Report ISO Study Group May 2, 2000
22
USC
C S E University of Southern CaliforniaCenter for Software Engineering
SoCal SPIN – 5/2/03
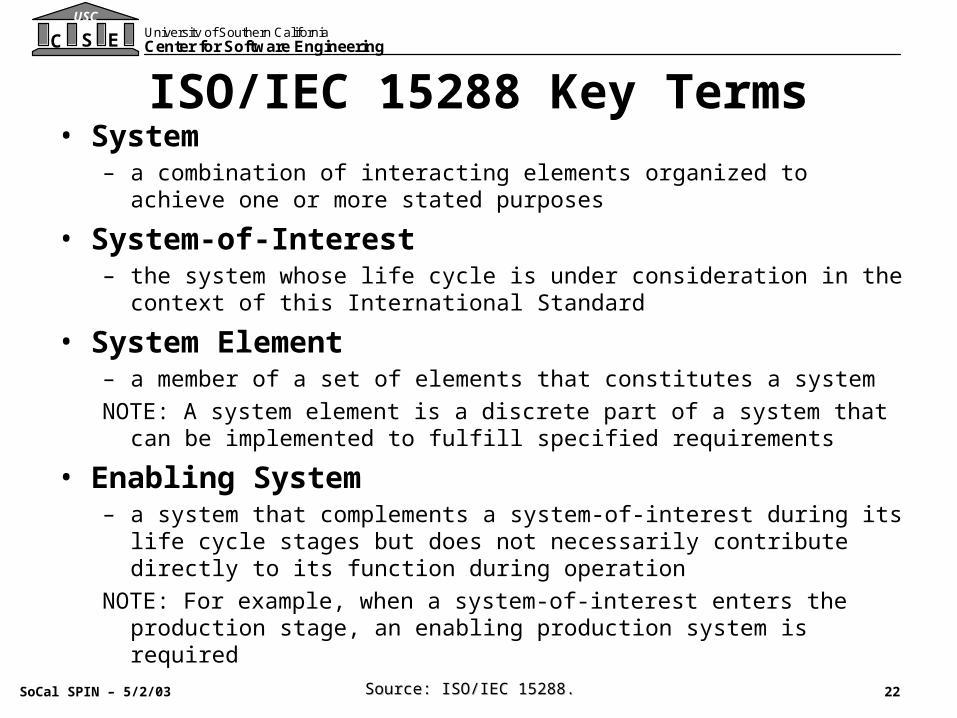
ISO/IEC 15288 Key Terms• System
– a combination of interacting elements organized to achieve one or more stated purposes
• System-of-Interest– the system whose life cycle is under consideration in the context of this
International Standard
• System Element– a member of a set of elements that constitutes a system
NOTE: A system element is a discrete part of a system that can be implemented to fulfill specified requirements
• Enabling System– a system that complements a system-of-interest during its life cycle
stages but does not necessarily contribute directly to its function during operation
NOTE: For example, when a system-of-interest enters the production stage, an enabling production system is required
Source: ISO/IEC 15288.Source: ISO/IEC 15288.

23
USC
C S E University of Southern CaliforniaCenter for Software Engineering
SoCal SPIN – 5/2/03
Systemelement
System-of-interest
Systemelement
Systemelement
SystemelementSystem
Systemelement
Systemelement
Systemelement
System
Systemelement
Systemelement
Systemelement
System
Systemelement
Systemelement
SystemelementSystem
Systemelement
Systemelement
System
Systemelement
Systemelement
System
Systemelement
Systemelement System
Systemelement
Systemelement
Systemelement
ISO/IEC 15288 System of Interest Structure
Make orbuy
Source: ISO/IEC 15288.Source: ISO/IEC 15288.
System Integrator
Prime
Subcontractor
3rd tiersub
2nd tiersub
SBIRS or FCS
24
USC
C S E University of Southern CaliforniaCenter for Software Engineering
SoCal SPIN – 5/2/03
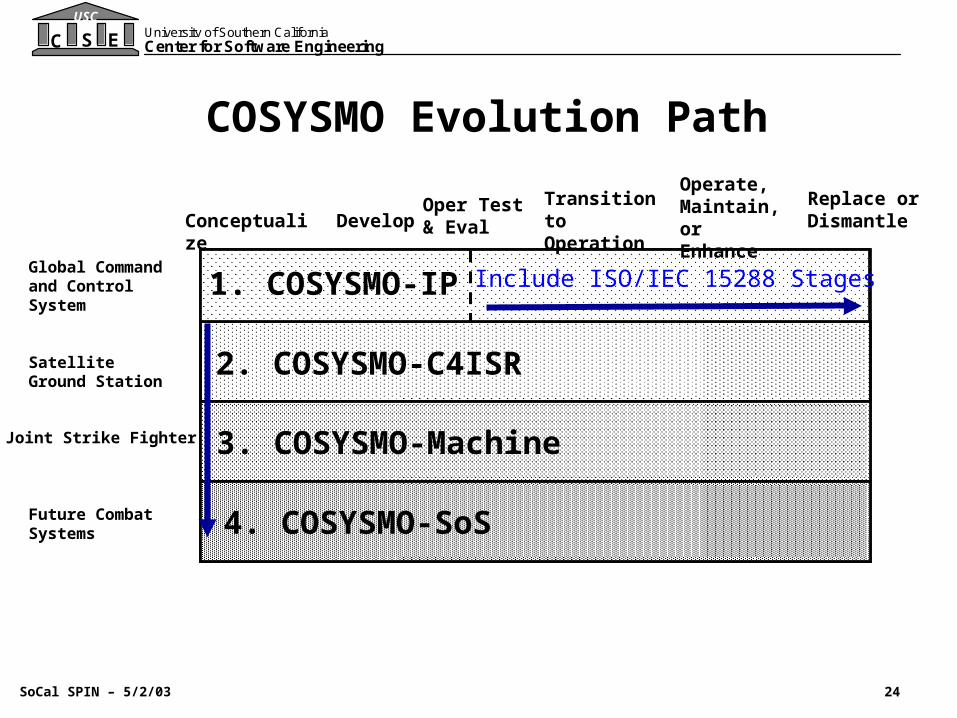
COSYSMO Evolution Path
Oper Test & Eval
1. COSYSMO-IP
2. COSYSMO-C4ISR
3. COSYSMO-Machine
4. COSYSMO-SoS
Global Command and Control System
Satellite Ground Station
Joint Strike Fighter
Future Combat Systems
Include ISO/IEC 15288 Stages
DevelopConceptualizeTransition to Operation
Operate, Maintain, or Enhance
Replace or Dismantle
25
USC
C S E University of Southern CaliforniaCenter for Software Engineering
SoCal SPIN – 5/2/03
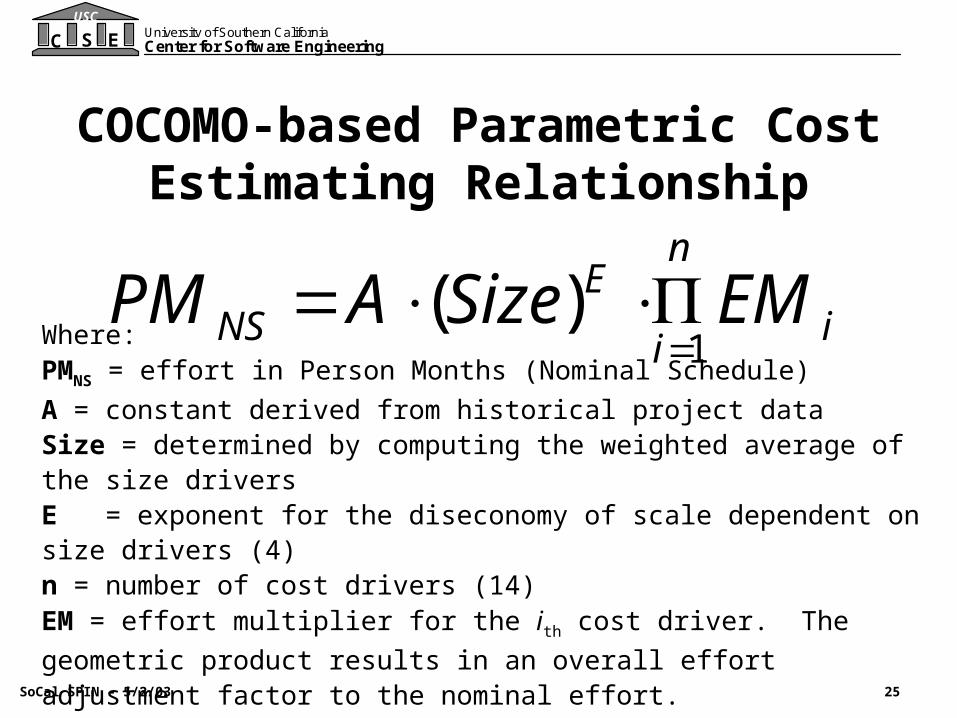
COCOMO-based Parametric Cost Estimating Relationship
Where: PMNS = effort in Person Months (Nominal Schedule)
A = constant derived from historical project data Size = determined by computing the weighted average of the size drivers E = exponent for the diseconomy of scale dependent on size drivers (4) n = number of cost drivers (14)EM = effort multiplier for the ith cost driver. The geometric product results
in an overall effort adjustment factor to the nominal effort.
i
n
i
ENS EMSizeAPM
1)(
26
USC
C S E University of Southern CaliforniaCenter for Software Engineering
SoCal SPIN – 5/2/03
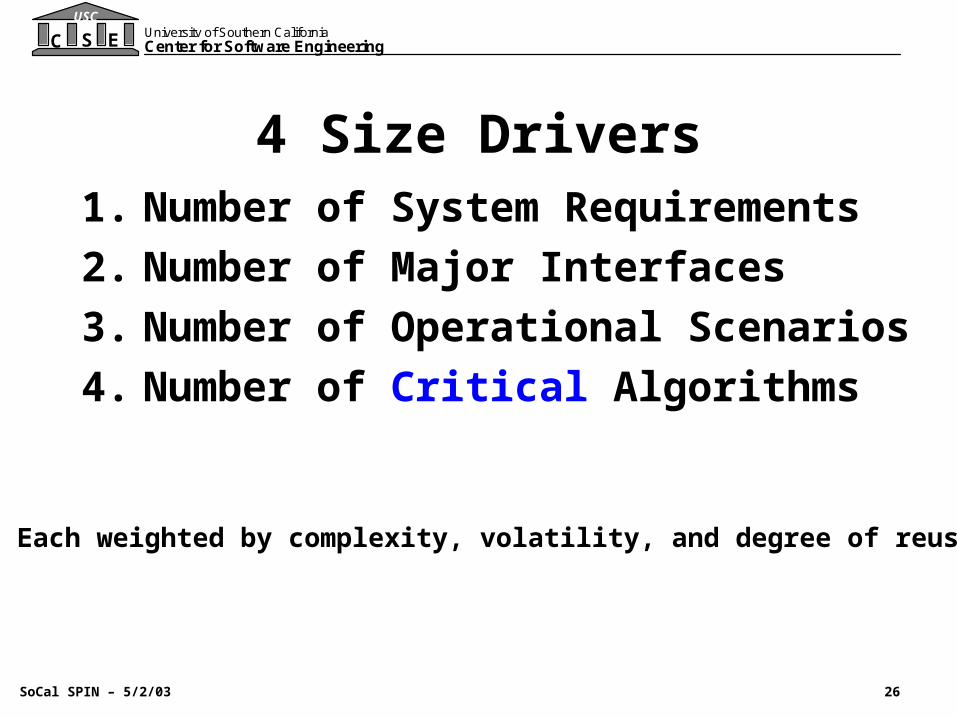
4 Size Drivers1. Number of System Requirements
2. Number of Major Interfaces
3. Number of Operational Scenarios
4. Number of Critical Algorithms
• Each weighted by complexity, volatility, and degree of reuse
27
USC
C S E University of Southern CaliforniaCenter for Software Engineering
SoCal SPIN – 5/2/03
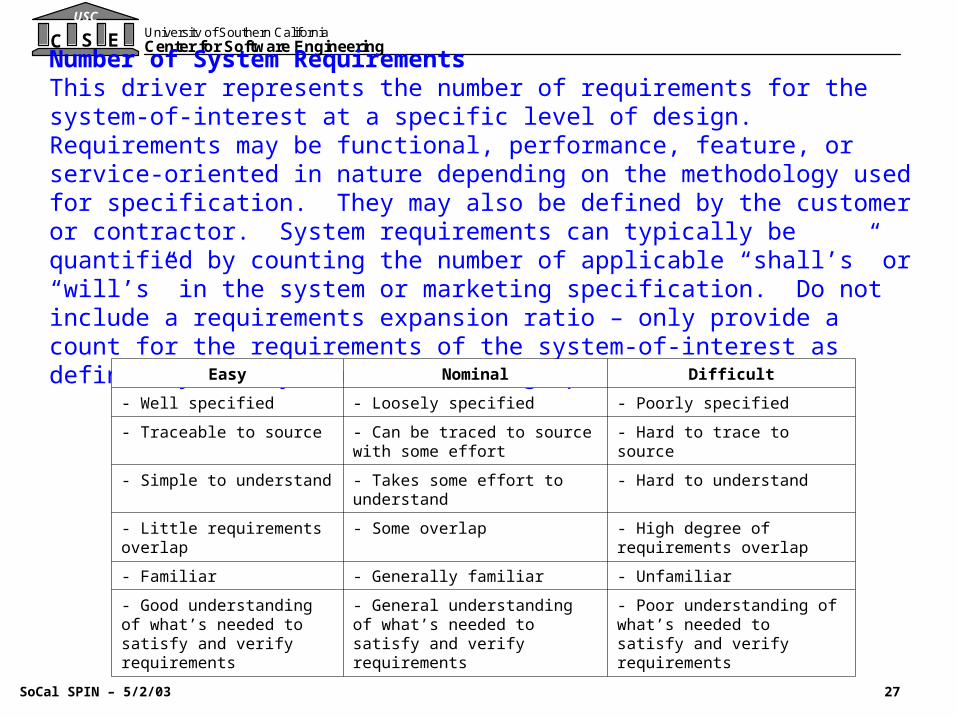
Number of System RequirementsThis driver represents the number of requirements for the system-of-interest at a specific level of design. Requirements may be functional, performance, feature, or service-oriented in nature depending on the methodology used for specification. They may also be defined by the customer or contractor. System requirements can typically be quantified by counting the number of applicable “shall’s” or “will’s” in the system or marketing specification. Do not include a requirements expansion ratio – only provide a count for the requirements of the system-of-interest as defined by the system or marketing specification.
Easy Nominal Difficult
- Well specified - Loosely specified - Poorly specified
- Traceable to source - Can be traced to source with some effort
- Hard to trace to source
- Simple to understand - Takes some effort to understand - Hard to understand
- Little requirements overlap - Some overlap - High degree of requirements overlap
- Familiar - Generally familiar - Unfamiliar
- Good understanding of what’s needed to satisfy and verify requirements
- General understanding of what’s needed to satisfy and verify requirements
- Poor understanding of what’s needed to satisfy and verify requirements
28
USC
C S E University of Southern CaliforniaCenter for Software Engineering
SoCal SPIN – 5/2/03
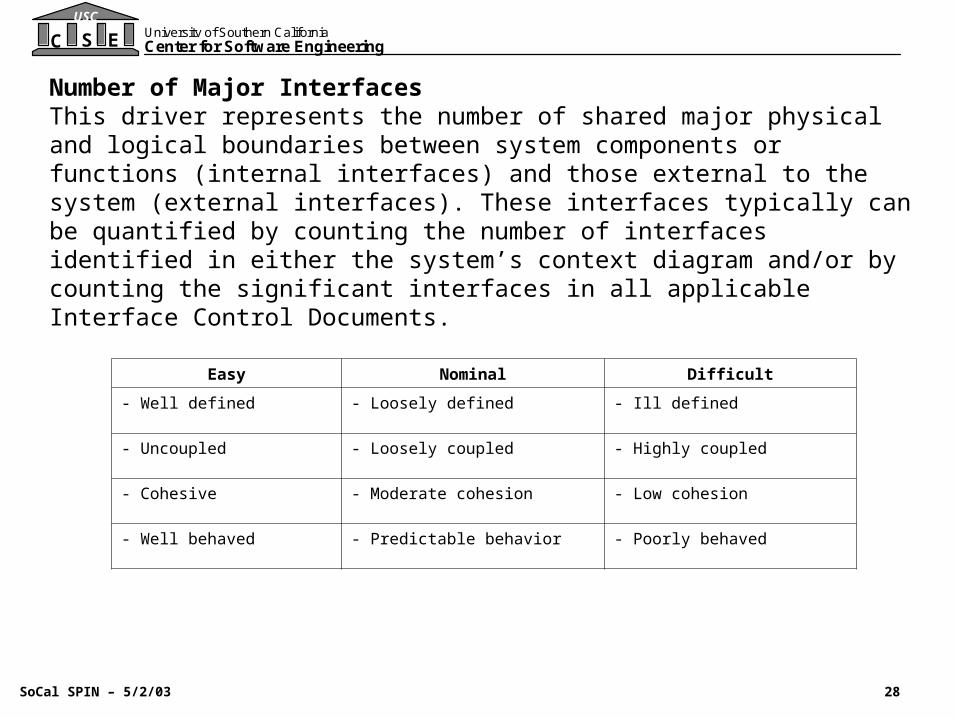
Number of Major InterfacesThis driver represents the number of shared major physical and logical boundaries between system components or functions (internal interfaces) and those external to the system (external interfaces). These interfaces typically can be quantified by counting the number of interfaces identified in either the system’s context diagram and/or by counting the significant interfaces in all applicable Interface Control Documents.
Easy Nominal Difficult
- Well defined - Loosely defined - Ill defined
- Uncoupled - Loosely coupled - Highly coupled
- Cohesive - Moderate cohesion - Low cohesion
- Well behaved - Predictable behavior - Poorly behaved

29
USC
C S E University of Southern CaliforniaCenter for Software Engineering
SoCal SPIN – 5/2/03
Number of Operational ScenariosThis driver represents the number of operational scenarios that a system must satisfy. Such threads typically result in end-to-end test scenarios that are developed to validate the system and satisfy all of its requirements. The number of scenarios can typically be quantified by counting the number of unique end-to-end tests used to validate the system functionality and performance or by counting the number of high-level use cases developed as part of the operational architecture.
Easy Nominal Difficult
- Well defined - Loosely defined - Ill defined
- Loosely coupled - Moderately coupled - Tightly coupled or many dependencies/conflicting requirements
- Timelines not an issue - Timelines a constraint - Tight timelines through scenario network
30
USC
C S E University of Southern CaliforniaCenter for Software Engineering
SoCal SPIN – 5/2/03
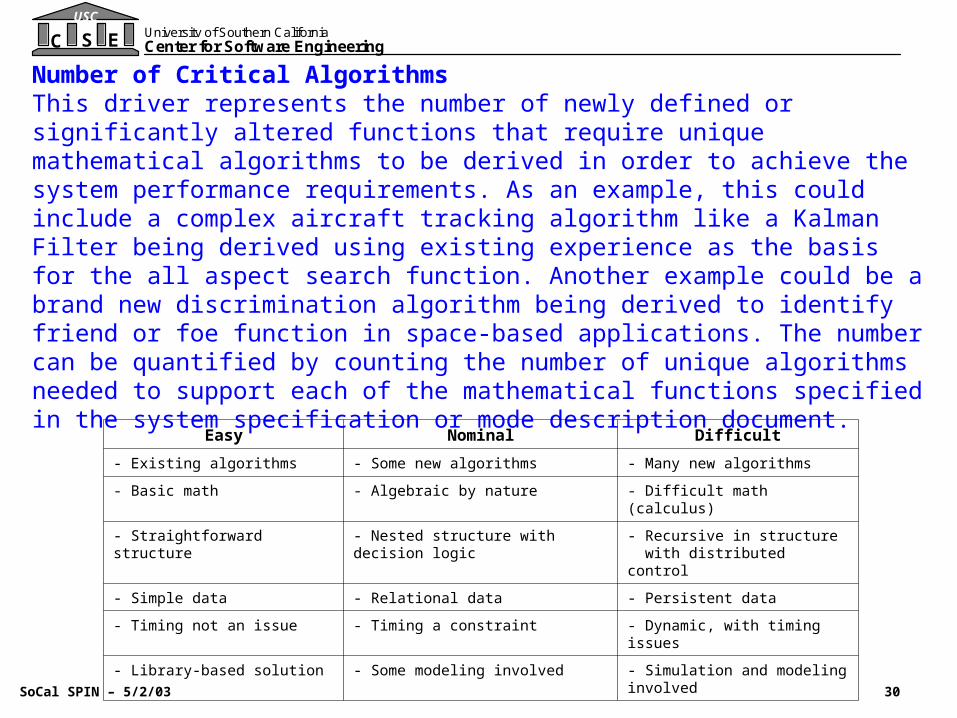
Number of Critical AlgorithmsThis driver represents the number of newly defined or significantly altered functions that require unique mathematical algorithms to be derived in order to achieve the system performance requirements. As an example, this could include a complex aircraft tracking algorithm like a Kalman Filter being derived using existing experience as the basis for the all aspect search function. Another example could be a brand new discrimination algorithm being derived to identify friend or foe function in space-based applications. The number can be quantified by counting the number of unique algorithms needed to support each of the mathematical functions specified in the system specification or mode description document.
Easy Nominal Difficult
- Existing algorithms - Some new algorithms - Many new algorithms
- Basic math - Algebraic by nature - Difficult math (calculus)
- Straightforward structure - Nested structure with decision logic - Recursive in structure with distributed control
- Simple data - Relational data - Persistent data
- Timing not an issue - Timing a constraint - Dynamic, with timing issues
- Library-based solution - Some modeling involved - Simulation and modeling involved
31
USC
C S E University of Southern CaliforniaCenter for Software Engineering
SoCal SPIN – 5/2/03
Outline
• Goals of this workshop
• Background, key ideas, and definitions
• Overview of COSYSMO
<coffee break>
• Estimation example
• Challenges
• Data collection process
• Demo
32
USC
C S E University of Southern CaliforniaCenter for Software Engineering
SoCal SPIN – 5/2/03
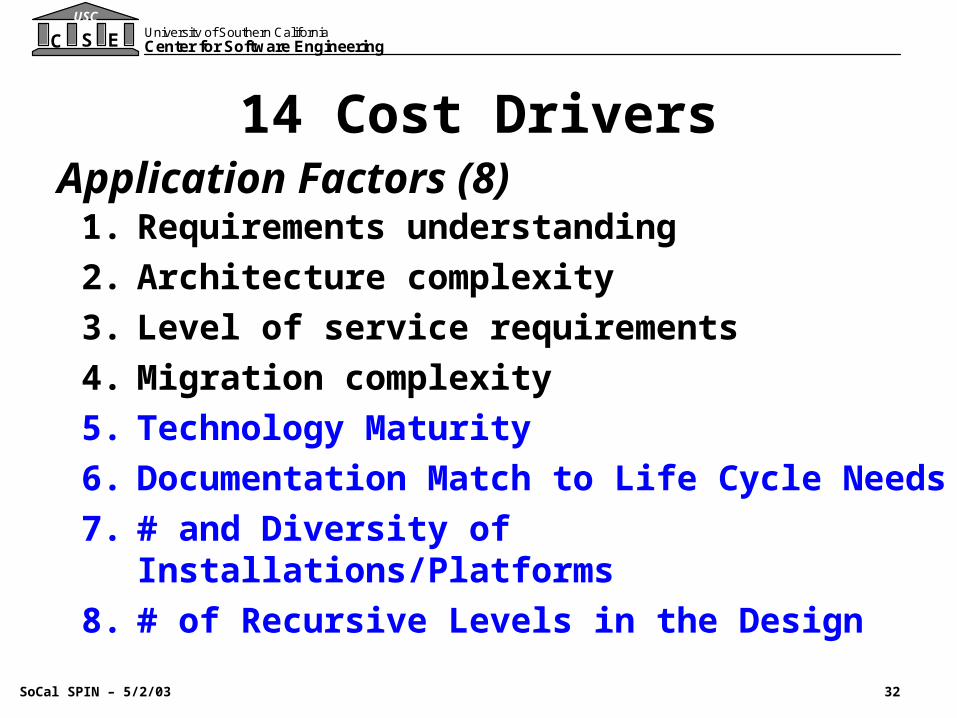
14 Cost Drivers
1. Requirements understanding
2. Architecture complexity
3. Level of service requirements
4. Migration complexity
5. Technology Maturity
6. Documentation Match to Life Cycle Needs
7. # and Diversity of Installations/Platforms
8. # of Recursive Levels in the Design
Application Factors (8)
33
USC
C S E University of Southern CaliforniaCenter for Software Engineering
SoCal SPIN – 5/2/03
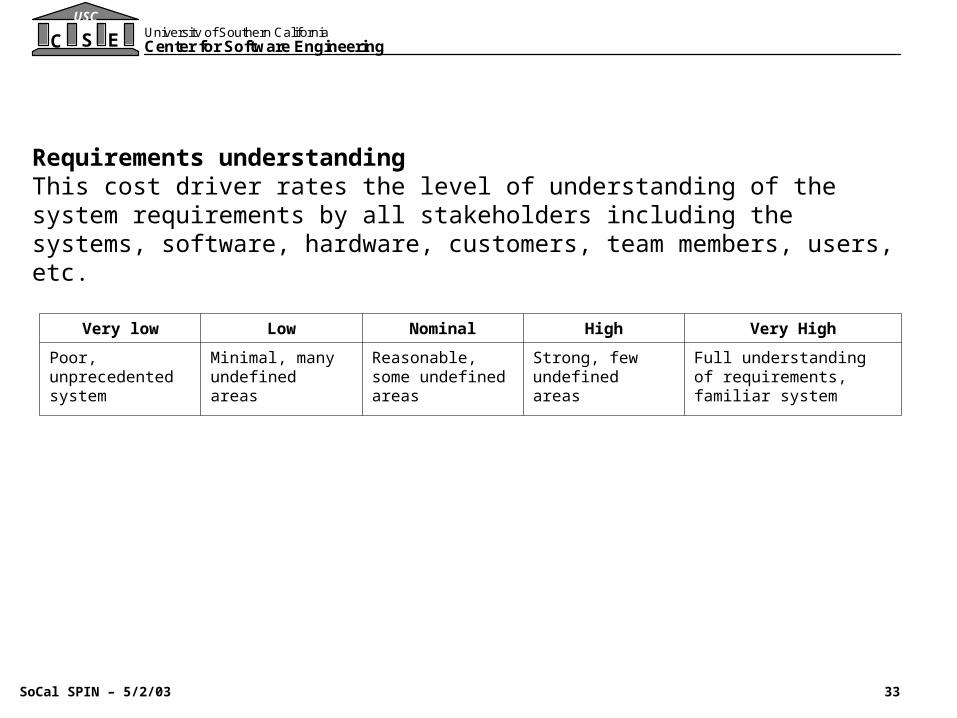
Requirements understanding This cost driver rates the level of understanding of the system requirements by all stakeholders including the systems, software, hardware, customers, team members, users, etc.
Very low Low Nominal High Very High
Poor, unprecedented system
Minimal, many undefined areas
Reasonable, some undefined areas
Strong, few undefined areas
Full understanding of requirements, familiar system

34
USC
C S E University of Southern CaliforniaCenter for Software Engineering
SoCal SPIN – 5/2/03
Architecture complexity This cost driver rates the relative difficulty of determining and managing the system architecture in terms of platforms, standards, components (COTS/GOTS/NDI/new), connectors (protocols), and constraints. This includes tasks like systems analysis, tradeoff analysis, modeling, simulation, case studies, etc.
Very low Low Nominal High Very High
Poor understanding of architecture and COTS, unprecedented system
Minimal understanding of architecture and COTS, many undefined areas
Reasonable understanding of architecture and COTS, some weak areas
Strong understanding of architecture and COTS, few undefined areas
Full understanding of architecture, familiar system and COTS
2 level WBS 3-4 level WBS 5-6 level WBS >6 level WBS

35
USC
C S E University of Southern CaliforniaCenter for Software Engineering
SoCal SPIN – 5/2/03
Level of service (KPP) requirementsThis cost driver rates the difficulty and criticality of satisfying the ensemble of Key Performance Parameters (KPP), such as security, safety, response time, interoperability, maintainability, the “ilities”, etc.
Very low Low Nominal High Very High
Difficulty Simple Low difficulty, coupling
Moderately complex, coupled
Difficult, coupled KPPs
Very complex, tightly coupled
Criticality Slight inconvenience
Easily recoverable losses
Some loss High financial loss
Risk to human life
36
USC
C S E University of Southern CaliforniaCenter for Software Engineering
SoCal SPIN – 5/2/03
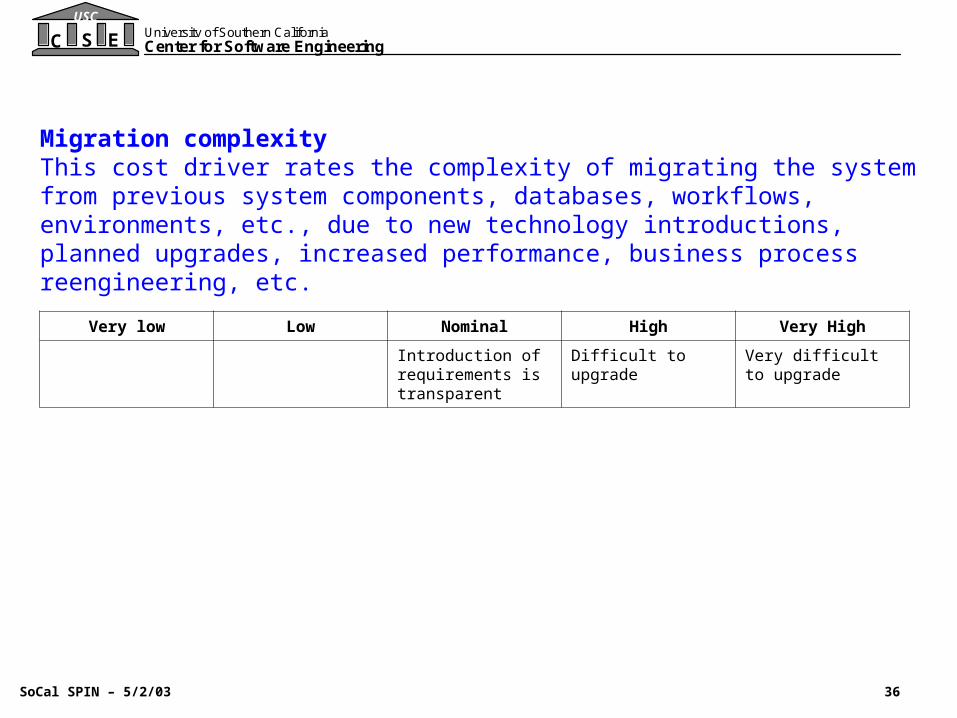
Migration complexity This cost driver rates the complexity of migrating the system from previous system components, databases, workflows, environments, etc., due to new technology introductions, planned upgrades, increased performance, business process reengineering, etc.
Very low Low Nominal High Very High
Introduction of requirements is transparent
Difficult to upgrade Very difficult to upgrade
37
USC
C S E University of Southern CaliforniaCenter for Software Engineering
SoCal SPIN – 5/2/03
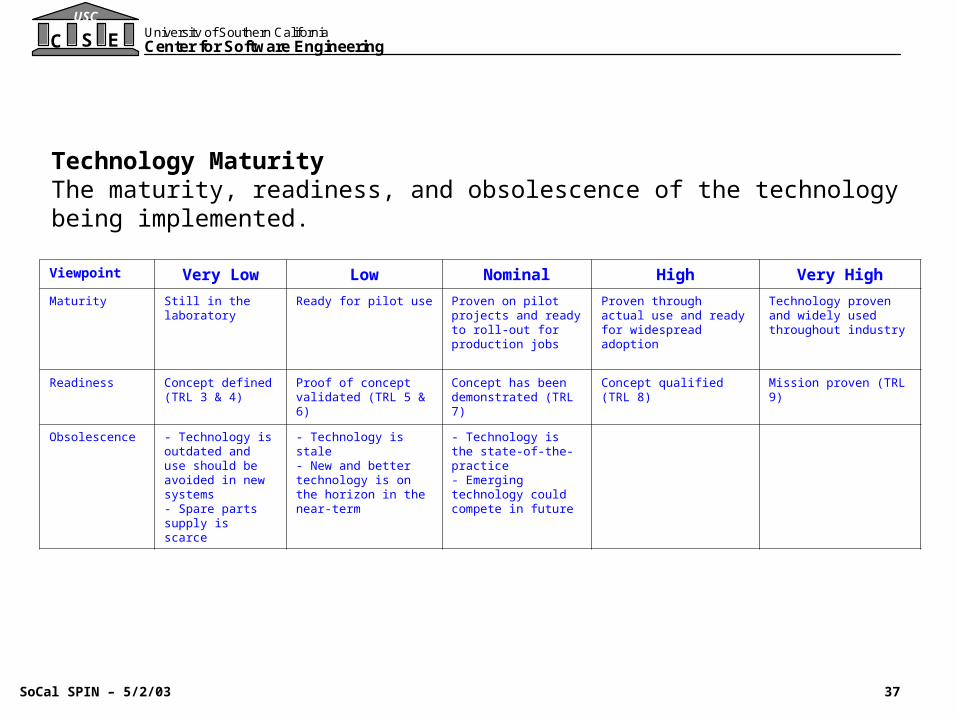
Technology MaturityThe maturity, readiness, and obsolescence of the technology being implemented.
Viewpoint Very Low Low Nominal High Very High
Maturity Still in the laboratory Ready for pilot use Proven on pilot projects and ready to roll-out for production jobs
Proven through actual use and ready for widespread adoption
Technology proven and widely used throughout industry
Readiness Concept defined (TRL 3 & 4)
Proof of concept validated (TRL 5 & 6)
Concept has been demonstrated (TRL 7)
Concept qualified (TRL 8) Mission proven (TRL 9)
Obsolescence - Technology is outdated and use should be avoided in new systems- Spare parts supply is scarce
- Technology is stale- New and better technology is on the horizon in the near-term
- Technology is the state-of-the-practice- Emerging technology could compete in future
38
USC
C S E University of Southern CaliforniaCenter for Software Engineering
SoCal SPIN – 5/2/03
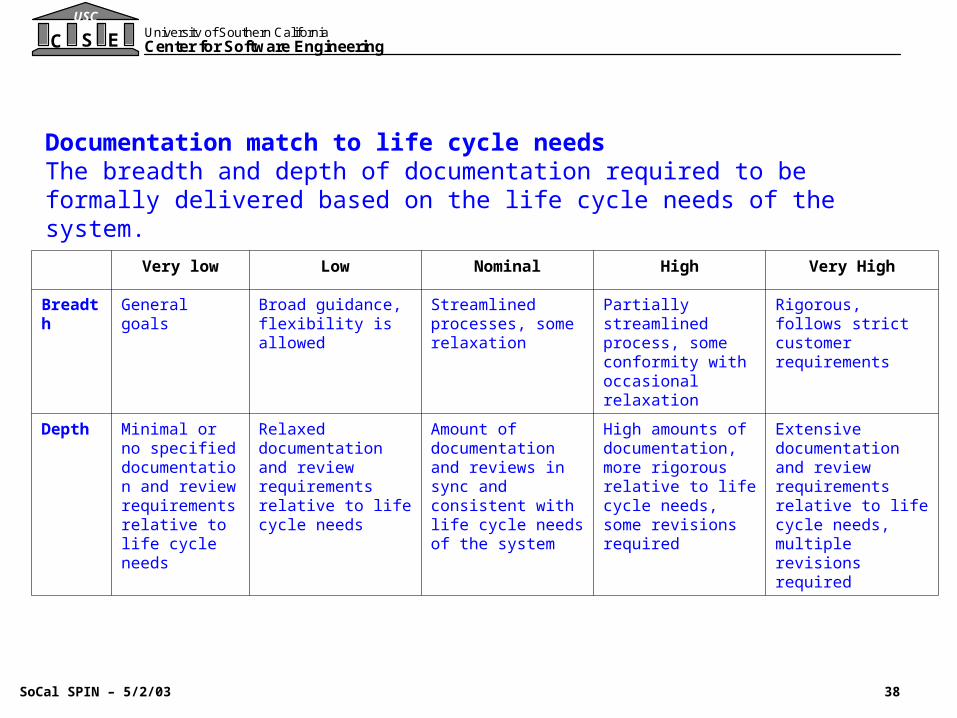
Documentation match to life cycle needs The breadth and depth of documentation required to be formally delivered based on the life cycle needs of the system.
Very low Low Nominal High Very High
Breadth General goals Broad guidance, flexibility is allowed
Streamlined processes, some relaxation
Partially streamlined process, some conformity with occasional relaxation
Rigorous, follows strict customer requirements
Depth Minimal or no specified documentation and review requirements relative to life cycle needs
Relaxed documentation and review requirements relative to life cycle needs
Amount of documentation and reviews in sync and consistent with life cycle needs of the system
High amounts of documentation, more rigorous relative to life cycle needs, some revisions required
Extensive documentation and review requirements relative to life cycle needs, multiple revisions required

39
USC
C S E University of Southern CaliforniaCenter for Software Engineering
SoCal SPIN – 5/2/03
# and diversity of installations/platformsThe number of different platforms that the system will be hosted and installed on. The complexity in the operating environment (space, sea, land, fixed, mobile, portable, information assurance/security). For example, in a wireless network it could be the number of unique installation sites and the number of and types of fixed clients, mobile clients, and servers. Number of platforms being implemented should be added to the number being phased out (dual count).
Viewpoint Nominal High Very High
Sites/installations Small # of installations or many similar installations
Moderate # of installations or some amount of multiple types of installations
Large # of installations with many unique aspects
Operating environment
Not a driving factor Moderate environmental constraints
Multiple complexities/constraints caused by operating environment
Platforms Few types of platforms (< 5) being installed and/or being phased out/replaced
Modest # and types of platforms (5 < P <10) being installed and/or being phased out/replaced
Many types of platforms (> 10) being installed and/or being phased out/replaced
Homogeneous platforms Compatible platforms Heterogeneous, incompatible platforms
Typically networked using a single protocol
Typically networked using several consistent protocols
Typically networked using different protocols

40
USC
C S E University of Southern CaliforniaCenter for Software Engineering
SoCal SPIN – 5/2/03
# of recursive levels in the designThe number of levels of design related to the system-of-interest and the amount of required SE effort for each level.
Viewpoint Very Low Low Nominal High Very High
Number of levels
1 2 3-5 6-7 >7
Required SE effort
Ad-hoc effort Maintaining system baseline with few planned upgrades
Sustaining SE for the product line, introducing some enhancements of product design features or optimizing performance and/or cost
Maintaining multiple configurations or enhancements with extensive pre-planned product improvements or new requirements, evolving
Maintaining many configurations or enhancements with extensive pre-planned product improvements, new requirements rapidly evolving

41
USC
C S E University of Southern CaliforniaCenter for Software Engineering
SoCal SPIN – 5/2/03
14 Cost Drivers (cont.)
1. Stakeholder team cohesion
2. Personnel/team capability
3. Personnel experience/continuity
4. Process maturity
5. Multisite coordination
6. Tool support
Team Factors (6)
42
USC
C S E University of Southern CaliforniaCenter for Software Engineering
SoCal SPIN – 5/2/03
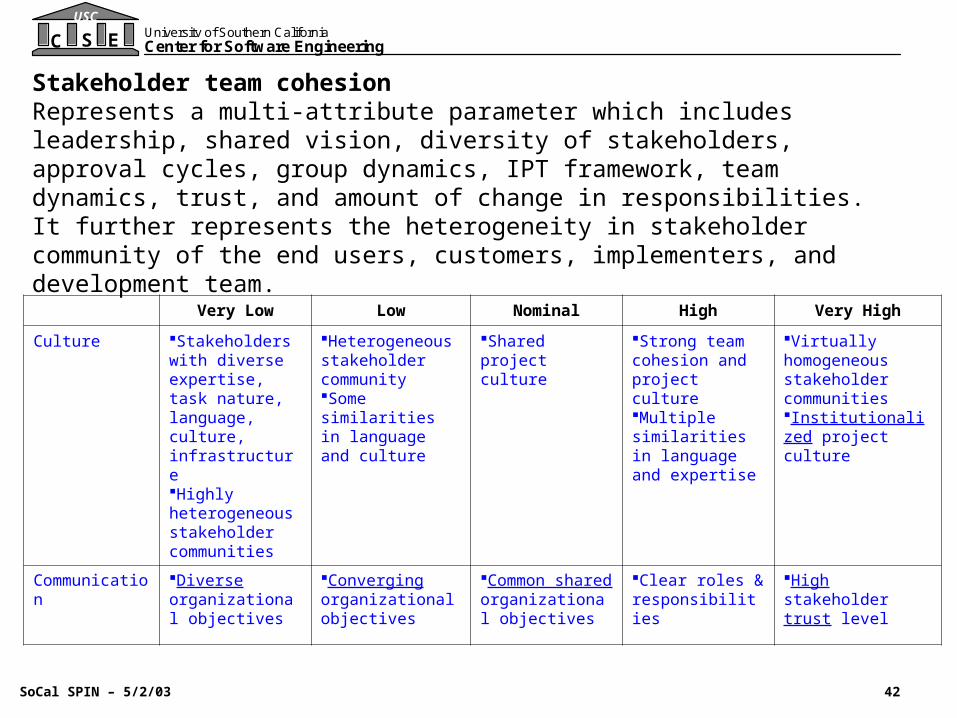
Stakeholder team cohesion Represents a multi-attribute parameter which includes leadership, shared vision, diversity of stakeholders, approval cycles, group dynamics, IPT framework, team dynamics, trust, and amount of change in responsibilities. It further represents the heterogeneity in stakeholder community of the end users, customers, implementers, and development team.
Very Low Low Nominal High Very High
Culture Stakeholders with diverse expertise, task nature, language, culture, infrastructure Highly heterogeneous stakeholder communities
Heterogeneous stakeholder communitySome similarities in language and culture
Shared project culture
Strong team cohesion and project cultureMultiple similarities in language and expertise
Virtually homogeneous stakeholder communitiesInstitutionalized project culture
Communication Diverse organizational objectives
Converging organizational objectives
Common shared organizational objectives
Clear roles & responsibilities
High stakeholder trust level
43
USC
C S E University of Southern CaliforniaCenter for Software Engineering
SoCal SPIN – 5/2/03
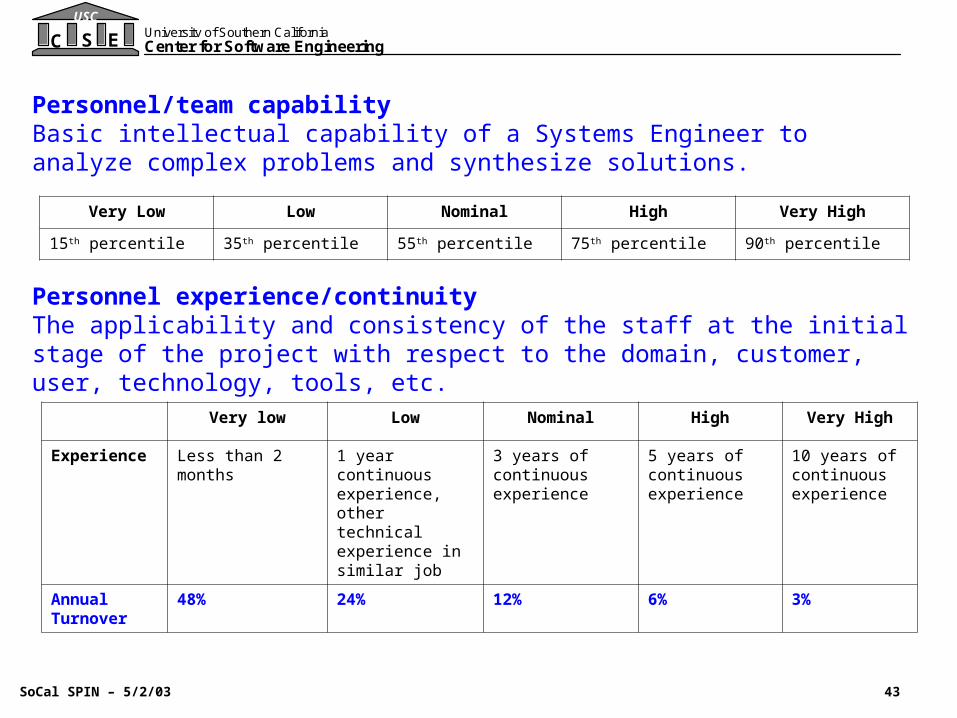
Personnel/team capability Basic intellectual capability of a Systems Engineer to analyze complex problems and synthesize solutions.
Very Low Low Nominal High Very High
15th percentile 35th percentile 55th percentile 75th percentile 90th percentile
Personnel experience/continuity The applicability and consistency of the staff at the initial stage of the project with respect to the domain, customer, user, technology, tools, etc.
Very low Low Nominal High Very High
Experience Less than 2 months 1 year continuous experience, other technical experience in similar job
3 years of continuous experience
5 years of continuous experience
10 years of continuous experience
Annual Turnover
48% 24% 12% 6% 3%

44
USC
C S E University of Southern CaliforniaCenter for Software Engineering
SoCal SPIN – 5/2/03
Process maturity Maturity per EIA/IS 731, SE CMM or CMMI.
Very low Low Nominal High Very High Extra High
CMMI Level 1 (lower half)
Level 1 (upper half)
Level 2 Level 3 Level 4 Level 5
EIA731 Performed SE process, activities driven only by immediate contractual or customer requirements, SE focus limited
Managed SE process, activities driven by customer and stakeholder needs in a suitable manner, SE focus is requirements through design
Defined SE process, activities driven by benefit to program, SE focus is through operation
Quantitatively Managed SE process, activities driven by SE benefit, SE focus on all phases of the life cycle
Optimizing SE process, continuous improvement, activities driven by system engineering and organizational benefit, SE focus is product life cycle & strategic applications
45
USC
C S E University of Southern CaliforniaCenter for Software Engineering
SoCal SPIN – 5/2/03
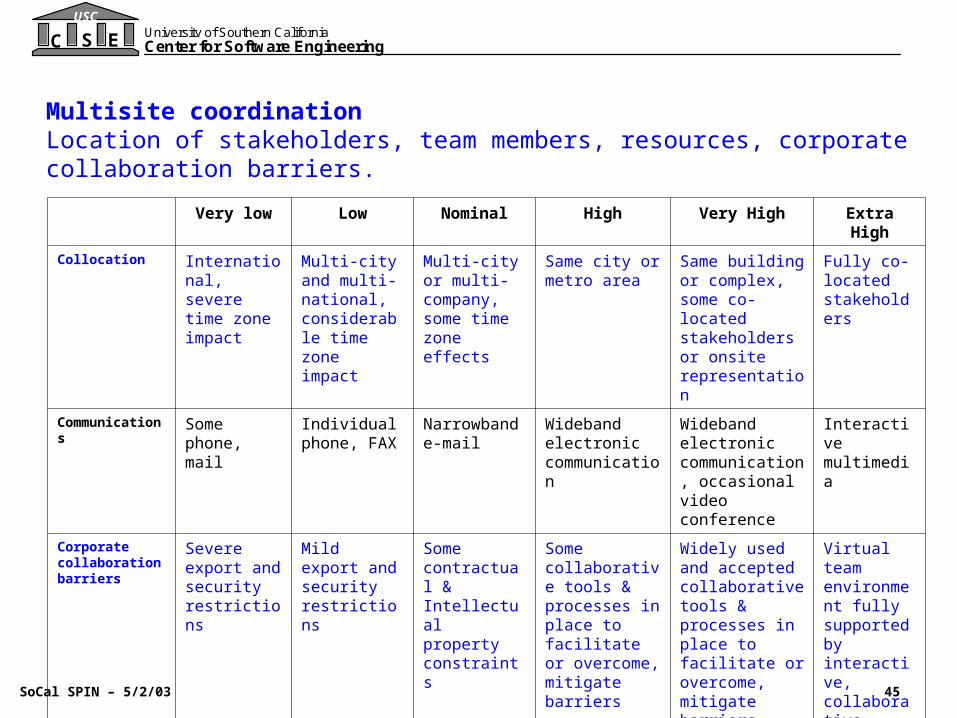
Multisite coordination Location of stakeholders, team members, resources, corporate collaboration barriers.
Very low Low Nominal High Very High Extra High
Collocation International, severe time zone impact
Multi-city and multi-national, considerable time zone impact
Multi-city or multi-company, some time zone effects
Same city or metro area
Same building or complex, some co-located stakeholders or onsite representation
Fully co-located stakeholders
Communications Some phone, mail
Individual phone, FAX
Narrowband e-mail
Wideband electronic communication
Wideband electronic communication, occasional video conference
Interactive multimedia
Corporate collaboration barriers
Severe export and security restrictions
Mild export and security restrictions
Some contractual & Intellectual property constraints
Some collaborative tools & processes in place to facilitate or overcome, mitigate barriers
Widely used and accepted collaborative tools & processes in place to facilitate or overcome, mitigate barriers
Virtual team environment fully supported by interactive, collaborative tools environment

46
USC
C S E University of Southern CaliforniaCenter for Software Engineering
SoCal SPIN – 5/2/03
Tool support Coverage, integration, and maturity of the tools in the Systems Engineering environment.
Very low Low Nominal High Very High
No SE tools Simple SE tools, little integration
Basic SE tools moderately integrated throughout the systems engineering process
Strong, mature SE tools, moderately integrated with other disciplines
Strong, mature proactive use of SE tools integrated with process, model-based SE and management systems
47
USC
C S E University of Southern CaliforniaCenter for Software Engineering
SoCal SPIN – 5/2/03
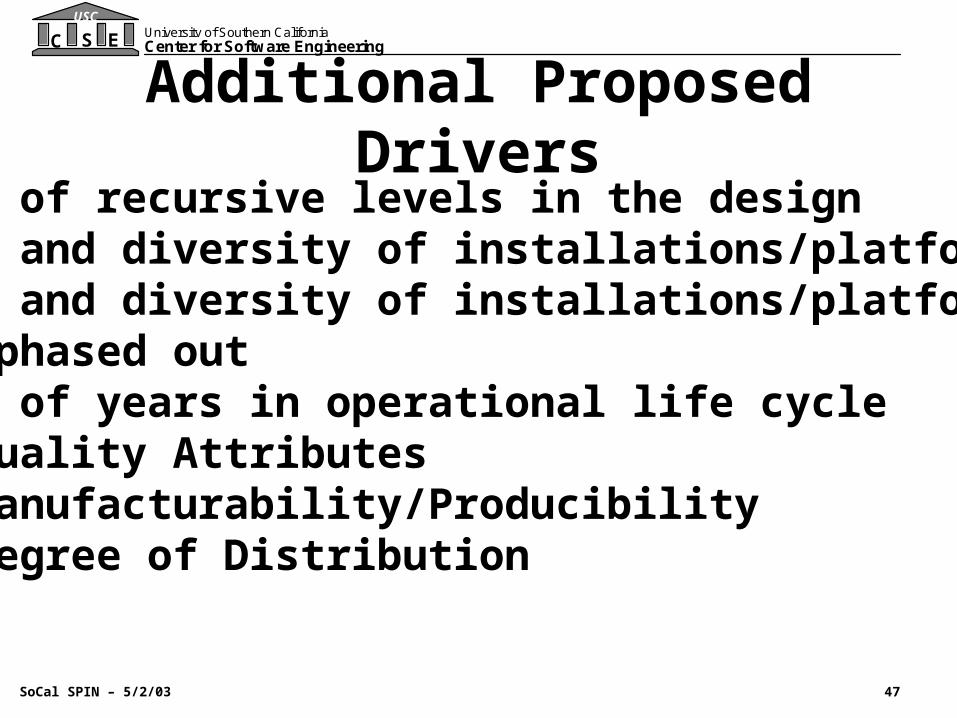
Additional Proposed Drivers• # of recursive levels in the design• # and diversity of installations/platforms• # and diversity of installations/platforms phased out • # of years in operational life cycle• Quality Attributes• Manufacturability/Producibility• Degree of Distribution
48
USC
C S E University of Southern CaliforniaCenter for Software Engineering
SoCal SPIN – 5/2/03
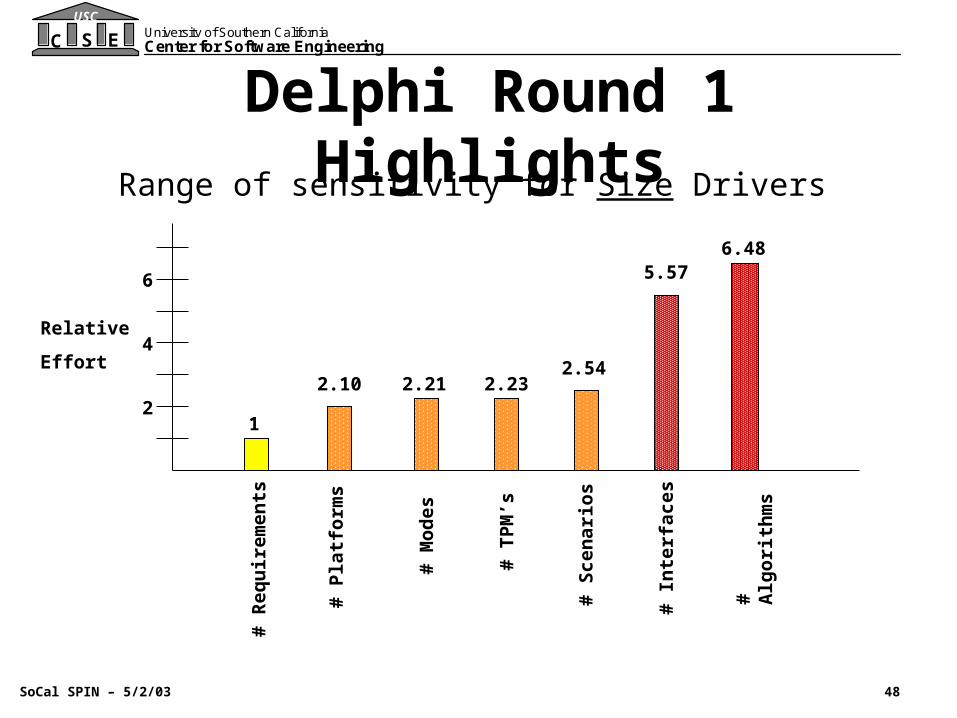
Delphi Round 1 HighlightsRange of sensitivity for Size Drivers
# A
lgo
rith
ms
# R
eq
uir
emen
ts
# In
terf
aces
# T
PM
’s
# S
cen
ario
s
# M
od
es
# P
latf
orm
s
5.57
Relative
Effort
1
2.232.54
2.212.10
6.48
6
4
2
49
USC
C S E University of Southern CaliforniaCenter for Software Engineering
SoCal SPIN – 5/2/03
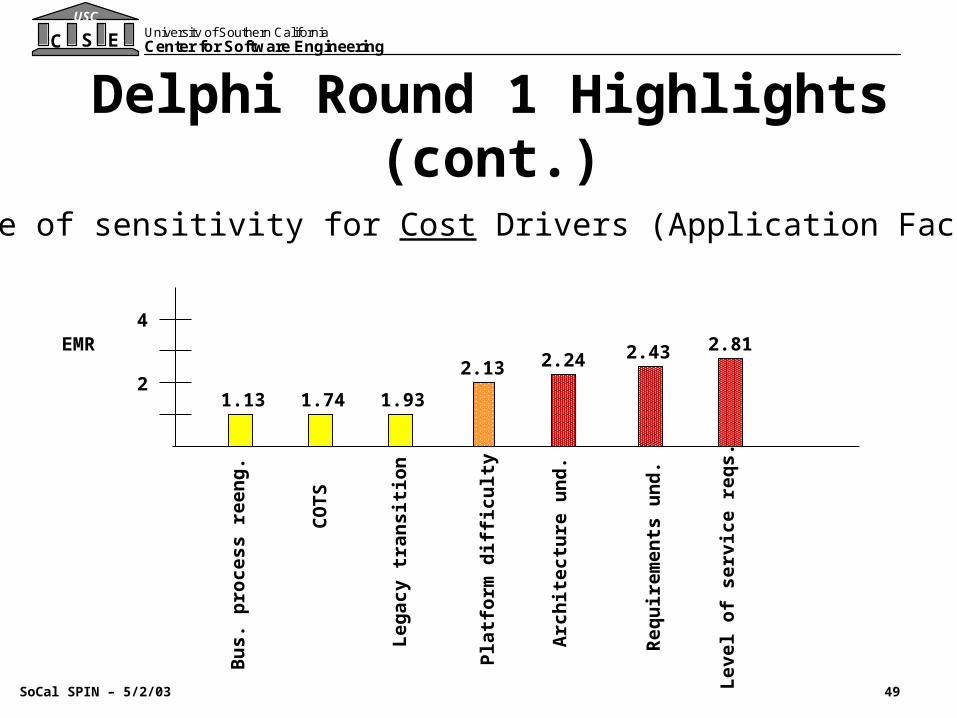
Delphi Round 1 Highlights (cont.)
Range of sensitivity for Cost Drivers (Application Factors)
EMR
1.93
2.812.13
2.432.24
4
2
Req
uir
em
ents
un
d.
Arc
hit
ectu
re u
nd
.
Lev
el o
f se
rvic
e re
qs.
Leg
acy
tra
nsi
tio
n
CO
TS
Pla
tfo
rm d
iffi
cult
y
Bu
s. p
roce
ss r
een
g.
1.741.13
50
USC
C S E University of Southern CaliforniaCenter for Software Engineering
SoCal SPIN – 5/2/03
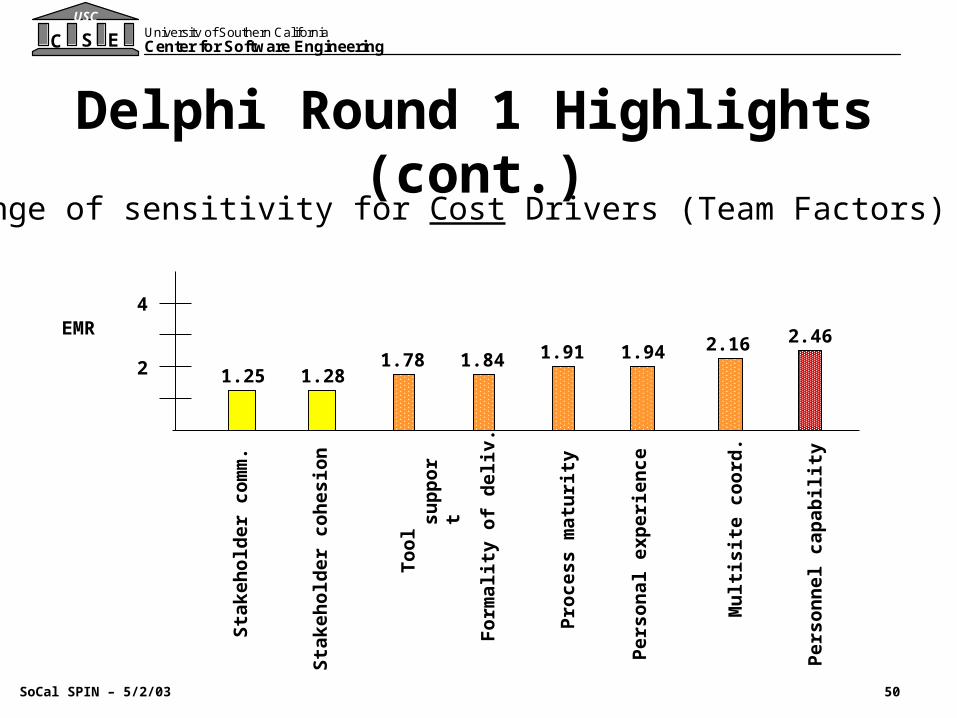
Delphi Round 1 Highlights (cont.)Range of sensitivity for Cost Drivers (Team Factors)
1.28
2.461.91 2.161.94
1.25
To
ol
sup
po
rt
Sta
keh
old
er c
om
m.
Sta
keh
old
er c
oh
esio
n
Per
son
nel
cap
ab
ilit
y
Per
son
al
exp
erie
nce
Pro
cess
mat
uri
ty
Mu
ltis
ite
coo
rd.
Fo
rmal
ity
of
del
iv.
1.841.78
EMR4
2

51
USC
C S E University of Southern CaliforniaCenter for Software Engineering
SoCal SPIN – 5/2/03
Outline
• Goals of this workshop
• Background, key ideas, and definitions
• Overview of COSYSMO
<coffee break>
• Estimation example
• Challenges
• Data collection process
• Demo
52
USC
C S E University of Southern CaliforniaCenter for Software Engineering
SoCal SPIN – 5/2/03
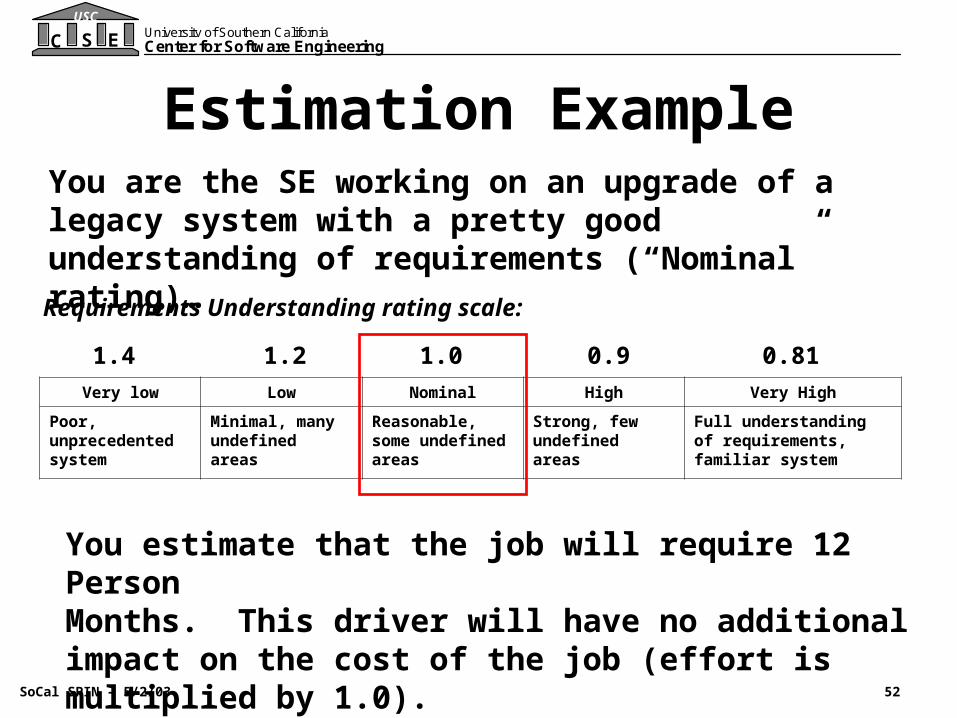
Estimation ExampleYou are the SE working on an upgrade of a legacy system with a pretty good understanding of requirements (“Nominal” rating)…
Very low Low Nominal High Very High
Poor, unprecedented system
Minimal, many undefined areas
Reasonable, some undefined areas
Strong, few undefined areas
Full understanding of requirements, familiar system
1.0
Requirements Understanding rating scale:
0.9 0.811.21.4
You estimate that the job will require 12 Person Months. This driver will have no additional impact on the cost of the job (effort is multiplied by 1.0).
53
USC
C S E University of Southern CaliforniaCenter for Software Engineering
SoCal SPIN – 5/2/03
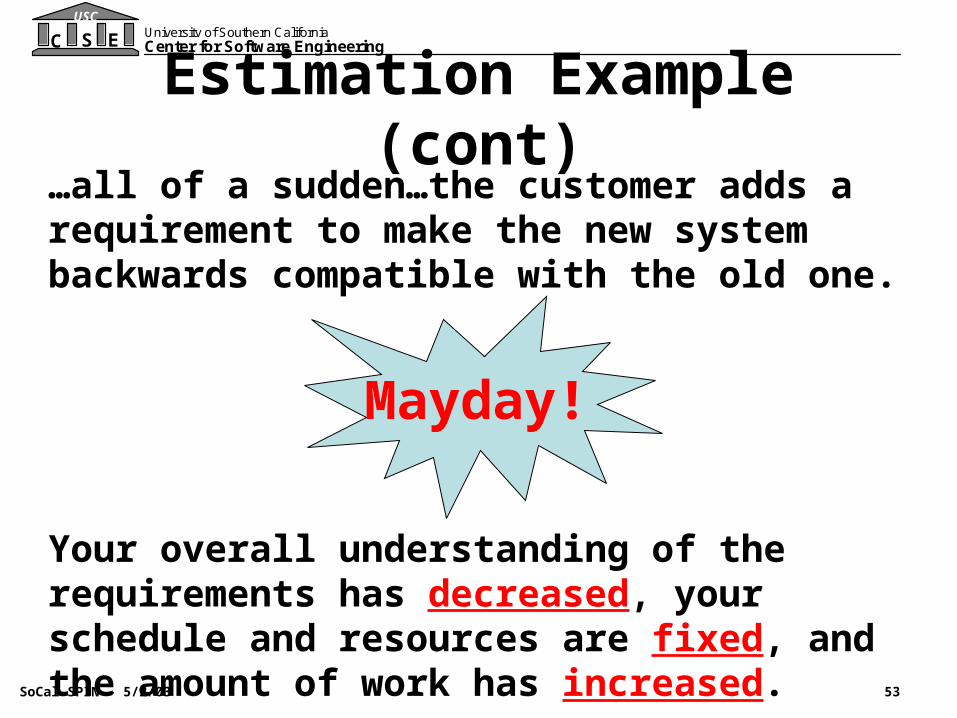
Estimation Example (cont)…all of a sudden…the customer adds a requirement to make the new system backwards compatible with the old one.
Your overall understanding of the requirements has decreased, your schedule and resources are fixed, and the amount of work has increased.
Mayday!

54
USC
C S E University of Southern CaliforniaCenter for Software Engineering
SoCal SPIN – 5/2/03
Estimation Example (cont)Justify to Program Manager/Director your request to increase resources in this area.
Very low Low Nominal High Very High
Poor, unprecedented system
Minimal, many undefined areas
Reasonable, some undefined areas
Strong, few undefined areas
Full understanding of requirements, familiar system
1.0
Requirements Understanding rating scale:
0.9 0.811.21.4
The effort is multiplied by 1.2!Instead of 12 PM, this job will require 14.4 PM of Systems Engineering work (additional $19.2k*)
*assumes $8k/PM

55
USC
C S E University of Southern CaliforniaCenter for Software Engineering
SoCal SPIN – 5/2/03
Outline
• Goals of this workshop
• Background, key ideas, and definitions
• Overview of COSYSMO
<coffee break>
• Estimation example
• Challenges
• Data collection process
• Demo
56
USC
C S E University of Southern CaliforniaCenter for Software Engineering
SoCal SPIN – 5/2/03
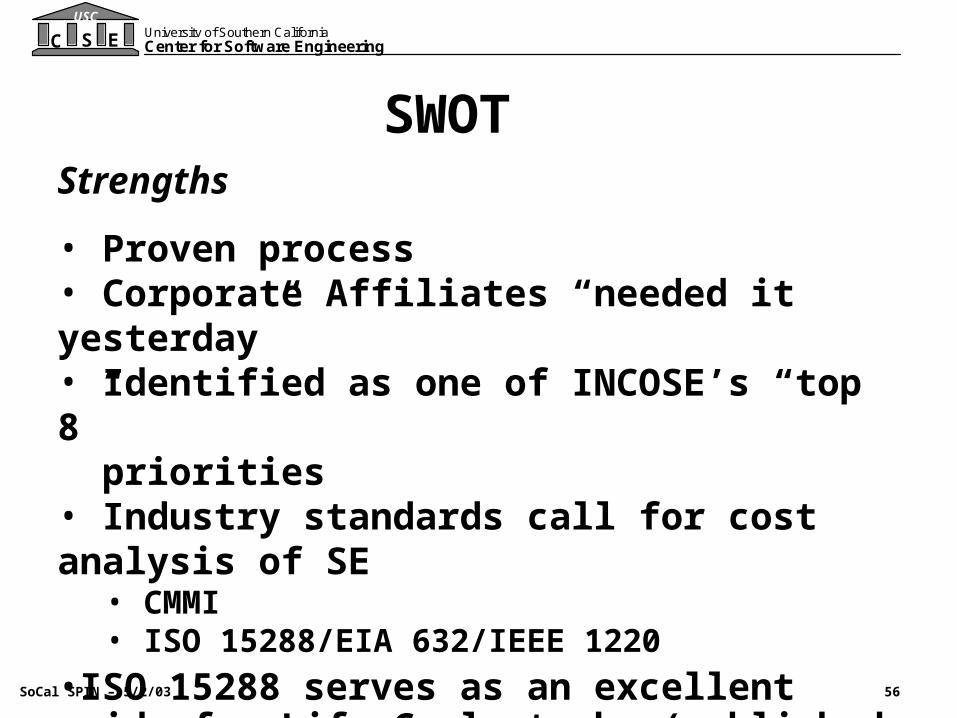
SWOTStrengths
• Proven process• Corporate Affiliates “needed it yesterday”• Identified as one of INCOSE’s “top 8” priorities• Industry standards call for cost analysis of SE
• CMMI• ISO 15288/EIA 632/IEEE 1220
•ISO 15288 serves as an excellent guide for Life Cycle tasks (published November 2002)
57
USC
C S E University of Southern CaliforniaCenter for Software Engineering
SoCal SPIN – 5/2/03
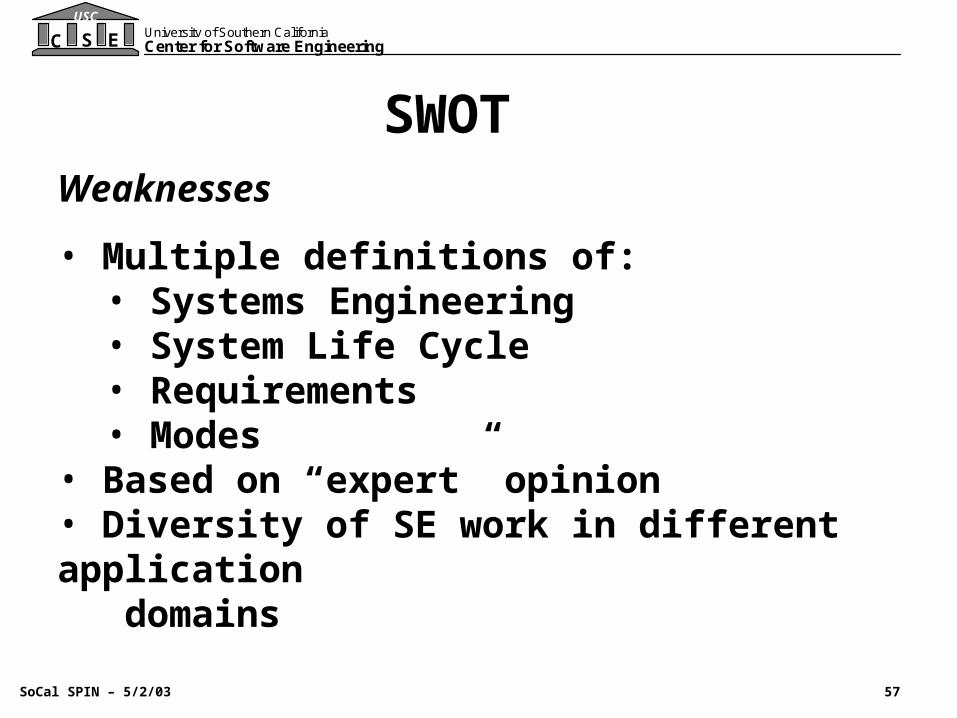
SWOTWeaknesses
• Multiple definitions of:• Systems Engineering• System Life Cycle• Requirements• Modes
• Based on “expert” opinion• Diversity of SE work in different application domains
58
USC
C S E University of Southern CaliforniaCenter for Software Engineering
SoCal SPIN – 5/2/03
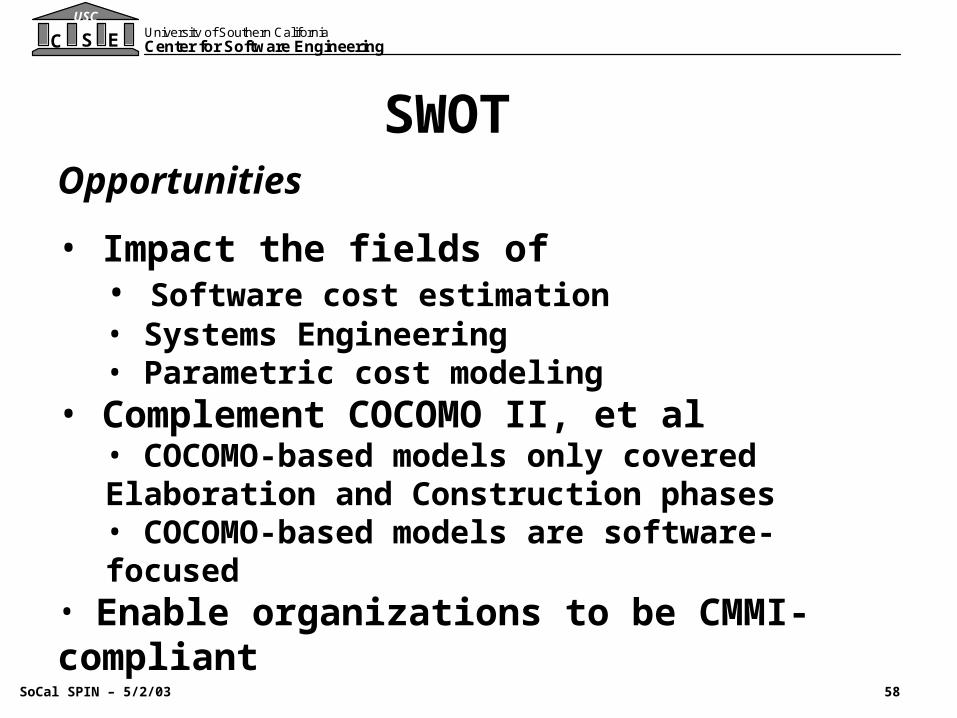
SWOTOpportunities
• Impact the fields of• Software cost estimation• Systems Engineering• Parametric cost modeling
• Complement COCOMO II, et al• COCOMO-based models only covered Elaboration and Construction phases• COCOMO-based models are software-focused
• Enable organizations to be CMMI-compliant

59
USC
C S E University of Southern CaliforniaCenter for Software Engineering
SoCal SPIN – 5/2/03
SWOTThreats
• Data is scarce• Accounting systems are very diverse• Statistical significance
• 18 predictor variables require 90 data points for calibration (following 5n rule)
• COSYSMO has several audiences• Parametric Analysts/Software Cost Modelers • Systems Engineers • Software Engineers
• SE is a “catch all” discipline
60
USC
C S E University of Southern CaliforniaCenter for Software Engineering
SoCal SPIN – 5/2/03
Outline
• Goals of this workshop
• Background, key ideas, and definitions
• Overview of COSYSMO
<coffee break>
• Estimation example
• Challenges
• Data collection process
• Demo
61
USC
C S E University of Southern CaliforniaCenter for Software Engineering
SoCal SPIN – 5/2/03
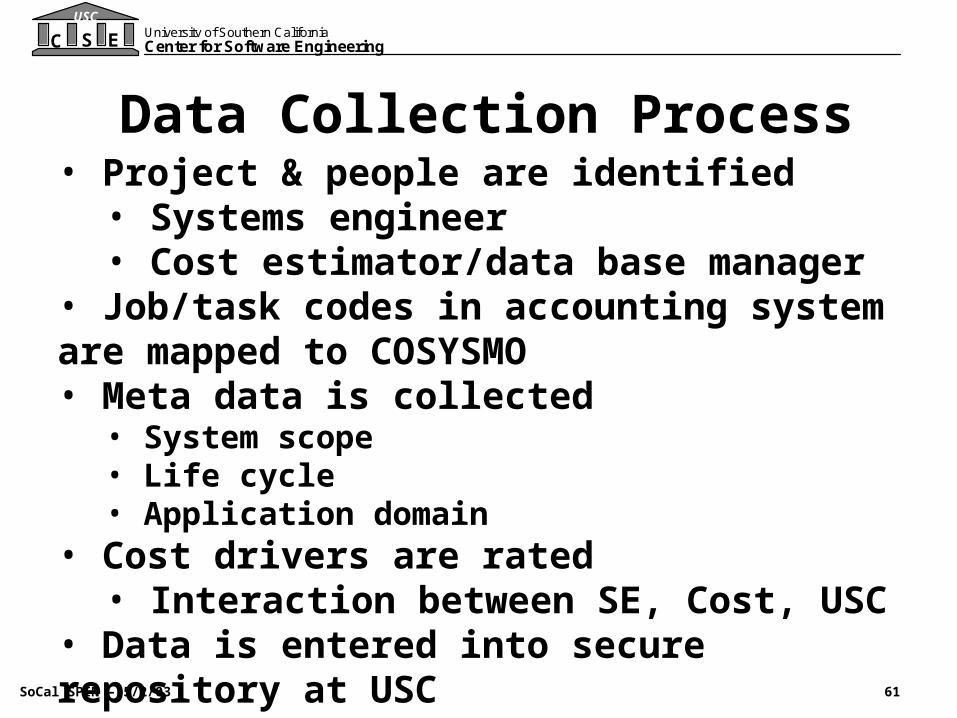
Data Collection Process• Project & people are identified
• Systems engineer• Cost estimator/data base manager
• Job/task codes in accounting system are mapped to COSYSMO• Meta data is collected
• System scope• Life cycle• Application domain
• Cost drivers are rated• Interaction between SE, Cost, USC
• Data is entered into secure repository at USC

62
USC
C S E University of Southern CaliforniaCenter for Software Engineering
SoCal SPIN – 5/2/03
USC/Raytheon myCOSYSMO* Demo
*Developed by Gary Thomas
at Raytheon Garland
63
USC
C S E University of Southern CaliforniaCenter for Software Engineering
SoCal SPIN – 5/2/03
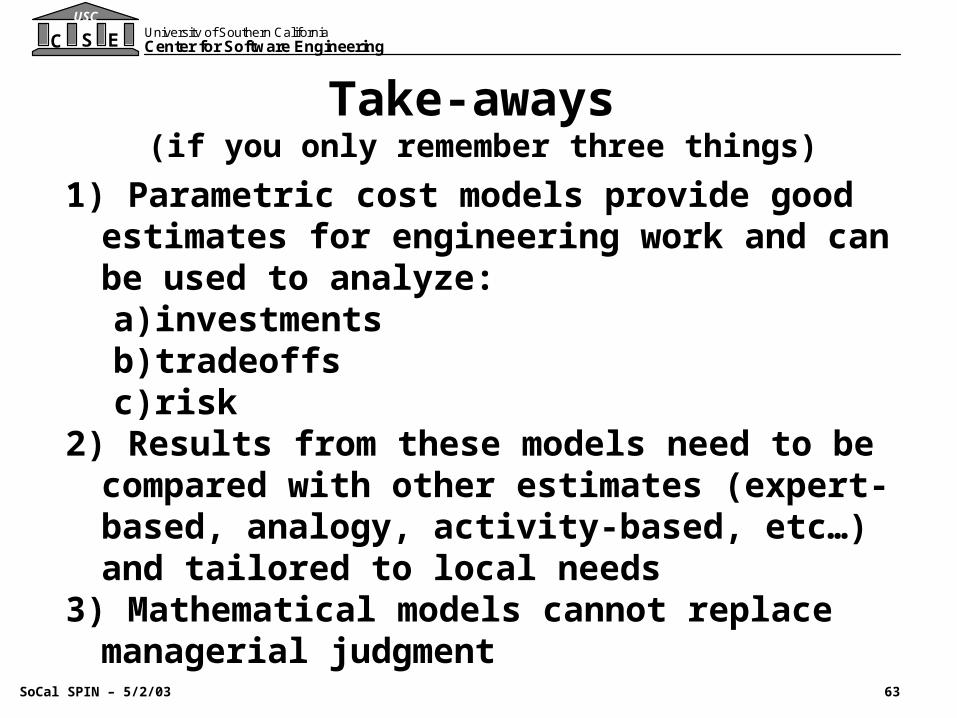
Take-aways (if you only remember three things)
1) Parametric cost models provide good estimates for engineering work and can be used to analyze:a) investmentsb)tradeoffsc) risk
2) Results from these models need to be compared with other estimates (expert-based, analogy, activity-based, etc…) and tailored to local needs
3) Mathematical models cannot replace managerial judgment
64
USC
C S E University of Southern CaliforniaCenter for Software Engineering
SoCal SPIN – 5/2/03
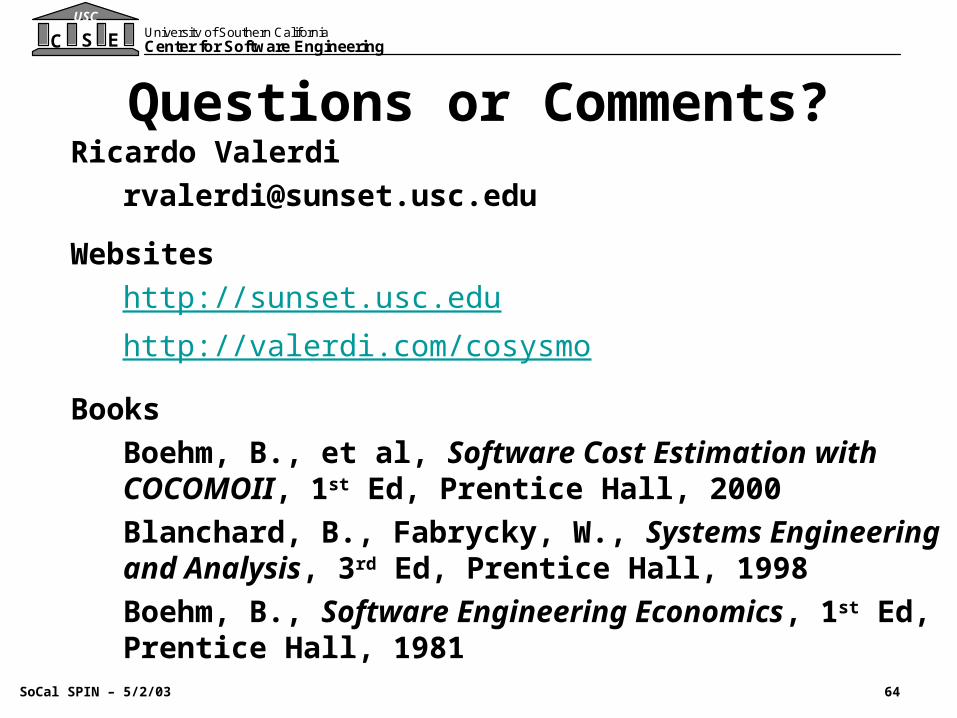
Questions or Comments?Ricardo Valerdi
Websites
http://sunset.usc.edu
http://valerdi.com/cosysmo
Books
Boehm, B., et al, Software Cost Estimation with COCOMOII, 1st Ed, Prentice Hall, 2000
Blanchard, B., Fabrycky, W., Systems Engineering and Analysis, 3rd Ed, Prentice Hall, 1998
Boehm, B., Software Engineering Economics, 1st Ed, Prentice Hall, 1981
65
USC
C S E University of Southern CaliforniaCenter for Software Engineering
SoCal SPIN – 5/2/03
Backup Charts

66
USC
C S E University of Southern CaliforniaCenter for Software Engineering
SoCal SPIN – 5/2/03
COSYSMO/COCOMO II MappingPrevious candidate starting point
Development EIA Stage Inception
Elaboration
Construction
Transition Management
14
12
10
14 Environment/CM
10
8
5
5 Requirements
38
18
8
4 Design
19
36
16
4 Implementation
8
13
34
19 Assessment
8
10
24
24 Deployment
3
3
3
30 TBD TBD TBD
= COCOMOII = COSYSMO-IP
When doingCOSYSMO-IP andCOCOMOII, Subtract grey areasprevent doublecounting.
TBD