Embed Size (px)
Citation preview
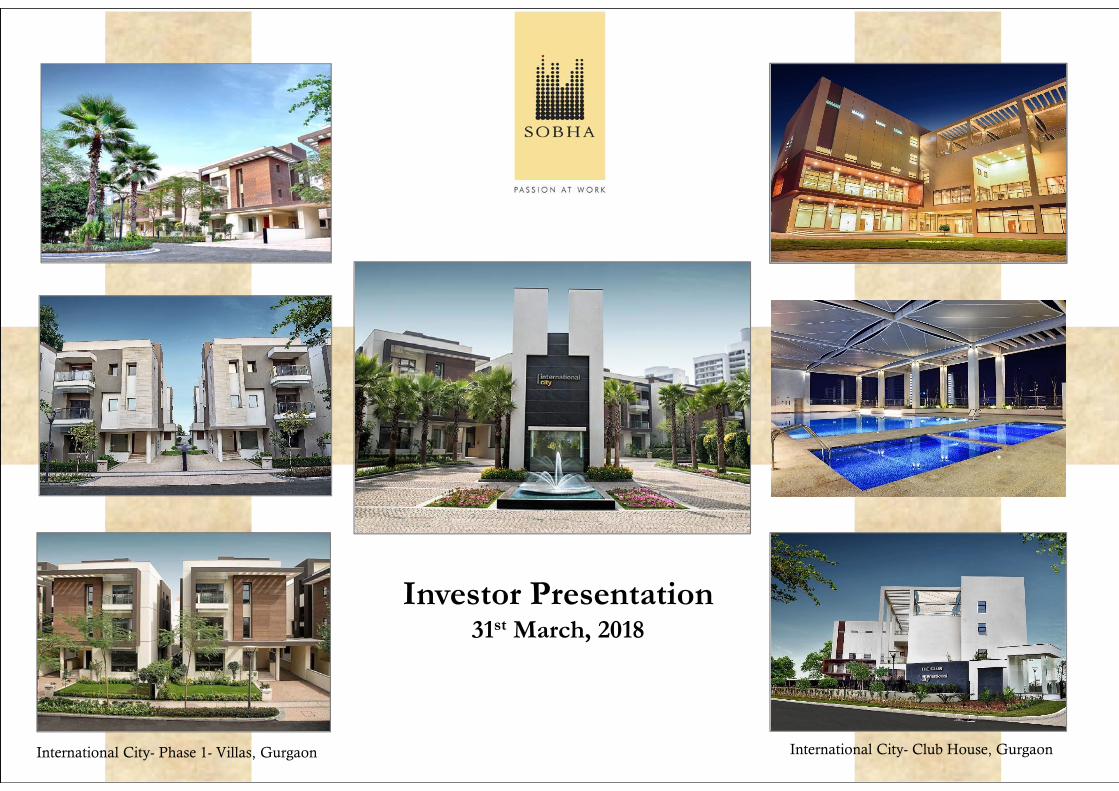
International City- Phase 1- Villas, Gurgaon International City- Club House, Gurgaon
Investor Presentation31stMarch, 2018

OPERATIONAL HIGHLIGHTS : FY 17-18
Slide no : 2(1 Square Meter = 10.764 Square Feet)
NEW SALES
� Rs.28.61 Billion Total Sales value (Sobha share of
sales value at Rs.24.22 Billion )– Highest ever.
� 3.63 Million square feet of New sales volume..
PROJECT COMPLETION
� Launched 4 projects measuring 2.52 mn sqft of
developable area (1.62 mn sqft saleable area).
� 1.78 mn sqft of area released for sale from existing
approved projects.
NEW LAUNCHES
RECOGNITION� 5.80 mn sqft of developable area completed during FY 17-18
(Both Real Estate & Contracts).
� In addition, 2.68 mn sqft of developable area completed and
applied for OC.
� SOBHA has been voted ‘Number 1’ choice of home
buyers nationally in ‘Track 2 Realty Consumer
Confidence report 20:20’, for the 4th consecutive
year.
CONTRACTS
� ≈ Rs.17.4 Billion of healthy order book.
� Bagged 2 major contractual orders from LuLu group & Biocon -
Total order valued at ≈ 6.10 Billion.
RERA & GST ERA
� Seamlessly integrated into RERA and GST
regime.
� All applicable Projects were registered under RERA.
Improved performance in challenging environment

FINANCIAL HIGHLIGHTS : FY 17-18
Slide no : 3(1 Square Meter = 10.764 Square Feet)
REVENUE & PROFIT
� Rs.28.37 Billion of Revenue – Highest ever
� Rs.3.17 Billion of PBT.
� Rs.2.17 Billion of PAT
CASH FLOW
� Rs.30.08 Billion of total collections – Best ever Inflow.
� Rs. 3.75 Billion of Net Operational Cash flow (After
interest & taxes)
� Consistently generated positive operational cash flow for
the past 11 quarters (Post interest & taxes).
COST OF BORROWING
� 9.39% - Lowest ever - Average cost of borrowings.
� 13 quarters of successive reduction of borrowing cost.
� 329 bps reduction of average interest cost since Q3-15.
D/E RATIO
� 0.79 of Debt Equity ratio as on 31st Mar-18.
� Rs.1,285 Million of Net debt reduction during Q4-18.
CREDIT RATING
� “A+ (Stable)” - Long term Credit Rating upgraded by
ICRA
HIGHEST EVER REVENUE, COLLECTIONS & NEW SALES VALUE

EXECELLENCE IN EXECUTION
Slide no : 4(1 Square Meter = 10.764 Square Feet)
LuLu- Cyber Tower 2, Kochi
� One of the Iconic project executed by Sobha Contracts Team for LuLu group at Cyber City – Info Park, Kakkanad, Kochi.
� Total Built-up area is ~ 1.5 mn.sft. Total contracts value at Rs.2.90 Billion. (Height of the building is 87 mtrs).
� Project was completed in 2.5 years time frame.
� Sobha scope of works includes Civil Structure, Finishes, MEP, Interiors & Glazing works.
� Uniquely designed & executed external facade and glazing works – ‘Double walled Tree Structure’.
� External façade works consist of, “Unitised Glazing, Tree Structure, Semi- Unitised Glazing, Aero Foil Lauver, Kalzip Cladding &
Spider Glazing works”.

SOBHA DREAM ACRES
Slide no : 5(1 Square Meter = 10.764 Square Feet)
Total extend of land ~ 81 Acres
Total Saleable Area 7.63 Mn. sqft
Total number of units 6,945
Total number of wings67 (plus 4 Club Houses)
Total area released for Sale as on 31st Mar-18
~ 3.64 Mn.sqft
Number of wings construction has begun
28 wings
Total area of work completed as on 31st Mar-18
~ 1.15 Mn.sqft
Wings 5,6
Wings 7-10,13-15
Wings 11 & 12Club House & Cycle Track
Wings 41 to 47

EXECUTION - SNAPSHOT
Slide no : 5(1 Square Meter = 10.764 Square Feet)
REAL ESTATE CONTRACTS
Completion till 31st
Mar-1742.44 44.29
FY 17-18 2.58 3.22
Total Completion 45.02* 47.51
� Total completion of 92.53 mn.sqft of area since inception.
� An average, ~ 7 mn.sqft of delivery for the past 5 years.
� ≈ 48.25 mn.sqft of projects under development.
� Land bank of 2,472 Acres spread across 9 cities, with approx. FSI
cost of Rs.122 / sqft.
� Execution presence in 26 cities / 13 states.
� Total number employees as on 31st Mar-18 : 2,857 #
� Total number of trained tradesmen as on 31st Mar-18 : ≈ 10,000
Area in mn. sqft
45.02 47.51
Completed
Real Estate Contracts
Area in mn.sqft
41.90
6.35
Ongoing
Real Estate Contracts
Area in mn.sqft
* This does not include 2.68 mn.sft of area completed and applied for OC.
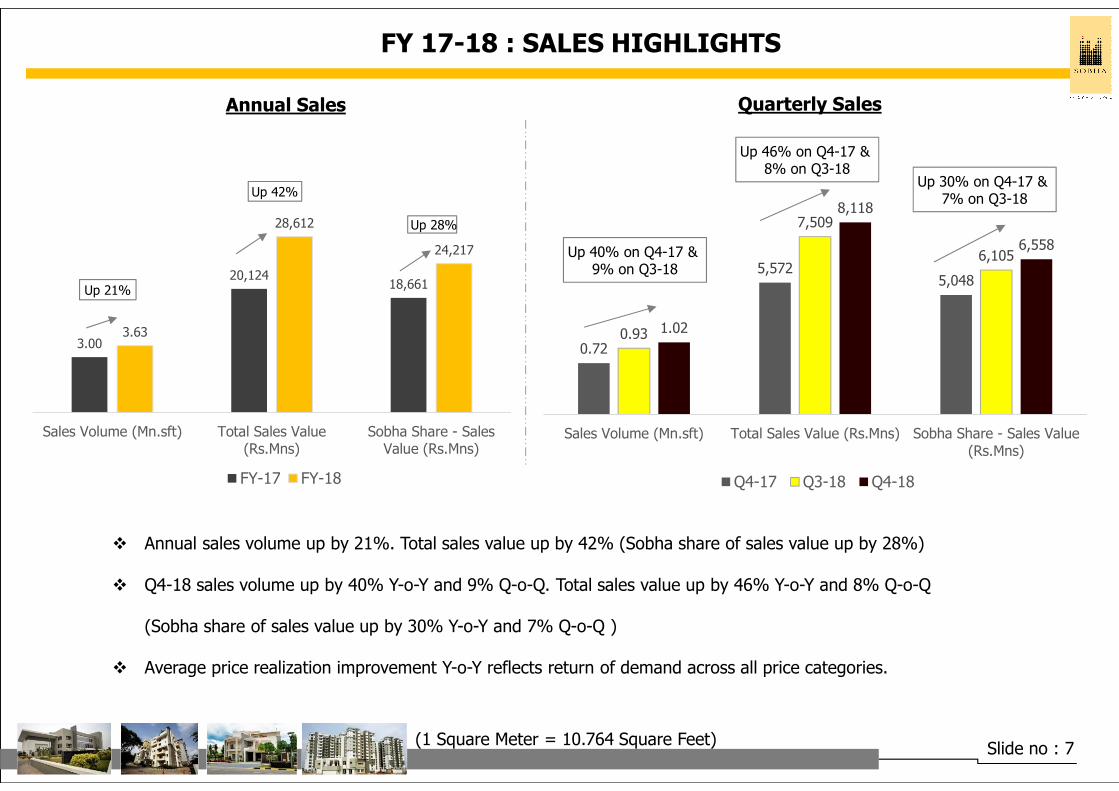
FY 17-18 : SALES HIGHLIGHTS
� Annual sales volume up by 21%. Total sales value up by 42% (Sobha share of sales value up by 28%)
� Q4-18 sales volume up by 40% Y-o-Y and 9% Q-o-Q. Total sales value up by 46% Y-o-Y and 8% Q-o-Q
(Sobha share of sales value up by 30% Y-o-Y and 7% Q-o-Q )
� Average price realization improvement Y-o-Y reflects return of demand across all price categories.
3.00
20,12418,661
3.63
28,612
24,217
Sales Volume (Mn.sft) Total Sales Value(Rs.Mns)
Sobha Share - SalesValue (Rs.Mns)
FY-17 FY-18
Up 21%
Up 28%
Up 42%
0.72
5,5725,048
0.93
7,509
6,105
1.02
8,118
6,558
Sales Volume (Mn.sft) Total Sales Value (Rs.Mns) Sobha Share - Sales Value(Rs.Mns)
Q4-17 Q3-18 Q4-18
Up 40% on Q4-17 & 9% on Q3-18
Up 46% on Q4-17 & 8% on Q3-18
Up 30% on Q4-17 & 7% on Q3-18
Annual Sales Quarterly Sales
Slide no : 7(1 Square Meter = 10.764 Square Feet)

SALES PERFORMANCE & PRICE REALIZATION
Slide no : 8(1 Square Meter = 10.764 Square Feet)
Bangalore ; 74%
Kochi; 11%
NCR (Gurgaon) ; 7%
Coimbatore; 3%
Chennai ; 2%
Other Cities; 3%
Particulars Bangalore NCR
(Gurgaon) Chennai Kochi Thrissur Calicut Coimbatore Mysore Pune TOTAL
Q4-18
Area Sold Sq.feet 750,375 75,733 20,100 116,409 6,425 4,871 25,127 10,944 5,727 1,015,711
Avg. Price Realization –Incl JD Share
Rs/Sqft 7,517 9,872 9,739 10,661 8,711 7,676 5,448 2,384 6,450 7,993
Avg. Price Realization –Only Sobha Share
Rs/Sqft 6,776 6,362 6,302 5,331 8,711 6,152 3,804 2,384 6,450 6,457
FY 17-18
Area Sold Sq.feet 2,600,252 360,857 102,227 317,618 59,570 45,340 69,271 67,230 3,025 3,625,390
Avg. Price Realization -Incl JD Share
Rs/Sqft 7,554 9,899 6,642 10,589 8,394 7,759 5,639 2,259 (12,797) 7,892
Avg. Price Realization -Only Sobha Share
Rs/Sqft 7,046 6,963 5,128 5,259 8,394 6,245 4,241 2,259 (12,797) 6,680
Mysore, 1.1%
Thrissur, 0.6%
Pune, 0.6%
Calicut, 0.5%
Note : Sales value includes Basic price, Car park, Statutory deposits, Taxes, but excludes Registration and stamp duty charges and maintenance deposits.
Q4 FY-18
Bangalore ; 71%NCR (Gurgaon) ; 10%
Kochi; 9%
Chennai ; 3%
Coimbatore; 2%
Mysore; 2%
Other Cities; 3%
Thrissur, 1.6%
FY 17-18
Calicut, 1.3%
Pune, 0.1%
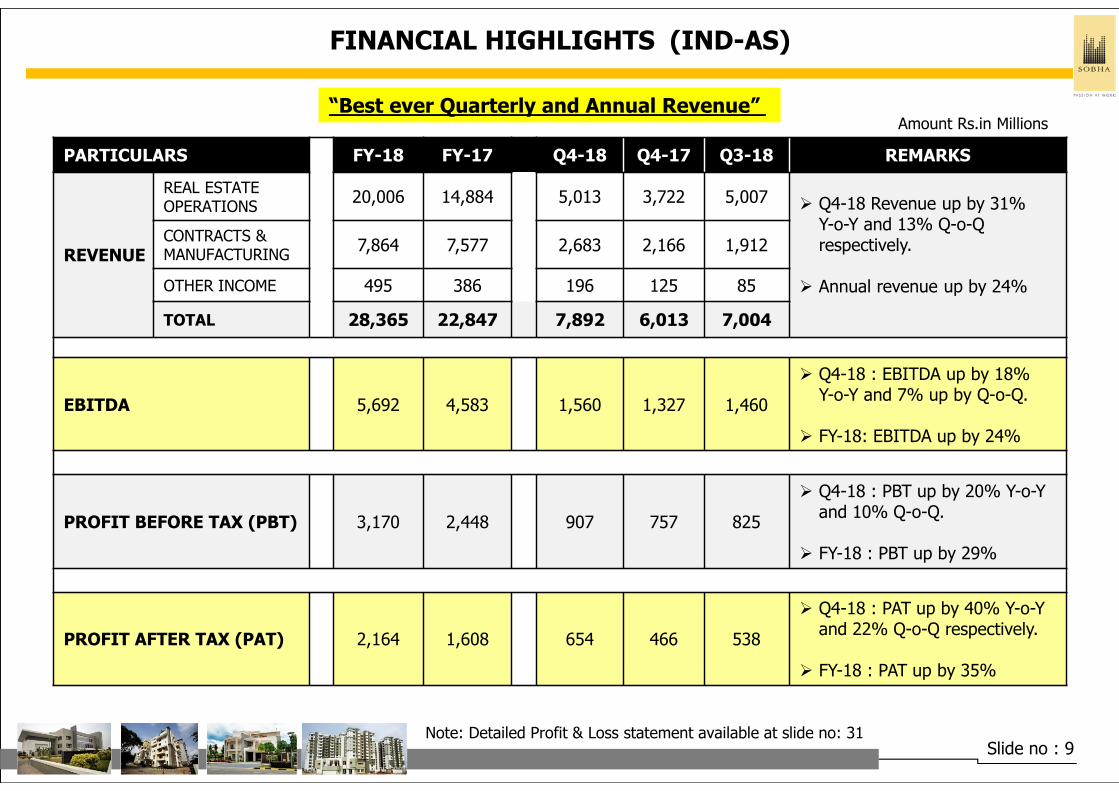
FINANCIAL HIGHLIGHTS (IND-AS)
Slide no : 9
PARTICULARS FY-18 FY-17 Q4-18 Q4-17 Q3-18 REMARKS
REVENUE
REAL ESTATE OPERATIONS
20,006 14,884 5,013 3,722 5,007� Q4-18 Revenue up by 31%
Y-o-Y and 13% Q-o-Q respectively.
� Annual revenue up by 24%
CONTRACTS & MANUFACTURING
7,864 7,577 2,683 2,166 1,912
OTHER INCOME 495 386 196 125 85
TOTAL 28,365 22,847 7,892 6,013 7,004
EBITDA 5,692 4,583 1,560 1,327 1,460
� Q4-18 : EBITDA up by 18% Y-o-Y and 7% up by Q-o-Q.
� FY-18: EBITDA up by 24%
PROFIT BEFORE TAX (PBT) 3,170 2,448 907 757 825
� Q4-18 : PBT up by 20% Y-o-Y and 10% Q-o-Q.
� FY-18 : PBT up by 29%
PROFIT AFTER TAX (PAT) 2,164 1,608 654 466 538
� Q4-18 : PAT up by 40% Y-o-Y and 22% Q-o-Q respectively.
� FY-18 : PAT up by 35%
Amount Rs.in Millions
Note: Detailed Profit & Loss statement available at slide no: 31
“Best ever Quarterly and Annual Revenue”
Slide no : 10
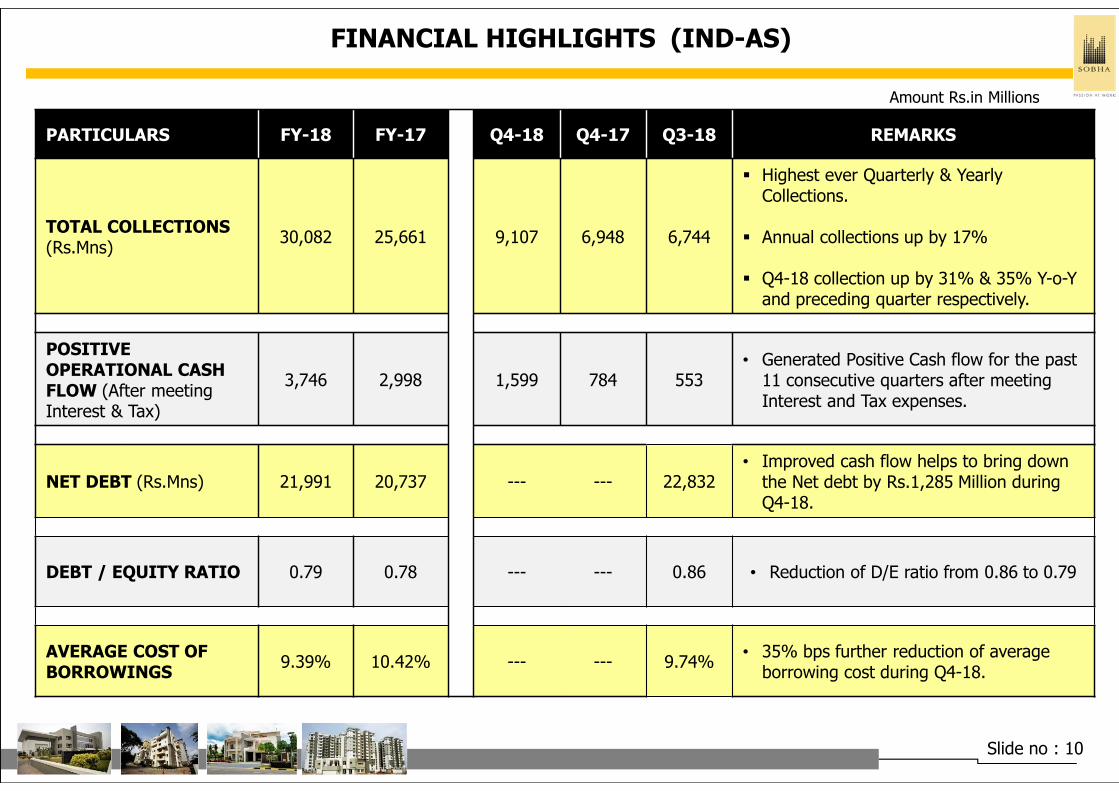
FINANCIAL HIGHLIGHTS (IND-AS)
PARTICULARS FY-18 FY-17 Q4-18 Q4-17 Q3-18 REMARKS
TOTAL COLLECTIONS (Rs.Mns)
30,082 25,661 9,107 6,948 6,744
� Highest ever Quarterly & YearlyCollections.
� Annual collections up by 17%
� Q4-18 collection up by 31% & 35% Y-o-Y and preceding quarter respectively.
POSITIVE OPERATIONAL CASH FLOW (After meeting Interest & Tax)
3,746 2,998 1,599 784 553• Generated Positive Cash flow for the past
11 consecutive quarters after meeting Interest and Tax expenses.
NET DEBT (Rs.Mns) 21,991 20,737 --- --- 22,832• Improved cash flow helps to bring down
the Net debt by Rs.1,285 Million during Q4-18.
DEBT / EQUITY RATIO 0.79 0.78 --- --- 0.86 • Reduction of D/E ratio from 0.86 to 0.79
AVERAGE COST OF BORROWINGS
9.39% 10.42% --- --- 9.74%• 35% bps further reduction of average
borrowing cost during Q4-18.
Amount Rs.in Millions

BALANCE SHEET – ABSTRACT (IND-AS)
Slide no : 11
PARTICULARSIND-AS
31st Mar-18 31st Mar-17
ASSETS
Non-current assets 12,101 10,812
Current Assets 78,147 78,118
TOTAL ASSETS 90,248 88,930
EQUITY & LIABILITIES
Total Equity 27,699 26,445
Non-Current Liabilities 5,494 6,869
Current Liabilities 57,055 55,616
TOTAL EQUITY & LIABILITIES 90,248 88,930
Note: Detailed Balance sheet break up available at slide no : 30
Amount Rs.in Millions
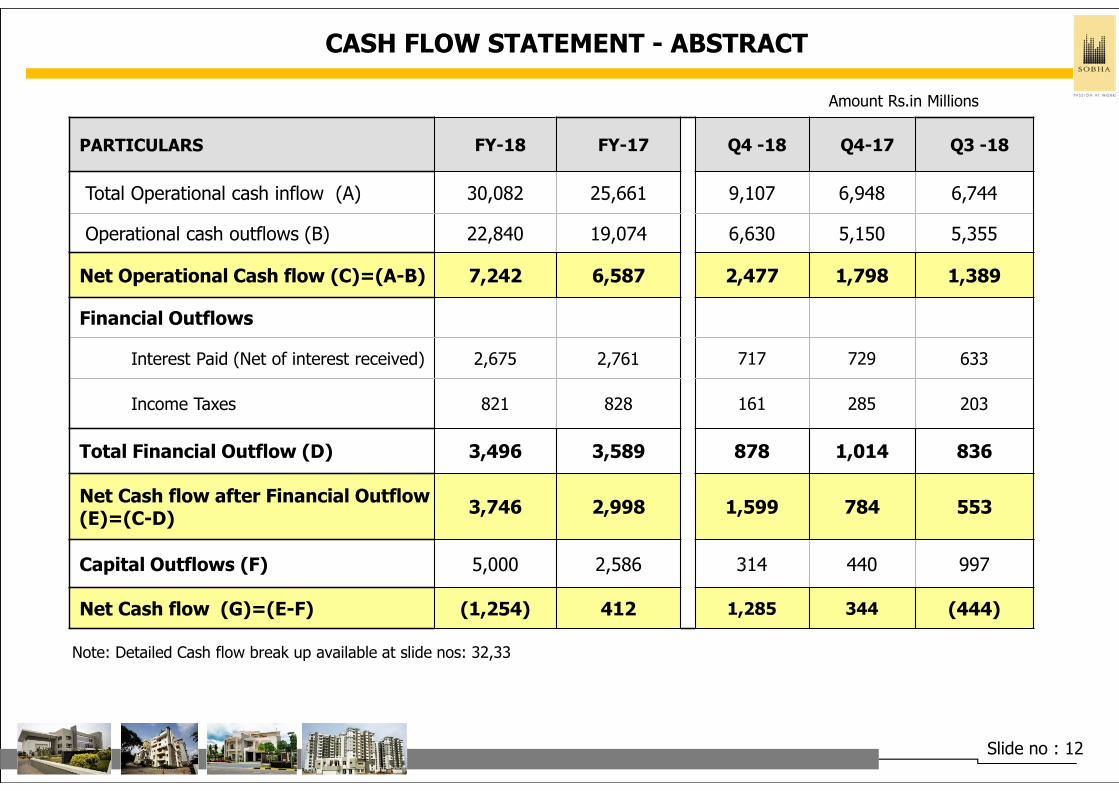
CASH FLOW STATEMENT - ABSTRACT
PARTICULARS FY-18 FY-17 Q4 -18 Q4-17 Q3 -18
Total Operational cash inflow (A) 30,082 25,661 9,107 6,948 6,744
Operational cash outflows (B) 22,840 19,074 6,630 5,150 5,355
Net Operational Cash flow (C)=(A-B) 7,242 6,587 2,477 1,798 1,389
Financial Outflows
Interest Paid (Net of interest received) 2,675 2,761 717 729 633
Income Taxes 821 828 161 285 203
Total Financial Outflow (D) 3,496 3,589 878 1,014 836
Net Cash flow after Financial Outflow (E)=(C-D)
3,746 2,998 1,599 784 553
Capital Outflows (F) 5,000 2,586 314 440 997
Net Cash flow (G)=(E-F) (1,254) 412 1,285 344 (444)
Slide no : 12
Note: Detailed Cash flow break up available at slide nos: 32,33
Amount Rs.in Millions
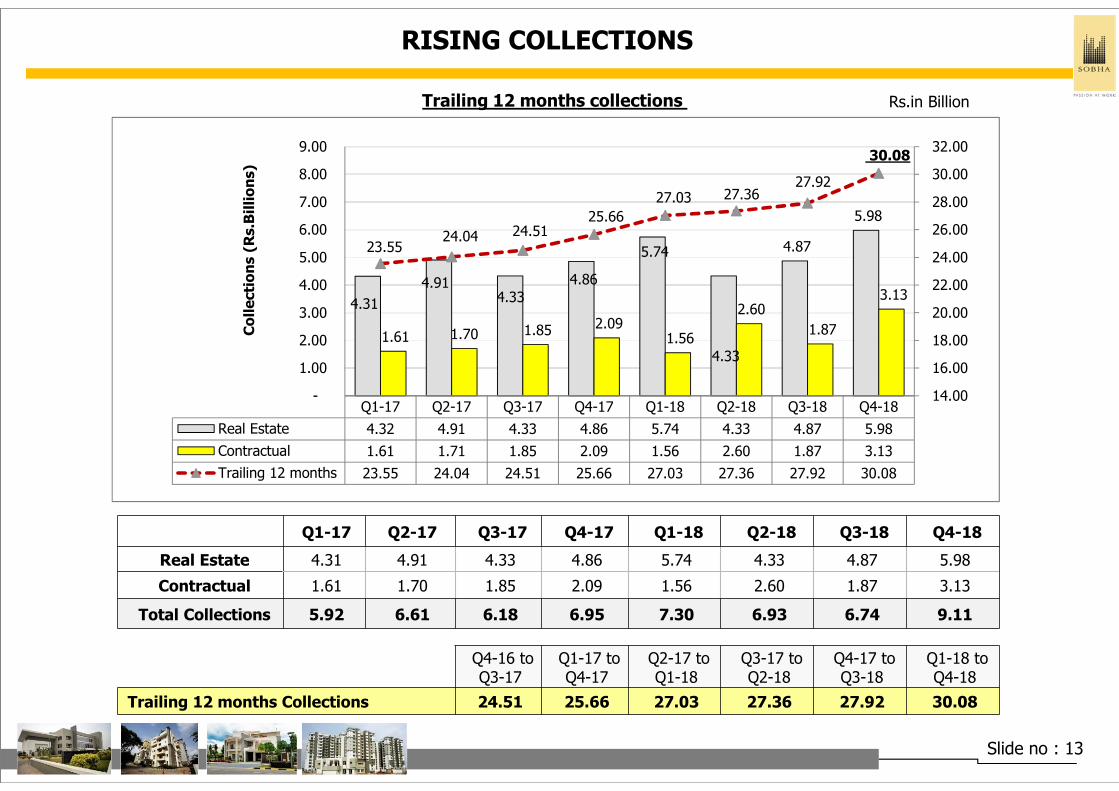
RISING COLLECTIONS
Slide no : 13
Rs.in BillionTrailing 12 months collections
Q1-17 Q2-17 Q3-17 Q4-17 Q1-18 Q2-18 Q3-18 Q4-18
Real Estate 4.31 4.91 4.33 4.86 5.74 4.33 4.87 5.98
Contractual 1.61 1.70 1.85 2.09 1.56 2.60 1.87 3.13
Total Collections 5.92 6.61 6.18 6.95 7.30 6.93 6.74 9.11
Q4-16 to Q3-17
Q1-17 to Q4-17
Q2-17 to Q1-18
Q3-17 to Q2-18
Q4-17 to Q3-18
Q1-18 to Q4-18
Trailing 12 months Collections 24.51 25.66 27.03 27.36 27.92 30.08
Q1-17 Q2-17 Q3-17 Q4-17 Q1-18 Q2-18 Q3-18 Q4-18
Real Estate 4.32 4.91 4.33 4.86 5.74 4.33 4.87 5.98
Contractual 1.61 1.71 1.85 2.09 1.56 2.60 1.87 3.13
Trailing 12 months 23.55 24.04 24.51 25.66 27.03 27.36 27.92 30.08
4.31
4.91 4.33
4.86
5.74
4.33
4.87
5.98
1.61 1.70 1.85 2.09 1.56
2.60
1.87
3.13
23.55 24.04 24.51
25.66
27.03 27.36 27.92
30.08
14.00
16.00
18.00
20.00
22.00
24.00
26.00
28.00
30.00
32.00
-
1.00
2.00
3.00
4.00
5.00
6.00
7.00
8.00
9.00
Co
lle
cti
on
s (
Rs.B
illi
on
s)
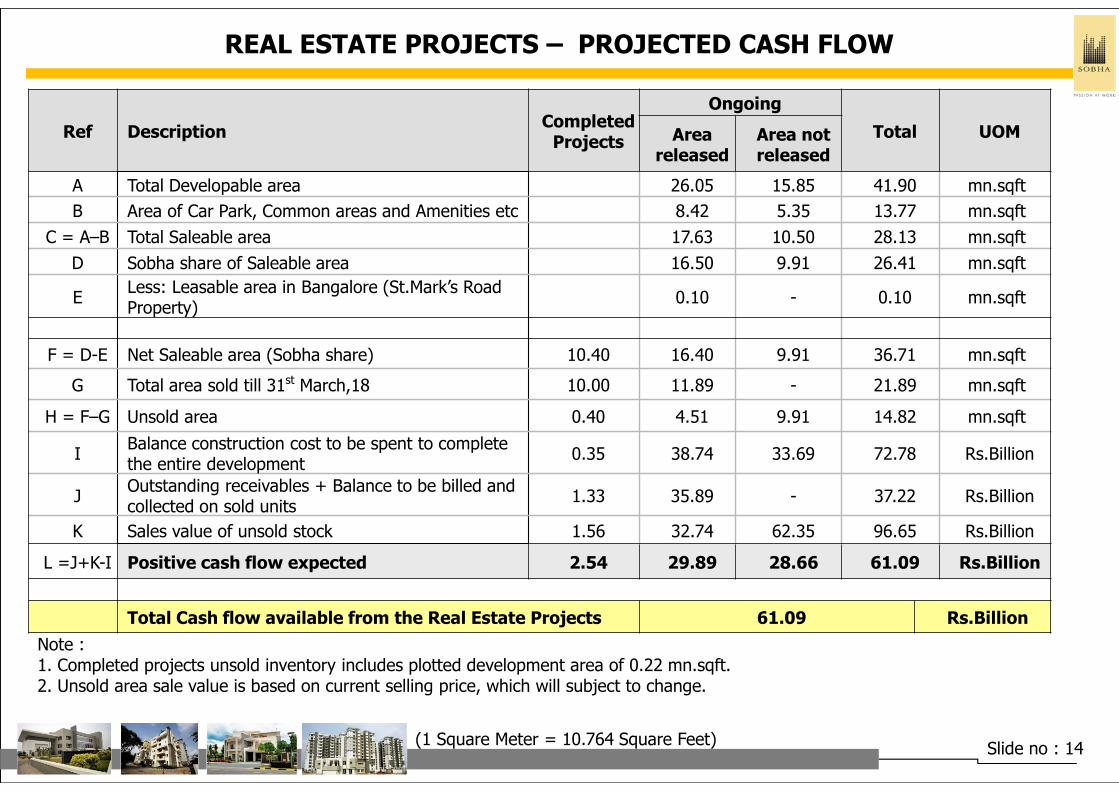
REAL ESTATE PROJECTS – PROJECTED CASH FLOW
Ref DescriptionCompleted
Projects
Ongoing
Total UOMArea released
Area not released
A Total Developable area 26.05 15.85 41.90 mn.sqft
B Area of Car Park, Common areas and Amenities etc 8.42 5.35 13.77 mn.sqft
C = A–B Total Saleable area 17.63 10.50 28.13 mn.sqft
D Sobha share of Saleable area 16.50 9.91 26.41 mn.sqft
ELess: Leasable area in Bangalore (St.Mark’s Road Property)
0.10 - 0.10 mn.sqft
F = D-E Net Saleable area (Sobha share) 10.40 16.40 9.91 36.71 mn.sqft
G Total area sold till 31st March,18 10.00 11.89 - 21.89 mn.sqft
H = F–G Unsold area 0.40 4.51 9.91 14.82 mn.sqft
IBalance construction cost to be spent to complete the entire development
0.35 38.74 33.69 72.78 Rs.Billion
JOutstanding receivables + Balance to be billed and collected on sold units
1.33 35.89 - 37.22 Rs.Billion
K Sales value of unsold stock 1.56 32.74 62.35 96.65 Rs.Billion
L =J+K-I Positive cash flow expected 2.54 29.89 28.66 61.09 Rs.Billion
Total Cash flow available from the Real Estate Projects 61.09 Rs.Billion
Slide no : 14(1 Square Meter = 10.764 Square Feet)
Note :1. Completed projects unsold inventory includes plotted development area of 0.22 mn.sqft.2. Unsold area sale value is based on current selling price, which will subject to change.
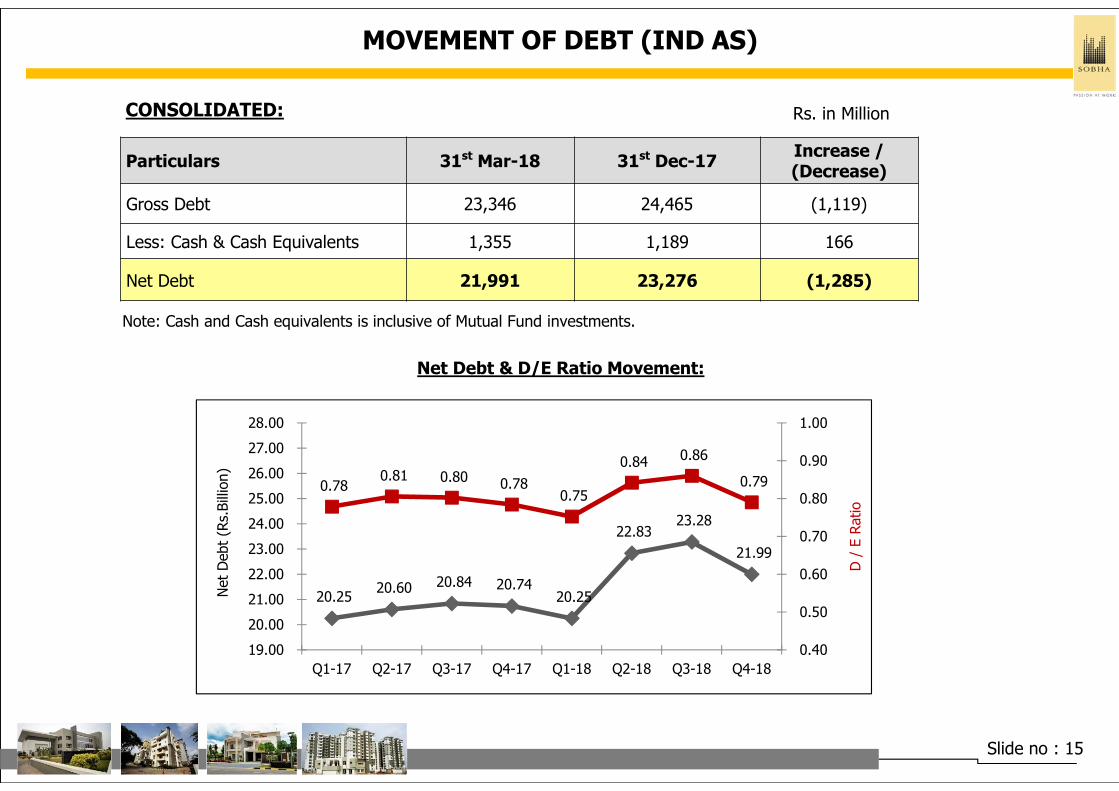
Particulars 31st Mar-18 31st Dec-17Increase / (Decrease)
Gross Debt 23,346 24,465 (1,119)
Less: Cash & Cash Equivalents 1,355 1,189 166
Net Debt 21,991 23,276 (1,285)
Rs. in MillionCONSOLIDATED:
MOVEMENT OF DEBT (IND AS)
Slide no : 15
Net Debt & D/E Ratio Movement:
Note: Cash and Cash equivalents is inclusive of Mutual Fund investments.
20.25 20.60 20.84 20.74
20.25
22.83 23.28
21.99
0.78 0.81 0.80 0.78
0.75
0.84 0.86
0.79
0.40
0.50
0.60
0.70
0.80
0.90
1.00
19.00
20.00
21.00
22.00
23.00
24.00
25.00
26.00
27.00
28.00
Q1-17 Q2-17 Q3-17 Q4-17 Q1-18 Q2-18 Q3-18 Q4-18
Net
Debt
(Rs.
Bill
ion)
D /
E R
atio
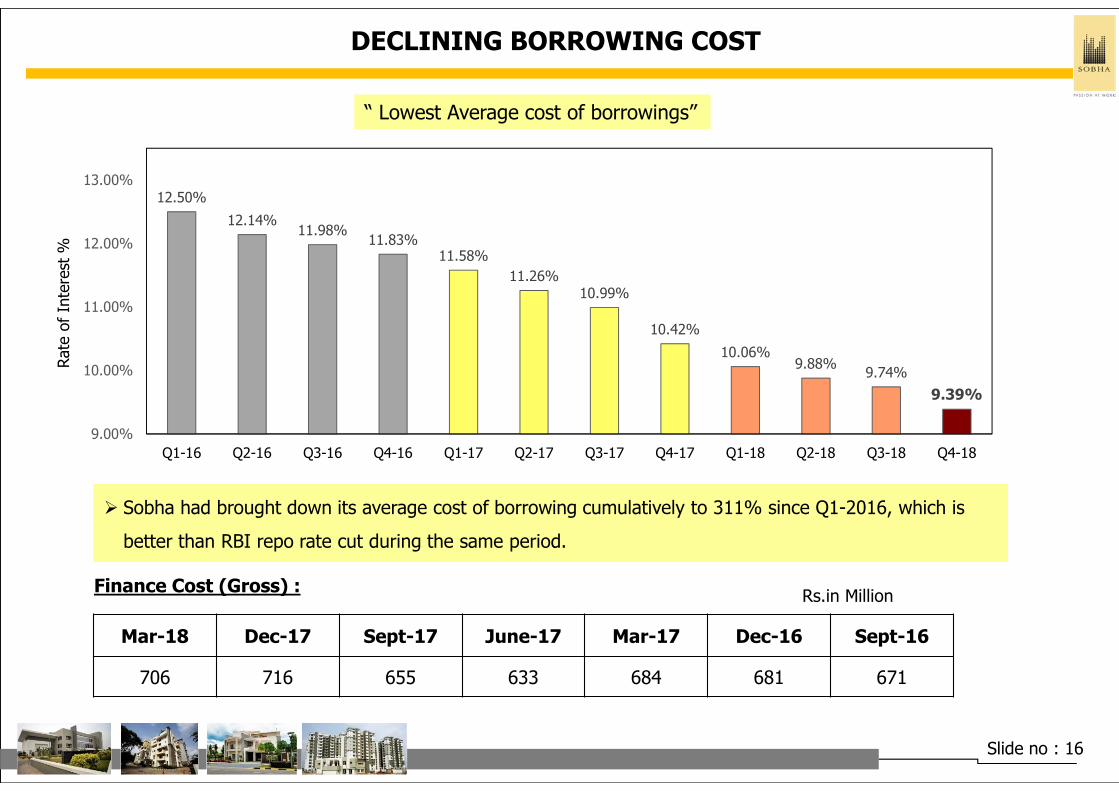
DECLINING BORROWING COST
Slide no : 16
“ Lowest Average cost of borrowings”
� Sobha had brought down its average cost of borrowing cumulatively to 311% since Q1-2016, which is
better than RBI repo rate cut during the same period.
Mar-18 Dec-17 Sept-17 June-17 Mar-17 Dec-16 Sept-16
706 716 655 633 684 681 671
Finance Cost (Gross) :Rs.in Million
12.50%
12.14%11.98%
11.83%11.58%
11.26%10.99%
10.42%
10.06%9.88%
9.74%
9.39%
9.00%
10.00%
11.00%
12.00%
13.00%
Q1-16 Q2-16 Q3-16 Q4-16 Q1-17 Q2-17 Q3-17 Q4-17 Q1-18 Q2-18 Q3-18 Q4-18
Rate
of
Inte
rest
%
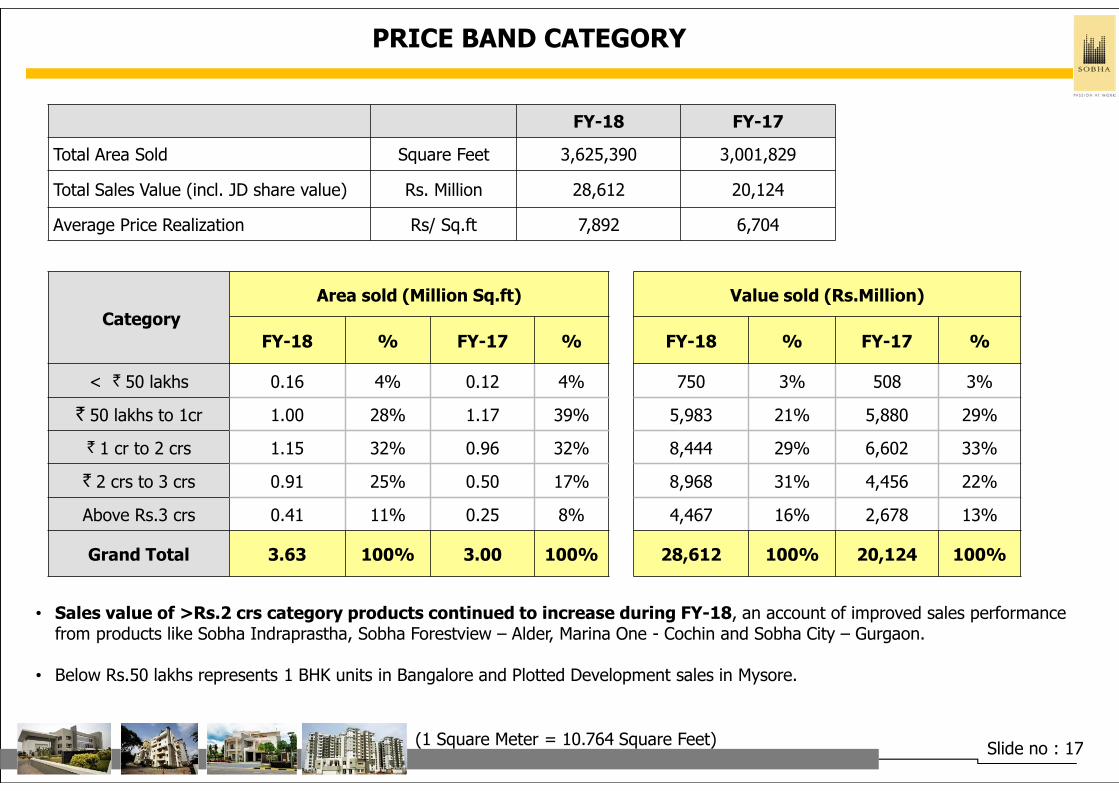
PRICE BAND CATEGORY
• Sales value of >Rs.2 crs category products continued to increase during FY-18, an account of improved sales performance from products like Sobha Indraprastha, Sobha Forestview – Alder, Marina One - Cochin and Sobha City – Gurgaon.
• Below Rs.50 lakhs represents 1 BHK units in Bangalore and Plotted Development sales in Mysore.
Slide no : 17(1 Square Meter = 10.764 Square Feet)
FY-18 FY-17
Total Area Sold Square Feet 3,625,390 3,001,829
Total Sales Value (incl. JD share value) Rs. Million 28,612 20,124
Average Price Realization Rs/ Sq.ft 7,892 6,704
Category
Area sold (Million Sq.ft) Value sold (Rs.Million)
FY-18 % FY-17 % FY-18 % FY-17 %
< ` 50 lakhs 0.16 4% 0.12 4% 750 3% 508 3%
` 50 lakhs to 1cr 1.00 28% 1.17 39% 5,983 21% 5,880 29%
` 1 cr to 2 crs 1.15 32% 0.96 32% 8,444 29% 6,602 33%
` 2 crs to 3 crs 0.91 25% 0.50 17% 8,968 31% 4,456 22%
Above Rs.3 crs 0.41 11% 0.25 8% 4,467 16% 2,678 13%
Grand Total 3.63 100% 3.00 100% 28,612 100% 20,124 100%

Slide no : 18
BUYERS PROFILE – ROLLING 12 MONTHS
* Others includes Housewives, Agriculturist, Retired and Govt. Employees.
Buyers Age-wise breakupProfession-wise breakup
NRI Booking status
Resident Indians 91%
NRI’s 9%Healthy Customer base:
� 78% of customers base fall under salaried professionals. (IT/ITES : 42% & Non-IT: 36%)
� 12% customers are Business & entrepreneur category.
� 81% of customers are below 50 years age category.Bank Loan 56%
Self Funding 44%
Customer Funding status (as o n 31st Mar-18)
IT/ITES Professional,
42%
Non-IT professionals,
36%
Business/ Entrepreneur,
12%
Medical / Pharma, 4%
Others, 6%
Age 21-30; 19%
Age 31-40; 38%
Age 41-50; 24%
Age > 50; 19%
* Developed / Developable area includes super built-up area (SBA) / saleable area to the customer plus common area, car parking area, service area, storage area, internal roads and common amenities.
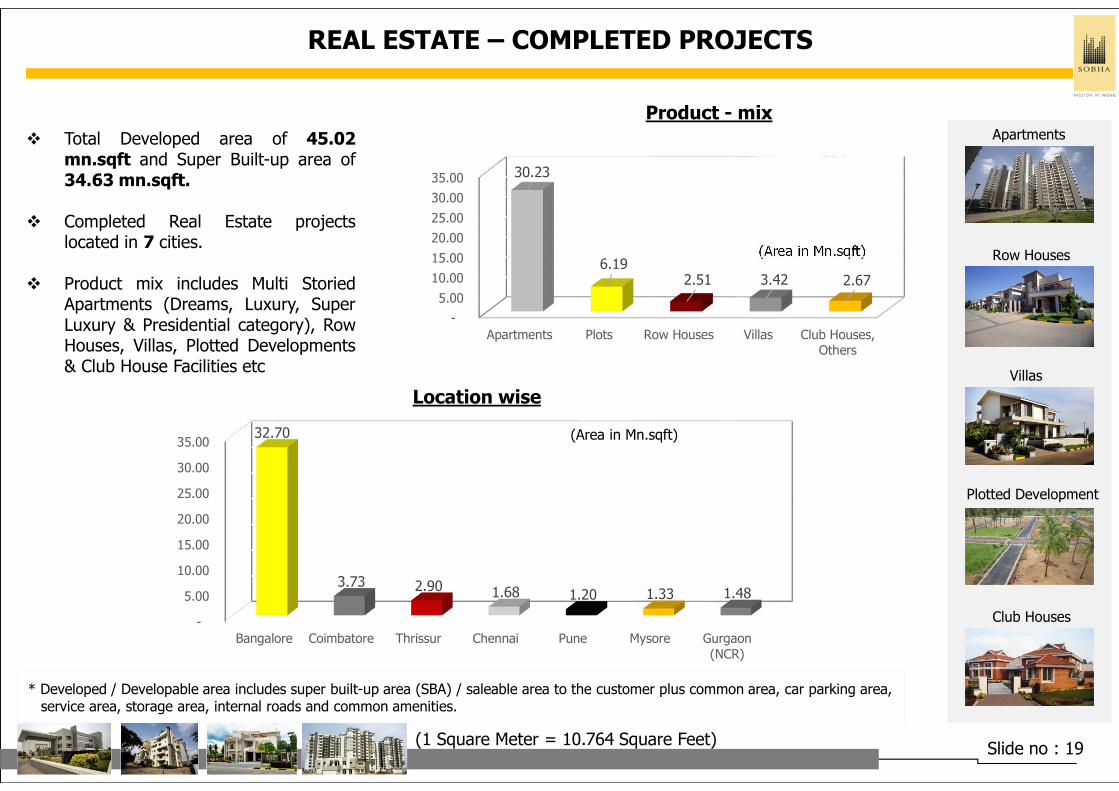
REAL ESTATE – COMPLETED PROJECTS
� Total Developed area of 45.02mn.sqft and Super Built-up area of34.63 mn.sqft.
� Completed Real Estate projectslocated in 7 cities.
� Product mix includes Multi StoriedApartments (Dreams, Luxury, SuperLuxury & Presidential category), RowHouses, Villas, Plotted Developments& Club House Facilities etc
Apartments
Villas
Row Houses
Plotted Development
Club Houses
Product - mix
Slide no : 19(1 Square Meter = 10.764 Square Feet)
(Area in Mn.sqft)
Location wise
-
5.00
10.00
15.00
20.00
25.00
30.00
35.00
Apartments Plots Row Houses Villas Club Houses,Others
30.23
6.19 2.51 3.42 2.67
-
5.00
10.00
15.00
20.00
25.00
30.00
35.00
Bangalore Coimbatore Thrissur Chennai Pune Mysore Gurgaon(NCR)
32.70
3.73 2.90 1.68 1.20 1.33 1.48
(Area in Mn.sqft)
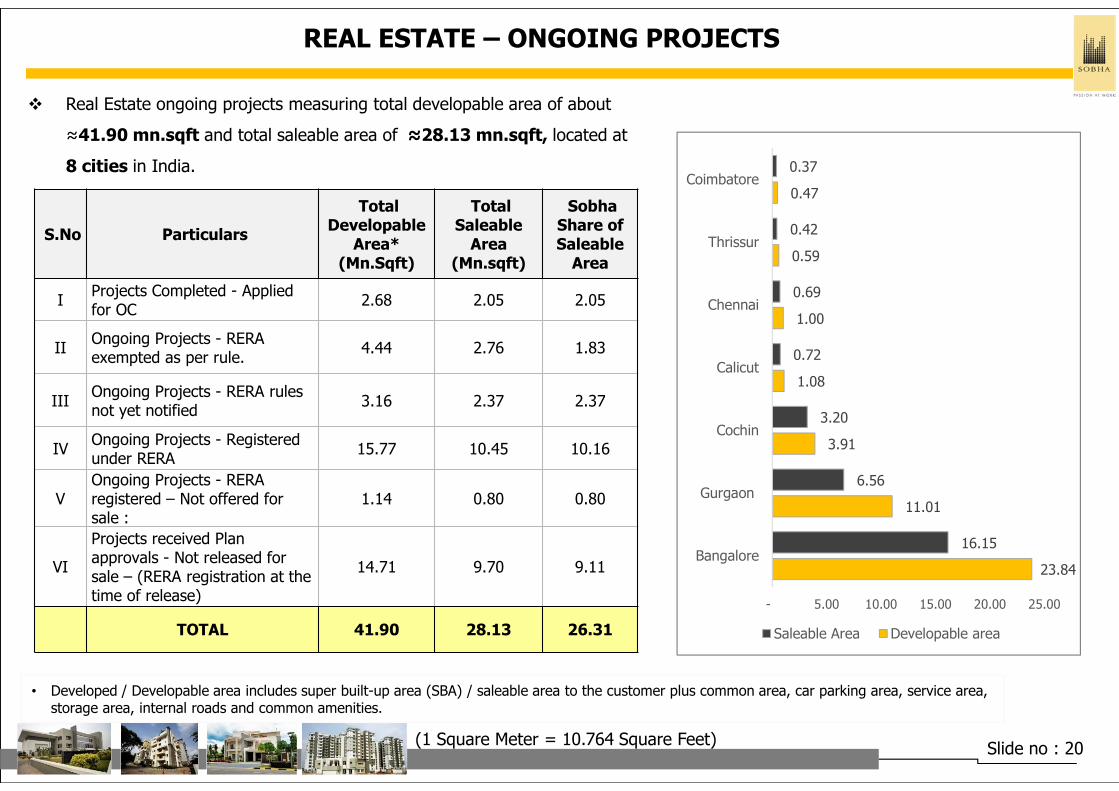
REAL ESTATE – ONGOING PROJECTS
� Real Estate ongoing projects measuring total developable area of about
≈41.90 mn.sqft and total saleable area of ≈28.13 mn.sqft, located at
8 cities in India.
Slide no : 20(1 Square Meter = 10.764 Square Feet)
S.No Particulars
Total Developable
Area*(Mn.Sqft)
Total Saleable
Area (Mn.sqft)
Sobha Share of Saleable
Area
IProjects Completed - Applied for OC
2.68 2.05 2.05
IIOngoing Projects - RERA exempted as per rule.
4.44 2.76 1.83
IIIOngoing Projects - RERA rules not yet notified
3.16 2.37 2.37
IVOngoing Projects - Registered under RERA
15.77 10.45 10.16
VOngoing Projects - RERA registered – Not offered for sale :
1.14 0.80 0.80
VI
Projects received Plan approvals - Not released for sale – (RERA registration at the time of release)
14.71 9.70 9.11
TOTAL 41.90 28.13 26.31
• Developed / Developable area includes super built-up area (SBA) / saleable area to the customer plus common area, car parking area, service area, storage area, internal roads and common amenities.
23.84
11.01
3.91
1.08
1.00
0.59
0.47
16.15
6.56
3.20
0.72
0.69
0.42
0.37
- 5.00 10.00 15.00 20.00 25.00
Bangalore
Gurgaon
Cochin
Calicut
Chennai
Thrissur
Coimbatore
Saleable Area Developable area

REAL ESTATE –STATUS OF RERA REGISTRATION
Slide no : 21(1 Square Meter = 10.764 Square Feet)
LocationsNo of projects
applied for RERA
No of projects received approval
from RERA
Bangalore 42 39
Chennai 2 2
Gurgaon 2 2
Pune 1 1
TOTAL 47 44
• 44 ongoing projects measuring total saleable area of 10.57 million sqft registered and received approval under RERA.
• In addition to above, 3 projects, consist of 2 Blocks in Sobha Arena and 1 wing in Sobha Dream Acres project –Registered under RERA and awaiting for approvals, which are yet to released for sale.
Future Launches :
• Company is planning to launch 6 - 8 new projects in Bangalore, Mysore, Thrissur, Cochin & Ahmedabad in coming quarters.

CONTRACTS – PROJECTS BREAK-UP
# LOCATION≈ Built-up
area (Mn.Sft)
1 Trivandrum 2.99
2 Bangalore 0.91
3 Mysore 0.83
4 Hyderabad 0.65
5 Indore 0.35
6 Gurgaon (NCR) 0.25
7 Bhubaneshwar 0.23
8 Chennai 0.14
TOTAL 6.35
� The scope of contractual orders varies from Civil, Finishes, Electrical, PHEworks, Interiors to Glazing.
Contractual projects status as on 31st March,18
Slide no : 22(1 Square Meter = 10.764 Square Feet)
• Other Corporate Clients include LuLu, Biocon, Syngene, Dell, HP, Timken, Taj, Bayer Material Science, HCL, Bharat Forge, ITC, Bosch, GMR, Huawei Technologies, Hotel Leela Ventures, Wonderla Holidays, Manipal Group etc
Bosch, Bangalore Infosys - Mysore Manipal Hostels, Bangalore Biocon, BangaloreNRN Holdings - Bangalore
Completed :
� Total completed ≈47.51 mn.sqft of area for various Clients in 26 cities
across India.
� Executed over 35 mn sqft of area for single / major client -‘Infosys’.
Under Progress:
� Currently executing ≈6.35 mn.sqft of area in 8 cities across India for
various clients.
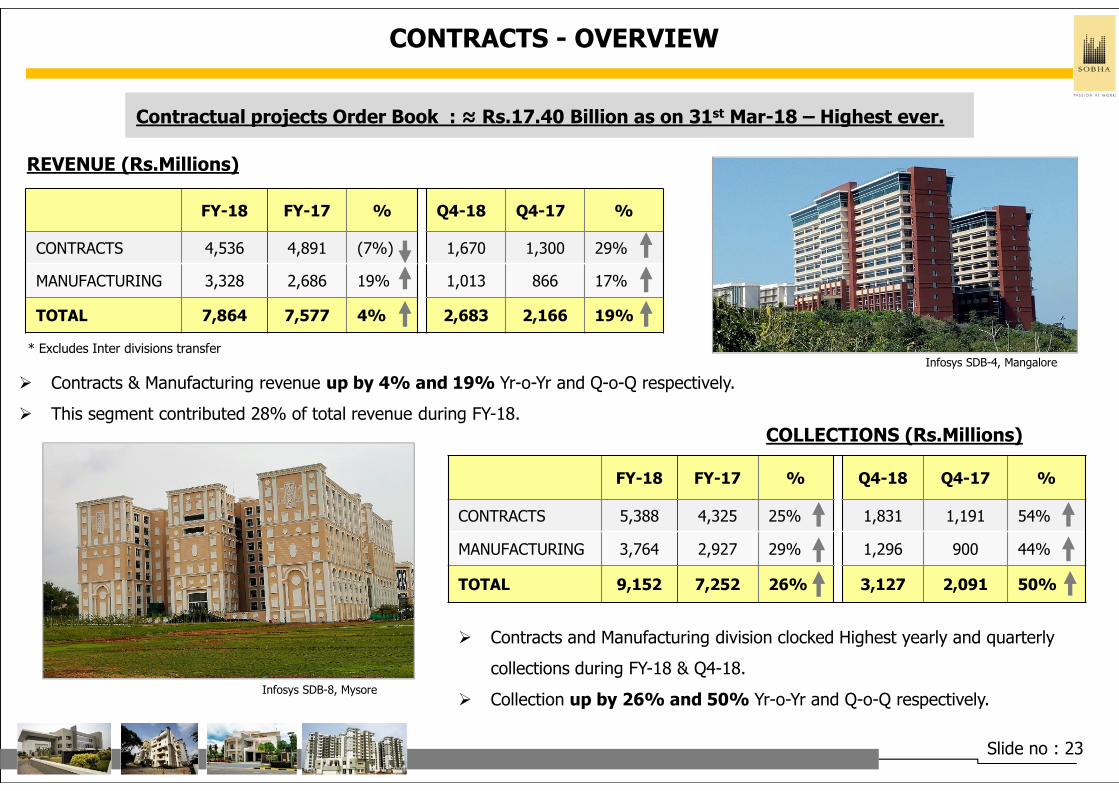
CONTRACTS - OVERVIEW
Slide no : 23
FY-18 FY-17 % Q4-18 Q4-17 %
CONTRACTS 4,536 4,891 (7%) 1,670 1,300 29%
MANUFACTURING 3,328 2,686 19% 1,013 866 17%
TOTAL 7,864 7,577 4% 2,683 2,166 19%
REVENUE (Rs.Millions)
COLLECTIONS (Rs.Millions)
* Excludes Inter divisions transfer
� Contracts & Manufacturing revenue up by 4% and 19% Yr-o-Yr and Q-o-Q respectively.
� This segment contributed 28% of total revenue during FY-18.
FY-18 FY-17 % Q4-18 Q4-17 %
CONTRACTS 5,388 4,325 25% 1,831 1,191 54%
MANUFACTURING 3,764 2,927 29% 1,296 900 44%
TOTAL 9,152 7,252 26% 3,127 2,091 50%
Contractual projects Order Book : ≈ Rs.17.40 Billion as on 31st Mar-18 – Highest ever.
� Contracts and Manufacturing division clocked Highest yearly and quarterly
collections during FY-18 & Q4-18.
� Collection up by 26% and 50% Yr-o-Yr and Q-o-Q respectively.
Infosys SDB-4, Mangalore
Infosys SDB-8, Mysore
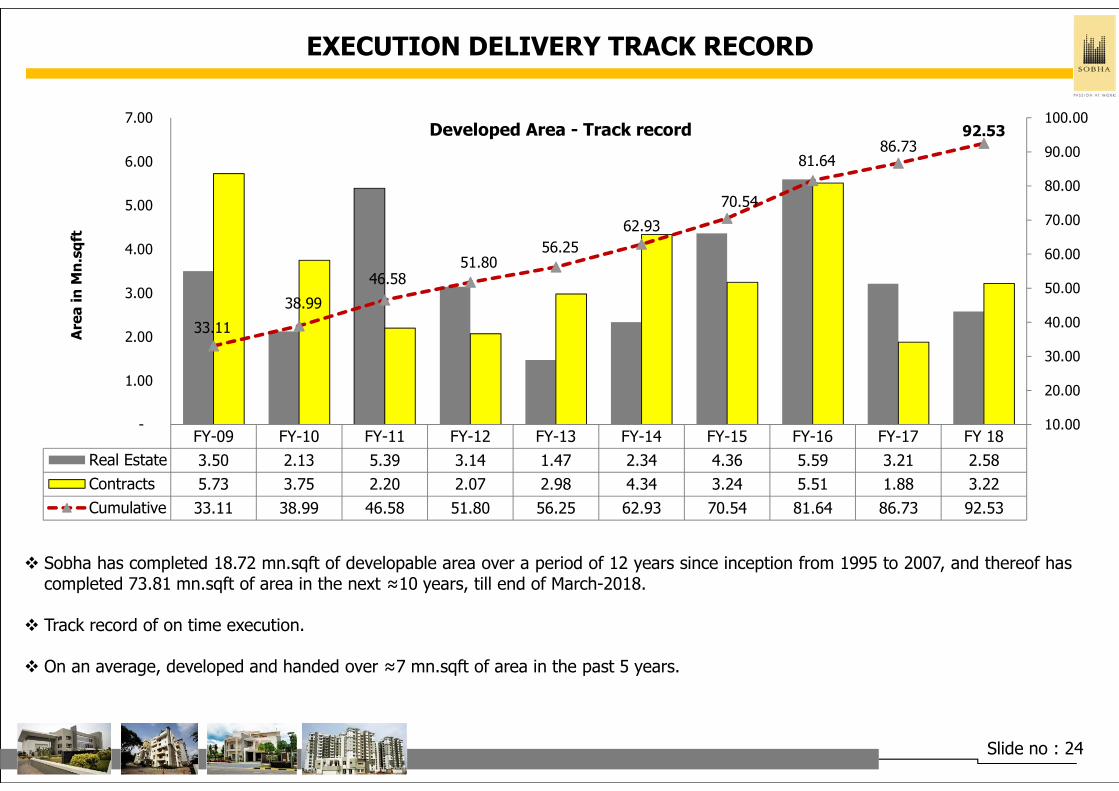
EXECUTION DELIVERY TRACK RECORD
� Sobha has completed 18.72 mn.sqft of developable area over a period of 12 years since inception from 1995 to 2007, and thereof hascompleted 73.81 mn.sqft of area in the next ≈10 years, till end of March-2018.
� Track record of on time execution.
� On an average, developed and handed over ≈7 mn.sqft of area in the past 5 years.
Slide no : 24
FY-09 FY-10 FY-11 FY-12 FY-13 FY-14 FY-15 FY-16 FY-17 FY 18
Real Estate 3.50 2.13 5.39 3.14 1.47 2.34 4.36 5.59 3.21 2.58
Contracts 5.73 3.75 2.20 2.07 2.98 4.34 3.24 5.51 1.88 3.22
Cumulative 33.11 38.99 46.58 51.80 56.25 62.93 70.54 81.64 86.73 92.53
33.11
38.99
46.58 51.80
56.25
62.93
70.54
81.64 86.73
92.53
10.00
20.00
30.00
40.00
50.00
60.00
70.00
80.00
90.00
100.00
-
1.00
2.00
3.00
4.00
5.00
6.00
7.00
Are
a i
n M
n.s
qft
Developed Area - Track record

BACKWARD INTEGRATION (World Class Manufacturing Facilities)
Glazing & Metal Works Division Interiors & Furnishing Division Concrete Products Division
Turnover *: FY-18 Rs.1,964 Mns Turnover* : FY-18 Rs.1,012 Mns Turnover *: FY-18 Rs.352 Mns
Factory area 0.30 Mn Sq ft Factory area 0.80 Mn sq ft Factory area 0.40 Mn sq ft
PRODUCTS
• Metal / Steel fabrication works
• Aluminum doors and windows, structure
• Glass works
PRODUCTS
• Manufacturing wood based productssuch as doors, windows, paneling,cabinets, cupboards & loose furniture.
• Manufacture of Economy, Deluxe, SuperDeluxe & Premium Mattresses fromFurnishing division
PRODUCTS
• Manufacture of wide range of concreteproducts such as concrete blocks,pavers, kerbstones, water drainagechannels, paving slabs and elitelandscape products
• Glass Fiber Reinforced Concrete(GFRC) products.
Slide no : 25
Note: * All divisions turnover represents net revenue excluding inter division sales and GST.
� SOBHA – Only Real Estate Company in India with Backward Integration model.
� It supports company to achieve world class quality with timely and efficient delivery.
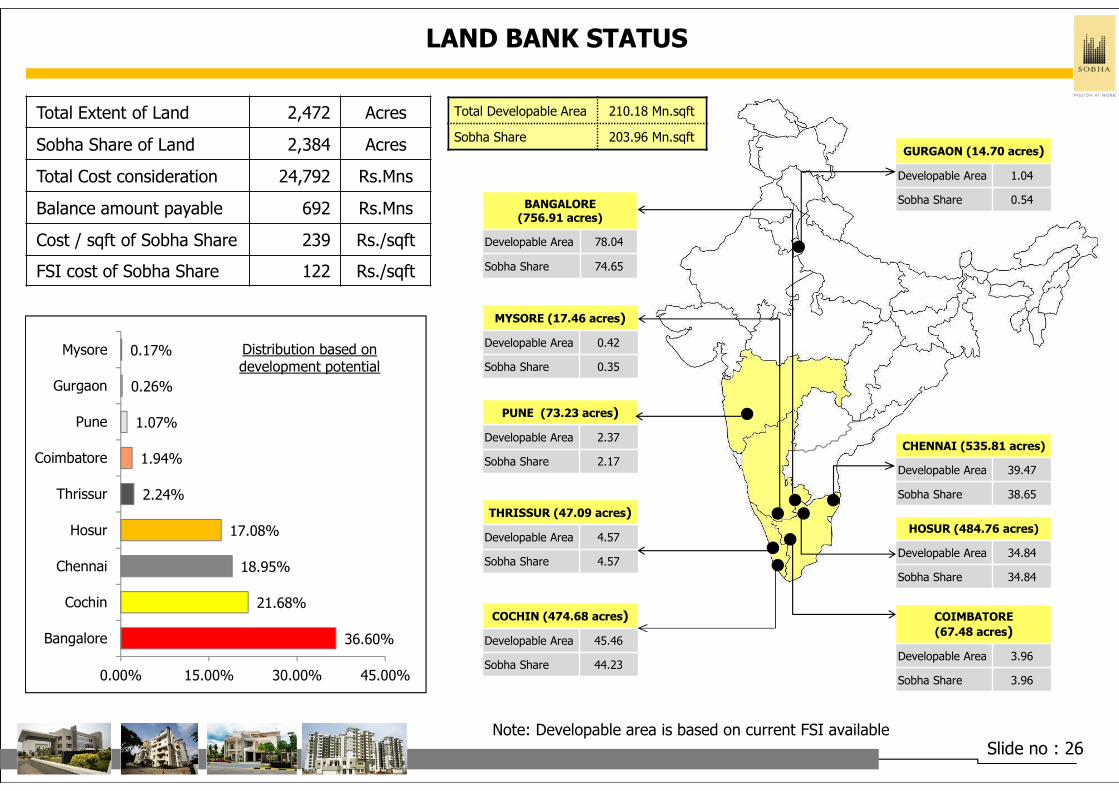
LAND BANK STATUS
BANGALORE (756.91 acres)
Developable Area 78.04
Sobha Share 74.65
PUNE (73.23 acres)
Developable Area 2.37
Sobha Share 2.17
MYSORE (17.46 acres)
Developable Area 0.42
Sobha Share 0.35
THRISSUR (47.09 acres)
Developable Area 4.57
Sobha Share 4.57
COCHIN (474.68 acres)
Developable Area 45.46
Sobha Share 44.23
COIMBATORE
(67.48 acres)
Developable Area 3.96
Sobha Share 3.96
HOSUR (484.76 acres)
Developable Area 34.84
Sobha Share 34.84
CHENNAI (535.81 acres)
Developable Area 39.47
Sobha Share 38.65
Total Extent of Land 2,472 Acres
Sobha Share of Land 2,384 Acres
Total Cost consideration 24,792 Rs.Mns
Balance amount payable 692 Rs.Mns
Cost / sqft of Sobha Share 239 Rs./sqft
FSI cost of Sobha Share 122 Rs./sqft
Total Developable Area 210.18 Mn.sqft
Sobha Share 203.96 Mn.sqftGURGAON (14.70 acres)
Developable Area 1.04
Sobha Share 0.54
Slide no : 26Note: Developable area is based on current FSI available
36.60%
21.68%
18.95%
17.08%
2.24%
1.94%
1.07%
0.26%
0.17%
0.00% 15.00% 30.00% 45.00%
Bangalore
Cochin
Chennai
Hosur
Thrissur
Coimbatore
Pune
Gurgaon
Mysore Distribution based on development potential
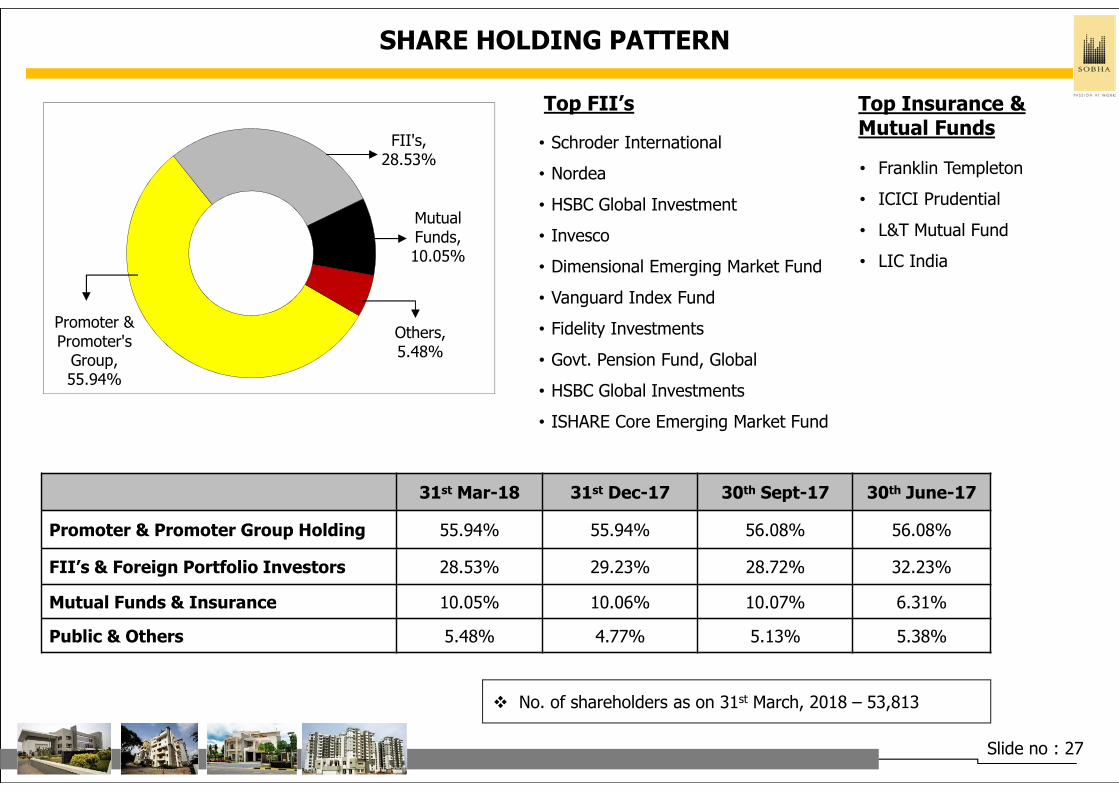
SHARE HOLDING PATTERN
31st Mar-18 31st Dec-17 30th Sept-17 30th June-17
Promoter & Promoter Group Holding 55.94% 55.94% 56.08% 56.08%
FII’s & Foreign Portfolio Investors 28.53% 29.23% 28.72% 32.23%
Mutual Funds & Insurance 10.05% 10.06% 10.07% 6.31%
Public & Others 5.48% 4.77% 5.13% 5.38%
� No. of shareholders as on 31st March, 2018 – 53,813
Slide no : 27
Top FII’s
• Schroder International
• Nordea
• HSBC Global Investment
• Invesco
• Dimensional Emerging Market Fund
• Vanguard Index Fund
• Fidelity Investments
• Govt. Pension Fund, Global
• HSBC Global Investments
• ISHARE Core Emerging Market Fund
Top Insurance & Mutual Funds
• Franklin Templeton
• ICICI Prudential
• L&T Mutual Fund
• LIC India
Promoter & Promoter's
Group, 55.94%
FII's, 28.53%
Mutual Funds, 10.05%
Others, 5.48%

SOBHA – STOCK PERFORMANCE
No. of Shares 94.85 Million
Market Capitalization Rs.48.18 Billion
Stock Price : 52 week High / Low Rs.627 / Rs.290
Avg. Daily volume (12 months) 444,253
Status as on: 31st March,18
Source : NSE, BSE
• CLSA India • IIFL (India Info Line) • ICICI Direct
• Morgan Stanley • Macquarie Capital • ICICI Securities
• Kotak Securities • B & K Securities • Spark Capital
• SBIcap Securities • HSBC Securities • Emkay Global
• J P Morgan • JM Financials • Anand Rathi
• Axis Capital • Elara Capital • BNP Paribas …
Key Research Houses covering the stock…
Slide no : 28
-20
0
20
40
60
80
100
120
140
Mar-17 Mar-17 May-17 May-17 Jun-17 Jul-17 Aug-17 Sep-17 Oct-17 Nov-17 Dec-17 Jan-18 Feb-18 Mar-18
% C
hange in C
losi
ng P
rice
Sobha vs Nifty vs NSE Realty
Sobha Nifty NSE Realty
Detailed break-up as of 31st March,2018
• Consolidated Balance Sheet
• Profit and Loss Statement
• Cash Flow Statement
• Real Estate Ongoing Projects
Slide no : 29
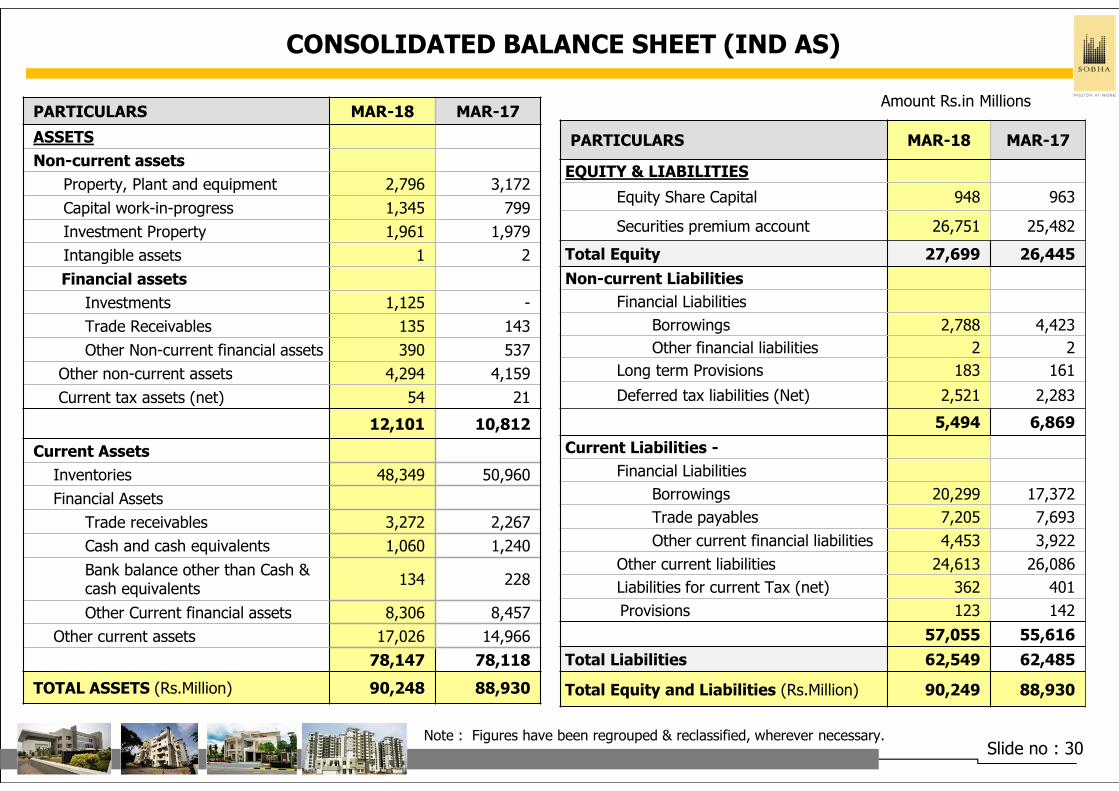
CONSOLIDATED BALANCE SHEET (IND AS)
Slide no : 30
PARTICULARS MAR-18 MAR-17
ASSETS
Non-current assets
Property, Plant and equipment 2,796 3,172
Capital work-in-progress 1,345 799
Investment Property 1,961 1,979
Intangible assets 1 2
Financial assets
Investments 1,125 -
Trade Receivables 135 143
Other Non-current financial assets 390 537
Other non-current assets 4,294 4,159
Current tax assets (net) 54 21
12,101 10,812
Current Assets
Inventories 48,349 50,960
Financial Assets
Trade receivables 3,272 2,267
Cash and cash equivalents 1,060 1,240
Bank balance other than Cash & cash equivalents
134 228
Other Current financial assets 8,306 8,457
Other current assets 17,026 14,966
78,147 78,118
TOTAL ASSETS (Rs.Million) 90,248 88,930
Note : Figures have been regrouped & reclassified, wherever necessary.
PARTICULARS MAR-18 MAR-17
EQUITY & LIABILITIES
Equity Share Capital 948 963
Securities premium account 26,751 25,482
Total Equity 27,699 26,445
Non-current Liabilities
Financial Liabilities
Borrowings 2,788 4,423
Other financial liabilities 2 2
Long term Provisions 183 161
Deferred tax liabilities (Net) 2,521 2,283
5,494 6,869
Current Liabilities -
Financial Liabilities
Borrowings 20,299 17,372
Trade payables 7,205 7,693
Other current financial liabilities 4,453 3,922
Other current liabilities 24,613 26,086
Liabilities for current Tax (net) 362 401
Provisions 123 142
57,055 55,616
Total Liabilities 62,549 62,485
Total Equity and Liabilities (Rs.Million) 90,249 88,930
Amount Rs.in Millions
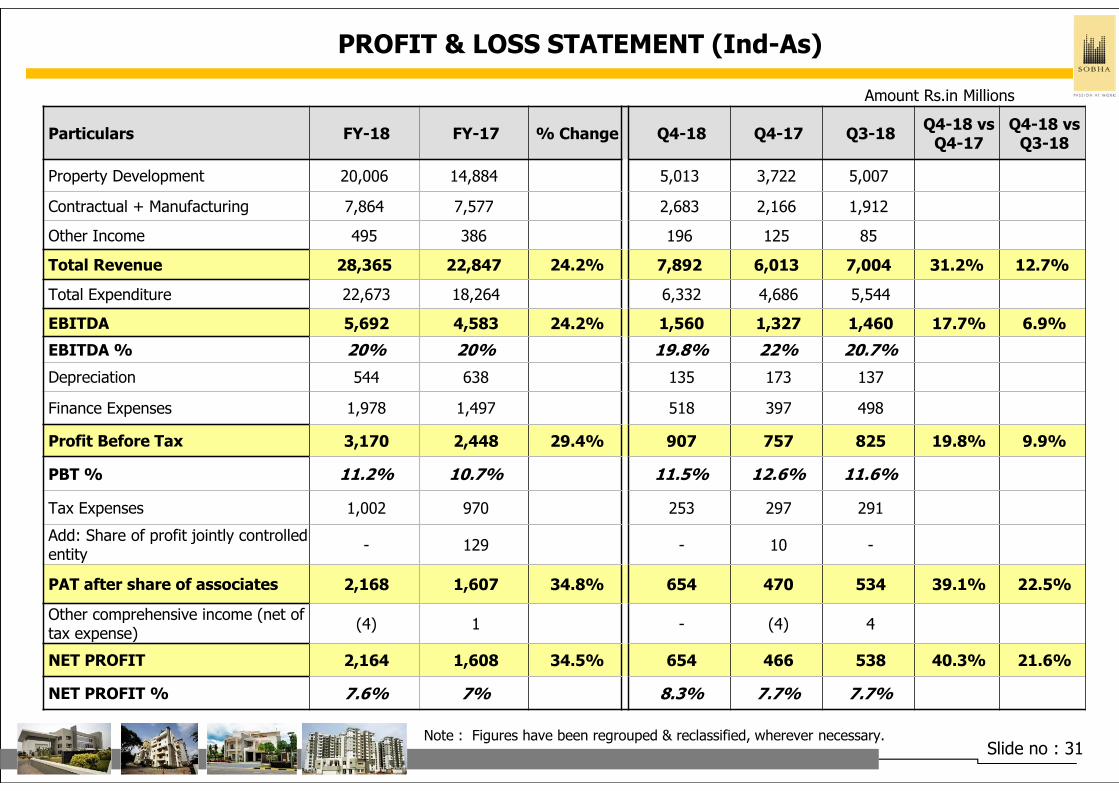
PROFIT & LOSS STATEMENT (Ind-As)
Note : Figures have been regrouped & reclassified, wherever necessary.Slide no : 31
Particulars FY-18 FY-17 % Change Q4-18 Q4-17 Q3-18Q4-18 vs
Q4-17Q4-18 vs
Q3-18
Property Development 20,006 14,884 5,013 3,722 5,007
Contractual + Manufacturing 7,864 7,577 2,683 2,166 1,912
Other Income 495 386 196 125 85
Total Revenue 28,365 22,847 24.2% 7,892 6,013 7,004 31.2% 12.7%
Total Expenditure 22,673 18,264 6,332 4,686 5,544
EBITDA 5,692 4,583 24.2% 1,560 1,327 1,460 17.7% 6.9%
EBITDA % 20% 20% 19.8% 22% 20.7%
Depreciation 544 638 135 173 137
Finance Expenses 1,978 1,497 518 397 498
Profit Before Tax 3,170 2,448 29.4% 907 757 825 19.8% 9.9%
PBT % 11.2% 10.7% 11.5% 12.6% 11.6%
Tax Expenses 1,002 970 253 297 291
Add: Share of profit jointly controlled entity
- 129 - 10 -
PAT after share of associates 2,168 1,607 34.8% 654 470 534 39.1% 22.5%
Other comprehensive income (net of tax expense)
(4) 1 - (4) 4
NET PROFIT 2,164 1,608 34.5% 654 466 538 40.3% 21.6%
NET PROFIT % 7.6% 7% 8.3% 7.7% 7.7%
Amount Rs.in Millions
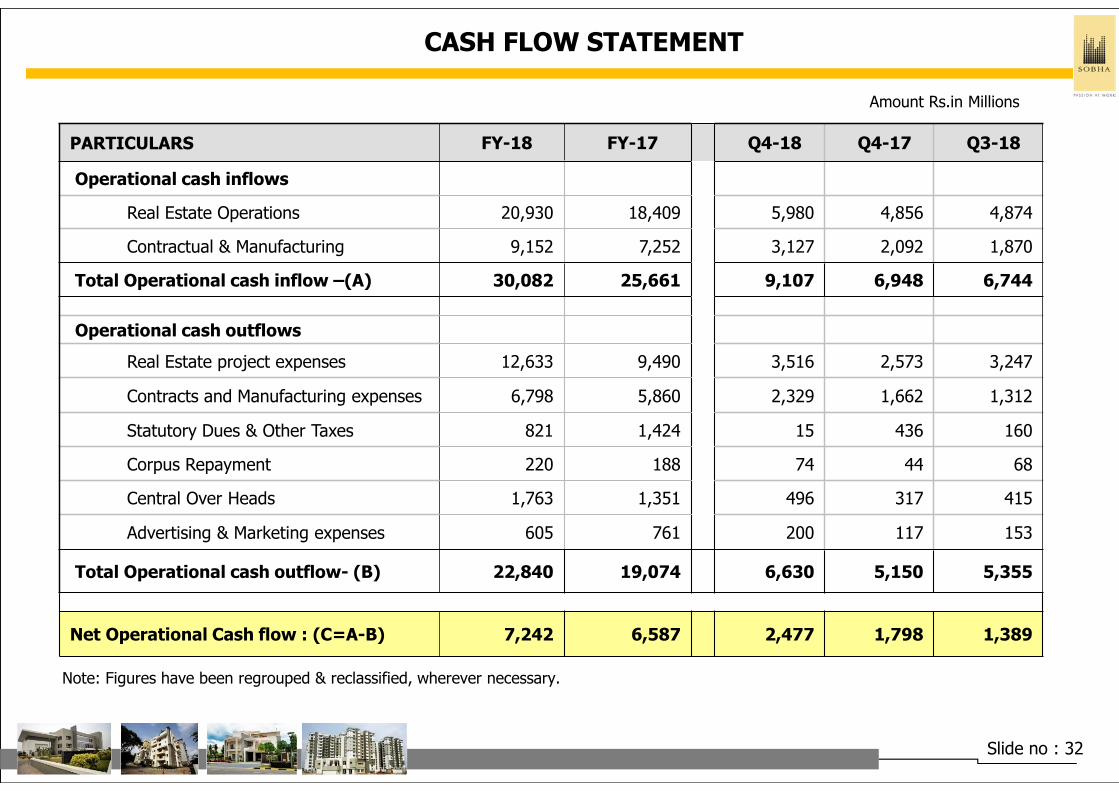
CASH FLOW STATEMENT
PARTICULARS FY-18 FY-17 Q4-18 Q4-17 Q3-18
Operational cash inflows
Real Estate Operations 20,930 18,409 5,980 4,856 4,874
Contractual & Manufacturing 9,152 7,252 3,127 2,092 1,870
Total Operational cash inflow –(A) 30,082 25,661 9,107 6,948 6,744
Operational cash outflows
Real Estate project expenses 12,633 9,490 3,516 2,573 3,247
Contracts and Manufacturing expenses 6,798 5,860 2,329 1,662 1,312
Statutory Dues & Other Taxes 821 1,424 15 436 160
Corpus Repayment 220 188 74 44 68
Central Over Heads 1,763 1,351 496 317 415
Advertising & Marketing expenses 605 761 200 117 153
Total Operational cash outflow- (B) 22,840 19,074 6,630 5,150 5,355
Net Operational Cash flow : (C=A-B) 7,242 6,587 2,477 1,798 1,389
Slide no : 32
Note: Figures have been regrouped & reclassified, wherever necessary.
Amount Rs.in Millions
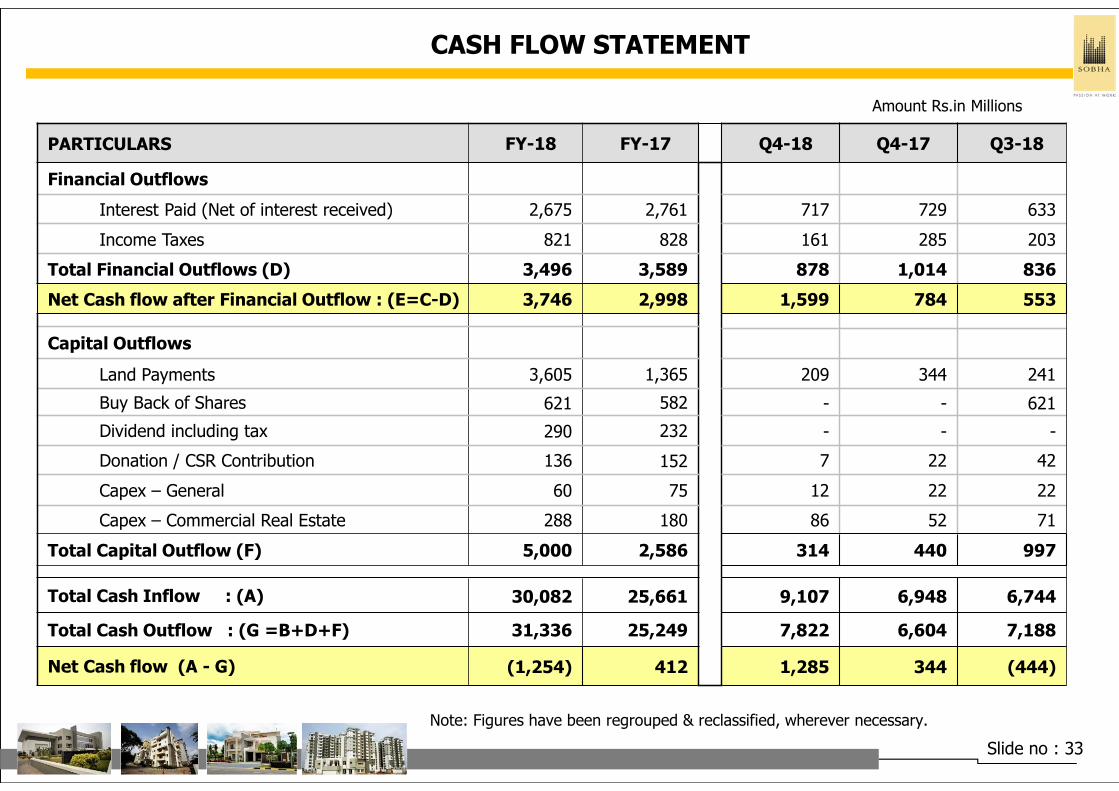
PARTICULARS FY-18 FY-17 Q4-18 Q4-17 Q3-18
Financial Outflows
Interest Paid (Net of interest received) 2,675 2,761 717 729 633
Income Taxes 821 828 161 285 203
Total Financial Outflows (D) 3,496 3,589 878 1,014 836
Net Cash flow after Financial Outflow : (E=C-D) 3,746 2,998 1,599 784 553
Capital Outflows
Land Payments 3,605 1,365 209 344 241
Buy Back of Shares 621 582 - - 621
Dividend including tax 290 232 - - -
Donation / CSR Contribution 136 152 7 22 42
Capex – General 60 75 12 22 22
Capex – Commercial Real Estate 288 180 86 52 71
Total Capital Outflow (F) 5,000 2,586 314 440 997
Total Cash Inflow : (A) 30,082 25,661 9,107 6,948 6,744
Total Cash Outflow : (G =B+D+F) 31,336 25,249 7,822 6,604 7,188
Net Cash flow (A - G) (1,254) 412 1,285 344 (444)
Slide no : 33
Note: Figures have been regrouped & reclassified, wherever necessary.
CASH FLOW STATEMENT
Amount Rs.in Millions

Real Estate – Details of Ongoing projects as on 31st March,2018
Slide no : 34
Area in Million Sq.feet
Sl.No Projects Location TypeTotal
Developable
Area
Total Saleable
Area
Sobha Share of Saleable
Area
I Projects completed & applied for Occupancy Certificate (RERA registration not applicable
1 Sobha Palladian HAL Road, Bangalore Apartments 0.64 0.47 0.47 2 Sobha City - Santorini 2 Thanisandra, Bangalore Apartments 0.51 0.39 0.39 3 Sobha City - Casa Paradiso 3 Thanisandra, Bangalore Apartments 0.46 0.38 0.38 4 Sobha Forest View- Alder Kanakapura Road, Bangalore Apartments 0.35 0.28 0.28
5Sobha Dream Acres - Rain Forest (Wing 9,10,12 & 14)
Balagere, Bangalore Apartments 0.72 0.53 0.53
2.68 2.05 2.05
II Ongoing Projects - RERA registration are exempted as per rule.
1 Sobha Lifestyle Legacy (Ph 2) Devanahalli, Bangalore Villas 0.97 0.49 0.37 2 Sobha West Hill - Part C Veerakeralam, Coimbatore Villas 0.05 0.03 0.03 3 élan (JD with LMW)* Ganapathy, Coimbatore Apartments 0.42 0.34 0.34 4 International City - Ph 1 (B & B3) Babupur, Gurgaon Duple Villas 0.08 0.08 0.055 International City - Phase 2 (E) Babupur, Gurgaon Villas & Duple Villas 1.78 1.14 0.73 6 International City - Phase 2 Babupur, Gurgaon Row Houses 0.06 0.04 0.03 7 International City - Phase 3 (Part) Babupur, Gurgaon Row Houses 0.69 0.45 0.28 8 St.Mark's Road Property St.Mark's Road Commercial 0.38 0.20 (For lease)
4.44 2.76 1.83
III Ongoing Projects - RERA rules not yet notified
1 Sobha Bela Encosta Palazhi, Kozhikode Villas 0.43 0.21 0.21 2 Sobha Rio Vista Feroke, Kozhikode Apartments 0.64 0.51 0.51 3 Sobha Lake Edge Sobha City @ Thrissur Apartments 0.29 0.24 0.24 4 Marina One - Block 2,3,4 & 12 Marine Drive, Cochin Apartments 1.49 1.22 1.225 Sobha Silver Estate Pottore, Thrissur Villas 0.31 0.18 0.18
3.16 2.37 2.37
IV Ongoing Projects - Registered under RERA
1 Sobha City - Casa Paradiso 4 Thanisandra, Bangalore Apartments 0.46 0.38 0.38 2 Sobha Indraprastha Central Bangalore Apartments 2.38 0.84 0.84 3 Sobha Silicon Oasis - Apts (Blk 1-11) Hosa Road, Bangalore Apartments 1.99 1.42 1.42 4 Sobha Silicon Oasis- Row Houses Hosa Road,Bangalore Row Houses 0.05 0.05 0.05 5 Sobha Valley View (Phase 1) Banashankari Extn,Bangalore Apartments 0.73 0.48 0.486 Sobha Avenue Whitefield, Bangalore Apartments 0.40 0.29 0.29

Real Estate – Details of Ongoing projects as on 31st March, 2018
Slide no : 35
Area in Million Sq.feet
Sl.No Projects Location TypeTotal
Developable Area
Total Saleable
Area
Sobha Share of Saleable
Area
7 Sobha Arena - The Park Kanakapura Road, Bangalore Apartments 0.32 0.22 0.22
8 Sobha Arena - The Plaza Kanakapura Road, Bangalore Apartments 0.32 0.22 0.22
9 Sobha Morzaria Grandeur-2 Diary Circle, Bangalore Apartments 0.10 0.08 0.08
10 Sobha Dream Acres - Rain Forest Balagere, Off ORR, Bangalore Apartments 1.55 1.16 1.16
11 Sobha Dream Acres - Tropical Greens Balagere, Off ORR, Bangalore Apartments 1.33 1.00 1.00
12 Sobha Dream Acres : Palm Springs Balagere, Off ORR, Bangalore Apartments 0.80 0.59 0.59
13 Sobha Clovelly Padmanabha Nagar, Bangalore Apartments 0.53 0.33 0.33 14 Sobha 25 Richmond Longford Town, Bangalore Apartments 0.02 0.02 0.01 15 Sobha Palm Court Kogilu Cross, Bangalore Apartments 0.71 0.51 0.42 16 Sobha HRC Pristine - Block 1,2 & 3 Jakkur, Bangalore Apartments 1.28 0.76 0.7617 Sobha HRC Pristine - Block 4 & 5 Jakkur, Bangalore Row Houses 0.04 0.04 0.04 18 Sobha Forest Edge Kanakapura Road, Bangalore Apartments 0.60 0.45 0.4519 Sobha City - Tower A1,B1,C1 Babupur, Gurgaon Apartments 0.58 0.46 0.46 20 Sobha City - Tower A2,B2,C2 Babupur, Gurgaon Apartments 0.58 0.46 0.46 21 Sobha Winchester Kovilampakkam, Chennai Apartments 0.70 0.51 0.37 22 Sobha Gardenia Vengai Vasal, Chennai Villas 0.30 0.19 0.12
15.77 10.45 10.16
V Ongoing Projects - Registered under RERA -Yet to be released for sale :
1 Sobha Arena - The Square (Block 4) Kanakapura Road, Bangalore Apartments 0.47 0.32 0.322 Sobha Arena - Pebble Court (Block 1) Kanakapura Road, Bangalore Apartments 0.38 0.26 0.263 SDA - Tropical Greens (Wing 19,20) Balagere, Off ORR, Bangalore Apartments 0.30 0.22 0.22
1.14 0.80 0.80
VI Projects received Plan approvals -- Not released for sale - Yet to be registered under RERA:
1 Sobha Dream Acres - Unreleased Balagere, Off ORR, Bangalore Apartments 5.06 3.77 3.772 International City - Residential (Ph 3 & 4) Babupur, Gurgaon Villas & Row Houses 3.82 1.16 0.743 International City - Commercial Babupur, Gurgaon Commercial Space 0.46 0.46 0.29 4 Sobha City - Unreleased Towers Babupur, Gurgaon Apartments 2.95 2.32 2.32 5 Marina One (Unreleased) Marine Drive, Cochin Apartments 2.42 1.98 1.98
14.71 9.70 9.11
GRAND TOTAL 41.90 28.13 26.31
* Developable area includes super built-up area (SBA) / saleable area to the customer plus common area, car parking area, service area, storage area, internal roads and common amenities.

AWARDS & RECOGNITIONS
Slide no : 36(1 Square Meter = 10.764 Square Feet)
• Declared as the ‘Top brand of Indian real estate sector‘ for the 3rd
consecutive year by the Brand X Report 2016-17, an annual study
conducted by Track2Realty.– The first hat-trick of brand leadership by any real
estate player in India so far.
• Won the CREDAI Awards for Real Estate (CARE) 2017 in the category ‘Best CSR
Activity’’ by CREDAI Karnataka.
• Voted as Number 1 choice of homebuyers nationally in Track2Realty’s
Consumer Confidence Report 20:20 - This is the 4th consecutive year that
SOBHA has won top rank in consumer confidence survey, making it an
exceptional and a rare feat achieved by any real estate brand in the country.
• Recognised with ‘The Most Trusted Real Estate Brand’ in South Zone at the
12th CNBC AWAAZ Real Estate Award 2017-18.
• Conferred with three prestigious awards at the 10th Construction Industry
Development Council (CIDC) Vishwakarma Awards 2018 - ‘Best Professionally
Managed Company’ (Turnover > INR 1000 crore; ‘Achievement Award for
Social Development & Impact’ and ‘Best Construction Projects’ for SOBHA
Sapphire, Thrissur, Kerala.

THANK YOU
Sobha Limited.‘SOBHA’, Sarjapur-Marathahalli Outer Ring Road(ORR),Devarabisanahalli, Bellandur Post,Bangalore-560103Phone: +91-80- 49320000, Fax: +91-80- 49320444Web : www.sobha.com
K.Bala MuruganSenior Manager – Investor RelationsMobile: +91- 98807 30459Email: [email protected]
Corporate Office Investors Contact :
Sobha Corporate Office - Bangalore Sobha Aspire & Elite- Bangalore Sobha Turquoise - Coimbatore Sobha Lifestyle - Bangalore
Mr.Subhash Mohan BhatChief Financial OfficerMobile: +91- 99801 99088Email: [email protected]
Disclaimer:The information in this presentation contains certain forward-looking statements and publically available data from various recourses such as research reports,publications etc.. These include statements regarding outlook on future development schedules, business plans and expectations of Capital expenditure. Thesestatements are based on current expectations that involve a number of risks and uncertainties which could cause actual results to differ from projections made by thecompany.