Embed Size (px)
Citation preview
Bayesian Networks
making our factored joint probabilities so much more graphical
Five Tribes of Machine Learning
“The Master Algorithm” by Pedro Domingos
● inductive reasoning (classical, symbolic AI)● connectionism (neural networks, deep learning, discriminative machine
learning algorithms are kind of in this camp)● evolutionary computation● Bayes' theorem● analogical modelling (kind of like connectionism, k-nearest neighbor-ish)
Machine Learning!!!!!!!!
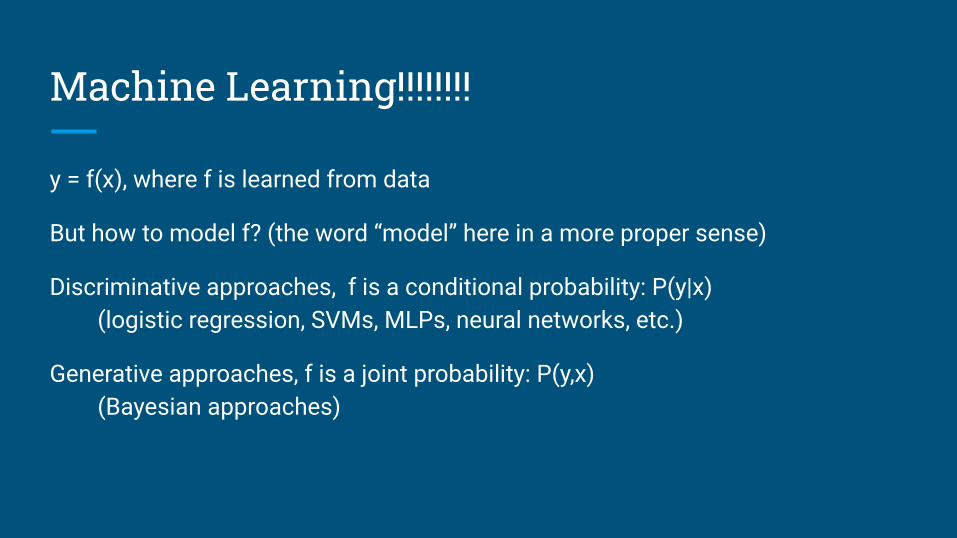
y = f(x), where f is learned from data
But how to model f? (the word “model” here in a more proper sense)
Discriminative approaches, f is a conditional probability: P(y|x)(logistic regression, SVMs, MLPs, neural networks, etc.)
Generative approaches, f is a joint probability: P(y,x)(Bayesian approaches)

Machine Learning using Joint Probability Functions

Starting point: the joint distribution
● You are familiar with the joint distribution.
Problems with Joint Probabilities
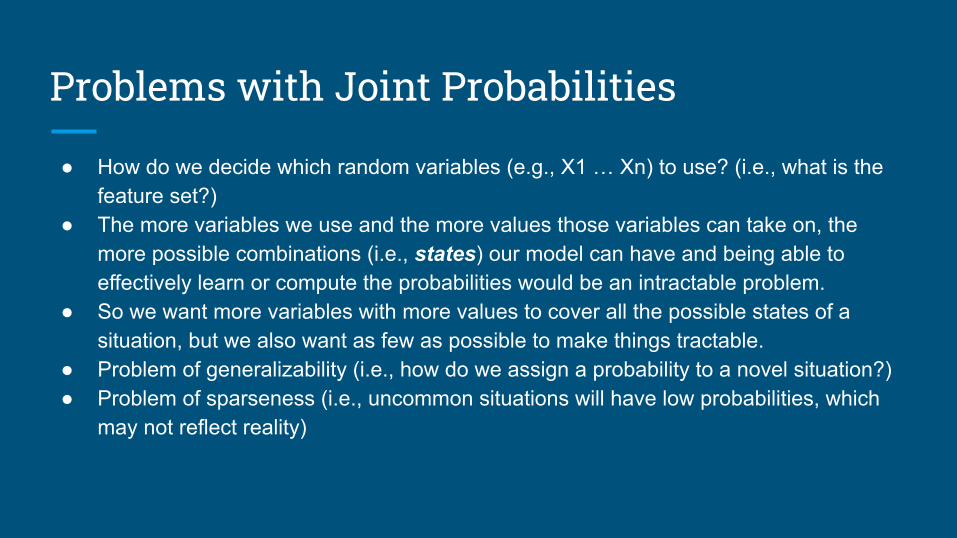
● How do we decide which random variables (e.g., X1 … Xn) to use? (i.e., what is the feature set?)
● The more variables we use and the more values those variables can take on, the more possible combinations (i.e., states) our model can have and being able to effectively learn or compute the probabilities would be an intractable problem.
● So we want more variables with more values to cover all the possible states of a situation, but we also want as few as possible to make things tractable.
● Problem of generalizability (i.e., how do we assign a probability to a novel situation?)● Problem of sparseness (i.e., uncommon situations will have low probabilities, which
may not reflect reality)

Example: Language Modeling● Goal: write a function (i.e. model) the probability of a sentence.
● We can easily model the probability of a sentence as the joint probability of all the words of a sentence. Then we can just count up all the words in all the sentences, right?
○ Anyone see the problem here? (we’ve discussed this before)○ Can this possibly consider all possible sentences that could occur? No. Any novel sentence
would have a probability of zero. ○ We’d have to write a different function for all sentence lengths.
● Remember, we are trying to handle uncertainty. Implicit in that goal is to be able to handle novel, un-before-seen situations/events.

Factoring Joint Probability Functions

Why should we factor joint prob functions?
● We need to break apart the joint probability distributions/functions/models into small, more manageable parts (hopefully without losing the informativeness of the full joint probability distribution)
● We have some useful equalities we can apply to help us factor….

Help with factoring: multiplication rule

Help with factoring: chain rule
Help with factoring: Markov assumption
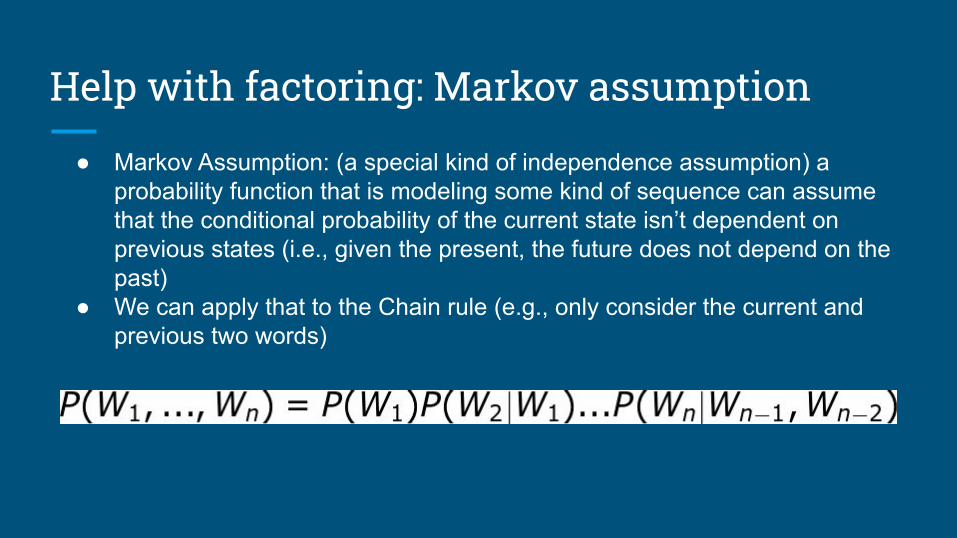
● Markov Assumption: (a special kind of independence assumption) a probability function that is modeling some kind of sequence can assume that the conditional probability of the current state isn’t dependent on previous states (i.e., given the present, the future does not depend on the past)
● We can apply that to the Chain rule (e.g., only consider the current and previous two words)

Help with factoring: Independence assumptions
● Independence assumptions: when two variables don’t actually care about each other.
Example: P(X,Y) = P(X)P(Y)

Hooray for factoring!
● Factoring solves some of our problems:○ We only have to write a few functions instead of one for each sentence length (for the
language model, we only need to write three)○ We can more accurately estimate the functions/distributions using data○ We don’t need to worry as much about sparseness or intractability
● This does not solve everything, however:○ Though it will be a more general model than the full joint probability distribution, there will still
be cases when we encounter novel words (or sequences) we didn’t consider when writing/training our functions.

So, how do I know how/when to factor?
● When can I use the chain rule?● When can I use the multiplication rule?● When can I apply independence assumptions?● When can I apply the Markov assumption?
Good questions.
This is where your human intuitions and domain expertise come into play.
Factored Joint Probabilities
● If we’re going to be factoring joint probabilities for the rest of our lives, it would be nice if we could represent them other than, you know, probability functions and equations. Not that those are bad.
● It would also be helpful if there were a way to show causal relationships between the various variables.
● Answer: graphical models!○ (some material for this lecture came from Kollar & Freidman, 2009)
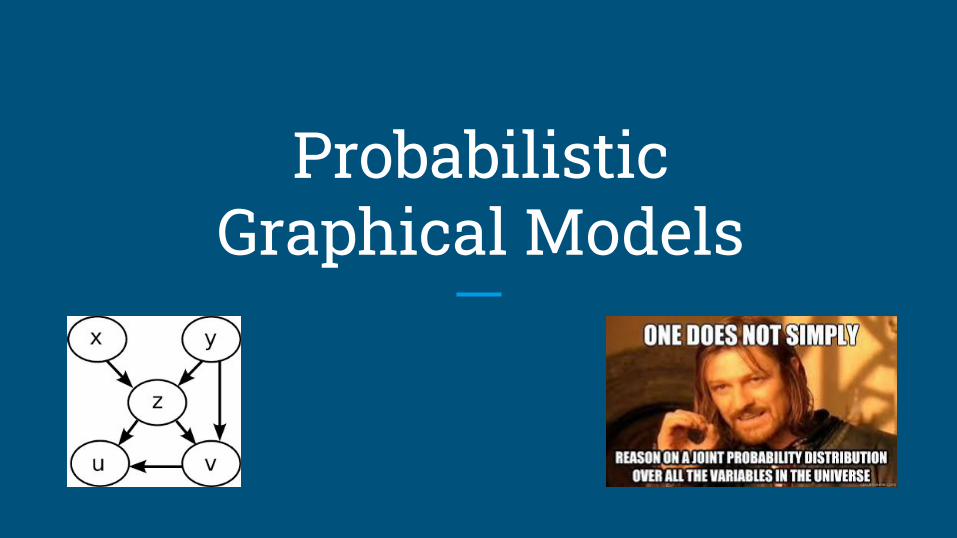
ProbabilisticGraphical Models
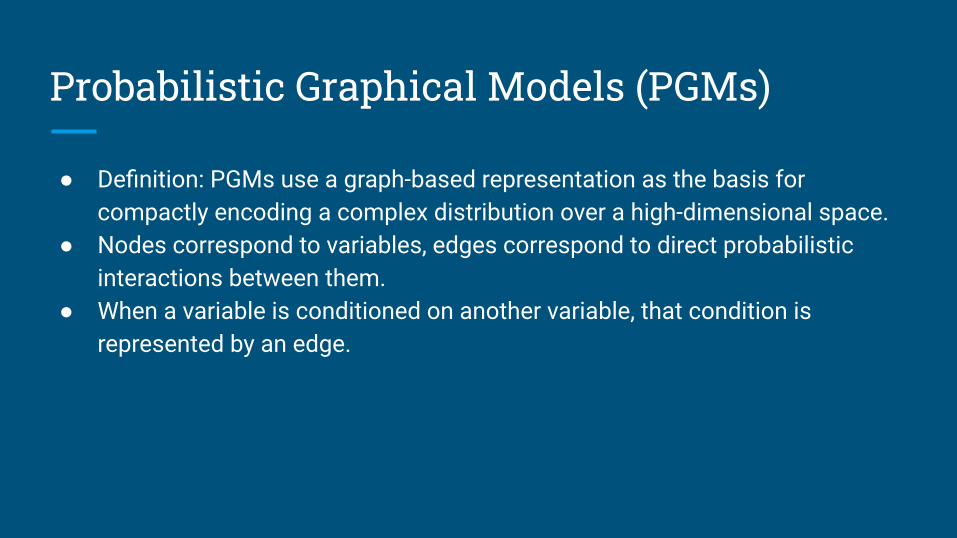
Probabilistic Graphical Models (PGMs)
● Definition: PGMs use a graph-based representation as the basis for compactly encoding a complex distribution over a high-dimensional space.
● Nodes correspond to variables, edges correspond to direct probabilistic interactions between them.
● When a variable is conditioned on another variable, that condition is represented by an edge.

PGM Example
S
F H
CM
H

PGM Examples
● What would the PGM be for a Naive Bayes’ Classifier?○ whiteboard
● What would the PGM be for an Ngram language model?○ whiteboard
● What would the PGM be for a full joint distribution with 4 variables?○ whiteboard

PGMs and Independence
● Can we tell what variables are independent from one another by looking at a PGM?
● Yes! We can tell, for example, that F is independentof H and M is independent of S (given F).
● In fact, it’s equivalent to say that the graph representation is a set of independencies and acts a skeleton for factorization.
S
F H
CM

PGM Advantages
● Compact, factored representation of an otherwise intractable joint distribution
● It’s interpretable in that anyone can look at the graph and reason about its meaning, implications, and properties
● It’s easy to see how variables reflect our domain knowledge (very important in NLP!)

But wait...
● Sure, we can represent a joint probability distribution as a PGM. But isn’t a PGM mostly a bunch of conditional probabilities? Conditional probabilities seem different than joint probabilities.
○ Yes.
● In fact, thanks to the conditional probabilities in the PGMS, we can do:○ Inference (i.e., answering queries using the distribution as our model world)○ Learning (we can start with some prior knowledge and use data to update our functions)○ When we use PGMs for these above to things, we are applying them as Bayesian Networks.

Bayesian Networks

Bayesian Networks (BNs)
● Directed PGMs, like we’ve seen in this lecture so far○ Directed Acyclic Graph (DAG) whose nodes are random variables in a domain and whose
edges correspond to influences between those variables
● BNs go a step further than just a factored joint probability distribution:○ Start with intuitive probability functions○ Use the conditional probabilities to reason and perform inference○ Update probability functions based on observed outcomes
● There is a lot more to BNs (e.g., I-Maps, D-Separation, etc.), but we’ll stick with this for now
● The way BNs are trained and applied is a bit different from what we’ve seen so far in this class.
Bayesian Statistics


Bayesian and Frequentist
● Frequentist statistics:○ An event's probability is the limit of its relative frequency in a large number of trials
● Bayesian statistics:○ Evidence about the true state of the world is expressed in terms of degrees of belief known
as Bayesian probabilities.○ The Bayesian interpretation of probability can be seen as an extension of propositional logic
that enables reasoning with hypotheses, i.e., the propositions whose truth or falsity is uncertain. In the Bayesian view, a probability is assigned to a hypothesis, whereas under frequentist inference, a hypothesis is typically tested without being assigned a probability.

Bayesian Statistics
● Looking at a PGM/BN, we see a lot of conditional probabilities (e.g., P(A|B)). For every conditional probability, we can apply Bayes’ Rule:
● Think of applying Bayes’ rule as another factorization to help us with the learning.
Bayesian Statistics
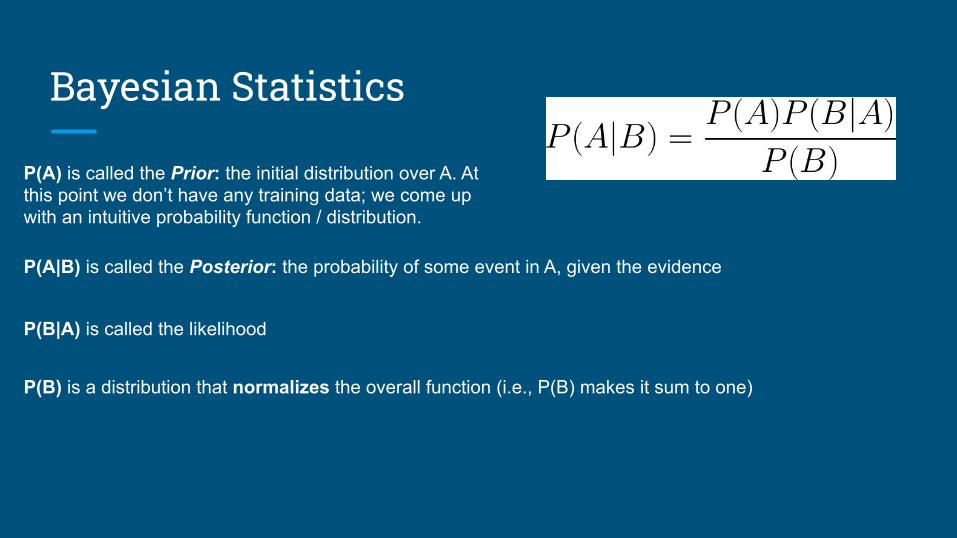
P(A) is called the Prior: the initial distribution over A. At this point we don’t have any training data; we come up with an intuitive probability function / distribution.
P(A|B) is called the Posterior: the probability of some event in A, given the evidence
P(B|A) is called the likelihood
P(B) is a distribution that normalizes the overall function (i.e., P(B) makes it sum to one)

Bayesian Learning (Training)
● Instead of just counting up a conditional probability, we instead convert it using Bayes’ Rule to the prior/likelihood/normalizer then we sort of make up the prior, count up things for the likelihood and normalizer, then use that.
○ Why does that make sense?● It doesn’t make as much intuitive sense as the frequentist approach we’ve been taking so far. But
there is one very important reason why it might be useful:○ Data.
● Suppose you need to write/train a probability function for your company. You figure out the variables (i.e., features!), you come up with a factorization (which is mostly made up of conditional probabilities), then you go to write the functions.
○ Problem: you have no training data to learn the functions. ● Now what? You can write the functions with your own intuitions (or using a very small amount of
training data), then you adjust the functions over time. ○ This is can only really work with a Bayesian approach○ This is called Bayesian updating.

Example: Naive Bayes
Predict spam using Naive Bayes
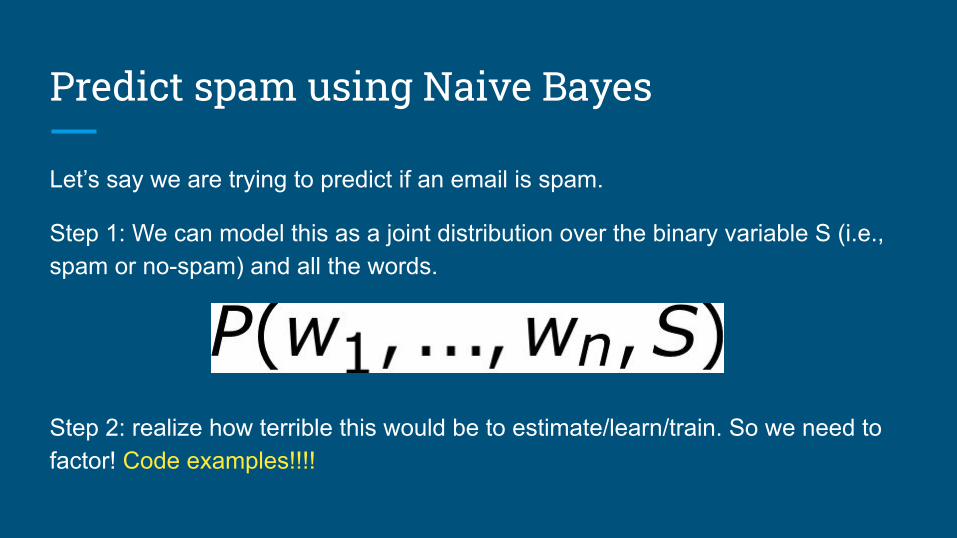
Let’s say we are trying to predict if an email is spam.
Step 1: We can model this as a joint distribution over the binary variable S (i.e., spam or no-spam) and all the words.
Step 2: realize how terrible this would be to estimate/learn/train. So we need to factor! Code examples!!!!

Naive Bayes
Why is it called “Naive” ?
(hint: it has something to dowith all of the independenceassumptions)