Embed Size (px)
Citation preview
So Many Choices: Choosing the Right Business Intelligence Reporting Tool for Your Organization Barry Markovic IT Convergence Melissa English IT Convergence In today’s IT world, there are so many choices to make. What is the right software for our business? What database will best support the company infrastructure? How will we store and maintain the data files? And finally, which reporting tool will give us the flexibility and information we need? Trying to make the right decisions can boggle the mind. In this paper, we discuss the pros and cons of some of the choices that are the most integrated with your Oracle Application reporting needs. Evaluating those pros and cons with respect to your organization’s requirements will help you choose the right business intelligence reporting tool for your organization. While there are certainly technical issues involved in selecting and implementing any piece of software, this paper will focus on the functionality of each tool with respect to easily providing useful information. Oracle has supplied several very integrated and focused reporting tools aimed at a specific reporting area such as Financial Statement Generator (FSG), Oracle Financial Analyzer (OFA), and Oracle Sales Analyzer (OSA). Our experience is that FSG is the most widely used of the single reporting area tools. Because of its inherent design to create reports in the accepted Financial Statement Format, FSG is still a good choice for this type of reporting. If a specific financial statement format is not required, we recommend using the other reporting tools covered late in this paper for several reasons. First, FSG, OFA and OSA do not easily allow the integration of data from a variety of the Oracle Applications. Ad Hoc reporting is not a strong point for these tools. Second, they are harder to integrate into the latest information delivery tools such as dashboards. Third, if an organization is using FSG, OFA and/or OSA, it will probably need a more flexible reporting tool which would require maintaining multiple reporting tool environments. This would require more hardware, technical resources, user training, etc. For more flexible reporting tools that can be used across Oracle Application Modules, we will review and compare:
1. Oracle Business Intelligence Discoverer 2. Oracle Business Intelligence Applications 3. Noetix Reporting Tools
Overview To some extent, each of these three reporting tools provides similar capabilities from an end user perspective. Canned reports can be scheduled and readily available in various summary or detail formats. A variety of visual displays is also available such as graphs, exception reporting, benchmarking, etc. They can be delivered via traditional paper reports, web display, Excel, and automatically e-mailed. All three tools can provide robust business intelligence reporting in an Oracle Applications environment. Of course, each tool does have pros and cons. Below is a summary of some key features. This summary is based on what we feel is a key strength of the product. With some additional effort, some of the features not checked could be made available.
Copyright ©2008 by John Barry Markovic and Melissa English
Reporting Tool Canned Reports AD Hoc
Reporting Real Time Reporting
Dashboards
BI Discoverer BI Applications Noetix Reporting Tools
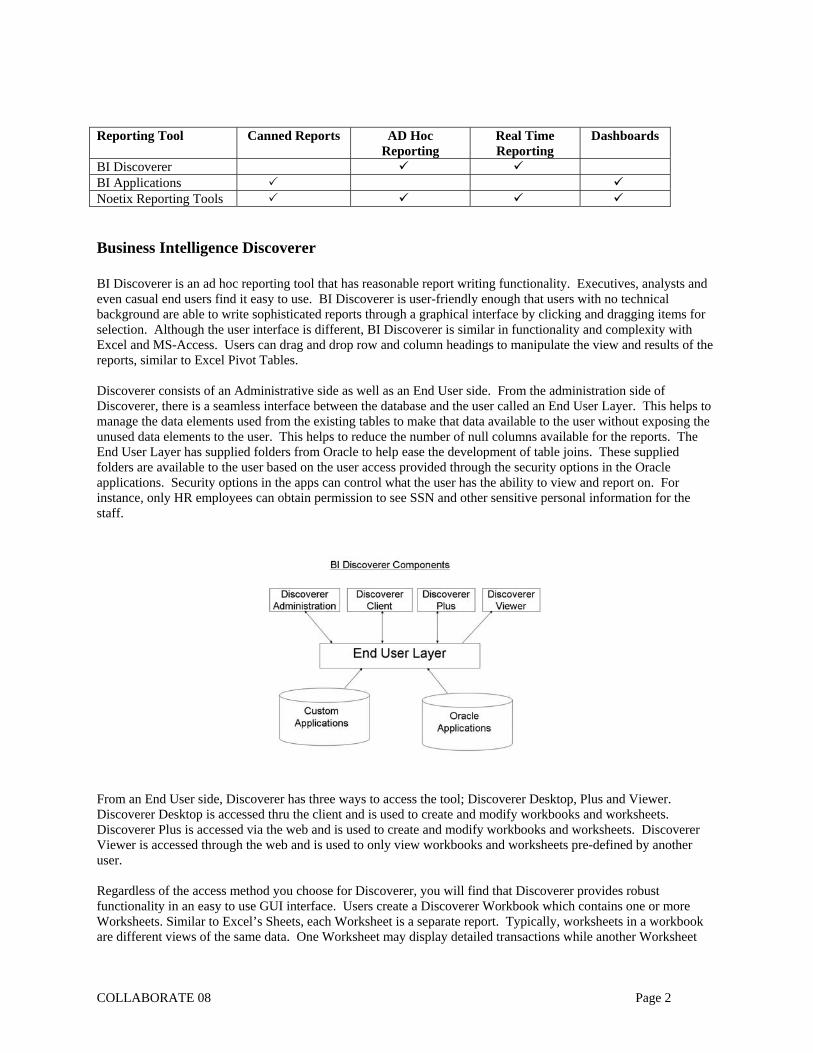
Business Intelligence Discoverer BI Discoverer is an ad hoc reporting tool that has reasonable report writing functionality. Executives, analysts and even casual end users find it easy to use. BI Discoverer is user-friendly enough that users with no technical background are able to write sophisticated reports through a graphical interface by clicking and dragging items for selection. Although the user interface is different, BI Discoverer is similar in functionality and complexity with Excel and MS-Access. Users can drag and drop row and column headings to manipulate the view and results of the reports, similar to Excel Pivot Tables. Discoverer consists of an Administrative side as well as an End User side. From the administration side of Discoverer, there is a seamless interface between the database and the user called an End User Layer. This helps to manage the data elements used from the existing tables to make that data available to the user without exposing the unused data elements to the user. This helps to reduce the number of null columns available for the reports. The End User Layer has supplied folders from Oracle to help ease the development of table joins. These supplied folders are available to the user based on the user access provided through the security options in the Oracle applications. Security options in the apps can control what the user has the ability to view and report on. For instance, only HR employees can obtain permission to see SSN and other sensitive personal information for the staff.
From an End User side, Discoverer has three ways to access the tool; Discoverer Desktop, Plus and Viewer. Discoverer Desktop is accessed thru the client and is used to create and modify workbooks and worksheets. Discoverer Plus is accessed via the web and is used to create and modify workbooks and worksheets. Discoverer Viewer is accessed through the web and is used to only view workbooks and worksheets pre-defined by another user. Regardless of the access method you choose for Discoverer, you will find that Discoverer provides robust functionality in an easy to use GUI interface. Users create a Discoverer Workbook which contains one or more Worksheets. Similar to Excel’s Sheets, each Worksheet is a separate report. Typically, worksheets in a workbook are different views of the same data. One Worksheet may display detailed transactions while another Worksheet
COLLABORATE 08 Page 2
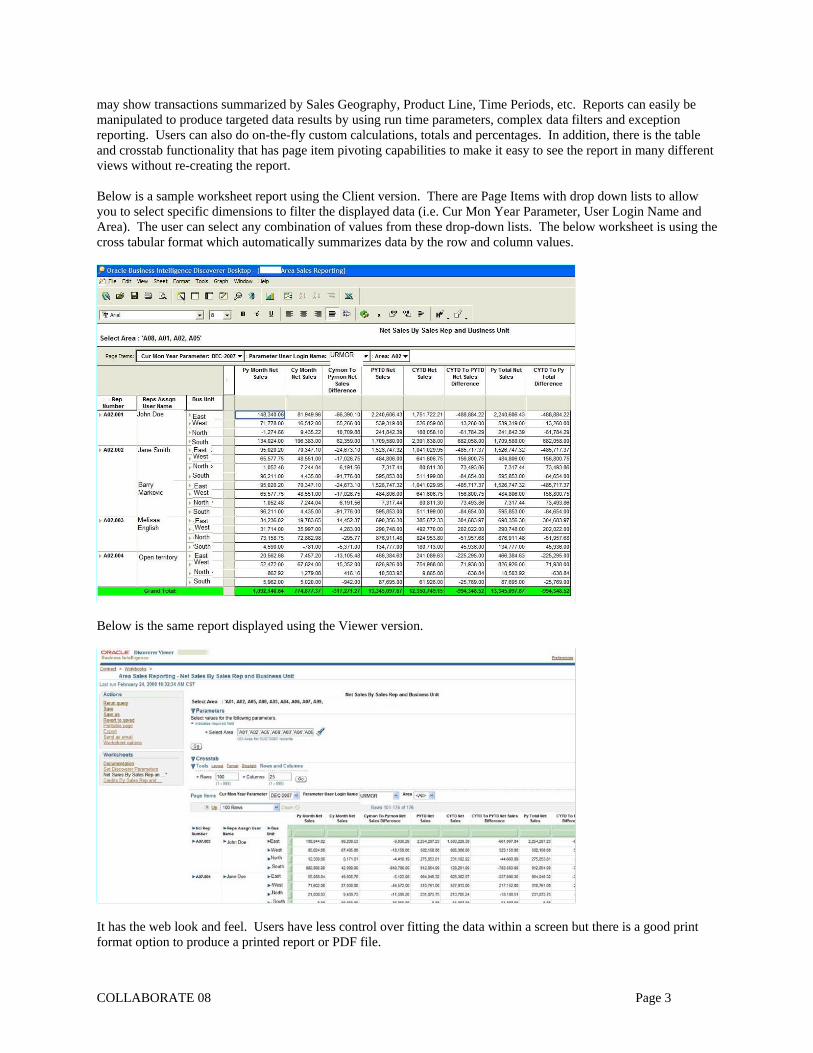
may show transactions summarized by Sales Geography, Product Line, Time Periods, etc. Reports can easily be manipulated to produce targeted data results by using run time parameters, complex data filters and exception reporting. Users can also do on-the-fly custom calculations, totals and percentages. In addition, there is the table and crosstab functionality that has page item pivoting capabilities to make it easy to see the report in many different views without re-creating the report. Below is a sample worksheet report using the Client version. There are Page Items with drop down lists to allow you to select specific dimensions to filter the displayed data (i.e. Cur Mon Year Parameter, User Login Name and Area). The user can select any combination of values from these drop-down lists. The below worksheet is using the cross tabular format which automatically summarizes data by the row and column values.
Below is the same report displayed using the Viewer version.
It has the web look and feel. Users have less control over fitting the data within a screen but there is a good print format option to produce a printed report or PDF file.
COLLABORATE 08 Page 3
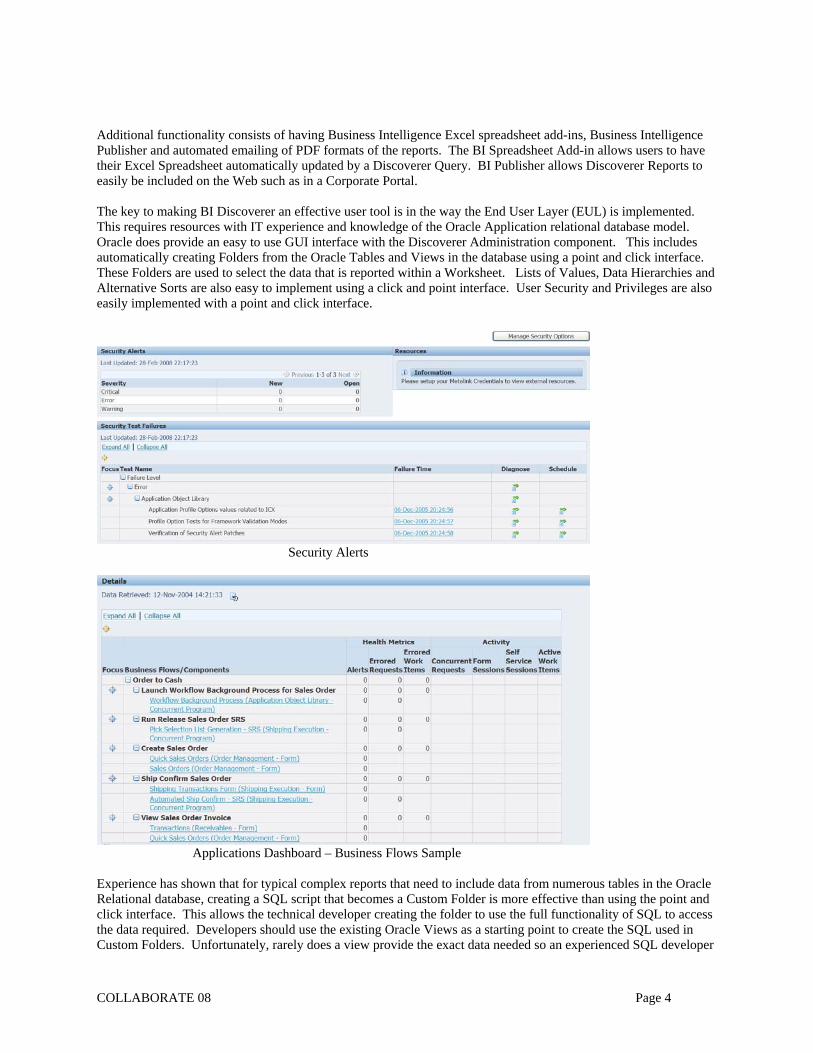
Additional functionality consists of having Business Intelligence Excel spreadsheet add-ins, Business Intelligence Publisher and automated emailing of PDF formats of the reports. The BI Spreadsheet Add-in allows users to have their Excel Spreadsheet automatically updated by a Discoverer Query. BI Publisher allows Discoverer Reports to easily be included on the Web such as in a Corporate Portal. The key to making BI Discoverer an effective user tool is in the way the End User Layer (EUL) is implemented. This requires resources with IT experience and knowledge of the Oracle Application relational database model. Oracle does provide an easy to use GUI interface with the Discoverer Administration component. This includes automatically creating Folders from the Oracle Tables and Views in the database using a point and click interface. These Folders are used to select the data that is reported within a Worksheet. Lists of Values, Data Hierarchies and Alternative Sorts are also easy to implement using a click and point interface. User Security and Privileges are also easily implemented with a point and click interface.
Security Alerts
Applications Dashboard – Business Flows Sample
Experience has shown that for typical complex reports that need to include data from numerous tables in the Oracle Relational database, creating a SQL script that becomes a Custom Folder is more effective than using the point and click interface. This allows the technical developer creating the folder to use the full functionality of SQL to access the data required. Developers should use the existing Oracle Views as a starting point to create the SQL used in Custom Folders. Unfortunately, rarely does a view provide the exact data needed so an experienced SQL developer
COLLABORATE 08 Page 4
is required to modify and combine Views and tables into a new SQL script. Another task that should be completed when developing the EUL is to ensure that the data items have names that clearly identify their use in the Oracle Applications. For example, many tables have items with generic names like “Name”, “Attribute 1”, “Effective Start Date”, etc. Changing these names to an easy to understand business description allows users to select the data they need. The EUL even allows a description to be entered for each item that allows even more documentation for users. Creating a well designed EUL is the most time consuming part of implementing a BI Discoverer environment. Luckily, creating the EUL is usually a one time set up process with minor enhancements as new releases of the Oracle Applications are implemented. Once good Custom Folders are developed, creating the actual Worksheet reports is the easy part.
BUSINESS INTELLIGENCE APPLICATIONS Business Intelligence Applications provide a set of predefined reports in dashboard format that are immediately available upon installation. The Business Intelligence Applications (BI Applications) are listed below:
1. Oracle Financial Analytics 2. Oracle HR Analytics 3. Oracle Order Management and Fulfillment Analytics 4. Oracle Supply Chain Analytics 5. Oracle Sales Analytics 6. Oracle Service Analytics 7. Oracle Contact Center Analytics 8. Oracle Marketing Analytics 9. Oracle Usage Accelerator Analytics for CRM
Each BI Application comes with a set of dashboards. Each dashboard consists of different regions each containing a specific type of content. There are five types of regions:
1. Parameter Region to allow the users to select run time parameters. 2. KPI Region to report on Key Performance Indicators. 3. Graph Region for graphic reporting. 4. Links Region to allow links to other Dashboards, company or external websites, etc. 5. Table Region to provide tabular reports.
Below is a sample dashboard with the regions identified.
COLLABORATE 08 Page 5
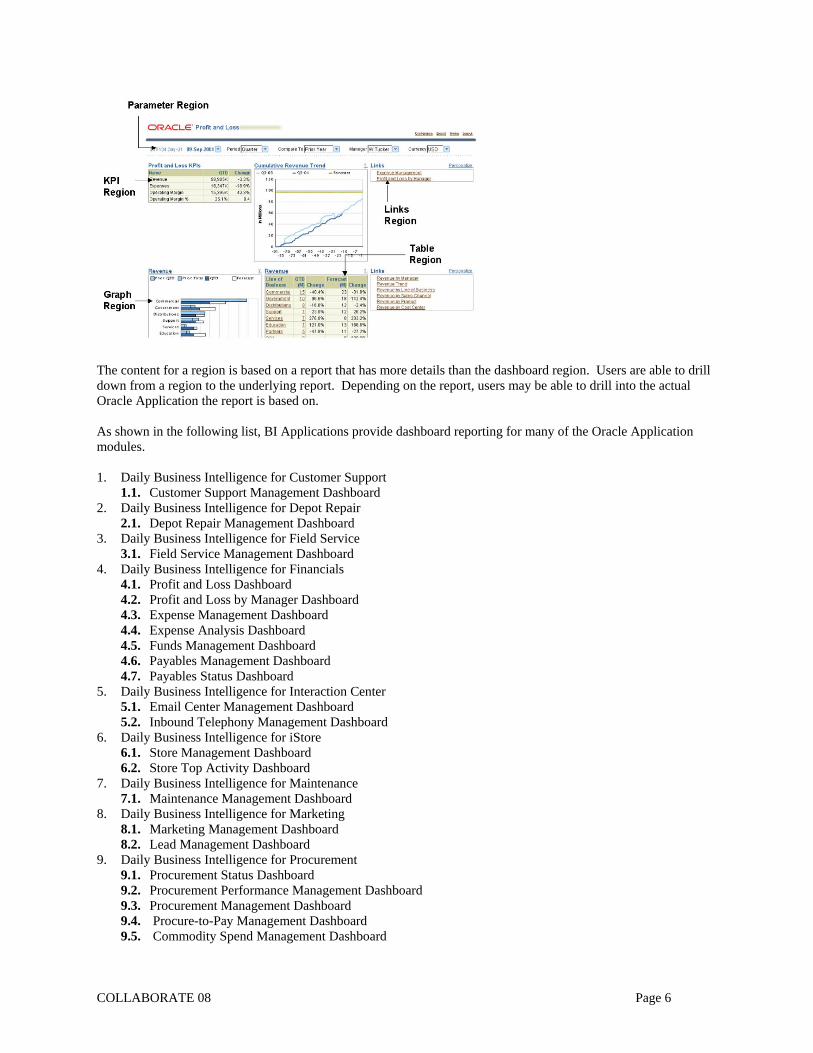
The content for a region is based on a report that has more details than the dashboard region. Users are able to drill down from a region to the underlying report. Depending on the report, users may be able to drill into the actual Oracle Application the report is based on. As shown in the following list, BI Applications provide dashboard reporting for many of the Oracle Application modules. 1. Daily Business Intelligence for Customer Support
1.1. Customer Support Management Dashboard 2. Daily Business Intelligence for Depot Repair
2.1. Depot Repair Management Dashboard 3. Daily Business Intelligence for Field Service
3.1. Field Service Management Dashboard 4. Daily Business Intelligence for Financials
4.1. Profit and Loss Dashboard 4.2. Profit and Loss by Manager Dashboard 4.3. Expense Management Dashboard 4.4. Expense Analysis Dashboard 4.5. Funds Management Dashboard 4.6. Payables Management Dashboard 4.7. Payables Status Dashboard
5. Daily Business Intelligence for Interaction Center 5.1. Email Center Management Dashboard 5.2. Inbound Telephony Management Dashboard
6. Daily Business Intelligence for iStore 6.1. Store Management Dashboard 6.2. Store Top Activity Dashboard
7. Daily Business Intelligence for Maintenance 7.1. Maintenance Management Dashboard
8. Daily Business Intelligence for Marketing 8.1. Marketing Management Dashboard 8.2. Lead Management Dashboard
9. Daily Business Intelligence for Procurement 9.1. Procurement Status Dashboard 9.2. Procurement Performance Management Dashboard 9.3. Procurement Management Dashboard 9.4. Procure-to-Pay Management Dashboard 9.5. Commodity Spend Management Dashboard
COLLABORATE 08 Page 6
9.6. Commodity Supplier Management Dashboard 10. Daily Business Intelligence for Product Lifecycle Management
10.1. Product Management - Engineering Dashboard 10.2. Product Management Dashboard
11. Daily Business Intelligence for Projects 11.1. Projects Profitability Management Dashboard 11.2. Projects Operations Management Dashboard 11.3. Capital Projects Cost Management Dashboard 11.4. Contract Projects Cost Management Dashboard
12. Daily Business Intelligence for Quoting 12.1. Quote Management Dashboard
13. Daily Business Intelligence for Sales 13.1. Sales Forecast Management Dashboard 13.2. Sales Management Dashboard 13.3. Opportunity Management Dashboard
14. Daily Business Intelligence for Service Contracts 14.1. Service Contracts Management Dashboard 14.2. Service Renewals Management Dashboard
15. Daily Business Intelligence for Supply Chain 15.1. Customer Fulfillment Management Dashboard 15.2. Shipping Management Dashboard 15.3. Inventory Management Dashboard 15.4. Manufacturing Management Dashboard 15.5. Product Cost Management Dashboard 15.6. Plan Management Dashboard 15.7. Product Revenue Bookings and Backlog Dashboard 15.8. Warehouse Management Dashboard 15.9. Transportation Management Dashboard
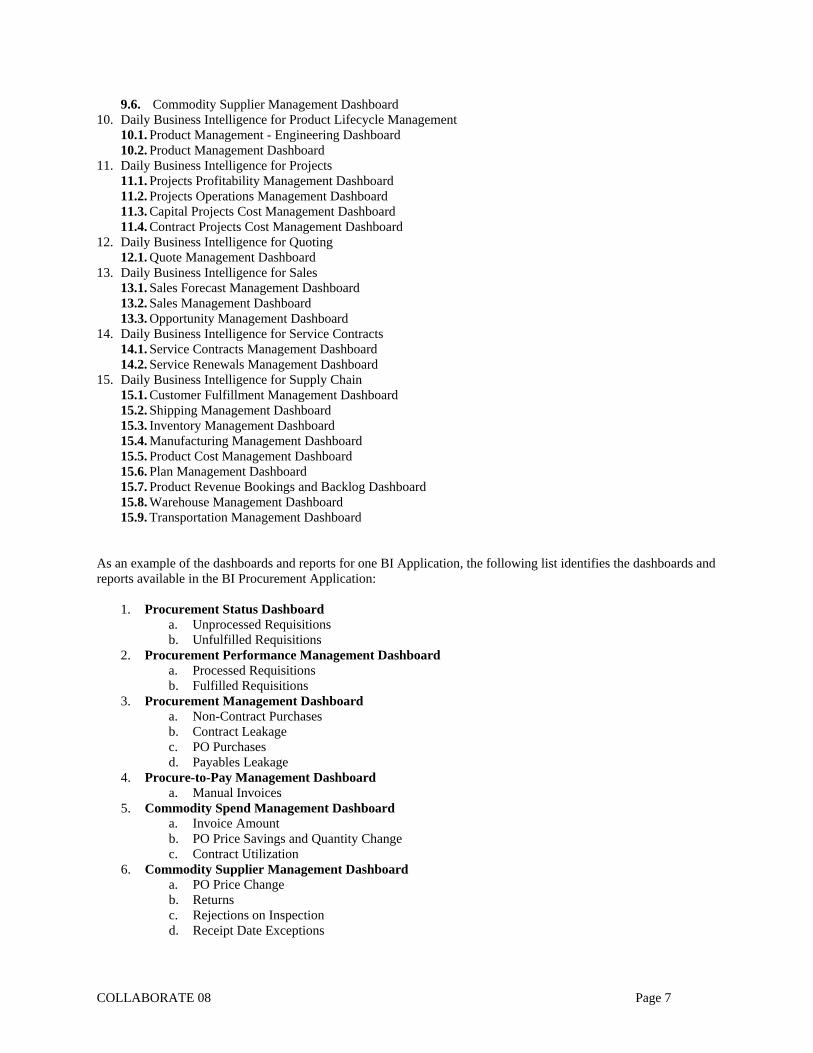
As an example of the dashboards and reports for one BI Application, the following list identifies the dashboards and reports available in the BI Procurement Application:
1. Procurement Status Dashboard a. Unprocessed Requisitions b. Unfulfilled Requisitions
2. Procurement Performance Management Dashboard a. Processed Requisitions b. Fulfilled Requisitions
3. Procurement Management Dashboard a. Non-Contract Purchases b. Contract Leakage c. PO Purchases d. Payables Leakage
4. Procure-to-Pay Management Dashboard a. Manual Invoices
5. Commodity Spend Management Dashboard a. Invoice Amount b. PO Price Savings and Quantity Change c. Contract Utilization
6. Commodity Supplier Management Dashboard a. PO Price Change b. Returns c. Rejections on Inspection d. Receipt Date Exceptions
COLLABORATE 08 Page 7
Dashboards can be customized as needed but normally the customization would be done by IT technical staff. Each Dashboard can have as many regions as needed to provide the required reporting. Normally, there would be one Parameter Region but there could be multiples for the other region types. There are several key concepts built into the BI Applications Dashboards.
• Responsibility – Identifies the data that a user can access. There are predefined responsibilities along with the capability of creating new ones.
• Date Parameters – Define the time period of the data being reported along with a time period for comparison purposes, such as current month to same month in the prior year.
• KPI or Key Performance Indicator – KPIs are defined for each Dashboard based on accepted “best practices”.
As an example, the KPIs for the Procurement Status Dashboard are used to see what volume of requisitions currently need processing into purchase orders or releases, including how many are processed late (past their expected date) and how long on average they have been in an unprocessed state. The actual KPIs are:
• Unprocessed Requisition Lines: Number of approved requisition lines that are not canceled, returned, or rejected, that are not on an approved purchase order or release.
• Unprocessed Requisition Lines Past Expected Date: Number of unprocessed requisition lines where the current date (specifically, the Data Last Updated date that displays at the bottom of each page) is past the Promised Date or Need-By Date on the purchase order or release shipment, or past the Need-By Date on the requisition line, whichever is available.
• Unprocessed Requisitions Amount: Price * Quantity. Sum of the amounts on each purchase order or release shipment corresponding to each unprocessed requisition line. If the requisition line has not yet been placed on a purchase order, then the requisition line amount (Price * Quantity) is used.
• Unprocessed Average Age (Days): Number of Days Pending / Unprocessed Requisition Lines. Each Dashboard has a similar set of predefined KPIs available upon installation. There is a key technical consideration when implementing BI Applications. Oracle Materialized Views are used as the source of data. These materialized views must be updated on a scheduled basis. Depending on the organization, this could be daily or even multiple times per day. Incremental updates are used to minimize processing time. For most BI reporting requirements, this snapshot of the data updated on an agreed upon schedule is sufficient. Noetix Tools Noetix Corporation offers Business Intelligence Reporting tools that work well with Oracle Applications. These tools include:
• Noetix Views • Noetix Generator • Noetix WebQuery • Noetix Answers • Noetix Platform
o Noetix Dashboards o Noetix QueryServer
Noetix Views is a set of custom Oracle Views each designed to provide specific business information. Data items in these views have been set to commonly understood business terms. This includes all of the flexfields an organization uses. The views and their data items are well documented. There is also a list of “hints” that ask typical business questions and then direct the user to a specific Noetix View to find the needed information. The following screen shots show the on-line Help available in Noetix Views.
COLLABORATE 08 Page 8
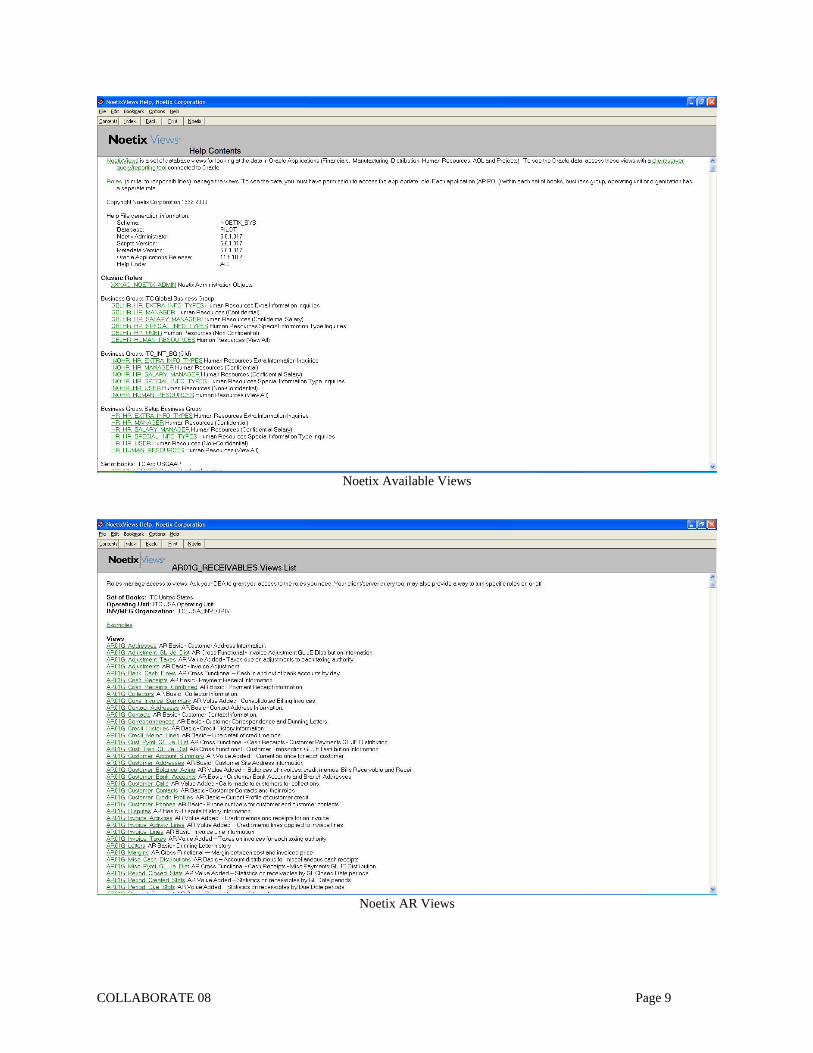
Noetix Available Views
Noetix AR Views
COLLABORATE 08 Page 9
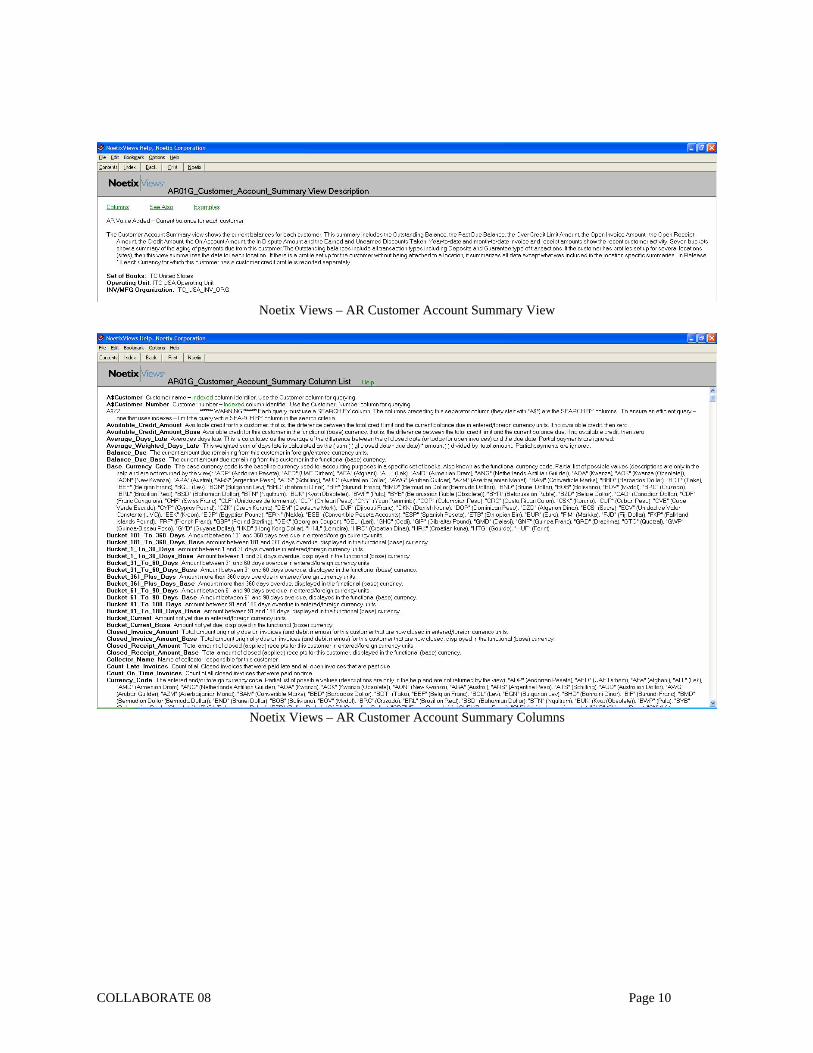
Noetix Views – AR Customer Account Summary View
Noetix Views – AR Customer Account Summary Columns
COLLABORATE 08 Page 10
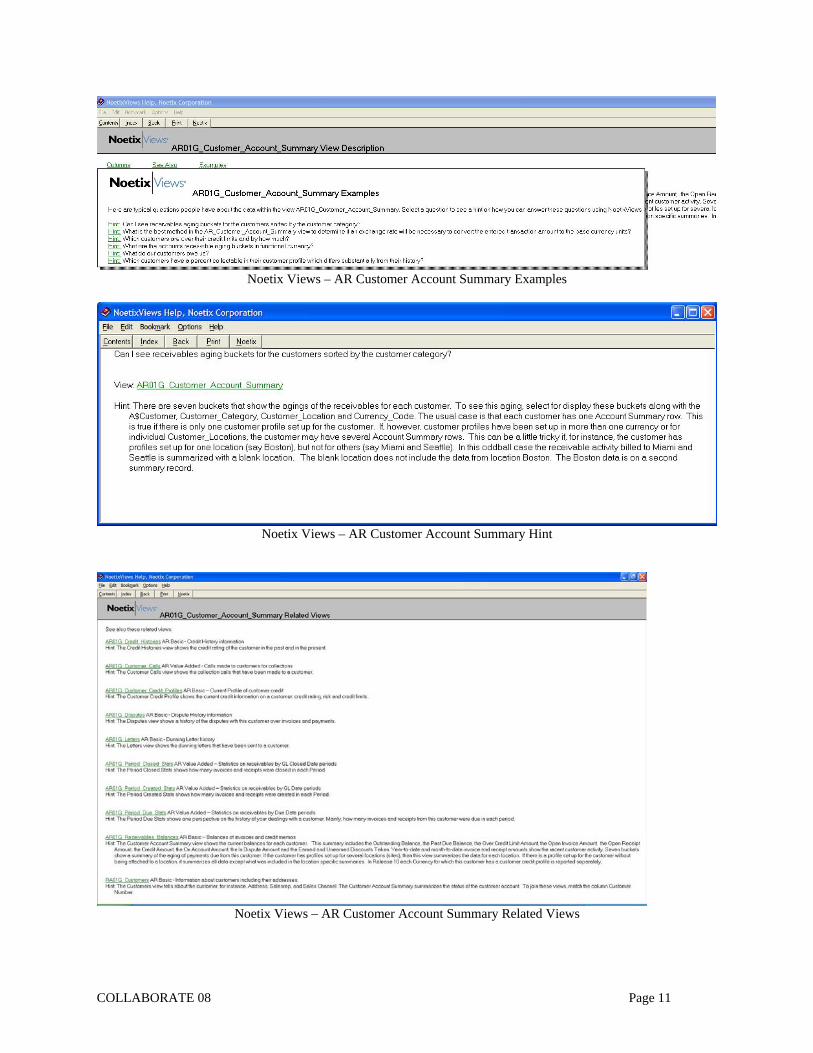
Noetix Views – AR Customer Account Summary Examples
Noetix Views – AR Customer Account Summary Hint
Noetix Views – AR Customer Account Summary Related Views
COLLABORATE 08 Page 11
The on-line Help included with Noetix Views is the key to enabling users to quickly understand the data available to them. Noetix provides views for the following Oracle Application modules:
• Oracle Financials • Order Management • Procurement • Projects • Discrete and Process Manufacturing • Human Resources • Payroll • Grants • Service
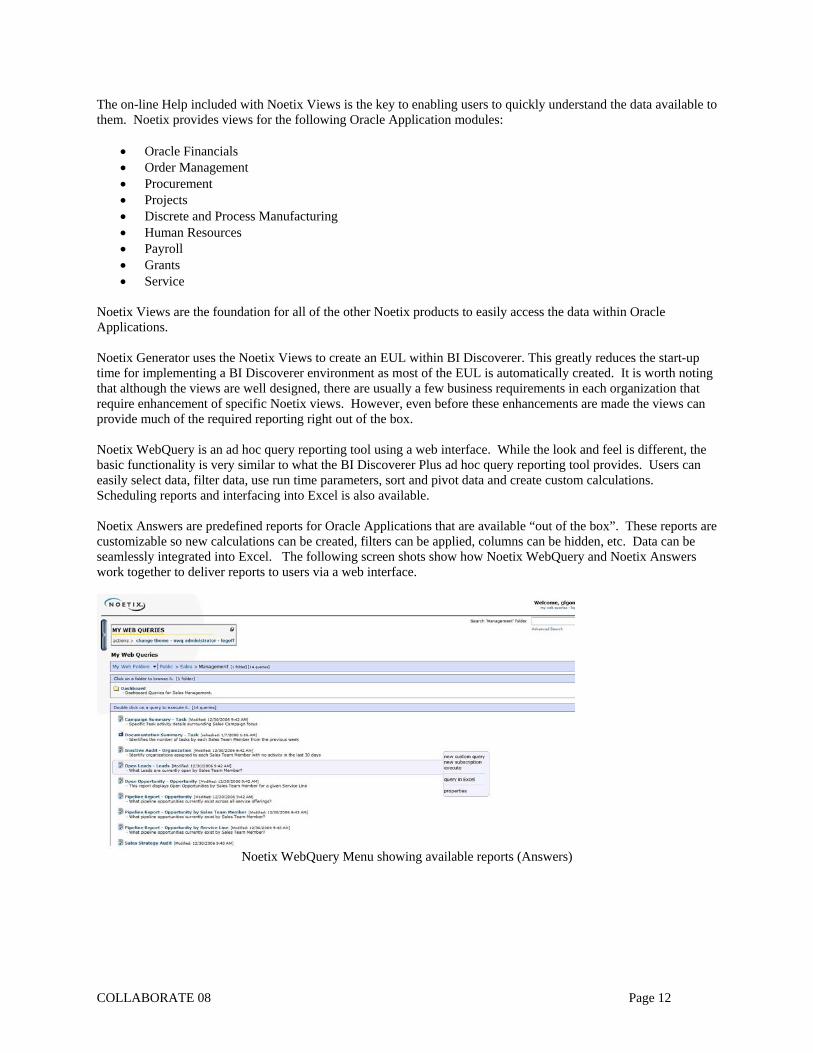
Noetix Views are the foundation for all of the other Noetix products to easily access the data within Oracle Applications. Noetix Generator uses the Noetix Views to create an EUL within BI Discoverer. This greatly reduces the start-up time for implementing a BI Discoverer environment as most of the EUL is automatically created. It is worth noting that although the views are well designed, there are usually a few business requirements in each organization that require enhancement of specific Noetix views. However, even before these enhancements are made the views can provide much of the required reporting right out of the box. Noetix WebQuery is an ad hoc query reporting tool using a web interface. While the look and feel is different, the basic functionality is very similar to what the BI Discoverer Plus ad hoc query reporting tool provides. Users can easily select data, filter data, use run time parameters, sort and pivot data and create custom calculations. Scheduling reports and interfacing into Excel is also available. Noetix Answers are predefined reports for Oracle Applications that are available “out of the box”. These reports are customizable so new calculations can be created, filters can be applied, columns can be hidden, etc. Data can be seamlessly integrated into Excel. The following screen shots show how Noetix WebQuery and Noetix Answers work together to deliver reports to users via a web interface.
Noetix WebQuery Menu showing available reports (Answers)
COLLABORATE 08 Page 12
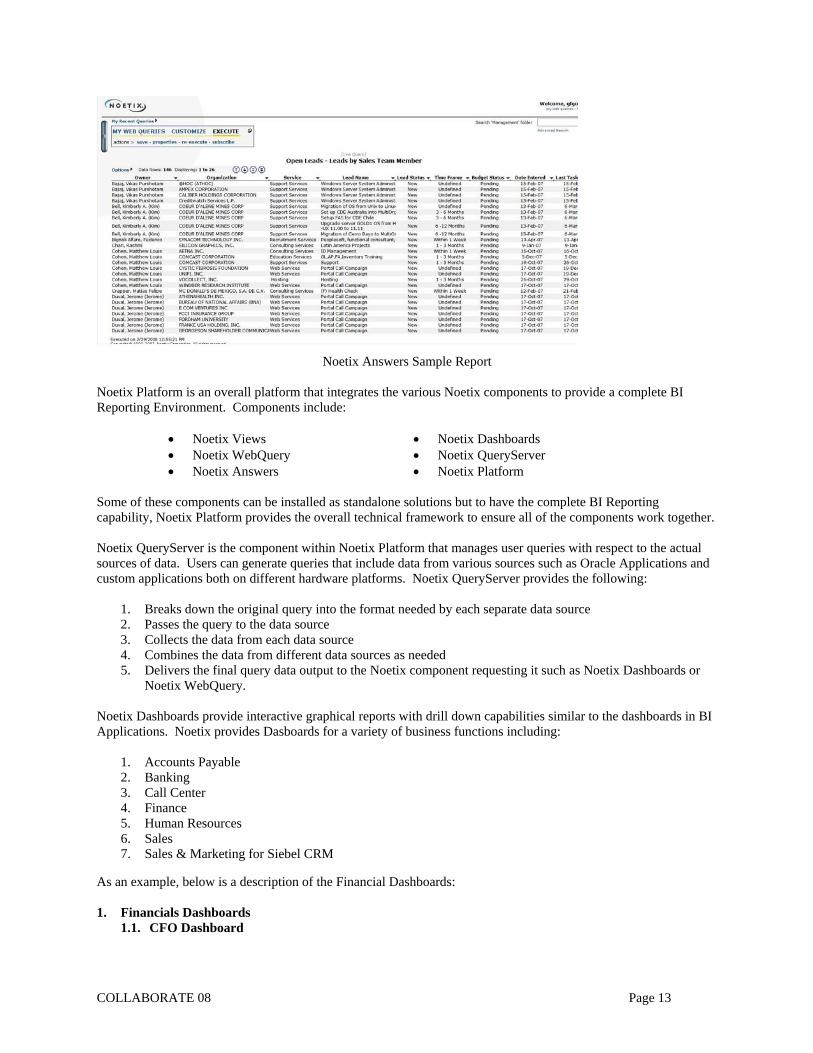
Noetix Answers Sample Report
Noetix Platform is an overall platform that integrates the various Noetix components to provide a complete BI Reporting Environment. Components include:
• Noetix Views • Noetix Dashboards • Noetix WebQuery • Noetix QueryServer • Noetix Answers • Noetix Platform
Some of these components can be installed as standalone solutions but to have the complete BI Reporting capability, Noetix Platform provides the overall technical framework to ensure all of the components work together. Noetix QueryServer is the component within Noetix Platform that manages user queries with respect to the actual sources of data. Users can generate queries that include data from various sources such as Oracle Applications and custom applications both on different hardware platforms. Noetix QueryServer provides the following:
1. Breaks down the original query into the format needed by each separate data source 2. Passes the query to the data source 3. Collects the data from each data source 4. Combines the data from different data sources as needed 5. Delivers the final query data output to the Noetix component requesting it such as Noetix Dashboards or
Noetix WebQuery. Noetix Dashboards provide interactive graphical reports with drill down capabilities similar to the dashboards in BI Applications. Noetix provides Dasboards for a variety of business functions including:
1. Accounts Payable 2. Banking 3. Call Center 4. Finance 5. Human Resources 6. Sales 7. Sales & Marketing for Siebel CRM
As an example, below is a description of the Financial Dashboards: 1. Financials Dashboards
1.1. CFO Dashboard
COLLABORATE 08 Page 13
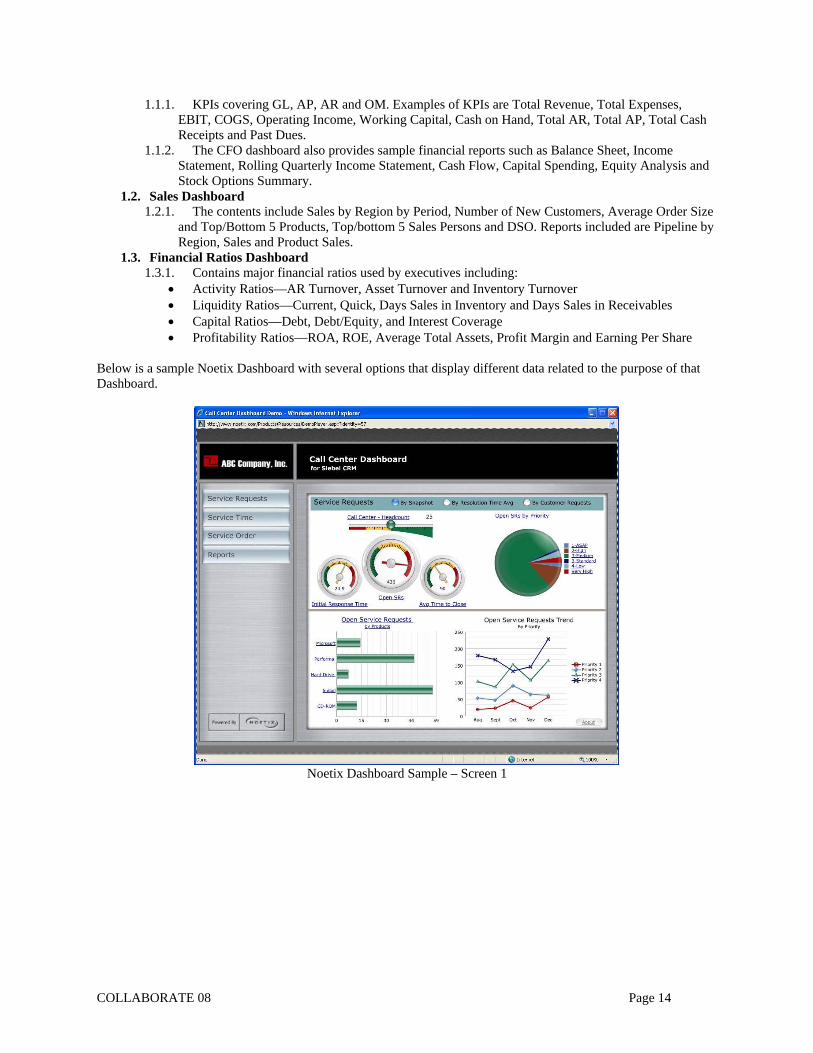
1.1.1. KPIs covering GL, AP, AR and OM. Examples of KPIs are Total Revenue, Total Expenses, EBIT, COGS, Operating Income, Working Capital, Cash on Hand, Total AR, Total AP, Total Cash Receipts and Past Dues.
1.1.2. The CFO dashboard also provides sample financial reports such as Balance Sheet, Income Statement, Rolling Quarterly Income Statement, Cash Flow, Capital Spending, Equity Analysis and Stock Options Summary.
1.2. Sales Dashboard 1.2.1. The contents include Sales by Region by Period, Number of New Customers, Average Order Size
and Top/Bottom 5 Products, Top/bottom 5 Sales Persons and DSO. Reports included are Pipeline by Region, Sales and Product Sales.
1.3. Financial Ratios Dashboard 1.3.1. Contains major financial ratios used by executives including:
• Activity Ratios—AR Turnover, Asset Turnover and Inventory Turnover • Liquidity Ratios—Current, Quick, Days Sales in Inventory and Days Sales in Receivables • Capital Ratios—Debt, Debt/Equity, and Interest Coverage • Profitability Ratios—ROA, ROE, Average Total Assets, Profit Margin and Earning Per Share
Below is a sample Noetix Dashboard with several options that display different data related to the purpose of that Dashboard.
Noetix Dashboard Sample – Screen 1
COLLABORATE 08 Page 14
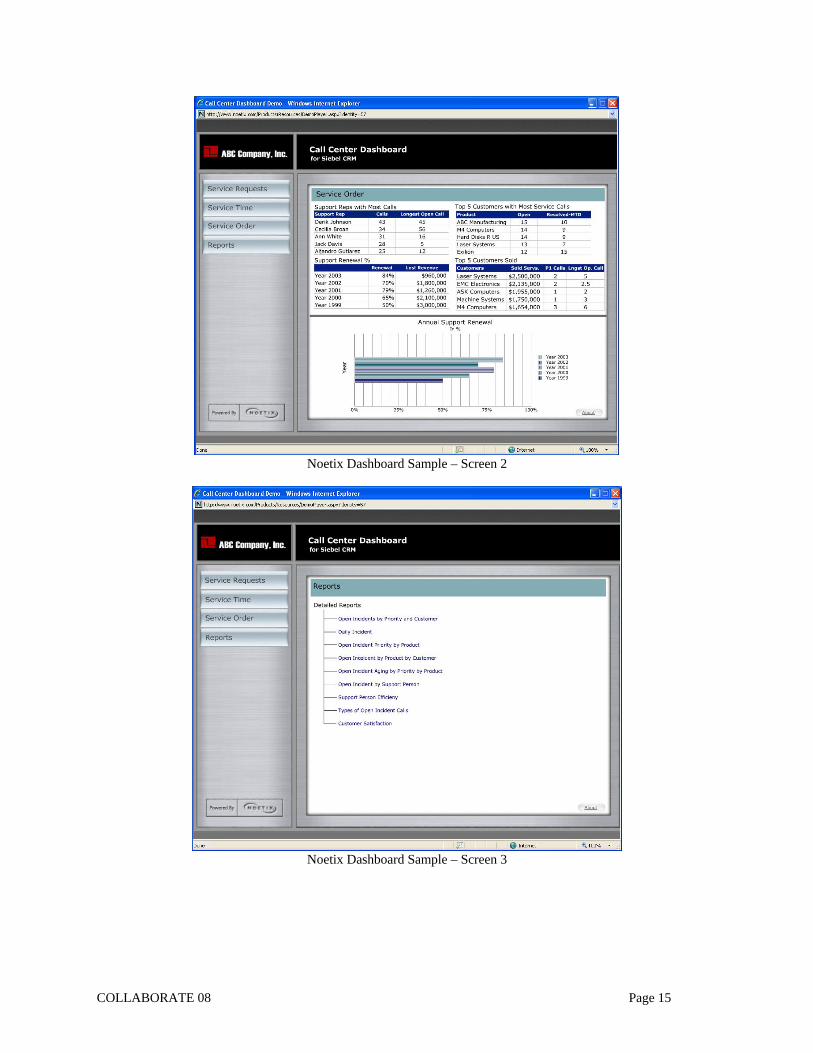
Noetix Dashboard Sample – Screen 2
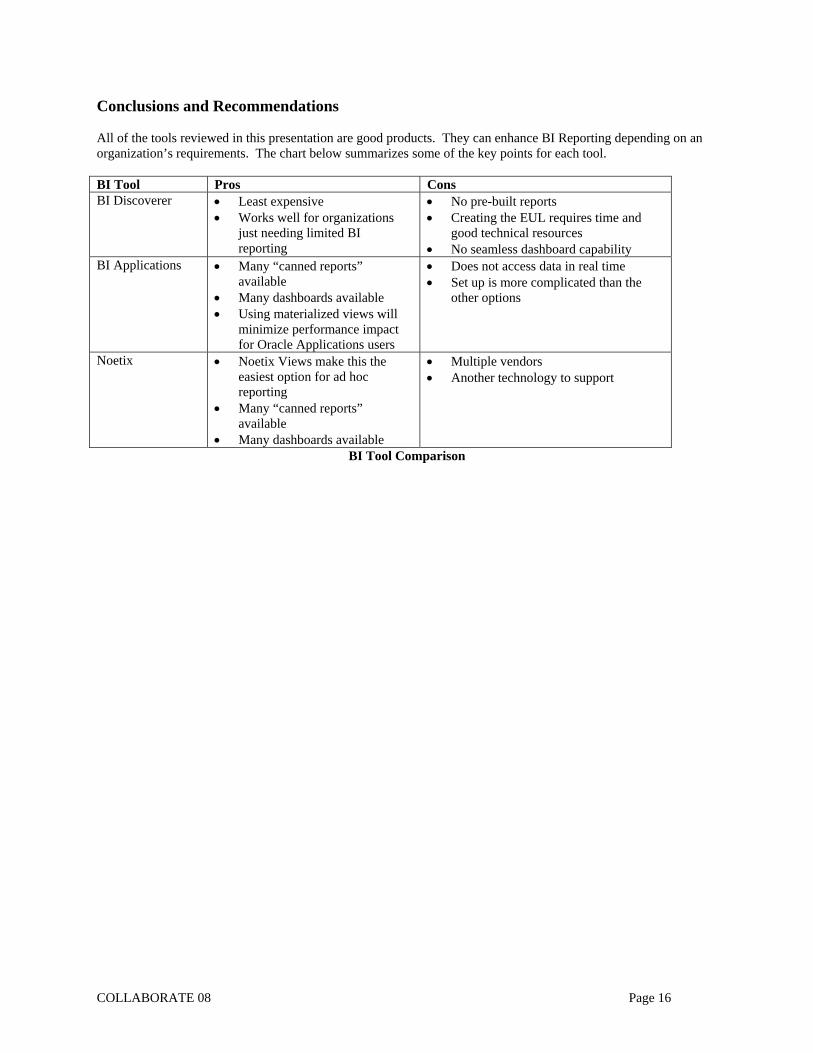
Noetix Dashboard Sample – Screen 3
COLLABORATE 08 Page 15
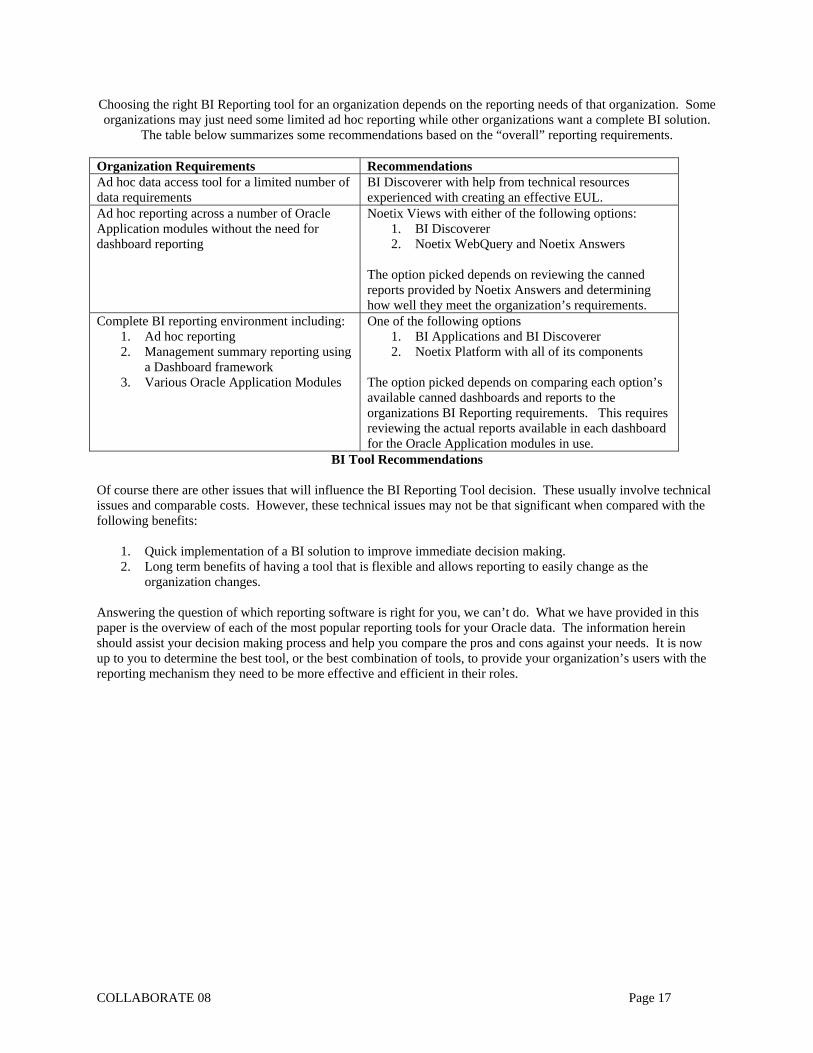
Conclusions and Recommendations All of the tools reviewed in this presentation are good products. They can enhance BI Reporting depending on an organization’s requirements. The chart below summarizes some of the key points for each tool. BI Tool Pros Cons BI Discoverer • Least expensive
• Works well for organizations just needing limited BI reporting
• No pre-built reports • Creating the EUL requires time and
good technical resources • No seamless dashboard capability
BI Applications • Many “canned reports” available
• Many dashboards available • Using materialized views will
minimize performance impact for Oracle Applications users
• Does not access data in real time • Set up is more complicated than the
other options
Noetix • Noetix Views make this the easiest option for ad hoc reporting
• Many “canned reports” available
• Many dashboards available
• Multiple vendors • Another technology to support
BI Tool Comparison
COLLABORATE 08 Page 16
COLLABORATE 08 Page 17
Choosing the right BI Reporting tool for an organization depends on the reporting needs of that organization. Some organizations may just need some limited ad hoc reporting while other organizations want a complete BI solution.
The table below summarizes some recommendations based on the “overall” reporting requirements.
Organization Requirements Recommendations Ad hoc data access tool for a limited number of data requirements
BI Discoverer with help from technical resources experienced with creating an effective EUL.
Ad hoc reporting across a number of Oracle Application modules without the need for dashboard reporting
Noetix Views with either of the following options: 1. BI Discoverer 2. Noetix WebQuery and Noetix Answers
The option picked depends on reviewing the canned reports provided by Noetix Answers and determining how well they meet the organization’s requirements.
Complete BI reporting environment including: 1. Ad hoc reporting 2. Management summary reporting using
a Dashboard framework 3. Various Oracle Application Modules
One of the following options 1. BI Applications and BI Discoverer 2. Noetix Platform with all of its components
The option picked depends on comparing each option’s available canned dashboards and reports to the organizations BI Reporting requirements. This requires reviewing the actual reports available in each dashboard for the Oracle Application modules in use.
BI Tool Recommendations
Of course there are other issues that will influence the BI Reporting Tool decision. These usually involve technical issues and comparable costs. However, these technical issues may not be that significant when compared with the following benefits:
1. Quick implementation of a BI solution to improve immediate decision making. 2. Long term benefits of having a tool that is flexible and allows reporting to easily change as the
organization changes. Answering the question of which reporting software is right for you, we can’t do. What we have provided in this paper is the overview of each of the most popular reporting tools for your Oracle data. The information herein should assist your decision making process and help you compare the pros and cons against your needs. It is now up to you to determine the best tool, or the best combination of tools, to provide your organization’s users with the reporting mechanism they need to be more effective and efficient in their roles.