Embed Size (px)
Citation preview
SO Incentives from April 2010
John Perkins

2
Gas System Operator (SO) Incentives
National Grid operates the high pressure Gas
Transmission System in Great Britain.
The System Operation function has financial
incentives that encourage us to:
Minimise System Operation costs to consumers
Consider our impact on the environment
Support efficient operation of the wholesale gas market
This year’s consultation covers incentives on activities involving over £100m of gas industry revenues

3
Development of SO Incentives
This consultation is your opportunity to voice your opinions on the incentive schemes from April 2010
National Grid first
led . development of Initial
Proposals
2007/2008
Fundamental review with consultation
through workshops
2008/2009
2009/2010 pre 2007
Ofgem led development
of SO proposals
National Grid leading on development of Initial Proposals

4
Engagement this year
We are keen to hear the views from the widest possible range of interested
parties
Presentations have been arranged at a several industry meetings, including
Major Energy Users’ Council, Small Suppliers Forum, Transmission Workstream, Demand Side Working Group, Association of Electricity Producers, Gas Ops Forum
We have offered to meet bilaterally with all parties who responded to last
years initial proposals consultation
If you would like us to present at another industry meeting or would like to meet
bilaterally then please contact us

5
Key challenges for this year
Gas
Explore options for new incentives around maintenance and environmental performance
Explore possible options to re-incentivise Operating Margins
Ensuring information on incentive performance is provided in an accessible, transparent manner
Electricity
Develop indexation
Handling of differential in risk profiles of the BSIS components
Differentiating incentive periods of the BSIS components
Implementation of Transmission Access and the SO / TO incentives
Increased information provision
Bundled vs unbundled schemes
Longer term schemes

6
Timetable
June/July 2009 Initial industry consultation/ engagement
July/August 2009 Publication of mini consultation documents
October 2009 Publication of initial proposals
November 2009 Industry event
November 2009 Ofgem to provide initial comments
December 2009 Initial Proposals consultation period closes
Early 2010 Ofgem consultation on final proposals
April 2010 Scheme go live
National Grid can be contacted at any time to discuss SO Incentives

7
How do I find out more?
Register to receive e-mail notifications
SO Incentives area of the National Grid website
www.nationalgrid.com/uk/Gas/soincentives/
www.nationalgrid.com/uk/electricity/soincentives/
Talk to us
[email protected] 01926 656337
[email protected] 01926 654909

Information published on gas incentives

9
Information on Incentive Performance
National Grid website is used to publish information on incentive performance
Reporting against performance measures
Financial incentive performance (where possible)
www.nationalgrid.com/uk/Gas/soincentives/AnalystArea/
We are looking to review this information and welcome industry views on
exactly what is needed

10
0
20
40
60
80
100
120
140
160
Apr-08
May-08
Jun-08
Jul-08
Aug-08
Sep-08
Oct-08
Nov-08
Dec-08
Jan-09
Feb-09
Mar-09
£k
0.00
0.20
0.40
0.60
0.80
1.00
1.20
1.40
1.60
£m
Sum of DPIP (£k) Cumulative Sum of DPIP (£m)
RESIDUAL BALANCING
Scheme Description:
For further information:
-1
Month
Sum of Daily Price Incentive
Payment (DPIP) (£)
Cumulative Sum of DPIP
(£)Sum of DPIP
(£k)
Cumulative Sum of DPIP
(£m)
Average Price Performance Measure (%)
PPM* Min PPM (%)Max PPM
(%)
Sum of Daily Linepack Incentive
Payment (£) DLIP
Cumulative Sum of DLIP
(£)Sum of DLIP
(£k)
Cumulative Sum of DLIP
(£k)
Average Linepack Measure
(mcm) LPM**Min LPM (mcm)
Max LPM (mcm)
Apr-08 £142,073 142,073 142 0.14 0.53 0.00 2.98 -£21,702 -21,702 -21.70 -21.70 2.99 0.10 11.34May-08 £113,219 255,292 113 0.26 2.75 0.00 17.87 £22,993 1,291 22.99 1.29 2.15 0.03 4.87Jun-08 £122,409 377,701 122 0.38 1.90 0.00 18.72 £58,474 59,765 58.47 59.76 1.52 0.01 4.77Jul-08 £130,177 507,878 130 0.51 1.66 0.00 19.81 £40,420 100,185 40.42 100.18 1.87 0.01 8.49
Aug-08 £123,669 631,547 124 0.63 2.07 0.00 16.03 £34,011 134,195 34.01 134.20 1.95 0.02 6.76Sep-08 £122,493 754,040 122 0.75 1.84 0.00 10.65 -£2,557 131,639 -2.56 131.64 2.59 0.26 6.29Oct-08 £86,278 840,318 86 0.84 4.71 0.00 24.13 -£18,240 113,399 -18.24 113.40 2.92 0.11 6.53Nov-08 £111,007 951,325 111 0.95 2.62 0.00 12.27 -£3,907 109,492 -3.91 109.49 2.64 0.05 7.28Dec-08 £103,101 1,054,426 103 1.05 3.56 0.00 35.82 £2,838 112,329 2.84 112.33 2.53 0.09 10.67Jan-09 £138,378 1,192,804 138 1.19 1.07 0.00 6.51 -£4,430 107,899 -4.43 107.90 2.65 0.01 7.09Feb-09 £104,263 1,297,067 104 1.30 2.55 0.00 7.90 -£32,925 74,974 -32.92 74.97 3.23 0.08 9.97Mar-09 £133,228 1,430,295 133 1.43 1.40 0.00 7.71 £30,506 105,480 30.51 105.48 2.00 0.07 4.88
*PPM is calculated as Max Price minus Min Price divided by the System Average Price (SAP). **LPM is calculated as the absolute value of opening linepack minus closing linepack
MonthVolume of
buys (kWh)Volume of sells (kWh)
Volume of sells (kWh)
Number of buys
Number of sells
Number of days - buys
Number of days - sells
SELL Min Price (ppt)
SELL Max Price (ppt)
BUY Min Price (ppt)
BUY Max Price (ppt)
Apr-08 99,028,695 202,512,067 -202,512,067 40 -80 4 -7 -56.2 -63.6 58.3 69.0May-08 247,176,083 328,356,758 -328,356,758 112 -131 9 -10 -42.0 -58.2 56.0 70.0Jun-08 37,835,469 206,644,364 -206,644,364 19 -84 4 -9 -42.0 -66.5 61.8 70.8Jul-08 86,690,403 184,898,501 -184,898,501 36 -91 3 -9 -25.0 -64.9 62.2 69.0
Aug-08 65,413,450 267,984,131 -267,984,131 36 -117 8 -6 -35.0 -56.0 52.9 64.0Sep-08 200,812,255 237,621,977 -237,621,977 83 -110 9 -9 -48.5 -73.0 44.0 83.0Oct-08 382,838,659 153,188,216 -153,188,216 148 -60 13 -5 -1.0 -69.7 41.0 86.0Nov-08 115,294,135 353,121,257 -353,121,257 52 -137 5 -13 -40.2 -68.6 45.3 77.0Dec-08 121,624,468 700,644,856 -700,644,856 53 -261 4 -16 -43.5 -62.2 55.9 82.0Jan-09 46,715,517 333,426,882 -333,426,882 18 -116 2 -11 -53 -68.85 59.5 64Feb-09 21,833,790 813,623,736 -813,623,736 10 -296 2 -15 -28.6 -62.1 57 67.5Mar-09 117,345,633 367,217,969 -367,217,969 48 -128 4 -10 -26.5 -33.71 28.28 37
NB: "Sell" is depicted as a negative figure for graphical purposes only
Trades
The incentive contains two elements, the Price Performance Measure (PPM) and the Linepack Measure (LM). As National Grid has no direct exposure to the costs of its balancing actions, the PPM is set toencourage National Grid to trade efficiently on behalf of the community, minimising the overall costs passed to neutrality and paid by shippers, and minimising its impact on cashout prices. The PPMencourages price efficiency by incentivising National Grid to carry out any balancing actions close to the System Average Price (SAP), measured through the differential between any National Grid trades.The LM incentivises National Grid to minimise any changes between starting and closing NTS linepack over a gas day. This is intended to ensure that any system imbalances are resolved on the relevantday, ensuring that the costs of resolving any imbalances are targeted to those responsible for the imbalance.
Go to the System Operator incentive scheme final proposals for 2008/09 http://www.ofgem.gov.uk/Pages/MoreInformation.aspx?docid=126&refer=Markets/WhlMkts/EffSystemOps/SystOpIncent
Price Linepack
0
20
40
60
80
100
120
140
160
Apr-08
May-08
Jun-08
Jul-08 Aug-08
Sep-08
Oct-08
Nov-08
Dec-08
Jan-09
Feb-09
Mar-09
£k
0.00
0.20
0.40
0.60
0.80
1.00
1.20
1.40
1.60
£m
Sum of DPIP (£k) Cumulative Sum of DPIP (£m)
0
5
10
15
20
25
30
35
40
Apr-08 May-08
Jun-08 Jul-08 Aug-08 Sep-08 Oct-08 Nov-08 Dec-08 Jan-09 Feb-09 Mar-09
%
Average Price Performance Measure (%) PPM* Min PPM (%) Max PPM (%)
-40
-20
0
20
40
60
80
Apr-08 May-08
Jun-08 Jul-08 Aug-08
Sep-08
Oct-08 Nov-08
Dec-08
Jan-09 Feb-09Mar-09
£k
-40
-20
0
20
40
60
80
100
120
140
160
£k
Sum of DLIP (£k) Cumulative Sum of DLIP (£k)
0
2
4
6
8
10
12
Apr-08 May-08 Jun-08 Jul-08 Aug-08 Sep-08 Oct-08 Nov-08 Dec-08 Jan-09 Feb-09 Mar-09
mcm
Average Linepack Measure (mcm) LPM** Min LPM (mcm) Max LPM (mcm)
-300
-200
-100
0
100
200
300
Apr
-08
May
-08
Jun-
08
Jul-0
8
Aug
-08
Sep
-08
Oct
-08
Nov
-08
Dec
-08
Jan-
09
Feb
-09
Mar
-09
Tra
des
-20
-15
-10
-5
0
5
10
15
20
Day
s
Number of buys Number of sells
Number of days - buys Number of days - sells
-1,000
-800
-600
-400
-200
0
200
400
600
800
1,000
Apr
-08
May
-08
Jun-
08
Jul-0
8
Aug
-08
Sep
-08
Oct
-08
Nov
-08
Dec
-08
Jan-
09
Feb
-09
Mar
-09
Vol
ume
(GW
h)
-100
-80
-60
-40
-20
0
20
40
60
80
100
Pen
ce P
er T
herm
PP
T)
Volume of buys (kWh) Volume of sells (kWh) SELL Min Price (ppt)
SELL Max Price (ppt) BUY Min Price (ppt) BUY Max Price (ppt)
Residual balancing
Month
Sum of Daily Price Incentive
Payment (DPIP) (£)
Cumulative Sum of DPIP
(£)
Apr-08 £142,073 142,073May-08 £113,219 255,292Jun-08 £122,409 377,701Jul-08 £130,177 507,878
Aug-08 £123,669 631,547Sep-08 £122,493 754,040Oct-08 £86,278 840,318Nov-08 £111,007 951,325Dec-08 £103,101 1,054,426Jan-09 £138,378 1,192,804Feb-09 £104,263 1,297,067Mar-09 £133,228 1,430,295

Gas incentive specific issues
12
Maintenance
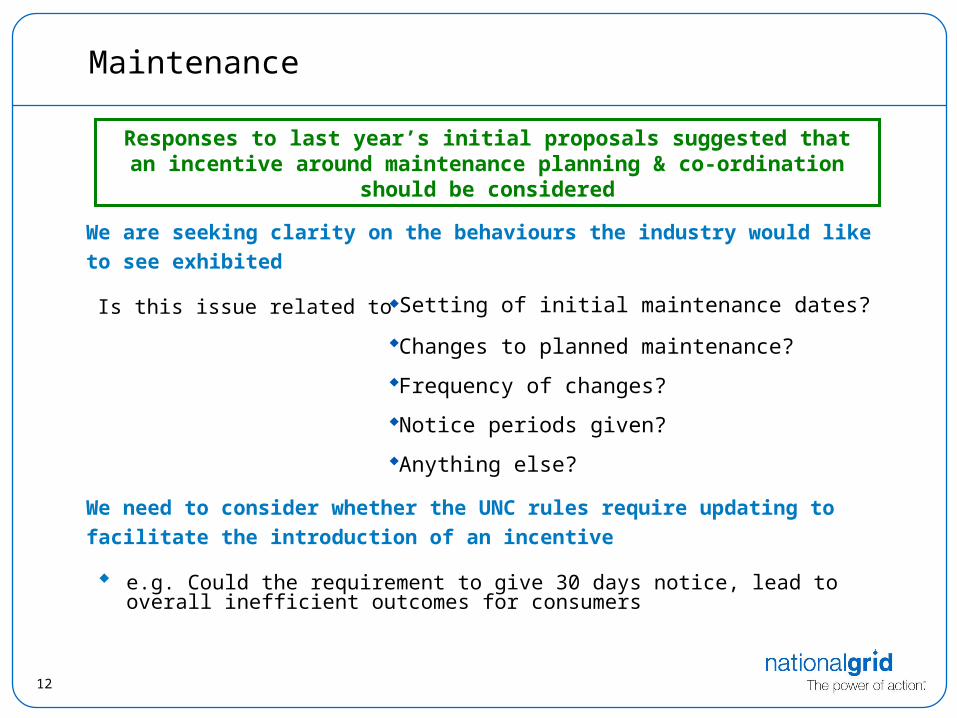
We are seeking clarity on the behaviours the industry would like to see
exhibited
Is this issue related to
We need to consider whether the UNC rules require updating to facilitate the
introduction of an incentive
e.g. Could the requirement to give 30 days notice, lead to overall inefficient outcomes for consumers
Responses to last year’s initial proposals suggested that an incentive around maintenance planning & co-ordination should be considered
Setting of initial maintenance dates?
Changes to planned maintenance?
Frequency of changes?
Notice periods given?
Anything else?
13
Environmental Incentives
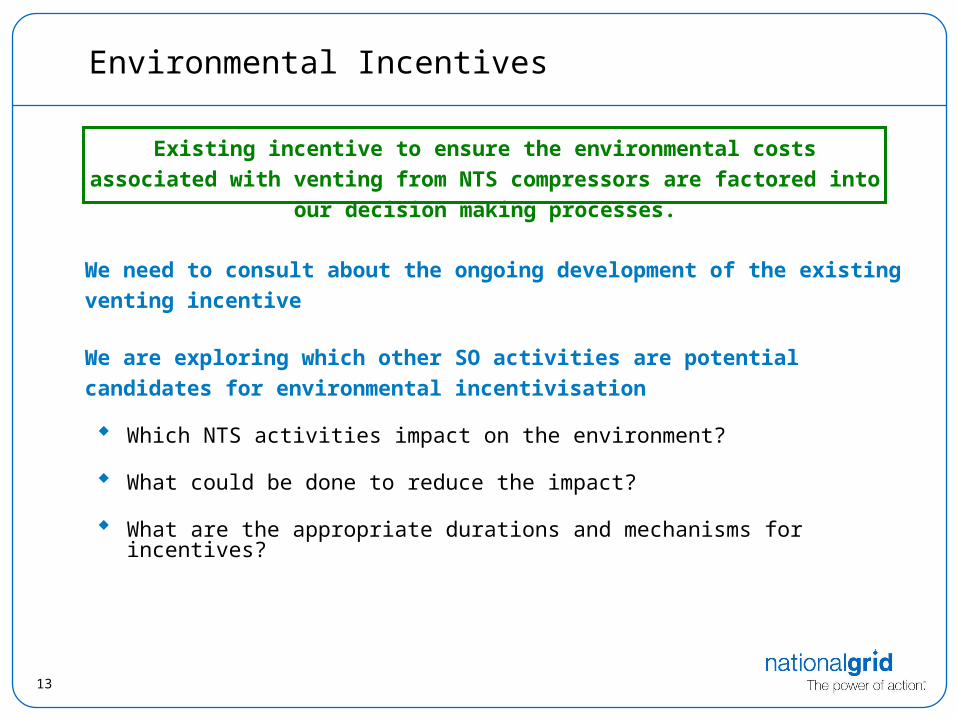
Existing incentive to ensure the environmental costs associated with venting
from NTS compressors are factored into our decision making processes.
We need to consult about the ongoing development of the existing venting
incentive
We are exploring which other SO activities are potential candidates for
environmental incentivisation
Which NTS activities impact on the environment?
What could be done to reduce the impact?
What are the appropriate durations and mechanisms for incentives?

14
Residual Balancing
Last year the fundamental review considered the interaction between the two
components of the scheme
Changes were made to the incentive, designed to reduce the amount of times
National Grid entered the market
The new scheme has been operational since April 2009
Given the review last year and the limited data available on this year, we do not currently propose any changes
We are inviting comments/evidence on whether there is a need for further incremental change
National Grid is incentivised to bring the system to energy balance each day but with minimum residual balancing activity from the SO
(minimising the market influence of these actions)

15
Operating Margins (OM)
Currently OM service is provided by a range of storage and LNG importation
facilities
UNC Pre-emption rights over Regulated NG LNG Storage facilities at administered prices (approx 50% of the service)
Other facilities on commercial terms
Previous OM incentives have focussed on cost minimisation
National Grid procures Operating Marginsto meet the requirements of UNC and its Safety Case
to support pressures on the NTS during periods of operational stresses

16
Operating Margins (OM)
National Grid leading the OM contestability review
Seeking to attract new providers (including demand side and beach)
Incentive for 2009/10
Given uncertainty over tendered & regulated prices it was not possible to produce a robust forecast cost target for an incentive. Gas holding costs are therefore currently cost pass through (with Ofgem scrutiny)
Existing small utilisation scheme retained
Incentive for 2010/11
What are the options for reintroducing an incentive from April 2010?
We need to consider implications of ongoing contestability work
17
Demand Forecasting
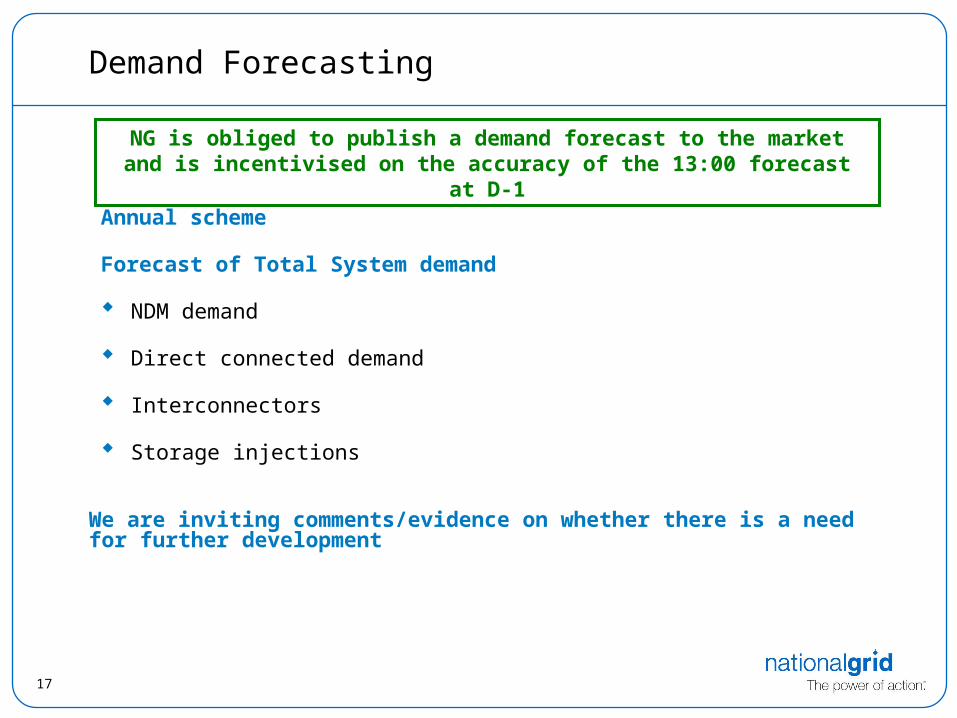
Annual scheme
Forecast of Total System demand
NDM demand
Direct connected demand
Interconnectors
Storage injections
We are inviting comments/evidence on whether there is a need for further development
NG is obliged to publish a demand forecast to the market and is incentivised on the accuracy of the 13:00 forecast at D-1

18
Data Publication
Measures are timeliness of data publication and availability of system for key data
items
Forecast flows onto the network (notified and physical)
Within day and D-1 Demand forecast
Predicted closing linepack
Some of last year’s responses suggested removing the incentive
We need to clarify if this information is still required
To the same levels of availability and timeliness?
NG is incentivised to maintain a standard of service in relation to the publication of some specific data items via our website

19
Network Flexibility
National Grid is currently working up its short, medium and long term plans
for considering network flexibility
Ofgem have indicated that they will issue a consultation in July 09
Depending on the outcome of these initiatives there maybe need to consider
incentives arrangements (if required)

20
How do I find out more?
Register to receive e-mail notifications
SO Incentives area of the National Grid website
www.nationalgrid.com/uk/Gas/soincentives/
www.nationalgrid.com/uk/electricity/soincentives/
Talk to us
[email protected] 01926 656337
[email protected] 01926 654909