Embed Size (px)
Citation preview
SNPs
• DNA differs between humans by 0.1%, (1 in 1300 bases)
• This means that you can map DNA variation to around 10,000,000 sites in the genome
• Almost all variation is ancient and 90% of SNP variation are constant across all populations
• These Single Nucleotide Polymorphisms (SNPs) can be correlated to human disease
• 1998 – 4,000 SNPs, 1994 – 7,800,000 nearly all mapped
Alzheimer's Disease
• Apolipoprotein E (ApoE) carries cholesterol and fat. It comes in three variants with two SNPs APoE2 (T-T), APoE3 (T-C), ApoE4 (C-C).
• In 1993, ApoE4 was correlated with 1/3 of the cases of Alzheimer’s disease
• If you have the E4 variant, you have a 60-70% lifetime risk of Alzheimer’s Disease
• Current research is focused on drug development that takes advantage of this knowledge
Haplotype Maps
• Although there are around 10,000,000 SNPs, they group into a small number of groups of SNPs that are correlated with each other.
• So, there are around around 300,000 unique arrangements of the SNPS
• This is not that big of a number!• CS people can imagine an exhaustive search
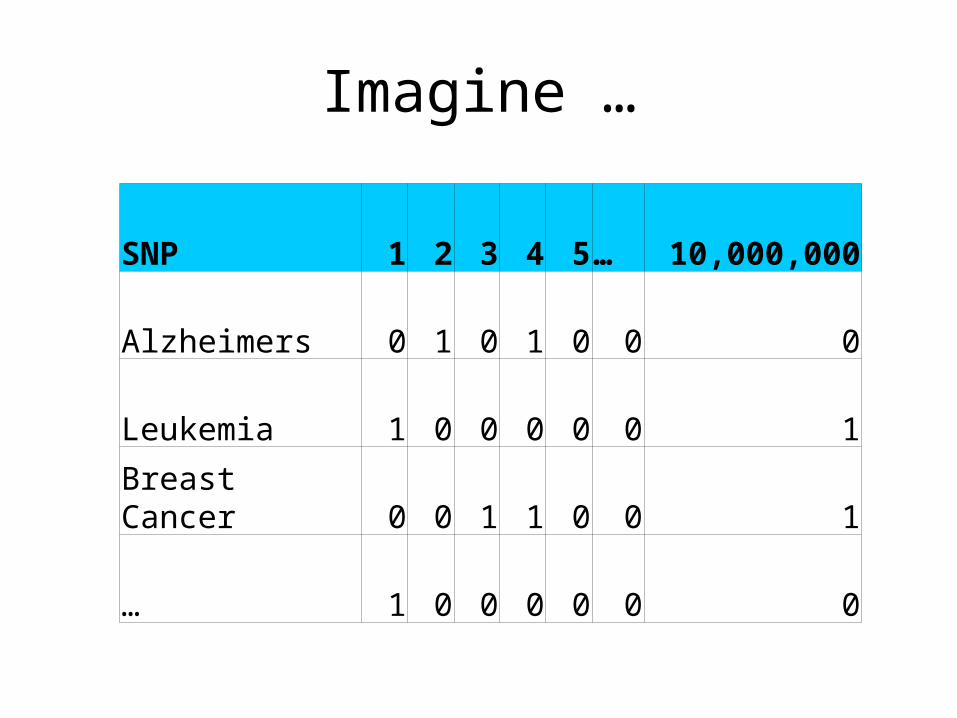
Imagine …
SNP 1 2 3 4 5… 10,000,000
Alzheimers 0 1 0 1 0 0 0
Leukemia 1 0 0 0 0 0 1
Breast Cancer 0 0 1 1 0 0 1
… 1 0 0 0 0 0 0
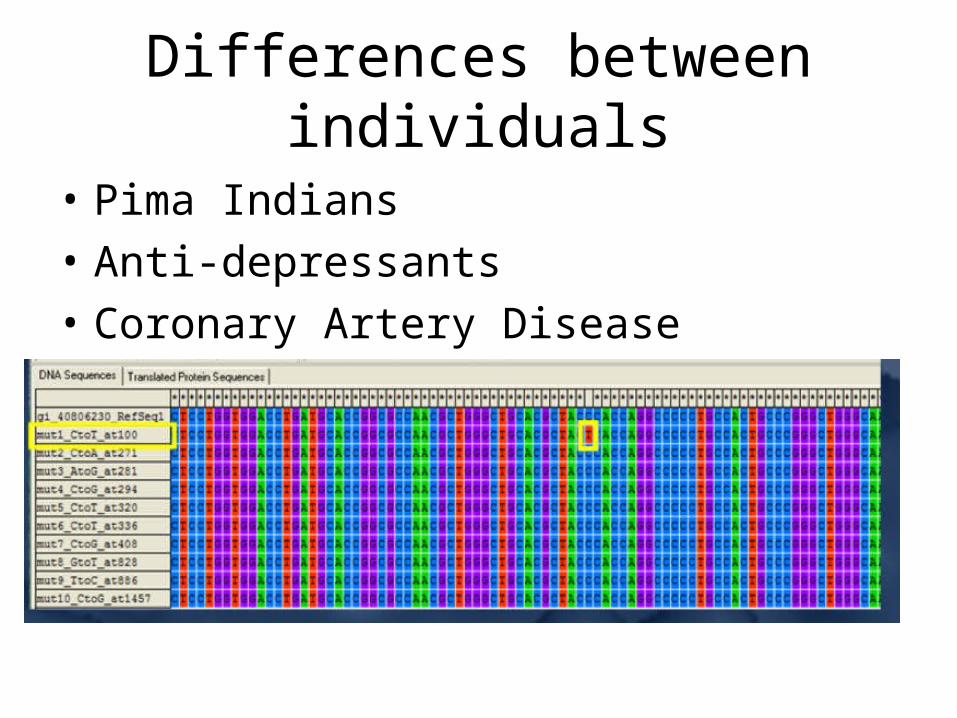
Differences between individuals
• Pima Indians• Anti-depressants• Coronary Artery Disease

Basic Concepts
A Ba b
A Ba b
High LD -> No Recombination(r2 = 1) SNP1 “tags” SNP2
A B
A B
A B
a b
a b
a b
Low LD -> RecombinationMany possibilities
A b
A ba Ba b
A BA B
a B
A b
etc…
A B
A B
X
OR
Parent 1 Parent 2
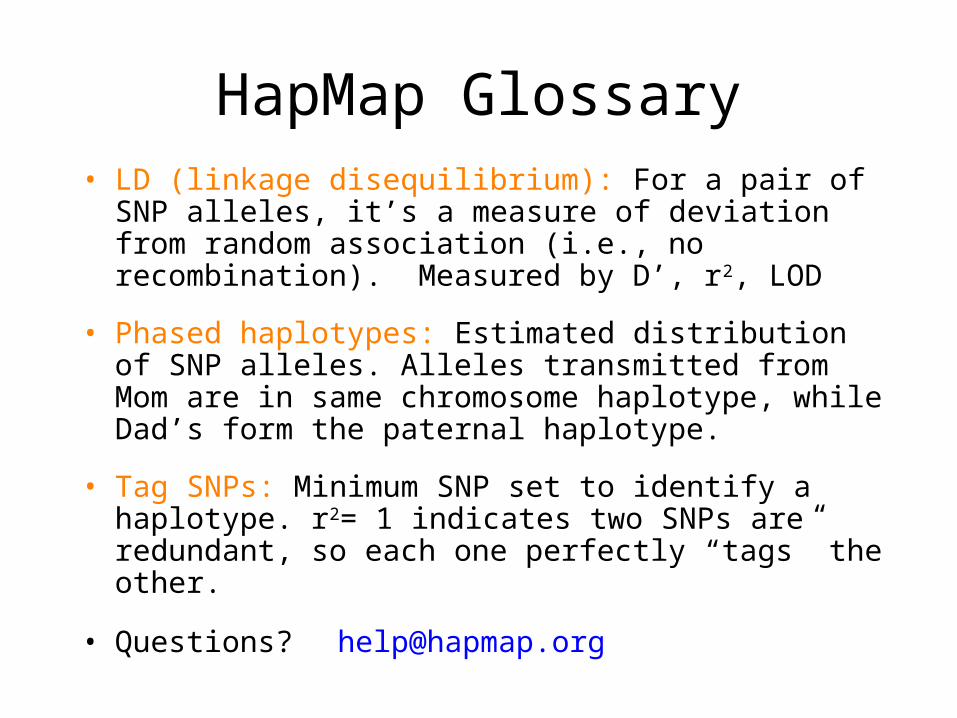
HapMap Glossary• LD (linkage disequilibrium): For a pair of SNP
alleles, it’s a measure of deviation from random association (i.e., no recombination). Measured by D’, r2, LOD
• Phased haplotypes: Estimated distribution of SNP alleles. Alleles transmitted from Mom are in same chromosome haplotype, while Dad’s form the paternal haplotype.
• Tag SNPs: Minimum SNP set to identify a haplotype. r2= 1 indicates two SNPs are redundant, so each one perfectly “tags” the other.
• Questions? [email protected]
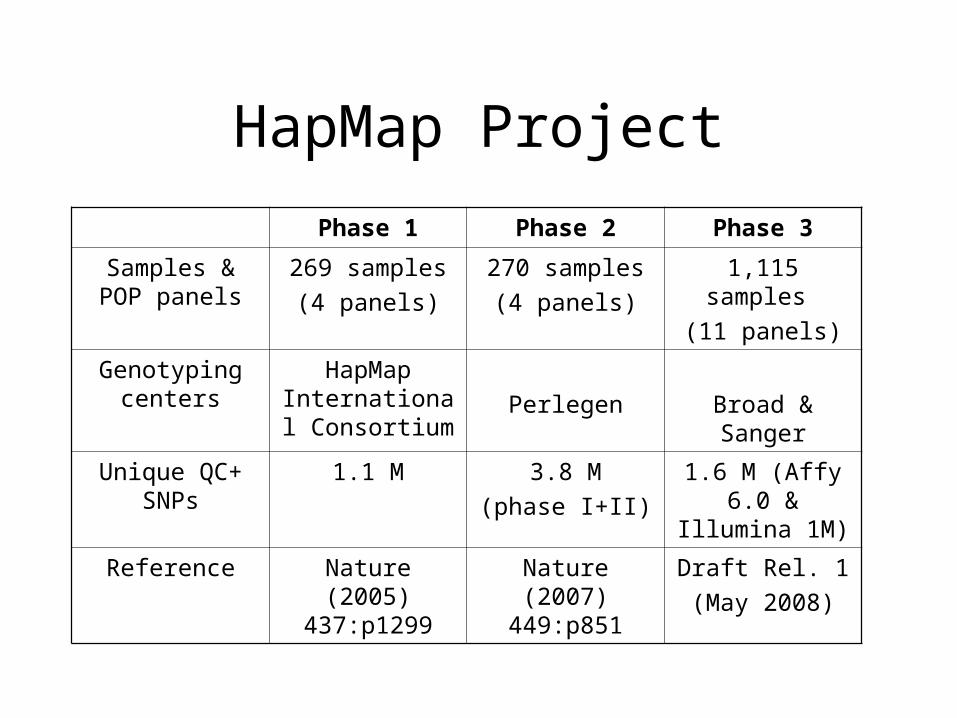
HapMap Project
Phase 1 Phase 2 Phase 3
Samples & POP panels
269 samples(4 panels)
270 samples(4 panels)
1,115 samples (11 panels)
Genotyping centers
HapMap International Consortium
Perlegen Broad & Sanger
Unique QC+ SNPs
1.1 M 3.8 M(phase I+II)
1.6 M (Affy 6.0 & Illumina 1M)
Reference Nature (2005) 437:p1299
Nature (2007) 449:p851
Draft Rel. 1 (May 2008)

Release Notes• Phase 1+2: Latest Release #24, October 2008
(NCBI build 36):
3.9 M unique QC+ SNPs -- > 1 SNP/700 bp
http://ftp.hapmap.org/00README.releasenotes_rel24
– Added back chrX SNPs dropped in previous releases– Corrected allele flips from rel#23a
• Phase 3: Draft release #1 (NCBI build 36)
http://ftp.hapmap.org/genotypes/2008-07_phaseIII/00README.txt
– HapMap3 sites @ Broad Institute, Sanger Center and Baylor College

Phase 3 Sampleslabel population sample # samples QC+ Draft 1ASW* African ancestry in Southwest USA 90 71
CEU*Utah residents with Northern and Western
European ancestry from the CEPH collection180 162
CHB Han Chinese in Beijing, China 90 82CHD Chinese in Metropolitan Denver, Colorado 100 70GIH Gujarati Indians in Houston, Texas 100 83JPT Japanese in Tokyo, Japan 91 82LWK Luhya in Webuye, Kenya 100 83MEX* Mexican ancestry in Los Angeles, California 90 71MKK* Maasai in Kinyawa, Kenya 180 171TSI Toscans in Italy 100 77
YRI* Yoruba in Ibadan, Nigeria 180 1631,301 1,115
* Population is made of family trios

1: Surf to the HapMap Browser
1b. Select “HapMap phase
3”
1a. Go to www.hapmap.o
rg
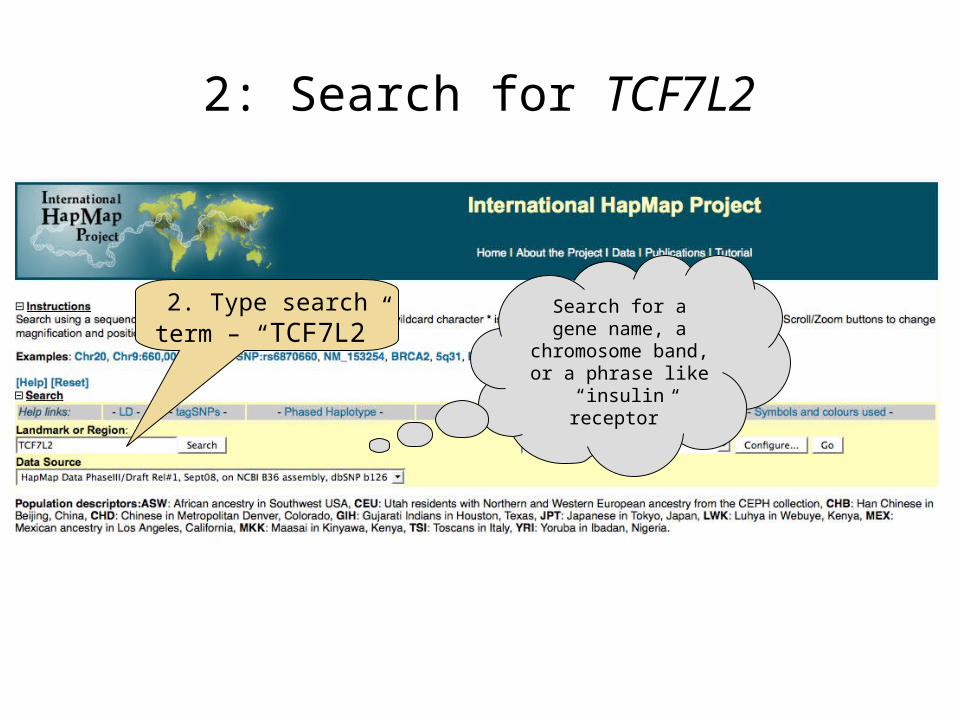
2: Search for TCF7L2
2. Type search term – “TCF7L2”
Search for a gene name, a
chromosome band, or a phrase like
“insulin receptor”
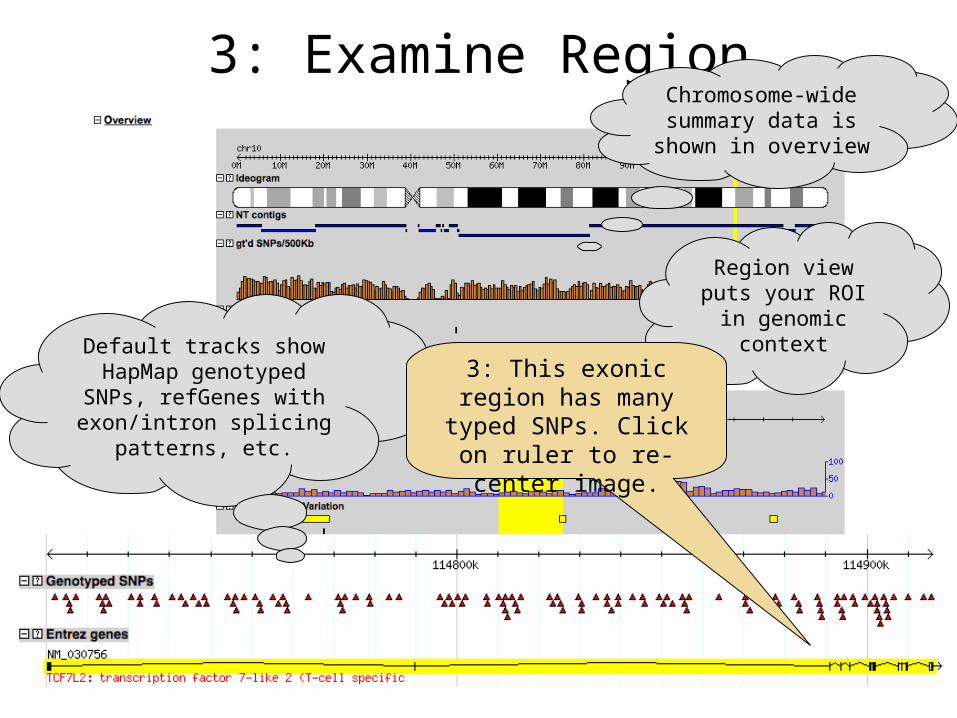
3: Examine Region
Region view puts your ROI in
genomic context
Chromosome-wide summary data is
shown in overview
Default tracks show HapMap genotyped SNPs, refGenes with exon/intron splicing
patterns, etc.
3: This exonic region has many typed SNPs.
Click on ruler to re-center image.

3: Examine Region (cont)
As you zoom in further, the
display changes to include more
detail
Use the Scroll/Zoom
buttons and menu to change position &
magnification
3: Mouse over a SNP to see allele frequency
table
Click to go to SNP details page
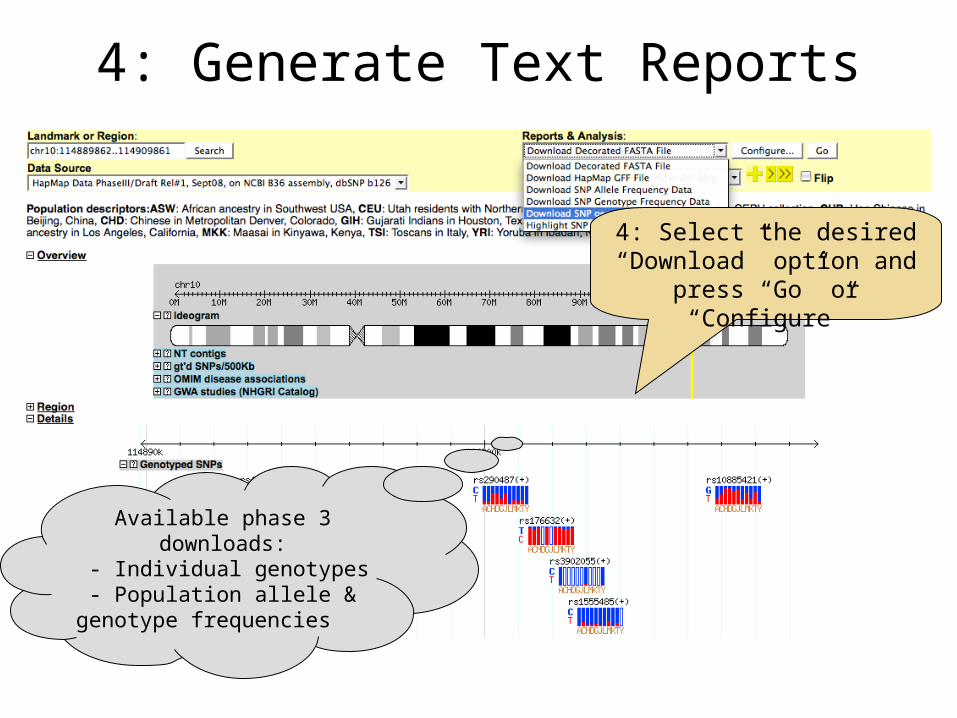
4: Generate Text Reports
4: Select the desired “Download” option and
press “Go” or “Configure”
Available phase 3 downloads:
- Individual genotypes - Population allele & genotype frequencies
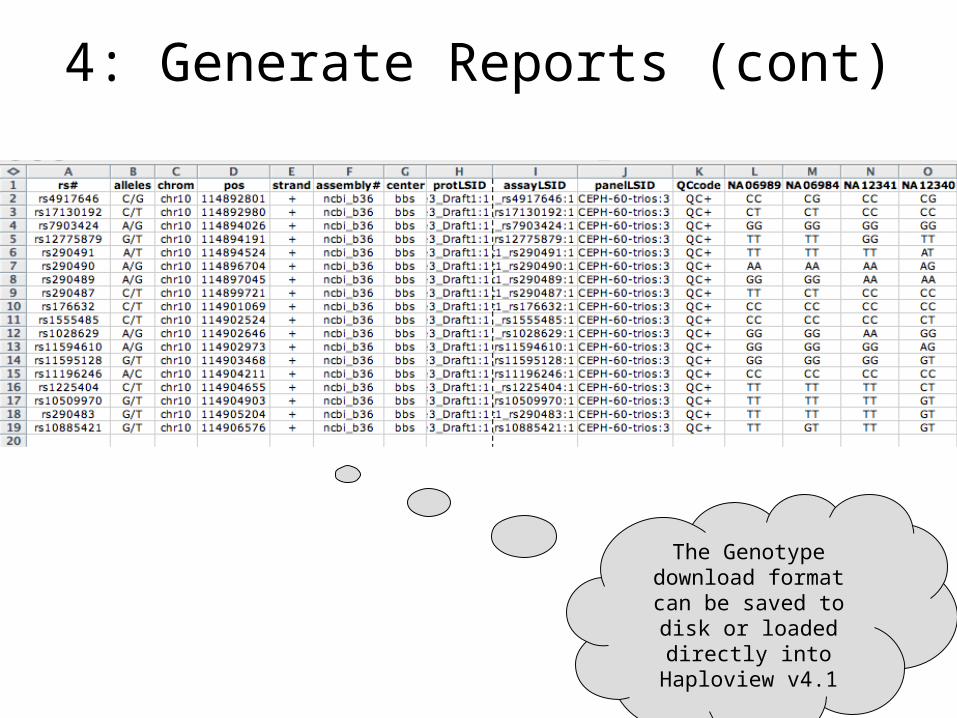
4: Generate Reports (cont)
The Genotype download format can be saved to disk or loaded directly into
Haploview v4.1
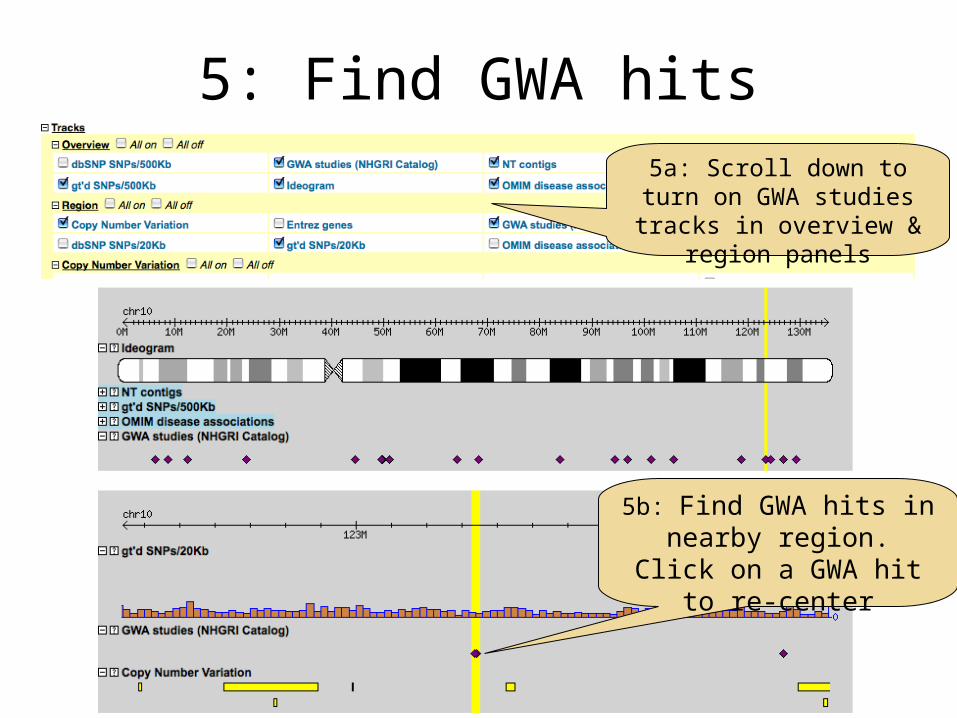
5: Find GWA hits5a: Scroll down to turn on GWA studies tracks in overview & region
panels
5b: Find GWA hits in nearby region. Click on a GWA hit to re-center
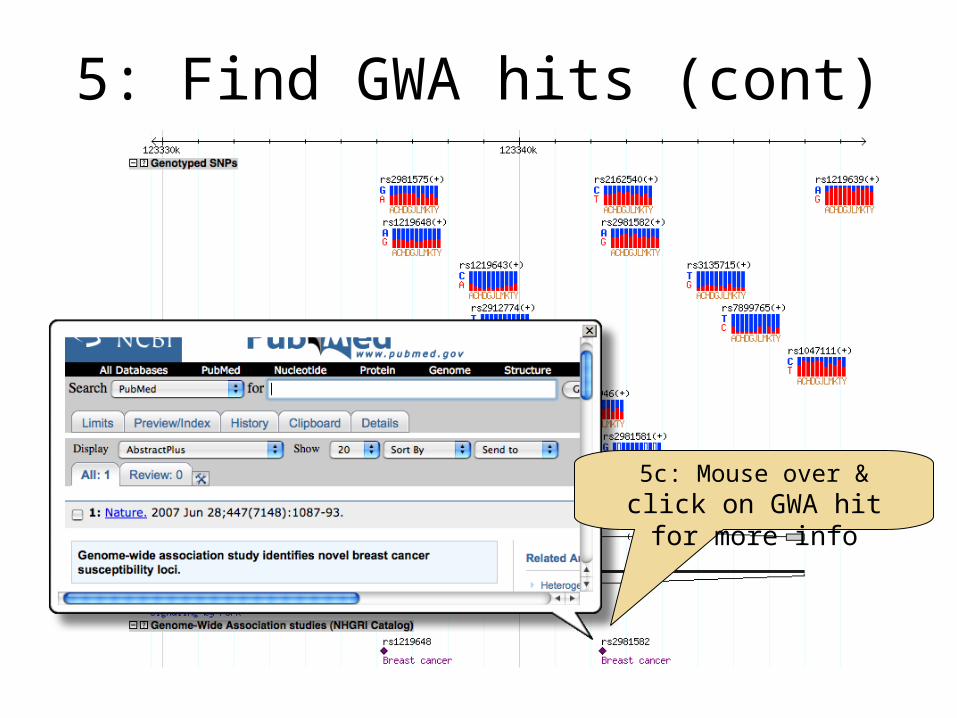
5: Find GWA hits (cont)
5c: Mouse over & click on GWA hit for more
info
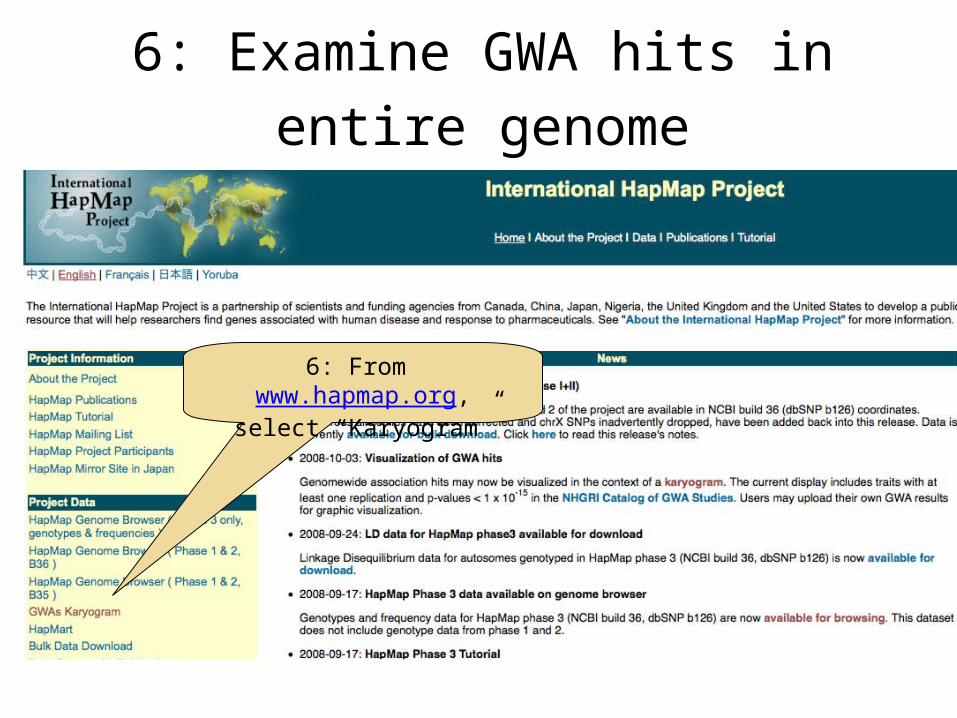
6: Examine GWA hits in entire genome
6: From www.hapmap.org, select “Karyogram”
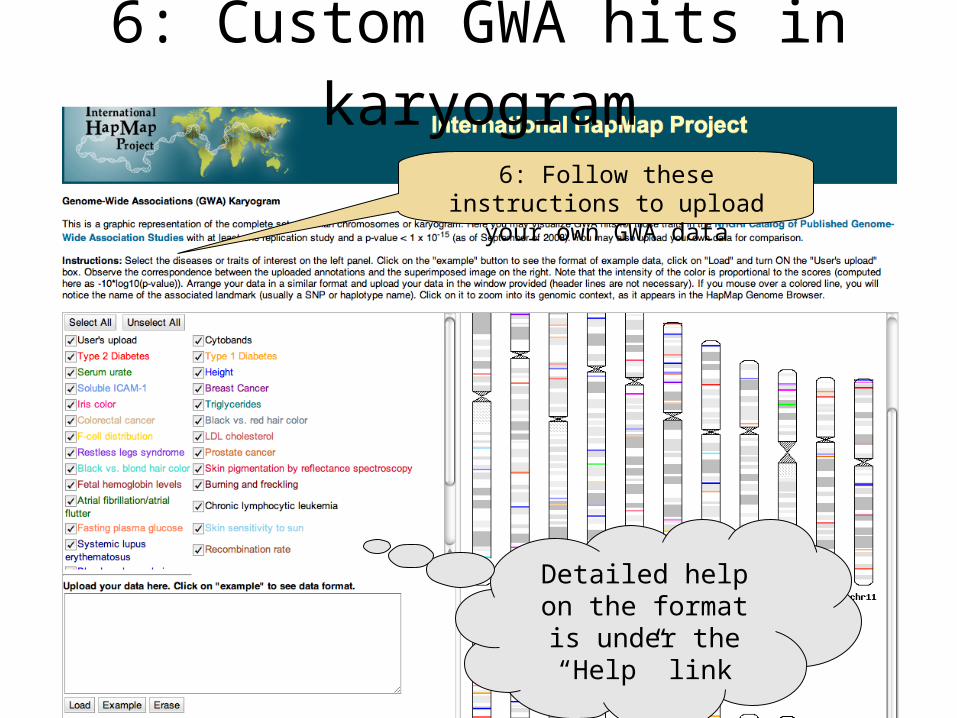
6: Custom GWA hits in karyogram
Detailed help on the format is
under the “Help” link
6: Follow these instructions to upload your own GWA data
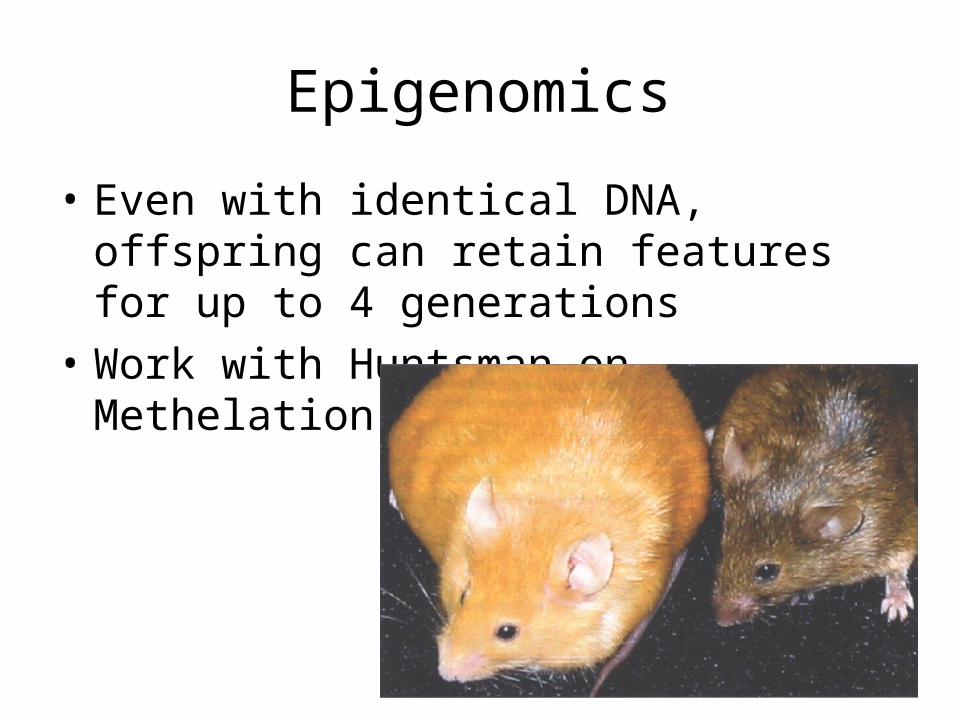
Epigenomics
• Even with identical DNA, offspring can retain features for up to 4 generations
• Work with Huntsman on Methelation
Progress in Disease Treatment
• Personalized medicine is becoming more prevalent for several kinds of cancer treatment
• 10-Feb-2009 – Breast Bioclassifier developed at the Huntsman Cancer Institute– 1/8 women will be diagnosed with breast cancer– Microarray analysis can separate large group who
need no treatment– Savings in cost and lifestyle– With $100 human genomes, doctors can determine
which drugs will be effective for your genotype
![Analysis of artificially degraded DNA using STRs and SNPs ...degraded DNA [3–11]. There are two kinds of markers that can bring the size of the amplicon substantially below 150](https://img.pdfslide.us/doc/110x75/611b6405ccc59210d9068592/analysis-of-artiicially-degraded-dna-using-strs-and-snps-degraded-dna-3a11.jpg)