Embed Size (px)
Citation preview
Snowdon & Associates Inc.
Shifts in Income Sources and the Impact on Internal Resource Allocation Policies
CAUBO Conference “Adjusting the Sails”Halifax, June 21-24
Ken SnowdonHigher Education Consultant

Snowdon & Associates Inc.
Outline
Changing fiscal environment - revenue changes
Characteristics of revenue change and implications
Responses to the changing fiscal environment
Resource Allocation ModelsLessons…….
Snowdon & Associates Inc.
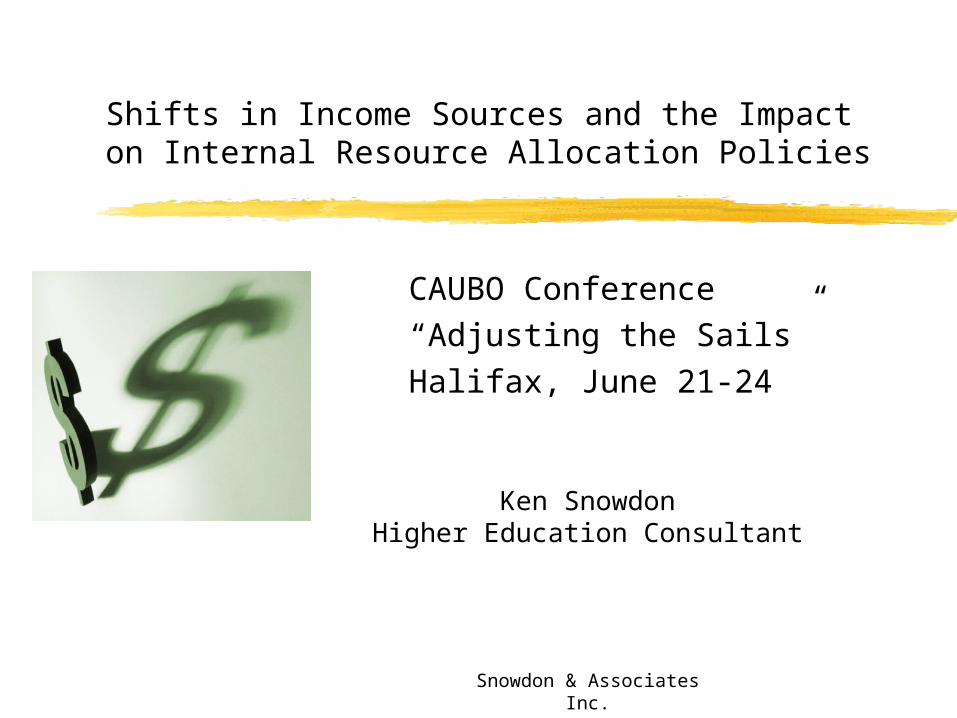
Revenue Changes - operating ($000’s)
Operating Fund OnlyRevenue By Source (Selected Universities)*
Indexed1980-81 1990-91 2000-01 Change
Provincial Grants 1,151,592$ 2,179,145$ 2,183,275$ 1.9
Credit Fees 146,153$ 372,226$ 941,771$ 6.4Non-Credit 14,705$ 53,176$ 79,712$ 5.4Miscellaneous Fees 13,382$ 42,891$ 139,035$ 10.4Total Fees 174,240$ 468,293$ 1,160,518$ 6.7
Federal Grants 465$ 1,562$ 1,461$ 3.1Municipal 128$ 16$ 15$ 0.1Foreign Grants 1114 153 419Donations 6,888$ 11,921$ 28,545$ 4.1Sales of Services 144,810$ -Investment Income 26,907$ 57,723$ 128,391$ 4.8Miscellaneous Income 3,376$ 26,942$ 66,892$ 19.8Interfund Tsf 8,795$ Grand Total 1,373,505$ 2,745,755$ 3,714,326$ 2.7
All-Items CPI 1992=100 58.9 98.5 116.4 2.0
Full-time enrolment 173,900 212,700 236,200 1.4
Source: CAUBO Financial Statistics, various years*Alberta, Laval, McGill, McMaster, Montreal, Queen's, Toronto, UBC, Western, Waterloo
Snowdon & Associates Inc.
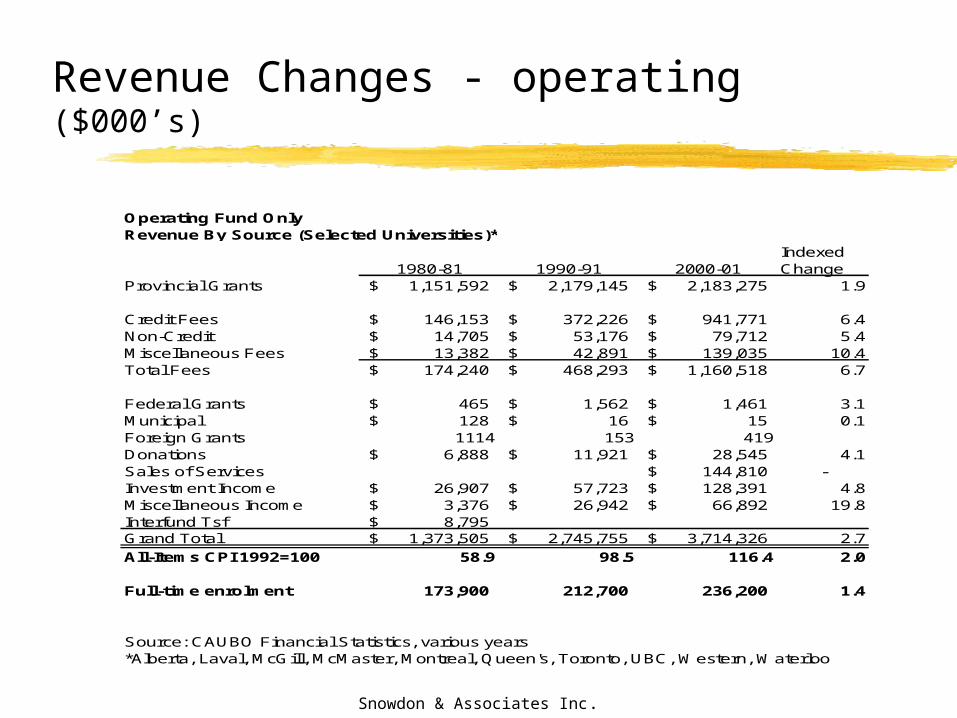
Indexed Change
Indexed Change in Operating Revenue by Type 1980-81 to to 2000-01
0.0 1.0 2.0 3.0 4.0 5.0 6.0 7.0
Provincial Grants
Total Fees
Federal Grants
Donations
Investment Income
Grand Total
All-Items CPI 1992=100
FT Enrolment
Index
Snowdon & Associates Inc.
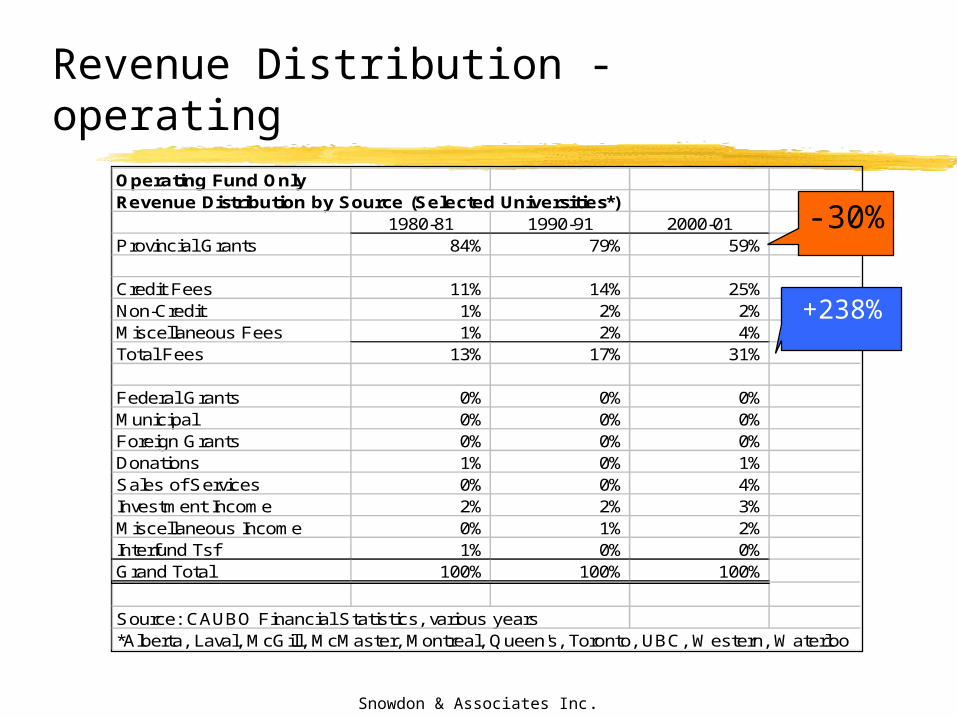
Revenue Distribution - operatingOperating Fund OnlyRevenue Distribution by Source (Selected Universities*)
1980-81 1990-91 2000-01Provincial Grants 84% 79% 59%
Credit Fees 11% 14% 25%Non-Credit 1% 2% 2%Miscellaneous Fees 1% 2% 4%Total Fees 13% 17% 31%
Federal Grants 0% 0% 0%Municipal 0% 0% 0%Foreign Grants 0% 0% 0%Donations 1% 0% 1%Sales of Services 0% 0% 4%Investment Income 2% 2% 3%Miscellaneous Income 0% 1% 2%Interfund Tsf 1% 0% 0%Grand Total 100% 100% 100%
Source: CAUBO Financial Statistics, various years*Alberta, Laval, McGill, McMaster, Montreal, Queen's, Toronto, UBC, Western, Waterloo
-30%
+238%
Snowdon & Associates Inc.
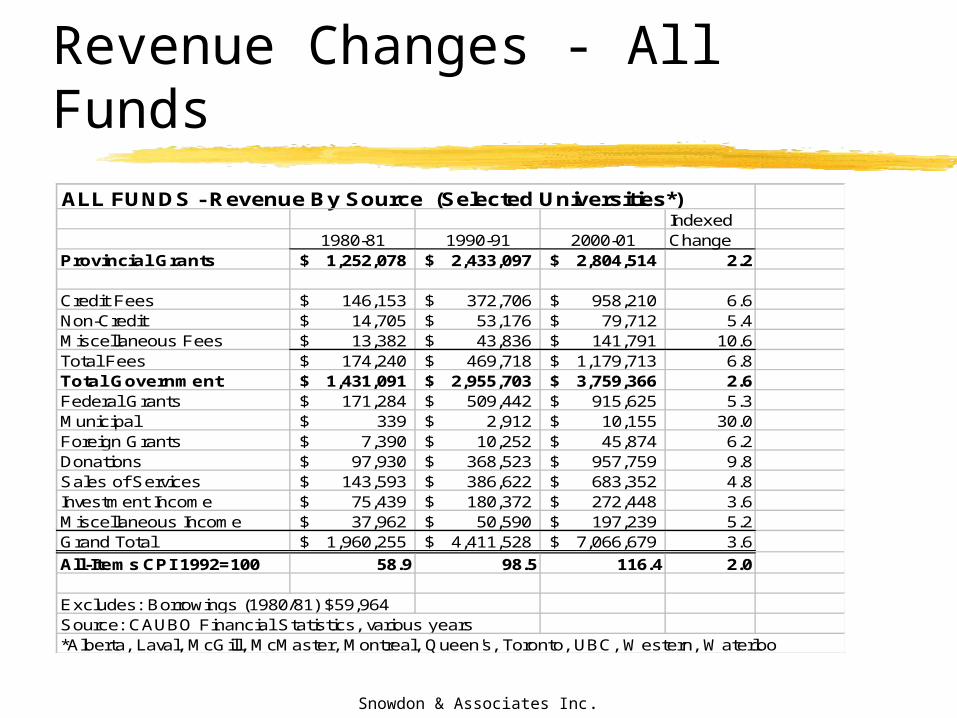
Revenue Changes - All FundsALL FUNDS - Revenue By Source (Selected Universities*)
Indexed1980-81 1990-91 2000-01 Change
Provincial Grants 1,252,078$ 2,433,097$ 2,804,514$ 2.2
Credit Fees 146,153$ 372,706$ 958,210$ 6.6Non-Credit 14,705$ 53,176$ 79,712$ 5.4Miscellaneous Fees 13,382$ 43,836$ 141,791$ 10.6Total Fees 174,240$ 469,718$ 1,179,713$ 6.8Total Government 1,431,091$ 2,955,703$ 3,759,366$ 2.6Federal Grants 171,284$ 509,442$ 915,625$ 5.3Municipal 339$ 2,912$ 10,155$ 30.0Foreign Grants 7,390$ 10,252$ 45,874$ 6.2Donations 97,930$ 368,523$ 957,759$ 9.8Sales of Services 143,593$ 386,622$ 683,352$ 4.8Investment Income 75,439$ 180,372$ 272,448$ 3.6Miscellaneous Income 37,962$ 50,590$ 197,239$ 5.2Grand Total 1,960,255$ 4,411,528$ 7,066,679$ 3.6
All-Items CPI 1992=100 58.9 98.5 116.4 2.0
Excludes: Borrowings (1980/81) $59,964Source: CAUBO Financial Statistics, various years*Alberta, Laval, McGill, McMaster, Montreal, Queen's, Toronto, UBC, Western, Waterloo
Snowdon & Associates Inc.
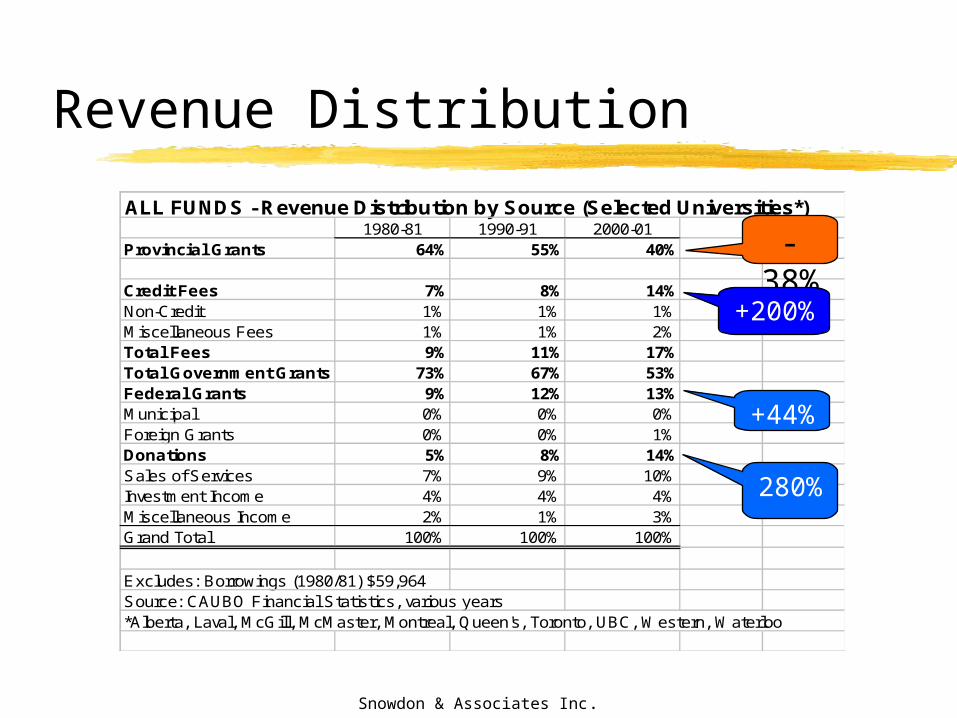
Revenue Distribution
ALL FUNDS - Revenue Distribution by Source (Selected Universities*)1980-81 1990-91 2000-01
Provincial Grants 64% 55% 40%
Credit Fees 7% 8% 14%Non-Credit 1% 1% 1%Miscellaneous Fees 1% 1% 2%Total Fees 9% 11% 17%Total Government Grants 73% 67% 53%Federal Grants 9% 12% 13%Municipal 0% 0% 0%Foreign Grants 0% 0% 1%Donations 5% 8% 14%Sales of Services 7% 9% 10%Investment Income 4% 4% 4%Miscellaneous Income 2% 1% 3%Grand Total 100% 100% 100%
Excludes: Borrowings (1980/81) $59,964Source: CAUBO Financial Statistics, various years*Alberta, Laval, McGill, McMaster, Montreal, Queen's, Toronto, UBC, Western, Waterloo
-38%
+200%
+44%
280%
Snowdon & Associates Inc.
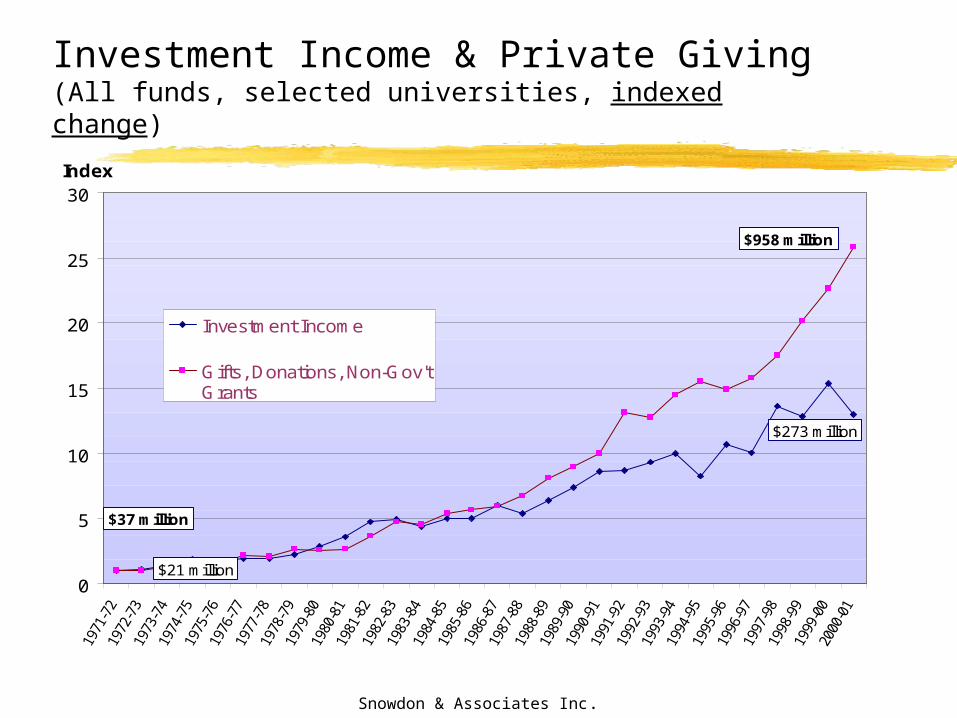
Investment Income & Private Giving (All funds, selected universities, indexed change)
0
5
10
15
20
25
30Index
Investment Income
Gifts, Donations, Non-Gov'tGrants
$273 million
$958 million
$37 million
$21 million
Snowdon & Associates Inc.
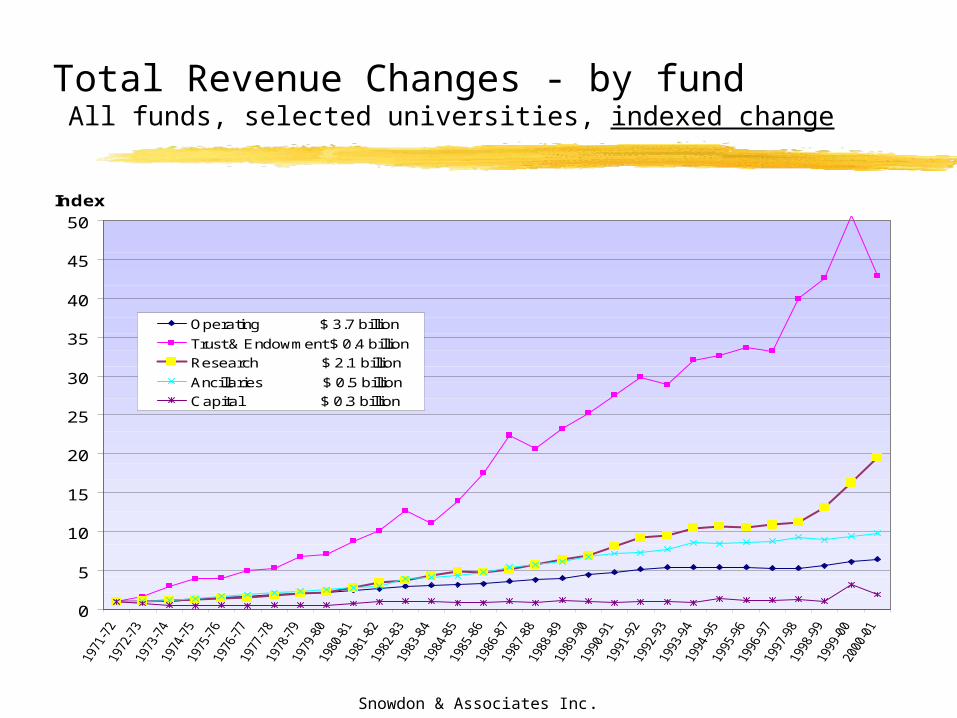
Total Revenue Changes - by fund All funds, selected universities, indexed change
0
5
10
15
20
25
30
35
40
45
50
Index
Operating $ 3.7 billion
Trust & Endowment $ 0.4 billion
Research $ 2.1 billion
Ancillaries $ 0.5 billion
Capital $ 0.3 billion
Snowdon & Associates Inc.
Characteristics of Funding Changes
External restrictions - earmarked funds Sometimes ‘matching’ requirements Workload - tuition policy, student assistance, research, private giving,
earmarked grants, preparing proposals, regulations, accountability, stewardship,….
Complexity - linking various sources of income Uneven in terms of campus impacts (ie. de-regulated fees,
research, private giving) Sometimes leads to costs in other areas - research (indirect costs),
capital (operating costs), subsidizaton of enrolment expansion in certain programs, student assistance with fee increases
Snowdon & Associates Inc.
Financial Planning Issues
Cash management / investment strategy trying to be ‘transparent’ with increasing complex array of
funding sources financial planning in a more complex environment recognizing ‘real costs’ of new ventures and opportunity costs internal resource allocation - budget subsidies and subsidization mechanisms links to academic planning, fund-raising, capital planning

Snowdon & Associates Inc.
Responding to a changing fiscal environment
Snowdon & Associates Inc.
Birnbaum’s review of Management Fads
Ur- management (line item budgets, enrolment planning)
PPBS, Program Planning Budgeting System MBO, Management By Objectives ZBB, Zero Based Budgeting Strategic Planning Benchmarking TQM/CQI, Total Quality Management / Continual Quality Improvement
BPR, Business Process Re-engineering RCM, Responsibility Centred Management
etc., etc., etc., …
Snowdon & Associates Inc.
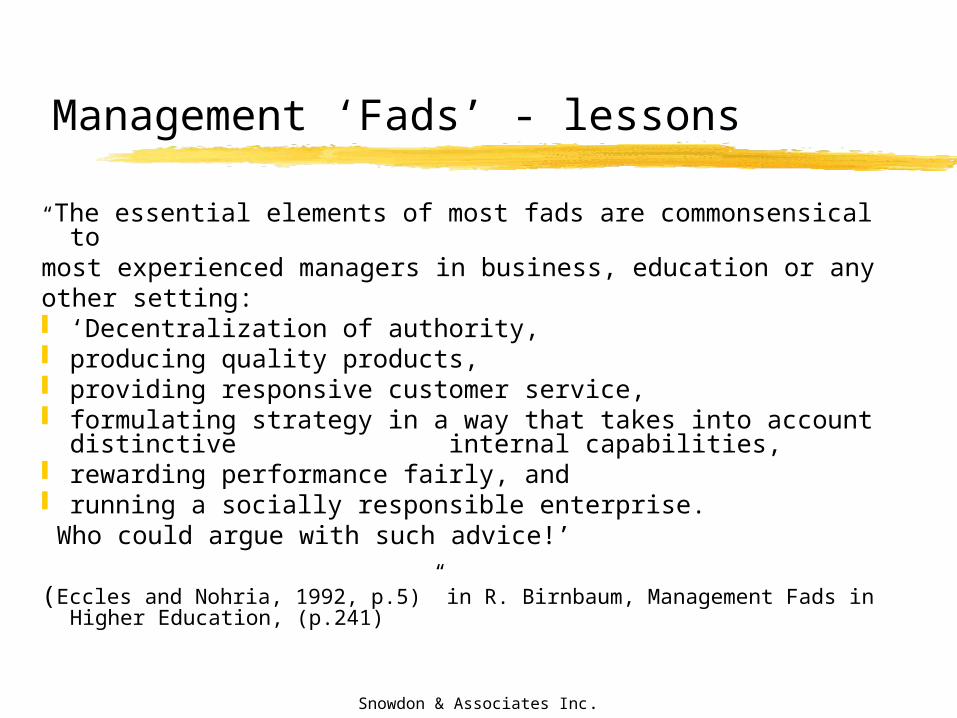
Management ‘Fads’ - lessons
“The essential elements of most fads are commonsensical to most experienced managers in business, education or any other setting: ‘Decentralization of authority, producing quality products, providing responsive customer service, formulating strategy in a way that takes into account distinctive
internal capabilities, rewarding performance fairly, and running a socially responsible enterprise. Who could argue with such advice!’
(Eccles and Nohria, 1992, p.5)” in R. Birnbaum, Management Fads in Higher Education, (p.241)
Snowdon & Associates Inc.
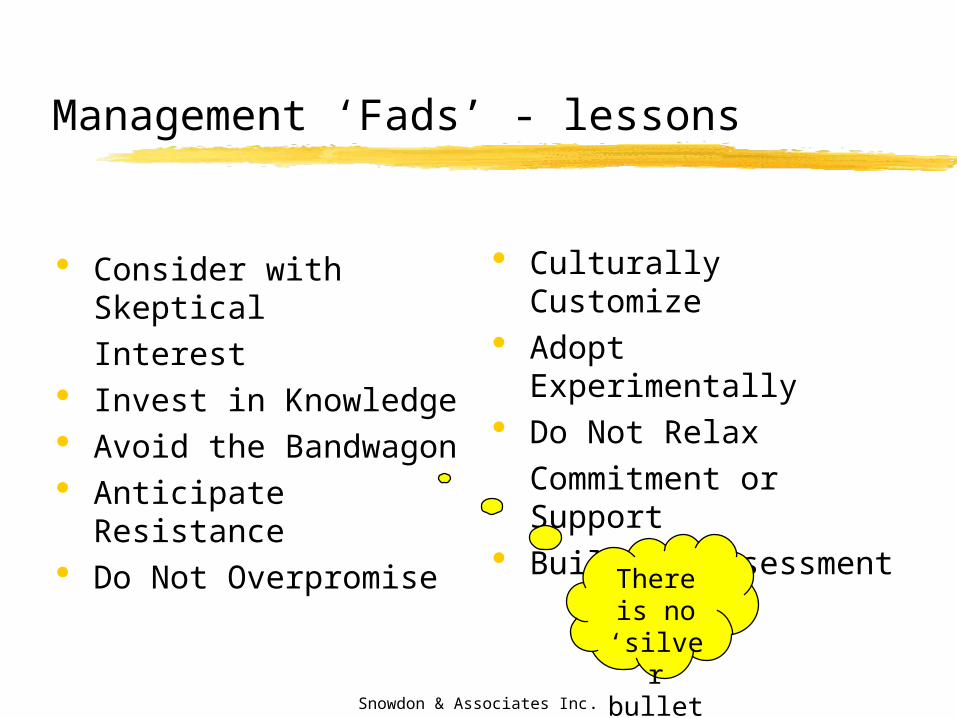
Management ‘Fads’ - lessons
Consider with Skeptical Interest
Invest in Knowledge Avoid the Bandwagon Anticipate Resistance Do Not Overpromise
Culturally Customize Adopt Experimentally Do Not Relax
Commitment or Support
Build in Assessment
There is no ‘silver
bullet’
Snowdon & Associates Inc.
Management ‘Fads’ - lessons
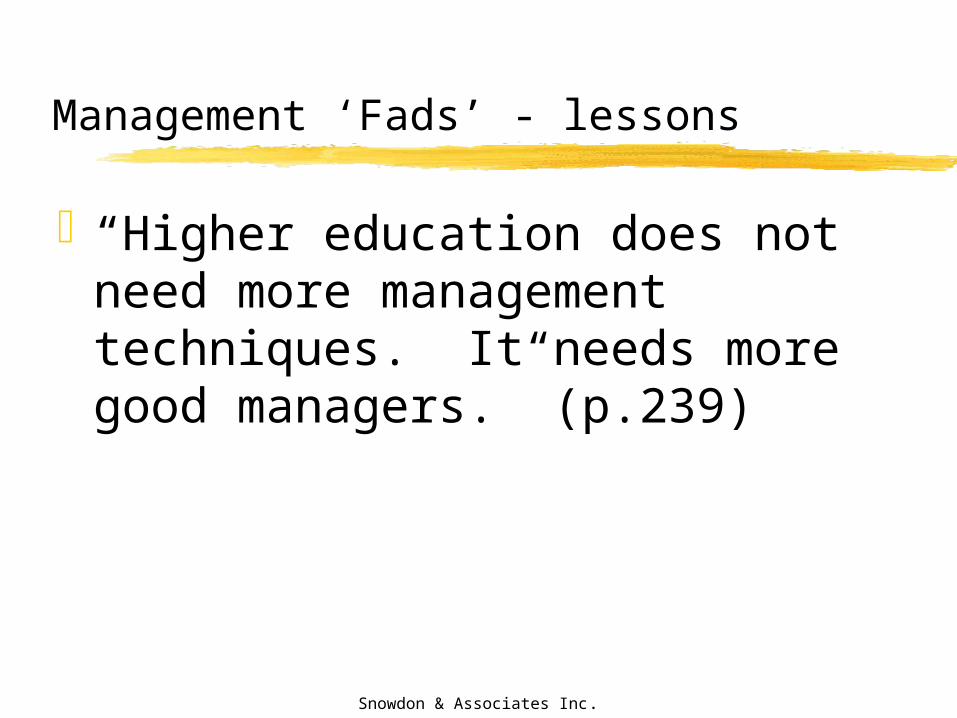
“Higher education does not need more management techniques. It needs more good managers.” (p.239)
Snowdon & Associates Inc.
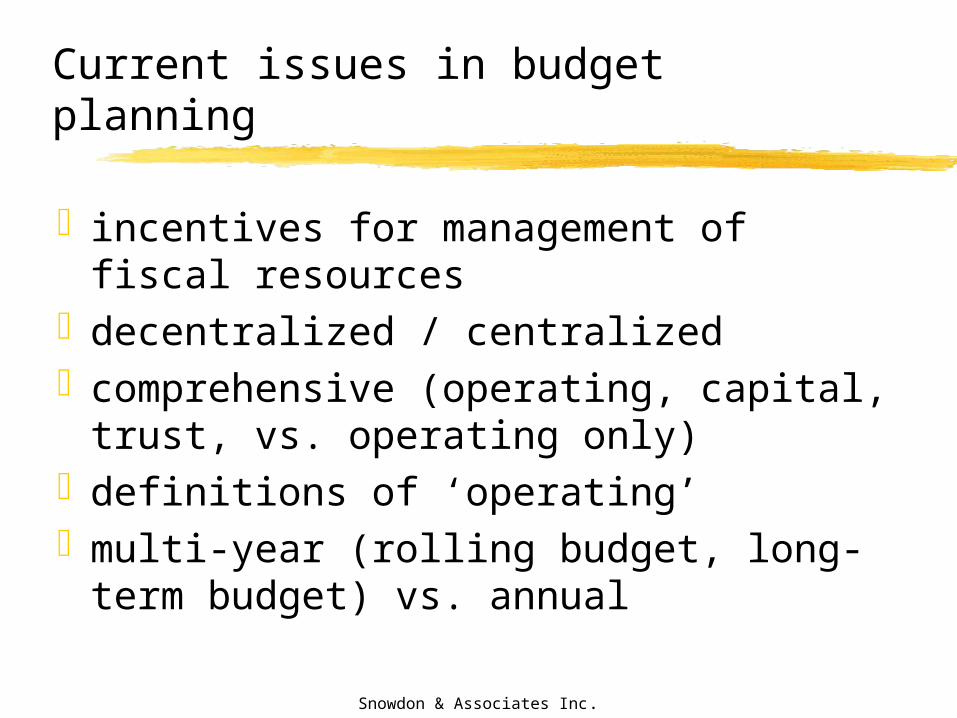
Current issues in budget planning
incentives for management of fiscal resourcesdecentralized / centralizedcomprehensive (operating, capital, trust, vs.
operating only)definitions of ‘operating’multi-year (rolling budget, long-term budget)
vs. annual
Snowdon & Associates Inc.
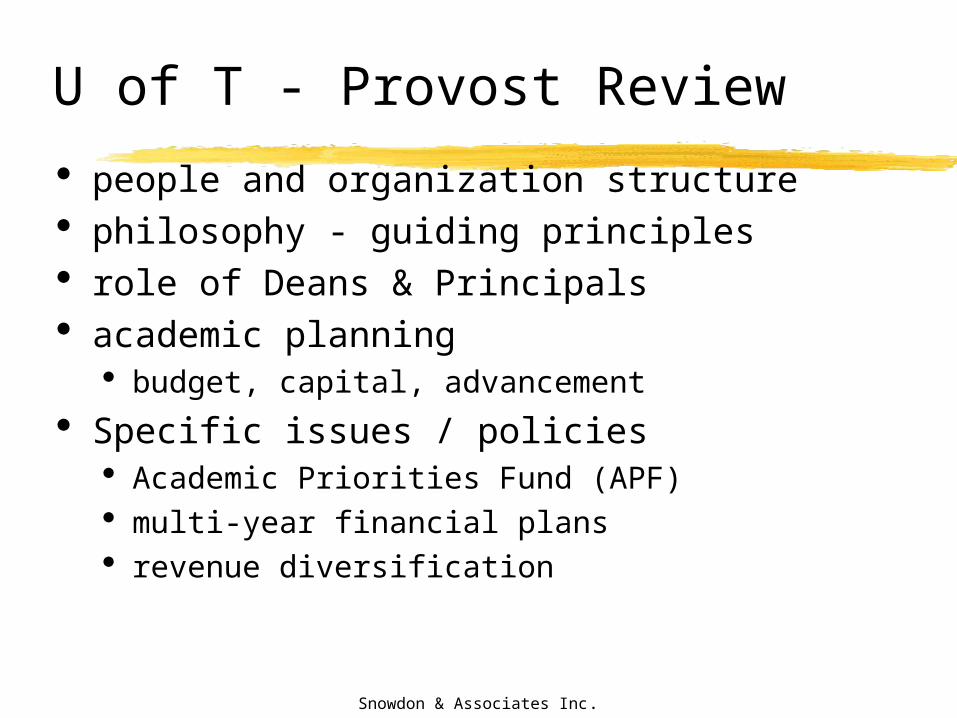
U of T - Provost Review
people and organization structure philosophy - guiding principles role of Deans & Principals academic planning
budget, capital, advancement
Specific issues / policies Academic Priorities Fund (APF) multi-year financial plans revenue diversification
Snowdon & Associates Inc.
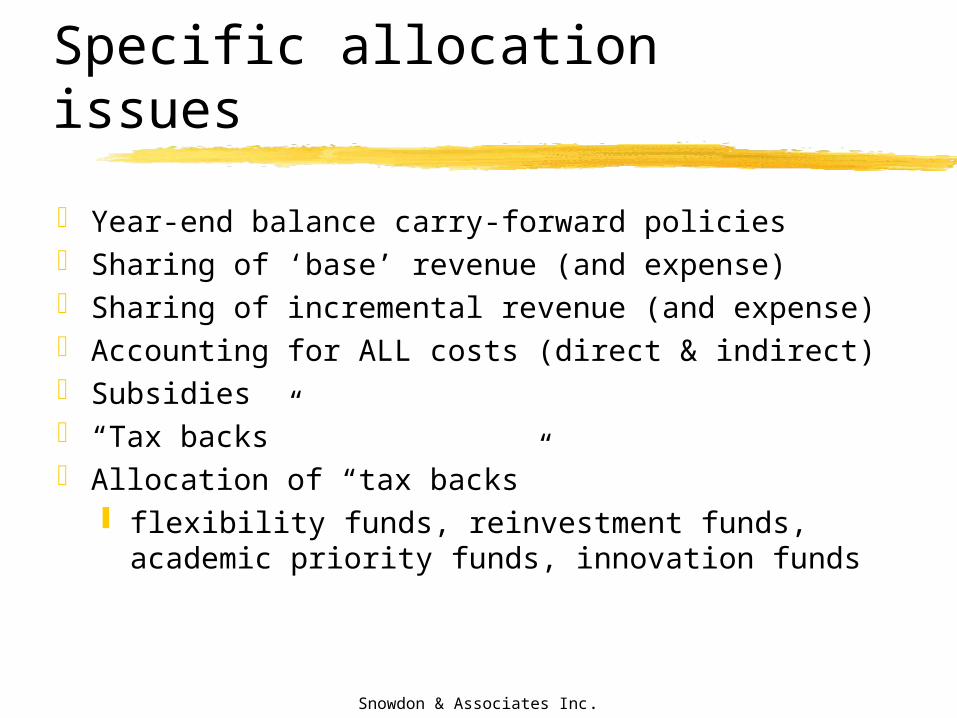
Specific allocation issues
Year-end balance carry-forward policies Sharing of ‘base’ revenue (and expense) Sharing of incremental revenue (and expense) Accounting for ALL costs (direct & indirect) Subsidies “Tax backs” Allocation of “tax backs”
flexibility funds, reinvestment funds, academic priority funds, innovation funds
Snowdon & Associates Inc.
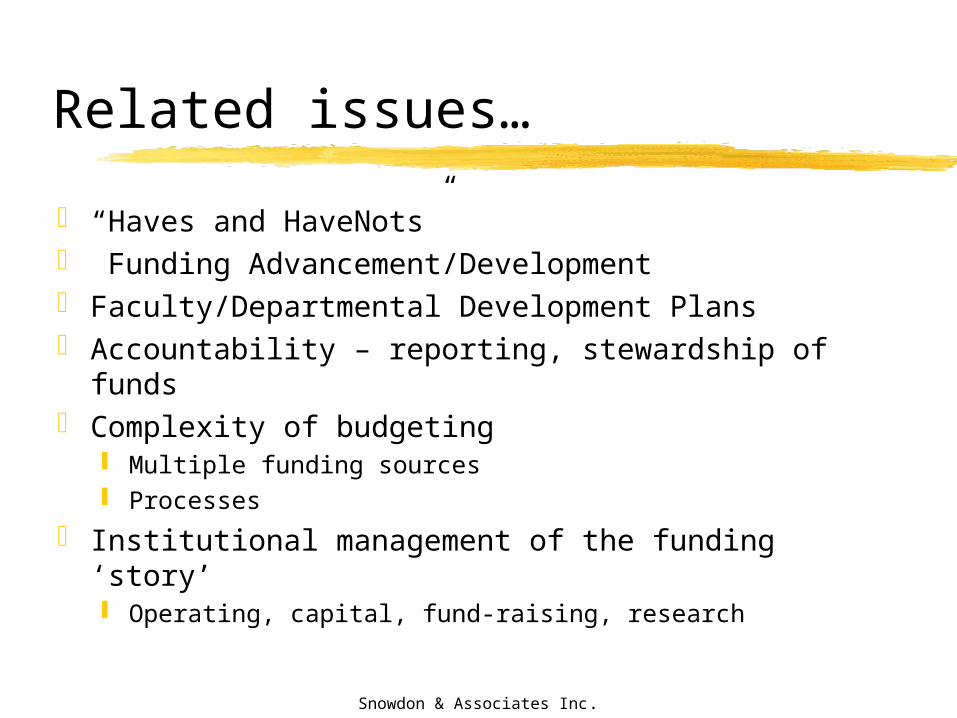
Related issues…
“Haves and HaveNots” Funding Advancement/Development Faculty/Departmental Development Plans Accountability – reporting, stewardship of funds Complexity of budgeting
Multiple funding sources Processes
Institutional management of the funding ‘story’ Operating, capital, fund-raising, research
Snowdon & Associates Inc.
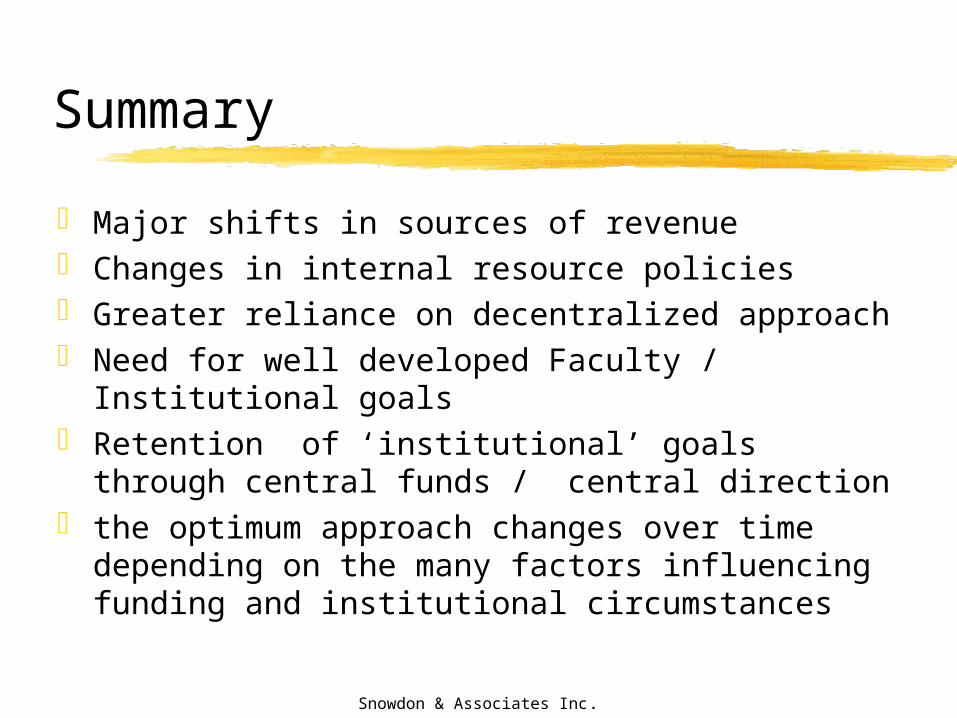
Summary
Major shifts in sources of revenue Changes in internal resource policies Greater reliance on decentralized approach Need for well developed Faculty / Institutional goals Retention of ‘institutional’ goals through central funds /
central direction the optimum approach changes over time depending on the
many factors influencing funding and institutional circumstances

Snowdon & Associates Inc.
Lessons…
There is No ‘silver bullet’….But, there some key characteristics of well developed
approaches Institutional Plan with objectives Multi-year fiscal plan Balance between ‘centralization vs. de-centralization’ Measurement indicators Public accountability