Embed Size (px)
Citation preview
Snooping on Mobile Phones: Prevalence and Trends
Diogo Marques,1 Ildar Muslukhov,2 Tiago Guerreiro,1 Konstantin Beznosov2 and Luís Carriço1
1 LaSIGE, Faculdade de Ciências 2 Department of Electrical and Computer EngineeringUniversidade de Lisboa, Lisbon, Portugal University of British Columbia, Vancouver, Canada[dmarques, tjvg, lmc]@di.fc.ul.pt [ildarm, beznosov]@ece.ubc.ca
ABSTRACTPersonal mobile devices keep private information which peopleother than the owner may try to access. Thus far, it has been un-clear how common it is for people to snoop on one another’s de-vices. Through an anonymity-preserving survey experiment, wequantify the pervasiveness of snooping attacks, defined as "look-ing through someone else’s phone without their permission." Weestimated the 1-year prevalence to be 31% in an online participantpool. Weighted to the U.S. population, the data indicates that 1 in5 adults snooped on at least one other person’s phone, just in theyear before the survey was conducted. We found snooping attacksto be especially prevalent among young people, and among thosewho are themselves smartphone users. In a follow-up study, wefound that, among smartphone users, depth of adoption, like age,also predicts the probability of engaging in snooping attacks. Inparticular, the more people use their devices for personal purposes,the more likely they are to snoop on others, possibly because theybecome aware of the sensitive information that is kept, and howto access it. These findings suggest that, all else remaining equal,the prevalence of snooping attacks may grow, as more people adoptsmartphones, and motivate further effort into improving defenses.
1. INTRODUCTIONMobile phones are not just phones anymore, they are interfaces tomuch of users’ social lives, and keep records which, in all likeli-hood, include intimate, sensitive, or confidential information. Aslong as those records are interesting to anyone, there is a risk thatthey might try to obtain them.
The speed and extent to which mobile devices are being adoptedhas created new opportunities for remote, sophisticated adversaries.Phenomena like mobile malware, surveillance by state-sponsoredactors, and personal data tracking for commercial purposes, haveentered into public discourse, and became, reasonably so, a pointof concern [38]. However, in their daily lives, users face a more im-mediate threat: people with whom they have close social ties caninfringe on their privacy just by picking up their devices and brows-ing through their data. Those social insiders [29] can act oppor-tunistically, without having any special skills or abilities. Such mayhappen when devices are left unattended, or handed over with the
Copyright is held by the author/owner. Permission to make digital or hardcopies of all or part of this work for personal or classroom use is grantedwithout fee.Symposium on Usable Privacy and Security (SOUPS) 2016, June 22–24,2016, Denver, Colorado.
expectation of limited use. Often, social insiders can achieve theirobjectives just by undertaking what we will refer to as a snoopingattack, that is, by looking at information that was not intended forthem, without a primary intent to extract data or make changes. Ifwe conceive of privacy as the ability to have control over the waysothers know us [33], being snooped on by people whose opinion wecare about is a violation of privacy in its most fundamental sense.
There are technological defenses against snooping attacks, mostnotably authentication mechanisms. However, it has become clearthat people very often do not use them [12, 17, 23]. While thereis debate over why people make such a choice, and over if andhow they could be encouraged to choose differently, users remainin a situation where there are more opportunities for snooping thanthere could otherwise be. More opportunities, however, do notnecessarily translate into more actual offenses. This uncertaintyabout whether people’s phones are commonly, or only rarely, be-ing snooped on, casts doubt over the importance and/or urgency ofsecuring their devices against third parties that are, at first sight,trusted.
In this paper, we bring new evidence into this conversation, by mea-suring actual successes in conducting snooping attacks, from theattacker’s perspective. From a security standpoint, it is of specialimportance to know how successful snooping attacks are, becausehigh degrees of success indicate that existing defenses, both be-havioral, like keeping the device on oneself at all times, and tech-nological, like device locking, are inadequate. We thus aimed tomeasure the proportion of people, in population with a large degreeof mobile device adoption, that successfully snooped on someoneelse’s device, and to explore the pervasiveness of the phenomenon,or lack thereof, across population groups. We selected the U.S.adult population as a target, because it is easily accessible and wellcharacterized in terms of mobile device adoption.
The main challenge with obtaining such data is methodological. Ifwe were to field a survey asking people whether they had snoopedon someone else’s device, we could not reasonably expect hon-est responses, because such behavior is commonly deemed to becensurable. Thus, we employed the list experiment (e.g., [27]), atechnique in which participants are asked to look at a list of items,and indicate how many (not which) they identify with. In list ex-periments, one group of participants receives a list of control items,and another group a list of the same control items plus an item ofinterest. An aggregate estimate of positive response to the item ofinterest can be calculated by the difference between groups, with-out knowing the true answer for each respondent. A more detaileddescription of the technique, and the rationale for its selection overother techniques, is provided in Section 3.
1
List experiments are understood to provide less biased estimatesof response to sensitive questions, in comparison with direct self-reporting, but require careful design. The way in which list ques-tions are worded, and the way in which surveys are administered,can have significant impact on measurement error [27]. We con-ducted two empirical studies to address these issues.
In a first study, conducted with Google Consumer Surveys (GCS),we selected the control and sensitive items to include in the list.For the control items, we measured, with direct questioning, theprevalence of previously reported behaviors that relate to privacyand security. Based on 1,140 responses, we selected a mix of itemsthat prevents ceiling and floor effects. For the sensitive item, specialconsideration was given to how it was framed, because the specificwording would be the operational definition of the construct thatwe wanted to measure – in this case, successful snooping attacks.We tested 4 alternative ways of wording the concept such that it waseasy to understand and mapped to the security issue at stake. Basedon 1,086 responses, we concluded that the most adequate wording,among the alternatives, was "looked through someone else’s phonewithout their permission". This study is reported in Section 4.
A second methodological challenge arose from a decision, made atthe outset, to field the survey in Amazon Mechanical Turk (MTurk).MTurk is commonly used to target large participant pools [34], butdoubts have been raised about its appropriateness for survey re-search [14], since participants, and especially those with low rep-utation, may engage in satisficing [32, 35]. To validate that listexperiments on MTurk produce reliable measurements, we ran alist experiment with one control group and two treatment groups (n= 434), who received extra items with known prevalence of ~100%(having opened eyes in the morning) and ~0% (having travelled ininterplanetary space). We were then able to compare the knownprevalence to the one estimated by the list experiment, across 3groups of MTurk participants, with distinct reputation levels. Weconcluded that list experiments appropriately estimated expectedproportions, without the need to control for participant reputation.This finding, which is reported in Section 5, is a secondary gener-alizable contribution of this work.
Taking these findings into consideration, and making conservativedesign choices, we deployed a list experiment to MTurk to mea-sure the prevalence of snooping attacks (n = 1,381). In Section 6,we describe the final design, the data collection process, and reporton the proportion of people who, in 1 year, successfully engaged insnooping attacks on others’ mobile phones, offering both a point es-timate of prevalence, and predictors of such behavior. We provideestimates for the MTurk sample, which is often taken as being rep-resentative of the Internet population, and further project it into theU.S. adult population, by post-stratification weighting. The mainfindings are as follows:
• An estimated 31% of participants had "looked through some-one else’s phone without permission," in the 12-month pe-riod before the survey was conducted.
• Adjusting the younger and more male MTurk sample to theU.S. adult population, the 1-year prevalence was estimatedat 20%.
• Engaging in snooping attacks does not seem to be stronglyrelated to gender, level of education, or geographical region.
• Younger participants were notably more likely to have en-gaged in snooping attacks, to the extent that the behaviour
was estimated to be prevalent (52%) among those between18 and 24 years of age.
• Those who own smartphones are much more likely to snoopon others.
Although this study could not establish mechanisms by which theobserved trends emerged, the fact that the youngest participants andthose who used smartphones were more likely to snoop on otherssuggested a common cause. It has been noted that smartphone usersoften engage in a pattern of adoption in which the phone mediatesimportant aspects of their private social life [9, 39]. In a follow-upstudy (n = 653), with a similar design to the previous, we examinedwhether, among smartphone users, depth of adoption predicted theprevalence of snooping attacks. We confirmed that the more peopleuse their smartphones in ways that generate privacy-sensitive data,the more likely they are to snoop on others, even when controllingof age. A compelling explanation for these findings is that, as peo-ple learn by their own usage what kinds of sensitive information iskept on smartphones, they gain a better sense of what they couldhave access to if they were to snoop. This final study is reported inSection 7.
Overall, these results indicate that snooping on other people’s de-vices must be relatively easy, to be so common. Furthermore, thepopulation trends that we found suggest possible growth of the phe-nomena. If it is the youngest, and those who adopt smartphones toa larger extent, that are more likely to snoop on others, then growthmay come from aging of the cohort, or from more people adopt-ing smartphones in ways that make them aware of the private datathat is kept. The situation calls for additional efforts in provid-ing adequate defenses against socially-close adversaries, and fora re-examination of assumptions of trust in mobile security threatmodels.
2. RELATED WORKIt has been widely documented that smartphones are used verydifferently than either regular phones or computers, and, as a re-sult, store a great deal of sensitive information, including accesscodes, personal communication, call and text logs, contacts, pic-tures, videos, and location records (e.g., [2, 13, 28]). Users havebeen found to be concerned about the risks to their privacy that havetherefore emerged [9, 36]. Events have not proved them wrong.
In the last few years, there has been much discussion about phe-nomena like mobile malware, government surveillance, and per-sonal data gathering for commercial purposes (e.g., [13, 37, 38]).Threats such as these, in which adversaries are technologically so-phisticated, and act remotely, have traditionally been seen as thepotentially most damaging. However, end-users are very rarely af-fected in a practical sense, and, when they are, the impact on theirlives has been somewhat limited, mainly taking the form of unso-licited advertising [13].
Recently, as spearfishing and insider threats have gained more at-tention in the computer security community, so have socially-closeadversaries been recognized as a threat to personal mobile com-puting [29]. Younger users, the so-called digital natives, are indeedmore concerned about insiders: they are more aware of threats witha social context (like those arising from loss, theft, snooping orshoulder-surfing) than of threats with a technical connotation (likethose arising from malware or network attacks) [23].
In a recent Pew survey [36], 12% of US mobile phone owners re-ported having had another person access the contents of their phone
2
in a way that made them feel their privacy was invaded. This statis-tic can be seen as an indirect measure of snooping attack success,but one that is likely inaccurate. For instance, many people mayhave had their smartphones snooped on but not know about it. Con-versely, the fact that someone felt that their privacy was invadeddoes not mean that there was an explicit intention by the personaccessing the device.
Corroborating that finding, in a recent survey with an MTurk sam-ple, 14% of participants reported being targets of snooping ("Some-one used my mobile phone without my permission with intention tolook at some of my data"), and 9% reported being attackers ("I usedsomeone’s mobile phone without owner’s permission to look intohis/her data") [29]. This is, as far as we know, the first measurementof successful snooping attacks from the attacker’s perspective. Thismeasurement, however, is not generalizable, for two reasons. First,because it was meant to be a sample summary, not a population es-timate, as part of a study with a broader objective. Second, becausethe questions were asked directly, and thus the number of peoplewilling to identify with behaviour that can be seen as offensive isexpected to be biased by the social desirability effect, as suggestedby a 6 percentage point mismatch between reported targets and at-tackers.
We aimed to measure how often people actually succeed in con-ducting snooping attacks, taking into consideration that they mightnot be willing to admit it. Furthermore, we were interested in an es-timate bounded in time, namely one year, to allow periodical com-parisons. By measuring 1-year prevalence periodically, it is pos-sible to discern any changes, which could, for instance, indicateadoption of new defenses. In contrast, if participants are periodi-cally asked if they ever snooped, changes might not be observableuntil there is a sufficiently large proportion of new entrants into thepopulation.
Comparing our results to previous statistics, the problem does seemto have been underestimated. We found that 20% of U.S. adultsengaged and succeeded in snooping attacks in a year, while only12%, over their lifetime, report having had the contents of their de-vices accessed [36]; and, for a comparable MTurk population, us-ing the list experiment procedure, we estimated 1-year prevalenceof snooping attacks (31%) to be approximately 3 times as high asthe previous lifetime prevalence estimate obtained with direct ques-tioning (9%) [29]. Unless there was a very large upward shift inprevalence that would explain these differences, it seems that in-deed many people never come to learn that they were snooped on,and that when asked directly, people who have snooped on othersoften do not admit to it.
3. ASKING SENSITIVE QUESTIONSStudies of attitudes, opinions and behaviors run into measurementerror whenever self-reports can not be trusted. One classic exampleis that men consistently report having had a far greater number ofsexual intercourse partners than women, which, if true, would defylogic [42].
One source of measurement error is social desirability bias [41].When questions are sensitive, respondents tend to give answers thatthey understand to be the right ones, and not necessarily the truth.Questions that pertain to protecting one’s privacy are known to besubject to that bias. It has been shown that the mere addition ofprivacy wording in surveys makes respondents much more likelyto give socially desirable responses [6].
Indirect survey techniques to reduce social desirability bias haveemerged in the last few decades. Their main principle is assurance
of response confidentiality by design, not policy. Respondents havestrict guarantees that their individual answer will not be revealed,and are therefore more likely to answer truthfully. The cost to re-searchers is that they will not know the response of each individual,only aggregate estimates.
Two main types of such survey instruments have received attention.One is the randomized response technique (RRT) [5]. In its sim-plest form, respondents are shown a sensitive question and askedto privately flip a coin. If it lands on one side, participants mustanswer “yes”, regardless of truthfulness, and if it lands on the otherside, they must answer truthfully, "yes" or "no". Each individual re-spondent is thus assured that answering “yes” does not reveal theirtrue response, as long as no one else knows on which side the coinlanded. But knowing that the probability of a coin landing headsor tails is equal, the total proportion of positive responses can becalculated by assuming that half the positive responses are a conse-quence of the coin toss, and the remaining are truthful.
The other technique is the list experiment (sometimes called un-matched count technique, or item count technique, or unmatchedblock design), which we have employed. List experiments are akind of survey experiment [30], which involve dividing a sampleinto two groups, the control and the treatment. As an example, ina recent study [40], where researchers addressed the puzzle of whya particular ballot initiative failed to pass when opinion polls indi-cated otherwise, the control group was asked the following ques-tion:
Here is a list of four things that some people have done and somepeople have not. [. . . ] Do not tell me which you have and have notdone. Just tell me how many:- Discussed politics with family or friends;- Cast a ballot for Governor Phil Bryant;- Paid dues to a union;- Given money to a Tea Party candidate or organization.How many of these things have you done in the past two years?
The treatment group saw the question with the following extra item:
- Voted ‘YES’ on the ‘Personhood’ Initiative on the November 2011Mississippi General Election ballot
With this technique, participants do not have to reveal their truth-ful answer to the extra item, which is the one actually being mea-sured. Yet, the proportion can be estimated by comparing the meannumber of items selected by respondents in control and treatmentgroups. All the rest being equal, a difference in means can be at-tributed to the presence of the extra item. The difference in means isthus the estimate of proportion of positive responses to the sensitiveitem.
It has been shown that both the list experiment and the RRT reduceresponse bias. In the mentioned validation study [40], which testedboth approaches, it was found that an RRT survey predicted almostexactly the actual vote. A list experiment survey considerably re-duced the bias, but still underestimated the actual vote share.
For online surveys, however, application of the RRT is problem-atic. Since the procedure is complex, respondents have to expendconsiderable time to understand it, and often they have trouble be-lieving their true answers are not revealed [11]. As we intended todeploy the survey on MTurk, where participant attention is alreadyscarce (e.g., [35]), and extra time is costly, we opted for a list exper-iment. Even if list experiments provided estimates that were overlyconservative, on the issue of snooping, it was best to err on the side
3
of caution. If even a conservative estimate was relevant, than surelya higher estimate would have at least the same consequence.
The list experiment procedure seldom appears in HCI research (withone exception that we know of [1]). With this paper we also wantedto call attention to the growing tool belt of survey research meth-ods for sensitive topics, which can help untangle the often founddiscrepancy between self-reports and actual behaviour in privacy-related studies.
4. STUDY 1: ITEM SELECTIONList experiments aim to reduce the measurement error that wouldoccur if sensitive questions were asked directly. For them to beeffective, careful consideration has to be given to the compositionof the list. The perception of confidentiality can be jeopardizedwhen lists are not credible, or when truthful answers would revealthat respondents had answered positively to the sensitive item. Withthis first empirical study, we aimed to compose a list of items thatwould minimize the chances of obtaining unreliable measurementsfrom a full-scale survey experiment.
The danger of unreliable measurement can be mitigated by follow-ing common advice on designing list experiments (e.g., [4, 11, 15,27]), which includes:
1. Avoid ceiling effects A ceiling effect happens when all the con-trol items are so common that many participants would, ifanswering truthfully, identify with all items, thus revealingtheir positive answer to the sensitive one.
2. Avoid floor effects A floor effect occurs when the control itemsare so uncommon that, for many participants, the only itemthey could credibly report as identifying with would be thesensitive one.
3. Avoid lists that are too short Short lists increase the likelihoodof a ceiling or floor effect.
4. Avoid lists that are too long Long lists increase variance anddemand more attention from participants.
5. Avoid contrast effects If the sensitive item is too salient, re-spondents might worry that any non-zero answer to the list isindicative of identification with it. The list should thereforeinclude control items that are on the same topic as the sensi-tive item, which itself should be worded in neutral language.
Taking this advice into account, we decided to run surveys on indi-vidual behaviors to obtain prevalence estimates, so we could selecta combination of control items, and a wording for the item pertain-ing to snooping attacks, that would make confidentiality plausible.
4.1 ProcedureTo build the list of items, we ran direct question surveys on severalcandidate items using Google Consumer Surveys (GCS).
For each candidate control item, we aimed at a target sample of 100participants. For candidate sensitive items, we targeted a sample of250 participants, as we expected lower sensitivity, due to social de-sirability bias. The actual number of participants is often differentthan the target, because of the particular way in which GCS sam-ples [26].
For the control items, to avoid contrast effects with the sensitiveitem, we selected candidates among previously documented behav-iors or situations related to mobile privacy [13] and online privacy[38], shown in Table 1, rows 1 to 8.
For the sensitive item, that pertains to snooping attacks, we testedfour ways of wording the behavior, shown in Table 1, rows 9 to 12.The formulations avoid the word "snooping", which we deemedto have a too-negative connotation, and instead test a malicious-ness dimension, with "used" vs. "looked through" wording, and anegregiousness dimension, with "without knowledge" vs. "withoutpermission" wording.
4.2 Results
4.2.1 Control item selectionOur surveys did not find privacy-relevant behaviors or situationsthat can be said to be of high prevalence, but items of low preva-lence were abundant. In part, such could be explained by the exis-tence of social desirability bias for some of the controls.
Nevertheless, taking the measured prevalences for candidate itemsas indicative of true differences in the population, results indicatedit would be trivial to avoid ceiling effects (advice 1) even with ashort list, by selecting among the items with very low prevalence.
Avoiding floor effects (advice 2) was more challenging, as we didnot find highly prevalent items. We decided to include 4 controlitems in the final list, at the cost of possible lower precision in es-timates (advice 4). With 4 control items rather than 2 or 3, therewere, we reasoned, enough guarantees of confidentiality. Even ifrespondents answered "1" it would be plausible enough that theywere referring to one of the controls that is not abundantly privacy-sensitive, such as receiving spam.
We finally selected the items from surveys 1, 2, 4 and 5, which arethe ones with the highest and lowest prevalence, that still pertain tomobile security, and thus generate less contrast (advice 5) with thesensitive item.
4.2.2 Sensitive item selectionFor the item conveying the "snooping attack" construct, the surveyswe conducted did not show any appreciable differences as a resultof different wording. A Chi-squared test did not provide evidencethat the wording had an overall effect on the rate of positive answers(χ2(3) = 5.36, p = 0.1471, Cramer’s V = 0.07), nor that wordingconveying either egregiousness or maliciousness had significant ef-fects in isolation (χ2(1) = 2.610, p = 0.1062, Cramer’s V = 0.05,and χ2(1) = 1.192, p = 0.2749, Cramer’s V = 0.04, respectively).In a logistic regression model of positive or negative answer as afunction of egregiousness or maliciousness wording, we also didnot find either factor to be a significant predictor at the 0.05 signifi-cance level, and the model accounted for very little of the deviance(null deviance 751 on 1085 d.f. vs. residual deviance 746 on 1083d.f.).
We could have expanded the sample to get more precise estimatesand possibly establish minute differences between wording choices,but given the observed effect sizes, and the likelihood that socialdesirability bias was already introducing measurement error, anydifferences, even if statically significant, were unlikely to be ofpractical importance. We thus concluded that, for the purpose ofour main survey, we should use the wording that, on its face, rep-resented an egregious violation of an access policy with maliciousintent: having looked through someone else’s cell phone withouttheir permission.
4.3 DiscussionBased on the results of direct question surveys, we composed a listof items that included a mix of controls which were low to medium
4
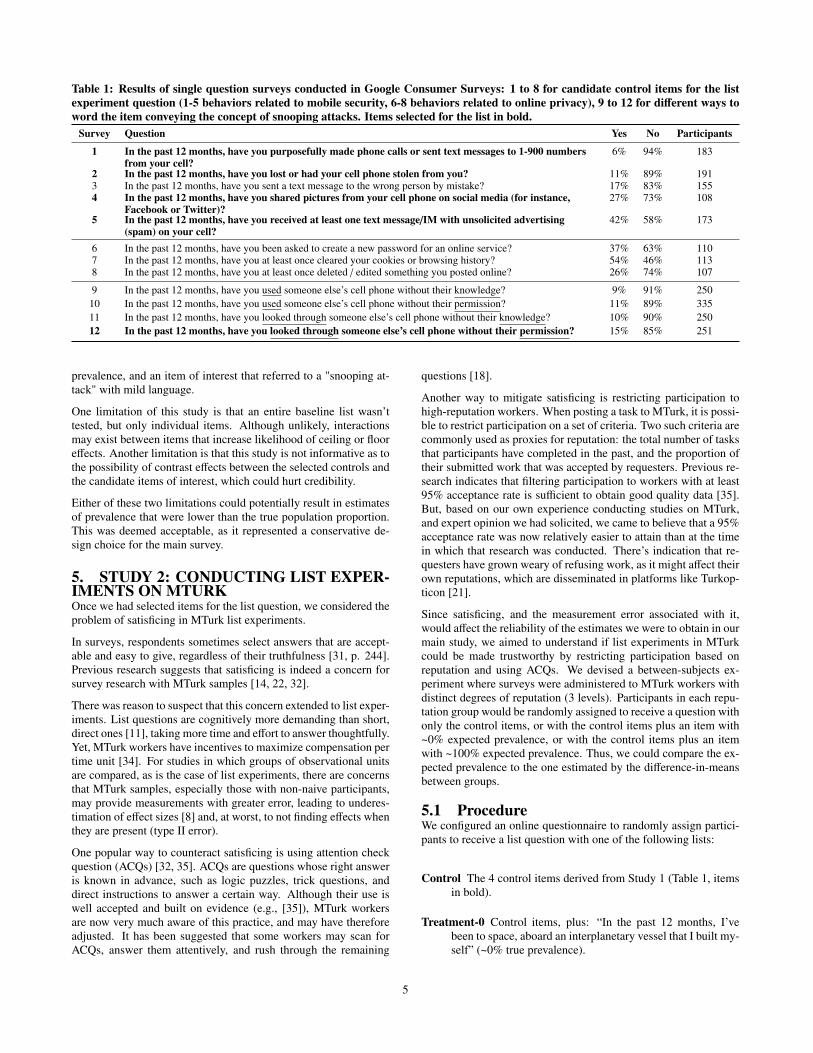
Table 1: Results of single question surveys conducted in Google Consumer Surveys: 1 to 8 for candidate control items for the listexperiment question (1-5 behaviors related to mobile security, 6-8 behaviors related to online privacy), 9 to 12 for different ways toword the item conveying the concept of snooping attacks. Items selected for the list in bold.
Survey Question Yes No Participants
1 In the past 12 months, have you purposefully made phone calls or sent text messages to 1-900 numbersfrom your cell?
6% 94% 183
2 In the past 12 months, have you lost or had your cell phone stolen from you? 11% 89% 1913 In the past 12 months, have you sent a text message to the wrong person by mistake? 17% 83% 1554 In the past 12 months, have you shared pictures from your cell phone on social media (for instance,
Facebook or Twitter)?27% 73% 108
5 In the past 12 months, have you received at least one text message/IM with unsolicited advertising(spam) on your cell?
42% 58% 173
6 In the past 12 months, have you been asked to create a new password for an online service? 37% 63% 1107 In the past 12 months, have you at least once cleared your cookies or browsing history? 54% 46% 1138 In the past 12 months, have you at least once deleted / edited something you posted online? 26% 74% 107
9 In the past 12 months, have you used someone else’s cell phone without their knowledge? 9% 91% 25010 In the past 12 months, have you used someone else’s cell phone without their permission? 11% 89% 33511 In the past 12 months, have you looked through someone else’s cell phone without their knowledge? 10% 90% 25012 In the past 12 months, have you looked through someone else’s cell phone without their permission? 15% 85% 251
prevalence, and an item of interest that referred to a "snooping at-tack" with mild language.
One limitation of this study is that an entire baseline list wasn’ttested, but only individual items. Although unlikely, interactionsmay exist between items that increase likelihood of ceiling or flooreffects. Another limitation is that this study is not informative as tothe possibility of contrast effects between the selected controls andthe candidate items of interest, which could hurt credibility.
Either of these two limitations could potentially result in estimatesof prevalence that were lower than the true population proportion.This was deemed acceptable, as it represented a conservative de-sign choice for the main survey.
5. STUDY 2: CONDUCTING LIST EXPER-IMENTS ON MTURKOnce we had selected items for the list question, we considered theproblem of satisficing in MTurk list experiments.
In surveys, respondents sometimes select answers that are accept-able and easy to give, regardless of their truthfulness [31, p. 244].Previous research suggests that satisficing is indeed a concern forsurvey research with MTurk samples [14, 22, 32].
There was reason to suspect that this concern extended to list exper-iments. List questions are cognitively more demanding than short,direct ones [11], taking more time and effort to answer thoughtfully.Yet, MTurk workers have incentives to maximize compensation pertime unit [34]. For studies in which groups of observational unitsare compared, as is the case of list experiments, there are concernsthat MTurk samples, especially those with non-naive participants,may provide measurements with greater error, leading to underes-timation of effect sizes [8] and, at worst, to not finding effects whenthey are present (type II error).
One popular way to counteract satisficing is using attention checkquestion (ACQs) [32, 35]. ACQs are questions whose right answeris known in advance, such as logic puzzles, trick questions, anddirect instructions to answer a certain way. Although their use iswell accepted and built on evidence (e.g., [35]), MTurk workersare now very much aware of this practice, and may have thereforeadjusted. It has been suggested that some workers may scan forACQs, answer them attentively, and rush through the remaining
questions [18].
Another way to mitigate satisficing is restricting participation tohigh-reputation workers. When posting a task to MTurk, it is possi-ble to restrict participation on a set of criteria. Two such criteria arecommonly used as proxies for reputation: the total number of tasksthat participants have completed in the past, and the proportion oftheir submitted work that was accepted by requesters. Previous re-search indicates that filtering participation to workers with at least95% acceptance rate is sufficient to obtain good quality data [35].But, based on our own experience conducting studies on MTurk,and expert opinion we had solicited, we came to believe that a 95%acceptance rate was now relatively easier to attain than at the timein which that research was conducted. There’s indication that re-questers have grown weary of refusing work, as it might affect theirown reputations, which are disseminated in platforms like Turkop-ticon [21].
Since satisficing, and the measurement error associated with it,would affect the reliability of the estimates we were to obtain in ourmain study, we aimed to understand if list experiments in MTurkcould be made trustworthy by restricting participation based onreputation and using ACQs. We devised a between-subjects ex-periment where surveys were administered to MTurk workers withdistinct degrees of reputation (3 levels). Participants in each repu-tation group would be randomly assigned to receive a question withonly the control items, or with the control items plus an item with~0% expected prevalence, or with the control items plus an itemwith ~100% expected prevalence. Thus, we could compare the ex-pected prevalence to the one estimated by the difference-in-meansbetween groups.
5.1 ProcedureWe configured an online questionnaire to randomly assign partici-pants to receive a list question with one of the following lists:
Control The 4 control items derived from Study 1 (Table 1, itemsin bold).
Treatment-0 Control items, plus: “In the past 12 months, I’vebeen to space, aboard an interplanetary vessel that I built my-self” (~0% true prevalence).
5
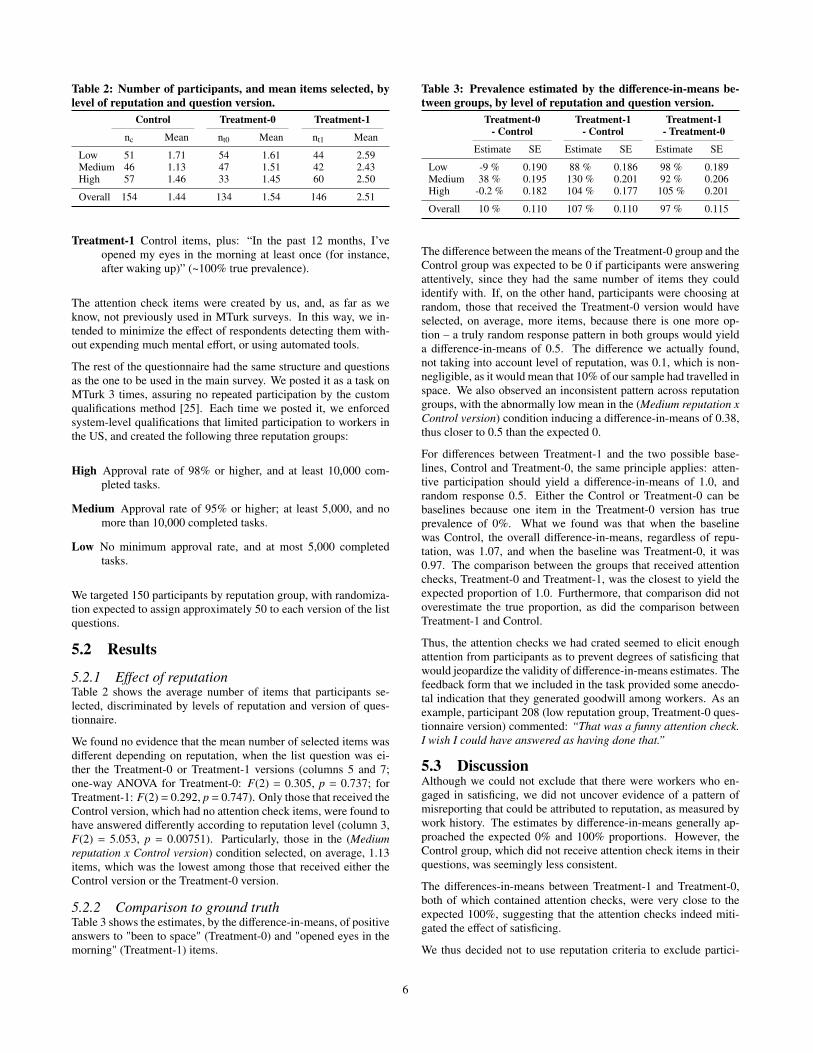
Table 2: Number of participants, and mean items selected, bylevel of reputation and question version.
Control Treatment-0 Treatment-1
nc Mean nt0 Mean nt1 Mean
Low 51 1.71 54 1.61 44 2.59Medium 46 1.13 47 1.51 42 2.43High 57 1.46 33 1.45 60 2.50
Overall 154 1.44 134 1.54 146 2.51
Treatment-1 Control items, plus: “In the past 12 months, I’veopened my eyes in the morning at least once (for instance,after waking up)” (~100% true prevalence).
The attention check items were created by us, and, as far as weknow, not previously used in MTurk surveys. In this way, we in-tended to minimize the effect of respondents detecting them with-out expending much mental effort, or using automated tools.
The rest of the questionnaire had the same structure and questionsas the one to be used in the main survey. We posted it as a task onMTurk 3 times, assuring no repeated participation by the customqualifications method [25]. Each time we posted it, we enforcedsystem-level qualifications that limited participation to workers inthe US, and created the following three reputation groups:
High Approval rate of 98% or higher, and at least 10,000 com-pleted tasks.
Medium Approval rate of 95% or higher; at least 5,000, and nomore than 10,000 completed tasks.
Low No minimum approval rate, and at most 5,000 completedtasks.
We targeted 150 participants by reputation group, with randomiza-tion expected to assign approximately 50 to each version of the listquestions.
5.2 Results
5.2.1 Effect of reputationTable 2 shows the average number of items that participants se-lected, discriminated by levels of reputation and version of ques-tionnaire.
We found no evidence that the mean number of selected items wasdifferent depending on reputation, when the list question was ei-ther the Treatment-0 or Treatment-1 versions (columns 5 and 7;one-way ANOVA for Treatment-0: F(2) = 0.305, p = 0.737; forTreatment-1: F(2) = 0.292, p = 0.747). Only those that received theControl version, which had no attention check items, were found tohave answered differently according to reputation level (column 3,F(2) = 5.053, p = 0.00751). Particularly, those in the (Mediumreputation x Control version) condition selected, on average, 1.13items, which was the lowest among those that received either theControl version or the Treatment-0 version.
5.2.2 Comparison to ground truthTable 3 shows the estimates, by the difference-in-means, of positiveanswers to "been to space" (Treatment-0) and "opened eyes in themorning" (Treatment-1) items.
Table 3: Prevalence estimated by the difference-in-means be-tween groups, by level of reputation and question version.
Treatment-0 Treatment-1 Treatment-1- Control - Control - Treatment-0
Estimate SE Estimate SE Estimate SE
Low -9 % 0.190 88 % 0.186 98 % 0.189Medium 38 % 0.195 130 % 0.201 92 % 0.206High -0.2 % 0.182 104 % 0.177 105 % 0.201
Overall 10 % 0.110 107 % 0.110 97 % 0.115
The difference between the means of the Treatment-0 group and theControl group was expected to be 0 if participants were answeringattentively, since they had the same number of items they couldidentify with. If, on the other hand, participants were choosing atrandom, those that received the Treatment-0 version would haveselected, on average, more items, because there is one more op-tion – a truly random response pattern in both groups would yielda difference-in-means of 0.5. The difference we actually found,not taking into account level of reputation, was 0.1, which is non-negligible, as it would mean that 10% of our sample had travelled inspace. We also observed an inconsistent pattern across reputationgroups, with the abnormally low mean in the (Medium reputation xControl version) condition inducing a difference-in-means of 0.38,thus closer to 0.5 than the expected 0.
For differences between Treatment-1 and the two possible base-lines, Control and Treatment-0, the same principle applies: atten-tive participation should yield a difference-in-means of 1.0, andrandom response 0.5. Either the Control or Treatment-0 can bebaselines because one item in the Treatment-0 version has trueprevalence of 0%. What we found was that when the baselinewas Control, the overall difference-in-means, regardless of repu-tation, was 1.07, and when the baseline was Treatment-0, it was0.97. The comparison between the groups that received attentionchecks, Treatment-0 and Treatment-1, was the closest to yield theexpected proportion of 1.0. Furthermore, that comparison did notoverestimate the true proportion, as did the comparison betweenTreatment-1 and Control.
Thus, the attention checks we had crated seemed to elicit enoughattention from participants as to prevent degrees of satisficing thatwould jeopardize the validity of difference-in-means estimates. Thefeedback form that we included in the task provided some anecdo-tal indication that they generated goodwill among workers. As anexample, participant 208 (low reputation group, Treatment-0 ques-tionnaire version) commented: “That was a funny attention check.I wish I could have answered as having done that.”
5.3 DiscussionAlthough we could not exclude that there were workers who en-gaged in satisficing, we did not uncover evidence of a pattern ofmisreporting that could be attributed to reputation, as measured bywork history. The estimates by difference-in-means generally ap-proached the expected 0% and 100% proportions. However, theControl group, which did not receive attention check items in theirquestions, was seemingly less consistent.
The differences-in-means between Treatment-1 and Treatment-0,both of which contained attention checks, were very close to theexpected 100%, suggesting that the attention checks indeed miti-gated the effect of satisficing.
We thus decided not to use reputation criteria to exclude partici-
6
pants in the main survey, as well as to add both the attention checksitems. Inclusion of attention checks in both conditions of the mainsurvey was the conservative design choice, as we had observed thattheir absence had, in this experiment, led to overestimation.
6. STUDY 3: MEASURING SNOOPING AT-TACKS6.1 DesignHaving selected the list of items, and validated that a deploymentto MTurk could provide good quality data, we proceeded to designand deploy the main survey.
We opted to create a very short questionnaire, with only the listquestion, and six other questions on personal characteristics, noneof them open-ended. The questions are shown in Appendix B.The decision to not include more questions was made for two rea-sons. First, we had started with very concise research question, andbroadening the scope before that question was answered could bea waste of time. Second, with more questions, or questions thatwere more probing, there was a risk that participants might feelthat anonymity was reduced. For instance, they could reasonablysuspect that their identity could be triangulated with responses toother surveys.
For that reason, we chose questions on personal characteristics care-fully, for instance not including questions about level of income orrace, which are very common in surveys, but that participants mayfeel to be very personal. We also asked for state of residency, butnot city; and asked for level of education in broad categories.
Another design choice was the ordering of questions. We chose toshow the list question at the beginning of the survey, to maximizeattention and decrease incomplete responses. Since the question iscognitively heavy, it would be more frustrating to answer it afterhaving cruised through simple demographics questions. We alsoinquired about personal characteristics in what we reasoned to bean increasing level of identifiability, to keep the sense of anonymitystrong, as long as possible.
The list question included the control items and the item of interestselected in Study 1, and the two attention checks used as treatmentmanipulations in Study 2. The main purpose of including the atten-tion checks was not to "catch" inattentive participants but to engageparticipants when thinking of the answer.
6.2 FieldingWe put the questionnaire online on a private web server, and con-figured it to randomly assign participants to either the treatment orthe control group, each receiving the corresponding version of thelist question. The survey proper was preceded by an informed con-sent form. We posted the survey several times as a task in MTurk,so that it would re-appear on the front page. Repeated participationwas prevented by the custom qualification method [25]. MTurkqualifications were also used to restrict participation to residentsin the United States. No other restrictions regarding past perfor-mance were enforced, as we found them to be superfluous in Study2. Participants were paid $0.20, regardless of them giving validresponses. The survey took 1 to 2 minutes to complete attentively.
6.3 Data cleanupWe received a total of 1,481 responses to the survey. Of those, 84(6%) were incomplete, and were removed from the dataset. Ad-ditionally, 16 responses (1%) were eliminated for being obviouslyinvalid: 8 for responding “none” to the list question, and 8 for re-sponding “all”. The following analysis is based on the remaining
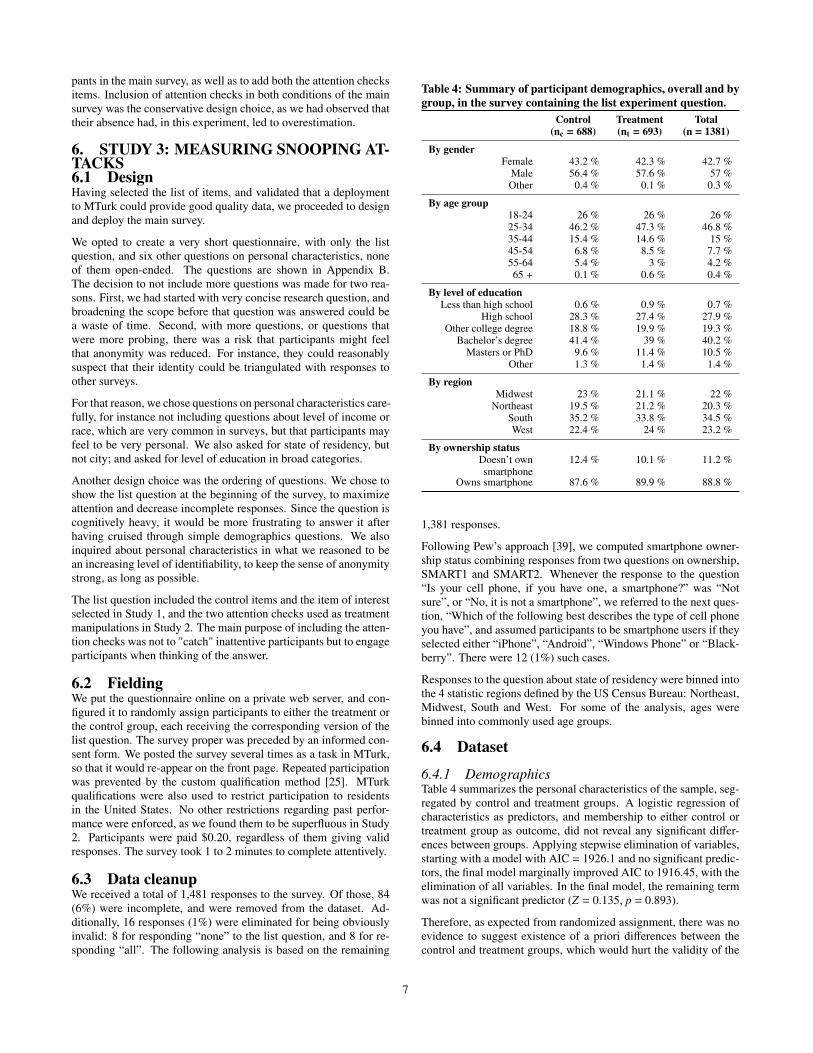
Table 4: Summary of participant demographics, overall and bygroup, in the survey containing the list experiment question.
Control Treatment Total(nc = 688) (nt = 693) (n = 1381)
By genderFemale 43.2 % 42.3 % 42.7 %
Male 56.4 % 57.6 % 57 %Other 0.4 % 0.1 % 0.3 %
By age group18-24 26 % 26 % 26 %25-34 46.2 % 47.3 % 46.8 %35-44 15.4 % 14.6 % 15 %45-54 6.8 % 8.5 % 7.7 %55-64 5.4 % 3 % 4.2 %65 + 0.1 % 0.6 % 0.4 %
By level of educationLess than high school 0.6 % 0.9 % 0.7 %
High school 28.3 % 27.4 % 27.9 %Other college degree 18.8 % 19.9 % 19.3 %
Bachelor’s degree 41.4 % 39 % 40.2 %Masters or PhD 9.6 % 11.4 % 10.5 %
Other 1.3 % 1.4 % 1.4 %
By regionMidwest 23 % 21.1 % 22 %
Northeast 19.5 % 21.2 % 20.3 %South 35.2 % 33.8 % 34.5 %West 22.4 % 24 % 23.2 %
By ownership statusDoesn’t ownsmartphone
12.4 % 10.1 % 11.2 %
Owns smartphone 87.6 % 89.9 % 88.8 %
1,381 responses.
Following Pew’s approach [39], we computed smartphone owner-ship status combining responses from two questions on ownership,SMART1 and SMART2. Whenever the response to the question“Is your cell phone, if you have one, a smartphone?” was “Notsure”, or “No, it is not a smartphone”, we referred to the next ques-tion, “Which of the following best describes the type of cell phoneyou have”, and assumed participants to be smartphone users if theyselected either “iPhone”, “Android”, “Windows Phone” or “Black-berry”. There were 12 (1%) such cases.
Responses to the question about state of residency were binned intothe 4 statistic regions defined by the US Census Bureau: Northeast,Midwest, South and West. For some of the analysis, ages werebinned into commonly used age groups.
6.4 Dataset
6.4.1 DemographicsTable 4 summarizes the personal characteristics of the sample, seg-regated by control and treatment groups. A logistic regression ofcharacteristics as predictors, and membership to either control ortreatment group as outcome, did not reveal any significant differ-ences between groups. Applying stepwise elimination of variables,starting with a model with AIC = 1926.1 and no significant predic-tors, the final model marginally improved AIC to 1916.45, with theelimination of all variables. In the final model, the remaining termwas not a significant predictor (Z = 0.135, p = 0.893).
Therefore, as expected from randomized assignment, there was noevidence to suggest existence of a priori differences between thecontrol and treatment groups, which would hurt the validity of the
7
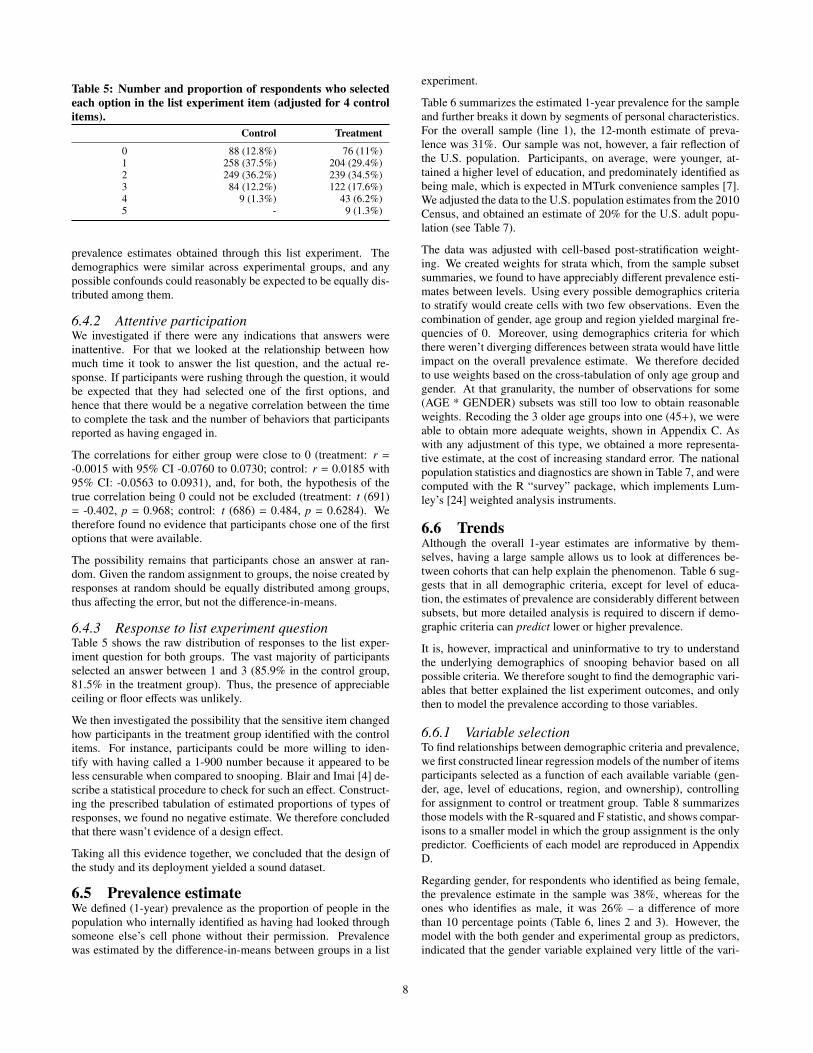
Table 5: Number and proportion of respondents who selectedeach option in the list experiment item (adjusted for 4 controlitems).
Control Treatment
0 88 (12.8%) 76 (11%)1 258 (37.5%) 204 (29.4%)2 249 (36.2%) 239 (34.5%)3 84 (12.2%) 122 (17.6%)4 9 (1.3%) 43 (6.2%)5 - 9 (1.3%)
prevalence estimates obtained through this list experiment. Thedemographics were similar across experimental groups, and anypossible confounds could reasonably be expected to be equally dis-tributed among them.
6.4.2 Attentive participationWe investigated if there were any indications that answers wereinattentive. For that we looked at the relationship between howmuch time it took to answer the list question, and the actual re-sponse. If participants were rushing through the question, it wouldbe expected that they had selected one of the first options, andhence that there would be a negative correlation between the timeto complete the task and the number of behaviors that participantsreported as having engaged in.
The correlations for either group were close to 0 (treatment: r =
-0.0015 with 95% CI -0.0760 to 0.0730; control: r = 0.0185 with95% CI: -0.0563 to 0.0931), and, for both, the hypothesis of thetrue correlation being 0 could not be excluded (treatment: t (691)= -0.402, p = 0.968; control: t (686) = 0.484, p = 0.6284). Wetherefore found no evidence that participants chose one of the firstoptions that were available.
The possibility remains that participants chose an answer at ran-dom. Given the random assignment to groups, the noise created byresponses at random should be equally distributed among groups,thus affecting the error, but not the difference-in-means.
6.4.3 Response to list experiment questionTable 5 shows the raw distribution of responses to the list exper-iment question for both groups. The vast majority of participantsselected an answer between 1 and 3 (85.9% in the control group,81.5% in the treatment group). Thus, the presence of appreciableceiling or floor effects was unlikely.
We then investigated the possibility that the sensitive item changedhow participants in the treatment group identified with the controlitems. For instance, participants could be more willing to iden-tify with having called a 1-900 number because it appeared to beless censurable when compared to snooping. Blair and Imai [4] de-scribe a statistical procedure to check for such an effect. Construct-ing the prescribed tabulation of estimated proportions of types ofresponses, we found no negative estimate. We therefore concludedthat there wasn’t evidence of a design effect.
Taking all this evidence together, we concluded that the design ofthe study and its deployment yielded a sound dataset.
6.5 Prevalence estimateWe defined (1-year) prevalence as the proportion of people in thepopulation who internally identified as having had looked throughsomeone else’s cell phone without their permission. Prevalencewas estimated by the difference-in-means between groups in a list
experiment.
Table 6 summarizes the estimated 1-year prevalence for the sampleand further breaks it down by segments of personal characteristics.For the overall sample (line 1), the 12-month estimate of preva-lence was 31%. Our sample was not, however, a fair reflection ofthe U.S. population. Participants, on average, were younger, at-tained a higher level of education, and predominately identified asbeing male, which is expected in MTurk convenience samples [7].We adjusted the data to the U.S. population estimates from the 2010Census, and obtained an estimate of 20% for the U.S. adult popu-lation (see Table 7).
The data was adjusted with cell-based post-stratification weight-ing. We created weights for strata which, from the sample subsetsummaries, we found to have appreciably different prevalence esti-mates between levels. Using every possible demographics criteriato stratify would create cells with two few observations. Even thecombination of gender, age group and region yielded marginal fre-quencies of 0. Moreover, using demographics criteria for whichthere weren’t diverging differences between strata would have littleimpact on the overall prevalence estimate. We therefore decidedto use weights based on the cross-tabulation of only age group andgender. At that granularity, the number of observations for some(AGE * GENDER) subsets was still too low to obtain reasonableweights. Recoding the 3 older age groups into one (45+), we wereable to obtain more adequate weights, shown in Appendix C. Aswith any adjustment of this type, we obtained a more representa-tive estimate, at the cost of increasing standard error. The nationalpopulation statistics and diagnostics are shown in Table 7, and werecomputed with the R “survey” package, which implements Lum-ley’s [24] weighted analysis instruments.
6.6 TrendsAlthough the overall 1-year estimates are informative by them-selves, having a large sample allows us to look at differences be-tween cohorts that can help explain the phenomenon. Table 6 sug-gests that in all demographic criteria, except for level of educa-tion, the estimates of prevalence are considerably different betweensubsets, but more detailed analysis is required to discern if demo-graphic criteria can predict lower or higher prevalence.
It is, however, impractical and uninformative to try to understandthe underlying demographics of snooping behavior based on allpossible criteria. We therefore sought to find the demographic vari-ables that better explained the list experiment outcomes, and onlythen to model the prevalence according to those variables.
6.6.1 Variable selectionTo find relationships between demographic criteria and prevalence,we first constructed linear regression models of the number of itemsparticipants selected as a function of each available variable (gen-der, age, level of educations, region, and ownership), controllingfor assignment to control or treatment group. Table 8 summarizesthose models with the R-squared and F statistic, and shows compar-isons to a smaller model in which the group assignment is the onlypredictor. Coefficients of each model are reproduced in AppendixD.
Regarding gender, for respondents who identified as being female,the prevalence estimate in the sample was 38%, whereas for theones who identifies as male, it was 26% – a difference of morethan 10 percentage points (Table 6, lines 2 and 3). However, themodel with the both gender and experimental group as predictors,indicated that the gender variable explained very little of the vari-
8
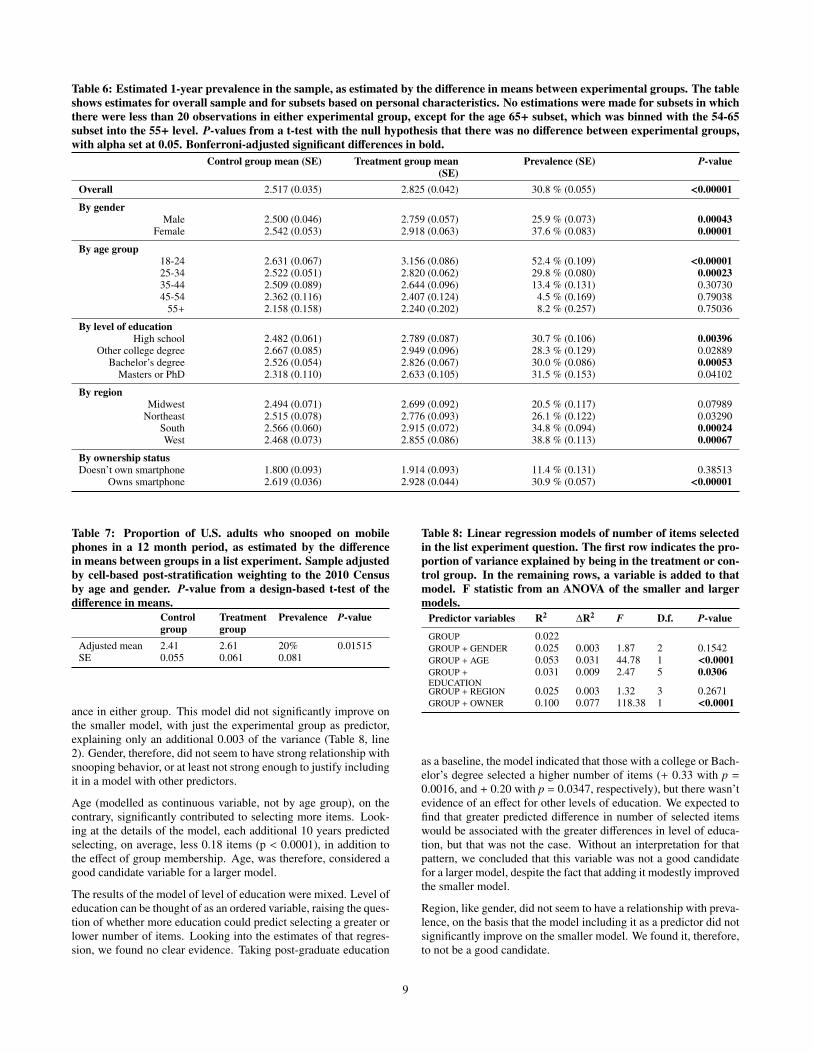
Table 6: Estimated 1-year prevalence in the sample, as estimated by the difference in means between experimental groups. The tableshows estimates for overall sample and for subsets based on personal characteristics. No estimations were made for subsets in whichthere were less than 20 observations in either experimental group, except for the age 65+ subset, which was binned with the 54-65subset into the 55+ level. P-values from a t-test with the null hypothesis that there was no difference between experimental groups,with alpha set at 0.05. Bonferroni-adjusted significant differences in bold.
Control group mean (SE) Treatment group mean(SE)
Prevalence (SE) P-value
Overall 2.517 (0.035) 2.825 (0.042) 30.8 % (0.055) <0.00001
By genderMale 2.500 (0.046) 2.759 (0.057) 25.9 % (0.073) 0.00043
Female 2.542 (0.053) 2.918 (0.063) 37.6 % (0.083) 0.00001
By age group18-24 2.631 (0.067) 3.156 (0.086) 52.4 % (0.109) <0.0000125-34 2.522 (0.051) 2.820 (0.062) 29.8 % (0.080) 0.0002335-44 2.509 (0.089) 2.644 (0.096) 13.4 % (0.131) 0.3073045-54 2.362 (0.116) 2.407 (0.124) 4.5 % (0.169) 0.79038
55+ 2.158 (0.158) 2.240 (0.202) 8.2 % (0.257) 0.75036
By level of educationHigh school 2.482 (0.061) 2.789 (0.087) 30.7 % (0.106) 0.00396
Other college degree 2.667 (0.085) 2.949 (0.096) 28.3 % (0.129) 0.02889Bachelor’s degree 2.526 (0.054) 2.826 (0.067) 30.0 % (0.086) 0.00053
Masters or PhD 2.318 (0.110) 2.633 (0.105) 31.5 % (0.153) 0.04102
By regionMidwest 2.494 (0.071) 2.699 (0.092) 20.5 % (0.117) 0.07989
Northeast 2.515 (0.078) 2.776 (0.093) 26.1 % (0.122) 0.03290South 2.566 (0.060) 2.915 (0.072) 34.8 % (0.094) 0.00024West 2.468 (0.073) 2.855 (0.086) 38.8 % (0.113) 0.00067
By ownership statusDoesn’t own smartphone 1.800 (0.093) 1.914 (0.093) 11.4 % (0.131) 0.38513
Owns smartphone 2.619 (0.036) 2.928 (0.044) 30.9 % (0.057) <0.00001
Table 7: Proportion of U.S. adults who snooped on mobilephones in a 12 month period, as estimated by the differencein means between groups in a list experiment. Sample adjustedby cell-based post-stratification weighting to the 2010 Censusby age and gender. P-value from a design-based t-test of thedifference in means.
Controlgroup
Treatmentgroup
Prevalence P-value
Adjusted mean 2.41 2.61 20% 0.01515SE 0.055 0.061 0.081
ance in either group. This model did not significantly improve onthe smaller model, with just the experimental group as predictor,explaining only an additional 0.003 of the variance (Table 8, line2). Gender, therefore, did not seem to have strong relationship withsnooping behavior, or at least not strong enough to justify includingit in a model with other predictors.
Age (modelled as continuous variable, not by age group), on thecontrary, significantly contributed to selecting more items. Look-ing at the details of the model, each additional 10 years predictedselecting, on average, less 0.18 items (p < 0.0001), in addition tothe effect of group membership. Age, was therefore, considered agood candidate variable for a larger model.
The results of the model of level of education were mixed. Level ofeducation can be thought of as an ordered variable, raising the ques-tion of whether more education could predict selecting a greater orlower number of items. Looking into the estimates of that regres-sion, we found no clear evidence. Taking post-graduate education
Table 8: Linear regression models of number of items selectedin the list experiment question. The first row indicates the pro-portion of variance explained by being in the treatment or con-trol group. In the remaining rows, a variable is added to thatmodel. F statistic from an ANOVA of the smaller and largermodels.
Predictor variables R2 ∆R2 F D.f. P-value
GROUP 0.022GROUP + GENDER 0.025 0.003 1.87 2 0.1542GROUP + AGE 0.053 0.031 44.78 1 <0.0001GROUP +
EDUCATION0.031 0.009 2.47 5 0.0306
GROUP + REGION 0.025 0.003 1.32 3 0.2671GROUP + OWNER 0.100 0.077 118.38 1 <0.0001
as a baseline, the model indicated that those with a college or Bach-elor’s degree selected a higher number of items (+ 0.33 with p =
0.0016, and + 0.20 with p = 0.0347, respectively), but there wasn’tevidence of an effect for other levels of education. We expected tofind that greater predicted difference in number of selected itemswould be associated with the greater differences in level of educa-tion, but that was not the case. Without an interpretation for thatpattern, we concluded that this variable was not a good candidatefor a larger model, despite the fact that adding it modestly improvedthe smaller model.
Region, like gender, did not seem to have a relationship with preva-lence, on the basis that the model including it as a predictor did notsignificantly improve on the smaller model. We found it, therefore,to not be a good candidate.
9
Finally, regarding ownership status, the model suggested that thosewho owned smartphones selected more items from the list, evenwhen controlling for membership in either control or treatmentgroup. Adding ownership status to a model of only group mem-bership explained 7.7% more of the variance, the greatest differ-ence we found. Looking at the estimates of the model, we foundthe additional effect of owning a smartphone to be selecting 0.91more items (p < 0.0001). Thus, ownership was clearly judged ascandidate variable for a larger model.
6.6.2 ModelHaving identified gender and smartphone ownership status as vari-ables of interest, we finally aimed to understand how they predictedthe probability of engaging in snooping attacks. For variable selec-tion, we had used number of items selected, controlled by groupmembership, as an indicator of higher probability. For the finalmodel, we wanted to look at actual predicted probability, while us-ing both variables as predictors, and accounting for possible non-linear relationships.
Recently, it has been noted that although list experiments cannot re-veal what each participant responded to the sensitive item, it is stillpossible to estimate conditional and joint proportions [10, 15], andthus model the joint probability distribution [4, 20]. Using the R"list" package [3] to that end, we created a model of the proportionof respondents identifying with the sensitive item, as a function ofage and ownership status.
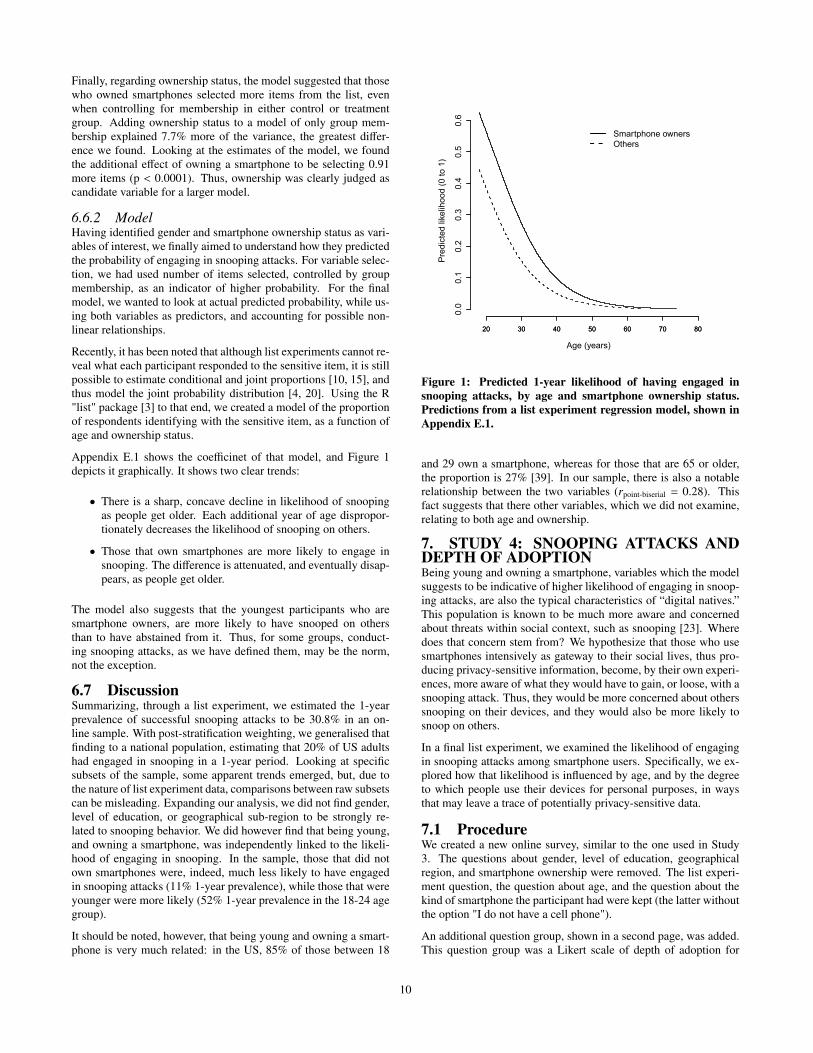
Appendix E.1 shows the coefficinet of that model, and Figure 1depicts it graphically. It shows two clear trends:
• There is a sharp, concave decline in likelihood of snoopingas people get older. Each additional year of age dispropor-tionately decreases the likelihood of snooping on others.
• Those that own smartphones are more likely to engage insnooping. The difference is attenuated, and eventually disap-pears, as people get older.
The model also suggests that the youngest participants who aresmartphone owners, are more likely to have snooped on othersthan to have abstained from it. Thus, for some groups, conduct-ing snooping attacks, as we have defined them, may be the norm,not the exception.
6.7 DiscussionSummarizing, through a list experiment, we estimated the 1-yearprevalence of successful snooping attacks to be 30.8% in an on-line sample. With post-stratification weighting, we generalised thatfinding to a national population, estimating that 20% of US adultshad engaged in snooping in a 1-year period. Looking at specificsubsets of the sample, some apparent trends emerged, but, due tothe nature of list experiment data, comparisons between raw subsetscan be misleading. Expanding our analysis, we did not find gender,level of education, or geographical sub-region to be strongly re-lated to snooping behavior. We did however find that being young,and owning a smartphone, was independently linked to the likeli-hood of engaging in snooping. In the sample, those that did notown smartphones were, indeed, much less likely to have engagedin snooping attacks (11% 1-year prevalence), while those that wereyounger were more likely (52% 1-year prevalence in the 18-24 agegroup).
It should be noted, however, that being young and owning a smart-phone is very much related: in the US, 85% of those between 18
20 30 40 50 60 70 80
0.0
0.1
0.2
0.3
0.4
0.5
0.6
Age (years)
Pre
dict
ed li
kelih
ood
(0 to
1)
20 30 40 50 60 70 80
Smartphone ownersOthers
Figure 1: Predicted 1-year likelihood of having engaged insnooping attacks, by age and smartphone ownership status.Predictions from a list experiment regression model, shown inAppendix E.1.
and 29 own a smartphone, whereas for those that are 65 or older,the proportion is 27% [39]. In our sample, there is also a notablerelationship between the two variables (rpoint-biserial = 0.28). Thisfact suggests that there other variables, which we did not examine,relating to both age and ownership.
7. STUDY 4: SNOOPING ATTACKS ANDDEPTH OF ADOPTIONBeing young and owning a smartphone, variables which the modelsuggests to be indicative of higher likelihood of engaging in snoop-ing attacks, are also the typical characteristics of “digital natives.”This population is known to be much more aware and concernedabout threats within social context, such as snooping [23]. Wheredoes that concern stem from? We hypothesize that those who usesmartphones intensively as gateway to their social lives, thus pro-ducing privacy-sensitive information, become, by their own experi-ences, more aware of what they would have to gain, or loose, with asnooping attack. Thus, they would be more concerned about otherssnooping on their devices, and they would also be more likely tosnoop on others.
In a final list experiment, we examined the likelihood of engagingin snooping attacks among smartphone users. Specifically, we ex-plored how that likelihood is influenced by age, and by the degreeto which people use their devices for personal purposes, in waysthat may leave a trace of potentially privacy-sensitive data.
7.1 ProcedureWe created a new online survey, similar to the one used in Study3. The questions about gender, level of education, geographicalregion, and smartphone ownership were removed. The list experi-ment question, the question about age, and the question about thekind of smartphone the participant had were kept (the latter withoutthe option "I do not have a cell phone").
An additional question group, shown in a second page, was added.This question group was a Likert scale of depth of adoption for
10
privacy-sensitive purposes, with 10 questions. For each, partici-pants rated their perceived degree of frequency of use, from "Never"(1) to "All the time" (7). As an example, one item was "I usemy smartphone to to look up information about health conditions".Items were based on behaviors of smartphone users that were re-ported in a Pew survey [39]. The scale is reproduced in Appendix F.
The survey was fielded in MTurk, following the same procedureas Study 3. The advertisement (HIT) asked specifically for smart-phone users, both in the title ("Survey of smartphone users") andthe description ("[...] Do not accept this HIT if you do not regu-larly use a smartphone"). Data cleanup was done also as describedin Study 3, resulting in the exclusion of 7 responses (1%). All par-ticipants were paid $0.25.
There were 653 valid responses, 314 of which in the control group,and 339 in the treatment group. The majority of participants (56%)reported having an Android smartphone, followed by an iPhone(41%), Windows Phone (3%) and Blackberry (<1%). No partic-ipants selected the option "I do not have a smartphone", that waskept to exclude responses in case of inattentive reading of the ad-vertisement.
7.2 Results
7.2.1 Depth of adoption and ageResponses to the depth of adoption scale, whose possible valuesare between 10 and 70, ranged from 16 to 70, and where somewhatskewed toward the higher end. The middle point of the scale is40, and the mean response was 44.66 (SD = 10.6). Details aboutthe distribution of responses, for the scale and individual questions,can be found in Appendix F.2.
Responses to the depth of adoption scale were, as expected, nega-tively correlated with age (r = -0.18, t(651) = -4.78, p < 0.00001).This correlation, however, was not strong (according to Cohen’seffect size criteria, it falls between small, 0.1, and medium, 0.3).Because depth of adoption, as it was measured, was relatively in-dependent of age, it could more easily be interpreted as a predictorof likelihood of engaging in snooping attacks.
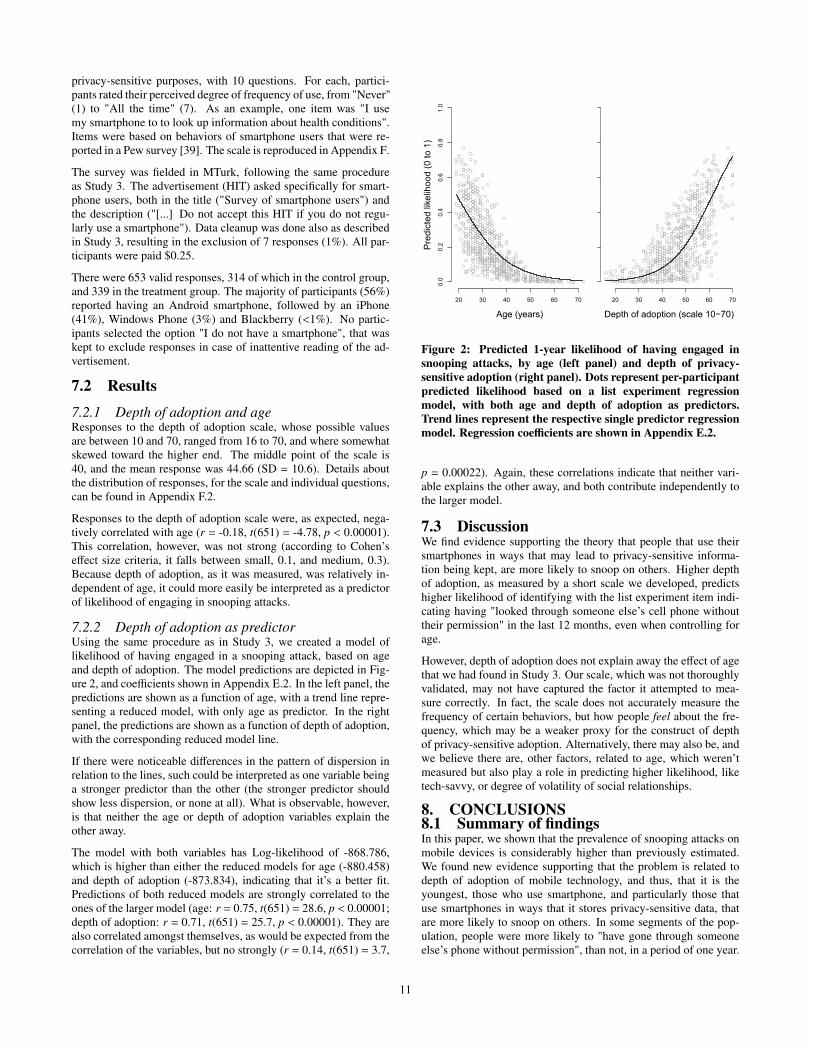
7.2.2 Depth of adoption as predictorUsing the same procedure as in Study 3, we created a model oflikelihood of having engaged in a snooping attack, based on ageand depth of adoption. The model predictions are depicted in Fig-ure 2, and coefficients shown in Appendix E.2. In the left panel, thepredictions are shown as a function of age, with a trend line repre-senting a reduced model, with only age as predictor. In the rightpanel, the predictions are shown as a function of depth of adoption,with the corresponding reduced model line.
If there were noticeable differences in the pattern of dispersion inrelation to the lines, such could be interpreted as one variable beinga stronger predictor than the other (the stronger predictor shouldshow less dispersion, or none at all). What is observable, however,is that neither the age or depth of adoption variables explain theother away.
The model with both variables has Log-likelihood of -868.786,which is higher than either the reduced models for age (-880.458)and depth of adoption (-873.834), indicating that it’s a better fit.Predictions of both reduced models are strongly correlated to theones of the larger model (age: r = 0.75, t(651) = 28.6, p < 0.00001;depth of adoption: r = 0.71, t(651) = 25.7, p < 0.00001). They arealso correlated amongst themselves, as would be expected from thecorrelation of the variables, but no strongly (r = 0.14, t(651) = 3.7,
20 30 40 50 60 70
0.0
0.2
0.4
0.6
0.8
1.0
Age (years)
Pre
dict
ed li
kelih
ood
(0 to
1)
20 30 40 50 60 70
Depth of adoption (scale 10−70)
Figure 2: Predicted 1-year likelihood of having engaged insnooping attacks, by age (left panel) and depth of privacy-sensitive adoption (right panel). Dots represent per-participantpredicted likelihood based on a list experiment regressionmodel, with both age and depth of adoption as predictors.Trend lines represent the respective single predictor regressionmodel. Regression coefficients are shown in Appendix E.2.
p = 0.00022). Again, these correlations indicate that neither vari-able explains the other away, and both contribute independently tothe larger model.
7.3 DiscussionWe find evidence supporting the theory that people that use theirsmartphones in ways that may lead to privacy-sensitive informa-tion being kept, are more likely to snoop on others. Higher depthof adoption, as measured by a short scale we developed, predictshigher likelihood of identifying with the list experiment item indi-cating having "looked through someone else’s cell phone withouttheir permission" in the last 12 months, even when controlling forage.
However, depth of adoption does not explain away the effect of agethat we had found in Study 3. Our scale, which was not thoroughlyvalidated, may not have captured the factor it attempted to mea-sure correctly. In fact, the scale does not accurately measure thefrequency of certain behaviors, but how people feel about the fre-quency, which may be a weaker proxy for the construct of depthof privacy-sensitive adoption. Alternatively, there may also be, andwe believe there are, other factors, related to age, which weren’tmeasured but also play a role in predicting higher likelihood, liketech-savvy, or degree of volatility of social relationships.
8. CONCLUSIONS8.1 Summary of findingsIn this paper, we shown that the prevalence of snooping attacks onmobile devices is considerably higher than previously estimated.We found new evidence supporting that the problem is related todepth of adoption of mobile technology, and thus, that it is theyoungest, those who use smartphone, and particularly those thatuse smartphones in ways that it stores privacy-sensitive data, thatare more likely to snoop on others. In some segments of the pop-ulation, people were more likely to "have gone through someoneelse’s phone without permission", than not, in a period of one year.
11
To obtain these findings, we conducted a series of empirical studies.In the first two studies, we designed items for a list experiment,and validated the use of that methodological approach in MTurk.Our finding that list experiments in MTurk produce reliable data,as long as there are appropriate attention checks, is a secondarycontribution of this work.
In the latter two studies, we conducted list experiments that informon the prevalence of snooping attacks. Employing conservativedesign choices, that may have had the effect of underestimatingprevalence, we were still able to estimate 1-year prevalence ratesfor the MTurk population, and, by weighting, for the U.S. adultpopulation, that are much higher than previous lifetime prevalenceindicators. Furthermore, we uncovered predictors of the likelihoodof engaging in snooping attacks, and discerned independent popu-lation trends related to age and adoption of smartphones. We hy-pothesize that one mechanism for the observed trends is that userslearn by their own experiences the kinds of valuable informationkept on smartphones, which makes them more capable of engagingin snooping attacks.
8.2 ImplicationsThis state-of-affairs can and should be addressed. There is room toimprove privacy-preserving technologies that still impose too mucheffort on users, like mobile authentication. In recent year, biomet-ric authentication on mobile devices, especially fingerprint authen-tication, has become more available and usable. There have alsobeen extensive research efforts in making secret-based authentica-tion more usable. Trends such as these indicate that defenses maybe catching up.
However, two considerations should be given to the authenticationapproach of defense. First, as usable as authentication is made tobe, it is not unreasonable to think that, for many people, it willnever be attractive. Potential users of secret-based authenticationmay continue to think that it’s a hassle. Potential users of biomet-ric authentication may have privacy concerns. Defenses againstsnooping attacks for those people are few, if any.
A second consideration it that innovations in authentication shouldinclude snooping attacks in their threat models, because snoop-ing attacks are likely to be attempted. Some adaptive authentica-tion methods that have been proposed can reduce authenticationrequirements when devices are in "trusted places", like at home orat work (for instance, Android’s Smart Lock [16]). It should nowbe clear that, in face of the pervasiveness of snooping attacks, thatincrease in usability will likely come at the cost of increased secu-rity risk.
Another possible road to improve the current situation is educationand awareness-building. In that respect, however, it should be notedthat in the realm of security, there has been little success in gettingexpert’s messages across to users [19]. Specifically in the case ofsnooping, the reality if that many people are already aware of therisk, and want to secure against it, but fail to find practical ways todo it [28].
We hope this work plays a role in helping builders of interactivesystems, educators, and policy-makers, to consider, when reason-ing about mobile security, how prevalent it is for users’ privacy tobe violated by people they know.
8.3 Snooping as an attackWe have abstained throughout this paper from making judgementson whether snooping on others is justified. The use of the word
attack, common in security lingo, should not be taken as havinglegal or moral connotations. It is an attack in the sense that actionswere taken by an agent to circumvent an access policy; as muchas one would call a brute-force attack to a situation where a mobiledevice owner who, upon forgetting their own PIN, ran a script to tryout all possible combinations. We are aware that some people thinkit is acceptable for parents to go through their children’s devices, orfor romantic partners to go through one another’s devices, and wedo not dispute those opinions.
We note, however, that people who hold the opinion that their unau-thorized access is acceptable, should also not be greatly impactedby social desirability bias. Thus, they should be expected to trendtowards answering truthfully to a direct question on the topic. Inthe first study here reported (Section 4), and in previous studies[29], between 9% and 15% of respondents admit to having hadsnooped when asked directly. However, we found, for a compara-ble sample, that 2 to 3 times more people (~31%) self-identify withthe behaviour when asked indirectly. The gap can be explained byparticipants themselves finding their actions censurable. We mustconclude that a large portion of the population engages in a behav-ior that they know to be, from their own personal perspective, anattack, in the common sense of the word.
8.4 Future workSecurity risks are often seen as being a function of the probabilitythat they materialize and the severity of their consequences. Thisseries of studies is informative as to the first factor, probability. Wehave, in this paper, focused on an overall measure of probability,and its relationship to demographic and usage factors. It wouldnow be important to find other factors, especially ones related tothe relationship between the attacker and the attacked (like socialdistance and motivation), and factors related to the context that cre-ates the opportunity for the attack (like physical environment andcircumstance). Both would be important for evaluating the effec-tiveness of new or existing defenses.
The other factor of which risk is a function is the severity of the con-sequences. We did not explore severity in this paper, but note thattheory (e.g., [33]) predicts that the loss of control over what peoplethat matter to us know about us, is likely to have considerable im-pact. We also note that one practical challenge in assessing sever-ity is that people may not associate negative outcomes in their liveswith someone having had snooped through their device, because, asour data suggests, they may never find out that it happened. Still, itis possible to gage how people think they would feel, or how theyfelt in the instances they know about, and find distinctions related,again, to context or social relationship between parties.
Both a fine-grained understanding of probability and of severityrequires additional research, which we leave for future work. Thequantitative approach we have employed here is not appropriate fora wide exploration of possible explanations, and possible outcomes,of snooping attacks. Finding factors requires breadth, and calls fora more qualitative approach. We believe that the fact that snoopingattacks are much more common than previously thought justifiessuch an effort.
9. ACKNOWLEDGMENTSThis work was partially supported by FCT through funding of aPhD studentship, ref. SFRH/BD/98527/2013, and of the LaSIGEResearch Unit, ref. UID/CEC/00408/2013. Special thanks to SergeEgelman, Kristy Milland, to several anonymous members of Turk-erNation.com, and to the MTurk workers who participated in oursurveys.
12
10. REFERENCES[1] J. Antin and A. Shaw. Social desirability bias and self-reports
of motivation. In Proceedings of the 2012 ACM annualconference on Human Factors in Computing Systems - CHI’12, page 2925, New York, New York, USA, May 2012.ACM Press.
[2] N. Ben-Asher, N. Kirschnick, H. Sieger, J. Meyer,A. Ben-Oved, and S. Möller. On the need for differentsecurity methods on mobile phones. In Proceedings of the13th International Conference on Human ComputerInteraction with Mobile Devices and Services - MobileHCI’11, page 465, New York, New York, USA, Aug. 2011. ACMPress.
[3] G. Blair and K. Imai. list: Statistical methods for the itemcount technique and list experiment. Available at TheComprehensive R Archive Network (CRAN)http://CRAN.R-project.org/package=list.
[4] G. Blair and K. Imai. Statistical Analysis of ListExperiments. Political Analysis, 20(1):47–77, Jan. 2012.
[5] G. Blair, K. Imai, and Y.-Y. Zhou. Design and analysis of therandomized response technique. Journal of the AmericanStatistical Association, 110(511):1304–1319, 2015.
[6] A. Braunstein, L. Granka, and J. Staddon. Indirect contentprivacy surveys. In Proceedings of the Seventh Symposiumon Usable Privacy and Security - SOUPS ’11, page 1. ACMPress, 2011.
[7] M. Buhrmester, T. Kwang, and S. D. Gosling. Amazon’sMechanical Turk: A New Source of Inexpensive, YetHigh-Quality, Data? Perspectives on Psychological Science,6(1):3–5, Feb. 2011.
[8] J. Chandler, G. Paolacci, E. Peer, P. Mueller, and K. A.Ratliff. Using nonnaive participants can reduce effect sizes.Psychological Science, 26(7):1131–1139, 2015.
[9] E. Chin, A. P. Felt, V. Sekar, and D. Wagner. Measuring userconfidence in smartphone security and privacy. Proceedingsof the Eighth Symposium on Usable Privacy and Security -SOUPS ’12, July 2012.
[10] D. Corstange. Sensitive Questions, Truthful Answers?Modeling the List Experiment with LISTIT. PoliticalAnalysis, 17(1):45–63, Feb. 2008.
[11] E. Coutts and B. Jann. Sensitive Questions in OnlineSurveys: Experimental Results for the RandomizedResponse Technique (RRT) and the Unmatched CountTechnique (UCT). Sociological Methods & Research,40(1):169–193, Feb. 2008.
[12] S. Egelman, S. Jain, R. S. Portnoff, K. Liao, S. Consolvo,and D. Wagner. Are You Ready to Lock? UnderstandingUser Motivations for Smartphone Locking Behaviors . InProceedings of the 2014 ACM SIGSAC Conference onComputer and Communications Security - CCS ’14, pages750–761, 2014.
[13] A. P. Felt, S. Egelman, and D. Wagner. I’ve got 99 problems,but vibration ain’t one: A survey of smartphone users’concerns. In Proceedings of the 2nd ACM Workshop onSecurity and Privacy in Smartphones and Mobile Devices,pages 33–44, New York, New York, USA, Oct. 2012. ACMPress.
[14] U. Gadiraju, R. Kawase, S. Dietze, and G. Demartini.Understanding Malicious Behavior in CrowdsourcingPlatforms: The Case of Online Surveys. In Proceedings ofthe 33rd Annual ACM Conference on Human Factors inComputing Systems - CHI ’15, pages 1631–1640, New York,
New York, USA, 2015. ACM Press.[15] A. N. Glynn. What Can We Learn with Statistical Truth
Serum?: Design and Analysis of the List Experiment. PublicOpinion Quarterly, 77(S1):159–172, Feb. 2013.
[16] Google. Google Smart Lock. Online, Retrieved Jan 19, 2016.https://get.google.com/smartlock/.
[17] M. Harbach, E. V. Zezschwitz, A. Fichtner, A. D. Luca, andM. Smith. It’s a Hard Lock Life: A Field Study ofSmartphone (Un) Locking Behavior and Risk Perception. InSymposium On Usable Privacy and Security (SOUPS 2014),pages 213–230, Menlo Park, CA, July 2014. USENIXAssociation.
[18] D. J. Hauser and N. Schwarz. Attentive turkers: Mturkparticipants perform better on online attention checks thando subject pool participants. Behavior Research Methods,48(1):400–407, 2016.
[19] C. Herley. More is not the answer. IEEE Security & Privacy,12(1):14–19, Jan.-Feb. 2014.
[20] K. Imai. Multivariate Regression Analysis for the Item CountTechnique. Journal of the American Statistical Association,106(494):407–416, June 2011.
[21] L. C. Irani and M. S. Silberman. Turkopticon: InterruptingWorker Invisibility in Amazon Mechanical Turk. InProceedings of the SIGCHI Conference on Human Factors inComputing Systems, CHI ’13, pages 611–620, New York,NY, USA, 2013. ACM.
[22] A. Kapelner and D. Chandler. Preventing Satisficing inOnline Surveys : A “ Kapcha ” to Ensure Higher QualityData. In Proceedings of the 2010 CrowdConf, 2010.
[23] S. Kurkovsky and E. Syta. Digital natives and mobilephones: A survey of practices and attitudes about privacyand security. In International Symposium on Technology andSociety, Proceedings, pages 441–449. IEEE, June 2010.
[24] T. Lumley. Analysis of complex survey samples. Journal ofStatistical Software, 9(8):1–19, 2004.
[25] S. Maldonado. Using mTurk Qualifications to preventworkers from participating in an experiment multiple times.Online, Retrieved Jan 19, 2016http://sgmaldonado.com/main/content/using-mturk-qualifications-prevent-workers-participating-experiment-multiple-times.
[26] P. McDonald, M. Mohebbi, and B. Slatkin. ComparingGoogle Consumer Surveys to existing probability andnon-probability based internet surveys. Google Whitepaper,Retrieved Jan 19, 2016. https://www.google.com/insights/consumersurveys/static/consumer_surveys_whitepaper_v2.pdf.
[27] S. McNeeley. Sensitive Issues in Surveys: Reducing RefusalsWhile Increasing Reliability and Quality of Responses toSensitive Survey Items. Handbook of Survey Methodologyfor the Social Sciences, pages 377–396, 2012.
[28] I. Muslukhov, Y. Boshmaf, C. Kuo, J. Lester, andK. Beznosov. Understanding users’ requirements for dataprotection in smartphones. In Proceedings - 2012 IEEE 28thInternational Conference on Data Engineering Workshops,ICDEW 2012, pages 228–235. IEEE, Apr. 2012.
[29] I. Muslukhov, Y. Boshmaf, C. Kuo, J. Lester, andK. Beznosov. Know your enemy: the risk of unauthorizedaccess in smartphones by insiders. In Proceedings of the 15thinternational conference on Human-computer interactionwith mobile devices and services - MobileHCI ’13, page 271,New York, New York, USA, Aug. 2013. ACM Press.
13
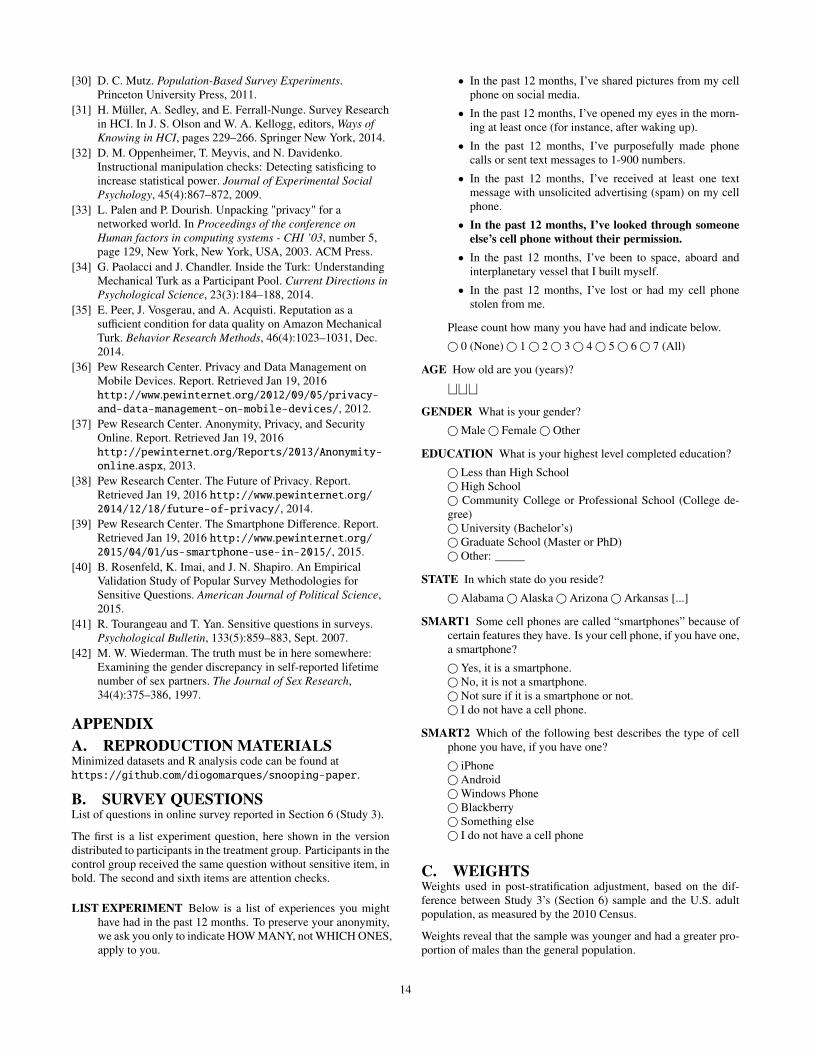
[30] D. C. Mutz. Population-Based Survey Experiments.Princeton University Press, 2011.
[31] H. Müller, A. Sedley, and E. Ferrall-Nunge. Survey Researchin HCI. In J. S. Olson and W. A. Kellogg, editors, Ways ofKnowing in HCI, pages 229–266. Springer New York, 2014.
[32] D. M. Oppenheimer, T. Meyvis, and N. Davidenko.Instructional manipulation checks: Detecting satisficing toincrease statistical power. Journal of Experimental SocialPsychology, 45(4):867–872, 2009.
[33] L. Palen and P. Dourish. Unpacking "privacy" for anetworked world. In Proceedings of the conference onHuman factors in computing systems - CHI ’03, number 5,page 129, New York, New York, USA, 2003. ACM Press.
[34] G. Paolacci and J. Chandler. Inside the Turk: UnderstandingMechanical Turk as a Participant Pool. Current Directions inPsychological Science, 23(3):184–188, 2014.
[35] E. Peer, J. Vosgerau, and A. Acquisti. Reputation as asufficient condition for data quality on Amazon MechanicalTurk. Behavior Research Methods, 46(4):1023–1031, Dec.2014.
[36] Pew Research Center. Privacy and Data Management onMobile Devices. Report. Retrieved Jan 19, 2016http://www.pewinternet.org/2012/09/05/privacy-and-data-management-on-mobile-devices/, 2012.
[37] Pew Research Center. Anonymity, Privacy, and SecurityOnline. Report. Retrieved Jan 19, 2016http://pewinternet.org/Reports/2013/Anonymity-online.aspx, 2013.
[38] Pew Research Center. The Future of Privacy. Report.Retrieved Jan 19, 2016 http://www.pewinternet.org/2014/12/18/future-of-privacy/, 2014.
[39] Pew Research Center. The Smartphone Difference. Report.Retrieved Jan 19, 2016 http://www.pewinternet.org/2015/04/01/us-smartphone-use-in-2015/, 2015.
[40] B. Rosenfeld, K. Imai, and J. N. Shapiro. An EmpiricalValidation Study of Popular Survey Methodologies forSensitive Questions. American Journal of Political Science,2015.
[41] R. Tourangeau and T. Yan. Sensitive questions in surveys.Psychological Bulletin, 133(5):859–883, Sept. 2007.
[42] M. W. Wiederman. The truth must be in here somewhere:Examining the gender discrepancy in self-reported lifetimenumber of sex partners. The Journal of Sex Research,34(4):375–386, 1997.
APPENDIXA. REPRODUCTION MATERIALSMinimized datasets and R analysis code can be found athttps://github.com/diogomarques/snooping-paper.
B. SURVEY QUESTIONSList of questions in online survey reported in Section 6 (Study 3).
The first is a list experiment question, here shown in the versiondistributed to participants in the treatment group. Participants in thecontrol group received the same question without sensitive item, inbold. The second and sixth items are attention checks.
LIST EXPERIMENT Below is a list of experiences you mighthave had in the past 12 months. To preserve your anonymity,we ask you only to indicate HOW MANY, not WHICH ONES,apply to you.
• In the past 12 months, I’ve shared pictures from my cellphone on social media.
• In the past 12 months, I’ve opened my eyes in the morn-ing at least once (for instance, after waking up).
• In the past 12 months, I’ve purposefully made phonecalls or sent text messages to 1-900 numbers.
• In the past 12 months, I’ve received at least one textmessage with unsolicited advertising (spam) on my cellphone.
• In the past 12 months, I’ve looked through someoneelse’s cell phone without their permission.• In the past 12 months, I’ve been to space, aboard and
interplanetary vessel that I built myself.
• In the past 12 months, I’ve lost or had my cell phonestolen from me.
Please count how many you have had and indicate below.
© 0 (None)© 1© 2© 3© 4© 5© 6© 7 (All)
AGE How old are you (years)?⊔⊔⊔GENDER What is your gender?
©Male© Female© Other
EDUCATION What is your highest level completed education?
© Less than High School© High School© Community College or Professional School (College de-gree)© University (Bachelor’s)© Graduate School (Master or PhD)© Other: _____
STATE In which state do you reside?
© Alabama© Alaska© Arizona© Arkansas [...]
SMART1 Some cell phones are called “smartphones” because ofcertain features they have. Is your cell phone, if you have one,a smartphone?
© Yes, it is a smartphone.© No, it is not a smartphone.© Not sure if it is a smartphone or not.© I do not have a cell phone.
SMART2 Which of the following best describes the type of cellphone you have, if you have one?
© iPhone© Android©Windows Phone© Blackberry© Something else© I do not have a cell phone
C. WEIGHTSWeights used in post-stratification adjustment, based on the dif-ference between Study 3’s (Section 6) sample and the U.S. adultpopulation, as measured by the 2010 Census.
Weights reveal that the sample was younger and had a greater pro-portion of males than the general population.
14
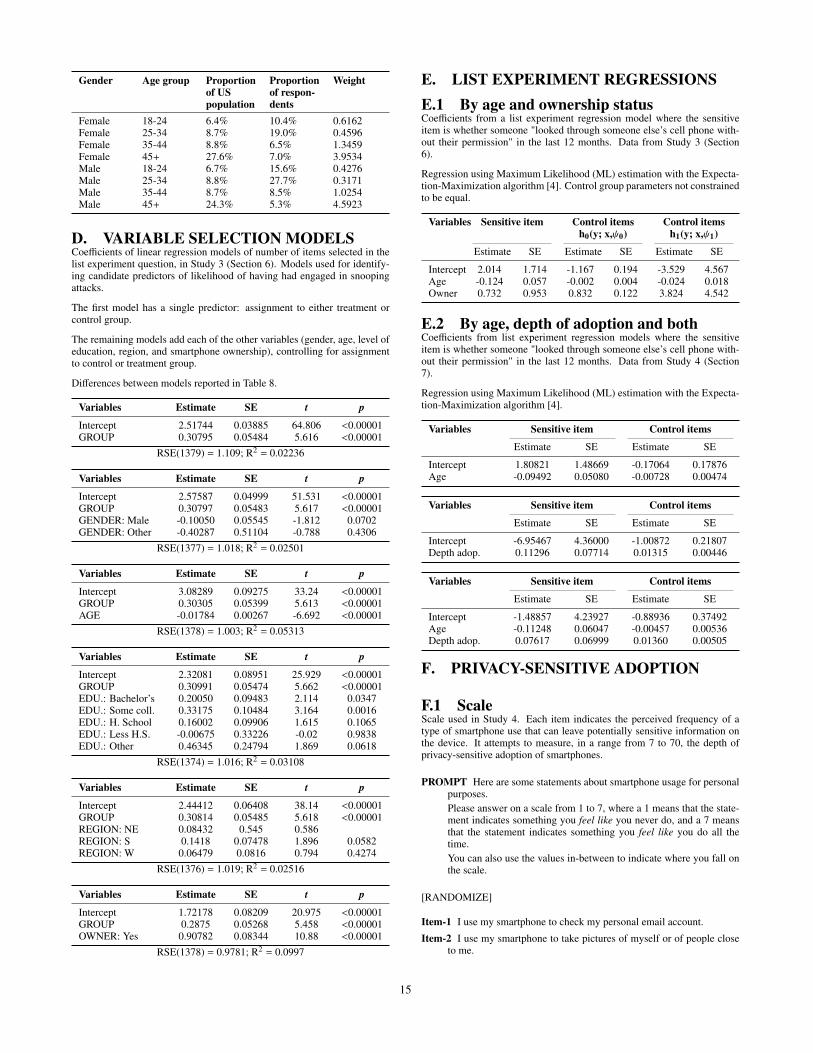
Gender Age group Proportionof USpopulation
Proportionof respon-dents
Weight
Female 18-24 6.4% 10.4% 0.6162Female 25-34 8.7% 19.0% 0.4596Female 35-44 8.8% 6.5% 1.3459Female 45+ 27.6% 7.0% 3.9534Male 18-24 6.7% 15.6% 0.4276Male 25-34 8.8% 27.7% 0.3171Male 35-44 8.7% 8.5% 1.0254Male 45+ 24.3% 5.3% 4.5923
D. VARIABLE SELECTION MODELSCoefficients of linear regression models of number of items selected in thelist experiment question, in Study 3 (Section 6). Models used for identify-ing candidate predictors of likelihood of having had engaged in snoopingattacks.
The first model has a single predictor: assignment to either treatment orcontrol group.
The remaining models add each of the other variables (gender, age, level ofeducation, region, and smartphone ownership), controlling for assignmentto control or treatment group.
Differences between models reported in Table 8.
Variables Estimate SE t p
Intercept 2.51744 0.03885 64.806 <0.00001GROUP 0.30795 0.05484 5.616 <0.00001
RSE(1379) = 1.109; R2 = 0.02236
Variables Estimate SE t p
Intercept 2.57587 0.04999 51.531 <0.00001GROUP 0.30797 0.05483 5.617 <0.00001GENDER: Male -0.10050 0.05545 -1.812 0.0702GENDER: Other -0.40287 0.51104 -0.788 0.4306
RSE(1377) = 1.018; R2 = 0.02501
Variables Estimate SE t p
Intercept 3.08289 0.09275 33.24 <0.00001GROUP 0.30305 0.05399 5.613 <0.00001AGE -0.01784 0.00267 -6.692 <0.00001
RSE(1378) = 1.003; R2 = 0.05313
Variables Estimate SE t p
Intercept 2.32081 0.08951 25.929 <0.00001GROUP 0.30991 0.05474 5.662 <0.00001EDU.: Bachelor’s 0.20050 0.09483 2.114 0.0347EDU.: Some coll. 0.33175 0.10484 3.164 0.0016EDU.: H. School 0.16002 0.09906 1.615 0.1065EDU.: Less H.S. -0.00675 0.33226 -0.02 0.9838EDU.: Other 0.46345 0.24794 1.869 0.0618
RSE(1374) = 1.016; R2 = 0.03108
Variables Estimate SE t p
Intercept 2.44412 0.06408 38.14 <0.00001GROUP 0.30814 0.05485 5.618 <0.00001REGION: NE 0.08432 0.545 0.586REGION: S 0.1418 0.07478 1.896 0.0582REGION: W 0.06479 0.0816 0.794 0.4274
RSE(1376) = 1.019; R2 = 0.02516
Variables Estimate SE t p
Intercept 1.72178 0.08209 20.975 <0.00001GROUP 0.2875 0.05268 5.458 <0.00001OWNER: Yes 0.90782 0.08344 10.88 <0.00001
RSE(1378) = 0.9781; R2 = 0.0997
E. LIST EXPERIMENT REGRESSIONSE.1 By age and ownership statusCoefficients from a list experiment regression model where the sensitiveitem is whether someone "looked through someone else’s cell phone with-out their permission" in the last 12 months. Data from Study 3 (Section6).
Regression using Maximum Likelihood (ML) estimation with the Expecta-tion-Maximization algorithm [4]. Control group parameters not constrainedto be equal.
Variables Sensitive item Control items Control itemsh0(y; x,ψ0) h1(y; x,ψ1)
Estimate SE Estimate SE Estimate SE
Intercept 2.014 1.714 -1.167 0.194 -3.529 4.567Age -0.124 0.057 -0.002 0.004 -0.024 0.018Owner 0.732 0.953 0.832 0.122 3.824 4.542
E.2 By age, depth of adoption and bothCoefficients from list experiment regression models where the sensitiveitem is whether someone "looked through someone else’s cell phone with-out their permission" in the last 12 months. Data from Study 4 (Section7).
Regression using Maximum Likelihood (ML) estimation with the Expecta-tion-Maximization algorithm [4].
Variables Sensitive item Control items
Estimate SE Estimate SE
Intercept 1.80821 1.48669 -0.17064 0.17876Age -0.09492 0.05080 -0.00728 0.00474
Variables Sensitive item Control items
Estimate SE Estimate SE
Intercept -6.95467 4.36000 -1.00872 0.21807Depth adop. 0.11296 0.07714 0.01315 0.00446
Variables Sensitive item Control items
Estimate SE Estimate SE
Intercept -1.48857 4.23927 -0.88936 0.37492Age -0.11248 0.06047 -0.00457 0.00536Depth adop. 0.07617 0.06999 0.01360 0.00505
F. PRIVACY-SENSITIVE ADOPTION
F.1 ScaleScale used in Study 4. Each item indicates the perceived frequency of atype of smartphone use that can leave potentially sensitive information onthe device. It attempts to measure, in a range from 7 to 70, the depth ofprivacy-sensitive adoption of smartphones.
PROMPT Here are some statements about smartphone usage for personalpurposes.Please answer on a scale from 1 to 7, where a 1 means that the state-ment indicates something you feel like you never do, and a 7 meansthat the statement indicates something you feel like you do all thetime.You can also use the values in-between to indicate where you fall onthe scale.
[RANDOMIZE]
Item-1 I use my smartphone to check my personal email account.
Item-2 I use my smartphone to take pictures of myself or of people closeto me.
15
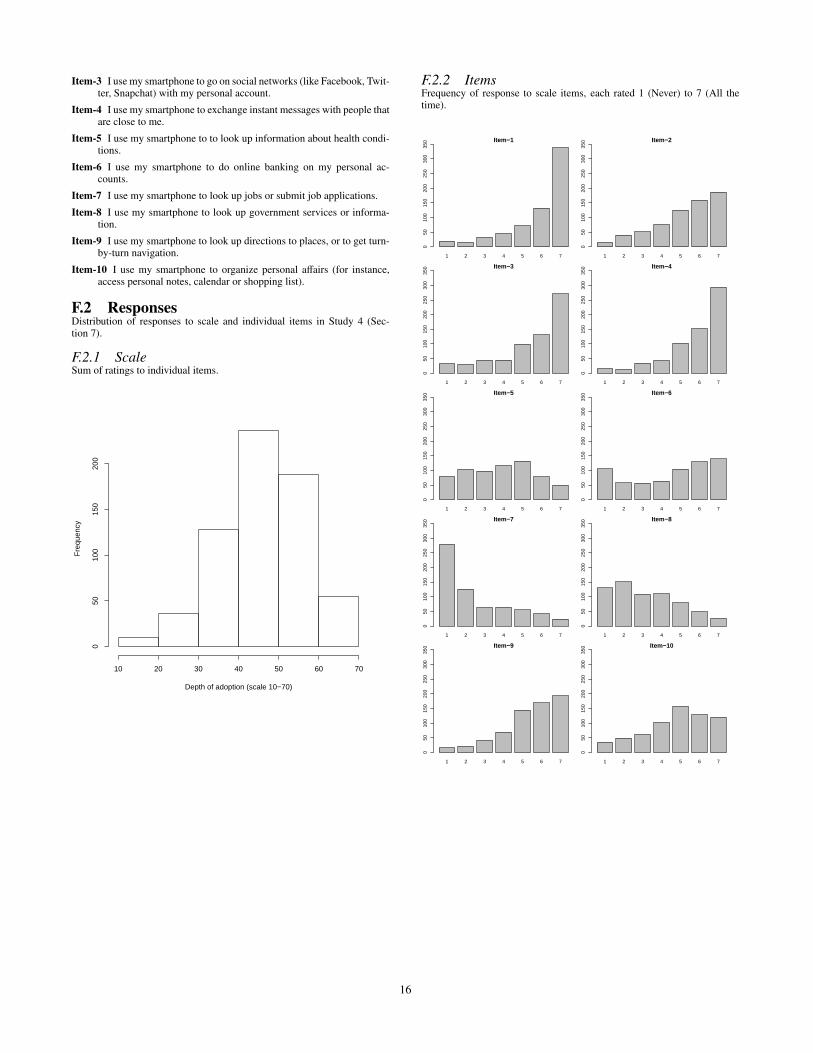
Item-3 I use my smartphone to go on social networks (like Facebook, Twit-ter, Snapchat) with my personal account.
Item-4 I use my smartphone to exchange instant messages with people thatare close to me.
Item-5 I use my smartphone to to look up information about health condi-tions.
Item-6 I use my smartphone to do online banking on my personal ac-counts.
Item-7 I use my smartphone to look up jobs or submit job applications.
Item-8 I use my smartphone to look up government services or informa-tion.
Item-9 I use my smartphone to look up directions to places, or to get turn-by-turn navigation.
Item-10 I use my smartphone to organize personal affairs (for instance,access personal notes, calendar or shopping list).
F.2 ResponsesDistribution of responses to scale and individual items in Study 4 (Sec-tion 7).
F.2.1 ScaleSum of ratings to individual items.
Depth of adoption (scale 10−70)
Fre
quen
cy
10 20 30 40 50 60 70
050
100
150
200
F.2.2 ItemsFrequency of response to scale items, each rated 1 (Never) to 7 (All thetime).
1 2 3 4 5 6 7
Item−1
050
100
150
200
250
300
350
1 2 3 4 5 6 7
Item−2
050
100
150
200
250
300
350
1 2 3 4 5 6 7
Item−3
050
100
150
200
250
300
350
1 2 3 4 5 6 7
Item−4
050
100
150
200
250
300
350
1 2 3 4 5 6 7
Item−5
050
100
150
200
250
300
350
1 2 3 4 5 6 7
Item−6
050
100
150
200
250
300
350
1 2 3 4 5 6 7
Item−7
050
100
150
200
250
300
350
1 2 3 4 5 6 7
Item−8
050
100
150
200
250
300
350
1 2 3 4 5 6 7
Item−9
050
100
150
200
250
300
350
1 2 3 4 5 6 7
Item−10
050
100
150
200
250
300
350
16