Embed Size (px)
Citation preview
Proceedings of the 7th International Conference on
Networked Learning 2010, Edited by: Dirckinck-Holmfeld L, Hodgson V, Jones C, de Laat M, McConnell D & Ryberg T
125 ISBN 978-1-86220-225-2
SNAPP: Realising the affordances of real-time SNA within networked learning environments
Shane Dawson,
University of British Columbia, Canada, [email protected]
Aneesha Bakharia,
University of Queensland, Australia
Elizabeth Heathcote
Heathcote Consulting, Australia,
Abstract Higher Education Institutions internationally have continued their trend for adopting increasingly
sophisticated information and communication technologies (ICTs) in order to provide students with
greater flexibility in their studies and more timely access to learning materials and communication
tools beyond the classroom. Despite the apparent benefits these technologies bring, teaching staff are
quick to note that online technologies lack the multiple student learning cues that are available
through more traditional modes of education delivery (face to face). For example, observing
classroom cues that assist teachers in identifying which students may require further instruction and
mediation. Resources which evaluate the way students are utilising the online tools and interacting
with each other have, to date, been largely neglected, thus there are limited resources for teachers to
access ongoing and informal learning indicators within the online environment. As a result, the online
education environment has suffered from a lack of readily available learning-progress data that can
assist teaching staff in designing learning activities, and assessing and identifying individuals
requiring early learning interventions.
This paper outlines the development of a tool designed to provide educators with real-time evaluative
data to better support student learning. The Social Networks Adapting Pedagogical Practice (SNAPP)
tool extracts student online network data and renders this information into a readily interpretable
user-interface. The monitoring of student social networks has been demonstrated to assist educators
in identifying instances of learner isolation (McDonald, Stuckey, Noakes, & Nyrop, 2005), creativity
(Burt, 2004), and community formation (Dawson, 2008; De Laat, Lally, Lipponen, & Simons, 2007).
The ability to view social graph structure and community evolution is crucial to successful
facilitation and serves as an early indicator of the success of a learning activity design as well as
information about student participation and potential performance. The lack of real-time analysis and
visualisation tool integration within current Learning Management Systems has hindered the update
of SNA and left its potential as a diagnostic tool unrealised. This paper argues for the need for real-
time social graph visualisation, describes the design principles behind the development of SNAPP
and highlights the key participant and community structural patterns that SNAPP allows forum
facilitators to visualise.
Keywords Social network analysis, analytics, network learning, learning management system, graph theory,
visualisation, inferring social networks, computer supported collaborative learning, evaluation.
Background
The Higher Education sector worldwide has largely embraced the integration of information and communication
technologies (ICTs) into general teaching and learning practices. The rapid adoption and integration has been
facilitated through the ready availability of numerous open source (e.g. Moodle, Elgg; Sakai) and commercial
(e.g. Blackboard, Desire2learn) learning management systems (LMS). While the level of integration varies
across institutions, there is a growing dependence on these tools for providing the additional flexible learning
options many contemporary students require. In essence, access to institutionally supported and managed online
Proceedings of the 7th International Conference on
Networked Learning 2010, Edited by: Dirckinck-Holmfeld L, Hodgson V, Jones C, de Laat M, McConnell D & Ryberg T
126 ISBN 978-1-86220-225-2
tools and resources has never been easier for educators and students alike. Despite the easy access to and vast
flexible affordances of LMS, Web 2.0, and other collaborative based ICTs, there remain limited diagnostic tools
that are available for education practitioners to better evaluate their implemented learning activities. For
example, LMS have largely ignored the development of any user-analytics that go beyond the capture and
presentation of basic tool access statistics. It is not without good reason that the current set of diagnostic tools
are amongst the least utilised in the LMS suite (Dawson & McWilliam, 2008). Moreover, the presentation of
these statistics is commonly in a format that is both complex and removed from the pedagogical intent and
context. Thus the transformation of this data from analysis to informed action is a complex and potentially
labour intensive process for individual practitioners.
This lack of access to interpretable real-time user-analytics presents a significant challenge for course
instructors, facilitators and learning activity designers who utilise collaborative tools with the aim of
encouraging knowledge sharing and construction. An increased focus on developing collaborative and
community centric learning endeavours reflects current educational theory, which emphasises the importance of
diverse and sustained social interaction for enhancing and facilitating student learning (Gabelnick, MacGregor,
Matthews, & Smith, 1990; Levine Laufgraben & Shapiro, 2004; Tinto, 1993; Vygotsky, 1978). This has been
well demonstrated in the work of Alexander Astin (1993), Richard Light (2001) and John Seely Brown and
Richard Adler (2008) for example, who note that the development and maintenance of social networks are one
of the most important factors determining a students future academic success, academic growth and
development and persistence in a course of study. In short, the development of a community of learners or a
learning network has become a foundational educational practice for both online and offline education
environments.
It is therefore, not surprising that the educational adoption and integration of ICTs should also reflect this
pedagogical intent for enabling increased opportunities for student socialisation. Macfadyen and Dawson (2009)
noted that the two most dominant LMS tools within a large Canadian university included the content page for
transmission of information and the discussion forum for collaboration and community building. Arguably,
many other collaborative focused ICTs are now available that would better support and enable student
socialisation. However, given the easy access for instructors to integrate discussion forums into the curriculum,
discussion activities have become the leading medium for facilitating learner to learner networks.
Given the growing adoption of social learning practices coupled with increasing usage of ICTs, there is an
opportunity to better leverage the available ICT student interaction data to provide real-time analytics to assist
educators in their everyday teaching and learning endeavours. The notion of developing “academic analytics”
from student usage of available ICTs was first proposed by Wang & colleagues (Wang & Newlin, 2000, 2002;
Wang, Newlin, & Tucker, 2001). The authors suggested that the analysis of student online activity may reveal
an early indication of a student’s academic success. This concept has been further developed by researchers such
as Morris, Finnegan and Wu (2005) and more recently Macfadyen and Dawson (2009), who demonstrate a
significant positive relationship between student discussion activity and academic performance. While these
studies tap into the vast potential for ICT student interaction data to provide early indicators of student learning,
they lack the development and integration of a visualisation tool that can assist staff in better understanding the
relationship between implemented pedagogical practice and student online behaviour. Consequently, the
development of visualisations juxtaposed with usage analytics will enable instructors’ opportunity to pro-
actively evaluate both individual student learning and their implemented learning design.
In this context, the application of Social Network methodologies into academic analytics has much to offer
education in terms of novel evaluative approaches. This is well noted by Reffay and Chanier (2002) who
suggested that the adoption of Social Network Analysis (SNA) can act as an educational evaluative tool in order
to monitor and assess elements of student group cohesion in a collaborative environment. Furthermore, the
authors noted that the incorporation of SNA “would enable tutors to detect a problem or a slowdown of group
interaction” (p.31) thereby affording early and timely response to individual student learning requirements.
Reffay and Chanier’s suggestion that SNA is used to monitor and track student network evolution is an
important element for considering the development of an evaluative tool for education practice. The generation
of a tool that affords both the visualisation and analysis of the network fostered through student forum
discussions (Bakharia & Dawson, 2009), can act as an accurate lead indicator of online student engagement.
This paper reports on the development of such an evaluative tool that uses real-time social network
visualisations to evaluate the effectiveness of implemented learning designs. In so doing, the tool also provides
pedagogically meaningful insights into individual and group learning characteristics.
Proceedings of the 7th International Conference on
Networked Learning 2010, Edited by: Dirckinck-Holmfeld L, Hodgson V, Jones C, de Laat M, McConnell D & Ryberg T
127 ISBN 978-1-86220-225-2
SNAPP – Discussion forum interactions
The Social Networks Adapting Pedagogical Practice (SNAPP) tool was designed to provide educators with real-
time access to the evolving social graph within a course. The emerging data and visualisations serve as a
monitoring/diagnostic tool providing instructors with the opportunity to reflect on the observed network
behaviour and determine if this is aligned with the intended learning activity outcomes. As the discussion forum
is a universally accessible feature of all LMS, SNAPP initially focused on the extraction and visualisation of all
interactions that occur within this communication medium. As an entry point to embed social network metrics
and visualisations within a LMS, the rendering of a social graph alongside the standard threaded message
display was investigated. While the threaded discussion view provides an indication of the number posts and the
depth of message threads, it is challenging for instructors to interpret these results for making informed
decisions regarding satisfactory levels of peer interaction (Dawson & McWilliam, 2008). Moreover, the
complexity of determing levels of student engagement and peer networking is further compounded as class size
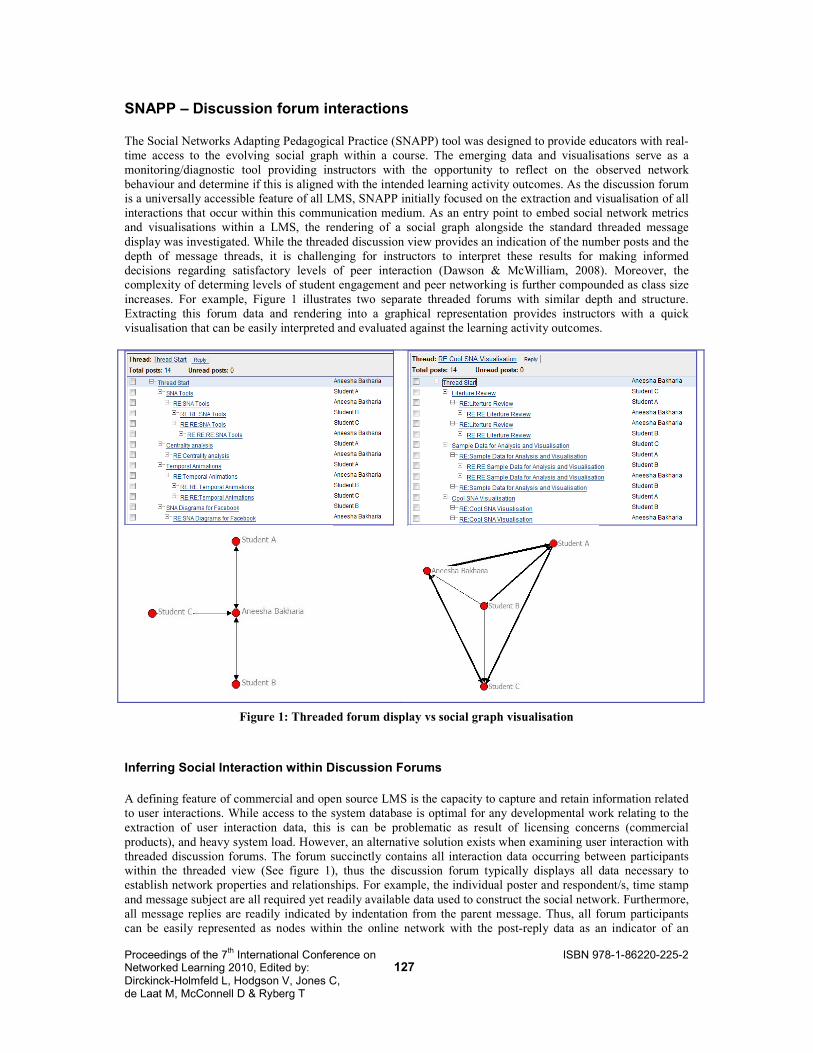
increases. For example, Figure 1 illustrates two separate threaded forums with similar depth and structure.
Extracting this forum data and rendering into a graphical representation provides instructors with a quick
visualisation that can be easily interpreted and evaluated against the learning activity outcomes.
Figure 1: Threaded forum display vs social graph visualisation
Inferring Social Interaction within Discussion Forums
A defining feature of commercial and open source LMS is the capacity to capture and retain information related
to user interactions. While access to the system database is optimal for any developmental work relating to the
extraction of user interaction data, this is can be problematic as result of licensing concerns (commercial
products), and heavy system load. However, an alternative solution exists when examining user interaction with
threaded discussion forums. The forum succinctly contains all interaction data occurring between participants
within the threaded view (See figure 1), thus the discussion forum typically displays all data necessary to
establish network properties and relationships. For example, the individual poster and respondent/s, time stamp
and message subject are all required yet readily available data used to construct the social network. Furthermore,
all message replies are readily indicated by indentation from the parent message. Thus, all forum participants
can be easily represented as nodes within the online network with the post-reply data as an indicator of an
Proceedings of the 7th International Conference on
Networked Learning 2010, Edited by: Dirckinck-Holmfeld L, Hodgson V, Jones C, de Laat M, McConnell D & Ryberg T
128 ISBN 978-1-86220-225-2
established relationship between two or more participants. Therefore, the necessity for extracting user data from
the systems database can be completely removed to navigate around the complexities and challenges associated
with licensing and system load. The development of a script designed to “skin” the threaded forum for network
relationships is an effective alternative. The translation of the network from threaded discussion to social graph
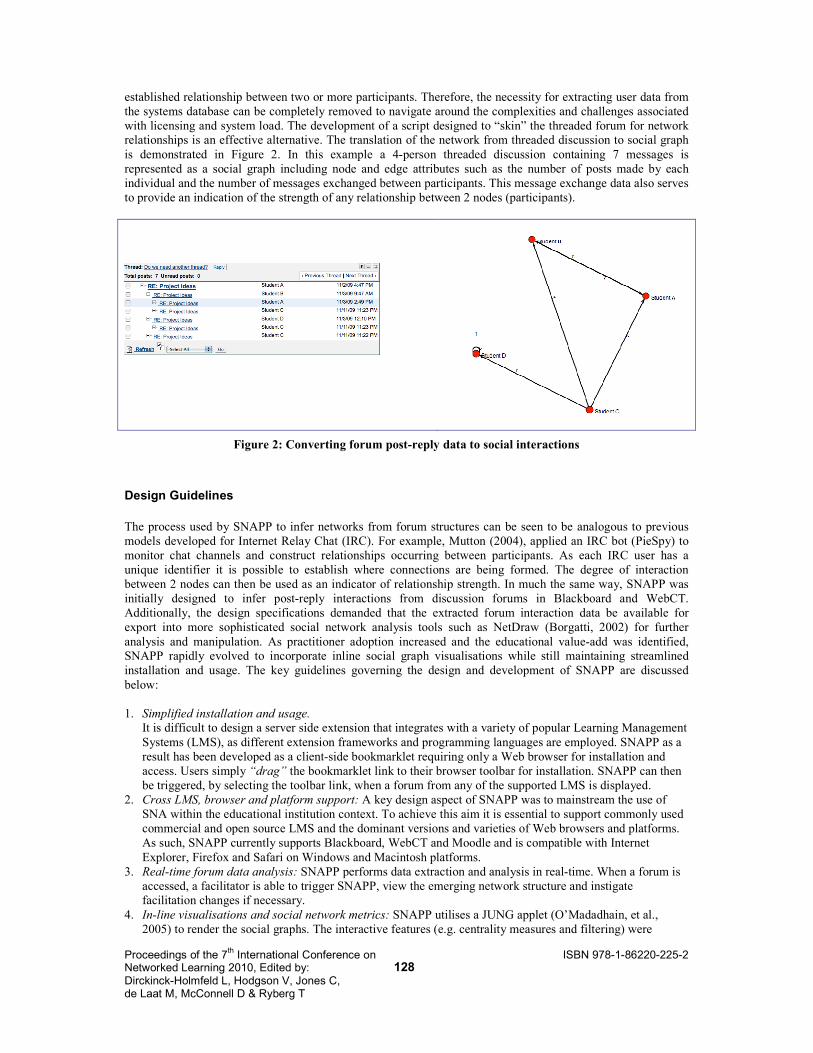
is demonstrated in Figure 2. In this example a 4-person threaded discussion containing 7 messages is
represented as a social graph including node and edge attributes such as the number of posts made by each
individual and the number of messages exchanged between participants. This message exchange data also serves
to provide an indication of the strength of any relationship between 2 nodes (participants).
Figure 2: Converting forum post-reply data to social interactions
Design Guidelines
The process used by SNAPP to infer networks from forum structures can be seen to be analogous to previous
models developed for Internet Relay Chat (IRC). For example, Mutton (2004), applied an IRC bot (PieSpy) to
monitor chat channels and construct relationships occurring between participants. As each IRC user has a
unique identifier it is possible to establish where connections are being formed. The degree of interaction
between 2 nodes can then be used as an indicator of relationship strength. In much the same way, SNAPP was
initially designed to infer post-reply interactions from discussion forums in Blackboard and WebCT.
Additionally, the design specifications demanded that the extracted forum interaction data be available for
export into more sophisticated social network analysis tools such as NetDraw (Borgatti, 2002) for further
analysis and manipulation. As practitioner adoption increased and the educational value-add was identified,
SNAPP rapidly evolved to incorporate inline social graph visualisations while still maintaining streamlined
installation and usage. The key guidelines governing the design and development of SNAPP are discussed
below:
1. Simplified installation and usage.
It is difficult to design a server side extension that integrates with a variety of popular Learning Management
Systems (LMS), as different extension frameworks and programming languages are employed. SNAPP as a
result has been developed as a client-side bookmarklet requiring only a Web browser for installation and
access. Users simply “drag” the bookmarklet link to their browser toolbar for installation. SNAPP can then
be triggered, by selecting the toolbar link, when a forum from any of the supported LMS is displayed.
2. Cross LMS, browser and platform support: A key design aspect of SNAPP was to mainstream the use of
SNA within the educational institution context. To achieve this aim it is essential to support commonly used
commercial and open source LMS and the dominant versions and varieties of Web browsers and platforms.
As such, SNAPP currently supports Blackboard, WebCT and Moodle and is compatible with Internet
Explorer, Firefox and Safari on Windows and Macintosh platforms.
3. Real-time forum data analysis: SNAPP performs data extraction and analysis in real-time. When a forum is
accessed, a facilitator is able to trigger SNAPP, view the emerging network structure and instigate
facilitation changes if necessary.
4. In-line visualisations and social network metrics: SNAPP utilises a JUNG applet (O’Madadhain, et al.,
2005) to render the social graphs. The interactive features (e.g. centrality measures and filtering) were
Proceedings of the 7th International Conference on
Networked Learning 2010, Edited by: Dirckinck-Holmfeld L, Hodgson V, Jones C, de Laat M, McConnell D & Ryberg T
129 ISBN 978-1-86220-225-2
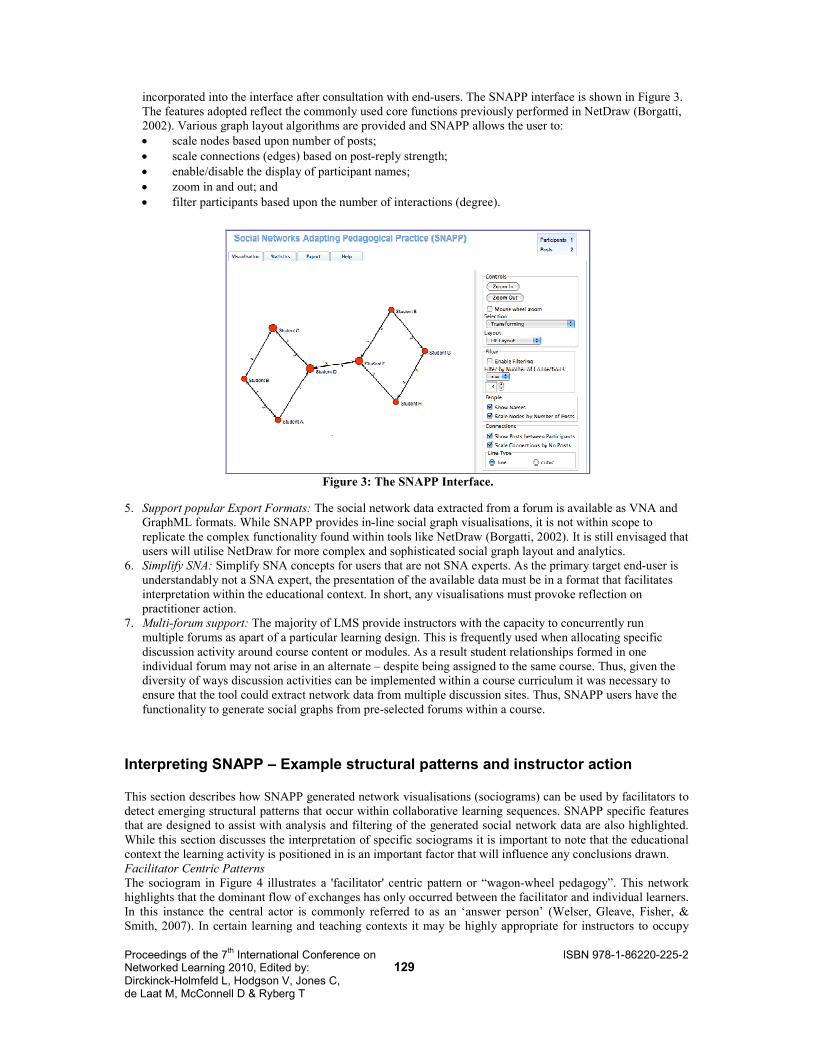
incorporated into the interface after consultation with end-users. The SNAPP interface is shown in Figure 3.
The features adopted reflect the commonly used core functions previously performed in NetDraw (Borgatti,
2002). Various graph layout algorithms are provided and SNAPP allows the user to:
• scale nodes based upon number of posts;
• scale connections (edges) based on post-reply strength;
• enable/disable the display of participant names;
• zoom in and out; and
• filter participants based upon the number of interactions (degree).
Figure 3: The SNAPP Interface.
5. Support popular Export Formats: The social network data extracted from a forum is available as VNA and
GraphML formats. While SNAPP provides in-line social graph visualisations, it is not within scope to
replicate the complex functionality found within tools like NetDraw (Borgatti, 2002). It is still envisaged that
users will utilise NetDraw for more complex and sophisticated social graph layout and analytics.
6. Simplify SNA: Simplify SNA concepts for users that are not SNA experts. As the primary target end-user is
understandably not a SNA expert, the presentation of the available data must be in a format that facilitates
interpretation within the educational context. In short, any visualisations must provoke reflection on
practitioner action.
7. Multi-forum support: The majority of LMS provide instructors with the capacity to concurrently run
multiple forums as apart of a particular learning design. This is frequently used when allocating specific
discussion activity around course content or modules. As a result student relationships formed in one
individual forum may not arise in an alternate – despite being assigned to the same course. Thus, given the
diversity of ways discussion activities can be implemented within a course curriculum it was necessary to
ensure that the tool could extract network data from multiple discussion sites. Thus, SNAPP users have the
functionality to generate social graphs from pre-selected forums within a course.
Interpreting SNAPP – Example structural patterns and instructor action
This section describes how SNAPP generated network visualisations (sociograms) can be used by facilitators to
detect emerging structural patterns that occur within collaborative learning sequences. SNAPP specific features
that are designed to assist with analysis and filtering of the generated social network data are also highlighted.
While this section discusses the interpretation of specific sociograms it is important to note that the educational
context the learning activity is positioned in is an important factor that will influence any conclusions drawn.
Facilitator Centric Patterns
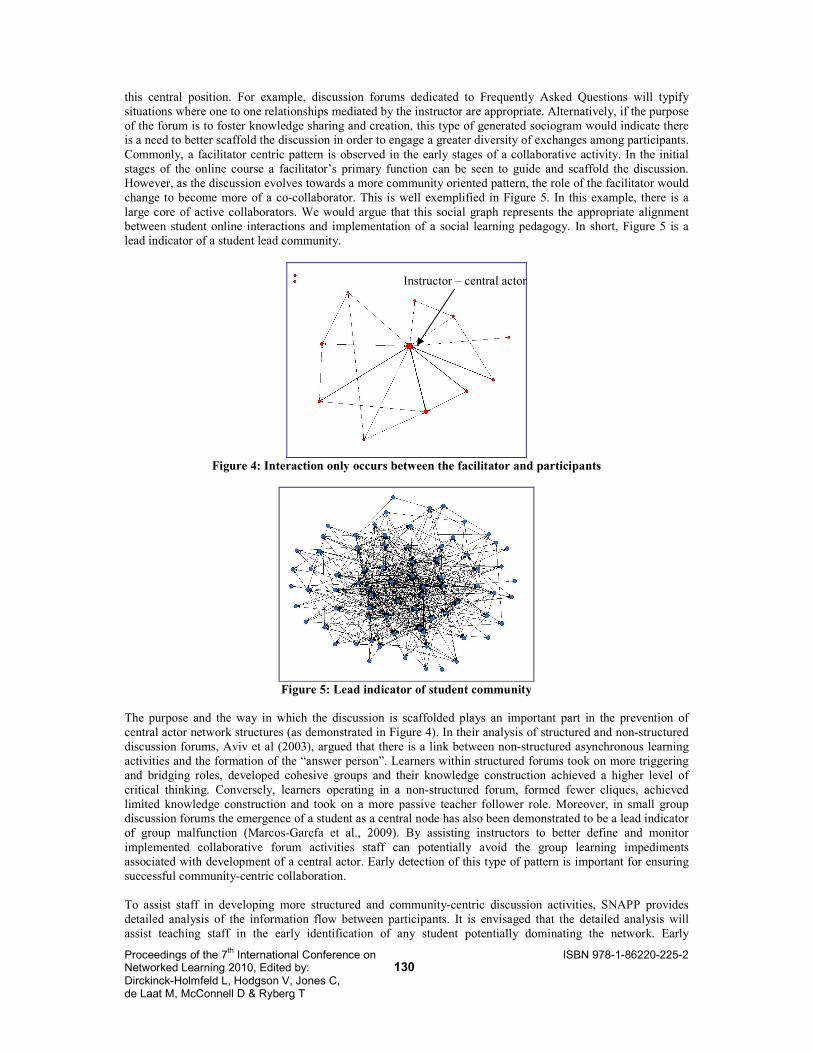
The sociogram in Figure 4 illustrates a 'facilitator' centric pattern or “wagon-wheel pedagogy”. This network
highlights that the dominant flow of exchanges has only occurred between the facilitator and individual learners.
In this instance the central actor is commonly referred to as an ‘answer person’ (Welser, Gleave, Fisher, &
Smith, 2007). In certain learning and teaching contexts it may be highly appropriate for instructors to occupy
Proceedings of the 7th International Conference on
Networked Learning 2010, Edited by: Dirckinck-Holmfeld L, Hodgson V, Jones C, de Laat M, McConnell D & Ryberg T
130 ISBN 978-1-86220-225-2
this central position. For example, discussion forums dedicated to Frequently Asked Questions will typify
situations where one to one relationships mediated by the instructor are appropriate. Alternatively, if the purpose
of the forum is to foster knowledge sharing and creation, this type of generated sociogram would indicate there
is a need to better scaffold the discussion in order to engage a greater diversity of exchanges among participants.
Commonly, a facilitator centric pattern is observed in the early stages of a collaborative activity. In the initial
stages of the online course a facilitator’s primary function can be seen to guide and scaffold the discussion.
However, as the discussion evolves towards a more community oriented pattern, the role of the facilitator would
change to become more of a co-collaborator. This is well exemplified in Figure 5. In this example, there is a
large core of active collaborators. We would argue that this social graph represents the appropriate alignment
between student online interactions and implementation of a social learning pedagogy. In short, Figure 5 is a
lead indicator of a student lead community.
Figure 4: Interaction only occurs between the facilitator and participants
Figure 5: Lead indicator of student community
The purpose and the way in which the discussion is scaffolded plays an important part in the prevention of
central actor network structures (as demonstrated in Figure 4). In their analysis of structured and non-structured
discussion forums, Aviv et al (2003), argued that there is a link between non-structured asynchronous learning
activities and the formation of the “answer person”. Learners within structured forums took on more triggering
and bridging roles, developed cohesive groups and their knowledge construction achieved a higher level of
critical thinking. Conversely, learners operating in a non-structured forum, formed fewer cliques, achieved
limited knowledge construction and took on a more passive teacher follower role. Moreover, in small group
discussion forums the emergence of a student as a central node has also been demonstrated to be a lead indicator
of group malfunction (Marcos-Garcfa et al., 2009). By assisting instructors to better define and monitor
implemented collaborative forum activities staff can potentially avoid the group learning impediments
associated with development of a central actor. Early detection of this type of pattern is important for ensuring
successful community-centric collaboration.
To assist staff in developing more structured and community-centric discussion activities, SNAPP provides
detailed analysis of the information flow between participants. It is envisaged that the detailed analysis will
assist teaching staff in the early identification of any student potentially dominating the network. Early
Instructor – central actor
Proceedings of the 7th International Conference on
Networked Learning 2010, Edited by: Dirckinck-Holmfeld L, Hodgson V, Jones C, de Laat M, McConnell D & Ryberg T
131 ISBN 978-1-86220-225-2
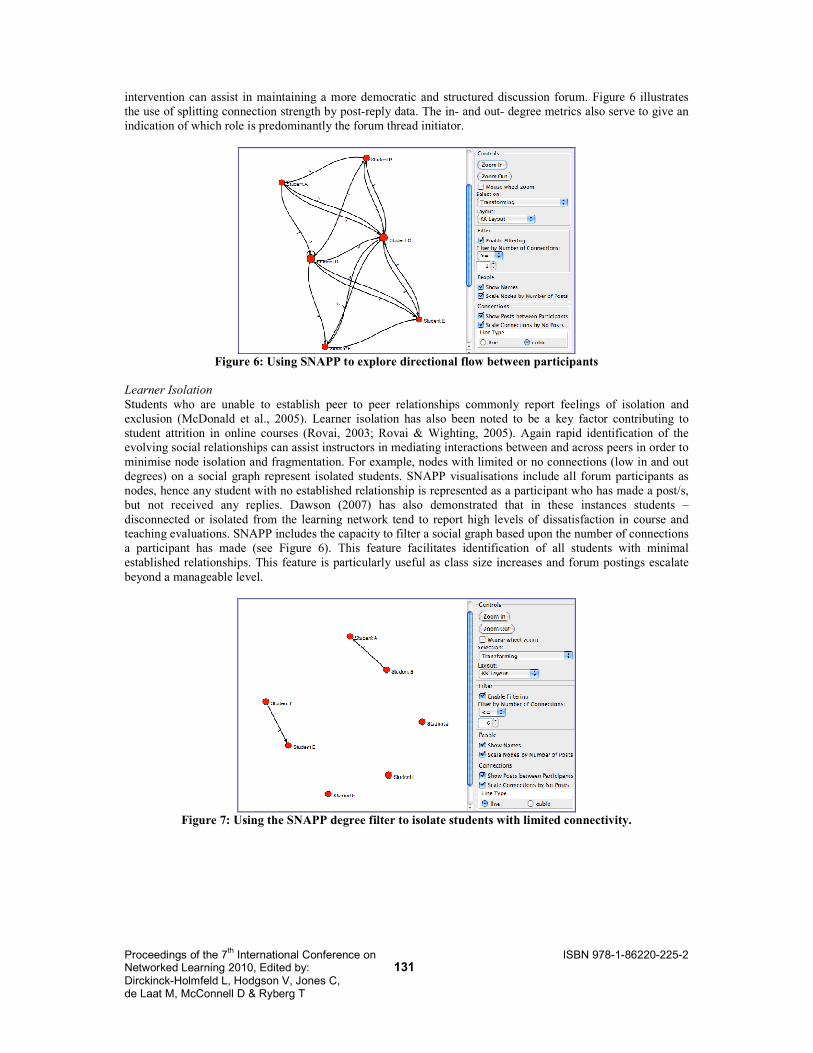
intervention can assist in maintaining a more democratic and structured discussion forum. Figure 6 illustrates
the use of splitting connection strength by post-reply data. The in- and out- degree metrics also serve to give an
indication of which role is predominantly the forum thread initiator.
Figure 6: Using SNAPP to explore directional flow between participants
Learner Isolation
Students who are unable to establish peer to peer relationships commonly report feelings of isolation and
exclusion (McDonald et al., 2005). Learner isolation has also been noted to be a key factor contributing to
student attrition in online courses (Rovai, 2003; Rovai & Wighting, 2005). Again rapid identification of the
evolving social relationships can assist instructors in mediating interactions between and across peers in order to
minimise node isolation and fragmentation. For example, nodes with limited or no connections (low in and out
degrees) on a social graph represent isolated students. SNAPP visualisations include all forum participants as
nodes, hence any student with no established relationship is represented as a participant who has made a post/s,
but not received any replies. Dawson (2007) has also demonstrated that in these instances students –
disconnected or isolated from the learning network tend to report high levels of dissatisfaction in course and
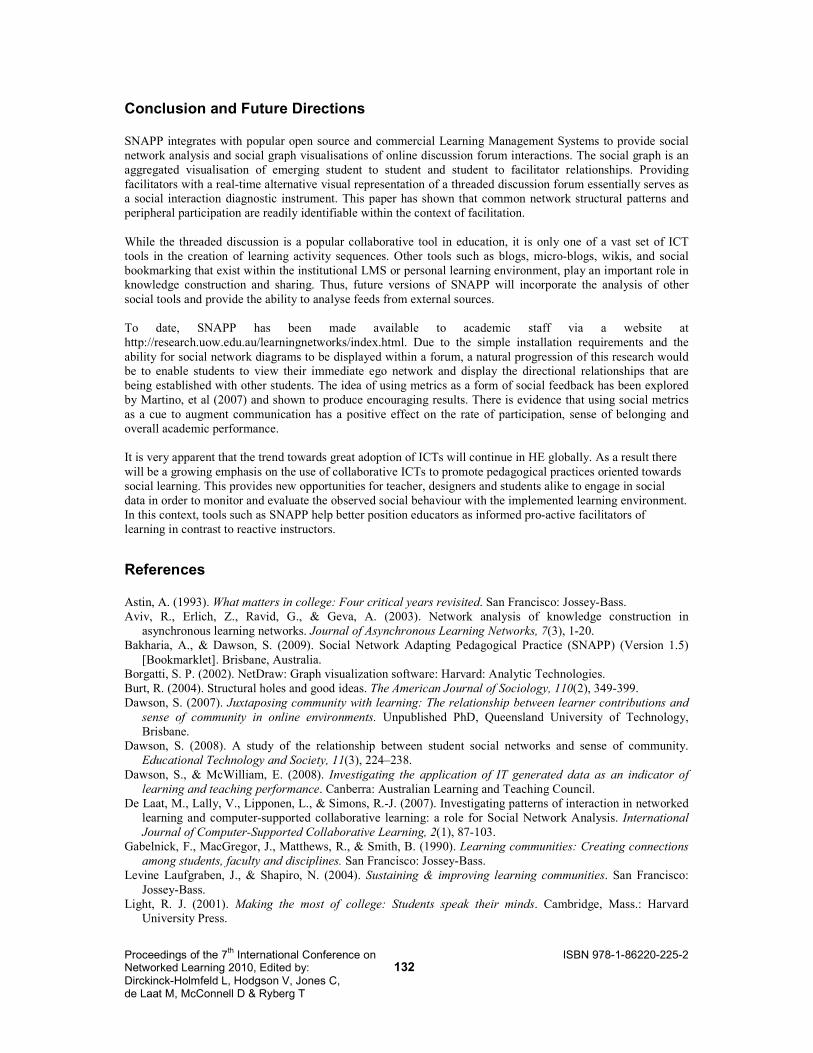
teaching evaluations. SNAPP includes the capacity to filter a social graph based upon the number of connections
a participant has made (see Figure 6). This feature facilitates identification of all students with minimal
established relationships. This feature is particularly useful as class size increases and forum postings escalate
beyond a manageable level.
Figure 7: Using the SNAPP degree filter to isolate students with limited connectivity.
Proceedings of the 7th International Conference on
Networked Learning 2010, Edited by: Dirckinck-Holmfeld L, Hodgson V, Jones C, de Laat M, McConnell D & Ryberg T
132 ISBN 978-1-86220-225-2
Conclusion and Future Directions
SNAPP integrates with popular open source and commercial Learning Management Systems to provide social
network analysis and social graph visualisations of online discussion forum interactions. The social graph is an
aggregated visualisation of emerging student to student and student to facilitator relationships. Providing
facilitators with a real-time alternative visual representation of a threaded discussion forum essentially serves as
a social interaction diagnostic instrument. This paper has shown that common network structural patterns and
peripheral participation are readily identifiable within the context of facilitation.
While the threaded discussion is a popular collaborative tool in education, it is only one of a vast set of ICT
tools in the creation of learning activity sequences. Other tools such as blogs, micro-blogs, wikis, and social
bookmarking that exist within the institutional LMS or personal learning environment, play an important role in
knowledge construction and sharing. Thus, future versions of SNAPP will incorporate the analysis of other
social tools and provide the ability to analyse feeds from external sources.
To date, SNAPP has been made available to academic staff via a website at
http://research.uow.edu.au/learningnetworks/index.html. Due to the simple installation requirements and the
ability for social network diagrams to be displayed within a forum, a natural progression of this research would
be to enable students to view their immediate ego network and display the directional relationships that are
being established with other students. The idea of using metrics as a form of social feedback has been explored
by Martino, et al (2007) and shown to produce encouraging results. There is evidence that using social metrics
as a cue to augment communication has a positive effect on the rate of participation, sense of belonging and
overall academic performance.
It is very apparent that the trend towards great adoption of ICTs will continue in HE globally. As a result there
will be a growing emphasis on the use of collaborative ICTs to promote pedagogical practices oriented towards
social learning. This provides new opportunities for teacher, designers and students alike to engage in social
data in order to monitor and evaluate the observed social behaviour with the implemented learning environment.
In this context, tools such as SNAPP help better position educators as informed pro-active facilitators of
learning in contrast to reactive instructors.
References
Astin, A. (1993). What matters in college: Four critical years revisited. San Francisco: Jossey-Bass.
Aviv, R., Erlich, Z., Ravid, G., & Geva, A. (2003). Network analysis of knowledge construction in
asynchronous learning networks. Journal of Asynchronous Learning Networks, 7(3), 1-20.
Bakharia, A., & Dawson, S. (2009). Social Network Adapting Pedagogical Practice (SNAPP) (Version 1.5)
[Bookmarklet]. Brisbane, Australia.
Borgatti, S. P. (2002). NetDraw: Graph visualization software: Harvard: Analytic Technologies.
Burt, R. (2004). Structural holes and good ideas. The American Journal of Sociology, 110(2), 349-399.
Dawson, S. (2007). Juxtaposing community with learning: The relationship between learner contributions and
sense of community in online environments. Unpublished PhD, Queensland University of Technology,
Brisbane.
Dawson, S. (2008). A study of the relationship between student social networks and sense of community.
Educational Technology and Society, 11(3), 224–238.
Dawson, S., & McWilliam, E. (2008). Investigating the application of IT generated data as an indicator of
learning and teaching performance. Canberra: Australian Learning and Teaching Council.
De Laat, M., Lally, V., Lipponen, L., & Simons, R.-J. (2007). Investigating patterns of interaction in networked
learning and computer-supported collaborative learning: a role for Social Network Analysis. International
Journal of Computer-Supported Collaborative Learning, 2(1), 87-103.
Gabelnick, F., MacGregor, J., Matthews, R., & Smith, B. (1990). Learning communities: Creating connections
among students, faculty and disciplines. San Francisco: Jossey-Bass.
Levine Laufgraben, J., & Shapiro, N. (2004). Sustaining & improving learning communities. San Francisco:
Jossey-Bass.
Light, R. J. (2001). Making the most of college: Students speak their minds. Cambridge, Mass.: Harvard
University Press.
Proceedings of the 7th International Conference on
Networked Learning 2010, Edited by: Dirckinck-Holmfeld L, Hodgson V, Jones C, de Laat M, McConnell D & Ryberg T
133 ISBN 978-1-86220-225-2
Macfadyen, L., & Dawson, S. (2009). Mining LMS data to develop an “early warning system” for educators: A
proof of concept. Computers & Education, In press.
Marcos-Garcfa, J. A., Martinez-Mones, A., Dimitriadis, Y., Anguita-Martinez, R., Ruiz-Requies, I., & Rubia-
Avi, B. (2009). Detecting and Solving Negative Situations in Real CSCL Experiences with a Role-Based
Interaction Analysis Approach. In T. Daradoumis, S. Caballé & J. M. Marquès (Eds.), Intelligent
Collaborative E-Learning Systems and Applications (Vol. 246). Berlin, Germany: Springer.
Martino, F., Miotto, A., Davide, F., & Gamberini, L. (2007). Exploring Social Network Indices As Cues To
Augment Communication and to Improve Social Practices. Paper presented at the 1st International
Workshop on Maps Based Interaction in Social Networks.
McDonald, B., Stuckey, B., Noakes, N., & Nyrop, S. (2005). Breaking down learner isolation: How network
analysis informs design and facilitation for online learning. Paper presented at the AERA, Montreal,
Canada.
Morris, L. V., Finnegan, C., & Wu, S. (2005). Tracking student behavior, persistence, and achievement in online
courses. Internet and Higher Education, 8(3), 221-231.
Mutton, P. (2004). Inferring and Visualizing Social Networks on Internet Relay Chat. Paper presented at the
Information Visualization, Los Alamitos, CA.
Reffay, C., & Chanier, T. (2002). Social Network Analysis used for modelling collaboration in distance learning
groups. In S. A. Cerri, G. Guarderes & F. Paraguaco (Eds.), Lecture Notes in Computer Science (Vol. 2363,
pp. 31-40). Bergen: Kluwer Academic Publishers.
Rovai, A. P. (2003). In search of high persistence rates in distance education online programs. Internet and
Higher Education, 6(1), 1-16.
Rovai, A. P., & Wighting, M. J. (2005). Feelings of alienation and community among higher education students
in a virtual classroom. Internet and Higher Education, 8(2), 97-110.
Seely Brown, J., & Adler, A. P. (2008). Minds on fire: Open education, the long tail, and learning 2.0.
EDUCAUSE Review, 43(1), 16-32.
Tinto, V. (1993). Leaving college: rethinking the causes and cures of student attrition (2nd ed.). Chicago:
University of Chicago Press.
Vygotsky, L. S. (1978). Mind in society: The development of higher psychological processes (M. Cole, V. John-
Steiner, S. Scribner & E. Souberman, Trans.). Cambridge Mass: Harvard University Press.
Wang, A. Y., & Newlin, M. H. (2000). Characteristics of Students Who Enroll and Succeed in Web- Based
Psychology Classes. Journal of Educational Psychology, 137-143.
Wang, A. Y., & Newlin, M. H. (2002). Predictors of Performance in the Virtual Classroom: Identifying and
Helping At-Risk Cyber-Students. The Journal of Higher Education. Academic Matters., 29(10), 21-25.
Wang, A. Y., Newlin, M. H., & Tucker, T. L. (2001). A Discourse Analysis of Online Classroom Chats:
Predictors of Cyber-Student Performance. Teaching of Psychology, 28(221-225).
Welser, T., Gleave, E., Fisher, D., & Smith, M. (2007). Visualizing the signatures of social roles in online
discussion groups. The Journal of Social Structure, 8(2),
www.cmu.edu/joss/content/articles/volume8/Welser.